Article

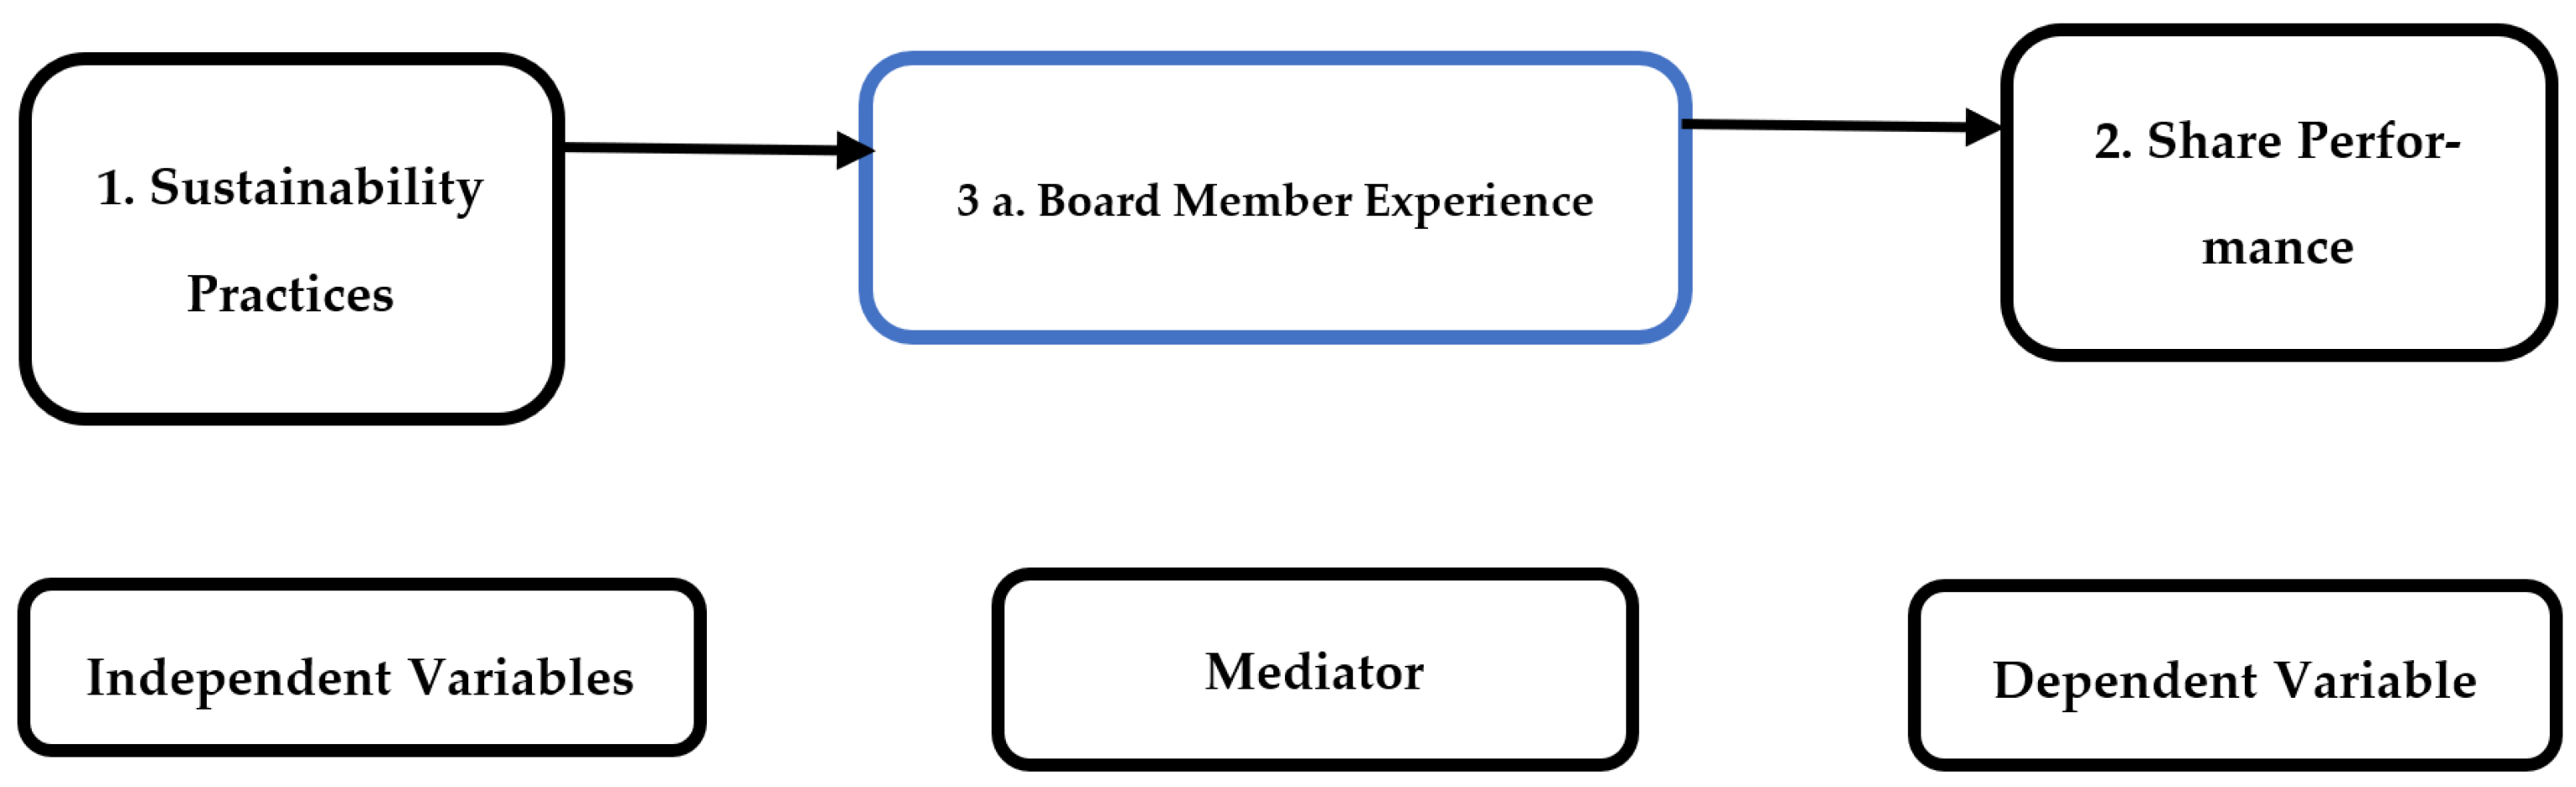
The Impact of Sustainability Practices on Share Performance with Mediation of Board Members Experience: A Study on Malaysian Listed Companies

by
Uzair Bhatti
1,2,* and
Noralfishah Sulaiman
3
1
College of Business, The American University of Kurdistan, Sumel, Duhok 42003, Iraq
2
Department of Technology Management, Universiti Tun Hussein Onn Malaysia, Parit Raja 86400, Malaysia
3
KANZU Research: Resilient Built Environment, Department of Architecture, Faculty of Civil Engineering and Built Environment, Universiti Tun Hussein Onn Malaysia (UTHM), Parit Raja 86400, Malaysia
*
Author to whom correspondence should be addressed.
Int. J. Financial Stud. 2023, 11(1), 4; https://doi.org/10.3390/ijfs11010004
Submission received: 4 October 2022 / Revised: 4 December 2022 / Accepted: 15 December 2022 / Published: 22 December 2022
(This article belongs to the Collection Corporate Social Responsibility in Finance)

Abstract

:
The purpose of this paper is to explore the impact of ESG sustainability practices (i.e., Environmental, Social, Governance/economic) on share performance. Moreover, the objective of the study is to investigate the sustainability practices with mediation of board member experience, which might contribute in maintaining the share performance. The study is unique in such a way that instead of analysing the stated relationship with internal financial performance measures such as return on asset (ROA) or return on equity (ROE), this study will investigate the relationship using external performance measures such as firm share performance. In this research, data were collected from 100 Bursa Malaysia listed companies using purposive sampling during the sampling period from 2017 to 2020. The data were analysed using the Autoregressive Distributed Lag (ARDL) bound testing model instead of a traditional regression model to examine the causal relationship. The results of the study showed the long-run steady relationships through the error correction term (ECT) at the optimum lag. Further, the findings also revealed that there is no short run association between the sustainability practices and the stock performance with mediation of the board experience. The findings also showed that sustainability practices have a significant impact on share performance with mediation of board experience. It is found that sustainability practices, especially environmental and social, are essential to attract investors. The results have also demonstrated that a board of directors of different ages has different knowledge, competencies, and expertise which could prove beneficial in terms of board diversity that decides to adapt the best sustainability practices. These findings provide some inference for future research on the relationship of sustainability practices and share performance with other mediating factors of board attributes.

1. Introduction

Sustainability practices are regarded as an understanding of management wherein businesses are inclined to collaborate with social, economic and environmental issues among their business operations, and have interaction with their stakeholders (Beji et al. 2021; Font and Lynes 2018). Sustainability practices are utilised to make companies accountable for the environment and social communities in a way that means every stakeholder could prosper and the firm’s negative aspects are reduced (Tran 2019). The concept of sustainability is important for emerging economies to promote the image of the country in question.
The study in consideration is important for understanding how board members are adopting the sustainability practices that improve the stock’s performance. Board members from different age groups and with different experiences will react differently towards implementation of sustainability practices. This study is unique in such a way that will highlight the importance of board member experience in adapting the sustainability practices to maintain the share performance. The current study will establish this relationship and help to identify the corporate spending to improve the society and environment, which will have positive impact on share performance. The scope of this research is to find out the implementations of this evidence in Malaysia and to evaluate the results and identify the best sustainability practices employed by the board members to maintain the share performance. Moreover, the study will focus on factors such as investments and investors’ perception of sustainable practices that are indeed missing in previous literatures. The past literature focuses on the internal performance factors such as return on asset (ROA), return on equity (ROE), and profit margin. However, this study is focused on external performance measures such as share performance. Sustainability practices are still seen as a losing proposition in certain studies, particularly in the Asian region. The study presents a characteristic equation to determine how investors will react if businesses adopt management practices, specifically if they invest in sustainable projects.
In the majority of countries, the company selects corporate social responsibility by directly integrating sustainable practices to have an influential and noticeable performance and improve the image of the brand (Bhatti and Sulaiman 2020). Moreover, it has been contended that it is still considered to be a major cost for the investors of companies mainly in developing countries, for instance, Malaysia. Similarly, the previous literature has also depicted the strong impact of the practices of sustainability that are normally important for preserving the long-term growth of socio-economic circumstances. This is environmentally important for businesses that are looking to operate in the long run. This gap is extracted from the study of Keesstra et al. (2018), where the focus is only on the impact of sustainability practices on share performance and the mediating factor is missing, covered through this study in relation to the Malaysian listed companies. On the other hand, share performance as the dependent variable and practices of sustainability as an independent variable is tested in the study to strengthen the literature and fulfil the designed aim of the research.
In the majority of the literature, the measurements related to financial performance have an emphasis on the indicators of internal performance, for instance, the return on equity (ROE), return on assets (ROA), and other related accounts of balance sheets and income statements. Nonetheless, the perspective of investors of a company’s performance depends on the performance of the stock market (Bhatti and Sulaiman 2021). Hence, there is a gap in the literature relating to the requirement for the improvement in the sustainability of businesses by stimulating sustainability practices and board attributes by companies, all of which has an influence on share performance (Zraqat 2019). The concept of corporate sustainability is not yet extensively studied in terms of the triple bottom line approach, which focuses on social, environmental, and economic settings. In the extensive literature study by Praveen et al. (2013), it was observed that only ten papers had discussed sustainability. The majority of the prior literature focused on developed countries in the analysis. In relation to Praveen et al.’s (2013) findings, a study conducted by Bhatti and Sulaiman (2021) argued that the investor’s perspective and their behaviour are not studied in detail. The literature lacks the knowledge in the identified area; the conceptual model will provide the basis of research that can be conducted to analyse the investor’s behaviour. Thus, this research focuses on the identification of the impact of sustainability practices on share performance with the mediation of board attributes, processed in the consideration of Malaysian listed companies.
The study in consideration will assist in understanding the firm’s sustainability practices and how it can impact the firm’s share performance. This study will investigate the relationships using sustainability as an independent variable and share performance as a dependent variable while considering board member experience as a mediator. The mediating role of board attributes will assist in understanding how board members make decisions that promote corporate sustainability pratices. The sustainability practices are measured by using three main components of sustainability reporting: social, environmental, and economic responsibilities. These widely accepted practices consider the surrounding with a firm’s capacity to gain profits, known as the triple bottom approach (Zorio-Grima et al. 2017). On the other hand, board attributes will be measured using board members’/CEOs’ experience, relevant qualifications, and expertise (Arora 2022; Dembo 2017).
In this research, 100 Bursa Malaysia listed companies were selected using a purposive sampling technique. The data for board members’ attributes (experience and age), share price values (for share performance), and ESG factor rating (for sustainability practices) were collected and analysed to identify the relationship. The data were collected for sustainability (ESG), share price and board member experience for the selected period of 2017 to 2020. In this study, the Autoregressive Distributed Lag (ARDL) model is used for the data analysis model instead of a traditional regression model, in order to avoid biases in result interpretation. The results of the study showed that the sustainability practices have long-term relation-term associations with share performance with the mediation of board members’ attributes.
This paper will provide beneficial information to investors, academics and researchers on the behaviour of shareholders on corporate social responsibility initiatives by board members to promote the company’s image. This study will add unique value to the body of knowledge, which can be used as a solid foundation for future studies. The findings of this study will benefit the firms by providing insight into the key points of this research, which assist the firms in building a better brand image.
The upcoming section of the paper will detail the literature review carried out by previous researches. The third chapter is where the methodological design adopted by the researcher is proposed. The fourth chapter can also be regarded as one of the most essential parts of the study, showing the data analysis using the applicable tool and technique. This chapter also shows the extracted results, which are used in answering the research question and satisfying research objectives. The fifth chapter is the concluding chapter of the study, where the researcher concludes the entire research briefly.

2. Literature Review

This research is based on sustainability practices along with their impact on the share performances of the listed organisations. Sustainability practices have recently started to be used across types of organisation (Yong et al. 2020). The present study aims to focus on the effects of sustainability practices on share performance while considering board attributes as a mediator. Moreover, sustainability practices serve as the outlook of the impact fostered by a corporation as the result of their economic, environmental and social properties (Annunziata et al. 2018; Nguyen 2022). Meanwhile, sustainability reporting or practices have started becoming one of the essential mechanisms for organisations globally because of growing concerns related to environmental protection. The reports made as a result of adopting sustainability practices help to ensure a kind of commitment by the organisation to their own sustainable or green policies. A growing number of businesses are now connecting with stakeholders on different sustainability subjects with full consideration. They also listen to opinions from stakeholders on different sustainable operations (Crane et al. 2019).
Thus, integration, along with the combination of sustainability practices and the financial performance of organisations, has helped analyse how well organisations produce their revenues. Hence, this also indicates that the coverage of firms from different kinds of damages and negative impacts on the environment can impact the image of the company (Pajunen et al. 2012; Pugna et al. 2019). Firms have diverted their focuses and put more emphasis on social and environmental efforts rather than earning profits by any cost-saving strategies.

2.1. Sustainability Practices and Board Attributes

Sustainability practices are those that encompass all environmental, social and governance (ESG) concerns; this is now increasingly positioned on the top of agendas (Shen et al. 2022; Unruh et al. 2016). Hence, this is also discussed in the study of Sumner (2017); this is not the boardroom topic that everyone first thinks of. Sustainability has been a central topic for corporate competitiveness and the ability of companies to continually operate. Traditionally, topics have been as varied as environmental disasters, labour relations, different safety incidents, or sustainability effects of all the sectors, along with the challenges. Another study by Daugaard (2020) found that there is a huge emphasis on the governance element of the ESG, and that it is the fiduciary board’s duty to look after the companies’ strategies, risk and allocation of the capital. Furthermore, it has been postulated that enterprise risk management (ERM) consider the central avenue for expanding the consideration of the company towards the risk that is posed by the environmental and societal trends. This also encompasses a change in the expectations of the stakeholders that can impact the ability of the company to achieve their all-strategic objectives. This is also revealed by Galli (2021): the expansion of the ERM includes the ESG risk to help make connections to risk, strategy, and decision making, which makes companies increasingly resilient and competitive (Dang and Nguyen 2021).
Markets are becoming increasingly competitive with each passing day and corporations are put under unprecedented pressure to incorporate sustainable practices. The reason is that their financial success and share performance are highly dependent on sustainability practices (Alshehhi et al. 2018; Dang and Nguyen 2021). The adoption of sustainability practices, such as environmental, social and economic practices, has increased over the years since these practices in the corporate business strategy have shown improvement in brand image as well as the financial performance of the corporations (Keskin et al. 2020). Therefore, today, many countries prefer to adopt sustainability practices to improve the share performance of their corporations (Alshehhi et al. 2018). Investors and customers alike are conscious of corporate sustainability since they consider it their responsibility to preserve the environment by encouraging sustainability practices in a corporation. For decades, investors have been raising their concerns over sustainability, but now they have started considering making investments in the sustainable projects offered by the corporations (Keskin et al. 2020).
In addition to the above information, O’Dwyer and Unerman (2020) further argued in their study that more of the robust ESG integration in the broader sense of ERM practice and sustainability practices directly helped to promote all kinds of measurements, along with the disclosure of the meaningful ESG information. They claimed that this enabled management and the board to access overall resources that are required, and accordingly assign the capital. As discussed in the study of Fisch (2018), to understand the relationship between sustainability and board attributes, sustainability practices helped to secure more time at and in between the board meeting, and a standardised approach towards incorporating the ESG in the discussion of the boardroom, especially when making longer-term strategy and identification of the risks. Hence, stakes were found to be very high and directors had to act to recognise that sustainability is one of the fundamental elements of stewardship and a fiduciary role.

2.2. Board Members’ Attributes and the Impact on Firm Performance

It has been demonstrated in the study of Masud et al. (2019) that the board and directors’ expertise, as well as the trust placed in them, inspire board members, which improves the overall performance. Whitler et al. (2018) pointed out in their study that expertise of the boards related to that which is relevant to the firm’s industries and business and in regard to operations and business models has a positive impact on firms. Furthermore, directors with more experience and from different firms tend to develop tactical knowledge. This knowledge is found to be very hard to replicate, constitutes an intangible asset, and potentially leads towards a competitive advantage (Zaragoza-Sáez et al. 2016). Merendino et al. (2018) indicated that the appointment of some of the experienced directors directly increases different ranges of perspectives along with their interpretation and that this reduces the internal biases among the decision-making process of the board. This has also been seen from the study of Tejerina-Gaite and Fernández-Temprano (2020), that the double-aged sword means older age directors are simultaneously associated with greater experience on one hand, and a high-risk aversion with a loss of productivity on the other. In relation to this, Loderer et al. (2017) postulated that old age leads to greater market experience and that this results in the growth of the earnings of firms and the growth of those employed in the firm (Hastalona and Sadalia 2021).
Corporate social responsibility ESG is a spotlight issue nowadays due to potential longer-term outcomes from shareholder investment (Hastalona and Sadalia 2021). The stockholders include customers, individuals, employees and society that show meaningful impacts on social, economic and environmental effects to achieve corporate sustainability practices CSP (Rahman et al. 2022). Implementing such policies and strategies could strengthen the relationship between the stakeholders to create a positive impact on firm financial performance (FFP). Different perspectives are seen in the literature on CSP. Companies with eco-efficient strategies revealed high market value compared to companies who do not implement environmental strategies. The relationship of gender diversity and firm’s performance with the board of directors. The author concluded that due to effective skills and better knowledge and understanding, women directors could better share discrete values and norms than the men. Thus, women directors can increase the decision-making process and revolutionise business settings (Arora 2022; Saggar et al. 2021).
Previous studies show that the presence of women on boards of directors improves the performance of companies. Female directors participate in more diverse roles than men. Women work in more corporate and social organisations (such as NGOs) when compared to men. Female entrepreneurs also play a significant role in economic activities. Various parameters such as age, nationality, qualification, decision making power, ethics, and professionalism are important and play a significant role to promote diversity. Women on boards of directors should have diverse skills and life experiences (Arora 2022). There are many other different factors that affect the overall performance of organisations. Women directors may not perform well in other regions or developing countries, unlike China, because of social norms and corporate culture. The features of a board with respect to its independence, diversity and diligence on ESG show various impacts on a company’s performance (Nguyen 2022). A board is comprised of internal and external directors. The firm’s daily operations and decision making power is directly impacted by internal directors (Kamaludin et al. 2022). Managerial or independent members relate to external directors. Having external or independent directors on the board is critical to confirming effective monitoring. Studies analysed that board independence and diversity enhance ESG disclosure, which failed earlier in the Malaysian context. Policy makers may also help in providing and enhancing the non-financial performance through sustainability activities.
In addition to the above attributes, education, and experience are found to be other important attributes for the board of directors. These tend to integrate the background of the directors and their personalities. While addressing the association between the demographic diversity of the board members and firm performance, Ma et al. (2021) discussed in their study that educational heterogeneity positively helps to influence the return on investment (ROI). Furthermore, the study put forward by Hong et al. (2016) showed that the university degrees that are directly held by the board members are linked with seven different measures of the performance, such as earning per share (EPS), ROA, cumulative returns, cumulative abnormal returns, changes in the EPS, changes in the ROA and the end market-to-book ratio. Likewise, some of the other studies have also found a significant relationship between education and the performance of the firm, and from the example of a study conducted by Oziegbe and Cy (2021) and Marn and Romuald (2012), it is shown that the education of the board has no significant and positive impact on the firm’s performance, especially in the Malaysian listed firms.

2.3. Hypothesis Development

The framework shown in Figure 1 is designed to investigate the impact of sustainability practices on stock performance with the mediation of board members’ experience. As per the conceptual framework, it has been identified that the dependent variable is share performance. The independent variable is sustainability, which includes three sub-factors: social, environmental, and economic aspects. Similarly, the mediating variable is the one that helps in creating an association between dependent and independent variables that explores the relationship among the two variables (van Schaaijk et al. 2020). It is mainly a hypothetical variable that acts as a mediator in the connecting of the two variables. The mediating variable of the study includes board attributes based on experience and education.
It has been observed that sustainable practices incorporate help in controlling the business environment in terms of managing disasters, labour relations, different safety incidents and sustainability effects that have a significant impact on the progression of the company (Schmitt 2017). It sheds light on the fact that the growing attention of the investors is more towards sustainability with a huge emphasis on governance, where the board of directors looks after the company’s strategies, risks, and the allocation of capital (Boffo and Patalano 2020). In a broader aspect, enterprise risk management (ERM) practices and sustainability practices directly help in promoting all types of measurements with the disclosure of ESG information, which enables the board to gain overall access to the resources.
The board member experience attribute that has been examined through the study as having a direct impact on the performance of the company includes composition, characteristics, structure, and process. These attributes show a clear image of the board members that is correlated with the financial performance of the firm (Arora 2022; Saggar et al. 2021). In this regard, board member experience plays a vital role, as it determines that it has a significant effect on social practices and share performances. The study determines that board members have a significant and positive effect on the relationship among social practices and share performance by successfully practicing CSR activities in an organization for the growth of economic, environmental and social practices (Żelazna et al. 2020). However, the majority of the prior literature suggests that sustainability practices on environmental, social, and economic levels will distract firm performance. Higher management will lose its focus on core business objectives, that, is to maximise shareholders’ wealth. The findings highlighted the fact that sustainability practices have no control over explaining the changes in firm performance (Dyduch and Krasodomska 2017).
In this regard, various other factors affect share performance, share price, trading volumes and market capitalisation. In this context, sustainable practices influence share performance by affecting the functioning of the company’s performance where non-financial performance indicators, including environmental and social performance, are considered as effective valuation (Alshehhi et al. 2018). These factors help in improving share performance and the share performance is increased by delivering high returns through the corporate environment and social performance. Adopting best sustainable techniques can also help to maintain the brand image (Praveen et al. 2013). The firm’s higher profitability attracts more investors that help to increase free cash flow. These practices are initiated from the top-level management which creates a good brand image and reputation in the market, focusing more on the environment and society instead of profitability in particular (Oncioiu et al. 2020).

3. Methodology

The current research has used a deductive approach of reasoning since hypotheses are already established to test the theories. Furthermore, data were collected via a quantitative method; therefore, the use of deductive reasoning was adequate to ensure results are more profound, explaining the associations between sustainability practices, board attributes, and share performance. The data are collected from a sample of 100 Bursa Malaysia listed companies using a purposive sampling technique. Purposive sampling is used because all the relevant data are not available for all the companies and all the identified variables.
As stated by Ryan (2018), positivism allows the determining of facts and figures and examining of associations, relations, and properties of the selected variables of the research. Based on the nature of this research, positivism was adopted for analysing results using quantifiable and observable approaches. Therefore, it was utilised in the current study to identify the impact of sustainability practices (social practices, environmental practices, and economics) on share performance. It was considered appropriate for assessing the data collected from secondary sources, i.e., annual reports and stock market websites. The results by the use of positivism were analysed adequately for large samples. The positivism provides a range of benefits to the researcher where the foremost advantage includes a deep examination of results with higher accuracy and validity (Cooper and Schindler 2013). This research was carried out using the philosophy paradigm of positivism. Therefore, positivist ontology and epistemology are viewed and justified in this section. According to Al-Saadi (2014), it is believed by positivist ontology that the world is external and that the objective reality to any research phenomenon is single regardless of the perspective of the researcher or his beliefs. Thus, a structural approach is used for identifying evident research phenomena for the performance of the research by the formulation of appropriate hypotheses. In addition, the ontology of positivism also explained that there is a clear distinction between personal experience and value judgement, which is evaluated by determining statistical inferences adhering to the objective reality of the world (Klakegg 2016). On the other hand, an epistemology of positivism reflects upon knowledge explaining the association between research and reality. It is pertinent to undergo a possible review of objective knowledge where an extensive focus is placed on abstraction and generalisation. The thought here is governed by state theories and hypotheses (Al-Saadi 2014).
The data collected by the researcher will be evaluated using the Autoregressive Distribution Lag Model (ARDL). The same model is used in previous studies in comparison to Generalized Least Squares (GLS) and Ordinary Least Square (OLS) methods (Ajide 2014; Samontaray 2010). The ARDL approach was adopted due to a number of advantages. Firstly, it can be applied to data regardless of stationarity. Secondly, it can also take a sufficient number of lags. Thirdly, it is a superior estimate of long-run coefficients with reliable diagnostic testing of the estimated equation. Fourthly, the dynamic error correction model (ECM) can also be derived from ARDL (Garratt et al. 2012; Gerrard and Godfrey 1998). However, it is more appropriate on the smaller sample size; that is why, in this study, yearly data are analysed to keep the data within the range of 100 observation each year. To this extent, the researcher will employ trend analysis and fundamental financial/econometric analysis to help establish the relationship.

3.1. Model Specification

The model needed to generate the results is extracted from the generalised least square regression model. Regression models of this type have been in use for decades, but in more recent times, they have been shown to provide a very valuable vehicle for testing for the presence of long-run relationships between economic time-series (Gujarati 2009). In its basic form, an ARDL regression model is as it looks in Equation (1).
y t = β 0 + β 1 y t 1 + + β p y t p + α 0 x t + α 1 x t 1 + α 2 x t 2 + + α q x t q + ε t
The model is derived from the framework to create a framework for the impact of sustainability practices on the share performance with mediation of board member experience. The objective is to identify the relationship between sustainability practices employed by the company and the share performance and how board member experience plays a mediating role in identifying the best practices to maintain the share performance. By keeping in view the prior experiential studies, the causal relations among the variables is specified as follows:
Y = α + β 1 + β 2 ( M e ) + ε
The standard regression equation 1 is used for the analysis of the variables where Y is the dependent variable and Alpha (α) is the constant followed by the independent variables (β) and (ε) error term.
SPER = f(SS + Age (Me) + ε)
The SPER represents the share performance of the firm, which is a dependent variable of the function, whereas the SS is sustainability share is represented by the Environmental, Social and Economic/Governance (ESG). The mediation Age (Me) represents the age of the board members which also shows experience.
The model explained above is then further classified in three equations in order to observe the relationship with Environmental, Social, and Economic (Governance).
SPER = F(SS (Environmental, Social, Economic) + Age (Me) + ε
The analysis is performed using the above equations, which assist in identifying the relationship between share performance and sustainability practices (Environmental, Social and Economic) with a mediation of board member experience. This will also assist in identifying the best diversity of board member based on the experience and age.

3.2. Data Sources

ESG rating is defined as the effective measuring tool used for evaluating the companies’ performance regarding the environmental, social and governance/economic risks and opportunities. It is challenging to report all the sustainability practices or companies’ sustainable activities separately as high cost, resources and time are required. Therefore, companies have mostly used this method to detail their progress regarding exposure to ESG risks and opportunities, and how they manage these risks (Keskin et al. 2020). This is publicly available information about sustainability conducted by the companies, which helps the investors when making investment decisions. It is recognised that the more the company conducts behaviour in the area of sustainability, the greater the ESG score will be, and the more compelling it will be for the investor to invest in the company. By contrast, a lower ESG score means the company has low exposure and does not perform well; therefore, the investors have low interest in the company.
In this study, professional experience is used as a proxy for board characteristics. In this regard, the age of the board member is considered as a representation of their experience. To examine the industry awareness, it was helpful to gather the data on practical experience, along with how it would help the success of businesses and stock performance (Rao and Tilt 2016). The board’s experience was gathered from the organisation’s annual report, websites, and social media platforms such as LinkedIn, all of which offered significant data in this area.
The data of the stock trade capitalisation was derived from the Bursa Malaysia website as a measurement of the stock performance (Malaysia 2022). Increased market capitalisation volumes indicate that buyers were interested in stock because of its profitability or other facts about the company (Ichsani and Suhardi 2015). Trading quantity is a metric of a stock’s performance that academics and researchers use to evaluate its market worth (Abiola and Olusegun 2017).

4. Results and Finding

This section revolves around executing analysis of gathered data via chosen secondary sources to accomplish the central aim of this study. For investigating the gathered secondary data from mentioned sources, the chapter carries out quantitative analysis, which is tested stationary, with no unit root in the model, by applying the unit root test, which shows that data are stationary. The outcomes of testing applied are compiled according to the needs of the analysis using the Autoregressive Distribution Lag Model (ARDL).

4.1. Descriptive Statistics

From the descriptive statistics shown in Table 1, it is clear that the number of observations collected to perform the analysis is 100; i.e., 100 Malaysian companies are taken for the research. However, the sustainability share and share performance of the companies are taken from the year 2017 to 2020.
As shown in Table 1, the age of the board members defines the experience of the board members and the age of the firm. Moreover, it is found that the age of most of the board members age lies in the range of 40 to 80 years, whereas the minimum age is 32 and the maximum age is 83. Considering the share performance of the companies, it is found that the average share performance of the companies is 3.09%; however, the maximum share performance is 35.6% and the minimum value is 0.01%. In the case of sustainability share, the average share in sustainability by the companies is approx. 94.82%, while the maximum share in sustainability recorded is 99% and the minimum share value is 82%.
Hence, from the primary findings, it is clear that the board of members performed well due to greater age and experience level; thus, an increase in share performance and sustainability share came into being. Similarly, it is evident from secondary findings that the older the board members are, the more expertise or knowledge they will have. Moreover, expertise and knowledge are considered to be strategic resources that contribute significantly to share performance as knowledge and expertise assist in management, advice, counselling and making critical decisions. In previous research, age has been taken as an indicator of experience and the competencies of board members; i.e., the older the board members, the more experience they will have.
It is observed that members in their forties and fifties have to face significant challenges and pressures in the business environment, and that as a result, they are more likely to be unable to implement investment decisions. In contrast, board members with more experience are capable of dealing with business matters in a better way due to a high familiarity with the environment. According to both primary and secondary findings, a member of a higher age has more competencies and experience compared to younger aged board members. Moreover, according to resource-based theory, higher aged board members lead to better performance from a firm.

4.2. Autoregressive Distribution Lag (ARDL) Model

Before the application of ARDL model, it is determined that the data are stationary and their lack of serial correlation. The basic rule of applying the ARDL model is to identify the optimum lag selection. This requires certain criteria which can give us an idea of the best model application for the study. According to the criteria, lag selection is observed at different levels (e.g., Lag 4, 3, 2, 1). As a rule of thumb, where Akaike Info Criteria (AIC) or Schwarz Info Criterion (SIC) are at the lowest level, lag selection is considered to be optimum (Anderson et al. 2015).
In this study, AIC info can be used for the optimum lag selection criteria. In the given model, the lag selection criteria are applied at different levels (Lag 1, 2, 3, 4) for each year (2017 to 2020), as shown in Table 2. As discussed in the criteria above, the point where AIC and SIC are lowest is taken as the best lag selection, as shown in Table 2. In 2017, Akaike info criteria (AIC) value is the lowest at Lag 3, which is −6.14 as compared to −6.08 at Lag 4, −6.07 at Lag 2 and −5.99 at Lag 1. Based on the criteria, Lag 3 is at the optimum level with the lowest AIC value in the year 2017 (Anderson et al. 2015; Gujarati 2009).
Using the same criteria, in year 2018, the value of AIC is lowest at Lag 4, which is −6.45, which shows that lag 4 is optimum at this level. In year 2019, the value of AIC is lowest at Lag 4, which is −6.25. In year 2020, the value of AIC is also lowest at Lag 4, which is −6.19.

4.3. Results of Breusch–Godfrey Serial Correlation LM Test

The results of the Breusch–Godfrey serial correlation LM test results are calculated for each year to test if the serial correlation exists in the variable. Table 3 shows the test results of the serial correlation test at lag 3 for year 2017. The results clearly show that the Prob Chi Square value is higher than 5% significance level which indicates that the null hypothesis cannot be rejected. It identifies that there is no serial correlation in the year 2017 dataset, whereas the serial correlation is tested on the optimum lag model of years 2018 to 2020. The results showed that the Prob Chi Square is higher than 5% significance level, which indicates that there is no serial correlation in the data at each optimum lag.
As there is no serial correlation detected in the 2017 dataset, it follows to test the stability of the data by using the CUSUM test. As shown in Figure 2, the results of the CUSUM test show that the blue (Solid) trend line (CUSUM) is in between the two redlines (Dotted), which means that the dataset of the year 2017 is stable at lag 3. The CUSUM stability test is applied on the optimum lag model of the year 2018 to 2020, which indicates that the dataset is stable for each year.

4.4. Wald Test Bound Testing to Check the Longer-Term Association of Variables

In order to see the long-term and long-lasting relationship between the variables in this study, the researcher can use the coefficient bound testing Wald test. The criteria to check the long-term association is to observe the F statistics and compare it to the Pesaran critical value at 5% (Garratt et al. 2012; Pesaran et al. 2001). At 5% critical level, the lower bound value is 2.86 and the upper bound is 4.01 (shown in Table 4 below) and observed F statistics should be higher than the upper bound. It shows that the variables have a long-term and long-lasting relationship with each other. It also means all the variables move along in the longer run (Cooper and Schindler 2013).
The coefficient bound testing Wald test is applied to the data of each year and compared according to the criteria explained above. The results of the Wald test are shown in Table 5. In the year 2017, the results of F statistics value are observed to be 23.14 (at Lag 3), which is higher than 4.01, the upper bound range identified by the Pesaran criteria at 5% critical level. It indicates that all the defined variables have long-term and long-lasting relationships with each other; i.e., all the variables move together in the long run.
In the year 2018, the results of the F statistics value are observed to be 20.48, which is higher than 4.01, the upper bound range identified by the Pesaran criteria at 5% critical level. In the years 2019 and 2020, the results of the F statistics value are 5.23 and 4.89, which is higher than 4.01, the upper bound range identified by Pesaran criteria at 5% critical level. This indicates that all the defined variables in each year have long-term and long-lasting relationships with each other; i.e., all the variables move together in the long run.

4.5. Dynamic Error Correction Model (ECM)

One of the most important aspects of applying the ARDL model is to estimate the Error Correction Term (ECT), which assists in identifying the speed of adjustment toward the long run equilibrium of the applied model at the optimum lag (Anderson et al. 2015). According to the criteria, ECT should be a negative number and significant (p value less than 5%) if model specifications are correct (Gujarati 2009). After analysing the ECT on the given dataset of each year (2017 to 2020), it is observed that the ECT value is negative and significant in each year. However, the serial correlation is observed in the test after applying ECT in the model. To remove the serial correction, one variable DPERFORMANCE (−1) is dropped from the year 2017 to 2020. After removing the DPERFORMANCE (−1) from the dataset, the serial correlation is removed, and results are desirable for the further analysis. Table 6 shows ECT (−1) with no serial correlation observed in the data.
Based on the results shown in Table 6, the ECT value is −0.93 and Prob value is 0.000 (significant), which is desirable for the analysis. The results for year 2017 concluded that the whole system can get back to the long-run equilibrium at the speed of 93.48%.Table 6 shows that there is no serial correlation in the model. The observed p value is 26.71%, which is higher than 5%. That means the null hypothesis cannot be rejected and there is no serial correlation observed in the system. The model derived after applying the diagnostic testing is stable and ready for analysis and interpretation which helps in answering the research questions in the study.
In the study, the same procedure is applied to the dataset of year 2018 to 2020 by removing one variable from the system. After removing DPERFORMANCE (−1) from the model, it is observed that the serial correlation is removed. As shown in the Table 6, ECT (−1) is negative each year, p value is significant and there is no serial correlation in the system. The model in consideration is ready for further analysis and interpretation of results.

4.6. Testing Short Run Causality

In the given model, it is important to test the short run causality of the independent variable on the dependent variable (Ajide 2014; Anderson et al. 2015). To test the short run causality, the researcher can use the Wald test on each variable on the optimum lags.

4.6.1. Experience Short Run Causality Test on the Share Performance

The test is applied on mediation of experience to observe the short run causality on the share performance. In the year 2017, the optimum lag selection is Lag 3. In that case, the researcher can check the causality of the independent variable and the mediators on the dependent variable. The short run causality of board member experience is tested with the share performance (market capitalisation). As shown in Table 7, the default null hypothesis shows that Experience Lag 1, Lag 2 and Lag 3 (C 7, C 8, C 9) will not cause short run causality in the share performance. From the results of the Wald test below, it can be seen that the probability value is 23.57%, which is higher than the 5% significance level. This means that the null hypothesis cannot be rejected, and Experience at Lag 1, Lag 2 and Lag 3 cannot cause short run causality in the share performance in the dataset of year 2017.
The dataset of the optimum lag for the year 2018 to 2020 is also tested for the short run causality between board member experience and share performance. Table 7 shows the overall results of the F statistics probability value. The results concluded that in the years 2018 to 2020, the default null hypothesis cannot be rejected. This means that there is no short run causality in share performance caused by experience of board members.

4.6.2. Sustainability Short Run Causality Test on the Share Performance

After testing short run causality with the mediators (education and experience) with share performance, the next step is to test the short run causality of sustainability performance (ESG ranking) with share performance. In the year 2017, the optimum lag selection is Lag 3. In this case the researcher can check the causality of the independent and dependent variable. As shown in Table 8, the default null hypothesis shows that the Sustainability of Lag 1, Lag 2 and Lag 3 (C 10, C 11, C 12) will not cause short run causality in the share performance. From the results of the Wald test below, it can be seen that the F statistics probability value is 10.39%, which is higher than the 5% significance level. This means that the null hypothesis cannot be rejected, and Sustainability at Lag 1, Lag 2 and Lag 3 cannot cause short run causality in the share performance in the dataset of the year 2017.
The dataset of the optimum lag for the years 2018 to 2020 is also tested for the short run causality between sustainability performance and share performance. Table 8 shows the overall results of the F statistics probability value. The results concluded that in the years 2018 to 2020, the default null hypothesis cannot be rejected. This means that there is no short run causality in share performance caused by sustainability performance (ESG performance).

4.7. Analysis and Interpretation

Following the diagnostic testing, it is clear that the data has no serial correlation, and it has no unit root. This means that the data in each year (2017 to 2020) is stable, stationary and has a longer-lasting relationship. In this section, the coefficients of ARDL at the optimum lag will be observed for the interpretation, which will help in understanding the relationship and answering the research questions.

ARDL Optimum Lag Model

From the results of the ARDL model discussed above, it is seen that the dataset is optimum at Lag 3 in the year 2017, Lag 4 in the year 2018, Lag 4 in the year 2019, and Lag 4 in the year 2020. The results of each year’s Lag are further tested for serial correlation, stability and the long-run and short run relationship between the variables. The results show that there is no serial correlation and that data are stable in each year.
In order to understand the longer-term and longer-lasting relationship between the variables, Coefficient Bound testing Wald Test can be used. The criteria to check the long-term association is to observe the F statistics and compare it to the Pesaran critical value at 5% (Garratt et al. 2012; Pesaran et al. 2001). The results of the Wald test are shown in Table 7. The results of F statistics value in each year is observed to be higher than the upper bound range (Upper bound 4.01) identified by the Pesaran criteria at 5% critical level (Ajide 2014; Laskar and Maji 2017). It indicates that all the defined variables have long-term and long-lasting relationships with each other, i.e., all the variables move together in the long run.
The most important aspect of applying the ARDL model is to estimate the Error Correction Term (ECT), which assists in identifying the speed of adjustment toward the long run equilibrium of the applied model at the optimum lag (Anderson et al. 2015). According to the criteria, ECT should be a negative number and significant at the 5% level, if model specifications are correct (Gujarati 2009). Table 9 shows that the ECT (−1) value in each year is negative and significant at the 5% level, which is desirable for the analysis. The results concluded that the whole system can get back to the long run equilibrium at the speed of 93% (2017), 94% (2018), 93% (2019), and 90% (2020).
The short run causality of board member experience is tested with the share performance (market capitalisation). As shown in the table shown below, it can be seen that the Probability value is higher than the 5% significance level. This means that the null hypothesis cannot be rejected and experience at optimum lag cannot cause short run causality in the share performance.
After testing short run causality with the mediator (experience) and share performance (market capitalisation), short run causality needs to be tested for sustainability performance (ESG ranking) and share performance. From the results of the Wald test in Table 9, it can be seen that the is higher than the 5% significance level. This means that the null hypothesis cannot be rejected and sustainability at optimum lag cannot cause short run causality in the share performance.
As shown in Table 9, the overall model is significant at the 5% level (Prob F-statistic), meaning that the system is estimating long run and short run variations properly. The estimates of model fitness in the adjusted R Square measure show that the independent variable and mediators are explaining 42.5% to 50% (2017 to 2020) variation in the dependent variables, keeping other things constant. In this type of study, the overall range of adjusted R square is acceptable (Awaysheh et al. 2020). The Durbin Watson statistics also fall within the acceptable range for this model.
According to the thumb rule, if prob. value (p-value) is less than 0.05, then it can be said that there exists a significant relationship between variables or the null hypothesis can be accepted. Table 9 shows that the p value for mediators (experience), and the ESG ranking (Sustainability) is insignificant in the short run. Moreover, the t-statistics and prob. value is insignificant at each lag, which means that there is no short run variation caused by the sustainability with a mediation of education and experience on the share performance. The results are consistent with the previous studies of Laskar and Maji (2017), which shows that the short run variation is not observed in the share performance due to corporate social responsibility. However, the results of the coefficient bound testing Wald test indicate that all the defined variables have longer-term and long-lasting relationships with each other, i.e., all the variables move together in the long run. The results of ECT (−1) also estimate that the system is getting adjusted towards long run equilibrium at the speed of 93% (2017), 94% (2018), 93% (2019), 90% (2020), which is significant at the 5% level, meaning that the sustainability has a longer run relationship with the mediation of board members’ education and experience on the share performance. These results are consistent with a classical study of Praveen et al. (2013), which shows that sustainability reporting and corporate social responsivity have a longer run relationship with the financial performance of the firm.
Table 10 shows the long run association of the variables and its impact on the dependent variable. It shows that the board experience in terms of sustainability share (ESG) and share performance is associated with each other in the longer run. The p-values of all the variables are less than 0.05, i.e., age (experience = 0.046) and sustainability share ESG rating (Sustainability Share = 0.034). Furthermore, the value of the adjusted R square is in the range of 40 to 50% (Table 9), indicating that share performance of the companies moves in line with sustainability practices and mediating variables. In the years 2017, 2018 and 2020 the same pattern is observed. The p value indicates that the results are significant, meaning that the mediator and independent variables have a longer-term association with the dependent variable. Accordingly, the results conclude that the sustainability practices of the company impact the share performance with a mediation of board experience in a longer run.
Accordingly, the coefficients show a positive relationship between share performance and sustainability practices, with the mediation of education. However, experience shows a negative association with share performance in each year. It can be said that more experienced board members are concerned with other performance measures instead of concentrating on the sustainability practices (Saggar et al. 2021). The expert board of directors who are highly educated consequently exhibit good sustainability practices, and ultimately the share performance of the companies increased. According to Loderer et al. (2017), the different ages of the board of directors are a reflection of the era in which they were born: old age directors (above age 50) are viewed as hard-working and have strong moral beliefs and values towards profit maximisation. By contrast, directors in the below-fifties age group are seen as more interested in gender equality, human rights and women empowerment. Further, the generation X director group (i.e., age in forties) are found to be more technology-oriented and tech-savvy, i.e., they are more concerned with bringing a green environmental impact through implementing a modern lifestyle with renewable resources. Thus, different age group directors are important for any firm as they are the source of better information, resources, and diversified reasoning for decision making (Galletta et al. 2022). However, the number of board members should be limited, as fewer board members means less cultural diversity, and in turn there will be less chance of conflict arising in decision making (Loderer et al. 2017).
From the findings seen in the above Table 10, it can be said that board experience and board competencies in terms of sustainability share (ESG), share performance or share price all are associated with each other. It is accepted that, in 2020, the progress of all the Malaysian companies was not satisfactory due to the dawn of the COVID-19 pandemic, as all the existing board members did not have high qualifications and experience and were unable to perform well. Thus, as a result, share performance decreased due to a lack of sustainable practices. It is evident from the above table that due to negligible sustainability practices, the level of share performance was low, which indicates that the companies’ progress was not valuable in the view of stakeholders. This happened due to a lack of expertise, education, capabilities and competencies.

5. Discussion

The board attributes (such as age) and sustainability practices (such as environment, social and economic) have an important contribution to firm performance (Nguyen 2022). Moreover, different ages of board members, competencies (qualification), sustainable practices and the firm’s reputation with respect to share performance all are positively associated with each other. The results or findings are consistent with all the previous research conducted in the past that is in support of the argument that “board attributes, sustainability practices and share performance are strongly correlated” (Bhatti and Sulaiman 2021). Board diversity in the form of different ages ensures better applicability of sustainable practices and dealing with sustainable issues. Board attributes such as age, qualification, and the number of board members are a representation of the board’s reputation, while the board’s reputation influences sustainable practices. It is expected that a good board reputation in terms of greater awareness about the environment and social issues can make a decision effectively; otherwise, a bad reputation of the board will lead to bad decision making that will adversely affect the sustainability ESG rating and thus result in bad firm performance. According to secondary findings, in the view of the share performance and sustainability, a major role is played by board attributes. As per the research conducted by Rao and Tilt (2016), board attributes significantly contribute by playing an important role in corporate strategy and decision making.
According to Beji et al. (2021), experience is considered a collection of knowledge and competencies gained by a person from different locations throughout life. Moreover, experience is not only career-oriented or job-oriented, it can be acquired from any stage of the lifecycle from childhood to adulthood. It is expected that board of members with greater experience relevant to the field are likely to be more competent in performing the firm’s objectives. While discussing experience, the age factor is understood as vital, as it is taken as a close indicator of experience, capabilities and competencies.
In this regard, it can be said that the older the age of the board members, the more experience they have, and the more competent they are at decision making (Nguyen and Johnson 2020). According to Jaturat et al. (2021), the more experience board members have, the more they will be able to deal with business matters, sustainable practices and lead firm performance. According to resource-based theory (2018), age and experience provide different resources; i.e., older board members with greater field experience ensure the provision of greater resources than younger members who have less experience in the field (Pfeffer 1972; Pfeffer and Salancik 1978; Pfeffer and Salancik 2015). In many previous kinds of research (Beji et al. 2021; Bhala et al. 2020; Cucari et al. 2018), age has been taken as an identifier of board members’ experience and it is believed that experience is the necessary element which can bring more awareness to board members regarding social sustainable practices. In addition, from the research by Ojeka et al. (2019), it is evident that social sustainable practice is positively related to a firm’s share performance. According to the report by Chong et al. (2018), in Malaysia, the regulations and policies are not only considered economic benefits but also social and environmental benefits. Board members’ experience, skills and competencies are the major determinants to predict to what extent firms deal with such regulations and policies effectively. It is found that experienced board members can deal more efficiently with such regulations and policies and be the reason for the firm’s effective sustainability and share performance.
Moreover, the experienced board members can forecast the possible changes in the future regulations and policy, and thus they can proactively address social sustainability practices. It is recognised that sustainability issues are complex, and firms should have experienced board members to achieve sustainability. Similarly, experienced board members contribute to sustainability; this is important in enhancing the firm’s share performance.
It was found by Bakar and Ahmad (2019) that members with previous experience as supervisors, directors or CEOs from different firms can prove beneficial for a firm as they can bring diverse opinions or ideas and possess a wide range of resources or networks, thus contributing to improved decision making. It is found from the primary data that young board directors mostly have master’s degrees and international experience as compared to older board members who mostly have diplomas, certificates and maximum graduate degree. Moreover, it is expected that diversity in board experience can lead the firm towards better share performance. The primary and secondary findings support the same statement, which stated that experienced board members are the source of diversified opinions and networks useful to the firm that can lead to better corporate governance and social sustainability practice. However, the results of the study are contradicting with the existing literature, which shows that the board members with more experience lead to negative share performance. This is due to the lack of adoption of the new trends emerged in the market. The results are not supported in the shorter run in the defined sample period, which highlights the point that the board members can update the expertise and knowledge to improve the longer-term stock performance.
Conclusively, from the tests, it is analysed that there is a long run relationship between the share performance and sustainability practices in which board attributes are major players. It is also evident from the secondary findings from the research conducted by Augustine et al. (2021) that without the involvement of board attributes, organisations cannot achieve suitability in operations and performance. This can be supported by research conducted by Naciti (2019): different board attributes such as meeting, competence and equity ownership show a positive relationship with sustainable performance. On the other hand, board attributes also play an effective role concerning the share performance. Besides that, the share performance is immediately affected as soon as the sustainability share changes. Besides, how much the percentage change in the share performance will result in due to a change in sustainable practice cannot be predicted. Lastly, there is a significant relationship between board attributes (expertise, experience and knowledge) and the firm’s sustainability practices.

6. Conclusions

The paper examined the impact of sustainability practices on stock performance with the mediation of board member experience. In this study, 100 Malaysian stock market listed companies using purposive sampling are selected from the sample period from 2017 to 2020. An Autoregressive distribution Lag (ARDL) model is employed to investigate the relationship between the variables. The study is useful in identifying how sustainability practices can impact the stock prices. The study has also established how the mediation of board members’ experience can explain the relationship of sustainability practice and stock prices. It is established that the stock market is influenced by major macroeconomic variables such as inflation, interest rates and exchange. However, in normal situations, factors such as sustainability play a vital role in stabilising the stock performance. Nowadays, companies pay huge amounts to improve the governance structure and the sustainability practices of a company, which is helpful in maintaining the stock performance. The research demonstrated that board attributes play a mediating role between sustainability practices and the share performance of the firm. The sustainable practices of a firm are pushing top management, including the board of directors, to make decisions that affect the share performance positively or negatively.
The findings of the study suggest that different ages of the board of directors reflect the era in which they were born. The descriptive statistics shows that directors of an older age (above 50) are viewed as hard-working and have strong moral beliefs and values towards social practices. Conversely, directors in the below-fifties age group are seen as more interested in gender equality, human rights and women empowerment. Moreover, the generation X director group (i.e., age in forties) are found to be more technology-oriented and tech-savvy, i.e., they are found to be more concerned about environmental and social impacts. Thus, different age group directors are important for any firm as they are the source of better information, resources, and diversified reasoning for decision making.
The results showed that all the defined variables have longer-term and longer-lasting relationships with each other, i.e., all the variables move together in the long run. The dynamic error correction terms (ECT-1) are in the range of 90% and the prob. value is 0.000 (significant) in each year, which is desirable for the analysis. This shows that the whole system can get back to the long run equilibrium at a speed of 90% approximately at optimum lag each year. The short run causality of board member experience is tested with the share performance (market capitalisation). The calculated prob. value is higher than the 5% significance level, which shows that board member experience is not causing short run causality in the share performance. The estimates of model fitness measured by the adjusted R Square show how independent variables and the mediator explains changes in the dependent variable. The adjusted R square shows that the independent variable and mediators explain a 42.5% to 50% (2017 to 2020) variation in the dependent variables, keeping other things constant. In this type of study, the overall range of the adjusted R square is acceptable (Awaysheh et al. 2020). The coefficients at each optimum lag show a negative association of experience with share performance. It can be said that more experienced board members are concerned with others’ performance measure instead of concentrating on sustainability practices (Saggar et al. 2021).
Thus, from the results, it is recommended that board members should update themselves regarding new market changes. Lack of information pertinent to global economics and the market ecosystem could further accentuate price movement. Therefore, the board of directors needs to be well-informed regarding the market condition. Similarly, the analysis of domestic and global market by including better transparency and innovation led practices can assist in sustaining the prices of the share at international and regional level.
The existing research was carried out with the major purpose of addressing the research gap of how board member experience considers the importance of sustainability practices which can impact the share performance. The current study completes the analysis findings in order to comprehend the relevance of sustainability practises and the influence of sustainability activities on share performance through the mediation of board qualities. This was performed by employing approaches of quantitative research to analyse the relationship between sustainability practices and the share performance with the mediation of board attributes in the Malaysian listed companies. The study is unique in the way of presenting the results with external performance measures of the firm, such as stock performance, while previous studies considered internal performance measures such as return on asset (ROA) and return on equity (ROE)
However, in the future, the analysis can be carried out by using the approach of qualitative methods to present evidence-based justifications of the current results. It will highlight the insights regarding best sustainable practices that can be employed by the board members to maintain the share prices. It is also noteworthy that the current study was based on examining the association between variables of the research by collecting data from secondary sources, such as annual reports of companies, etc. The study was conducted during the pandemic (COVID-19). The year 2021 was not taken into consideration because the stock performance did not show the real impact of social, economic and environmental changes. The data are also limited since many board members were replaced due to the impact of COVID-19 in the years 2020 and 2021. The existing study is limited in terms of its sample period because the ARDL model is not meant for the large data size. In order to fully adapt the model, the researcher limits the model to the observation each year.

Author Contributions

Conceptualization, U.B. and N.S.; Methodology, U.B.; Validation, U.B. and N.S.; Investigation, U.B.; Writing and Original draft preparation, U.B.; Formal Analysis, U.B. and N.S. All authors have read and agreed to the published version of the manuscript.

Funding

The research received no external funding.

Informed Consent Statement

Not applicable.

Data Availability Statement

The listed companies stock prices data was collected from the Bursa Malaysia. The data of ESG ranking is collected from sustainalytics.com, and FUTSE Russell (FUTSE4good).

Conflicts of Interest

The authors declare no conflict of interest.

References

  1. Abiola, Babatunde, and Ajibola Joseph Olusegun. 2017. Appraising the Exchange Rate Volatility, Stock Market Performance and Aggregate Output Nexus in Nigeria. Business and Economics Journal 8: 1–12. [Google Scholar] [CrossRef]
  2. Ajide, Kazeem Bello. 2014. Quality of governance and stock market performance: The Nigerian experience. Journal of Economics and Development Studies 2: 501–22. [Google Scholar]
  3. Al-Saadi, Hashil. 2014. Demystifying Ontology and Epistemology in research methods. Research Gate 1: 1–10. [Google Scholar]
  4. Alshehhi, Ali, Haitham Nobanee, and Nilesh Khare. 2018. The impact of sustainability practices on corporate financial performance: Literature trends and future research potential. Sustainability 10: 494. [Google Scholar] [CrossRef] [Green Version]
  5. Anderson, David R., Dennis J. Sweeney, Thomas A. Williams, Jeffrey D. Camm, and James J. Cochran. 2015. Quantitative Methods for Business. Boston: Cengage Learning. [Google Scholar]
  6. Annunziata, Eleonora, Tommaso Pucci, Marco Frey, and Lorenzo Zanni. 2018. The role of organizational capabilities in attaining corporate sustainability practices and economic performance: Evidence from Italian wine industry. Journal of Cleaner Production 171: 1300–11. [Google Scholar] [CrossRef]
  7. Arora, Akshita. 2022. Gender diversity in boardroom and its impact on firm performance. Journal of Management and Governance 26: 735–55. [Google Scholar] [CrossRef]
  8. Augustine, Ele Augustine, B. J. Inyang, O. E. Ekpe, Okongo Nsor John, Eja Basil Richard, and Ewah Sunday Felix. 2021. Organizational Development: An Intervention Strategy for Effective Corporate Performance in Nigeria. Development 4: 9–25. [Google Scholar]
  9. Awaysheh, Amrou, Randall A. Heron, Tod Perry, and Jared I. Wilson. 2020. On the relation between corporate social responsibility and financial performance. Strategic Management Journal 41: 965–87. [Google Scholar] [CrossRef]
  10. Bakar, Aishah Ghazali, and Maslina Ahmad. 2019. Sustainability reporting and board diversity in Malaysia. International Journal of Academic Research in Business and Social Sciences 9: 91–99. [Google Scholar] [CrossRef]
  11. Beji, Rania, Ouidad Yousfi, Nadia Loukil, and Abdelwahed Omri. 2021. Board diversity and corporate social responsibility: Empirical evidence from France. Journal of Business Ethics 173: 133–55. [Google Scholar] [CrossRef]
  12. Bhala, Neeraj, Gwenetta Curry, Adrian R. Martineau, Charles Agyemang, and Raj Bhopal. 2020. Sharpening the global focus on ethnicity and race in the time of COVID-19. The Lancet 395: 1673–76. [Google Scholar] [CrossRef]
  13. Bhatti, Uzair, and Noralfishah Sulaiman. 2020. Impact of sustainability practices on share performance with mediation of green innovation: A conceptual paper. International Journal of Psychosocial Rehabilitation 24: 1826–36. [Google Scholar] [CrossRef]
  14. Bhatti, Uzair, and Noralfishah Sulaiman. 2021. The Relationship of Sustainability Reporting and Share Prices with a Mediation of Green Invention: A Conceptual Review Paper. Studies of Applied Economics 39: 25. [Google Scholar] [CrossRef]
  15. Boffo, Riccardo, and Robert Patalano. 2020. ESG Investing: Practices, Progress and Challenges. Paris: OCDE. [Google Scholar]
  16. Chong, Lee-Lee, Hway-Boon Ong, and Siow-Hooi Tan. 2018. Corporate risk-taking and performance in Malaysia: The effect of board composition, political connections and sustainability practices. Corporate Governance: The International Journal of Business in Society 18: 635–54. [Google Scholar] [CrossRef]
  17. Cooper, Donald, and Pamela Schindler. 2013. Business Research Methods, 12th ed. New York: McGraw-Hill Higher Education. [Google Scholar]
  18. Crane, Andrew, Dirk Matten, Sarah Glozer, and Laura Spence. 2019. Business Ethics: Managing Corporate Citizenship and Sustainability in the Age of Globalization. New York: Oxford University Press. [Google Scholar]
  19. Cucari, Nicola, Salvatore Esposito de Falco, and Beatrice Orlando. 2018. Diversity of board of directors and environmental social governance: Evidence from Italian listed companies. Corporate Social Responsibility and Environmental Management 25: 250–66. [Google Scholar] [CrossRef]
  20. Dang, Van Cuong, and Quang Khai Nguyen. 2021. Internal corporate governance and stock price crash risk: Evidence from Vietnam. Journal of Sustainable Finance & Investment, 1–18. [Google Scholar] [CrossRef]
  21. Daugaard, Dan. 2020. Emerging new themes in environmental, social and governance investing: A systematic literature review. Accounting & Finance 60: 1501–30. [Google Scholar]
  22. Dembo, Abubakar M. 2017. The impact of sustainability practices on the financial performance: Evidence from listed oil and gas companies in Nigeria. In Dimensional Corporate Governance. Cham: Springer, pp. 215–33. [Google Scholar]
  23. Dyduch, Justyna, and Joanna Krasodomska. 2017. Determinants of corporate social responsibility disclosure: An empirical study of Polish listed companies. Sustainability 9: 1934. [Google Scholar] [CrossRef] [Green Version]
  24. Fisch, Jill E. 2018. Making sustainability disclosure sustainable. The Georgetown Law Journal 107: 923. [Google Scholar]
  25. Font, Xavier, and Jennifer Lynes. 2018. Corporate Social Responsibility in Tourism and Hospitality. Boca Raton: Taylor & Francis, vol. 26, pp. 1027–42. [Google Scholar]
  26. Galletta, Simona, Sebastiano Mazzù, Valeria Naciti, and Carlo Vermiglio. 2022. Gender diversity and sustainability performance in the banking industry. Corporate Social Responsibility and Environmental Management 29: 161–74. [Google Scholar] [CrossRef]
  27. Galli, Brian J. 2021. Economic Decision-Making and Risk Management: A Relation From the Banking Perspective. International Journal of System Dynamics Applications (IJSDA) 10: 1–25. [Google Scholar] [CrossRef]
  28. Garratt, Anthony, Kevin Lee, M. Hashem Pesaran, and Yongcheol Shin. 2012. Global and National Macroeconometric Modelling: A Long-Run Structural Approach. New York: Oxford University Press. [Google Scholar]
  29. Gerrard, William, and Leslie Godfrey. 1998. Diagnostic Checks for Single-equation Error-correction and Autoregressive Distributed Lag Models. The Manchester School 66: 222–37. [Google Scholar] [CrossRef]
  30. Gujarati, Damodar N. 2009. Basic econometrics. Noida: Tata McGraw-Hill Education. [Google Scholar]
  31. Hassan, Hisham Mohamed. 2009. Causal Relations Growth, Inequality and Poverty in Sudan. Available online: https://papers.ssrn.com/sol3/papers.cfm?abstract_id=1414147 (accessed on 15 June 2021).
  32. Hastalona, Dina, and Isfenti Sadalia. 2021. Literature Review ESG and Sustainability Finance. Budapest International Research and Critics Institute (BIRCI-Journal): Humanities and Social Sciences 4: 3548–57. [Google Scholar]
  33. Hong, Bryan, Zhichuan Li, and Dylan Minor. 2016. Corporate governance and executive compensation for corporate social responsibility. Journal of Business Ethics 136: 199–213. [Google Scholar] [CrossRef] [Green Version]
  34. Ichsani, Sakina, and Agatha Rinta Suhardi. 2015. The effect of return on equity (ROE) and return on investment (ROI) on trading volume. Procedia-Social and Behavioral Sciences 211: 896–902. [Google Scholar] [CrossRef] [Green Version]
  35. Jaturat, Malee, Kusuma Dampitakse, and Chanongkorn Kuntonbutr. 2021. The Effect of Corporate Governance on the Board of Directors’ Characteristics and Sustainability Disclosure: An Empirical Study from Thailand. The Journal of Asian Finance, Economics and Business 8: 191–201. [Google Scholar]
  36. Kamaludin, Kamilah, Izani Ibrahim, Sheela Sundarasen, and Ova Faizal. 2022. ESG in the boardroom: Evidence from the Malaysian market. International Journal of Corporate Social Responsibility 7: 1–15. [Google Scholar] [CrossRef]
  37. Keesstra, Saskia, Gerben Mol, Jan De Leeuw, Joop Okx, Margot De Cleen, and Saskia Visser. 2018. Soil-related sustainable development goals: Four concepts to make land degradation neutrality and restoration work. Land 7: 133. [Google Scholar] [CrossRef] [Green Version]
  38. Keskin, Ayşe İrem, Banu Dincer, and Caner Dincer. 2020. Exploring the impact of sustainability on corporate financial performance using discriminant analysis. Sustainability 12: 2346. [Google Scholar] [CrossRef] [Green Version]
  39. Klakegg, Ole Jonny. 2016. Ontology and epistemology. In Designs, Methods and Practices for Research of Project Management. London: Routledge, pp. 87–96. [Google Scholar]
  40. Laskar, Najul, and Santi Gopal Maji. 2017. Corporate sustainability reporting practices in India: Myth or reality? Social Responsibility Journal 12: 625–41. [Google Scholar] [CrossRef]
  41. Loderer, Claudio, René Stulz, and Urs Waelchli. 2017. Firm rigidities and the decline in growth opportunities. Management Science 63: 3000–20. [Google Scholar] [CrossRef] [Green Version]
  42. Ma, Wanglin, Hongyun Zheng, Yueji Zhu, and Jianling Qi. 2021. Effects of cooperative membership on financial performance of banana farmers in China: A heterogeneous analysis. Annals of Public and Cooperative Economics 93: 5–27. [Google Scholar] [CrossRef]
  43. Malaysia, Bursa. 2022. Bursa Malaysia Retrieved March 2021, 2017–2021. Available online: https://www.bursamalaysia.com/trade/trading_resources/listing_directory/main_market (accessed on 5 October 2019).
  44. Marn, Joel Tham Kah, and Dondjio Fomedjou Romuald. 2012. The impact of corporate governance mechanism and corporate performance: A study of listed companies in Malaysia. Journal for the Advancement of Science & Arts 3: 31–45. [Google Scholar]
  45. Masud, Md, Abdul Kaium, Seong Mi Bae, Javier Manzanares, and Jong Dae Kim. 2019. Board directors’ expertise and corporate corruption disclosure: The moderating role of political connections. Sustainability 11: 4491. [Google Scholar] [CrossRef] [Green Version]
  46. Merendino, Alessandro, Sally Dibb, Maureen Meadows, Lee Quinn, David Wilson, Lyndon Simkin, and Ana Canhoto. 2018. Big data, big decisions: The impact of big data on board level decision-making. Journal of Business Research 93: 67–78. [Google Scholar] [CrossRef] [Green Version]
  47. Naciti, Valeria. 2019. Corporate governance and board of directors: The effect of a board composition on firm sustainability performance. Journal of Cleaner Production 237: 117727. [Google Scholar] [CrossRef]
  48. Nguyen, Ninh, and Lester W. Johnson. 2020. Consumer behaviour and environmental sustainability. Journal of Consumer Behaviour 19: 539–41. [Google Scholar] [CrossRef]
  49. Nguyen, Quang Khai. 2022. Determinants of bank risk governance structure: A cross-country analysis. Research in International Business and Finance 60: 101575. [Google Scholar] [CrossRef]
  50. O’Dwyer, Brendan, and Jeffrey Unerman. 2020. Shifting the focus of sustainability accounting from impacts to risks and dependencies: Researching the transformative potential of TCFD reporting. Accounting, Auditing & Accountability Journal 33: 1131–41. [Google Scholar]
  51. Ojeka, Stephen, Alex Adegboye, Kofo Adegboye, Olaoluwa Umukoro, Olajide Dahunsi, and Emmanuel Ozordi. 2019. Corruption perception, institutional quality and performance of listed companies in Nigeria. Heliyon 5: e02569. [Google Scholar] [CrossRef]
  52. Oncioiu, Ionica, Anca-Gabriela Petrescu, Florentina-Raluca Bîlcan, Marius Petrescu, Delia-Mioara Popescu, and Elena Anghel. 2020. Corporate Sustainability Reporting and Financial Performance. Sustainability 12: 4297. [Google Scholar] [CrossRef]
  53. Oziegbe, David Jerry, and Okenwa Ogbodo Cy. 2021. Board attributes and firm performance of Nigerian quoted banks with international authorization. International Journal of Economics, Business and Management Research 5: 302–17. [Google Scholar]
  54. Pajunen, Nani, Gary Watkins, Maaria Wierink, and Kari Heiskanen. 2012. Drivers and barriers of effective industrial material use. Minerals Engineering 29: 39–46. [Google Scholar] [CrossRef]
  55. Pesaran, M. Hashem, Yongcheol Shin, and Richard J. Smith. 2001. Bounds testing approaches to the analysis of level relationships. Journal of Applied Econometrics 16: 289–326. [Google Scholar] [CrossRef]
  56. Pfeffer, Jeffrey. 1972. Size and composition of corporate boards of directors: The organization and its environment. Administrative Science Quarterly 17: 218–28. [Google Scholar] [CrossRef]
  57. Pfeffer, Jeffrey, and G. R. Salancik. 1978. A resource dependence perspective. In Intercorporate Relations. The Structural Analysis of Business. Cambridge: University Press Cambridge. [Google Scholar]
  58. Pfeffer, Jeffrey, and Gerald Salancik. 2015. External Control of Organizations—Resource Dependence Perspective. In Organizational Behavior 2. London: Routledge, pp. 373–88. [Google Scholar]
  59. Praveen, Goyal, Rahman Zillur, and A. A. Kazmi. 2013. Corporate sustainability performance and firm performance research: Literature review and future research agenda. Management Decision 51: 361–79. [Google Scholar]
  60. Pugna, Irina Bogdana, Adriana Duțescu, and Oana Georgiana Stănilă. 2019. Corporate attitudes towards big data and its impact on performance management: A qualitative study. Sustainability 11: 684. [Google Scholar] [CrossRef] [Green Version]
  61. Rahman, Haseeb Ur, Muhammad Zahid, and Musa Khan. 2022. Corporate sustainability practices: A new perspective of linking board with firm performance. Total Quality Management & Business Excellence 33: 929–46. [Google Scholar]
  62. Rao, Kathyayini, and Carol Tilt. 2016. Board composition and corporate social responsibility: The role of diversity, gender, strategy and decision making. Journal of Business Ethics 138: 327–47. [Google Scholar] [CrossRef]
  63. Ryan, Gemma. 2018. Introduction to positivism, interpretivism and critical theory. Nurse Researcher 25: 41–49. [Google Scholar] [CrossRef] [Green Version]
  64. Saggar, Ridhima, Nischay Arora, and Balwinder Singh. 2021. Gender diversity in corporate boardrooms and risk disclosure: Indian evidence. Gender in Management: An International Journal 37: 182–201. [Google Scholar] [CrossRef]
  65. Samontaray, Durga Prasad. 2010. Impact of corporate governance on the stock prices of the nifty 50 broad index listed companies. International Research Journal of Finance and Economics 41: 7–18. [Google Scholar]
  66. Schmitt, Eugenia. 2017. Effective risk culture in banks: Responsibilities and boundaries of the risk management. In European Financial Systems 2017, Proceedings of the 14th International Scientific Conference. Brno: Masaryk University, p. 239. [Google Scholar]
  67. Shen, Wei, Yuliya Ponomareva, and Timur Uman. 2022. Can you catch two birds with one stone? The impacts of nominating committee composition on board monitoring and resource provision. Long Range Planning 55: 102127. [Google Scholar] [CrossRef]
  68. Sumner, Jennifer. 2017. Sustainability and the Civil Commons. Toronto: University of Toronto Press. [Google Scholar]
  69. Tejerina-Gaite, Fernando A., and Miguel A. Fernández-Temprano. 2020. The influence of board experience on firm performance: Does the director’s role matter? Journal of Management and Governance 25: 685–705. [Google Scholar] [CrossRef]
  70. Tran, Ben. 2019. Corporate social responsibility. In Advanced Methodologies and Technologies in Business Operations and Management. Hershey: IGI Global, pp. 270–81. [Google Scholar]
  71. Unruh, Gregory, David Kiron, Nina Kruschwitz, Martin Reeves, Holger Rubel, and Alexander Meyer Zum Felde. 2016. Investing for a sustainable future: Investors care more about sustainability than many executives believe (No. 1532-9194). MIT Sloan Management Review 57: 1–32. [Google Scholar]
  72. van Schaaijk, Art, Adnan Noor Baloch, Sara Thomée, Monique Frings-Dresen, Mats Hagberg, and Karen Nieuwenhuijsen. 2020. Mediating factors for the relationship between stress and work ability over time in young adults. International Journal of Environmental Research and Public Health 17: 2530. [Google Scholar] [CrossRef] [Green Version]
  73. Whitler, Kimberly A., Ryan Krause, and Donald R. Lehmann. 2018. When and how board members with marketing experience facilitate firm growth. Journal of Marketing 82: 86–105. [Google Scholar] [CrossRef]
  74. Yong, Jing Yi, Mohd-Yusoff Yusliza, Thurasamy Ramayah, Charbel Jose Chiappetta Jabbour, Simone Sehnem, and Venkatesh Mani. 2020. Pathways towards sustainability in manufacturing organizations: Empirical evidence on the role of green human resource management. Business Strategy and the Environment 29: 212–28. [Google Scholar] [CrossRef]
  75. Zaragoza-Sáez, Patrocinio, Enrique Claver-Cortés, Bartolomé Marco-Lajara, and Mercedes Úbeda-García. 2016. Influence of intellectual capital upon knowledge creation in Spanish subsidiaries: An empirical study. Knowledge Management Research & Practice 14: 489–501. [Google Scholar]
  76. Żelazna, Anna, Matylda Bojar, and Ewa Bojar. 2020. Corporate Social Responsibility towards the Environment in Lublin Region, Poland: A comparative study of 2009 and 2019. Sustainability 12: 4463. [Google Scholar] [CrossRef]
  77. Zorio-Grima, Ana, Laura Sierra-García, and Maria A Garcia-Benau. 2017. Sustainability reporting experience by universities: A causal configuration approach. International Journal of Sustainability in Higher Education 19: 337–52. [Google Scholar] [CrossRef]
  78. Zraqat, Omar. 2019. Sustainability practices disclosure and value relevance: Evidence from Jordan. Modern Applied Science 13: 75–86. [Google Scholar]
Figure 1. Research framework. Source: Researcher-Generated.
Ijfs 11 00004 g001
Figure 2. CUSUM Test Results (Lag 3–Year 2017).
Ijfs 11 00004 g002
Table 1. Descriptive Statistics.
Sustainability 2017Sustainability 2018Sustainability 2019Sustainability 2020Share Performance 2017Share Performance 2018Share Performance 2019Share Performance 2020Experience Education
Mean89.890.391.489.42.83.43.82.556.62.5
Median94.595.096.094.01.51.92.51.257.02.0
Maximum99.399.5100.099.033.934.535.633.383.05.0
Minimum0.31.53.81.00.10.20.30.032.01.0
Std. Dev.20.420.320.020.24.74.95.24.611.21.5
Probability0.00.00.00.00.00.00.00.00.40.0
Sum9253.49305.09409.29208.5289.4345.5389.8260.45832.0258.0
Obs103.0103.0103.0103.0103.0103.0103.0103.0103.0103.0
Table 2. Lag selection using Akaike Info Criteria (AIC) or Schwarz Info Criterion (SIC).
ARDL Lag Selection
YearLag 4Lag 3Lag 2Lag 1
AICSICAICSICAICSICAICSIC
2017−6.08−6.64−6.14 *−6.69 *−6.07−6.41−5.99−6.23
2018−6.45 *−7.06 *−6.37−6.85−6.26−6.62−6.296.54
2019−6.25 *−6.82 *−6.23−6.71−6.19−6.53−6.12−6.35
2020−6.19 *−6.76 *−6.17−6.62−6.16−6.5−6.1−6.36
* Optimum lag.
Table 3. Breusch–Godfrey serial correlation LM test (Lag 3–Year 2017).
Breusch–Godfrey Serial Correlation LM Test:
Null Hypothesis: No Serial Correlation at up to 3 Lags
Fstatistic0.917249Prob. F(3,77)0.06436
Obs*R-squared3.346878Prob. Chi-Square(3)0.06343
Table 4. Pesaran and Narayan critical value. Source: (Hassan 2009; Pesaran et al. 2001).
Pesaran et al. (2001)Hassan (2009)
Critical ValueLower Bound ValueUpper Bound Value Lower Bound ValueUpper Bound Value
1%3.745.064.596.37
5%2.864.013.284.63
10%2.453.522.703.90
Table 5. F Statistics of bound testing Wald test (2017–2020).
Coefficient Bound Testing Wald Test (2017–2020)
Year F Statistics Bound Testing Remark
201723.41>4.01Long-term association
201820.48>4.01Long-term association
20195>4.01Long-term association
20204.89>4.01Long-term association
Table 6. ARDL and serial correlation after removing DPERFORMANCE (−1).
Year ECT (−1)p Value Serial Correlation (p Value)Remarks
2017−0.9348890.00000.2671Negative, Significant, No Serial Correl
2018−0.937140.00000.2351Negative, Significant, No Serial Correl
2019−0.9413580.00000.1576Negative, Significant, No Serial Correl
2020−0.902080.00000.1636Negative, Significant, No Serial Correl
Table 7. Wald test for short run causality between experience and share performance (2017 to 2020).
Year Probability ValueNull Hypothesis Optimum LagsRemarks (5% Significance Level)
201723.57%C(7) = C(8) = C(9) = 03Null hypothesis accepted (No short run causality)
201818.82%C(9) = C(10) = C(11) = C(12) = 04Null hypothesis accepted (No short run causality)
201929.87%C(9) = C(10) = C(11) = C(12) = 04Null hypothesis accepted (No short run causality)
202021.31%C(9) = C(10) = C(11) = C(12) = 04Null hypothesis accepted (No short run causality)
Table 8. Wald Test for short run causality between sustainability performance and share performance (2017 to 2020).
Year Probability ValueNull Hypothesis Optimum LagsRemarks (5% Significance Level)
201710.30%C(10) = C(11) = C(12) = 03Null hypothesis accepted (No short run causality)
201813.78%C(13) = C(14) = C(15) = C(16) = 04Null hypothesis accepted (No short run causality)
201926.39%C(13) = C(14) = C(15) = C(16) = 04Null hypothesis accepted (No short run causality)
202014.83%C(13) = C(14) = C(15) = C(16) = 0 4Null hypothesis accepted (No short run causality)
Table 9. Long run and short run, adjusted R square, and significance (2017 to 2020).
Year Optimum LagECT (−1) Coefficient of Bound Testing > 4.01Sustainability (ESG)-Short Run Causality (5% Sig Level)Experience-Short Run Causality Adjusted R SquareDurbin WatsonProb F Stat
20173−0.9323.4110.30%24%42.26%2.9230.000
20184−0.9420.4813.78%19%50.50%2.1990.000
20194−0.94526.39%30%50.23%2.1410.000
20204−0.904.8914.83%21%56.76%2.3890.000
Table 10. Interpretation of long run coefficient (5% significance level).
Year ItemsCoefficientT StatisticsProbResults
2017Experience −0.032.654.6%Significant
Sustainability0.012.383.4%Significant
2018Experience −0.032.624.4%Significant
Sustainability0.03−2.243.2%Significant
2019Experience −0.020.563.8%Significant
Sustainability−0.05−2.232.8%Significant
2020Experience 0.08−2.872.8%Significant
Sustainability0.002.193.4%Significant
Disclaimer/Publisher’s Note: The statements, opinions and data contained in all publications are solely those of the individual author(s) and contributor(s) and not of MDPI and/or the editor(s). MDPI and/or the editor(s) disclaim responsibility for any injury to people or property resulting from any ideas, methods, instructions or products referred to in the content.

