Article

Corporate Social Responsibility Risk and Firm Performance: A Network Perspective

1
Collaborative Innovation Center for Transport Studies, Dalian Maritime University, Dalian 116026, China
2
School of Shipping Economics and Management, Dalian Maritime University, Dalian 116026, China
*
Author to whom correspondence should be addressed.
Int. J. Financial Stud. 2022, 10(2), 40; https://doi.org/10.3390/ijfs10020040
Submission received: 14 April 2022 / Revised: 19 May 2022 / Accepted: 19 May 2022 / Published: 1 June 2022
(This article belongs to the Collection Corporate Social Responsibility in Finance)

Abstract

:
This study explored how corporate social responsibility (CSR) risk, social networks, and firm performance interacted in light of resource dependence theory and information asymmetry theory to bridge the literature gap between CSR risk and firm performance under the conditions of China’s network. We used data from Shanghai and Shenzhen A-share listed firms in China from 2010 to 2019 to conduct a social network analysis and random-effects GLS regression analysis. The study revealed the following: (1) CSR risk hurts financial performance, while structural holes and network density attenuate this effect; (2) CSR risk positively impacts capital performance, which is amplified by closeness centrality; (3) CSR risk harms innovation performance, while betweenness centrality and network density mitigate this effect. Despite CSR risk bringing short-term benefits, this effect is not sustained. Generally, CSR risks are more detrimental to firms than beneficial. In this study, we strengthen the basis of the research on CSR risk and firm performance, along with research on social networks, advising firms to avoid CSR risks and utilize their networks to mitigate such risks and achieve a better performance.

1. Introduction

There is a consensus that corporate social responsibility (CSR) practices benefit society, investors, and firms (Becchetti et al. 2012). CSR engagement could improve organizations and lead to increased shareholder wealth (Krüger 2015), increased transparency (Kim et al. 2014), lower corporate risk (Jo and Na 2012), and cheaper access to financing (Cheng et al. 2014). According to stakeholder theory and resource dependence theory, positive CSR could help firms meet stakeholder needs and build close stakeholder relationships (Choi and Wang 2009), obtaining scarce, irreplaceable, and competing resources (Hasan and Habib 2017; Vilanova et al. 2009). Positive CSR behaviors could also benefit firms by strengthening communication with stakeholders, enhancing corporate legitimacy, and lowering litigation and regulatory risks (Hong and Kacperczyk 2009). It could heighten customer evaluation and satisfaction with the firm’s products, improve customer loyalty, reduce customer churn in a fiercely competitive environment (Krasnikov et al. 2009), establish a positive corporate image of a “good citizen”, and reduce the volatility of operating income and firm risk (Jo and Na 2012; Liu et al. 2021a). By emphasizing CSR practices, firms may also garner more financial support from their customers and become more resilient to damaging health crises (Boubaker et al. 2022). Furthermore, Lu and Abeysekera (2021) found that the stock market responds positively to the disclosure of strategic CSR (Lu and Abeysekera 2021). Better CSR performance makes firms more creditworthy, providing them better access to financing, reducing distress and default risk, potentially leading to a more attractive corporate environment, better financial stability, and a more crisis-resilient economy (Boubaker et al. 2020).
However, CSR activities may be affected by factors, such as the national macro-institutional environment and religious and cultural norms (Hunjra et al. 2021; Pan et al. 2018). There is a wealth of prior work on CSR in developed Western countries, but those studies rarely address emerging economies and developing countries and provide limited insights (Blowfield and Frynas 2005). China is the world’s largest developing country and emerging market economy, but its CSR research was introduced relatively late, lacking proper supervision and strict constraints stemming from relevant laws and regulations. The large majority of Chinese firms lack CSR activities and even engage in corporate social irresponsibility (CSI) as a means to gain economic benefits, leading to severe CSR problems. The CSI behavior of Chinese firms is more severe than others, and it deserves more attention from scholars. For example, since the Southern Weekend Research Institute of China began collecting and analyzing CSI incidents in September 2019, it has collected 407 cases in just ten months. Indeed, this is only the tip of the iceberg. Chinese firms’ CSI behavior and behavioral alienation are becoming more serious. In addition, CSR-related systems are not complete, supervision in China is weak, and socially irresponsible actions cannot be effectively identified. Even if exposed, appropriate protocols may not be in place, and firms may not be appropriately punished, with events being easily forgotten. Therefore, China, as the research object to delve further into the impact of CSR risk on firm performance, may provide a promising opportunity for CSR research.
“CSI is seen as immoral and/or illegal corporate actions with negative consequences for others” (Lin-Hi and Müller 2013). Widespread external perceptions state that a CSI practice can have negative consequences since an organization’s success, indeed its survival, depends in part on satisfying normative expectations from its environment (Pfeffer and Salancik 1978). Some scholars corroborate that firms with CSI practices may be punished, leading to a decline in firm performance and affecting firm value (Gregory-Smith et al. 2014; Wang and Sarkis 2017). Nevertheless, empirical studies regarding the effect of CSI on firms’ performance show seemingly inconsistent findings. Using empirical data from 3773 global-listed firms from 1998 to 2005 (Li et al. 2018), it was found that CSI has a U-shaped impact on financial performance.
CSR risk is closely linked to CSI and can be viewed as an extension. It is necessary here to clarify exactly what is meant by CSR risk. We defined it as the risk possibility or consequences of social and firm damage and losses due to various CSI behaviors to stakeholders (Li and Guan 2017). CSR risk encompasses the following six dimensioned risks: responsible governance risk, human rights risk, environmental responsibility risk, proper operation risk, product responsibility risk, and community development risk (Luo et al. 2021). Several scholars investigated CSR risk, but few of these studies were conducted from an empirical perspective in China. Li and Guan (2017) utilized the data of China’s 171 listed manufacturing firms to analyze the linear impact of CSR risk on financial performance and capital performance in the current period and one lag period (Li and Guan 2017). This study, however, only used sample data from the manufacturing industry, so its results may not accurately reflect all situations in China. Despite the extensive insights found by this body of research into CSR risk/CSI on financial performance and capital performance, it is still unclear what impact CSR risk/CSI has on firm performance in the context of China. Moreover, studies on whether innovation performance is affected by CSR risk/CSI are absent from the literature.
Previous studies examined how the linkage between CSI and firm performance may be moderated by environmental dynamism, competition intensity, firm capability, and disclosure (Fatemi et al. 2018; Sun and Ding 2021), whereas little attention was devoted to the relationship between CSR risk/CSI and firm performance under different network characteristics. Chinese firms have an institutional background that differs from the Western “relational society” (Xie and Chen 2012). A social network is a collection of relationships generated by the interaction of multiple social actors (Tichy et al. 1979), and the social network relationships “embedded” by firms could affect its behavioral characteristics (Granovetter 1985). Accordingly, different characteristics of networks and research situations have produced conflicting findings regarding the effect of social networks on firm performance (Li et al. 2013; Martin et al. 2015). Moreover, research regarding the network’s effect on CSR behavior is not comprehensive. In previous studies, authors generally wrote about network relationships that might influence similarities in behavior, decisions of disclosure, and the quality of disclosure of CSR reports (Liu and Wang 2016). Previous research has shed important light on how network characteristics affect firm behavior and performance (Larcker et al. 2013; Liu et al. 2021b). However, it still falls short of exploiting the moderating effect of network characteristics on the relationship between CSR risk/CSI and firm performance. To bridge these research gaps, we address two questions in our study:
What impact does CSR risk have on financial performance, capital performance, and innovation performance, respectively?
Under what network conditions will CSR risk’s positive and negative effects on firm performance become more pronounced?
This study makes three contributions to the existing literature. First, by integrating resource dependence theory and information asymmetry theory, this study investigates the mechanism of CSR risk on firm performance, deepening the application of theory and extending the research on CSI practice, CSR risk, and its relationship with firm performance. This study finds that CSR risk harms financial and innovation performance but benefits capital performance. However, this positive effect is short-lived. The impact of CSR risk on firm performance is still more harmful than profit in the long run. Second, this study synthesizes the overall perspective (network density) and local perspective (centrality and structural holes) to explore how social networks moderate the relationship between CSR risk and firm performance. Study results have important implications for how firms can adequately avoid CSR risk while using social networks to minimize the detrimental effects of CSR risk, thus improving firm performance. It also guides investors to rationally invest and minimize blind investment. Finally, this study takes Chinese-listed firms as the research object, adding developing countries’ insights into CSR and CSI practices, as well as the relationship between CSR risk, social network, and firm performance. This study deepens and expands the previous literature primarily from developed countries, highlighting the importance of research in emerging markets and the developing world. It is critically important that all stakeholders, including shareholders, investors, consumers, and government officials, understand how CSR risks affect firm performance and the critical role of networks.
Building on the resource dependence theory and information asymmetry theory, we delve further into the relationship between CSR risk, social network, and firm performance. We utilized the data of A-share listed firms in Shanghai and Shenzhen from 2010 to 2019 to perform social network analysis and random-effects GLS regression analysis. The results revealed that: (1) CSR risk harms financial performance, while structural holes and network density attenuate this effect; (2) CSR risk positively impacts capital performance, which is heightened by closeness centrality; (3) CSR risk damages innovation performance, while betweenness centrality and network density mitigate this effect. CSR risk positively impacts capital performance in the short term, but it is not sustainable. The negative impact of CSR risk still outweighs the positive impact in the long run. It implies that firms should properly fulfill their social responsibilities, minimize their participation in CSI incidents, and ultimately attenuate the adverse effects of CSR risks. Investors also cannot blindly invest in irresponsible firms for short-term gain.
The next part of this paper will discuss the theoretical background and hypotheses development. Section 3 describes our empirical design. We elucidate the results in Section 4 and discuss significant findings in Section 5. Finally, the last section concludes the paper and presents limitations and future research avenues.

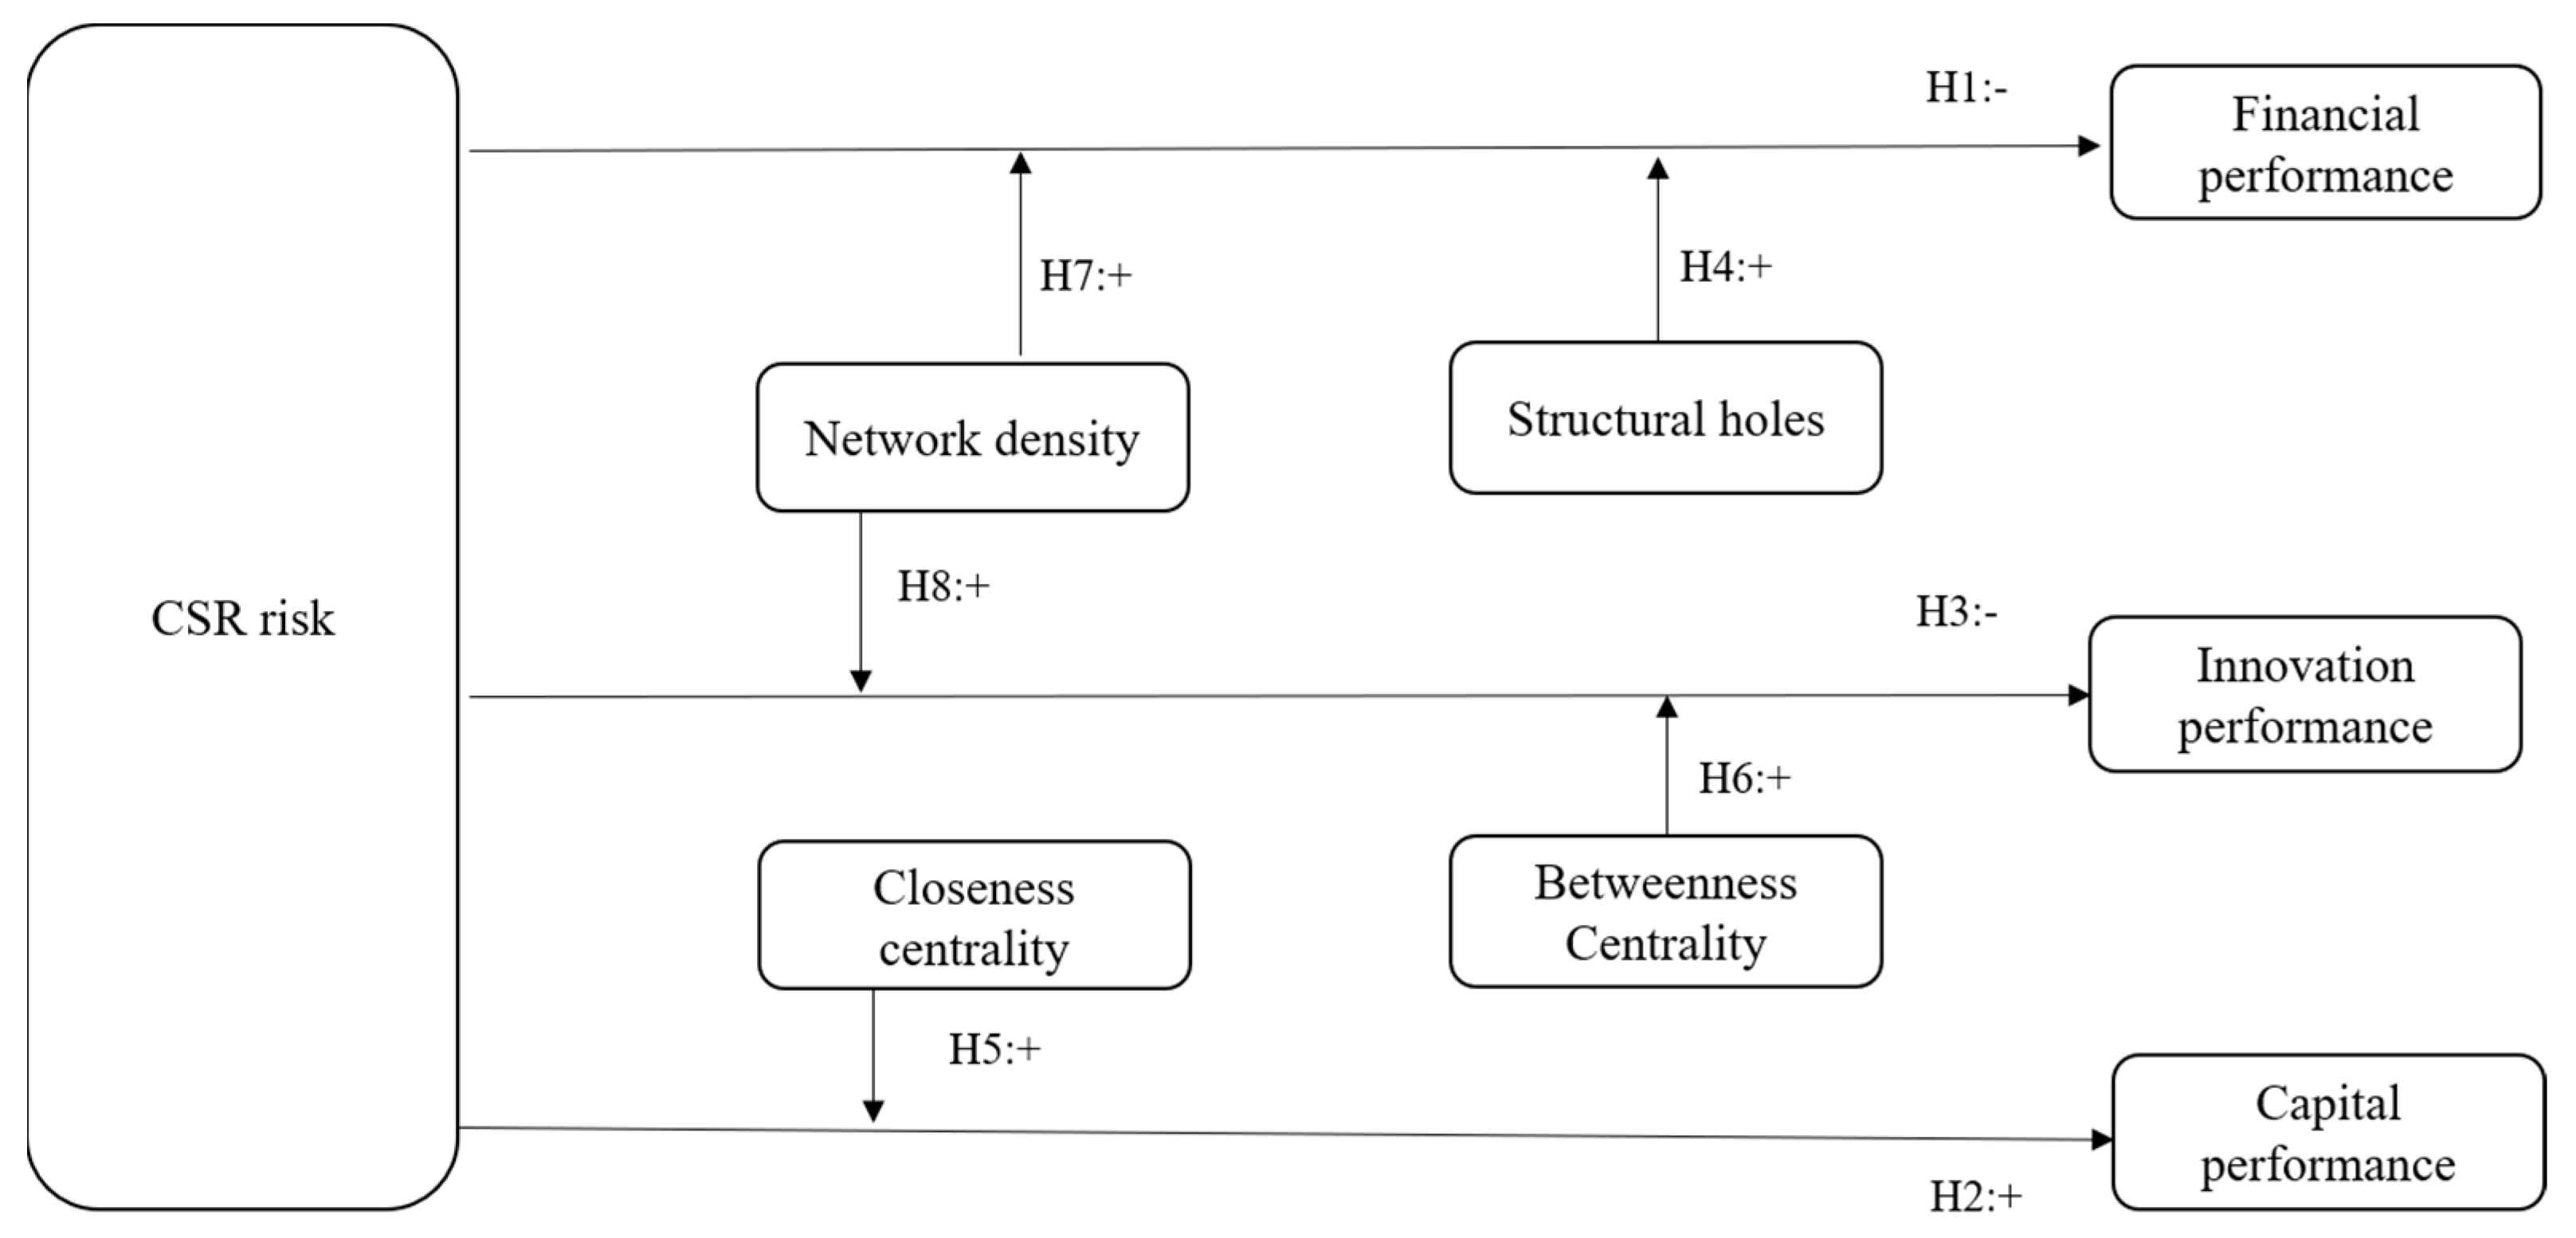
2. Theoretical Background and Hypotheses Development

2.1. CSR Risk and Firm Performance

Resource dependence theory affirms that constructing a firm’s competitive advantage depends on the pivotal resources held by its stakeholders. The higher the CSR risk, the greater the likelihood of losing valuable strategic resources obtained from stakeholders. These high CSR risk behaviors send many negative signals to the market and stakeholders (Folkes and Kamins 1999; Luo et al. 2010). Stakeholders such as regulators and consumers may pay more attention to firms and punish them, which results in lower sales, lower investment, and lower employee satisfaction (Folkes and Kamins 1999; Luo et al. 2010). The incessant disregard of firms for CSR risk may eventually result in lower loyalty, less government support, a loss of trust from partners, and a loss of pivotal resources controlled by stakeholders, resulting in a low sustainability of corporate earnings, elevated finance costs, and decreased financial performance and firm value (Wan and Liu 2015). In addition, there is a significant asymmetry between people’s cognitive processing of negative information and positive information (Kanouse and Hanson 1987). In contrast to positive news, the public may respond more strongly to negative news and actively participate in evaluating and disseminating this negative news (Folkes and Kamins 1999). It is easier for stakeholders to detect a firm’s irresponsible behavior when unfavorable information is widely disseminated. There may be a reduction in the degree of information asymmetry between the firm and its stakeholders. As a consequence, it is difficult for the firm to utilize information asymmetry to obtain pivotal resources from stakeholders, ultimately attributing to higher operating costs and a decline in financial performance. Therefore, we hypothesize:
Hypothesis 1.
CSR risk attenuates a firm’s financial performance.
CSR risk is manifested as the possibility or consequence of damage and loss to firms and society due to CSI. It is a widely held view that a firm’s CSI behaviors may cause damage or losses for it. This CSI behavior may lead responsible investors to sell stocks and reduce investment. However, Groening and Kanuri (2013) found that adverse CSR events may positively impact firm value because, in the stock market, investors may carefully assess the impact of CSI behavior on its future earnings. This suggests that irresponsible behavior has only a limited negative social impact and is conducive to reducing a firm’s costs. Investors may decide to stick with their existing investment or even increase it for a profit. A firm may obtain the corresponding stock returns to a certain extent (Groening and Kanuri 2013). In addition, (El Ghoul et al. 2011) contend that the information asymmetry of firms with a poor social responsibility performance is more severe than that of firms with excellent CSR performance. Severe information asymmetry makes it difficult for investors to discern a firm’s actual financial status. Firms with poor CSR performance receive little attention, and investors who invest in such firms may take greater risks and demand greater risk premiums (Merton 1974). These firms may have to offer higher expected stock returns to attract investors, thereby heightening the firm’s capital performance. Therefore, we hypothesize:
Hypothesis 2.
CSR risk heightens a firm’s capital performance.
Resource dependence theory emphasizes the interdependence between the firm and other environmental subjects (such as individuals, other firms, groups, or governments) to ensure resource exchange stability (Pfeffer and Salancik 1978). The fulfillment of various social responsibilities to stakeholders could meet the needs of stakeholders and ensure this resource exchange stability. In this way, a firm could attain the knowledge resource network of its stakeholders and gather explicit and tacit knowledge essential to both internal and external innovation (Li and Yang 2019). Conversely, if a firm cannot perform CSR or suffers from a high CSR risk, the stability of resource exchange between a firm and stakeholders might be quickly destroyed. A firm with a high CSR risk has difficulty obtaining explicit and tacit innovation resources from stakeholders, resulting in the loss of innovative talents, investors decreasing innovation capital support, the Government decreasing creation and entrepreneurship policy support, and partners reducing innovation cooperation. Ultimately, such high CSR risk behavior may hinder a firm’s ability to innovate. In addition, when CSR risk rises, a firm may prioritize the negative impact of CSR risk and consume abounding resources to compensate for the reputation loss caused by CSI, attributing to a resource crowding effect on other production and operation activities of the firm. A firm’s insufficient investment in energy and resources in innovation ultimately leads to lower innovation performance. Therefore, we hypothesize:
Hypothesis 3.
CSR risk attenuates a firm’s innovation performance.

2.2. The Moderating Role of Social Networks

Structural holes could connect individuals who normally could not be directly connected (Burt 1992). On the one hand, a firm with structural holes could monopolize most of the resources and information in the network. On the other hand, it could block the communication channels between other firms and become the carrier of information resource allocation (Huang 2019). When a firm with a high CSR risk is in a structural hole position, it can easily integrate resources, such as information, knowledge, and technology. The resources obtained from structural holes might compensate for essential resources not accessible from stakeholders due to high CSR risk, enabling the firm to build competitive advantages and improve financial performance. In addition, a firm in a structural hole could control the flow of information, effectively block the dissemination of unfavorable information, maintain the reputation and image of CSR, and weaken the adverse effect of CSR risk on financial performance to a certain extent. Therefore, we hypothesize:
Hypothesis 4.
Structural holes attenuate the negative impact of CSR risk on financial performance.
Network centrality could serve as a measure of individuals’ importance in social networks and reflect their superiority, privilege, and social prestige in society. Closeness centrality is a measure of network centrality, which represents the ability of a participant to directly and independently access other participants (Freeman 1978). It follows that the higher a firm’s closeness centrality, the shorter its path to other participants in the network, and the harder it is for other participants to constrain it (Freeman 1978). The higher CSR risk that a firm with high closeness centrality has, the more difficult it is for other participants in the social network to constrain or control it. Unconstrained firms incur more CSR risks, which further enhance the positive impact of CSR risk on capital performance. In addition, when the closeness centrality of a firm with a high CSR risk is greater, the distance from the firm to other participants in the social network is shorter, the information is disseminated more quickly, and the firm’s irresponsible negative information is more widespread. The greater the likelihood of losses from widespread negative information, the more the firm may have to provide higher stock returns to attract more investors, ultimately improving capital performance. Therefore, we hypothesize:
Hypothesis 5.
Closeness centrality heightens the positive effect of CSR risk on capital performance.
Betweenness centrality means that a participant is on the path to communicating with other participants, and other participants must communicate through this participant. “Individuals in the middle position could influence the group by controlling or distorting the transmission of information” (Freeman 1978). When a firm with high betweenness centrality suffers high CSR risk, it could minimize or eliminate the adverse impact of high CSR risk by controlling the flow of unfavorable information, thereby restraining the damaging effects of CSR risk on innovation performance. From the resource dependence theory, a firm with a high betweenness centrality often has more motivation to undertake CSR to gain information and resource support from marginal firms in the network, which lowers CSR risk. A firm with a high betweenness centrality is likely to form a long-term and stable collaboration and more trust relationships with other firms, facilitating the integration of complementary resources and mutually beneficial collaboration (Bagul and Mukherjee 2018). These complementary resources and mutually beneficial collaboration may buffer the negative impact of CSR risk on innovation performance due to the loss of crucial innovation resources. Therefore, we hypothesize:
Hypothesis 6.
Betweenness centrality attenuates the negative impact of CSR risk on innovation performance.
Network density refers to the degree of closeness between network members (Nahapiet and Ghoshal 1998). Network density affects not only the way participants exchange information and cooperate, but also imposes constraints on them (Afuah 2013), affecting the relationship between CSR risk and firm performance. On the one hand, high-density networks also force the firm to comply with accepted behavioral norms and market norms due to the cohesion of the network (Xie 2005). A firm in dense networks is more likely to be sanctioned if its behaviors are not standardized (Oliver 1991). Therefore, in a high-density network, the firm must strictly prevent CSR risk, actively perform corresponding social responsibilities, and minimize its negative impact on firm performance. On the other hand, high-density networks could open up more possibilities for the firm to contact more participants and open up channels of resource acquisition (Xie 2005). It could promote resource exchange and information sharing among firms, bringing the firm more resources to compensate for the loss of crucial resources obtained from stakeholders due to high CSR risk. Ultimately, the negative impact of high CSR risk on firm performance is alleviated on a high-density network. Therefore, we hypothesize:
Hypothesis 7.
Network density attenuates the negative impact of CSR risk on financial performance.
Hypothesis 8.
Network density attenuates the negative impact of CSR risk on a firm’s innovation performance.
The conceptual framework of this study is shown in Figure 1.

3. Empirical Design

3.1. Data and Sample

We utilized the data of Shanghai and Shenzhen A-share listed firms of China from 2010 to 2019 as the initial firm-year observations. Simple data were gathered from the CSR reports, annual reports, CSMAR databases, WIND databases, CNRDS databases, and Hexun.com released by Chinese listed firms in Shanghai and Shenzhen. To maintain the integrity of the firm’s network, we included all A-share listed firms when computing the network variables (Chen 2014). For other variables, we processed the initial sample as follows: (1) removed missing values; (2) removed financial listed firms; (3) removed discontinuous firms in the ten years from 2010 to 2019. Then, we winsorized the main continuous variables at the 1% level, and finally, obtained 1593 A-share listed firms for ten consecutive years from 2010 to 2019, with 15,930 samples in total.

3.2. Measurement

3.2.1. Dependent Variables

Financial performance: To access a firm’s financial performance in a certain period, we chose the absolute indicator—net profit. Because the relative index is used to measure when the firm has CSR risk, it may simultaneously affect the relative index numerator and denominator, which may cause deviation (Li and Guan 2017).
Capital performance: The stock price reaction to CSR risk could show changes in the firm’s market value and whether investors favor it. We could intuitively observe the impact of CSR risk on capital performance through stock price. To avoid the effects of differences in stock prices of different firms and consider the existence of cash dividend reinvestment in the stock market, we utilized the annual individual stock return considering cash dividend reinvestment to represent the firm’s capital performance (Li and Guan 2017).
Innovation performance: Patents represent the independent intellectual property rights and proprietary technologies the firm owns. Many scholars have adopted the sum number of patent applications to assess the firm’s innovation performance (Ahuja and Katila 2001). Therefore, we utilized the number of patent applications (the sum of the number of invention patents, utility models, and design patent applications) to represent the firm’s innovation output performance in that year.

3.2.2. Independent Variables

The independent variable is CSR risk. Previous studies adopted the CSR concerns scores provided by the KLD (Kinder, Lydenberg, Domini Research & Analytics) agency, which could assign binary values to each CSI item (Boukattaya and Abdelwahed 2021; Price and Sun 2017). Such treatments are unsatisfactory because they may not reflect the severity of each index. Given the lack of a database dedicated to measuring CSR performance in China, we referenced and optimized the CSR risk evaluation index system by (Li and Bao 2017). We constructed a CSR risk evaluation index system containing 27 indicators from the six dimensions of responsible governance, human rights, environmental responsibility, proper operation, product responsibility, and community development (Luo et al. 2021). To distinguish the severity level of the risk and facilitate the measurement of indicators, we used 0, 0.5, and 1 as scores (Wan and Liu 2015), representing the absence of CSR risk or the existence of low CSR risk, moderate CSR risk, and severe CSR risk, respectively. Finally, after obtaining the risk coefficient value of each firm’s 27 indicators, they were weighted according to their weight and multiplied by 100. Finally, the overall risk coefficient value of the firm for the year was obtained.

3.2.3. Moderator Variables

Referring to the definition by Chen (2015), we defined a direct link as the firm’s social network. Direct link means a tie in which one or more directors/managers of a firm serve on the board of another firm in the same year (Chen 2015). Assuming that the two firms directly communicate with each other, and a network based on this direct link is referred to as the firm’s social network (Chen 2015). The general manager/CEO and other executives of Chinese-listed firms generally serve on the board of directors, and the director network also includes the decision making of executives (Chen 2015). This definition of network input at the individual level and then network output at the organizational level is the general approach to studying social networks (Jackson 2010; Larcker et al. 2013). Therefore, we conducted the director network to represent the social network between firms. The local level of the network included the betweenness centrality, closeness centrality, and structural holes. The betweenness centrality and closeness centrality were measured by adopting Freeman’s method (Freeman 1978), and structural holes were determined by Burt’s research method (Burt 1992). The overall level of the network included network density measured by the method of (Xie 2005). We sorted the directors and associations of 1593 A-share listed firms in China from 2010 to 2019. With the help of the software Pajek, we calculated the network variables of all directors for each year. Then, we averaged these data at the firm level to represent the firm’s social network.

3.2.4. Control Variables

We controlled a series of control variables to restrain the effect of a firm’s characteristics and governance on its performance. The firm’s age (Age) was measured by the logarithmic transformation of the number of years since its creation. Firms’ age is an influential factor affecting their performance since experience and accumulated knowledge increase with age. The sum of the shareholding ratio of the top 10 shareholders (Top10) represented the firm’s ownership structure. The greater it was, the more concentrated the ownership. We also controlled leverage (Lev), measured as the debt-to-equity ratio. This ratio was calculated by dividing a firm’s total liabilities by its total assets. Board size (Broad) was defined as the total number of directors on a board. We measured board independence (Indep) by calculating the percentage of independent directors on the board of directors (number of independent directors/total number of directors) because board independence might influence firm performance (Boukattaya and Abdelwahed 2021). The correlation between stock and market return rates (MY) was high in China (Li and Guan 2017). The one-year market return rate of the Shanghai/Shenzhen Composite Index of China was used to represent the market return rate. The firm’s property rights (Property), which affected firm performance to a certain extent, were divided into four categories according to the nature of the firm’s actual controller. One represented the state-owned group, two represented the private group, three represented the foreign-funded group, and four represented other groups. We also controlled timing and industry (Year/Industry) effects, where the industry classification standard referred to the classification standard of the China Securities Regulatory Commission (CSRC) in 2012 (Li and Guan 2017).

3.3. Empirical Models

As illustrated in (1)–(8), we constructed regression models 1, 2, 3, 4, 5, 6, 7, and 8 to examine the impact of CSR risk on financial performance, capital performance, innovation performance, along with the moderating effect of networks:
Model   1 :   N P i t = α 0 + α 1 C S I R i t + α j C o n t r o l j i t + ε i t
Model   2 :   S t o c k i t = α 0 + α 1 C S I R i t + α j C o n t r o l j i t + ε i t
Model   3 :   I n n o i t = α 0 + α 1 C S I R i t + α j C o n t r o l j i t + ε i t
Model   4 :   N P i t = δ 0 + δ 1 C S I R i t × S H i t + δ j C o n t r o l j i t + ε i t
Model   5 :   S t o c k i t = γ 0 + γ 1 C S I R i t × C l o s e i t + γ j C o n t r o l j i t + ε i t
Model   6 :   I n n o i t = β 0 + β 1 C S I R i t × M e d i t + β j C o n t r o l j i t + ε i t
Model   7 :   N P i t = ϵ 0 + ϵ 1 C S I R i t × D e n s i t y i t + ϵ j C o n t r o l j i t + ε i t
Model   8 :   I n n o i t = ϵ 0 + ϵ 1 C S I R i t × D e n s i t y i t + ϵ j C o n t r o l j i t + ε i t
where i represents the firm, t the year, j the jth control variable, ε i t the random error term, Control the control variable, C S I R CSR risk, N P financial performance, S t o c k capital performance, I n n o innovation performance, M e d betweenness centrality, C l o s e closeness centrality, S H structural holes, and D e n s i t y network density.

4. Results

4.1. Preliminary Analysis

Table 1 primarily shows the descriptive statistics of the main variables, including the mean, standard deviation, maximum value, and minimum value. Table 1 shows that different firms’ financial performance and innovation levels are quite different. The average CSIR is 15.27, indicating that the overall CSR risk of the sample firms is relatively low. The maximum value of CSR risk is 58.11, and the minimum value is 0, indicating that the CSR risk level varies considerably. For network variables, the social network density among listed firms in China is generally low, the network centrality is low, and the richness of structural holes varies significantly among different firms. Table 2 presents the correlation coefficients between all variables. The correlation coefficients of all variables in this study are low, and there is no significant multicollinearity effect.

4.2. Hypothesis Testing

We conducted a random-effects GLS regression to verify the impact of CSR risk on firm performance and the moderating role of networks. We standardized all the data before panel analysis. Moreover, we centralized relevant variables when calculating interaction items.

4.2.1. CSR Risk, Social Networks, and Financial Performance

Table 3 reports the impact of CSR risk on financial performance and the interaction of structural holes and network density on the relationship between the two. H1 predicts that CSR risk may harm financial performance. For the CSR risk coefficient in Model 1a, as shown in Table 3 (β = −0.020, p < 0.01), H1 established that the coefficient was significantly negative. This result is consistent with existing research (Boukattaya and Abdelwahed 2021; Price and Sun 2017). H4 predicts that firms with structural holes may utilize their information and control capabilities to counteract risk propagation and take advantage of their location to integrate resources and compensate for crucial resources lost due to high CSR risk (Burt 1992). Structural holes may inhibit the adverse effect of CSR risk on financial performance. In Table 3, the interaction term coefficient of CSR risk and structural holes in Model 2a (β = 0.009, p < 0.05) is significantly positive, which accords with our earlier inferences of H4. H7 predicts that network density may attenuate the negative impact of CSR risk on financial performance. Network density could improve the efficiency of information dissemination in the network and help to form a unified code of conduct (Oliver 1991). Firms with a high-density network may actively prevent CSR risk, thereby reducing the negative impact of CSR risk on financial performance. In Table 3, the interaction term coefficient of CSR risk and network density in Model 3a (β = 0.023, p < 0.01) is significantly positive, and the results further support H7. According to the whole-model regression results shown in Model 4a in Table 3, these results are in line with those previous hypotheses, including H1, H4, and H7.

4.2.2. CSR Risk, Social Networks, and Capital Performance

Table 4 shows the impact of CSR risk on capital performance and the moderating effect of closeness centrality on the relationship between the two. H2 predicts that CSR risk has a positive effect on capital performance. Investors in the capital market are affected by information asymmetry when investing in high-risk firms and demand higher risk premiums (Merton 1974). Such high-CSR risk firms have to increase their stock returns to attract more investors and compensate investors for missed diversification opportunities (Merton 1987), thus heightening their capital performance to a certain extent. The independent variable CSR risk coefficient in Model 1b (β = 0.014, p < 0.1) in Table 4 is significantly positive, supporting H2. The closeness centrality, which represents the speed of information dissemination, may accelerate the transmission of CSR risk. Firms with closeness centrality are not easily constrained and controlled, thus amplifying the positive impact of CSR risk on capital performance. As shown in Table 4, the interaction term coefficient of CSR risk and closeness centrality in Model 2b (β = 0.027, p < 0.01) is significantly positive, supporting H5.

4.2.3. CSR Risk, Social Networks, and Innovation Performance

Table 5 reports the impact of CSR risk on innovation performance and the interaction of betweenness centrality and network density on the relationship between the two. H3 predicts that CSR risk may harm innovation performance. The CSR risk coefficient in model 1c (β = −0.013, p < 0.05) of Table 5 is significantly negative, as validated by H3. H6 predicts that firms with a high betweenness centrality may effectively attenuate CSR risk through the advantages of betweenness and centrality. Firms with high betweenness centrality hinge on the information and resources associated with innovation in the network, thereby inhibiting the adverse effects of CSR risk on innovation performance due to a lack of stakeholders’ critical resources (Bagul and Mukherjee 2018). As shown in Table 5, Model 2c shows that the interaction coefficient between CSR risk and betweenness centrality (β = 0.008, p < 0.05) is significantly positive, as established by H6. H8 predicts that high-density networks may weaken the negative impact of CSR risk on innovation performance. High-density networks force firms to comply with generally accepted norms and guidelines, consciously prevent CSR risk and simultaneously increase the channels for firms to obtain resources (Oliver 1991), which weakens the negative impact of CSR risk on innovation performance to a certain extent. As shown in Table 5, Model 3c demonstrates that the interaction term coefficient of CSR risk and network density (β = 0.009, p < 0.05) is significantly positive, as supported by H8.

4.3. Robustness Checks

We performed further analysis by changing the measurement method of independent variables to assess the robustness of our findings. When scoring 27 indicators of CSR risk, the scoring standards were 0, 0.5, and 1 to represent the severity of the risk, respectively. The number of indicators with a score other than 0 was used to measure CSR risk at the firm level. To differentiate the severity of risk, the number of indicators with a score of 1 was multiplied by 2, meaning that the severity of risk for indicators with a score of 1 was twice the severity of risk for indicators with a score of 0.5. The formula reads as follows:
The firm’s CSR risk value in the year = the number of indicators with a score of 0.5 + 2 * the number of indicators with a score of 1.
We adopted the number of CSR risk indicators at the firm level to replace the original CSR risk value, and the proposed hypothesis was re-tested. The results show that the conclusions are still robust, even with different measurement methods.
In addition, this study utilized CSR risk in period t − 1 to regress firm performance in period t to address the endogeneity problem. Results indicated that the current CSR risk has a significant negative impact on financial performance and innovation performance, validating that the reverse causal relationship between CSR risk and firm performance in finance and innovation does not hold. The current CSR risk does not significantly impact the capital performance over a lag period, proving that the impact of CSR risk on capital performance is only temporary and cannot be sustained. There is no reverse causality issue between CSR risk and capital performance. Most studies on the stock market adopted cross-sectional data or panel data for the current period (Becchetti et al. 2018; Hong and Kacperczyk 2009; Kim et al. 2014). CSR risk factors may affect stock returns (Becchetti et al. 2018; Hong and Kacperczyk 2009), but stock volatility may not affect a firm’s CSR risk.

5. Discussions

This study primarily investigates the relationship between CSR risk and firm performance through the theoretical lenses of resource dependence theory, information asymmetry theory, and the social network perspective. Our results reveal several important theoretical and practical implications.

5.1. Theoretical Contributions

First, drawing on resource dependence theory and information asymmetry theory, this study deepens our understanding of the advantages and disadvantages of CSR risk on firm performance and expands the relevant research on CSI. CSR risk sends a highly negative message to stakeholders and jeopardizes their interests, losing the critical resources that firms obtain from stakeholders, thereby hurting financial performance and innovation performance (Wan and Liu 2015). Coupled with the asymmetry of stakeholders’ cognitive processing of different CSR information (Kanouse and Hanson 1987), people respond more vigorously and consistently to the firms’ negative CSR news than to their positive news (Boukattaya and Abdelwahed 2021; Price and Sun 2017; Sun and Ding 2021). This CSI practice may be widely disseminated among stakeholders and affects analyst recommendations, as well as investors’ and consumers’ perceptions, lowering firm performance and value (Folkes and Kamins 1999; Luo et al. 2010).
However, this study discovered that the impact of CSR risk on firm performance is not all negative. CSR risk could also heighten a firm’s capital performance, leading to higher stock returns. On the one hand, in the stock market, investors may carefully evaluate the impact of CSI on its future earnings. Adverse CSR events may positively impact firm value if they have only a limited negative impact, or help cut costs (Groening and Kanuri 2013). On the other hand, such “sin” firms with higher CSR risk face more severe information asymmetry. Investors pay less attention to the “sin” firms that may be more likely to face more significant litigation risks. These “sin” firms may have to offer investors higher returns on their stocks to compensate for their lack of risk-sharing capacity (Hong and Kacperczyk 2009). Higher returns of irresponsible firms compensate investors for missed diversification opportunities (Merton 1987). Firms with poor CSR performance face higher stakeholder risk, so in equilibrium, firms must pay a premium to investors to compensate for their higher risk exposure (Becchetti et al. 2018). Ultimately, firms with a higher CSR risk have higher stock returns and higher capital performance. However, the positive impact of CSR risk on capital performance is not sustainable and only lasts for a short time. It may increase a firm’s equity financing cost in the long run (El Ghoul et al. 2011; Hong and Kacperczyk 2009), which is not conducive to firm performance and long-term growth. We conducted a lag period test on CSR risk and firm performance to further analyze this. We found that CSR risk in this period still harmed the lag period’s financial performance and innovation performance, but had no significant positive effect on its capital performance. Therefore, CSR risk has more detrimental effects than beneficial effects on firm performance in the long run.
The second theoretical contribution is that both the advantages and disadvantages of CSR risk on firm performance may be more pronounced under the condition of different network characteristics. Drawing on the social network literature, our study demonstrates that a firm’s network may serve as another mechanism that influences the linkage between CSR risk and firm performance. Different network locations and overall networks affect the relationship between CSR risk and firm performance. Structural holes and network density could attenuate the negative impact of CSR risk on financial performance. Closeness centrality could enhance the positive impact of CSR risk on capital performance. Betweenness centrality and network density could counteract the negative impact of CSR risk on innovation performance.
When a firm with a high closeness centrality suffers a high CSR risk, other participants in the social network cannot restrain it, further heightening CSR risk. The speed of information dissemination in a high closeness centrality network is faster, and the negative information about a firm is more widely spread, resulting in higher CSR risk. Under this condition, the firm may have to bear a higher risk premium, attributing to a further increase in capital performance. A firm with a structural hole could monopolize most of the network’s resources and information and block the communication channels between other firms (Huang 2019). Firms could take advantage of resources and information brought by structural holes to effectively restrain the adverse impact of CSR risk on financial performance. Betweenness centrality could affect groups by controlling or misinterpreting the transfer of information (Freeman 1978), where firms could control the flow of adverse information, reducing the negative impact of CSR risk on innovation performance. Firms with a higher betweenness centrality are often more motivated to engage in CSR to gain support from other firms in the network. It is more likely to form long-term and stable cooperation and trust relationships with other firms in the network, conducive to accumulating and improving innovation resources, such as knowledge, information, and technology (Xu and Xu 2015). Thereby, it could inhibit the adverse impact of CSR risk on innovation performance. High-density networks may force the firm to comply with accepted behavioral norms and market norms due to the cohesion of the network (Xie 2005). Firms in high-density networks must strictly regulate themselves and actively fulfill their social responsibilities. High-density networks may also bring more opportunities for resource sharing and information exchange, buffering the loss of crucial resources from stakeholders due to CSR risk, thereby attenuating the negative impact of CSR risk on firm performance.
Additionally, we examined Chinese-listed firms to add developing countries’ insights to CSR and CSI practices, as well as the relationship between CSR risk, social network, and firm performance to the previous literature, which mainly focused on developed countries. This contributes to the growing body of knowledge regarding CSR risk, social networks, and firm performance in emerging markets and developing countries.

5.2. Managerial Implications

First, the firm’s managers must realize the adverse impact of CSR risk, which damages a firm’s reputation and impairs its performance. Managers should understand the longer-lasting negative impact of CSI and be incredibly attentive to potential CSI incidents, initiating CSR projects to weaken the impact and the length of time that CSI damages firm performance (Price and Sun 2017). Managers should act responsibly through CSR and avoid engaging in CSI to attenuate the adverse impact of CSR risk on firm performance (Lin-Hi and Müller 2013). In addition, managers should build a broad mindset that incorporates all stakeholders because the development of firms depends on the critical resources in the hands of stakeholders (Hill and Jones 1992; Price and Sun 2017). Each stakeholder group could potentially affect firms and their survival. Firms must fulfill their responsibilities to stakeholder groups and actively disclose relevant information to mitigate information asymmetry. By doing so, firms can gain the trust of stakeholders, which could provide source group support to obtain the necessary information and resources to improve competitive advantages.
Second, firms with higher CSR risks have higher stock returns in the short term, but this positive impact is not sustainable for firms and may also increase the cost of debt financing to some degree (El Ghoul et al. 2011; Hong and Kacperczyk 2009). In the long run, which may be detrimental to business operations and development. The disadvantages of CSR risks far outweigh the benefits, requiring firms to fulfill their social responsibilities and refrain from participating in CSI incidents to lower CSR risks. For investors, if they choose to invest in such firms because of their higher stock returns in the short term, they may suffer higher risks. Unlike foreign capital markets, where institutional investors dominate, China’s stock market, with limited judgment and lack of access to information, is dominated by retail investors. Chinese investors should rationally invest rather than relying solely on stock returns as a measure of investment. They should comprehensively consider the benefits brought by CSR to society and effectively curb the trend of hype and blind obedience, ultimately promoting the healthy development of China’s stock market.
Third, firms should highlight the roles of social networks and learn to rationally use resources and information in the network to avoid risks and improve firm performance. It may be essential for firms to form a strong “CSR alliance” with their network partners (Liu et al. 2021b). The entire network adheres to the same CSR values and works toward a cohesive CSR objective, ultimately promoting the overall performance of firms in the entire network.

6. Conclusions

This study explored the relationship between CSR risk, social networks, and firm performance in the Chinese context based on resource dependence theory and information asymmetry theory. This study highlighted the negative impact of CSR risk and the role of the network in it. CSI behavior or high CSR risk behavior may attenuate firm performance and value and damage stakeholders’ rights and interests, which is not conducive to firm governance and development. Firms should pay attention to potential CSI incidents, leverage social networks to fulfill their social responsibilities and weaken the harm caused by CSR risks. The Chinese government and relevant departments should complete the corresponding CSR laws and regulations, strengthen the supervision of CSI behavior, and build a CSR risk database. It is also helpful for stakeholders and NGOs to select firms as partners. They can support or collaborate with firms with exemplary CSR performance or low CSR risk and oversee CSI behavior and high CSR risk behavior.
This study is subject to five limitations that may influence the direction of future research. First, those scoring according to the CSR risk index system tend to be subjective. Alternatively, advanced methods need to be explored further to improve the objectivity and accuracy of CSR risk assessment in the future. Second, only the director network was examined to measure the firm’s social network, not comprehensively considering the perspectives of shareholders, suppliers, and customers. In the future, the firm’s social network should be comprehensively measured from various perspectives. Third, when calculating the network data, we only calculated social network connections among Chinese A-share listed firms, ignoring the connections of listed and non-listed firms. Research in the future could incorporate second-hand data and questionnaires with further investigation, making the results of this study more universal. Fourth, CSR risk was measured from a holistic perspective to delineate its overall effect on firm performance. We did not directly examine the effects of CSR risk on firm performance from different dimensions, such as internal governance, employee responsibility, environmental responsibility, product responsibility, community responsibility, and other dimensions. A multidimensional approach is advised to enrich our knowledge of CSR risk and firm performance connections. Finally, this study did not solve all endogeneity problems. Future research could find suitable instrumental variables for CSR risk and combine the instrumental variable method with the two-stage least square method to further verify the robustness of the results in this study.

Author Contributions

Conceptualization, J.L.; methodology, J.L.; software, M.B.; validation, M.B.; formal analysis, M.B.; data curation, M.B.; writing—original draft preparation, M.B.; writing—review and editing, M.B. and D.J. All authors have read and agreed to the published version of the manuscript.

Funding

This research was funded by the National Key Research and Development Project of China (grant number 2019YFB1600400); the National Natural Science Foundation of China (grant number 71831002); the Fundamental Research Funds for the Central Universities of China (grant number 3132022288 and 3132022266); the Later General Projects of the National Social Science Foundation of China (grant number 21FGLB044).

Institutional Review Board Statement

Not applicable.

Informed Consent Statement

Not applicable.

Data Availability Statement

Not applicable.

Conflicts of Interest

The authors declare no conflict of interest.

References

  1. Afuah, Allan. 2013. Are Network Effects Really All about Size? The Role of Structure and Conduct. Strategic Management Journal 34: 257–73. [Google Scholar] [CrossRef] [Green Version]
  2. Ahuja, Gautam, and Riitta Katila. 2001. Technological Acquisitions and the Innovation Performance of Acquiring Firms: A Longitudinal Study. Strategic Management Journal 22: 197–220. [Google Scholar] [CrossRef]
  3. Bagul, Avinash, and Indrajit Mukherjee. 2018. An Insight into Centralised Sourcing Strategy for Enhancing Performance and Sustainability of Multi-Tier Supply Network. International Journal of Intelligent Enterprise 5: 18–49. [Google Scholar] [CrossRef]
  4. Becchetti, Leonardo, Ciciretti Rocco, and Dalò Ambrogio. 2018. Fishing the Corporate Social Responsibility Risk Factors. Journal of Financial Stability 37: 25–48. [Google Scholar] [CrossRef]
  5. Becchetti, Leonardo, Rocco Ciciretti, Iftekhar Hasan, and Nada Kobeissi. 2012. Corporate Social Responsibility and Shareholder’s Value. Journal of Business Research 65: 1628–35. [Google Scholar] [CrossRef]
  6. Blowfield, Michael, and Jedrzej George Frynas. 2005. Editorial Setting New Agendas: Critical Perspectives on Corporate Social Responsibility in the Developing World. International Affairs 81: 499–513. [Google Scholar] [CrossRef]
  7. Boubaker, Sabri, Alexis Cellier, Riadh Manita, and Asif Saeed. 2020. Does Corporate Social Responsibility Reduce Financial Distress Risk? Economic Modelling 91: 835–51. [Google Scholar] [CrossRef]
  8. Boubaker, Sabri, Zhenya Liu, and Yaosong Zhan. 2022. Customer Relationships, Corporate Social Responsibility, and Stock Price Reaction: Lessons from China During Health Crisis Times. Finance Research Letters, 102699. [Google Scholar] [CrossRef]
  9. Boukattaya, Sonia, and Omri Abdelwahed. 2021. Corporate Social Practices and Firm Financial Performance: Empirical Evidence from France. International Journal of Financial Studies 9: 54. [Google Scholar] [CrossRef]
  10. Burt, Ronald S. 1992. Structural Holes: The Social Structure of Competition. Cambridge: Harvard University Press. [Google Scholar]
  11. Chen, Yunsen. 2014. Directors’ Social Networks and Firm Efficiency: A Structural Embeddedness Perspective. China Journal of Accounting Studies 2: 53–73. [Google Scholar] [CrossRef]
  12. Chen, Yunsen. 2015. Social Network and Trade Credit: Evidence Based on Structural Holes. China Accounting and Finance Review 17: 1–71. [Google Scholar]
  13. Cheng, Beiting, Ioannis Ioannou, and George Serafeim. 2014. Corporate Social Responsibility and Access to Finance. Strategic Management Journal 35: 1–23. [Google Scholar] [CrossRef]
  14. Choi, Jaepil, and Heli Wang. 2009. Stakeholder Relations and the Persistence of Corporate Financial Performance. Strategic Management Journal 30: 895–907. [Google Scholar] [CrossRef]
  15. El Ghoul, Sadok, Omrane Guedhami, Chuck C. Y. Kwok, and Dev R. Mishra. 2011. Does Corporate Social Responsibility Affect the Cost of Capital? Journal of Banking & Finance 35: 2388–406. [Google Scholar]
  16. Fatemi, Ali, Martin Glaum, and Stefanie Kaiser. 2018. ESG Performance and Firm Value: The Moderating Role of Disclosure. Global Finance Journal 38: 45–64. [Google Scholar] [CrossRef]
  17. Folkes, Valerie S, and Michael A. Kamins. 1999. Effects of Information About Firms’ Ethical and Unethical Actions on Consumers’ Attitudes. Journal of Consumer Psychology 8: 243–59. [Google Scholar] [CrossRef]
  18. Freeman, Linton C. 1978. Centrality in Social Networks Conceptual Clarification. Social Networks 1: 215–39. [Google Scholar] [CrossRef] [Green Version]
  19. Granovetter, Mark. 1985. Economic Action and Social Structure: The Problem of Embeddedness. American Journal of Sociology 91: 481–510. [Google Scholar] [CrossRef]
  20. Gregory-Smith, Ian, Brian G. M. Main, and Charles A. O’Reilly III. 2014. Appointments, Pay and Performance in Uk Boardrooms by Gender. Economic Journal 124: F109–F128. [Google Scholar] [CrossRef] [Green Version]
  21. Groening, Christopher, and Vamsi Krishna Kanuri. 2013. Investor Reaction to Positive and Negative Corporate Social Events. Journal of Business Research 66: 1852–60. [Google Scholar] [CrossRef]
  22. Hasan, Mostafa Monzur, and Ahsan Habib. 2017. Corporate Life Cycle, Organizational Financial Resources and Corporate Social Responsibility. Journal of Contemporary Accounting & Economics 13: 20–36. [Google Scholar]
  23. Hill, Charles W. L., and Thomas M. Jones. 1992. Stakeholder-Agency Theory. Journal of Management Studies 29: 131–54. [Google Scholar] [CrossRef]
  24. Hong, Harrison, and Marcin Kacperczyk. 2009. The Price of Sin: The Effects of Social Norms on Markets. Journal of Financial Economics 93: 15–36. [Google Scholar] [CrossRef]
  25. Huang, Jiawen. 2019. Is Social Network of Enterprise Always Useful: A Literature Review. Science Research Management 40: 57–64. (In Chinese). [Google Scholar]
  26. Hunjra, Ahmed Imran, Sabri Boubaker, Murugesh Arunachalam, and Asad Mehmood. 2021. How Does CSR Mediate the Relationship between Culture, Religiosity and Firm Performance? Finance Research Letters 39: 101587. [Google Scholar] [CrossRef]
  27. Jackson, Matthew O. 2010. Social and Economic Networks. Princeton: Princeton University Press. [Google Scholar]
  28. Jo, Hoje, and Haejung Na. 2012. Does Csr Reduce Firm Risk? Evidence from Controversial Industry Sectors. Journal of Business Ethics 110: 441–56. [Google Scholar] [CrossRef]
  29. Kanouse, David E., and Reid L. Hanson Jr. 1987. Negativity in Evaluations. In Attribution: Perceiving the Causes of Behavior. Mahwah: Lawrence Erlbaum Associates, Inc., pp. 47–62. [Google Scholar]
  30. Kim, Yongtae, Haidan Li, and Siqi Li. 2014. Corporate Social Responsibility and Stock Price Crash Risk. Journal of Banking & Finance 43: 1–13. [Google Scholar]
  31. Krasnikov, Alexander, Saurabh Mishra, and David Orozco. 2009. Evaluating the Financial Impact of Branding Using Trademarks: A Framework and Empirical Evidence. Journal of Marketing 73: 154–66. [Google Scholar] [CrossRef] [Green Version]
  32. Krüger, Philipp. 2015. Corporate Goodness and Shareholder Wealth. Journal of Financial Economics 115: 304–29. [Google Scholar] [CrossRef]
  33. Larcker, David, Eric So, and Charles Wang. 2013. Boardroom Centrality and Firm Performance. Journal of Accounting and Economics 55: 2–3. [Google Scholar] [CrossRef] [Green Version]
  34. Li, Jinglin, and Zhen Yang. 2019. Board Gender Diversity, Corporate Social Responsibility and Technological Innovation: An Empirical Study Based on Listed Firms in China. Science of Science and Management of S.&T. 40: 34–51. (In Chinese). [Google Scholar]
  35. Li, Ming, and Lili Bao. 2017. Construction and Application of Corporate Social Responsibility Risk Evaluation System. Finance and Accounting Monthly, 61–66. (In Chinese). [Google Scholar]
  36. Li, Ming, and Wei Guan. 2017. The Intertemporal Impact of Corporate Social Responsibility Risk and Corporate Performance: Based on the Analysis of 171 Listed Manufacturing Companies. Enterprise Economy 36: 27–34. (In Chinese). [Google Scholar]
  37. Li, Qian, Jie Xiong, and Han Huang. 2018. An Empirical Research of Corporate Social Irresponsibility on Financial Performance. Chinese Journal of Management 15: 255–61. (In Chinese). [Google Scholar]
  38. Li, Wan, Rajaram Veliyath, and Justin Tan. 2013. Network Characteristics and Firm Performance: An Examination of the Relationships in the Context of a Cluster. Journal of Small Business Management 51: 1–22. [Google Scholar] [CrossRef]
  39. Lin-Hi, Nick, and Karsten Müller. 2013. The CSR Bottom Line: Preventing Corporate Social Irresponsibility. Journal of Business Research 66: 1928–36. [Google Scholar] [CrossRef]
  40. Liu, Bai, Tao Ju, and Simon S. S. Gao. 2021a. The Combined Effects of Innovation and Corporate Social Responsibility on Firm Financial Risk. Journal of International Financial Management & Accounting 32: 283–310. [Google Scholar]
  41. Liu, Jihan, and Jianqiong Wang. 2016. Similar Behavior of Corporate Social Responsibility Performance in the Social Network. Chinese Journal of Management Science 24: 115–23. (In Chinese). [Google Scholar] [CrossRef]
  42. Liu, Yi, Xingping Jia, Xingzhi Jia, and Xenophon Koufteros. 2021b. CSR Orientation Incongruence and Supply Chain Relationship Performance—A Network Perspective. Journal of Operations Management 67: 237–60. [Google Scholar] [CrossRef]
  43. Lu, Yingjun, and Indra Abeysekera. 2021. Do Investors and Analysts Value Strategic Corporate Social Responsibility Disclosures? Evidence from China. Journal of International Financial Management & Accounting 32: 147–81. [Google Scholar]
  44. Luo, Jiaqi, Mingxiao Bi, and Haibo Kuang. 2021. Design of Evaluation Scheme for Social Responsibility of China’s Transportation Enterprises from the Perspective of Green Supply Chain Management. Sustainability 13: 3390. [Google Scholar] [CrossRef]
  45. Luo, Xueming, Christian Homburg, and Jan Wieseke. 2010. Customer Satisfaction, Analyst Stock Recommendations, and Firm Value. Journal of Marketing Research 47: 1041–58. [Google Scholar] [CrossRef]
  46. Martin, Geoffrey, Remzi Gözübüyük, and Manuel Becerra. 2015. Interlocks and Firm Performance: The Role of Uncertainty in the Directorate Interlock-Performance Relationship. Strategic Management Journal 36: 235–53. [Google Scholar] [CrossRef]
  47. Merton, Robert C. 1974. On the Pricing of Corporate Debt: The Risk Structure of Interest Rates. Journal of Finance 29: 449–70. [Google Scholar]
  48. Merton, Robert C. 1987. A Simple Model of Capital Market Equilibrium with Incomplete Information. Journal of Finance 42: 483–509. [Google Scholar] [CrossRef]
  49. Nahapiet, Janine, and Sumantra Ghoshal. 1998. Social Capital, Intellectual Capital, and the Organizational Advantage. Academy of Management Review 23: 242–66. [Google Scholar] [CrossRef]
  50. Oliver, Christine. 1991. Strategic Responses to Institutional Processes. Academy of Management Review 16: 145–79. [Google Scholar] [CrossRef]
  51. Pan, Xin, Xuanjin Chen, and Lutao Ning. 2018. The Roles of Macro and Micro Institutions in Corporate Social Responsibility (CSR): Evidence from Listed Firms in China. Management Decision 56: 955–71. [Google Scholar] [CrossRef]
  52. Pfeffer, Jeffrey, and Gerald R. Salancik. 1978. The External Control of Organizations: A Resource Dependence Perspective. Bloomington: Stanford University Press. [Google Scholar]
  53. Price, Joseph M., and Wenbin Sun. 2017. Doing Good and Doing Bad: The Impact of Corporate Social Responsibility and Irresponsibility on Firm Performance. Journal of Business Research 80: 82–97. [Google Scholar] [CrossRef]
  54. Sun, Wenbin, and Zhihua Ding. 2021. Is Doing Bad Always Punished? A Moderated Longitudinal Analysis on Corporate Social Irresponsibility and Firm Value. Business & Society 60: 1811–48. [Google Scholar]
  55. Tichy, Noel, Michael Tushman, and Charles Fombrun. 1979. Social Network Analysis for Organizations. Academy of Management Review 4: 507–19. [Google Scholar] [CrossRef]
  56. Vilanova, Marc, Josep Maria Lozano, and Daniel Arenas. 2009. Exploring the Nature of the Relationship between CSR and Competitiveness. Journal of business Ethics 87: 57–69. [Google Scholar] [CrossRef]
  57. Wan, Shouyi, and Feifei Liu. 2015. Study on the Causes and Economic Consequences of Corporate Social Irresponsibility. Friends of Accounting, 15–25. (In Chinese). [Google Scholar]
  58. Wang, Zhihong, and Joseph Sarkis. 2017. Corporate Social Responsibility Governance, Outcomes, and Financial Performance. Journal of Cleaner Production 162: 1607–16. [Google Scholar] [CrossRef]
  59. Xie, Deren, and Yunsen Chen. 2012. Board Network: Definition, Characteristics and Measurement. Accounting Research 95: 44–51. (In Chinese). [Google Scholar]
  60. Xie, Hongming. 2005. The Impacts of Network Structural Properties on the Dynamic Competition Actions. Science Research Management, 104–12. (In Chinese). [Google Scholar]
  61. Xu, Jianzhong, and Yingying Xu. 2015. Enterprise’s Collaborative Competence, Network Location and Technology Innovation Performance—Empirical Analysis of Manufacturing Enterprises in the Bohai Coastal Region. Management Review 27: 114–25. (In Chinese). [Google Scholar]
Figure 1. The conceptual framework. The conceptual framework clearly articulates the hypothesis of the relationship between CSR risk and firm performance and the moderating effect of different network variables on their relationship.
Ijfs 10 00040 g001
Table 1. Descriptive statistics.
VariablesMean StandardDeviationMinimumMaximum
NP (CNY 100 million)6.6840.8−4671510
Stock0.09480.514−0.87811.85
Inno51.19144.701082
CSIR15.279.455058.11
Med0.0005560.00056000.00282
Close0.1140.05500.00005670.173
SH0.2860.08690.1410.570
Density0.0004610.00007670.0003600.000552
Age2.8530.3430.6933.714
Top100.5410.1590.01320.986
Lev0.5310.831−0.19563.97
Broad8.8771.805320
The dependent variables are the firm’s financial performance (NP), capital performance (Stock), and innovation performance (Inno). CSIR is the independent variable. Med, Close, SH, and Density are network moderator variables. NP: net profit, Stock: the firm’s annual individual stock return considering cash dividend reinvestment, Inno: the sum number of the firm’s patent applications, CSIR: CSR risk, Med: betweenness centrality, Close: closeness centrality, SH: structural holes, Density: network density, Age: the firm’s age, Top10: the sum of the shareholding ratio of the top 10 shareholders, Lev: the debt-to-equity ratio, Broad: board size, Indep: the proportion of independent directors on the board, MY: the market return rate of China.
Table 2. Correlation matrix.
VariablesNPStockInnoCSIRMedCloseSHDensityAgeTop10PropertyLevBroadIndepMYIndustry
NP1
Stock0.016 **1
Inno0.383 ***−0.008001
CSIR−0.123 ***−0.053 ***−0.173 ***1
Med0.032 ***0.015 *0.062 ***−0.095 ***1
Close0.017 **0.132 ***0.026 ***−0.093 ***0.350 ***1
SH−0.058 ***−0.032 ***−0.099 ***0.145 ***−0.536 ***−0.427 ***1
Density−0.025 ***0.099 ***−0.033 ***0.084 ***0.063 ***0.215 ***−0.01101
Age−0.035 ***−0.016 *−0.056 ***−0.014 *−0.060 ***−0.033 ***−0.068 ***−0.229 ***1
Top100.192 ***0.024 ***0.126 ***−0.162 ***0.075 ***0.048 ***−0.126 ***−0.037 ***−0.179 ***1
Property−0.058 ***0.042 ***−0.042 ***0.072 ***−0.024 ***−0.047 ***0.105 ***−0.022 ***−0.021 ***−0.108 ***1
Lev−0.013 *−0.018 **0.009000.081 ***−0.0100−0.00800−0.0050000.039 ***−0.035 ***0.001001
Broad0.083 ***−0.018 **0.082 ***−0.073 ***0.062 ***0.103 ***−0.468 ***0.040 ***−0.030 ***0.124 ***−0.173 ***0.007001
Indep0.065 ***00.080 ***−0.036 ***0.046 ***−0.002000.133 ***−0.028 ***−0.023 ***0.002000.038 ***0.00500−0.407 ***1
MY−0.015 *0.521 ***−0.026 ***−0.149 ***−0.002000.116 ***−0.072 ***0.110 ***0.058 ***−0.018 **0.025 ***−0.00300−0.031 ***0.01101
Industry−0.046 ***0.023 ***−0.083 ***0.070 ***0.059 ***0.043 ***−0.042 ***00.114 ***0.007000.029 ***0.025 ***−0.013 *0.006000.002001
The dependent variables are the firm’s financial performance (NP), capital performance (Stock), and innovation performance (Inno). CSIR is the independent variable. Med, Close, SH, and Density are network moderator variables. NP: net profit, Stock: the firm’s annual individual stock return considering cash dividend reinvestment, Inno: the sum number of the firm’s patent applications, CSIR: CSR risk, Med: betweenness centrality, Close: closeness centrality, SH: structural holes, Density: network density, Age: firm’s age, Top10: the sum of the shareholding ratio of the top 10 shareholders, Lev: the debt-to-equity ratio; Broad: board size, Indep: the proportion of independent directors on the board, MY: the market return rate of China, Property: the firm’s property rights, Industry: reference to the classification standard of the CSRC in 2012. *, **, *** represent the significance level of 10%, 5%, and 1%, respectively.
Table 3. CSR risk, social network, and financial performance.
Variables0a1a2a3a4a
NPNPNPNPNP
CSIR −0.020 ***−0.021 ***−0.023 ***−0.023 ***
(0.006)(0.006)(0.006)(0.006)
CSIR*SH 0.009 ** 0.009 **
(0.004) (0.004)
CSIR*Density 0.023 ***0.023 ***
(0.004)(0.004)
SH0.0010.0010.000 −0.000
(0.005)(0.005)(0.005) (0.005)
Density0.1260.089 0.0460.054
(0.104)(0.104) (0.104)(0.104)
Age0.040 ***0.040 ***0.040 ***0.037 **0.037 **
(0.016)(0.016)(0.016)(0.015)(0.015)
Top100.063 ***0.063 ***0.063 ***0.065 ***0.065 ***
(0.007)(0.007)(0.007)(0.007)(0.007)
Lev−0.013 ***−0.013 ***−0.013 ***−0.012 ***−0.012 ***
(0.004)(0.004)(0.004)(0.004)(0.004)
Broad0.036 ***0.035 ***0.035 ***0.033 ***0.034 ***
(0.008)(0.008)(0.008)(0.008)(0.008)
Indep0.025 ***0.025 ***0.025 ***0.024 ***0.025 ***
(0.006)(0.006)(0.006)(0.006)(0.006)
MY0.0070.0070.0070.0080.008
(0.009)(0.009)(0.009)(0.009)(0.009)
Controls0.0550.022−0.099−0.024−0.018
(0.279)(0.278)(0.251)(0.278)(0.278)
N15,93015,93015,93015,93015,930
R20.19570.19910.19970.20060.2013
IndustryControlControlControlControlControl
YearControlControlControlControlControl
PropertyControlControlControlControlControl
The dependent variable for columns 0a–4a is a firm’s financial performance represented by net profit (NP). CSIR is the independent variable measured as CSR risk. SH measured as structural holes and Density measured as network density are both moderator variables. Age: the firm’s age, Top10: the sum of the shareholding ratio of the top 10 shareholders, Lev: the debt-to-equity ratio; Broad: board size, Indep: the proportion of independent directors on the board, MY: the market return rate of China, Property: the firm’s property rights, Industry/Year: generating dummy variables to control for industry/year effects. **, *** represent the significance level of 5% and 1%, respectively.
Table 4. CSR risk, social network, and capital performance.
Variables0b1b2b
StockStockStock
CSIR 0.014 *0.014 **
(0.007)(0.007)
CSIR*Close 0.027 ***
(0.007)
Close−0.0000.001−0.004
(0.010)(0.010)(0.010)
Age0.027 ***0.026 ***0.026 ***
(0.008)(0.008)(0.008)
Top100.063 ***0.064 ***0.064 ***
(0.007)(0.007)(0.007)
Lev−0.014 **−0.014 **−0.014 **
(0.006)(0.006)(0.006)
Broad−0.0010.0000.000
(0.008)(0.008)(0.008)
Indep−0.005−0.005−0.005
(0.007)(0.007)(0.007)
MY0.200 ***0.201 ***0.201 ***
(0.015)(0.015)(0.015)
Controls0.1250.1130.117
(0.084)(0.084)(0.084)
N15,93015,93015,930
R20.35240.35250.3532
IndustryControlControlControl
YearControlControlControl
PropertyControlControlControl
The dependent variable for columns 0b–2b is the firm’s capital performance measured as the firm’s annual individual stock return considering cash dividend reinvestment (Stock). CSIR is the independent variable measured as CSR risk. Close is the moderator variable, represented by closeness centrality. Age: the firm’s age, Top10: the sum of the shareholding ratio of the top 10 shareholders, Lev: the debt-to-equity ratio; Broad: board size, Indep: the proportion of independent directors on the board, MY: the market return rate of China, Property: the firm’s property rights, Industry/Year: generating dummy variables to control for industry/year effects. *, **, *** represent the significance level of 10%, 5%, and 1%, respectively.
Table 5. CSR risk, social network, and innovation performance.
Variables0c1c2c3c4c
InnoInnoInnoInnoInno
CSIR −0.013 **−0.012 **−0.013 **−0.013 **
(0.006)(0.006)(0.006)(0.006)
CSIR*Med 0.008 ** 0.008 *
(0.004) (0.004)
CSIR*Density 0.009 **0.009 **
(0.004)(0.004)
Med−0.006−0.006−0.006 −0.006
(0.005)(0.005)(0.005) (0.005)
Density1.035 ***1.017 *** 1.006 ***1.004 ***
(0.103)(0.104) (0.104)(0.104)
Age0.060 ***0.059 ***0.059 ***0.058 ***0.057 ***
(0.016)(0.015)(0.015)(0.016)(0.015)
Top100.036 ***0.036 ***0.036 ***0.036 ***0.037 ***
(0.007)(0.007)(0.007)(0.007)(0.007)
Lev0.0030.0030.0030.0040.004
(0.004)(0.004)(0.004)(0.004)(0.004)
Broad0.027 ***0.027 ***0.026 ***0.026 ***0.026 ***
(0.008)(0.008)(0.008)(0.008)(0.008)
Indep0.012 **0.012 **0.012 **0.012 *0.012 *
(0.006)(0.006)(0.006)(0.006)(0.006)
MY−0.008−0.008−0.008−0.008−0.007
(0.009)(0.009)(0.009)(0.009)(0.009)
Controls0.957 ***0.942 ***−0.3990.932 ***0.930 ***
(0.280)(0.278)(0.251)(0.278)(0.277)
N15,93015,93015,93015,93015,930
R20.1680.17130.17080.17230.1712
IndustryControlControlControlControlControl
YearControlControlControlControlControl
PropertyControlControlControlControlControl
The dependent variable for columns 0c–4c is the firm’s innovation performance measured as the sum number of the firm’s patent applications (Inno). CSIR is the independent variable measured as CSR risk. Med measured as betweenness centrality and Density measured as network density are moderator variables. Age: the firm’s age, Top10: the sum of the shareholding ratio of the top 10 shareholders, Lev: the debt-to-equity ratio; Broad: board size, Indep: the proportion of independent directors on the board, MY: the market return rate of China, Property: the firm’s property rights, Industry/Year: generating dummy variables to control for industry/year effects. *, **, *** represent the significance level of 10%, 5%, and 1%, respectively.
Publisher’s Note: MDPI stays neutral with regard to jurisdictional claims in published maps and institutional affiliations.

