Article

Visible Vowels as a Tool for the Study of Language Transfer

by
Wilbert Heeringa
1,* and
Hans Van de Velde
1,2,*
1
Fryske Akademy, 8911 DX Leeuwarden, The Netherlands
2
Utrecht University, 3584 CS Utrecht, The Netherlands
*
Authors to whom correspondence should be addressed.
Languages 2024, 9(2), 35; https://doi.org/10.3390/languages9020035
Submission received: 18 October 2023 / Revised: 8 December 2023 / Accepted: 8 December 2023 / Published: 23 January 2024
(This article belongs to the Special Issue Speech Analysis and Tools in L2 Pronunciation Acquisition)

Abstract

:
In this paper, we demonstrate the use of Visible Vowels to detect formant and durational differences between L2 and L1 speakers. We used a dataset that contains vowel measures from L1 speakers of French and from L2 learners of French, with Italian, Spanish and English as L1. We found that vowels that are not part of the L1 phonological system are often pronounced differently by L2 speakers. Inspired by the Native Language Magnet Theory which was introduced by Patricia Kuhl in 2000, we introduced magnet plots that relate vowels shared by the French phonological system and the learners’ phonological system—the magnet vowels—to the vowels found only in the French phonological system. At a glance, it can be seen which vowels are attracted to the magnets and which vowels become further away from the magnets. When comparing vowel spaces, we found that the shape of the French vowel space of the English learners differed most from the shape of L1 speakers’ vowel space. Finally, it was found that the vowel durations of the L2 speakers are greater than that of the L1 speakers of French, especially those of the English learners of French.

1. Introduction

1.1. Acquisition of Sounds

The influence of a person’s first language on the learning of a foreign language is a classic topic in applied linguistics and second language learning. In particular, the degree of correspondence between the phonological systems of the languages was found to be an important factor that determines the extent to which someone is successful in acquiring an L2 language. Flege (1995, p. 238) writes:
“During L1 acquisition, speech perception becomes attuned to the contrastive phonic elements of the L1. Learners of an L2 may fail to discern the phonetic differences between pairs of sounds in the L2, or between L2 and L1 sounds, either because phonetically distinct sounds in the L2 are “assimilated” to a single category (see Best this volume), because the L1 phonology filters out features (or properties) of U sounds that are important phonetically but not phonologically, or both.”
According to the first hypothesis of the Speech Learning Model (SLM) that was developed by Flege (1995) and his colleagues, “learners perceptually relate positional allophones in the L2 to the closest positionally defined allophone (or “sound”) in the L1.” (p. 238).
Best and Tyler (2007, p. 20) write: “Perceptual learning occurs for some L2 contrasts, but seems to depend on their phonological and phonetic relationship to the L1, specifically on perceived similarities vs. dissimilarities to L1 phonemes.”
Kuhl (2000) introduced the Native Language Magnet Theory. This theory suggests that L1 learners (babies) categorize the sounds they hear in their mind into phonetic categories. Once a category is established, it will function as a magnet for sounds that are similar to the sound that is represented by that category. When learning an L2 language, yet-unknown sound patterns will be attracted to the L1 categories as well. Kuhl (2000) writes:
“A model reflecting this developmental sequence from universal perception to language-specific perception, called the Native Language Magnet model, proposes that infants’ mapping of ambient language warps the acoustic dimensions underlying speech, producing a complex network, or filter, through which language is perceived (39, 40, 82). The language-specific filter alters the dimensions of speech we attend to, stretching and shrinking acoustic space to highlight the differences between language categories. Once formed, language-specific filters make learning a second language much more difficult because the mapping appropriate for one’s primary language is completely different from that required by other languages.”
(p. 11854)
Visualizing the effect an L1 language has on an L2 language can help guide an L2 learner more effectively in acquiring or improving their pronunciation of the speech sounds. We are not referring here to evaluating an L2 learner’s pronunciation, but rather to identifying the exact differences between the L2 speaker’s pronunciation and the target pronunciation.
In this paper, we focus on the pronunciation of vowels. Differences in vowel pronunciation are evaluated in formants and duration.

1.2. Existing Software for Vowel Visualization

For the visualization of formants, several programs are available. Without claiming to be exhaustive, we mention the R packages vowels and phonR, and the programs NORM and VOIS3D, VowelWorm, VowelCat and Vowel Viewer.
With the R package vowels, phonetic and sociophonetic vowel formant data can be manipulated, normalized and plotted (Kendall and Thomas 2018). This package is also the backend for the web app NORM. Using NORM, vowels can be plotted and the formant measurements can be normalized using several normalization methods. Since NORM is less flexible than the vowels package, the authors encourage users to use their R package vowels rather than using NORM.
With VOIS3D, both formant frequencies and duration can be normalized. Spectral overlap can be assessed by an analytic geometric solution. VOIS3D runs only on Windows operating systems (Wassink 2006).
Another R package that can be used for the visualization of vowels is phonR (McCloy 2016). Trajectories can be visualized with an unlimited number of measure points. Additionally, IPA glyphs, confidence ellipses and convex hulls that mark the outline of a vowel space can be drawn. The degree of encroachment or overlap between vowel categories can be calculated and plotted by means of a heat map.
There are a few programs that record a user’s voice and display vowel plots in real-time such as KlinkerMikken (developed by linguists of Leiden University in 2010), VowelWorm1 (Frostel et al. 2011), VowelCat2 (at Ohio University in 2014) and Vowel Viewer3 (Rehman 2021).
The use of R packages requires some knowledge of the programming language R, and as such programs like NORM4 and VOIS3D5 are more user-friendly, but are limited in their functionality and flexibility. The four programs that give real-time response are useful for training purposes, but are even more limited in their visualizations and not useful for visualizing existing vowel measurements or relating them to potential explanatory factors.

1.3. Visible Vowels

In this paper, we present Visible Vowels, a web application for the visualization of vowel variation that aims to combine user friendliness with maximum flexibility and functionality. Characteristic of this web app is the use of a live view: each time the user changes something in the settings, the plot shown in the viewer is immediately adjusted accordingly.
Visible Vowels can be used in several research fields, such as phonetics, sociolinguistics, dialectology, forensic linguistics, speech pathology and language acquisition. It is freely available at https://www.visiblesounds.org/ (accessed on 18 October 2023) where a tutorial can be found as well.

1.4. Case Study

We focus on variation in the pronunciation of vowels spoken by L2 speakers and how they relate to the vowels pronounced by L1 speakers. We use a data set, which was compiled by Paolo Mairano, that contains vowel measurements of L1 speakers of French and of three groups of L2 learners of French, with Italian, Spanish and English as L1 (see Section 2.1). Using this data set, we demonstrate how Visible Vowels can be used as a tool in L2 research. We do this by answering the following questions:
  • What are the differences in F1 and F2 between the French vowels of Italian, Spanish and English L2 speakers and French L1 speakers?
  • Do the vowel spaces of Italian, Spanish and English L2 speakers of French differ from the vowel space of French L1 speakers?
  • How do the vowel systems of the French L2 speaker groups relate to the vowel system of the French L1 speaker group, and to each other, regarding the inter-vowel relationships?
  • What are the differences in duration between the French vowels of Italian, Spanish and English L2 speakers and French L1 speakers?
French has a lot of nasal vowels, and a lot of L2 speakers have difficulties in acquiring the nasal vowels. However, the automatic formant extraction methods used for the data sets do not provide valid values for nasal vowels, and therefore nasal vowels had to be excluded from the analysis.
In Section 2, the data set is described. We pay special attention to the removal of outliers and the normalization of the vowel formant measurements. In Section 3, different ways of visualizing vowel variation are shown and the four research questions are answered. In Section 4 we close the paper with some concluding remarks.

2. Methodology

2.1. Data Set

The learners of French data set was compiled by Paolo Mairano and includes 25 Italian L1 speakers from the ProSeg corpus (Delais-Roussarie et al. 2018), 15 Spanish L1 speakers from the COREIL corpus (Delais-Roussarie and Yoo 2010), 10 English L1 speakers from the AixOx corpus (Herment et al. 2014) and 10 French L1 speakers from the same AixOx corpus. Table 1 shows the distribution of speakers, split up for language group and gender.
The English L2 speakers of French are L1 speakers of southern British English recruited at the University of Oxford. They had a self-reported proficiency ranging from B1 to B2. The Italian L2 speakers are from the northern part of Italy and were recruited at the University of Turin. Their self-reported proficiency ranged from B1 to C1. The Spanish L2 speakers were students at the Autonomous University of Mexico (UNAM), having a self-reported proficiency that ranged from A2 to B2. For more details about the speaker groups, see Mairano et al. (2023).
All participants read the same text. Mairano et al. (2023) extracted the target vowels automatically from the recordings by means of forced alignment. WebMAUS (Kisler et al. 2017) was used for the recordings of the L2 English speakers, and Easyalign (Goldman 2011) for the other recordings. Subsequently, the alignments and transcriptions were verified by the respective authors of the data sets using Praat (Boersma and Weenink 2021). The transcriptions were minimally edited in order to reflect the target sounds, rather than actual realizations.
The set includes measurements of the vowels /i/, /y/, /u/, /e/, /ø/, o/, /ə/, /ɛ/, /œ/, /ɔ/ and /a/. Within the group of Spanish learners, one speaker did not pronounce that /œ/.
For all target vowels, the authors measured F1, F2, F3 and duration using Praat. The formants were measured automatically and were not manually verified (Delais-Roussarie et al. 2018; Delais-Roussarie et al. 2015; Herment et al. 2014). The formants were extracted from the midpoint of each vowel to minimize coarticulation effects. The Burg method was used in a band lower than 5.5 kHz for women and 5 kHz for men.
In order to eliminate formant measurement errors, we applied the interquartile range method to find outliers. This was done separately for F1, F2 and F3 and per language group, and within each group per gender. The quartile range (IQR) is calculated as the third quartile (Q3) minus the first quartile (Q1). Then, the lower fence is Q1 − 1.5 × IQR, and the upper fence is Q3 + 1.5 × IQR. Cases where formant measurements—whether F1 and/or F2 and/or F3—were below the lower fence or above the upper fence were removed from the data set.
Table 2 shows the number of realizations per vowel and language group both before and after the outliers have been removed. In total, 198 outliers (8%), equally spread over the vowels, were removed.

2.2. Scale Conversion and Normalization

Scale conversion methods aim to represent frequencies and frequency differences of pitch and/or formants in accordance with the perception of these differences. In Visible Vowels, five scales are available for formant measurements: Hz, bark (three versions), ERB (three versions), ln and mel (two versions). Additionally, 19 speaker normalization methods are available. Different speakers have varying vocal tract lengths and shapes, which can affect the formant frequencies. Vowel formant normalization aims to remove the effects of those differences, making it easier to compare and analyze formants across different speakers.
In order to find the best combination of a scale conversion method and a speaker normalization method for the data set that is uploaded by the user, an evaluation tab is included in Visible Vowels. Using this tab for all possible combinations of a scale conversion method and a speaker normalization method, it can be determined how effectively they (1) preserve phonemic information, (2) minimize anatomical/physiological information and (3) preserve sociolinguistic information in the formant measurements of vowels. These criteria were introduced by Adank (2003) and Adank et al. (2004).
The criteria were tested by two different approaches. In the first approach, it was tested (1) how well the acoustic variables can predict the phoneme that they represent, (2) how poorly they predict the anatomical differences and (3) how well they predict sociolinguistic distinctions. To this end, linear discriminant analysis (LDA) was used. In the second approach, it was measured (1) how well phonemic distinctions explain the variance in the acoustic variables, (2) how poorly anatomical differences are explained by the acoustic variables and (3) how well sociolinguistic variables explain the acoustic measurements. For that purpose, multivariate analysis (MANOVA) was used.
The same criteria and approaches are used in the evaluation tab of Visible Vowels. However, a proper use of (parametric) MANOVA would require checking its assumptions: independence of observations, randomly sampled data, the dependent variables should be normally distributed within groups and the population covariance matrices of each group should be equal. It cannot be assumed that the data that are uploaded to Visible Vowels by the users will always satisfy (all of) these assumptions, and checking them for each of the large number of MANOVAs that are carried out in the evaluation tab would make the procedure complex and cumbersome. Therefore, in Visible Vowels, non-parametric MANOVA is used as implemented in the function adonis2 in the R package vegan.
When using the evaluation tab, vowels that are not found across all speakers are automatically excluded in order to ensure that the procedures are run on the basis of the set of vowels that are found across all speakers. A notice listing the excluded vowels is given. In our case, the vowel /œ/ is excluded.
We submitted the learners of French data set to the evaluation tab twice, one time without and one time including F3. We have two reasons for this. First of all, the set of normalization methods that can also handle F3 is smaller than the set of normalization methods that are suitable for normalizing F1 and F2. The second reason is that a normalization method that is well evaluated for normalizing F1 and F2 measurements is not necessarily well evaluated for normalizing F3 measurements as well. In Table 3, for each criterion, the ‘winning method’ is given. For a detailed explanation of the methods, see Voeten et al. (2022). For the method of Johnson, see Johnson (2018, 2020).
In L2 research, we are interested in how well L2 learners pronounce the vowels and how well the vowels are distinguished from each other, especially in cases where L1 and L2 systems do not match. Therefore, the first criterion ‘phonemic’ is relevant here. Furthermore, we have to choose between ‘best prediction’ and ‘highest explained variance’. While the first approach focuses more on measuring the quality of the normalization, the second approach rather addresses the question of how the relevant information in the acoustic measurements can be optimally separated from noise, such as measurement errors. Because we would like to be able to detect vowel distinctions as well as possible, we opted for the second approach. This means that for visualizations based on F1 and F2 the raw measurements are normalized with ‘Johnson Hz’, and for visualizations that also use F3 the measurements are normalized with ‘Nearey I Hz.’
The effect of normalizing the data is visualized in Figure 1. In each of the two plots, the convex hulls of the vowel spaces of all speakers are shown in F1/F2 space. In the plot on the left, the original raw measurements are used. In the plot on the right, measurements normalized with Johson’s method (Johnson 2018, 2020) are used. In this graph, there is a higher degree of overlap between the envelopes.

3. Results

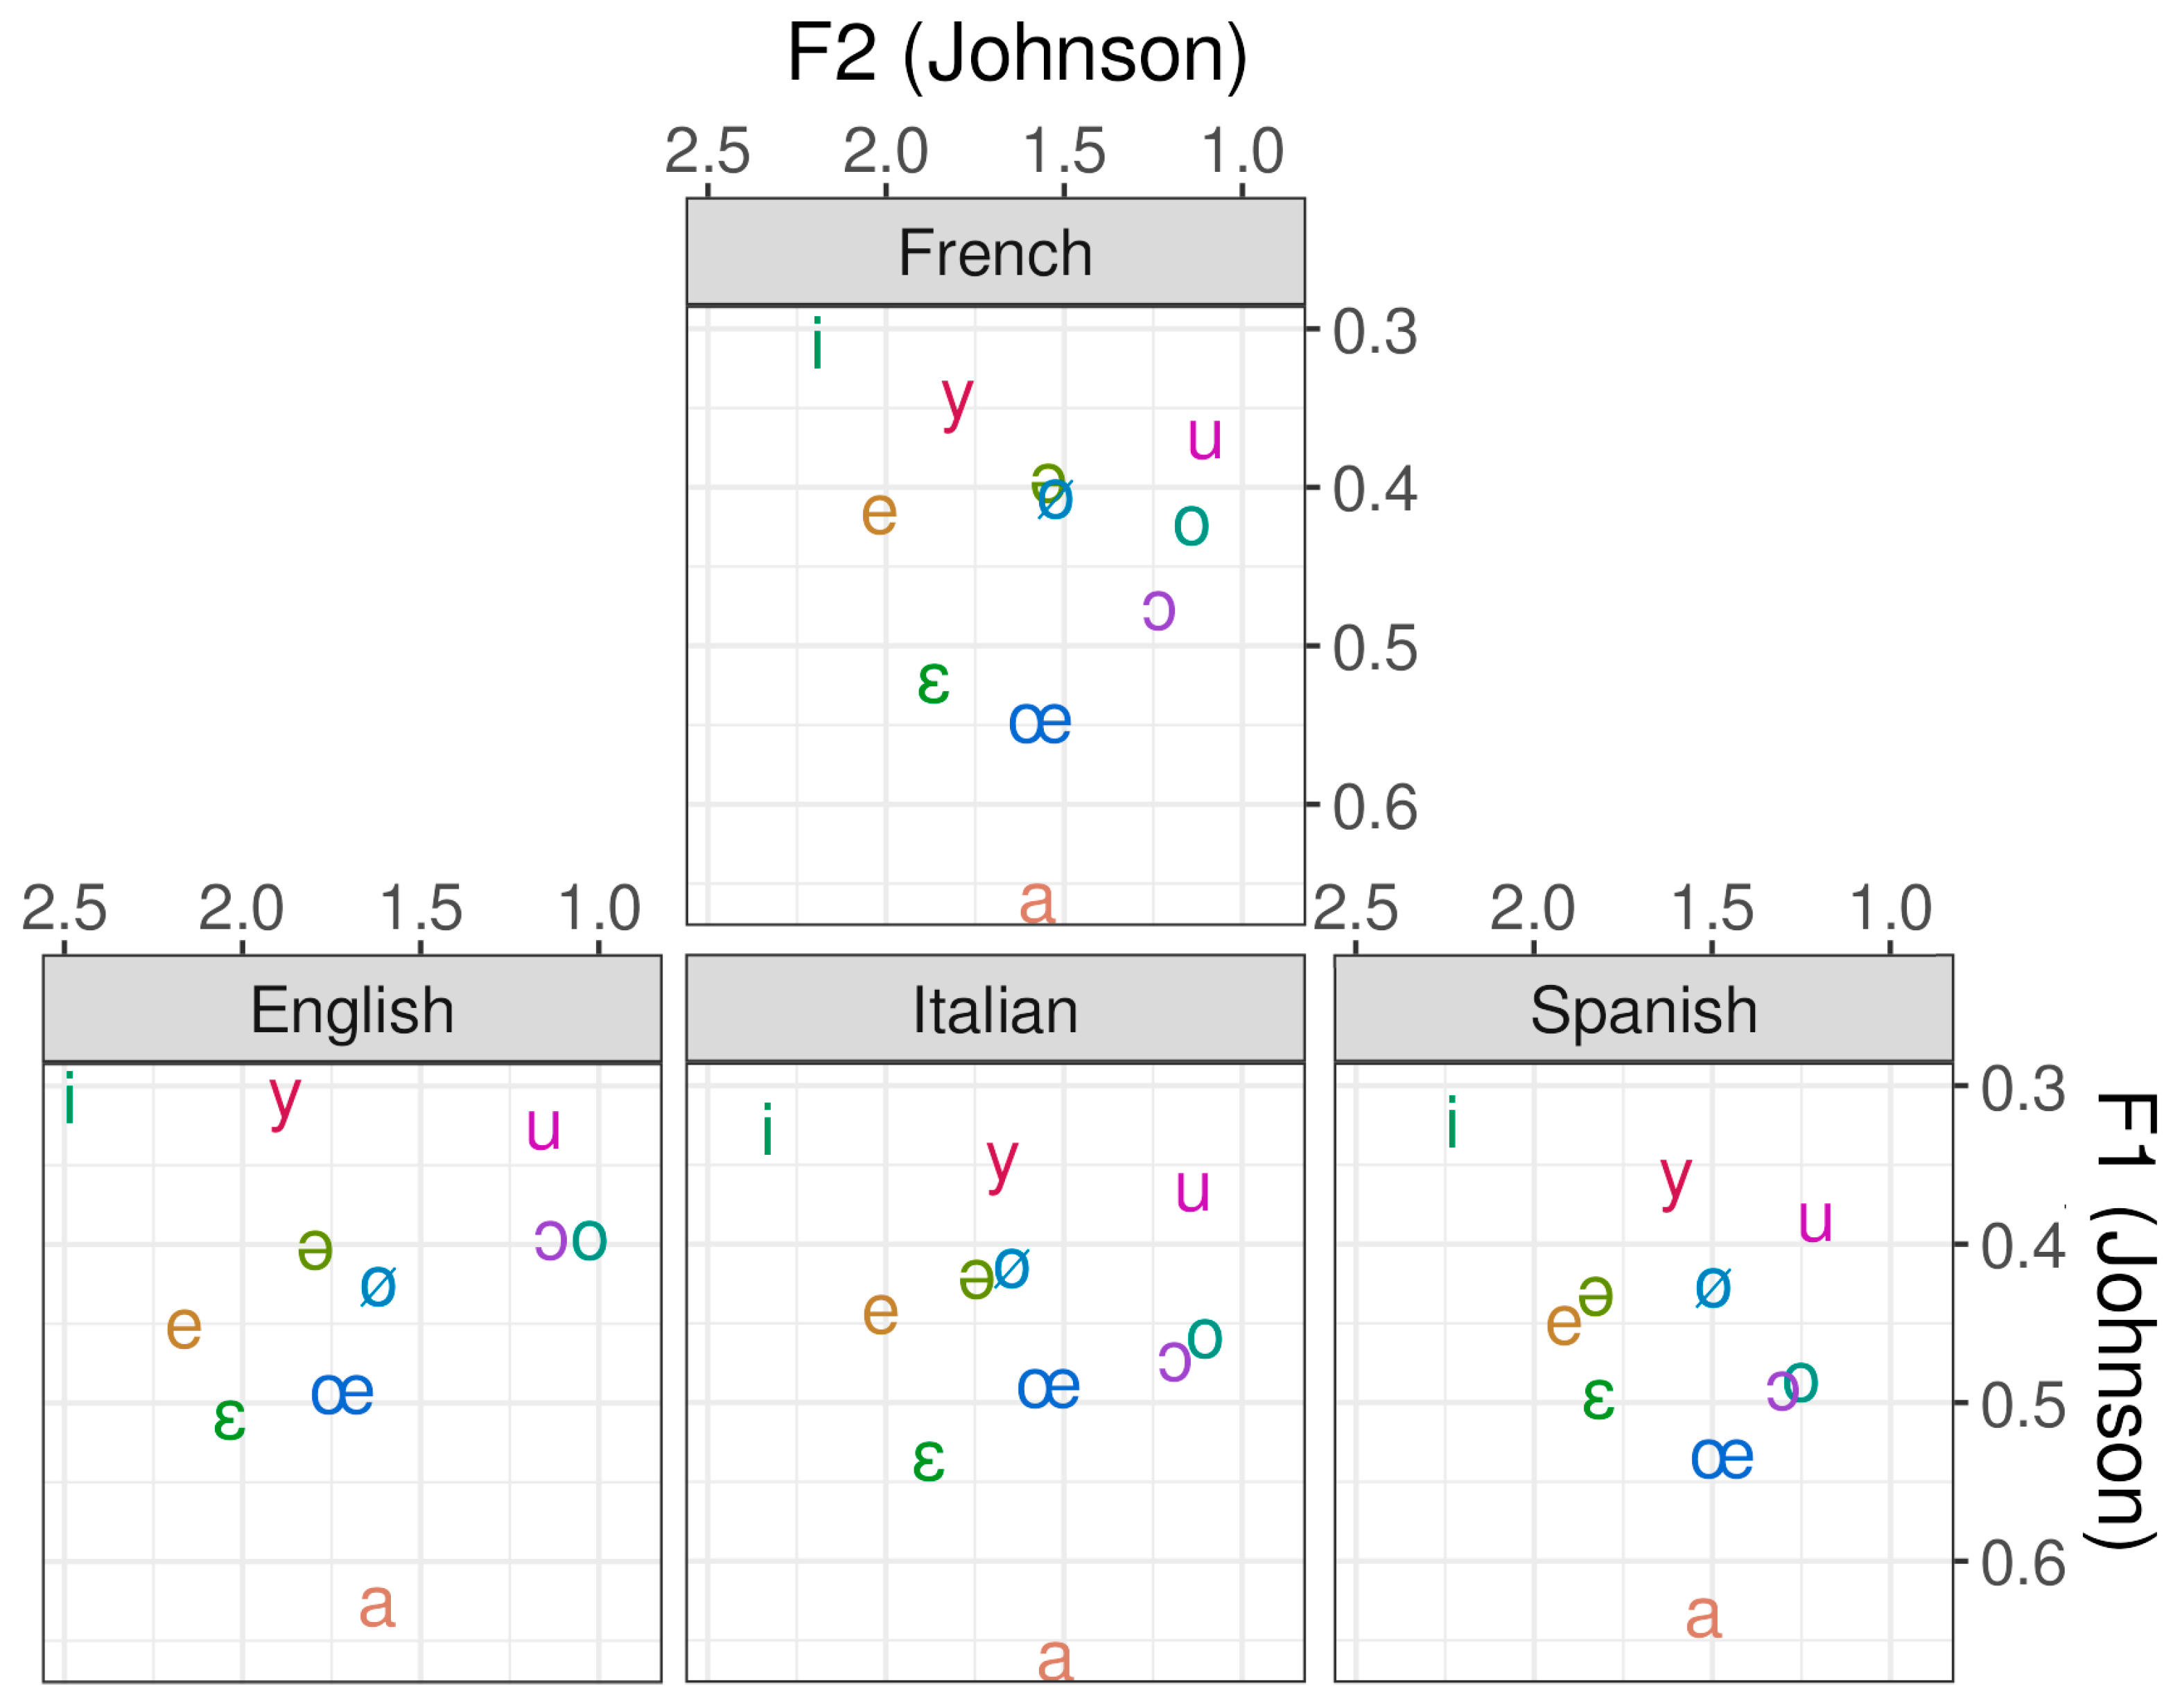
3.1. What Are the Differences in F1 and F2 between the French Vowels of Italian, Spanish and English L2 Speakers and French L1 Speakers?

Figure 2 gives an overview of the vowel systems of the L1 of the language groups: (Parisian) French, British English, Italian and Spanish. In this section, we compare the vowels pronounced by the L2 speakers of French to those pronounced by the L1 speakers of French. We expect that, in particular, French vowels that are not found in the L1 languages of the learners are pronounced differently compared to the pronunciation of the L1 speakers of French. The fewer vowels there are in the learners’ L1, the more difficult it may be for the learners to pronounce the French vowels correctly. On the other hand, in English there are vowels which are not found in French, which may also influence the pronunciation of the French vowels by the English learners. In Figure 2, the seven vowels of Italian seem to be the best match with the corresponding French vowels, but five oral (and four nasal) vowels still need to be acquired.
In Section 3.1.1, we compare the vowel plots of the English, Italian and Spanish learners to the vowel plot of the L1 speakers of French and try to detect noticeable differences. In Section 3.1.2, we investigate whether the vowels that occur in both French and the learners’ L1 act as magnets that attract the vowels that do not occur in their L1.

3.1.1. Comparing Vowel Plots

For each group of L2 speakers—L1 speakers of English, Italian and Spanish—the vowels are plotted in F1/F2 space, together with the vowels of the L1 speakers of French. Thus, larger deviations can easily be found. The plots are visualized in Figure 3. In each plot, and for each vowel, the formant values are averaged over the speakers.
In Figure 3, the L1 speakers of English are compared to the L1 speakers of French. In the plot, larger deviations are found for the vowels /œ/ and /ɔ/. In Figure 2b we can see that /œ/ and /ɔ/ are not found in the phonological system of British English. Sounds relatively close to /œ/ are English /ə/ and /ɜː/. However, the L2 speakers pronounce the /œ/ close to French /ɛ/. Sounds relatively close to /ɔ/ are English /ɔː/ and /ɒ/. The L1 speakers of English pronounce the /ɔ/ even higher than English /ɔː/, somewhere between French /o/ and /u/.
In Figure 3, the French vowels of the Italian L1 speakers are plotted together with the vowels pronounced by the L1 speakers of French. Larger deviations are found for /œ/ and /ə/, two phonemes that are not found in the phonological system of Italian (see Figure 2c). The Italian L1 speakers pronounce /œ/ much higher. The vowel /ə/ is pronounced lower and more to the front. Interestingly, a similar deviation is found for /ø/. Consequently, French /ə/ is close to French /ø/, and Italian /ə/ is close to Italian /ø/.
In Figure 3, the French vowels pronounced by the L1 speakers of Spanish are plotted in relation to the vowels pronounced by the L1 French speakers. The largest differences are found for the vowels /o/, /ə/ and /y/.
The vowel /o/ is also found in the Spanish phonological system, but is pronounced somewhere between /o/ and /ɔ/, which may explain why the Spanish L1 speakers pronounced French /o/ lower than the L1 speakers of French do.
The vowels /ə/ and /y/ are not found in the Spanish phonological system. The unstressed vowel /ə/ is pronounced more to the front and is hardly distinguished from the Spanish L1 speaker’s pronunciation of /e/. The vowel /y/ is pronounced more backwards, between /i/ and /u/.

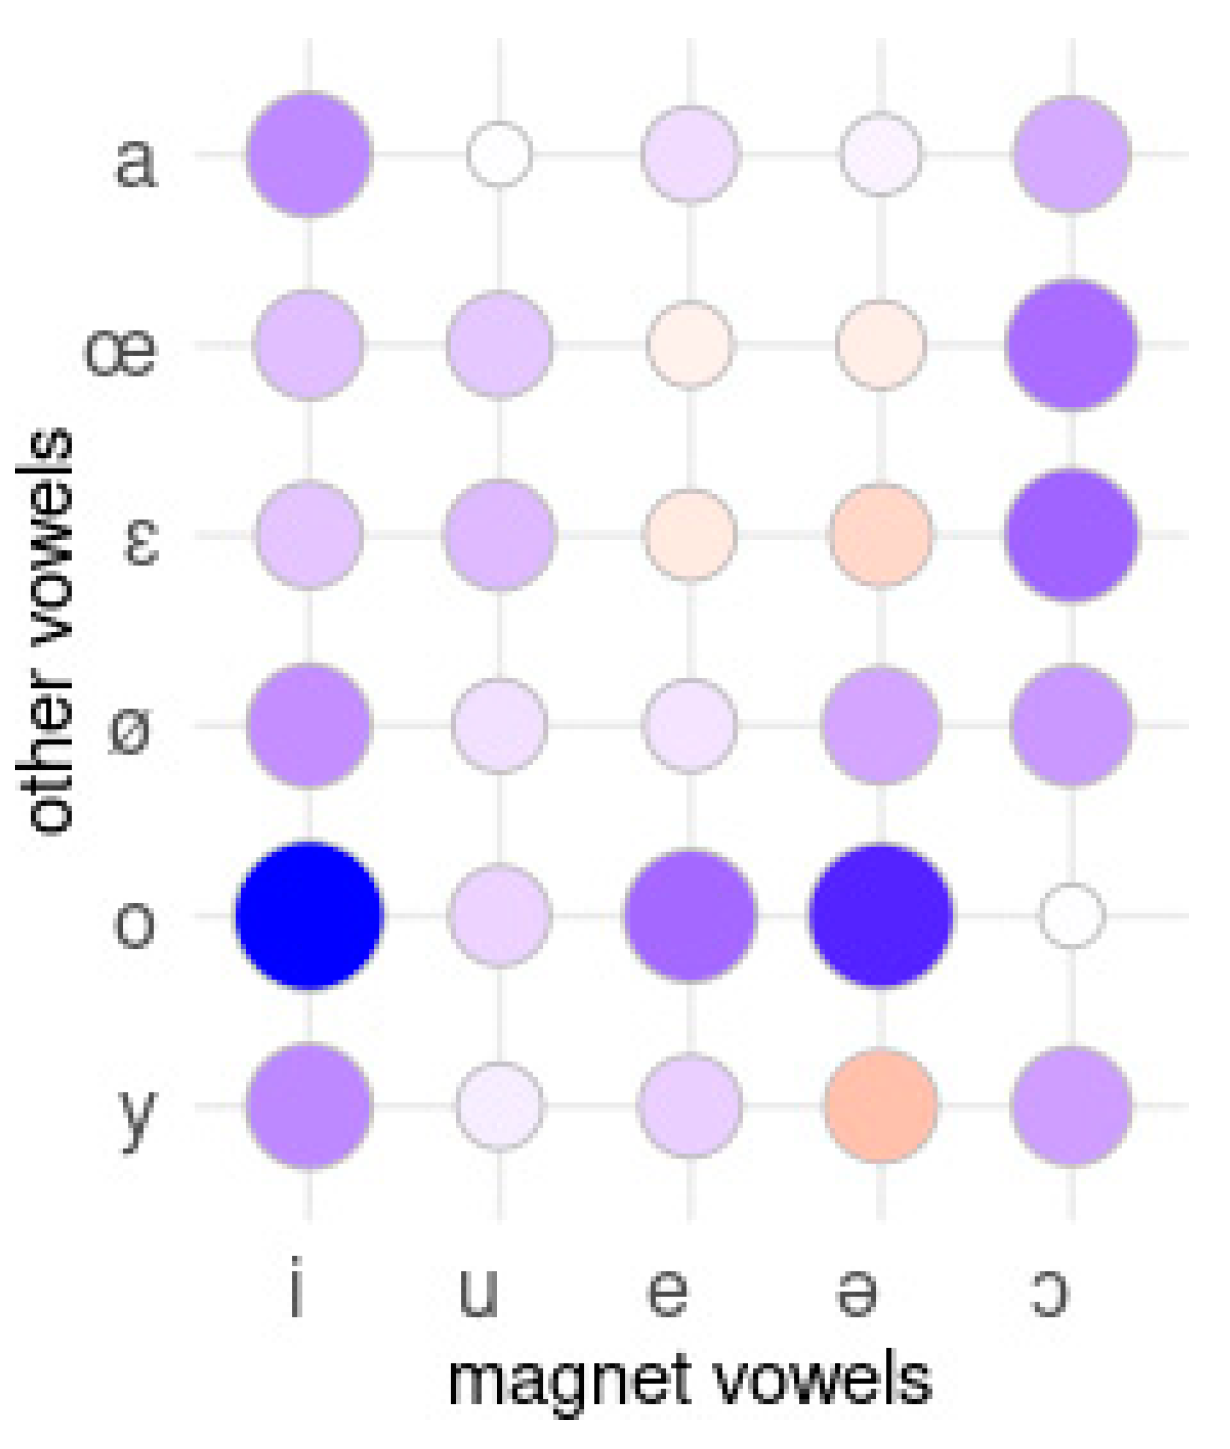
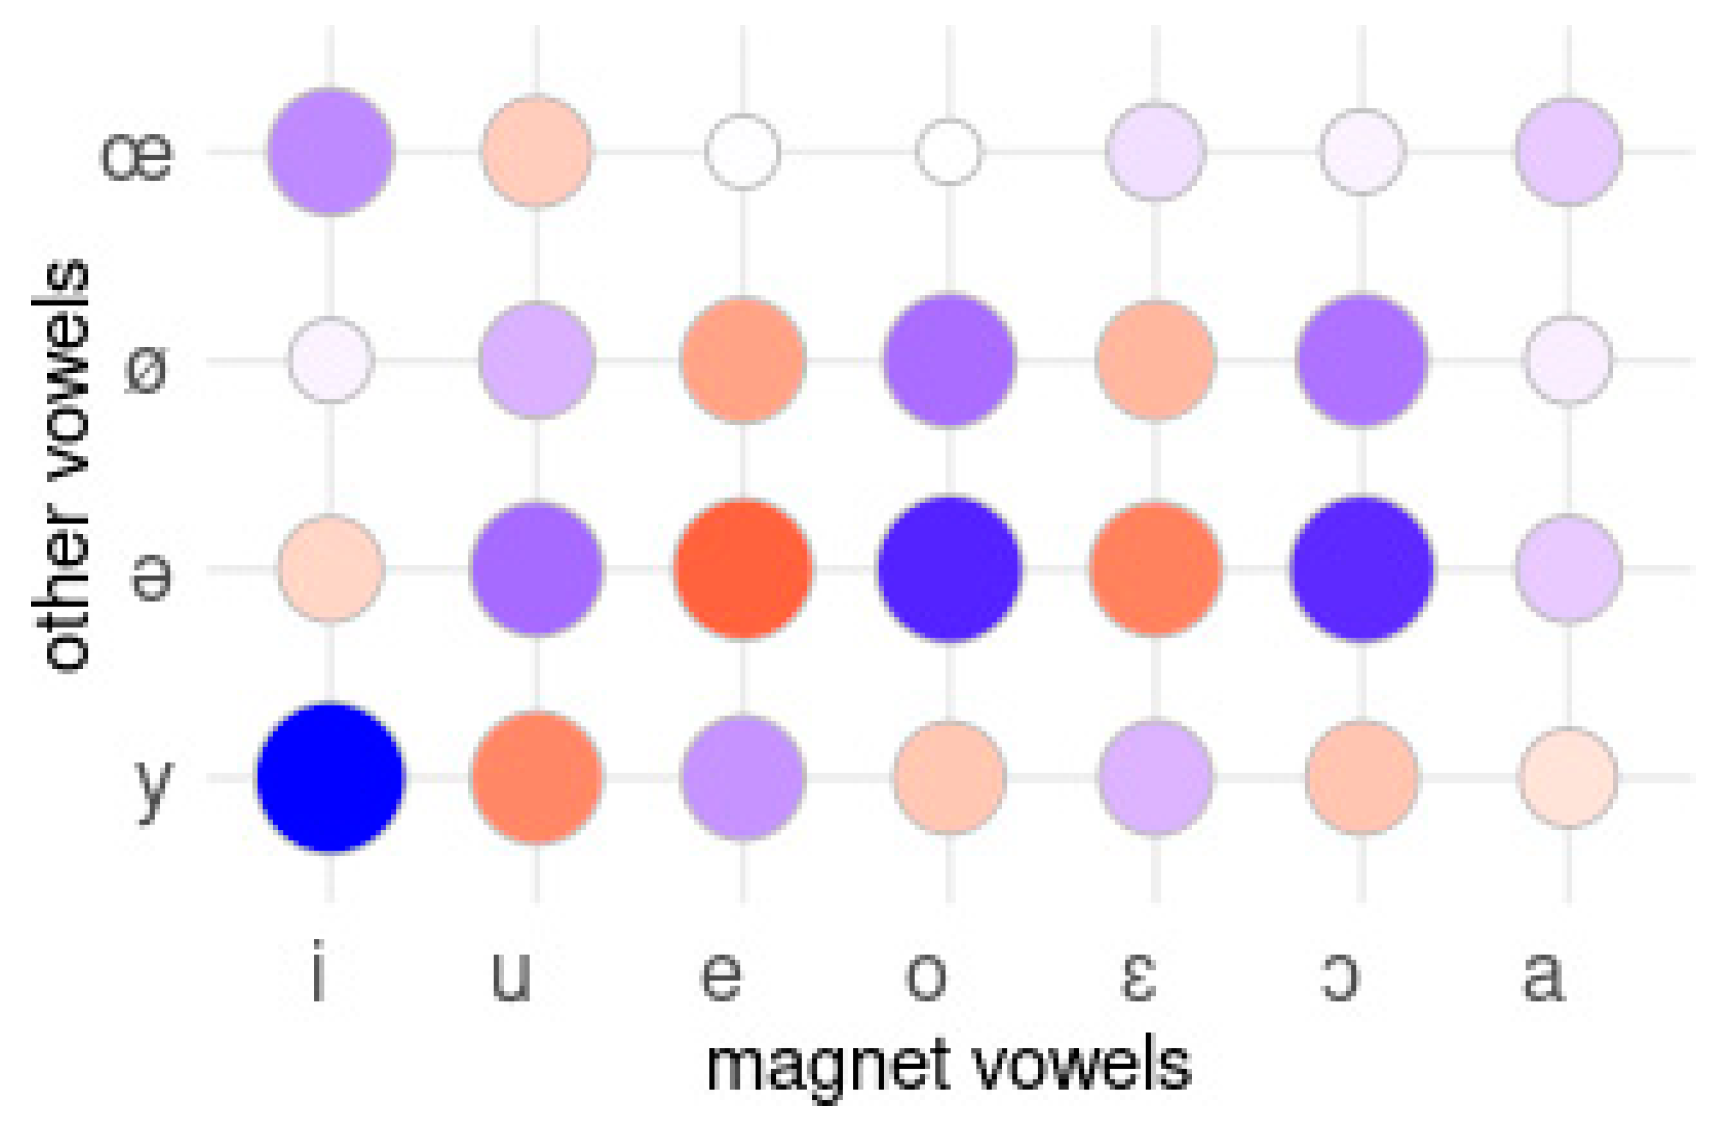
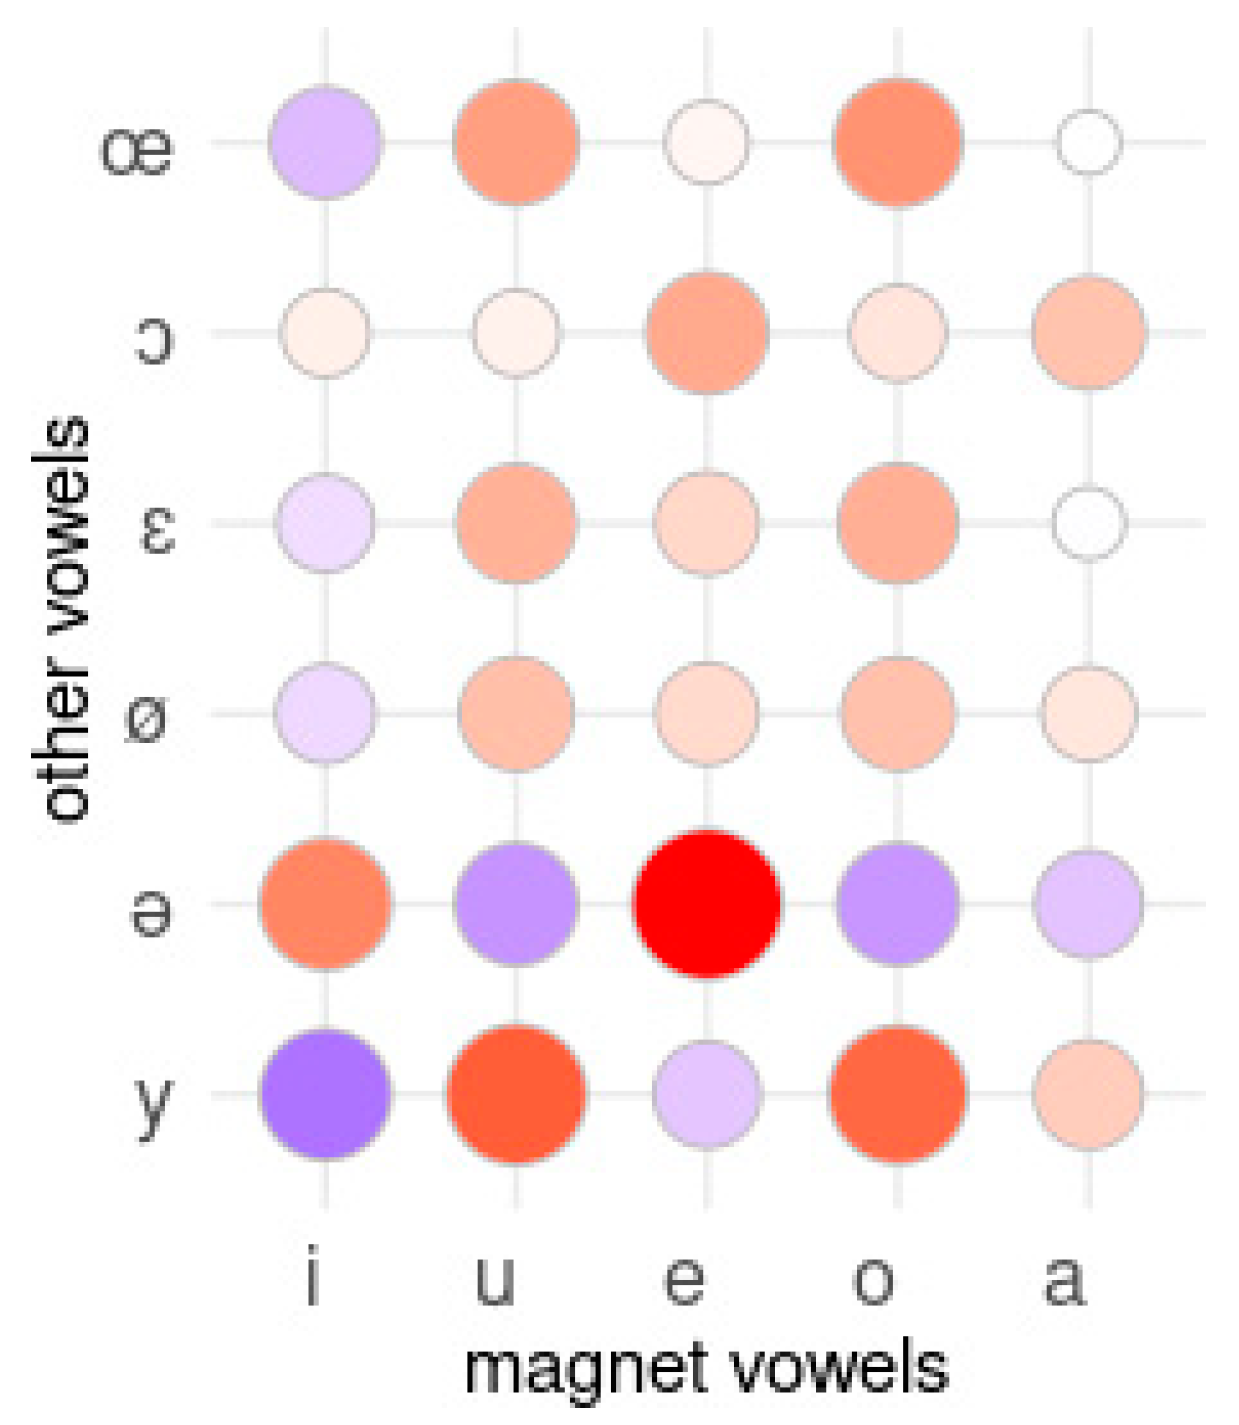
3.1.2. Detecting Magnet Vowels

In Section 1, the Native Language Magnet Theory of Kuhl (2000) (Kuhl et al. 2008) was mentioned. The vowel categories of a learner’s L1 may ‘attract’ the vowels in the L2 language that are not found in the learner’s L1. In order to find out whether this is reflected in our groups of L2 speakers, we first determine which vowels are the magnets. Since we do not have vowel measurements of the L1 languages of the learners, we consult the plots in Figure 2. For each L2 group, we select the vowels that are found both in the plot of the mother tongue of the learners (either Figure 2b or Figure 2c or Figure 2d) and in the plot with the French vowels (Figure 2a). Accordingly, the ‘magnet vowels’ for English are /iː/, /uː/, /e/, /ə/ and /ɔː/, for Italian are /i/, /u/, /e/, /o/, /ɛ/, /ɔ/ and /a/, and for Spanish are /i/, /u/, /e/, /o/ and /a/.
Now, we have to investigate whether the French vowels that do not coincide with the ‘magnet vowels’ are attracted by the ‘magnet vowels’. For each L2 group and for each ‘magnet vowel’, we measure the distance to the vowels that are not ‘magnet vowels’. We measure this distance twice; namely, on the basis of the measurements of the L1 speakers of French (d1) and on the basis of the measurements of the L2 speakers (d2). If d2 is smaller than d1, then we assume that the magnet vowel has attracted a vowel that is not found in the L1 language of the learners in the L2 group. We calculate d1−d2, which gives positive and negative values. The positive values represent attraction, and the negative values represent repulsion. The distance between a pair of vowels is calculated as the Euclidean distance between the F1/F2 values of the vowels, i.e., the square root of the sum of the squared F1 and F2 differences.
We now make a few comments on our approach. First, the potential ‘magnet vowels’ of Italian and Spanish are a subset of the set of French vowels, but English also has ‘magnet vowels’ which are not found in the set of French vowels. Second, we excluded the nasal vowels. Third, the English ‘magnet vowels’ are long (except for the schwa), but we still match them with their short French counterparts. Fourth, since we do not have L1 measurements of the three groups of learners, we assume that the location of the vowels in their L2 plot corresponds to the location of the vowels in their L1 plot. These four points may be cause for concern. We therefore present the results in this section with some reservations. The results are shown in Figure 4, Figure 5 and Figure 6. In each plot, the possible magnet vowels are found on the x axis and they are compared to the other vowels that are not found in the L1 of the learners. For each combination of vowels, a colored dot is shown. The redder the dot, the more the ‘other vowel’ is attracted by the ‘magnet vowel’, and the bluer the dot, the more repulsion.
For the English learners (Figure 4), we find that /y/ and /ɛ/ are attracted by /ə/. For Italian and Spanish learners, most ‘other vowels’ seem to be attracted by multiple ‘magnet vowels’. This happens when the magnet vowels are located relatively close to each other in the vowel space. In that case, we consider the ‘magnet vowel’ with the strongest attraction as the real magnet. As such, looking in Figure 5 (Italian learners), we find that /y/ is attracted by /u/, /ə/ and /ø/ are attracted by /e/, and /œ/ is attracted by /u/. In Figure 6 (Spanish learners), we find that /y/ and /ø/ are attracted by /u/, /ə/ and /ɔ/ are attracted by /e/, and /ɛ/ and /œ/ are attracted by /o/.
Almost all potential magnet vowels also act as magnets in the plots of the Italian and Spanish learners, but in the plot of the English learners, most magnet vowels do not attract any other vowels. This may be explained by the fact that all vowels of, respectively, the Italian and Spanish vowel systems are potential magnet vowels and are simply subsets of the set of French vowels (see Figure 2). However, English has also vowels that are not found in the set of French vowels, namely /ɪ/, /ʊ/, /ɜː/, /ʌ/ and /ɒ/. These vowels may act as magnets as well, but we cannot determine this because we have no measurements of these vowels, nor are these vowels shared with French. Furthermore, it could play a role that the English magnets that we included in the plot have phonological length while the French counterparts do not.

3.2. Do the Vowel Spaces of Italian, Spanish and English L2 Speakers of French Differ from the Vowel Space of French L1 Speakers?

In this section, we compare the shapes and sizes of the vowel spaces of the L2 speakers with those of the L1 speakers.
First, as was done in Section 3.1, the measurements of multiple realizations of the same vowel are averaged per speaker and the speaker averages are averaged for each vowel. Then, for each vowel group, the convex hull is determined. A convex hull is the smallest possible hull that encloses all points in a two-dimensional space. Assume we represent vowels as nails that are hammered in a wooden surface correctly representing their acoustic relationships. Then, if we stretch a rubber band around the nails, this forms the edge of the convex hull (Wikipedia Contributors 2023).
Additionally, the centroid of the vowels is determined and lines (or spokes) are drawn from this center to each of the vowels.
The results are shown in Figure 7. For each language group, convex hulls and spokes are shown for both male speakers and female speakers. The French vowel space of the English learners looks more deviant from the L1 speakers’ vowel space than the shapes of the French vowel spaces of the Italian and Spanish learners.

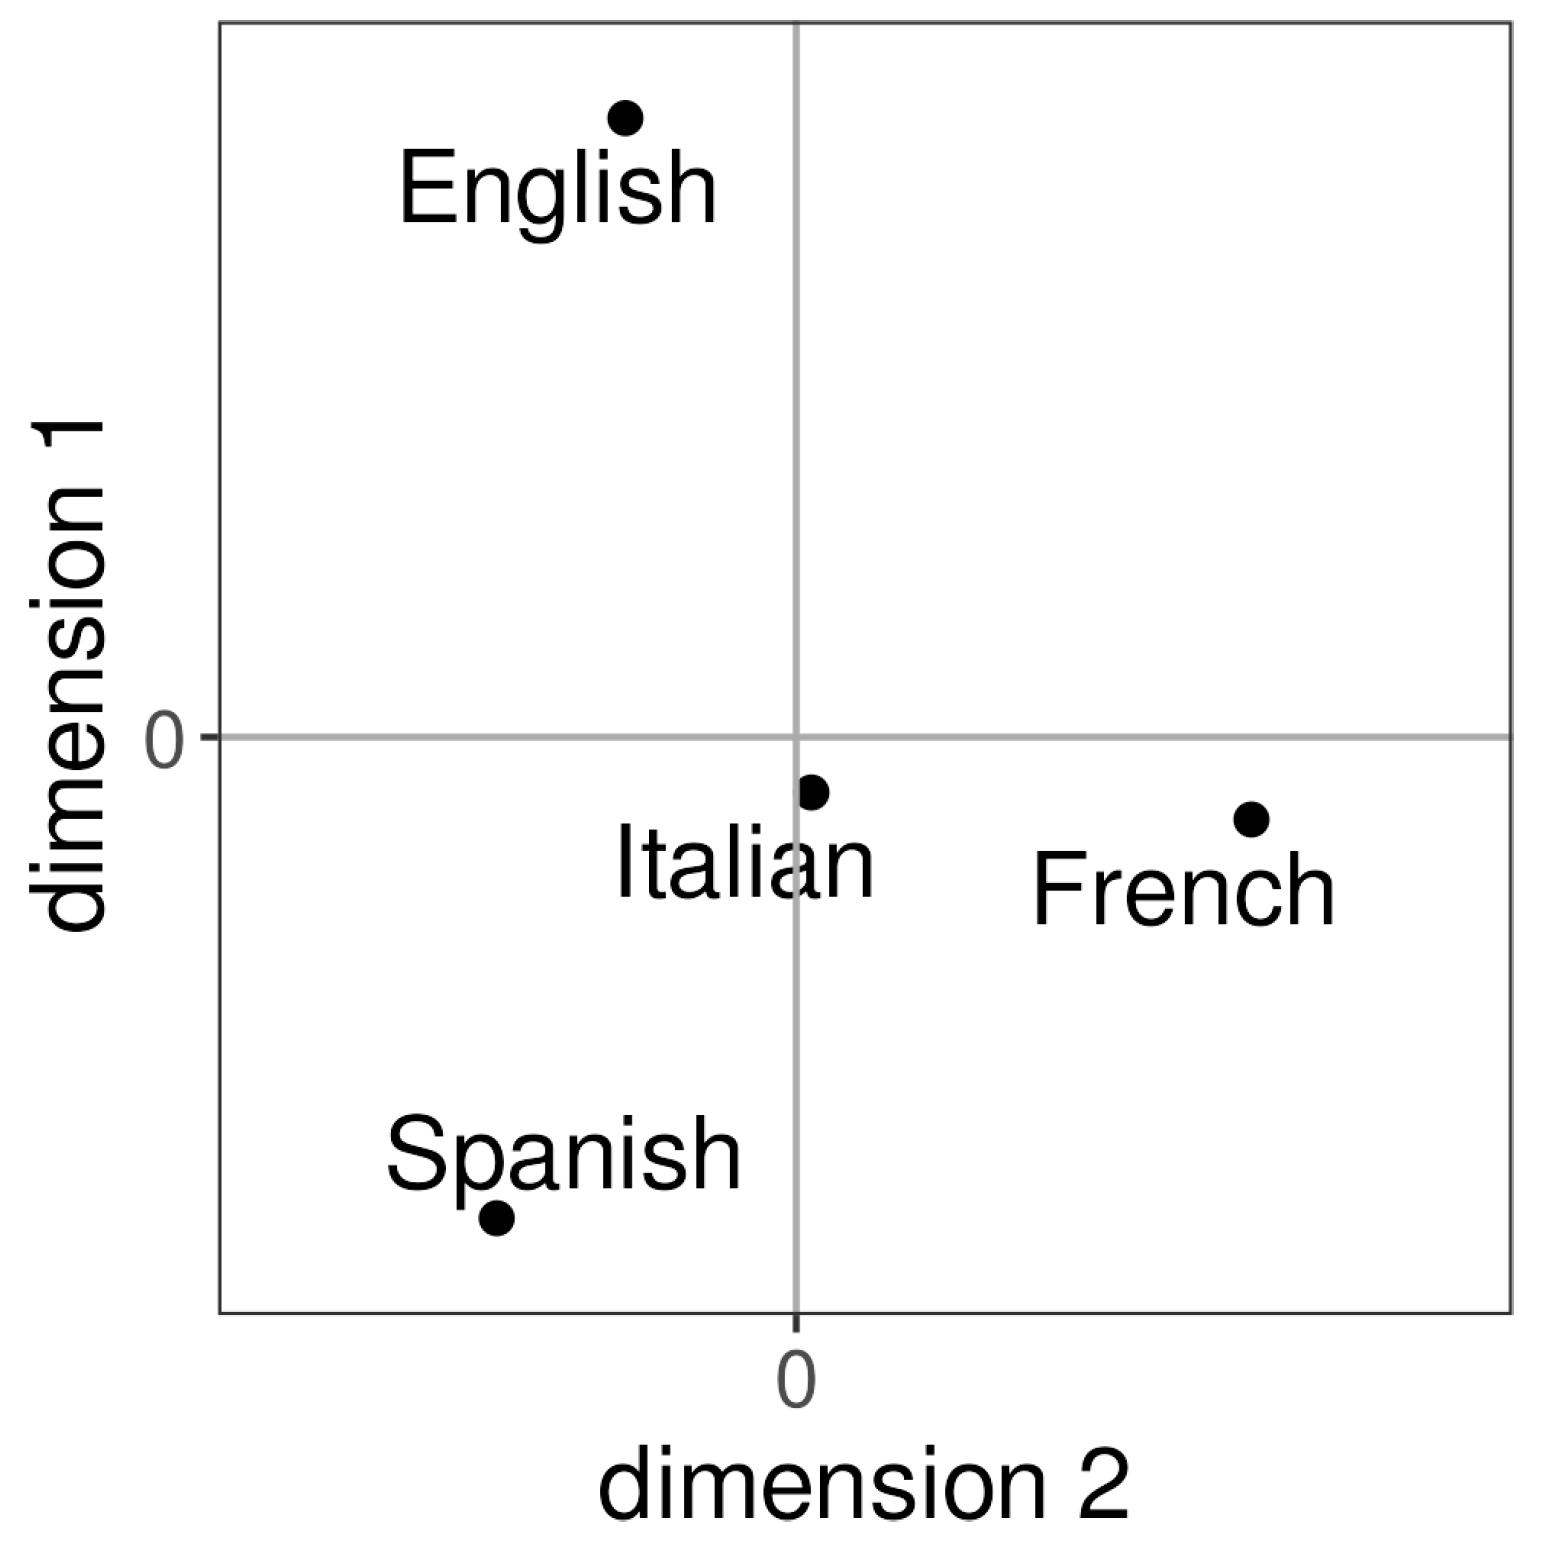
3.3. How Do the Vowel Systems of the French L2 Speaker Groups Relate to the Vowel System of the French L1 Speaker Group and to Each Other Regarding the Inter-Vowel Relationships?

Huckvale (2004) introduced ACCDIST (accent distances), a metric where a speaker’s vowel systems are compared by correlating the inter-vowel segment distances (see also Huckvale 2007). He used his metric for the accent classification of speakers into 14 English regional accents of the British Isles. Huckvale developed his method with speech technology in mind. He writes: “Thus speech technology could benefit from modeling techniques which are sensitive to the particular character of accent variation. Better modeling of accents would allow recognition systems to accommodate speakers from a wide range of accents, including second language speakers”. On the other hand, he also thinks about sociolinguistics when he writes: “… better definitions of accent groups could lead to new sociolinguistic insights into how groups form and change”.
We use the ACCDIST measure as another way to quantify the differences between the pronunciation of the French vowels pronounced by the French L1 speakers and the English, Italian and Spanish learners. From the Native Language Magnet Theory, it may be expected that the inter-vowel segment distances among the vowels of L2 speakers are affected by their L1, as the vowels in their L1 tend to attract the vowels of the L2 language. This causes the relationships between vowels to differ between L1 speakers and L2 speakers and between different L2 speaker groups.
The ACCDIST measure is available in Visible Vowels. The inter-vowel segment distances are calculated as Euclidean distances on the basis of their formant values (F1 and/or F2 and/or F3). The distance between any pair of speakers is 1 minus the correlation of their respective inter-vowel segment distances.
In order to be able to use this method, for each speaker the same set of vowels should be available. However, in the learners of French data set, the vowel /œ/ is missing for one speaker (see Section 2.1). Therefore, that vowel was excluded in this analysis to obtain the same set of vowels for each speaker.
In Visible Vowels, it is possible to calculate distances between groups. Assume a group with speakers A, B and C, and another group with speakers X and Y. Then, the distance between the two groups is calculated as the average distance of the speaker pairs AX, AY, BX, BY, CX and CY. Therefore, we can determine and visualize the relationships among the four language groups
Once the distances are calculated, the speakers (or speaker groups) can be classified using cluster analysis of multidimensional scaling. With multidimensional scaling, the speakers are projected in a two-dimensional space such that the distances between the speakers are proportionally reflected as closely as possible (Torgerson 1952, 1958).
Figure 8 shows a multidimensional scaling plot that was obtained on the basis of ACCDIST distances among the speakers of the learners of French data set. The Euclidean distances were calculated on the basis of F1, F2 and F3 measurements. Those formant measurements were normalized with the Nearey I normalization method (see Section 2.2).
In Visible Vowels, four different kinds of multidimensional scaling can be used: classical multidimensional scaling, Kruskal’s non-metric multidimensional scaling, Sammon’s non-linear mapping and t-distributed stochastic neighbor embedding (t-SNE). The quality of a scaling to n dimensions (in our case: n = 2) can be assessed by determining how much variance in the original distances (in our case the ACCDIST distances) is explained by the distances in the n-dimensional space. In our case, most of the variance is explained using Kruskal’s non-metric multidimensional scaling (Kruskal and Wish 1978), so we use this method.
The colored dots in Figure 8 represent the speakers of the four language groups: the English, Italian and Spanish learners of French and the L1 speakers of French. Some of the Italian L2 speakers cluster clearly with the L1 speakers. Although the groups of Italian and Spanish learners and the French L1 speakers can be more or less recognized, they are not sharply distinguished. Striking are the English learners who do not form a coherent group, but it should be noted that within each L2 group there are large differences. Further analyses could reveal whether this is linked to differences in French language skills.
A clearer picture is obtained by visualizing the relationships between the four groups, as can be seen in Figure 9. The group of Italian learners of French is relatively close to the group of L1 French speakers, and only differs on the 2nd dimension. The groups of Spanish and English learners are more distant to the group of L1 French speakers, and differ on both dimensions. The Spanish and English L2 speakers differ strongly on the 1st dimension.

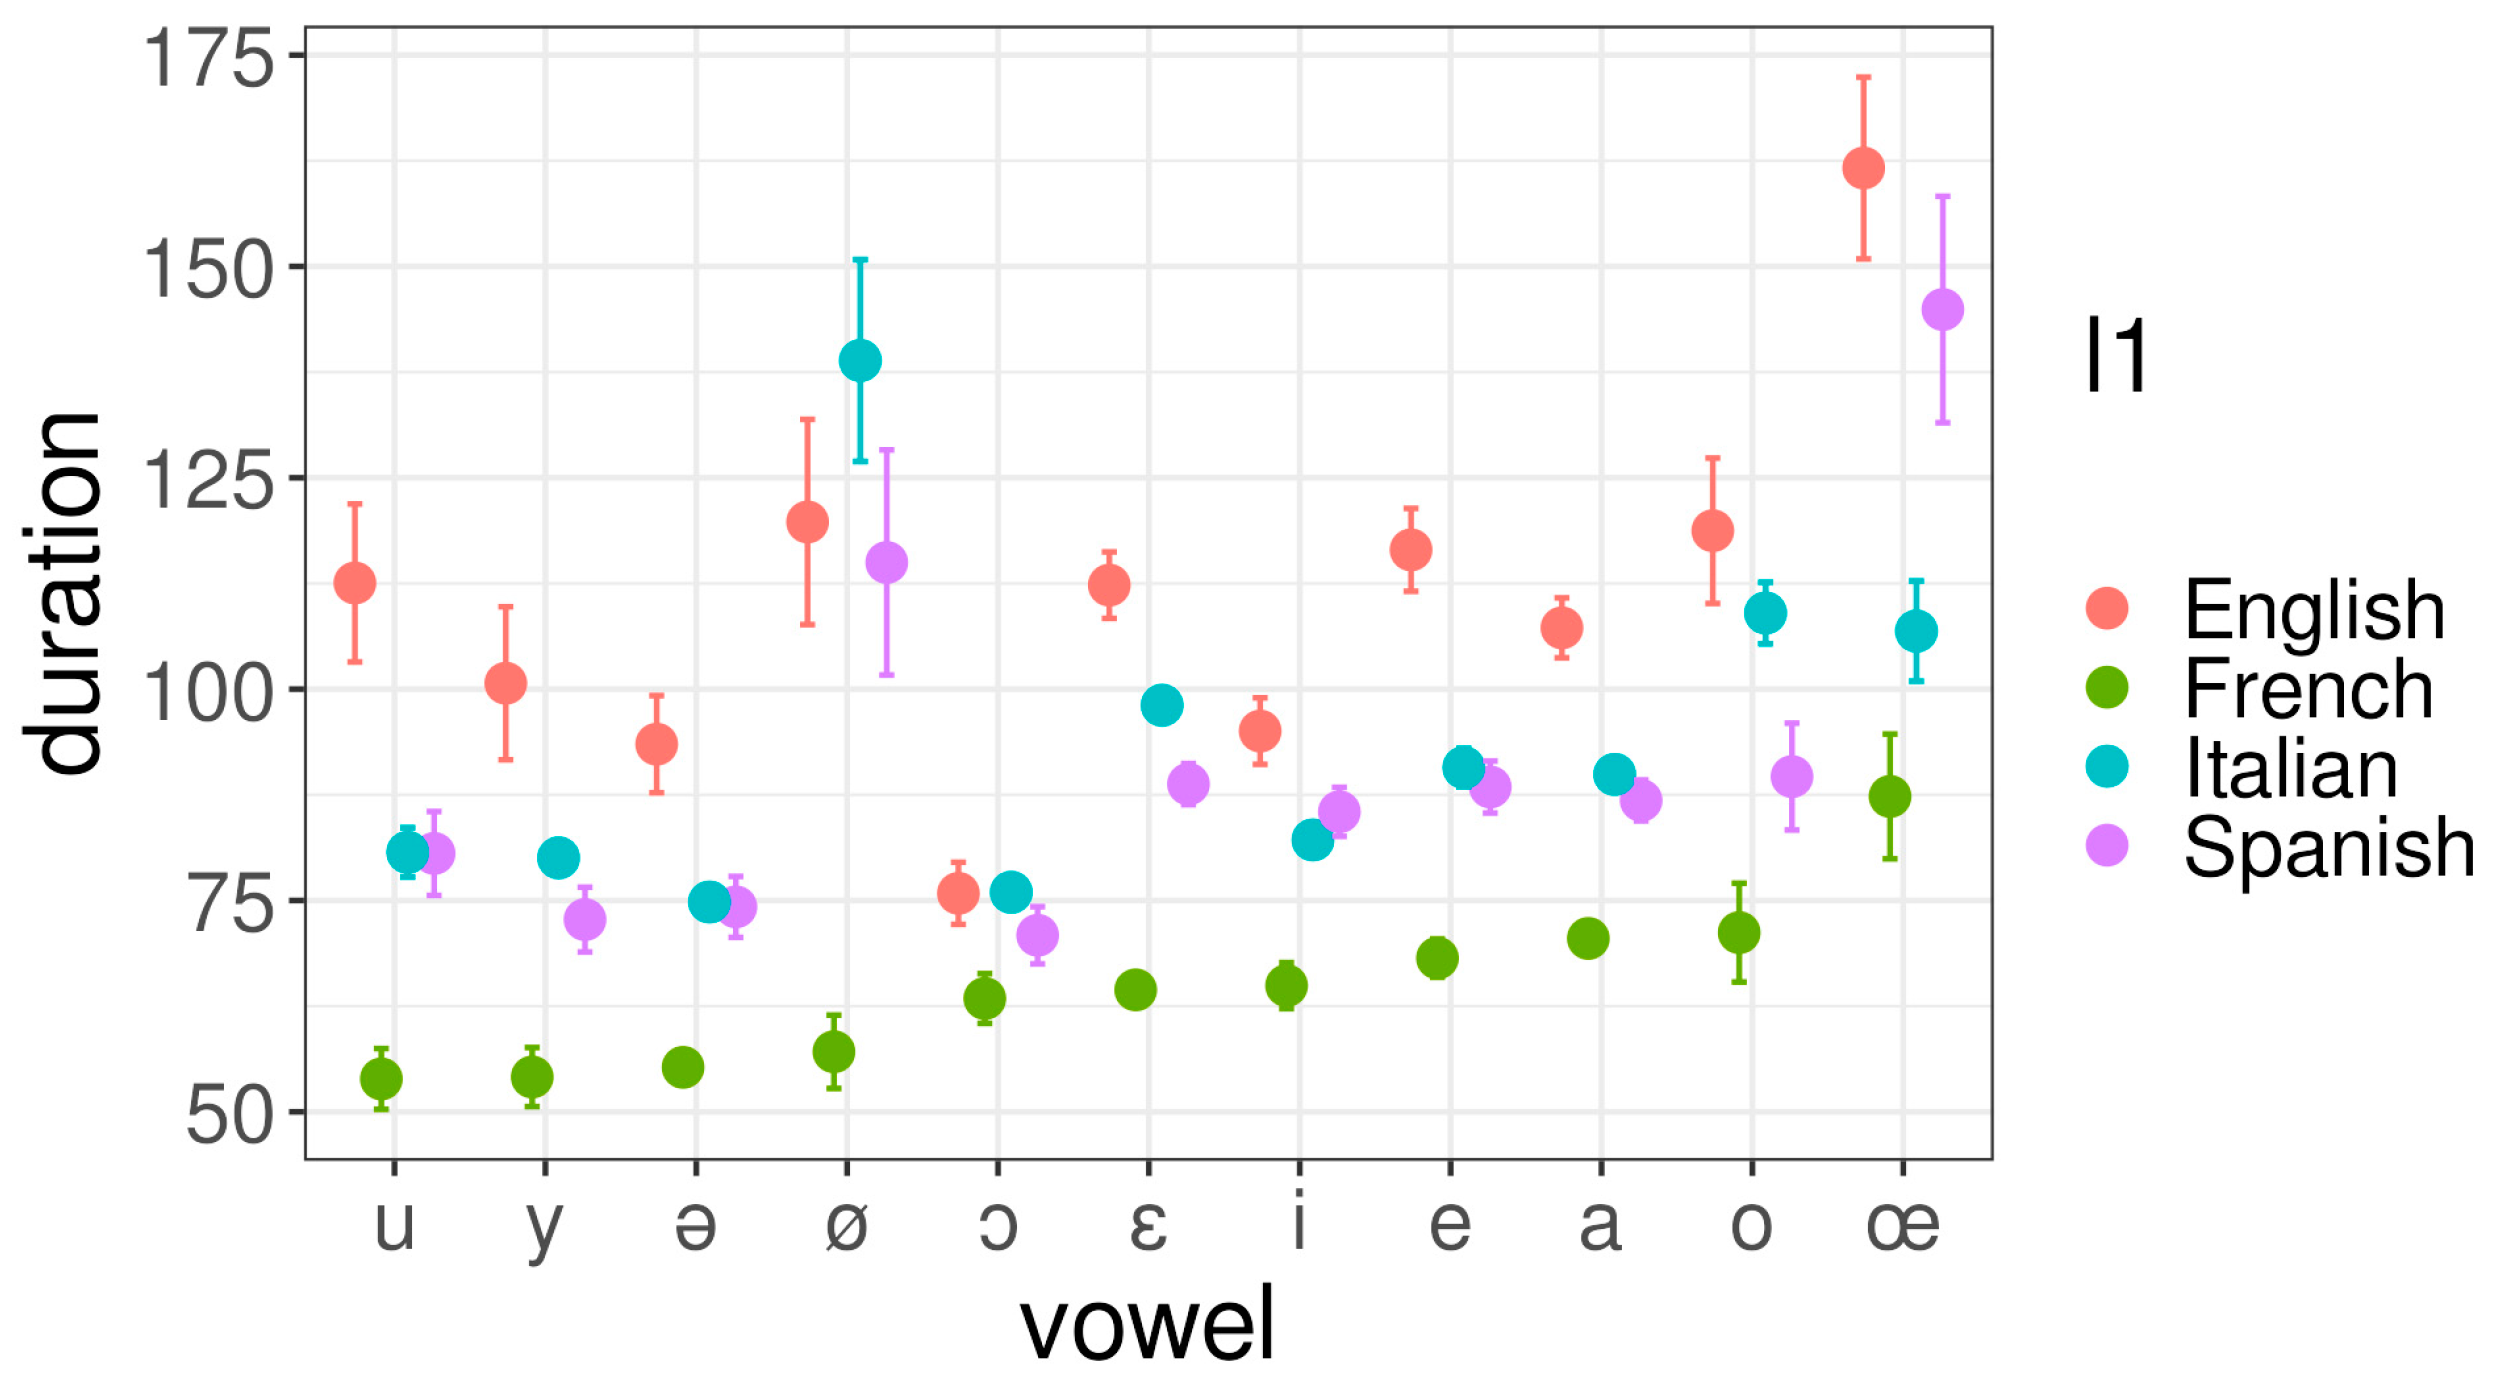
3.4. What Are the Differences in DURATION between the French Vowels of Italian, Spanish and English L2 Speakers and French L1 Speakers?

Visible Vowels includes a tab for visualizing vowel durations. In Figure 10, the durations of the vowels are visualized for each of the four language groups. As was done for the formants, first the durations of multiple realizations of the same vowel are averaged for each speaker. Then, in the plot, the mean speaker averages are shown with their 95% confidence intervals.
The plot shows that the L2 speakers have longer vowels than the L1 speakers of French. The largest durations were found for the L1 English speakers. The longer vowels of the learners are very likely related to a slower speech rate (Derwing and Munro 1997) and hyperarticulation. The largest vowel durations of the L1 English speakers may indicate that pronouncing the French words requires the greatest effort from them. In particular, the durations of the French vowels /ø/ and /œ/, which do not occur in the English vowel system, are much larger than the durations of the same vowels by the L1 speakers. The fact that French vowels have similar durations to English short vowels (Krzonowski et al. 2018) supports our explanation.

4. Concluding Remarks

In Section 3.1, we compared the vowel plots of the English, Italian and Spanish learners of French to the vowel plot of the L1 speakers of French. Examining the plots is an easy way to detect vowels that are pronounced differently by the L2 speakers compared to the pronunciation of the L1 speakers, and to explore where these differences can be found. Vowels that are not part of the L1 phonological system are often pronounced differently by L2 speakers. Inspired by the Native Language Magnet Theory of Kuhl (2000), we introduced magnet plots that relate vowels shared by the French phonological system and the phonological system of the learners—the magnet vowels—to the vowels that are only found in the phonological system of French. At a glance, it can be seen which vowels are attracted to the magnets and which vowels become further away from the magnets. This approach works best when the magnet vowels of the L1 of the learners of French are simply a subset of the full set of the French vowels, as is the case for Italian and Spanish, but not for English. This is only an exploratory analysis. Further research is necessary.
In Section 3.2, we compared the vowel spaces of the L1 and L2 speakers of French. The shape of the French vowel space of the English learners differed most from the shape of the L1 speakers’ vowel space.
In Section 3.3, the vowel systems of the four language groups were related to each other regarding the inter-vowel relationships. We found that the group of Italian learners of French is relatively close to the group of L1 French speakers, and that the groups of Spanish and English learners are more distant to the L1 speakers. An explanation may be that the Italian vowel system is most similar to the French vowel system (see Figure 2).
In Section 3.4, durations of vowels were considered. The vowel durations of the L2 speakers are larger than those of the L1 speakers of French. The longest durations were found for the English learners of French. Particularly, the durations of the vowels /ø/ and /œ/ were found to be much larger than the durations of the same vowels by the L1 speakers. This durational difference can be related by a slower speaking rate and/or hyperarticulation, linked to the proficiency level of the speakers.
The English L2 speakers of French consistently differ most from the native French speakers with respect to vowel spaces (Section 3.2), vowel systems (Section 3.3) and vowel duration (Section 3.4). In addition to inherent differences between, on the one hand, English (stress-timed, less overlapping and more vowels) and, on the other hand, Italian and Spanish (syllable-timed, more similar systems), the differences in self-reported L2 proficiency level between language groups might play a role in the observed differences between the English learners and the Italian and Mexican Spanish learners. With the data at our disposal, we cannot determine the precise role of proficiency level, and we would like to suggest this as an axe for future research to the authors of the respective corpora (ProSeg, COREIL and AixOx), also taking into account possible cultural differences in self-reporting and trying to relate self-reported proficiency with proficiency levels based on actual language production.
By answering the four research questions, we demonstrated features of Visible Vowels by which differences between L2 and L1 speakers can be visualized. We focused on formant measurements, speaker normalization, vowel spaces, and comparison of vowel systems and vowel duration, utilizing an existing data set of learners of French.
The figures generated by Visible Vowels in this paper can be a tool for speech therapists and language teachers to identify which vowels differ in pronunciation from the intended pronunciation, and in what respect they differ. The magnet plots in particular not only show the deviation in pronunciation, but also provide an explanation for the deviation. However, the feedback provided through these figures cannot be provided in real time, but only after a series of words that include both the magnet vowels and the target vowel multiple times have been spoken and processed.
We used Visible Vowels to compare L2 speakers of French with native speakers of French. However, within a language there can also be regional accents. The formants and duration can be compared between those accents, and the results explained by sociolinguistic variables such as age, gender, education, income and urbanicity. Further, the relationships between the vowel systems of accents can be measured and represented with the ACCDIST measure, as Huckvale (2004) did for accents of English spoken in the British Isles. One can then also try to find the explanatory variables for these relationships.
In addition to the functionality that we showed in this paper, f0 (pitch) contours, vowel formant trajectories and vowel dynamics can be visualized. We are also developing Visible Consonants, which can visualize variation in consonants. Although this program is still under development, a first version is already available at https://www.visiblesounds.org/ (accessed on 18 October 2023).

Author Contributions

Conceptualization, W.H. and H.V.d.V.; methodology, W.H. and H.V.d.V.; software development, W.H.; validation, H.V.d.V.; formal analysis, W.H.; investigation, W.H. and H.V.d.V.; data curation, W.H.; writing—original draft preparation, W.H. and H.V.d.V.; writing—review and editing, W.H. and H.V.d.V.; visualization, W.H. and H.V.d.V.; supervision, H.V.d.V.; project administration, H.V.d.V. All authors have read and agreed to the published version of the manuscript.

Funding

This research received no external funding.

Institutional Review Board Statement

Not applicable.

Informed Consent Statement

Informed consent was obtained from all subjects involved in the study by the authors of each corpus.

Data Availability Statement

French L1 and L2 data are part of three various corpora, some of which made be made available by authors (see Section 2.1 for details about each corpus).

Acknowledgments

We thank Paolo Mairano for providing the learners of French dataset. We thank the anonymous reviewers and the editors for their useful comments.

Conflicts of Interest

The authors declare no conflict of interest.

Notes

1
Available at: https://github.com/BYU-ODH/apeworm (accessed on 18 October 2023).
2
Available at: https://github.com/BYU-ODH/VowelCat (accessed on 18 October 2023).
3
See: https://www.ivanarehman.com/l2-tech-portfolio (accessed on 18 October 2023).
4
See: http://lingtools.uoregon.edu/norm/norm1.php (accessed on 18 October 2023).
5
See: https://depts.washington.edu/sociolab/VOIS3D/ (accessed on 18 October 2023).
6
In the formant tab of Visible Vowels this method can be found as ‘Labov et al. (2006) log-geomean II’. In the evaluation tab the method is labeled as ‘LABOV II’. The implementation is described in Voeten et al. (2022).

References

  1. Adank, Patricia Martine. 2003. Vowel Normalization: A Perceptual-Acoustic Study of Dutch Vowels. Nijmegen: Catholic University of Nijmegen. [Google Scholar]
  2. Adank, Patricia Martine, Roel Smits, and Roeland Van Hout. 2004. A comparison of vowel normalization procedures for language variation research. The Journal of the Acoustical Society of America 116: 3099–107. [Google Scholar] [CrossRef] [PubMed]
  3. Best, Catherine T., and Michael D. Tyler. 2007. Nonnative and second-language speech perception: Commonalities and complementarities. In Language Experience in Second Language Speech Learning; in Honour of James Emil Flege. Edited by Ocke-Schwen Bohn and Murray J. Munro. Amsterdam: John Benjamins Publishing Company, pp. 13–34. [Google Scholar]
  4. Boersma, Paul, and David Weenink. 2021. Praat: Doing Phonetics by Computer [Computer Program]. Version 6.4.01. Available online: http://www.praat.org/ (accessed on 18 October 2023).
  5. Delais-Roussarie, Elisabeth, and Hiyon Yoo. 2010. The COREIL Corpus: A Learner Corpus Designed for Studying Phrasal Phonology and Intonation. Paper presented at 6th New Sounds, Poznan, Poland, May 1–3; pp. 100–5. [Google Scholar]
  6. Delais-Roussarie, Elisabeth, Fabián Santiago, and Hi-Yon Yoo. 2015. The extended COREIL corpus: First outcomes and methodological issues. Paper presented at Workshop on Phonetic Learner Corpora, Glasgow, UK, August 12; pp. 57–59. [Google Scholar]
  7. Delais-Roussarie, Elisabeth, Tanja Kupisch, Paolo Mairano, Fabian Santiago, and Frida Splendido. 2018. ProSeg: A Comporable Corpus of Spoken L2 French. Paper presented at EuroSLA 2018, Münster, Germany, September 5–8. [Google Scholar]
  8. Derwing, Tracey M., and Murray J. Munro. 1997. Accent, intelligibility, and comprehensibility: Evidence from four L1s. Studies in Second Language Acquisition 19: 1–16. [Google Scholar] [CrossRef]
  9. Flege, James E. 1995. Second language speech learning theory, findings, and problems. In Speech Perception and Linguistic Experience: Issues in Cross-Language Research. Edited by Winifred Strange. Timonium: York Press, pp. 233–77. [Google Scholar]
  10. Fougeron, Cécile, and Caroline L. Smith. 1999. French. In Handbook of the International Phonetic Association: A Guide to the Use of the International Phonetic Alphabet. Cambridge: Cambridge University Press, pp. 78–81. [Google Scholar]
  11. Frostel, Harald, Andreas Arzt, and Gerhard Widmer. 2011. The vowel worm: Real-time mapping and visualisation of sung vowels in music. Paper presented at 8th Sound and Music Computing Conference, Padova, Italy, July 6–9; Padova: Padova University Press, pp. 214–19. [Google Scholar]
  12. Goldman, Jean-Philippe. 2011. EasyAlign: An automatic phonetic alignment tool under Praat. Paper presented at 12th Annual Conference of the International Speech Communication Association 2011 (INTERSPEECH 2011), Florence, Italy, August 27–31; pp. 3233–36. [Google Scholar] [CrossRef]
  13. Herment, Sophie, Anne Tortel, Brigitte Bigi, Daniel J. Hirst, and Anastassia Loukina. 2014. AixOx, a Multi-Layered Learners Corpus: Automatic Annotation. In Specialisation and Variation in Language Corpora. Edited by Francisco Javier Diaz-Pérez and Ana Díaz-Negrillo. Bern: Peter Lang, pp. 41–76. [Google Scholar]
  14. Huckvale, Mark. 2004. ACCDIST: A Metric for Comparing Speakers’ Accents. Paper presented at International Conference on Spoken Language Processing, Jeju, Republic of Korea, October 4–8; pp. 29–32. [Google Scholar]
  15. Huckvale, Mark. 2007. ACCDIST: An accent similarity metric for accent recognition and diagnosis. In Speaker Classification II: Selected Projects. Berlin and Heidelberg: Springer, pp. 258–75. [Google Scholar]
  16. Johnson, Keith. 2018. Vocal tract length normalization. In UC Berkeley PhonLab Annual Report. Berkeley: UC Berkeley PhonLab, vol. 14. [Google Scholar] [CrossRef]
  17. Johnson, Keith. 2020. The ∆F method of vocal tract length normalization for vowels. Laboratory Phonology 11: 10. [Google Scholar] [CrossRef]
  18. Kendall, Tyler, and Erik R. Thomas. 2018. Vowels: Vowel Manipulation, Normalization, and Plotting. R Package Version 1.2-2. Available online: https://CRAN.R-project.org/package=vowels (accessed on 18 October 2023).
  19. Kisler, T., U. Reichel, and F. Schiel. 2017. Multilingual processing of speech via web services. Computer Speech & Language 45: 326–47. [Google Scholar]
  20. Kruskal, Joseph B., and Myron Wish. 1978. Multidimensional Scaling. In Sage University Paper Series on Quantitative Applications in the Social Sciences. Newbury Park: Sage Publications, pp. 7–11. [Google Scholar]
  21. Krzonowski, J., F. Pellegrino, and E. Ferragne. 2018. Étude acoustique de la production de voyelles de l’anglais par des apprenants francophones. Paper presented at Actes des XXXIIe Journées d’Études sur la Parole, Aix-en-Provence, France, June 4–8; pp. 525–31. [Google Scholar]
  22. Kuhl, Patricia K. 2000. A new view of language acquisition. Proceedings of the National Academy of Sciences 97: 11850–57. [Google Scholar] [CrossRef]
  23. Kuhl, Patricia K., Barbara T. Conboy, Sharon Coffey-Corina, Denise Padden, Maritza Rivera-Gaxiola, and Tobey Nelson. 2008. Phonetic learning as a pathway to language: New data and native language magnet theory expanded (NLM-e). Philosophical Transactions of the Royal Society B: Biological Sciences 363: 979–1000. [Google Scholar] [CrossRef] [PubMed]
  24. Labov, William, Sharon Ash, and Charles Boberg. 2006. The Atlas of North American English: Phonetics, Phonology and Sound Change. Berlin: Mouton de Gruyter. [Google Scholar]
  25. Ladefoged, Peter, and Keith Johnson. 2010. A Course in Phonetics, 6th ed. Boston: Wadsworth Publishing. [Google Scholar]
  26. Mairano, Paolo, Fabián Santiago, and Leonardo Contreras-Roa. 2023. Can L2 pronunciation be evaluated without reference to a native model? Pillai scores for the intrinsic evaluation of L2 vowels. Languages 8: 280. [Google Scholar] [CrossRef]
  27. McCloy, Daniel R. 2016. phonR: Tools for Phoneticians and Phonologists. R package Version 1.0-7. Available online: https://CRAN.R-project.org/package=phonR (accessed on 18 October 2023).
  28. Rehman, Ivana. 2021. Real-Time Formant Extraction for Second Language Vowel Production Training. Ph.D. dissertation, Iowa State University, Ames, IA, USA. [Google Scholar]
  29. Roach, Peter. 2004. British English: Received Pronunciation. Journal of the International Phonetic Association 34: 239–45. [Google Scholar]
  30. Rogers, Derek, and Luciana d’Arcangeli. 2004. Italian. Journal of the International Phonetic Association 34: 117–21. [Google Scholar] [CrossRef]
  31. Torgerson, Warren S. 1952. Multidimensional scaling. I. Theory and method. Psychometrika 17: 401–19. [Google Scholar] [CrossRef]
  32. Torgerson, Warren S. 1958. Theory and Methods of Scaling. New York: Wiley. [Google Scholar]
  33. Voeten, Cesko, Wilbert Heeringa, and Hans Van de Velde. 2022. Normalization of nonlinearly time-dynamic vowels. The Journal of the Acoustical Society of America 152: 2692–710. [Google Scholar] [CrossRef] [PubMed]
  34. Wassink, Alicia Beckford. 2006. A geometric representation of spectral and temporal vowel features: Quantification of vowel overlap in three linguistic varieties. The Journal of the Acoustical Society of America 119: 2334–50. [Google Scholar] [CrossRef] [PubMed]
  35. Wikipedia Contributors. 2023. Convex Hull—Wikipedia, the Free Encyclopedia. Available online: https://en.wikipedia.org/wiki/Convex_hull (accessed on 4 August 2023).
Figure 1. Superimposed convex hulls of the speakers of the ‘learners of French data set’ on the basis of unnormalized data (left) and on the basis of measurements normalized by Johnson’s normalization method (right). The hulls are distinguished from each other by different colors, these colors were randomly assigned to the hulls.
Languages 09 00035 g001
Figure 2. Vowel charts of Parisian French, British English, North Italian and Spanish. (a) Vowels of French (Image taken from https://commons.wikimedia.org/wiki/File:French_oral_vowel_chart.png, IPA vowel chart for French vowels, 18 January 2008, public domain). From Fougeron and Smith (1999, p. 79); (b) Vowels of British English (Image taken from https://www.wikiwand.com/en/Received_Pronunciation#Media/File:RP_English_monophthongs_chart.svg, Monophthongs of a fairly conservative variety of RP, 18 April 2009, licensed under the Creative Commons Attribution-Share Alike 3.0 license, see: https://creativecommons.org/licenses/by-sa/3.0/). From Roach (2004, p. 240); (c) Vowels of Italian (Image taken from https://commons.wikimedia.org/wiki/File:Italian_vowel_chart.svg, IPA vowel Chart for Italian in SVG format, 17 April 2009, 16:35 (UTC), licensed under the Creative Commons Attribution-Share Alike 3.0 Unported license, see: https://creativecommons.org/licenses/by-sa/3.0/deed.en. The position of some vowel labels has been adapted). From Rogers and d’Arcangeli (2004, p. 119); (d) Vowels of Spanish (Image taken from https://commons.wikimedia.org/wiki/File:Spanish_vowel_chart.svg, Spanish vowel chart, 17 November 2017, licensed under the Creative Commons Attribution-Share Alike 4.0 International license, see https://creativecommons.org/licenses/by-sa/4.0/deed.en). From Ladefoged and Johnson (2010, p. 227).
Languages 09 00035 g002
Figure 3. French vowels pronounced by L1 speakers of French and by English, Italian and Spanish L2 speakers of French. The formants are averaged over the speakers per group. The labels refer to the native languages of the speakers.
Languages 09 00035 g003
Figure 4. Magnet vowels of the English learners versus French vowels not found in English. The redder the dot, the more attraction, and the bluer the dot, the more repulsion.
Languages 09 00035 g004
Figure 5. Magnet vowels of the Italian learners versus French vowels not found in Italian. The redder the dot, the more attraction, and the bluer the dot, the more removal.
Languages 09 00035 g005
Figure 6. Magnet vowels of the Spanish learners versus French vowels not found in Spanish. The redder the dot, the more attraction, and the bluer the dot, the more removal.
Languages 09 00035 g006
Figure 7. Convex hulls, centroids and spokes for the groups of L2 and L1 speakers of French obtained on the basis of measurements that are normalized by Johnson’s method. The labels refer to the L1 of the speakers.
Languages 09 00035 g007
Figure 8. Projection of L2 and L1 speakers of French in a two-dimensional space by applying Kruska’s non-metric multidimensional scaling to the ACCDIST distances that were measured among the speakers. Nearey I normalization was applied to the original measurements in Hz. The labels refer to the L1 of the speakers. The distances among the speakers in two-dimensional space explain 81.6% of the variance in the original ACCDIST distances.
Languages 09 00035 g008
Figure 9. Projection of the groups of L2 and L1 speakers of French in a two-dimensional space by applying Kruska’s non-metric multidimensional scaling to the ACCDIST distances that were measured among the groups. Nearey I normalization was applied to the original measurements in Hz. The labels refer to the L1 languages of the speakers. The distances among the groups in two-dimensional space explain 97.1% of the variance in the original ACCDIST distances.
Languages 09 00035 g009
Figure 10. Averaged durations in milliseconds of vowels pronounced by L2 and L1 speakers of French. The labels refer to the L1 languages of the speakers.
Languages 09 00035 g010
Table 1. Distribution of the speakers, split up for language group L2 and L1 speakers of French) and gender.
L2 English
(AixOx)
L2 Italian
(ProSeg)
L2 Spanish
(COREIL)
L1 French
(AixOx)
male speakers7484
female speakers32166
Table 2. Number of vowel tokens averaged over the speakers per language group. Incl. = including outliers, excl. = after removal of outliers.
TotalTotalL1 FrenchL2 EnglishL2 ItalianL2 Spanish
Incl.Excl.Incl.Excl.Incl.Excl.Incl.Excl.Incl.Excl.
a524480128123135110145137116110
e3433118782867086818478
ə35632771689075104979187
ɛ38836598921029295919490
i3142857664786986827570
o79711716201628261513
ø55511313161414131211
œ4138111016149955
ɔ1451373333363150482625
u1101012827292326252726
y1231142423292447452322
24782280
Table 3. Evaluation results of scale conversion methods and speaker normalization methods. The winning combinations are shown.
F1 + F2F1 + F2 + F3
Best PredictionHighest Explained VarianceBest PredictionHighest Explained Variance
phonemicLobanov HzJohnson HzLobanov Hz/bark I/mel IINearey I Hz
anatomicHeeringa & Van de Velde II bark IIHeeringa & Van de Velde II bark IIGerstman bark I/ERB IILobanov bark I
socioling.Heeringa & Van de Velde II lnNearey I HzNearey II HzLABOV II Hz6
Disclaimer/Publisher’s Note: The statements, opinions and data contained in all publications are solely those of the individual author(s) and contributor(s) and not of MDPI and/or the editor(s). MDPI and/or the editor(s) disclaim responsibility for any injury to people or property resulting from any ideas, methods, instructions or products referred to in the content.

