
Speech Rate and Turn-Transition Pause Duration in Dutch and English Spontaneous Question-Answer Sequences

Abstract
:1. Introduction
1.1. Speech Rate Entrainment and the Perception–Action Link in Speech
1.2. This Study
1.3. Research Questions
- Is there an inverse relationship between Speech Rate and TTT?
- Is there an inverse relationship between Final Rhyme Duration and TTT?
- 3.
- Are any observed effects of speech timing factors modulated by dialogue factors already shown to influence TTT (Question Length, Question Type, Answer Type)?
- 4.
- Do we observe any reliable differences, in the above factors between languages (Dutch and English)?
2. Materials and Methods
2.1. Corpora
2.2. Sampling of Question-Answer Sequences
2.3. Speech and Language Measurements
- 1.
- Answered
- Q: Well how about yourself then all set for Christmas then?
- A: Not very set.
- 2.
- Not answered
- Q: Well [wu]d wha’s your what are you doing your M.A. in?
- A: Eh MSc thank you very much.
2.4. Statistical Analysis
3. Results
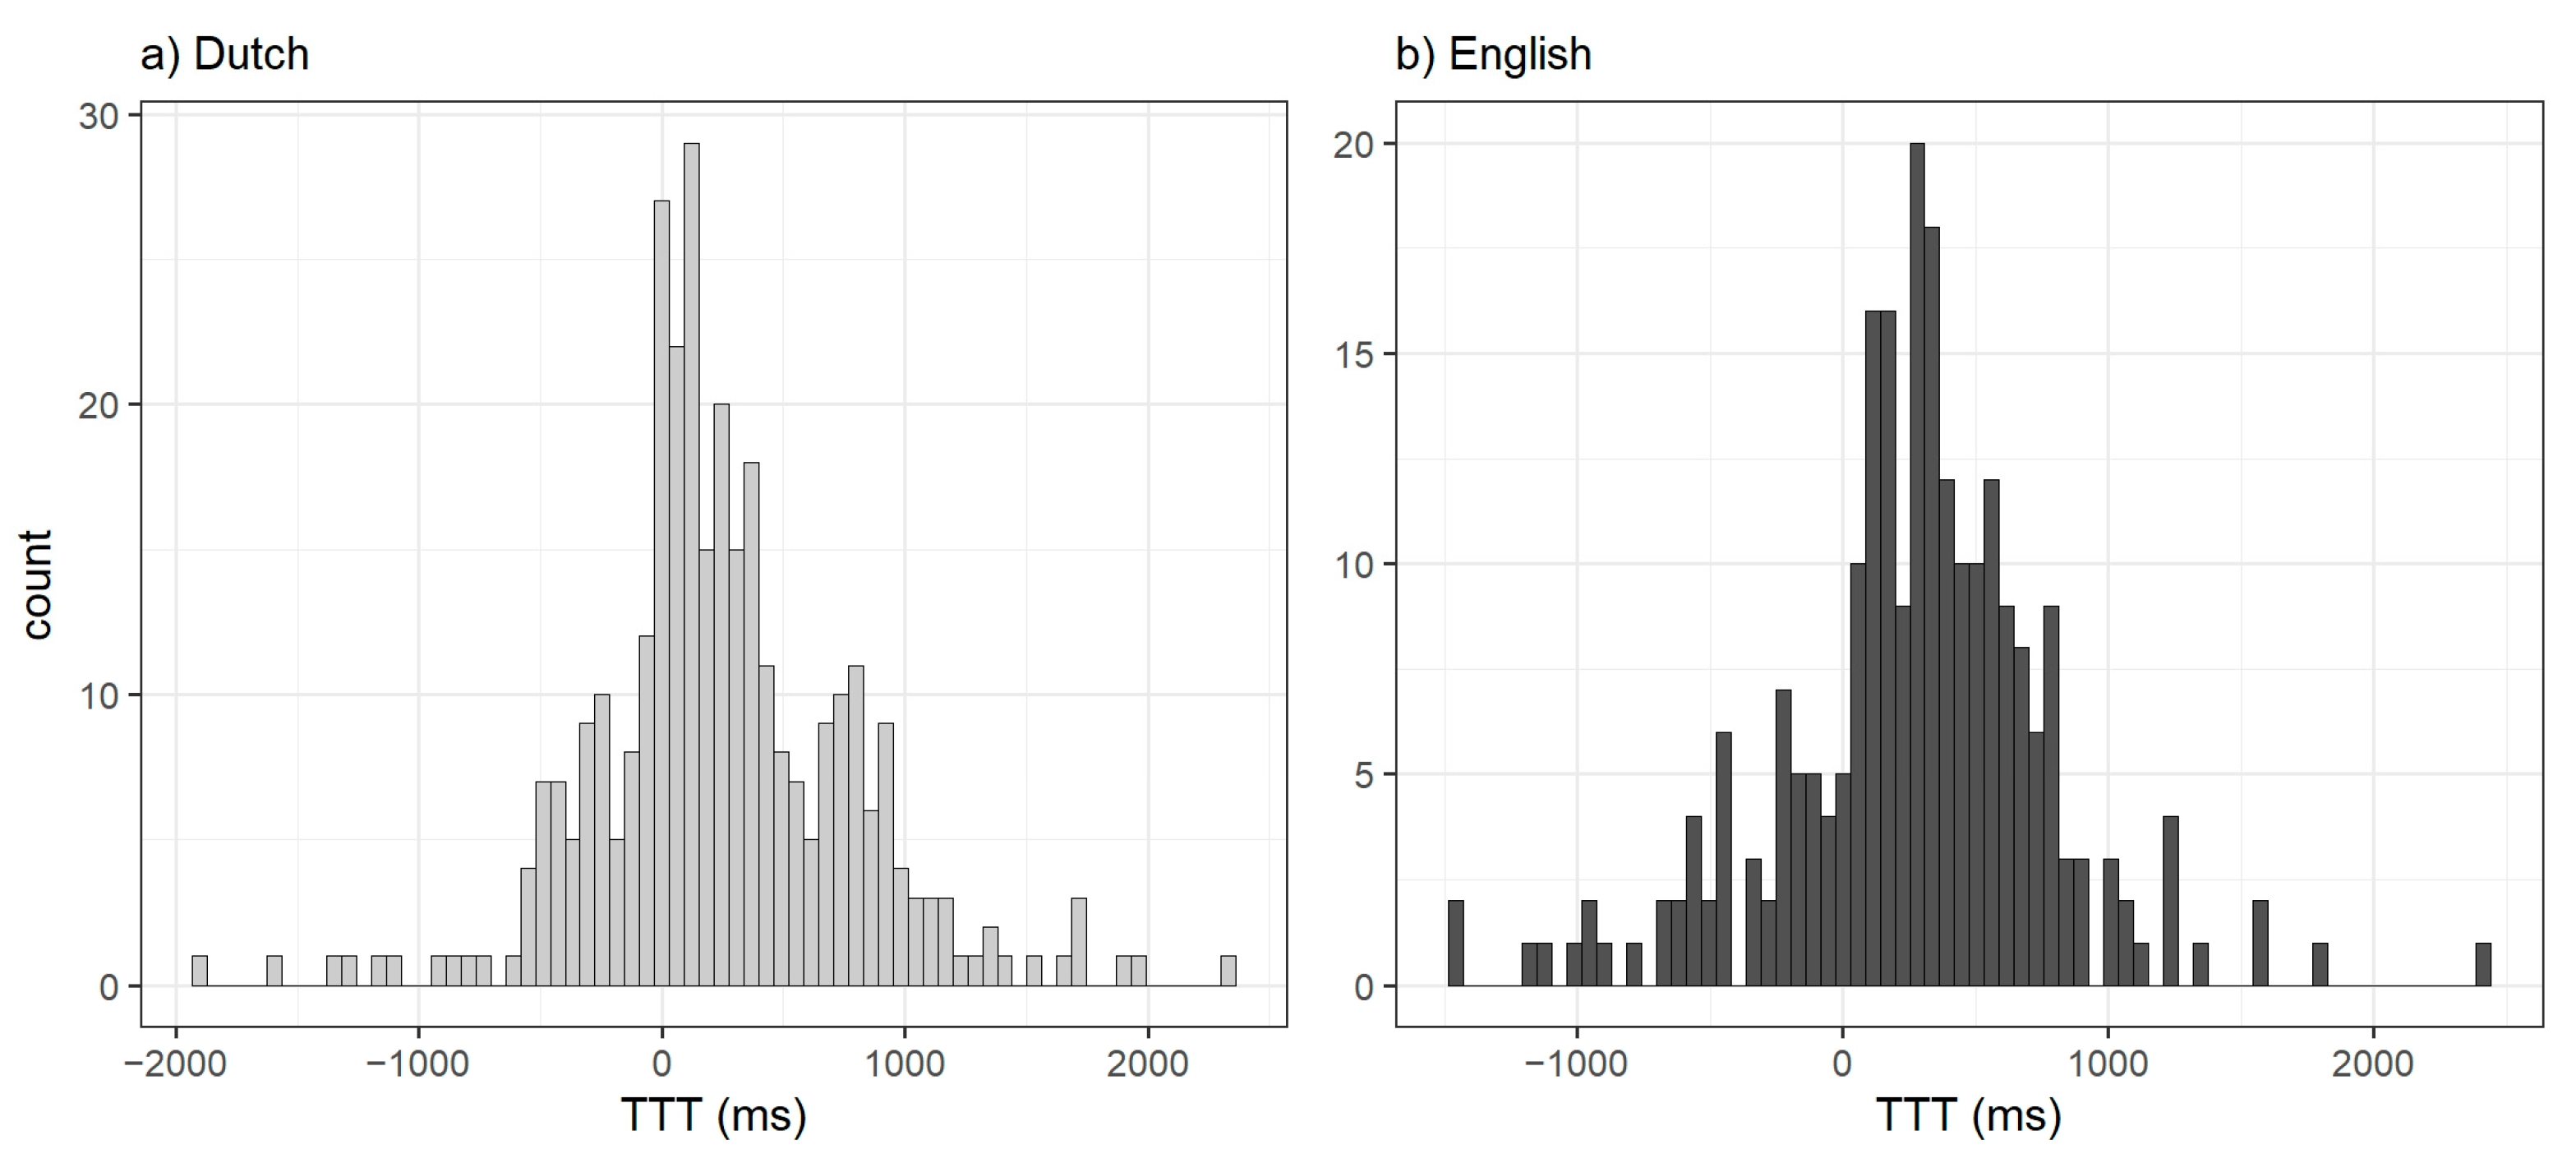
3.1. Descriptive Statistics
3.2. Inferential Statistics
3.2.1. Full Dataset
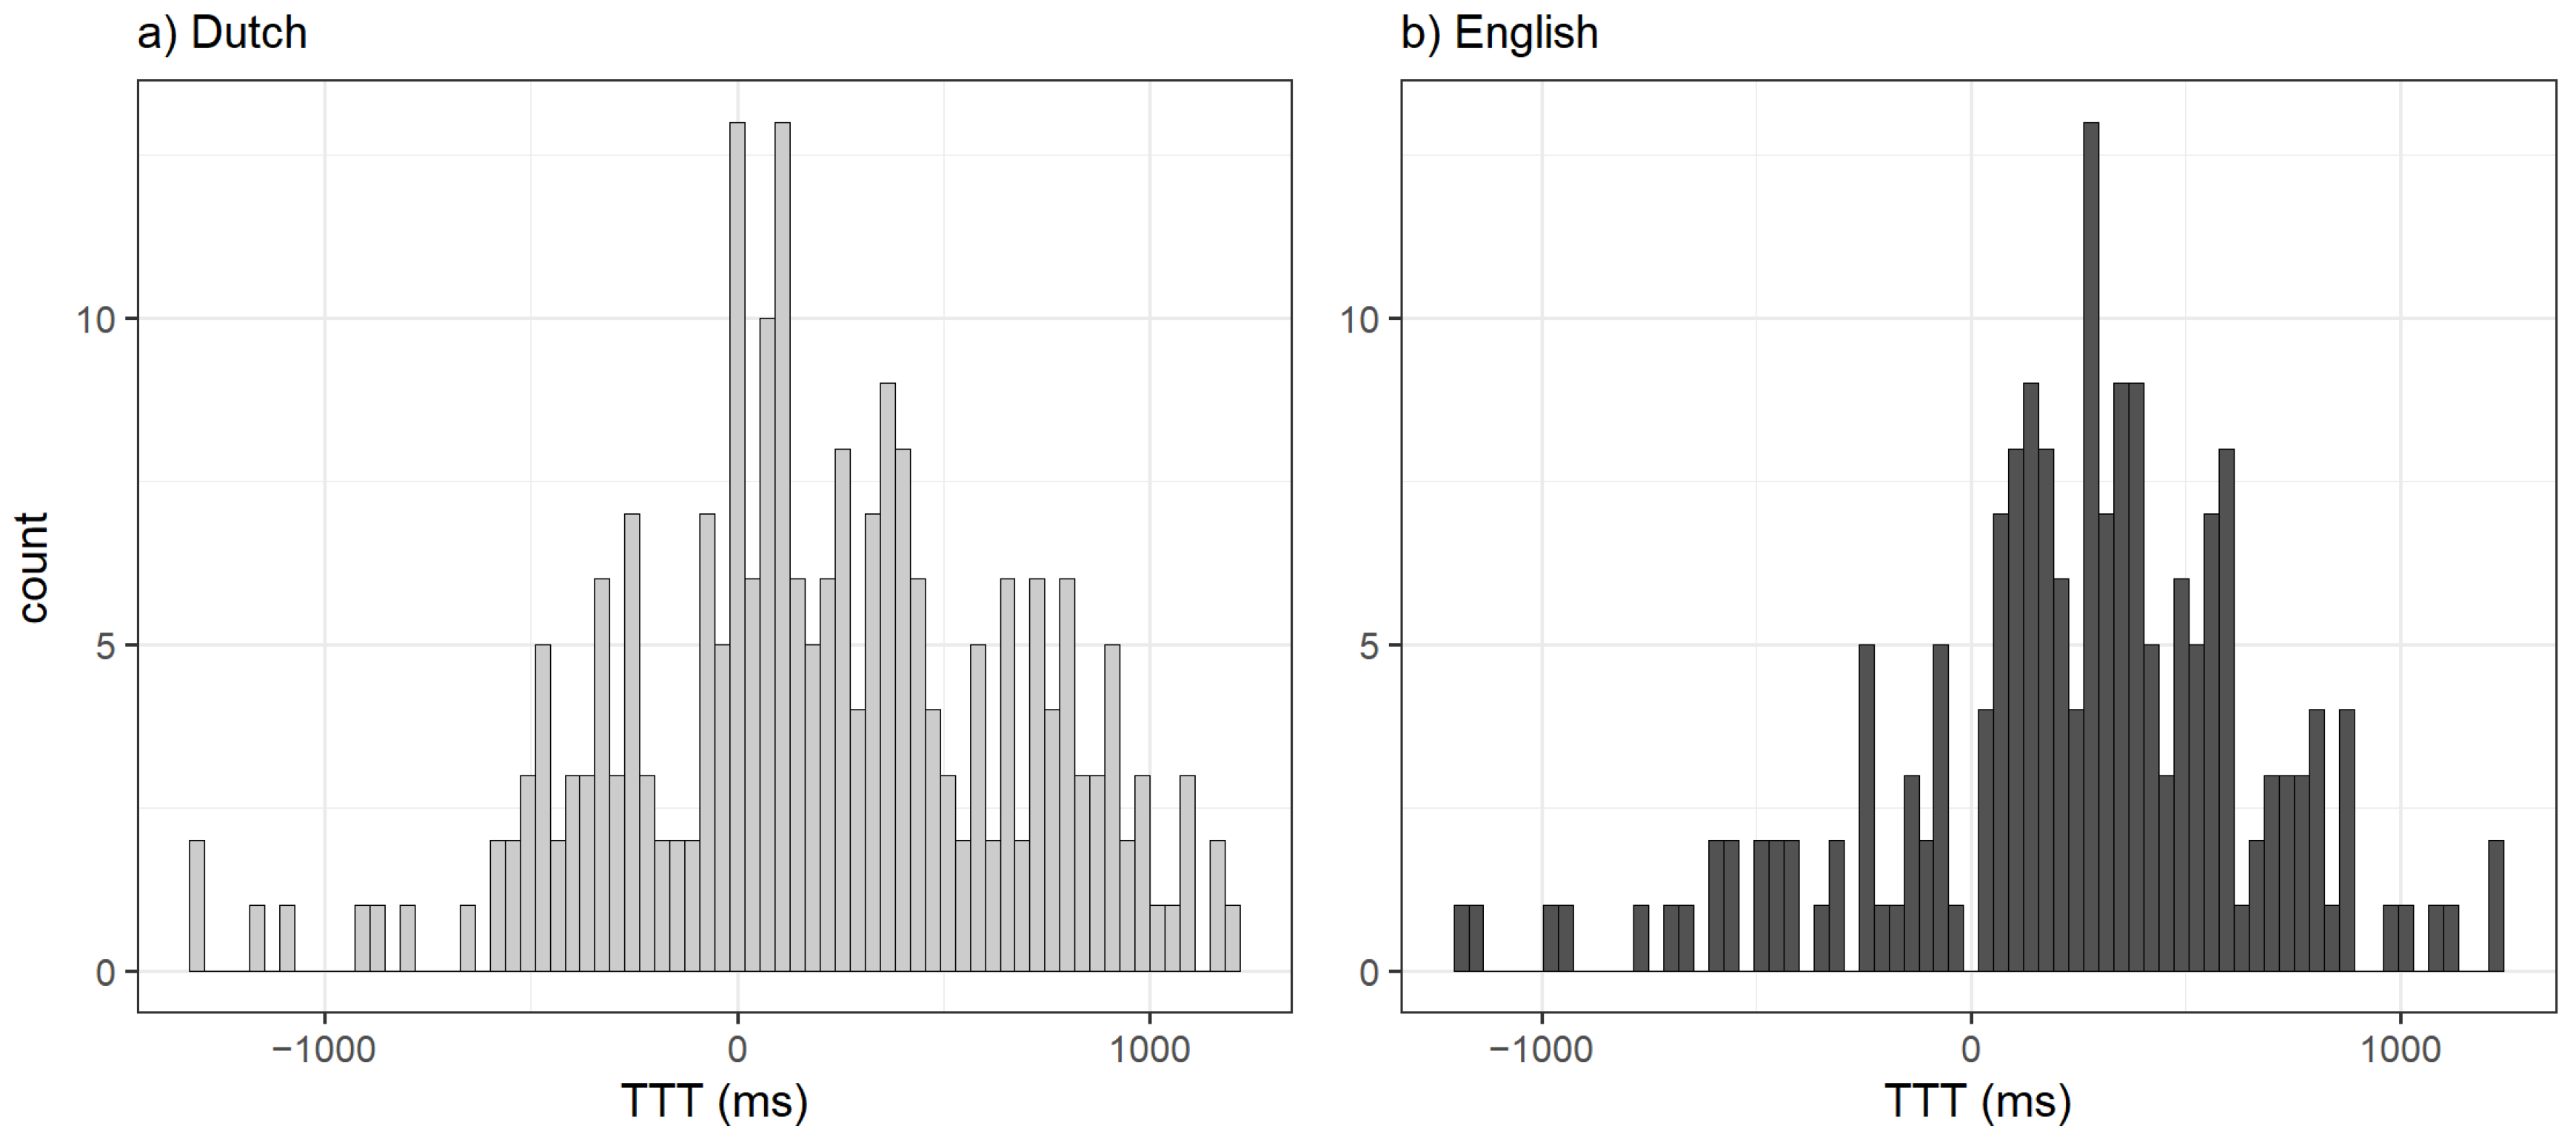
3.2.2. Gaps Only
3.2.3. Overlaps Only
4. Discussion
4.1. Speech Rate and Final Rhyme Duration as Predictors of TTT
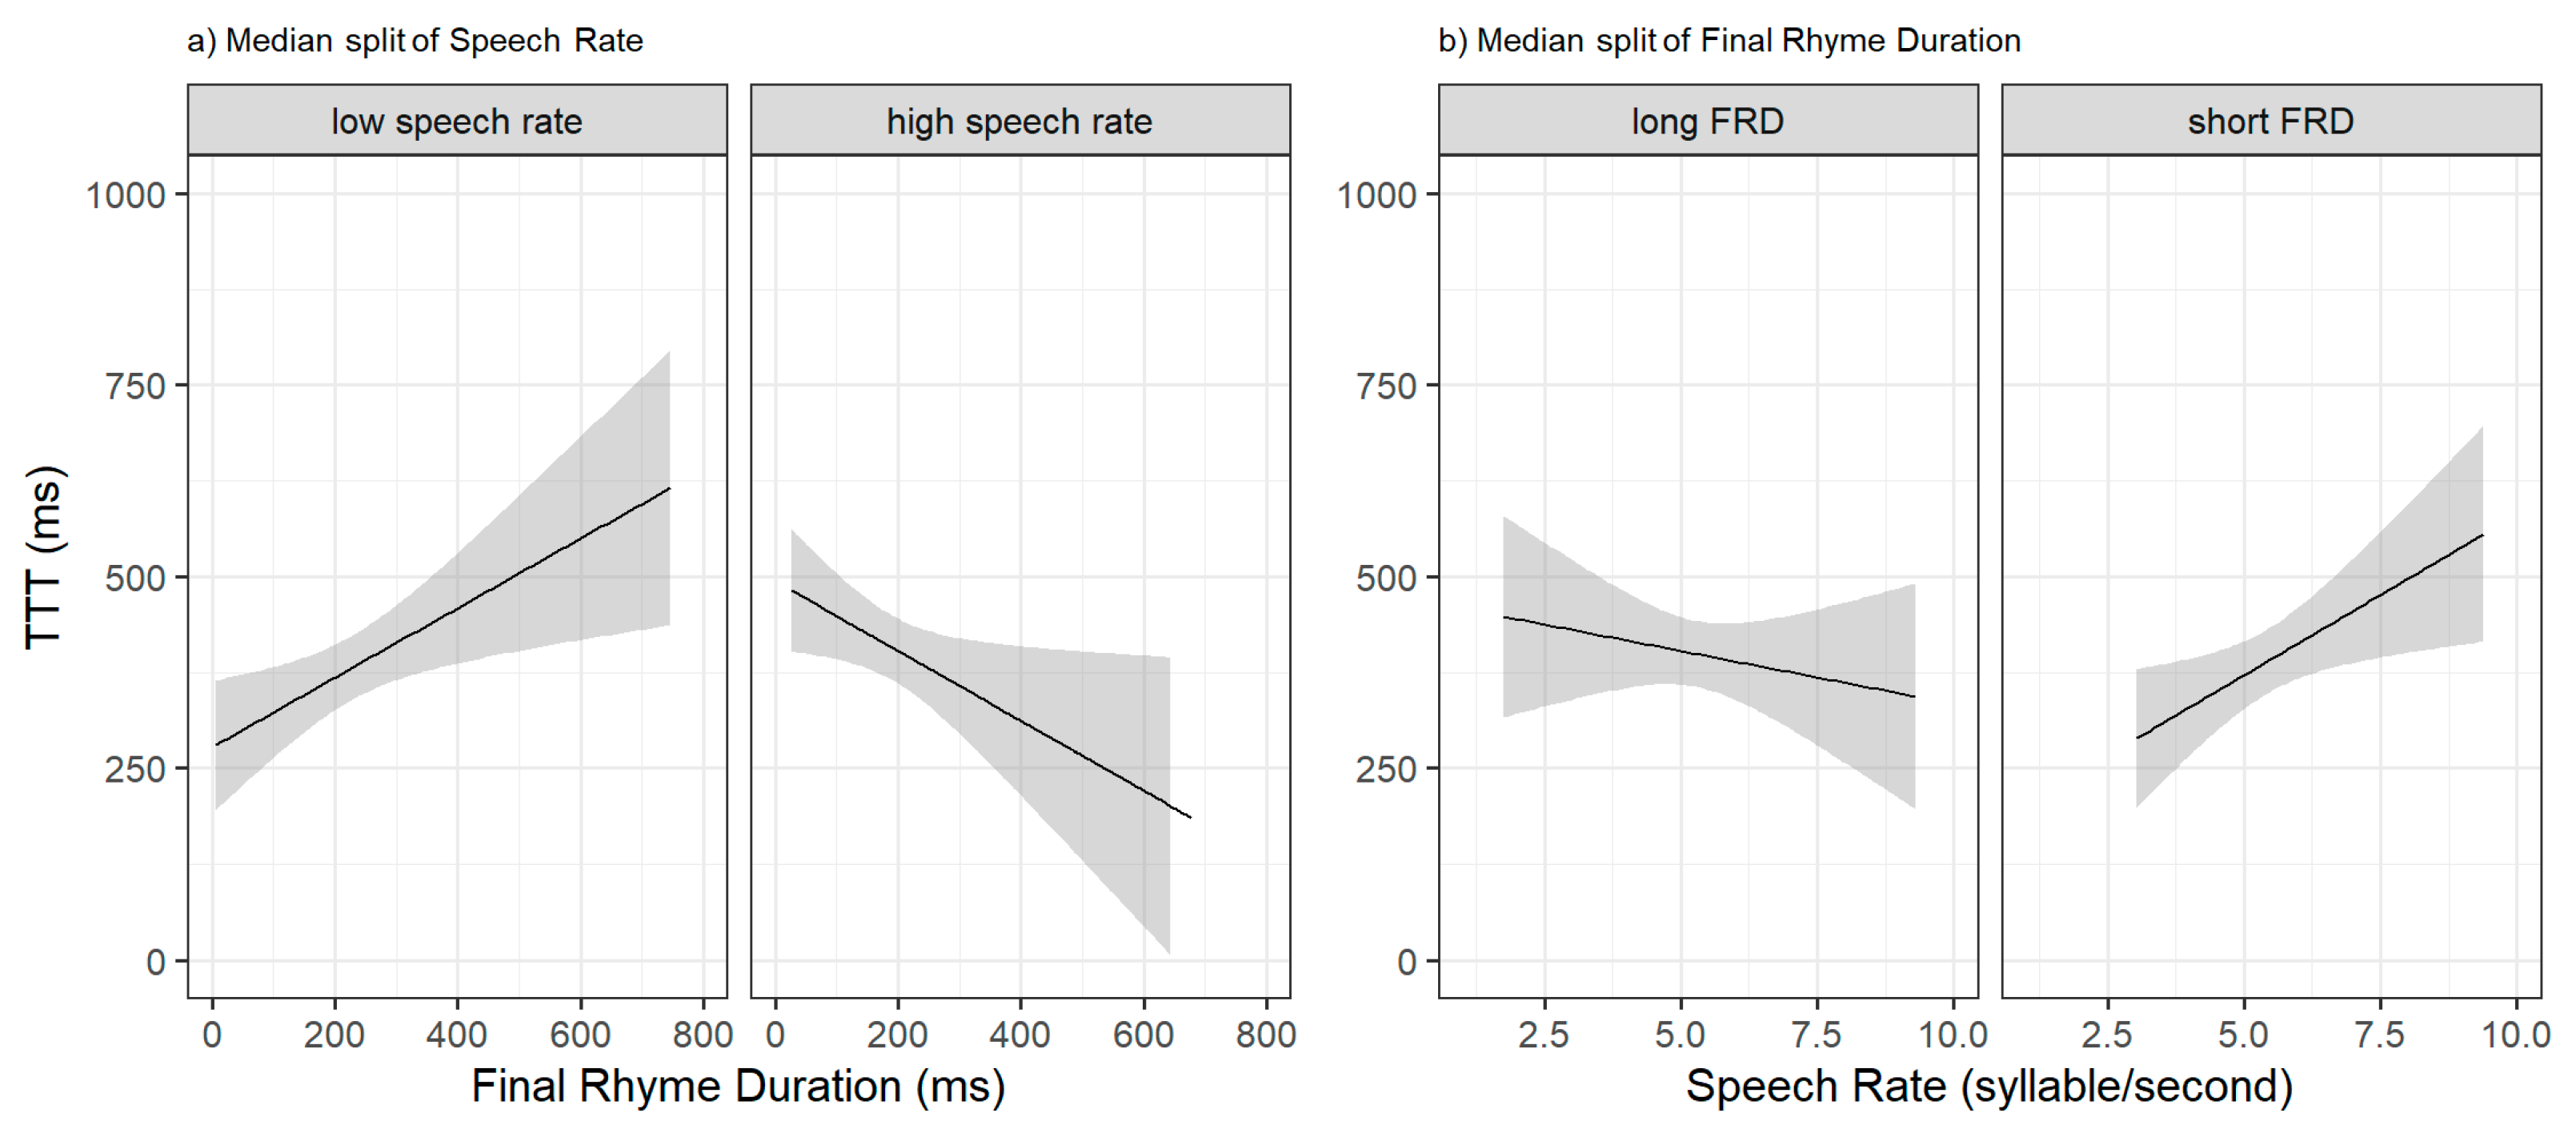
4.2. Speech Rate × Final Rhyme Interaction and TTT
4.3. Question Length and TTT
4.4. Question Type, Answer Type and TTT
4.5. Speech Rate × Question Type Interaction
4.6. Language and TTT
4.7. Observational vs. Experimental Studies
4.8. Timing of Gaps vs. Overlaps
5. Conclusions
Author Contributions
Funding
Institutional Review Board Statement
Informed Consent Statement
Data Availability Statement
Conflicts of Interest
Appendix A

References
- Akaike, Hirotogu. 1973. Information Theory as an Extension of the Maximum Likelihood Principle. In Second International Symposium on Information Theory. Budapest: Akademiai Kiado, pp. 276–81. [Google Scholar]
- Baese-Berk, Melissa M., Christopher C. Heffner, Laura C. Dilley, Mark A. Pitt, Tuuli H. Morrill, and J. Devin McAuley. 2014. Long-Term Temporal Tracking of Speech Rate Affects Spoken-Word Recognition. Psychological Science 25: 1546–53. [Google Scholar] [CrossRef] [PubMed]
- Bates, Douglas, Martin Mächler, Ben Bolker, and Steve Walker. 2015. Fitting Linear Mixed-Effects Models Using Lme4. Journal of Statistical Software 67: 1–48. [Google Scholar] [CrossRef]
- Beňuš, Štefan. 2009. Are We “in Sync”: Turn-Taking in Collaborative Dialogues. Paper presented at Tenth Annual Conference of the International Speech Communication Association, Brighton, UK, September 6–10. [Google Scholar]
- Berkovits, Rochele. 1994. Durational Effects in Final Lengthening, Gapping, and Contrastive Stress. Language and Speech 37: 237–50. [Google Scholar] [CrossRef] [PubMed]
- Bilmes, Jack. 1988. The Concept of Preference in Conversation Analysis. Language in Society 17: 161–81. [Google Scholar] [CrossRef]
- Boersma, Paul, and David Weenink. 2021. Praat: Doing Phonetics by Computer. Available online: http://www.praat.org/ (accessed on 21 March 2022).
- Bosker, Hans Rutger. 2017. Accounting for Rate-Dependent Category Boundary Shifts in Speech Perception. Attention, Perception, & Psychophysics 79: 333–43. [Google Scholar] [CrossRef]
- Bögels, Sara, Kobin H. Kendrick, and Stephen C. Levinson. 2020. Conversational Expectations Get Revised as Response Latencies Unfold. Language, Cognition and Neuroscience 35: 766–79. [Google Scholar] [CrossRef]
- Burle, Borís, and Michel Bonnet. 1999. What’s an Internal Clock for?: From Temporal Information Processing to Temporal Processing of Information. Behavioural Processes 45: 59–72. [Google Scholar] [CrossRef]
- Campbell, Nick. 2008. Individual Traits of Speaking Style and Speech Rhythm in a Spoken Discourse. In Lecture Notes in Computer Science (Including Subseries Lecture Notes in Artificial Intelligence and Lecture Notes in Bioinformatics). Berlin and Heidelberg: Springer, Volume 5042 LNAI, pp. 107–20. [Google Scholar] [CrossRef]
- Coffey, Emily B. J., Isabelle Arseneau-Bruneau, Xiaochen Zhang, Sylvain Baillet, and Robert J. Zatorre. 2021. Oscillatory Entrainment of the Frequency-Following Response in Auditory Cortical and Subcortical Structures. Journal of Neuroscience 41: 4073–87. [Google Scholar] [CrossRef]
- Corps, Ruth E., Birgit Knudsen, and Antje S. Meyer. 2022. Overrated Gaps: Inter-Speaker Gaps Provide Limited Information about the Timing of Turns in Conversation. Cognition 223: 105037. [Google Scholar] [CrossRef] [PubMed]
- Corps, Ruth E., Chiara Gambi, and Martin J. Pickering. 2020. How Do Listeners Time Response Articulation When Answering Questions? The Role of Speech Rate. Journal of Experimental Psychology: Learning, Memory, and Cognition 46: 781. [Google Scholar] [CrossRef] [PubMed]
- Corps, Ruth E., Martin J. Pickering, and Chiara Gambi. 2019. Predicting Turn-Ends in Discourse Context. Language, Cognition and Neuroscience 34: 615–27. [Google Scholar] [CrossRef]
- Ding, Nai, and Jonathan Z. Simon. 2014. Cortical Entrainment to Continuous Speech: Functional Roles and Interpretations. Frontiers in Human Neuroscience 8: 311. [Google Scholar] [CrossRef] [PubMed]
- Garrod, Simon, and Martin J. Pickering. 2015. The Use of Content and Timing to Predict Turn Transitions. Frontiers in Psychology 6: 1–12. [Google Scholar] [CrossRef] [PubMed]
- Heldner, Mattias, and Jens Edlund. 2010. Pauses, Gaps and Overlaps in Conversations. Journal of Phonetics 38: 555–68. [Google Scholar] [CrossRef]
- Kayser, Stephanie J., Robin A. A. Ince, Joachim Gross, and Christoph Kayser. 2015. Irregular Speech Rate Dissociates Auditory Cortical Entrainment, Evoked Responses, and Frontal Alpha. The Journal of Neuroscience 35: 14691–701. [Google Scholar] [CrossRef] [PubMed]
- Kendrick, Kobin H., and Francisco Torreira. 2015. The Timing and Construction of Preference: A Quantitative Study. Discourse Processes 52: 255–89. [Google Scholar] [CrossRef]
- Lehtonen, Jaakko, and Kari Sajavaara. 1985. The Silent Finn. In Perspectives on Silence. Norwood: Ablex Publishing Corporation. [Google Scholar]
- Levinson, Stephen C., and Francisco Torreira. 2015. Timing in Turn-Taking and Its Implications for Processing Models of Language. Frontiers in Psychology 6: 731. [Google Scholar] [CrossRef]
- Lin, Hua, and Qing Wang. 2007. Mandarin Rhythm: An Acoustic Study. Journal of Chinese Language and Computing 17: 127–40. [Google Scholar]
- Luo, Huan, and David Poeppel. 2007. Phase Patterns of Neuronal Responses Reliably Discriminate Speech in Human Auditory Cortex. Neuron 54: 1001–10. [Google Scholar] [CrossRef]
- Manson, Joseph H., Gregory A. Bryant, Matthew M. Gervais, and Michelle A. Kline. 2013. Convergence of Speech Rate in Conversation Predicts Cooperation. Evolution and Human Behavior 34: 419–26. [Google Scholar] [CrossRef]
- Meyer, Antje S., Phillip M. Alday, Caitlin Decuyper, and Birgit Knudsen. 2018. Working Together: Contributions of Corpus Analyses and Experimental Psycholinguistics to Understanding Conversation. Frontiers in Psychology 9: 525. [Google Scholar] [CrossRef]
- Morrill, Tuuli, Melissa Baese-Berk, Christopher Heffner, and Laura Dilley. 2015. Interactions between Distal Speech Rate, Linguistic Knowledge, and Speech Environment. Psychonomic Bulletin & Review 22: 1451–57. [Google Scholar]
- Müller, Jana A., Dorothea Wendt, Birger Kollmeier, Stefan Debener, and Thomas Brand. 2019. Effect of Speech Rate on Neural Tracking of Speech. Frontiers in Psychology 10: 449. [Google Scholar] [CrossRef] [PubMed]
- Oller, D. Kimbrough. 1973. The Effect of Position in Utterance on Speech Segment Duration in English. The Journal of the Acoustical Society of America 54: 1235–47. [Google Scholar] [CrossRef] [PubMed]
- Price, Patti J., Mari Ostendorf, Stefanie Shattuck-Hufnagel, and Cynthia Fong. 1991. The Use of Prosody in Syntactic Disambiguation. The Journal of the Acoustical Society of America 90: 2956–70. [Google Scholar] [CrossRef]
- Reinisch, Eva, Alexandra Jesse, and James M. McQueen. 2011. Speaking Rate Affects the Perception of Duration as a Suprasegmental Lexical-Stress Cue. Language and Speech 54: 147–65. [Google Scholar] [CrossRef]
- Roberts, Felicia, and Alexander L. Francis. 2013. Identifying a Temporal Threshold of Tolerance for Silent Gaps after Requests. Journal of the Acoustical Society of America 133: EL471–77. [Google Scholar] [CrossRef]
- Roberts, Felicia, Piera Margutti, and Shoji Takano. 2011. Judgments Concerning the Valence of Inter-Turn Silence across Speakers of American English, Italian, and Japanese. Discourse Processes 48: 331–54. [Google Scholar] [CrossRef]
- Roberts, Sean, Francisco Torreira, and Stephen C. Levinson. 2015. The Effects of Processing and Sequence Organization on the Timing of Turn Taking: A Corpus Study. Frontiers in Psychology 6: 509. [Google Scholar] [CrossRef]
- Stivers, Tanya, Nicholas J. Enfield, Penelope Brown, Christina Englert, Makoto Hayashi, Trine Heinemann, Gertie Hoymann, Federico Rossano, Jan Peter de Ruiter, Kyung-Eun Yoon, and et al. 2009. Universals and Cultural Variation in Turn-Taking in Conversation. Proceedings of the National Academy of Sciences 106: 10587–92. [Google Scholar] [CrossRef] [PubMed]
- Street, Richard L. 1984. Speech Convergence and Speech Evaluation in Fact-Finding Interviews. Human Communication Research 11: 139–69. [Google Scholar] [CrossRef]
- Templeton, Emma M., Luke J. Chang, Elizabeth A. Reynolds, Marie D. Cone LeBeaumont, and Thalia Wheatley. 2022. Fast Response Times Signal Social Connection in Conversation. Proceedings of the National Academy of Sciences of the United States of America 119: e2116915119. [Google Scholar] [CrossRef] [PubMed]
- Torreira, Francisco, and Sara Bögels. 2022. Vocal Reaction Times to Speech Offsets: Implications for Processing Models of Conversational Turn-Taking. Journal of Phonetics 94: 101175. [Google Scholar] [CrossRef]
- Van Bree, Sander, Ediz Sohoglu, Matthew H. Davis, and Benedikt Zoefel. 2021. Sustained Neural Rhythms Reveal Endogenous Oscillations Supporting Speech Perception. PLoS Biology 19: e3001142. [Google Scholar] [CrossRef] [PubMed]
- Van Son, Rob, Wieneke Wesseling, Eric Sanders, and Henk van den Heuvel. 2008. The IFADV Corpus: A Free Dialog Video Corpus. Paper presented at Sixth International Conference on Language Resources and Evaluation (LREC’08), Marrakech, Morocco, May 28–30; pp. 501–8. [Google Scholar]
- Wesseling, Wieneke, and Rob J. J. H. van Son. 2005. Early Preparation of Experimentally Elicited Minimal Responses. Paper presented at 6th SIGdial Workshop on Discourse and Dialogue, Lisbon, Portugal, September 2–3. [Google Scholar]
- White, Laurence. 2014. Communicative Function and Prosodic Form in Speech Timing. Speech Communication 63: 38–54. [Google Scholar] [CrossRef]
- White, Laurence, and Sven L. Mattys. 2007. Calibrating Rhythm: First Language and Second Language Studies. Journal of Phonetics 35: 501–22. [Google Scholar] [CrossRef]
- White, Laurence, Sven Mattys, and Lukas Wiget. 2012. Segmentation Cues in Conversational Speech: Robust Semantics and Fragile Phonotactics. Frontiers in Psychology 3: 375. [Google Scholar] [CrossRef]
- White, Laurence, Sven Mattys, Sarah Knight, Tess Saunders, and Laura Macbeath. 2022. Temporal Expectations and the Interpretation of Timing Cues to Word Boundaries. Proceedings Speech Prosody 2022: 322–26. [Google Scholar]
- Wilson, Margaret, and Thomas P. Wilson. 2005. An Oscillator Model of the Timing of Turn-Taking. Psychonomic Bulletin & Review 12: 957–68. [Google Scholar] [CrossRef]
- Wilson, Thomas P., and Don H. Zimmerman. 1986. The Structure of Silence between Turns in Two-Party Conversation. Discourse Processes 9: 375–90. [Google Scholar] [CrossRef]
- Xu, Qin, and Datian Ye. 2015. Temporal Integration Reflected by Frequency Following Response in Auditory Brainstem. Bio-Medical Materials and Engineering 26: S767–78. [Google Scholar] [CrossRef] [PubMed]


| Transition Type | Both Languages | English | Dutch |
|---|---|---|---|
| Gaps | 304 (428) | 145 (189) | 159 (239) |
| Overlaps | 109 (140) | 38 (53) | 71 (87) |
| Total | 413 (568) | 183 (242) | 230 (326) |
| Corpus | Mean TTT in ms | Highest Density in ms |
|---|---|---|
| Both languages | 218 (252) | 74 (124) |
| English | 242 (264) | 279 (281) |
| Dutch | 199 (244) | 0 (123) |
| Corpus | Question Length (No. of Syllables) | Speech Rate (Syllables/s) | Final Rhyme Duration (ms) |
|---|---|---|---|
| Both languages | 9.5 (8.3) | 5.3 (5.0) | 196 (200) |
| English | 9.0 (8.1) | 4.9 (4.7) | 212 (212) |
| Dutch | 9.8 (8.4) | 5.6 (5.2) | 183 (190) |
| Model | AIC | AIC Difference vs. Final Model | χ2 | p-Value | Effect on Turn-Transition Time (TTT) |
|---|---|---|---|---|---|
| Final | 6204.0 | ||||
| - Speech Rate | 6204.3 | +0.3 | 2.38 | 0.12 | N/A |
| - Answer Type | 6213.5 | +9.5 | 11.49 | <0.001 | “Answer” responses <=> shorter TTT |
| - Question Type | 6212.9 | +8.9 | 10.96 | <0.001 | Polar questions <=> shorter TTT |
| - Question Length | 6205.3 | +1.3 | 3.36 | 0.07 | Longer questions <=> shorter TTT |
| - Question Type × Speech Rate | 6209.1 | +5.1 | 7.14 | <0.001 | Polar questions: higher Speech Rate <=> longer TTT Non-polar questions: higher Speech Rate <=> shorter TTT |
| Model | AIC | AIC Difference vs. Final Model | χ2 | p-Value | Effect on Turn-Transition Time (TTT) |
|---|---|---|---|---|---|
| Final | 4306.82 | ||||
| - Speech Rate | 4307.42 | +0.6 | 2.60 | 0.11 | N/A |
| - Final Rhyme Duration | 4307.70 | +0.9 | 2.88 | 0.09 | Longer Final Rhyme<=>longer TTT |
| - Speech Rate x Final Rhyme Duration | 4306.76 | −0.1 | 1.94 | 0.16 | N/A |
| - Question Type | 4321.65 | +14.8 | 16.83 | <0.001 | Polar questions <=> shorter TTT |
Disclaimer/Publisher’s Note: The statements, opinions and data contained in all publications are solely those of the individual author(s) and contributor(s) and not of MDPI and/or the editor(s). MDPI and/or the editor(s) disclaim responsibility for any injury to people or property resulting from any ideas, methods, instructions or products referred to in the content. |
© 2023 by the authors. Licensee MDPI, Basel, Switzerland. This article is an open access article distributed under the terms and conditions of the Creative Commons Attribution (CC BY) license (https://creativecommons.org/licenses/by/4.0/).
Share and Cite
Hoogland, D.; White, L.; Knight, S. Speech Rate and Turn-Transition Pause Duration in Dutch and English Spontaneous Question-Answer Sequences. Languages 2023, 8, 115. https://doi.org/10.3390/languages8020115
Hoogland D, White L, Knight S. Speech Rate and Turn-Transition Pause Duration in Dutch and English Spontaneous Question-Answer Sequences. Languages. 2023; 8(2):115. https://doi.org/10.3390/languages8020115
Chicago/Turabian StyleHoogland, Damar, Laurence White, and Sarah Knight. 2023. "Speech Rate and Turn-Transition Pause Duration in Dutch and English Spontaneous Question-Answer Sequences" Languages 8, no. 2: 115. https://doi.org/10.3390/languages8020115