1. Introduction
Since 2019, many countries and space agencies have proposed Venus missions using balloons to study the cloud layers, atmosphere and more recently, the habitability for life in the Venusian clouds [
1,
2,
3,
4,
5]. All proposed missions are based around a main large balloon concept, some with deployable secondary probes.
An under-explored need for a small, lightweight sampling system was identified to run alongside a main balloon mission concept as part of the Venus Life Finder (VLF) Missions [
6], in order to increase the sample target areas in the Venusian cloud layer and increase the chance of discovering biosignature gas markers.
The first of these VLF missions will be a privately funded mission by Rocket Lab [
7]. Rocket Labs’ proposed Photon craft payload is 170 kg to LEO and for this untested mission to Venus, Rocket Labs calculate the Photon craft’s kick stage could carry a 15–20 kg payload. This payload will increase on later missions from NASA [
5]. Smaller, secondary sampling delivery systems would need to fit inside or alongside the main payload yet be able to be deployed in the Venusian atmosphere and withstand the hostile environment. In order to maximise the available payload and fit within the parameters of this mission, the authors proposed a <1 kg target mass for the LEVL probe. The proposed payload for the MEMS instrumentation is 340 g [
8], giving a target for the additional mass to create the LEVL probe body and wing. Calculations so far show that the LEVL can be built to a mass of 920 g, well within the original <1 kg target. Any subsequent Venus missions with a larger available payload will enable the use of more, or larger, LEVL probes. The LEVL probe would need a long enough flight time to run a 10-min MEMS micro-spectrometer cycle. The full 10 min cycle identifies the composition of gaseous and liquid samples, based on the optical spectra of plasma generated in the MEMS ion spectrometer. For examples of microelectromechanical systems (MEMS) instruments in this category see the VLF mission study [
6] and [
8,
9].
Initial ideas considered in this study include deploying probes (VLF Mission Study [
6]) by parachute. Parachutes can fail to open or operate at less than 100% efficiency. For example, the weight of precipitation can change the way a parachute flies and severe turbulence can partially or completely collapse the canopy. As precipitation and turbulent winds are both present in the Venusian atmosphere, other, simpler approaches needed to be considered. Inspired by nature, investigation has been conducted into the mechanism of free-falling sycamore seed distribution and the way in which a single-winged seed can create lift, thus prolonging its flight time and allowing it to travel far from the parent tree.
In addition, it should be noted that the rotational motion and resultant centripetal acceleration could be used to maintain flow within the sample analysis system and, for example, prevent clogging by particulates.
A literature review identified key publications [
10,
11] suggesting that leading-edge vortex lift (LEVL) is responsible for the performant flight of maple, sycamore and similar seeds. A model based on the lift equation [
12] enables predictions of the performance of single-winged objects with varying intrinsic properties under different extrinsic conditions.
This work builds on a study of the flight of falling maple seeds [
13] to build a library of single-winged flight data, in addition to testing at a wide range of scales by the authors. Data on the Venusian atmosphere and its density [
14] was used to predict flight times of the sample probe concept based on final design mass and wing area.
An initial investigation has also been made into the feasibility of constructing a probe of the required mass showing that this probe design appears to be viable, offering a flight time long enough to run the 10-min atmosphere analysis during transit through the Venusian cloud layer and relay the results back to an orbiter.
2. Theory—Lift Equation
The lift equation for a wing may be given by
where
L is the lift force,
CL is the coefficient of lift,
ρ is the fluid density,
vfwd is the airspeed, and
A is the planform area of the wing.
At terminal velocity mg =
L, where m is the mass of the body and
g is the local acceleration due to gravity, hence Equation (1) can rearranged to give:
Intrinsic and Extrinsic Components
Equation (2) can be divided into intrinsic and extrinsic components,
Cint and
Cext; that is, those attributable to the craft in question (mass, area, lift coefficient) and planetary or atmospheric characteristics (acceleration due to gravity, atmospheric density), respectively. There are therefore two equations of proportionality:
where
and
where
Assuming that the coefficient of lift is constant for craft with similar geometry irrespective of scale, thus reducing the intrinsic components to mass and area, Equation (4) can be simplified to
The relationships in Equations (6) and (7) are used in the following pages to build and test a steady-state model. It is very important to note that these relationships deal with airspeed—forward velocity—and not with the vertical component of the terminal velocity of a falling seed. However, they provided the authors with impetus to explore the correlations between the average vertical falling speed of various single-wing items—items with differing masses covering almost two orders of magnitude—and the intrinsic component, with surprising results.
Most usefully, these relationships enable comparisons between the performance of a body under available experimental conditions—Earth atmosphere at approximately sea-level—and under the conditions of interest—those on Venus at altitudes covering the cloud layer.
3. Materials and Methods
3.1. Pre-Existing Data
A literature review uncovered several papers describing tests on maple or sycamore seeds. Most interesting was a paper [
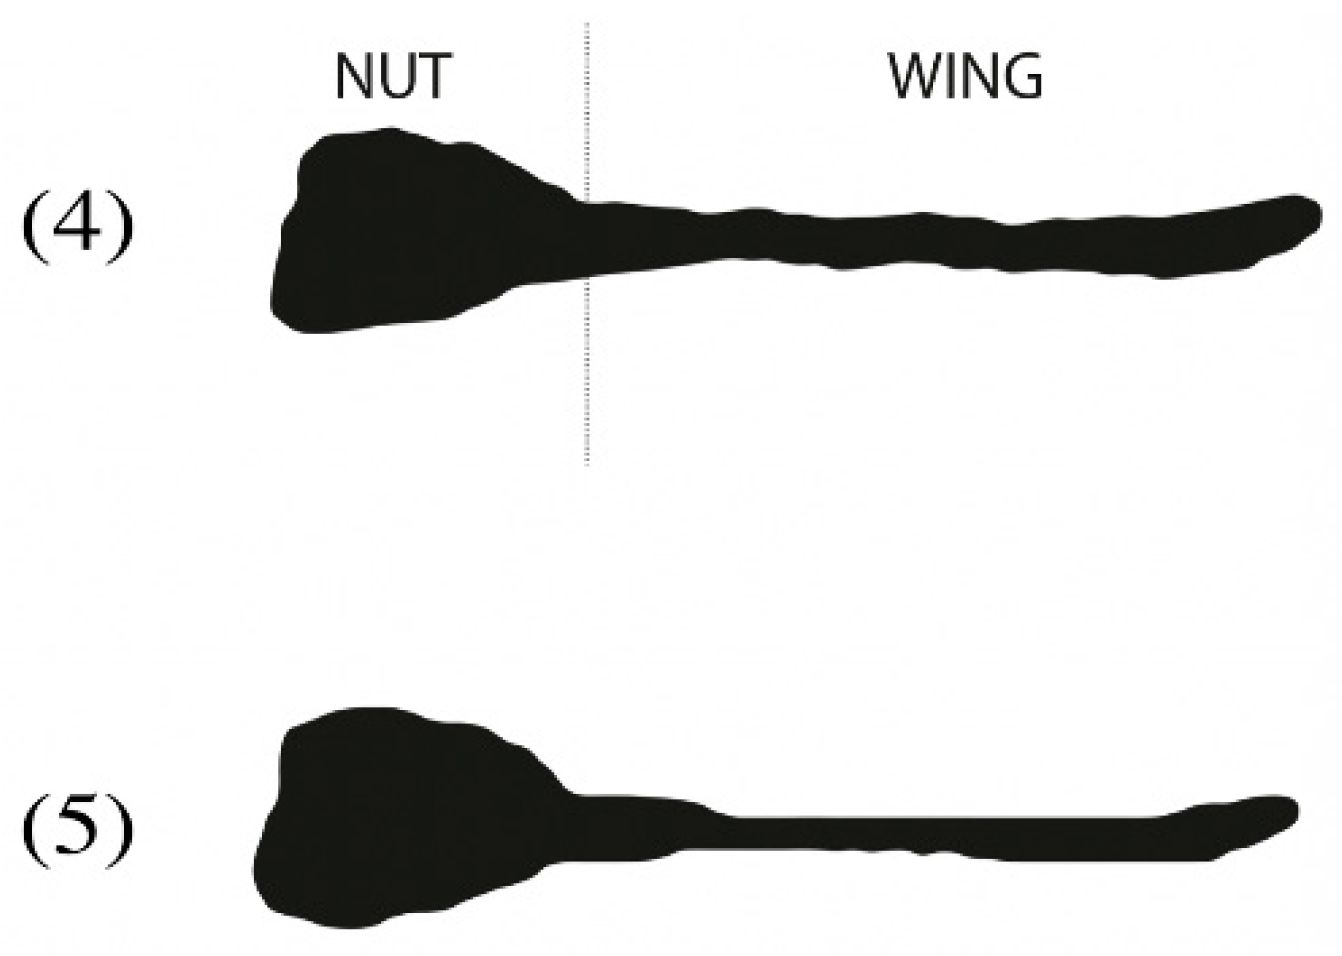
13] describing the flight characteristics of a pair of maple seeds subject to significant modifications of both the wing and the nut (
Table 1). See below for wing and nut definition (
Figure 1).
Examination of this data could provide support to the hypothesis that the intrinsic component could be a sufficient parameter to define the terminal velocity of a single-winged seed.
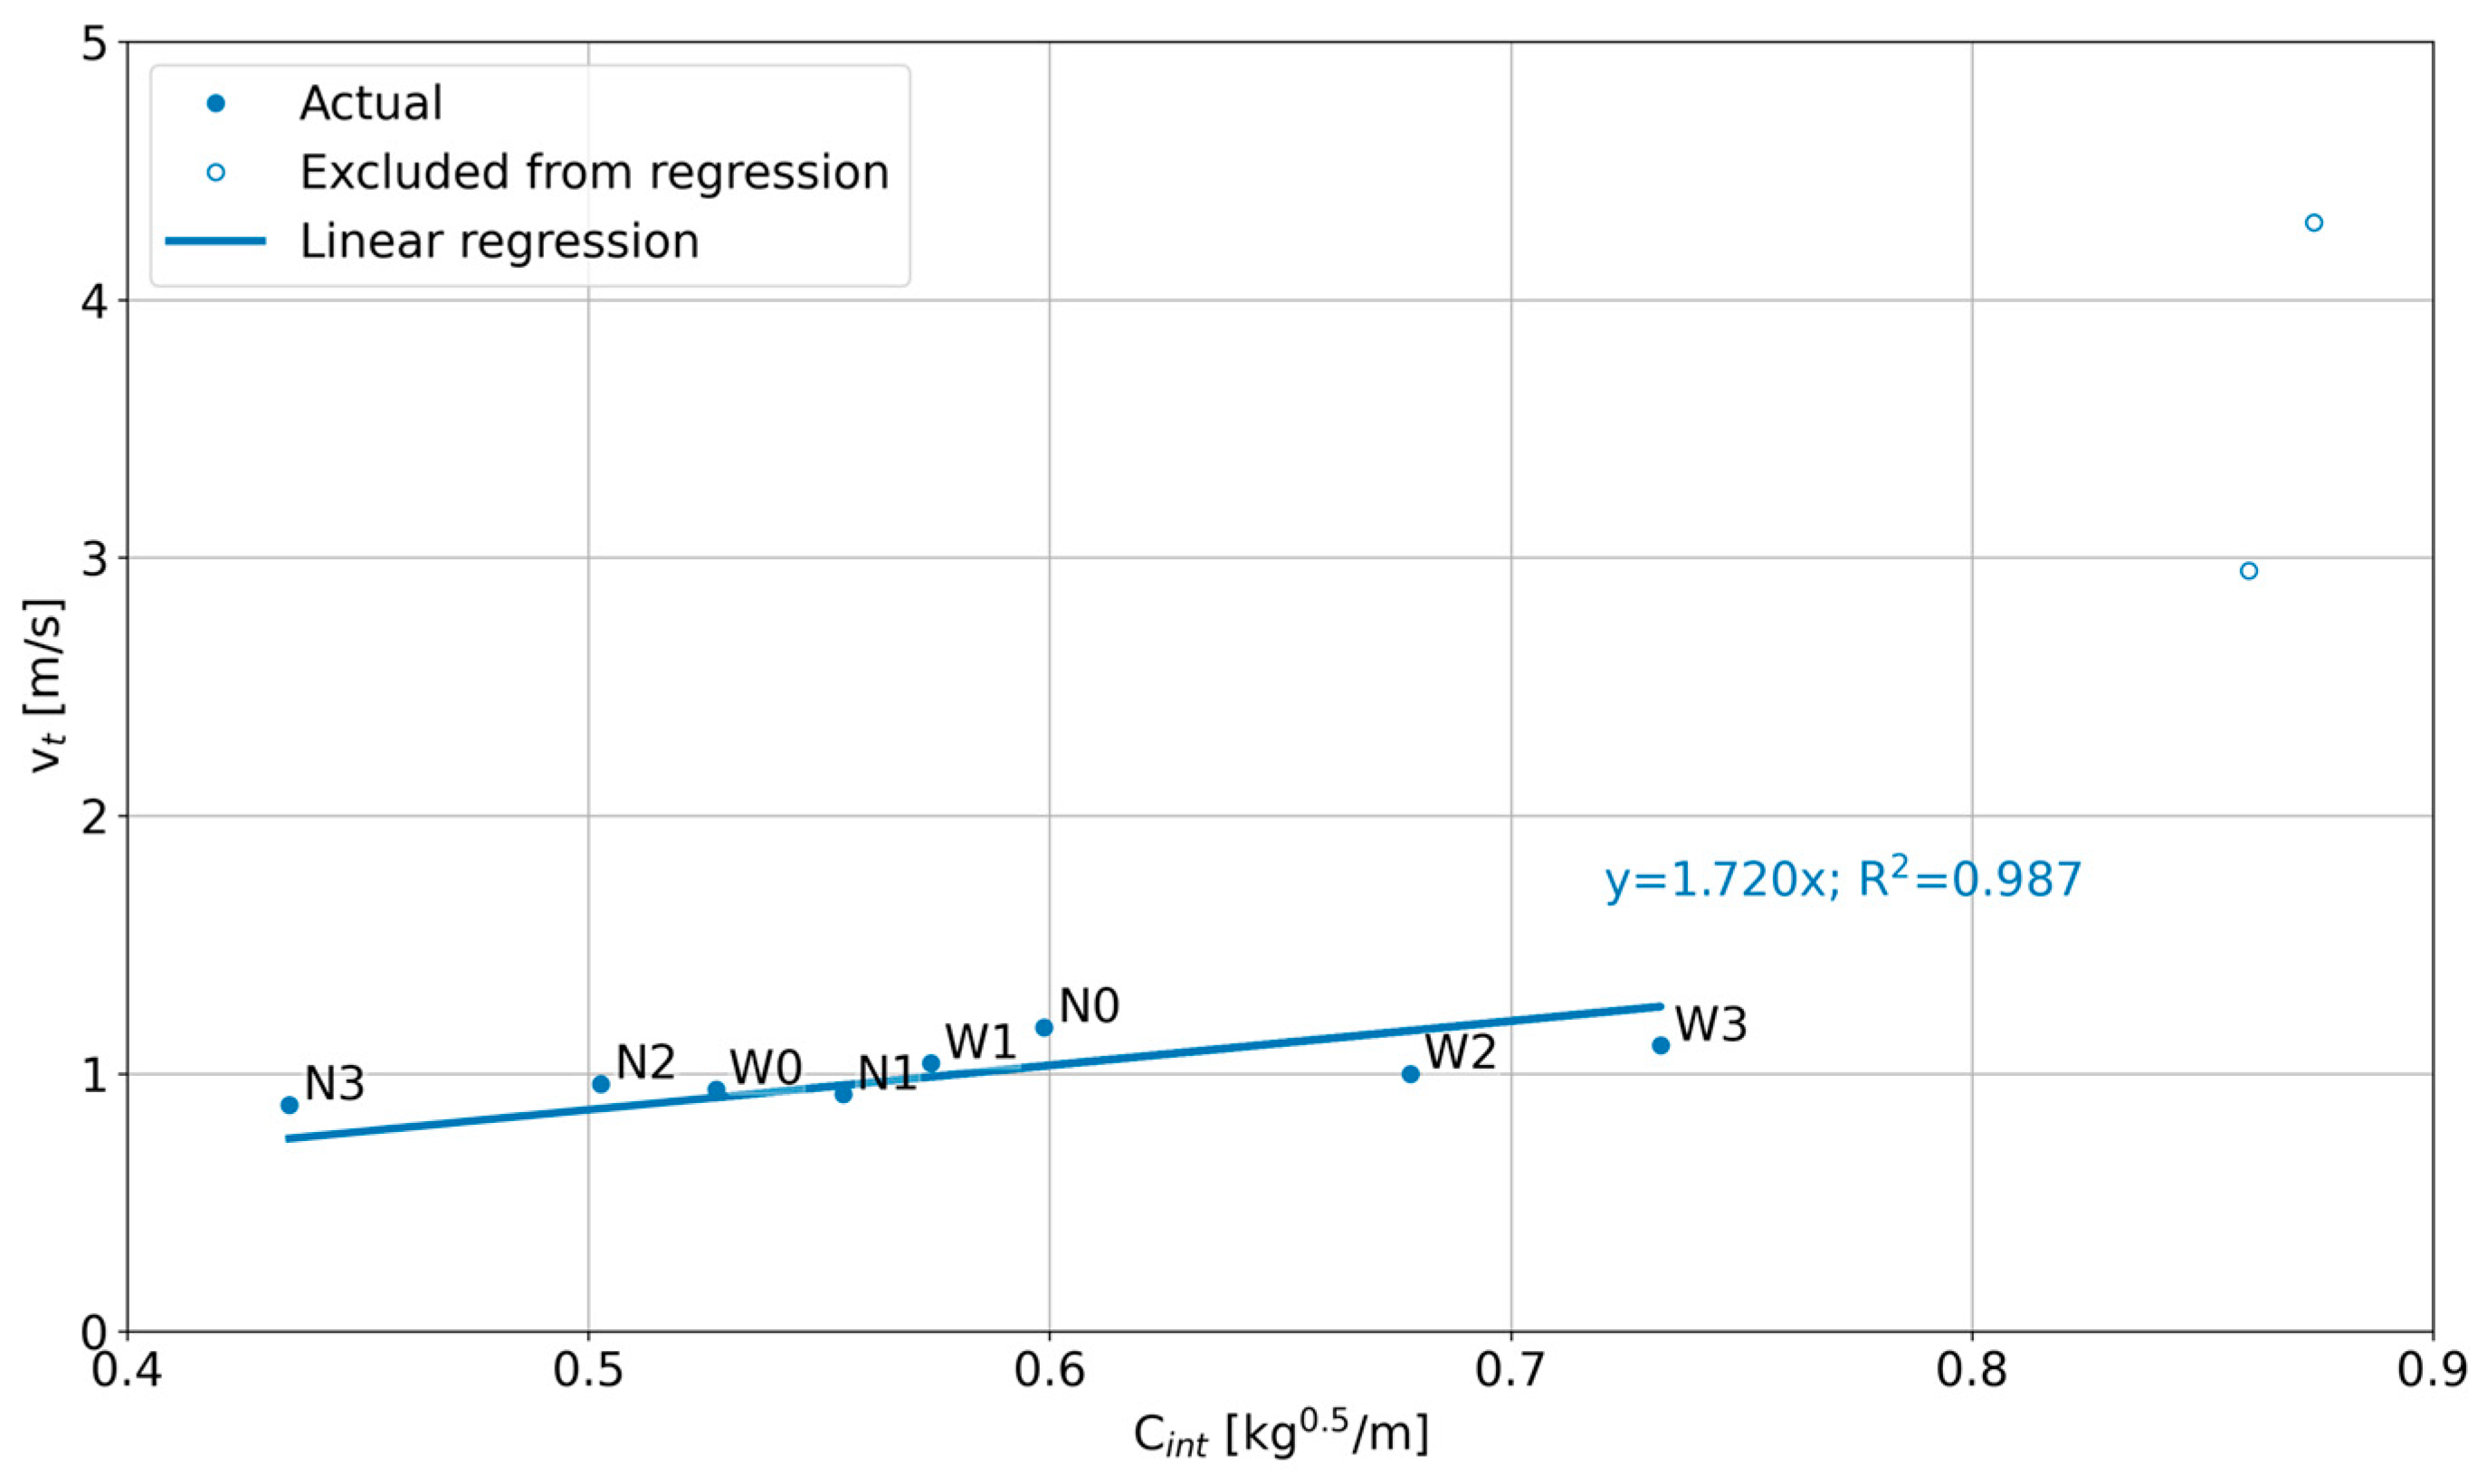
Calculating the intrinsic component and plotting this against terminal velocity yields the results shown (
Figure 2). The datapoints are labelled according to the IDs shown in
Table 1. “N0” and “W0” are the original seeds which were progressively modified by removing nut material or wing material, respectively. Removing wing material reduces the area, causing
Cint to increase (pushing points to the right); removing nut material reduces the mass, causing
Cint to decrease (pushing points to the left). If the coefficient of lift,
CL, is unaffected by these modifications (especially the modifications of the wing), it would be expected that these points should lie on a straight line. Visual inspection of the data confirmed by linear regression shows that, indeed, the data for N0–N3 and W0–W3 does lie on a line. Observing that data points W4 and W5 (
Figure 1), the most heavily modified wing samples, do begin to deviate from this straight line should give pause for caution if the ultimate probe design deviates heavily from the conventional sycamore seed characteristics.
3.2. Venusian Gravity and Atmospheric Density
Data has been obtained from the literature [
14] for the density and temperature of the Venusian atmosphere (
Figure 3). The key region of interest for VLF atmosphere sampling is the Venusian cloud layer between the cloud deck (VT) and the cloud base (VB). The atmospheric temperature is not immediately relevant to the flight model but is shown here since it does affect material selection. The acceleration due to gravity on Venus is ≈8.87 m/s
2.
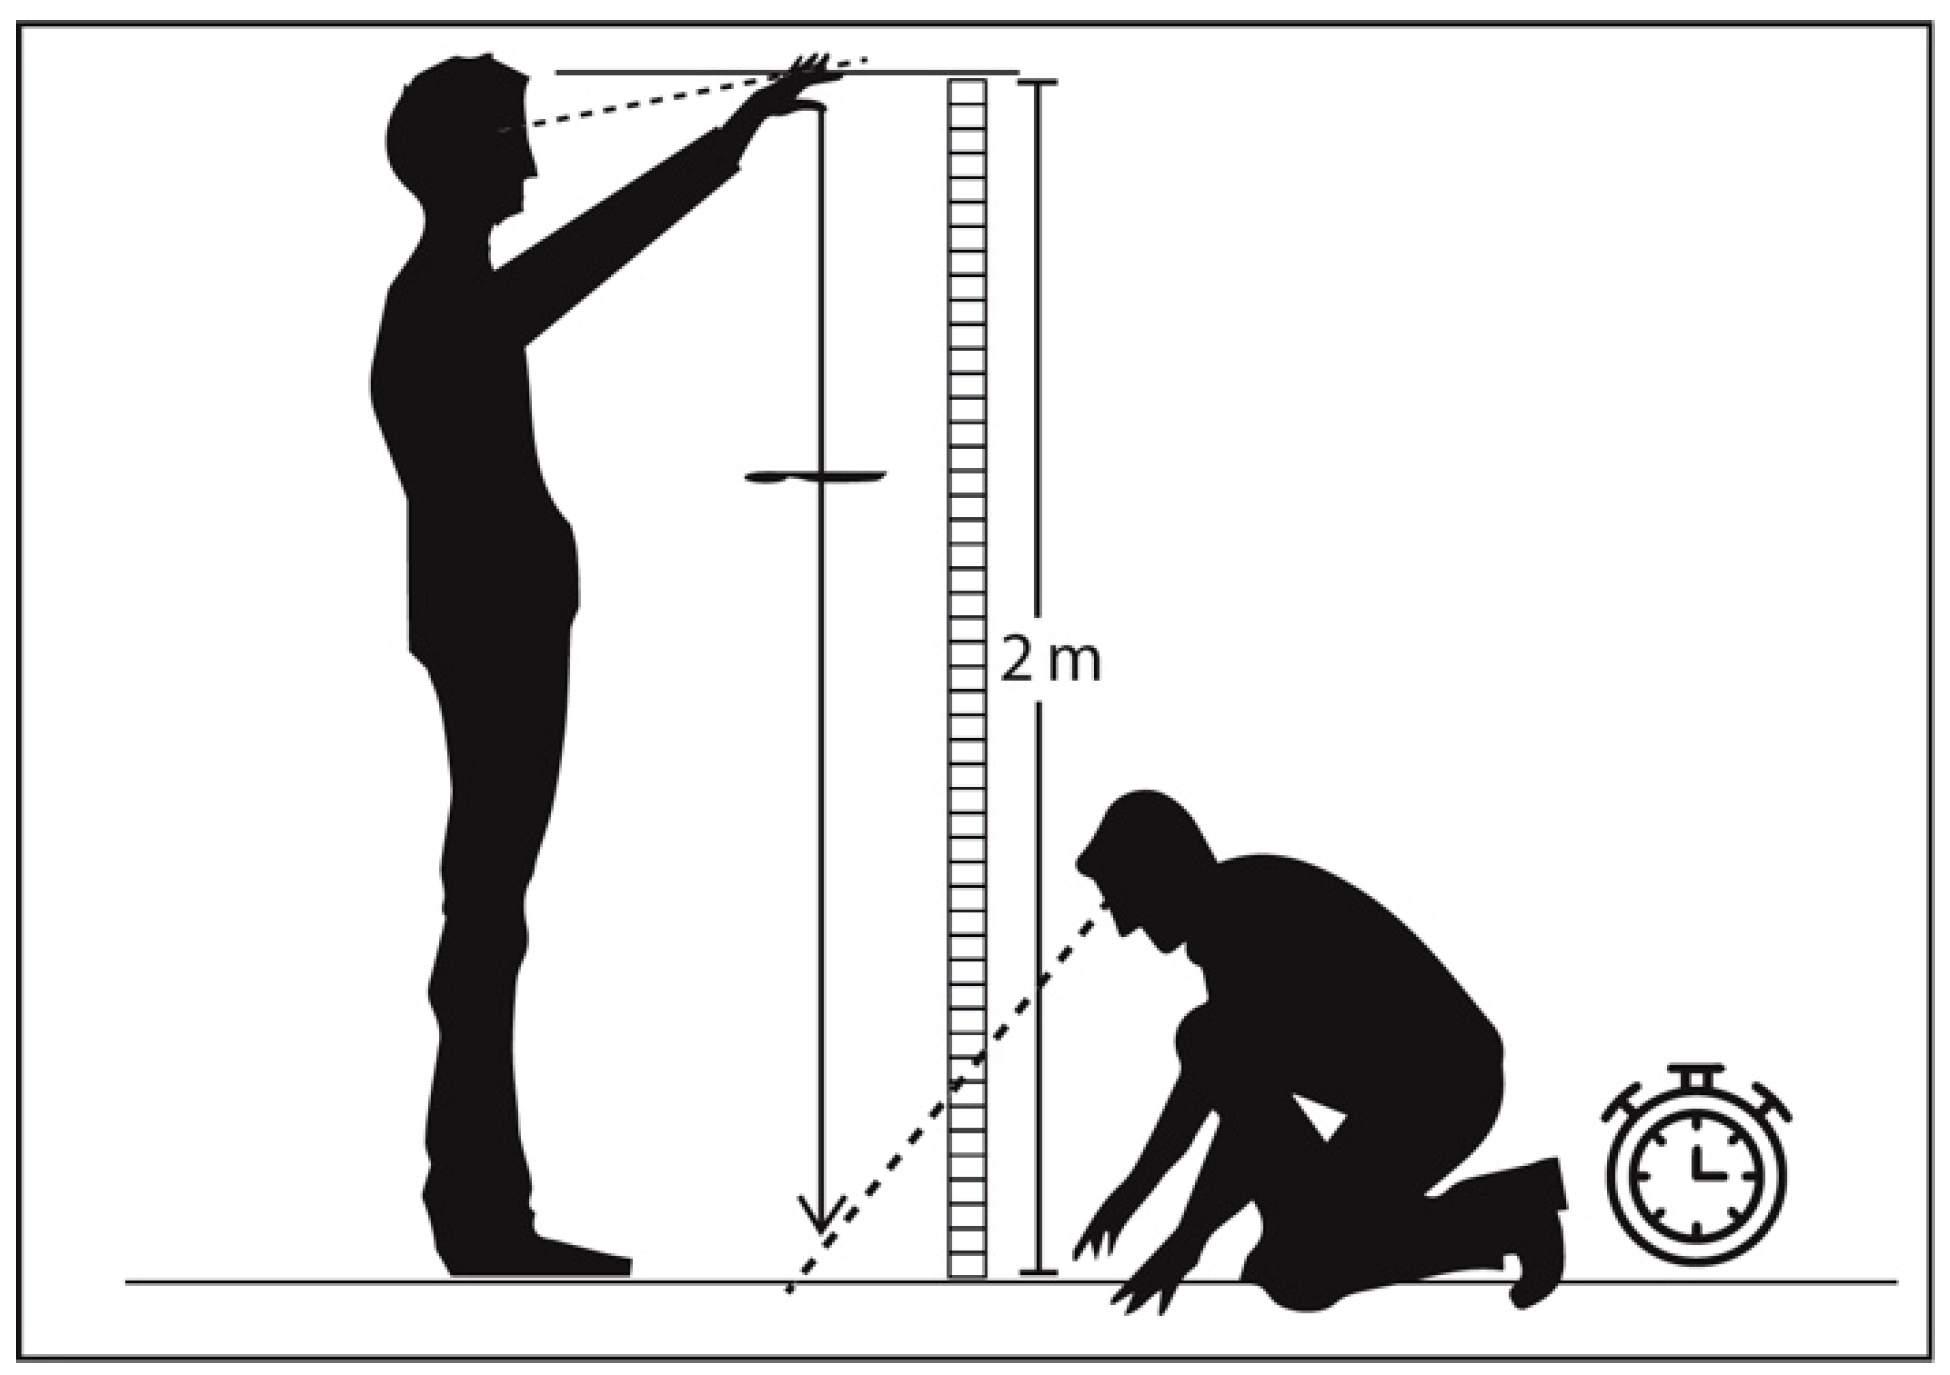
3.3. Sycamore Seed Drop Test
Initial testing involved a simple indoor drop test in a controlled environment, with no external air disturbance and a room temperature of 20 °C, using harvested sycamore seeds (
Figure 4). Twenty-six different seeds were weighed on digital scales (Hanyu HY-8028, Guangdong, China) then manually timed (Apple MacBook Pro stopwatch app, Cupertino, CA, USA) falling from a height of 2 m. The seeds were imaged on an A4 flatbed scanner (Epson V700, Nagano, Japan) at 300 dpi (85 μm resolution) to obtain the surface area.
3.4. Test Article 1
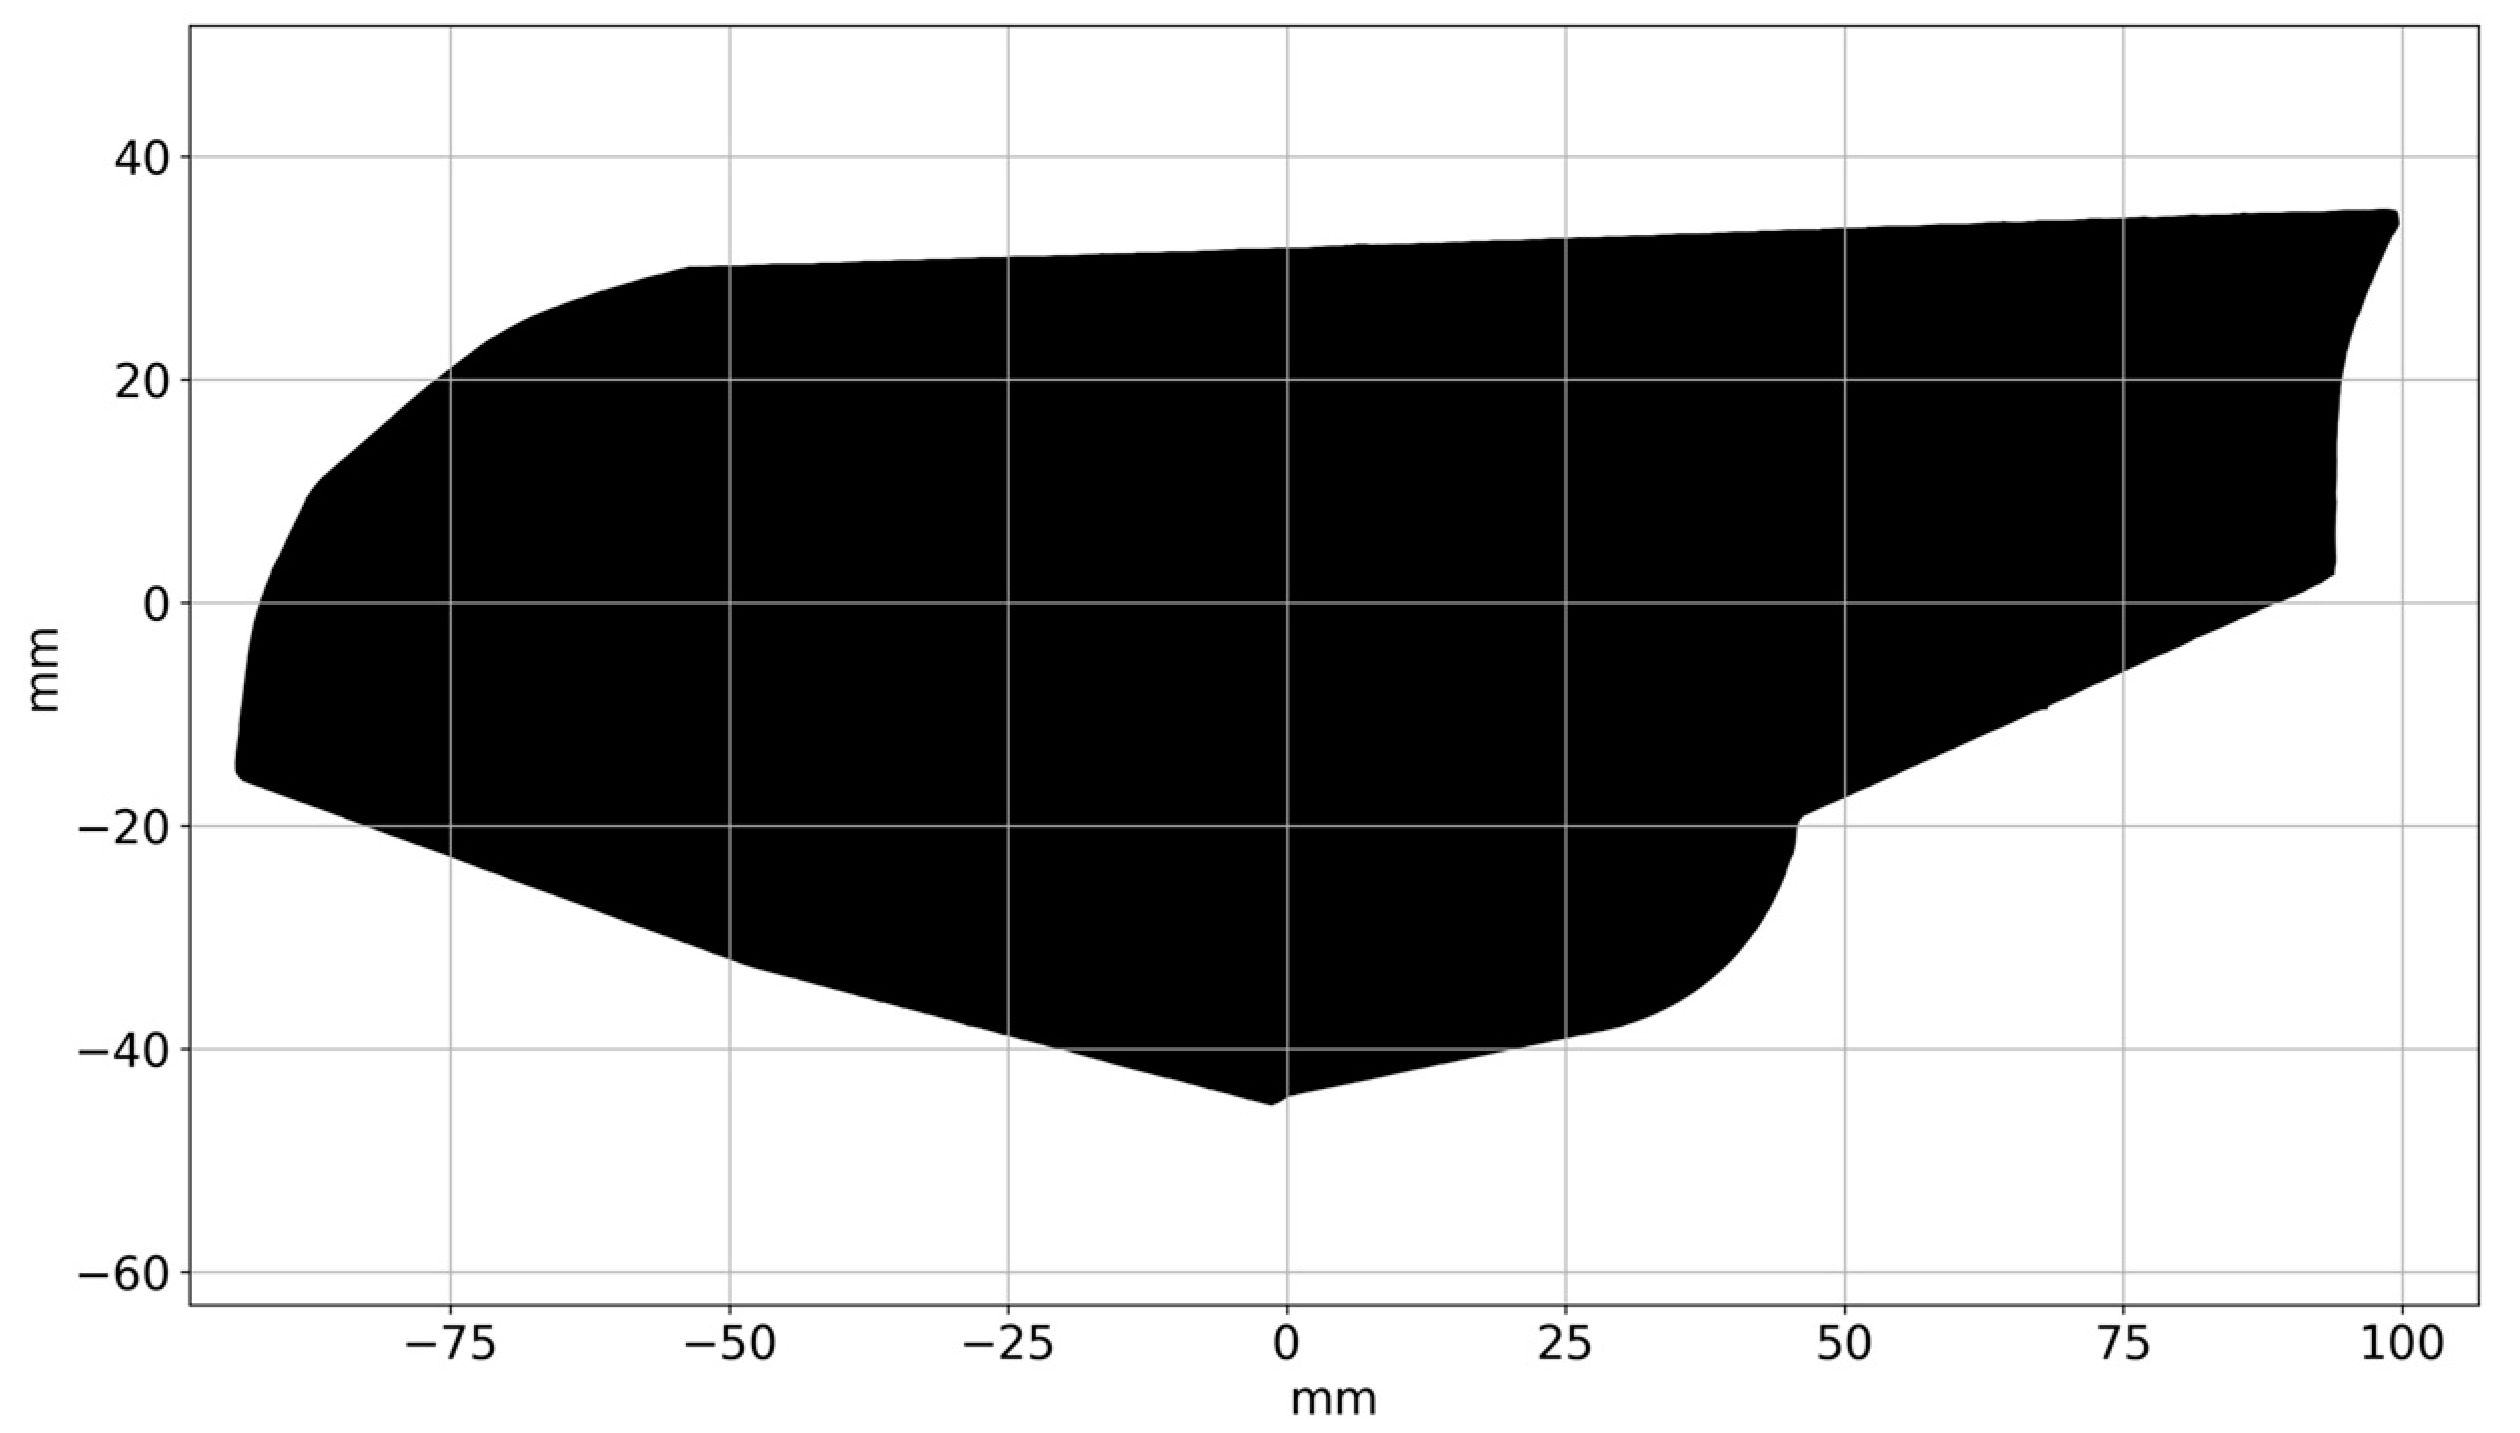
For cost-effective, rapid prototyping, and due to its lightweight properties, 1.75 mm diameter polylactic acid (PLA) polymer was used to produce Test Article 1 (TA1). TA1 was created, scaled up with ≈50% larger intrinsic component than the previously tested sycamore seeds (
Cint = 0.95 kg
0.5/m) and ≈70× heavier. TA1 has a mass of 10.78 g, wingspan (measured from the centre of the seed) of 200 mm and maximum chord of 75 mm; the wing profile and photographs are shown (
Figure 5 and
Figure 6).
TA1 was dropped from a drone, at a height of 62 m, and timed from launch to the ground. Wind conditions were a constant 4 mph. The release height was set by the limitation of the drone’s payload lift and flight stability.
3.5. Test Article 2
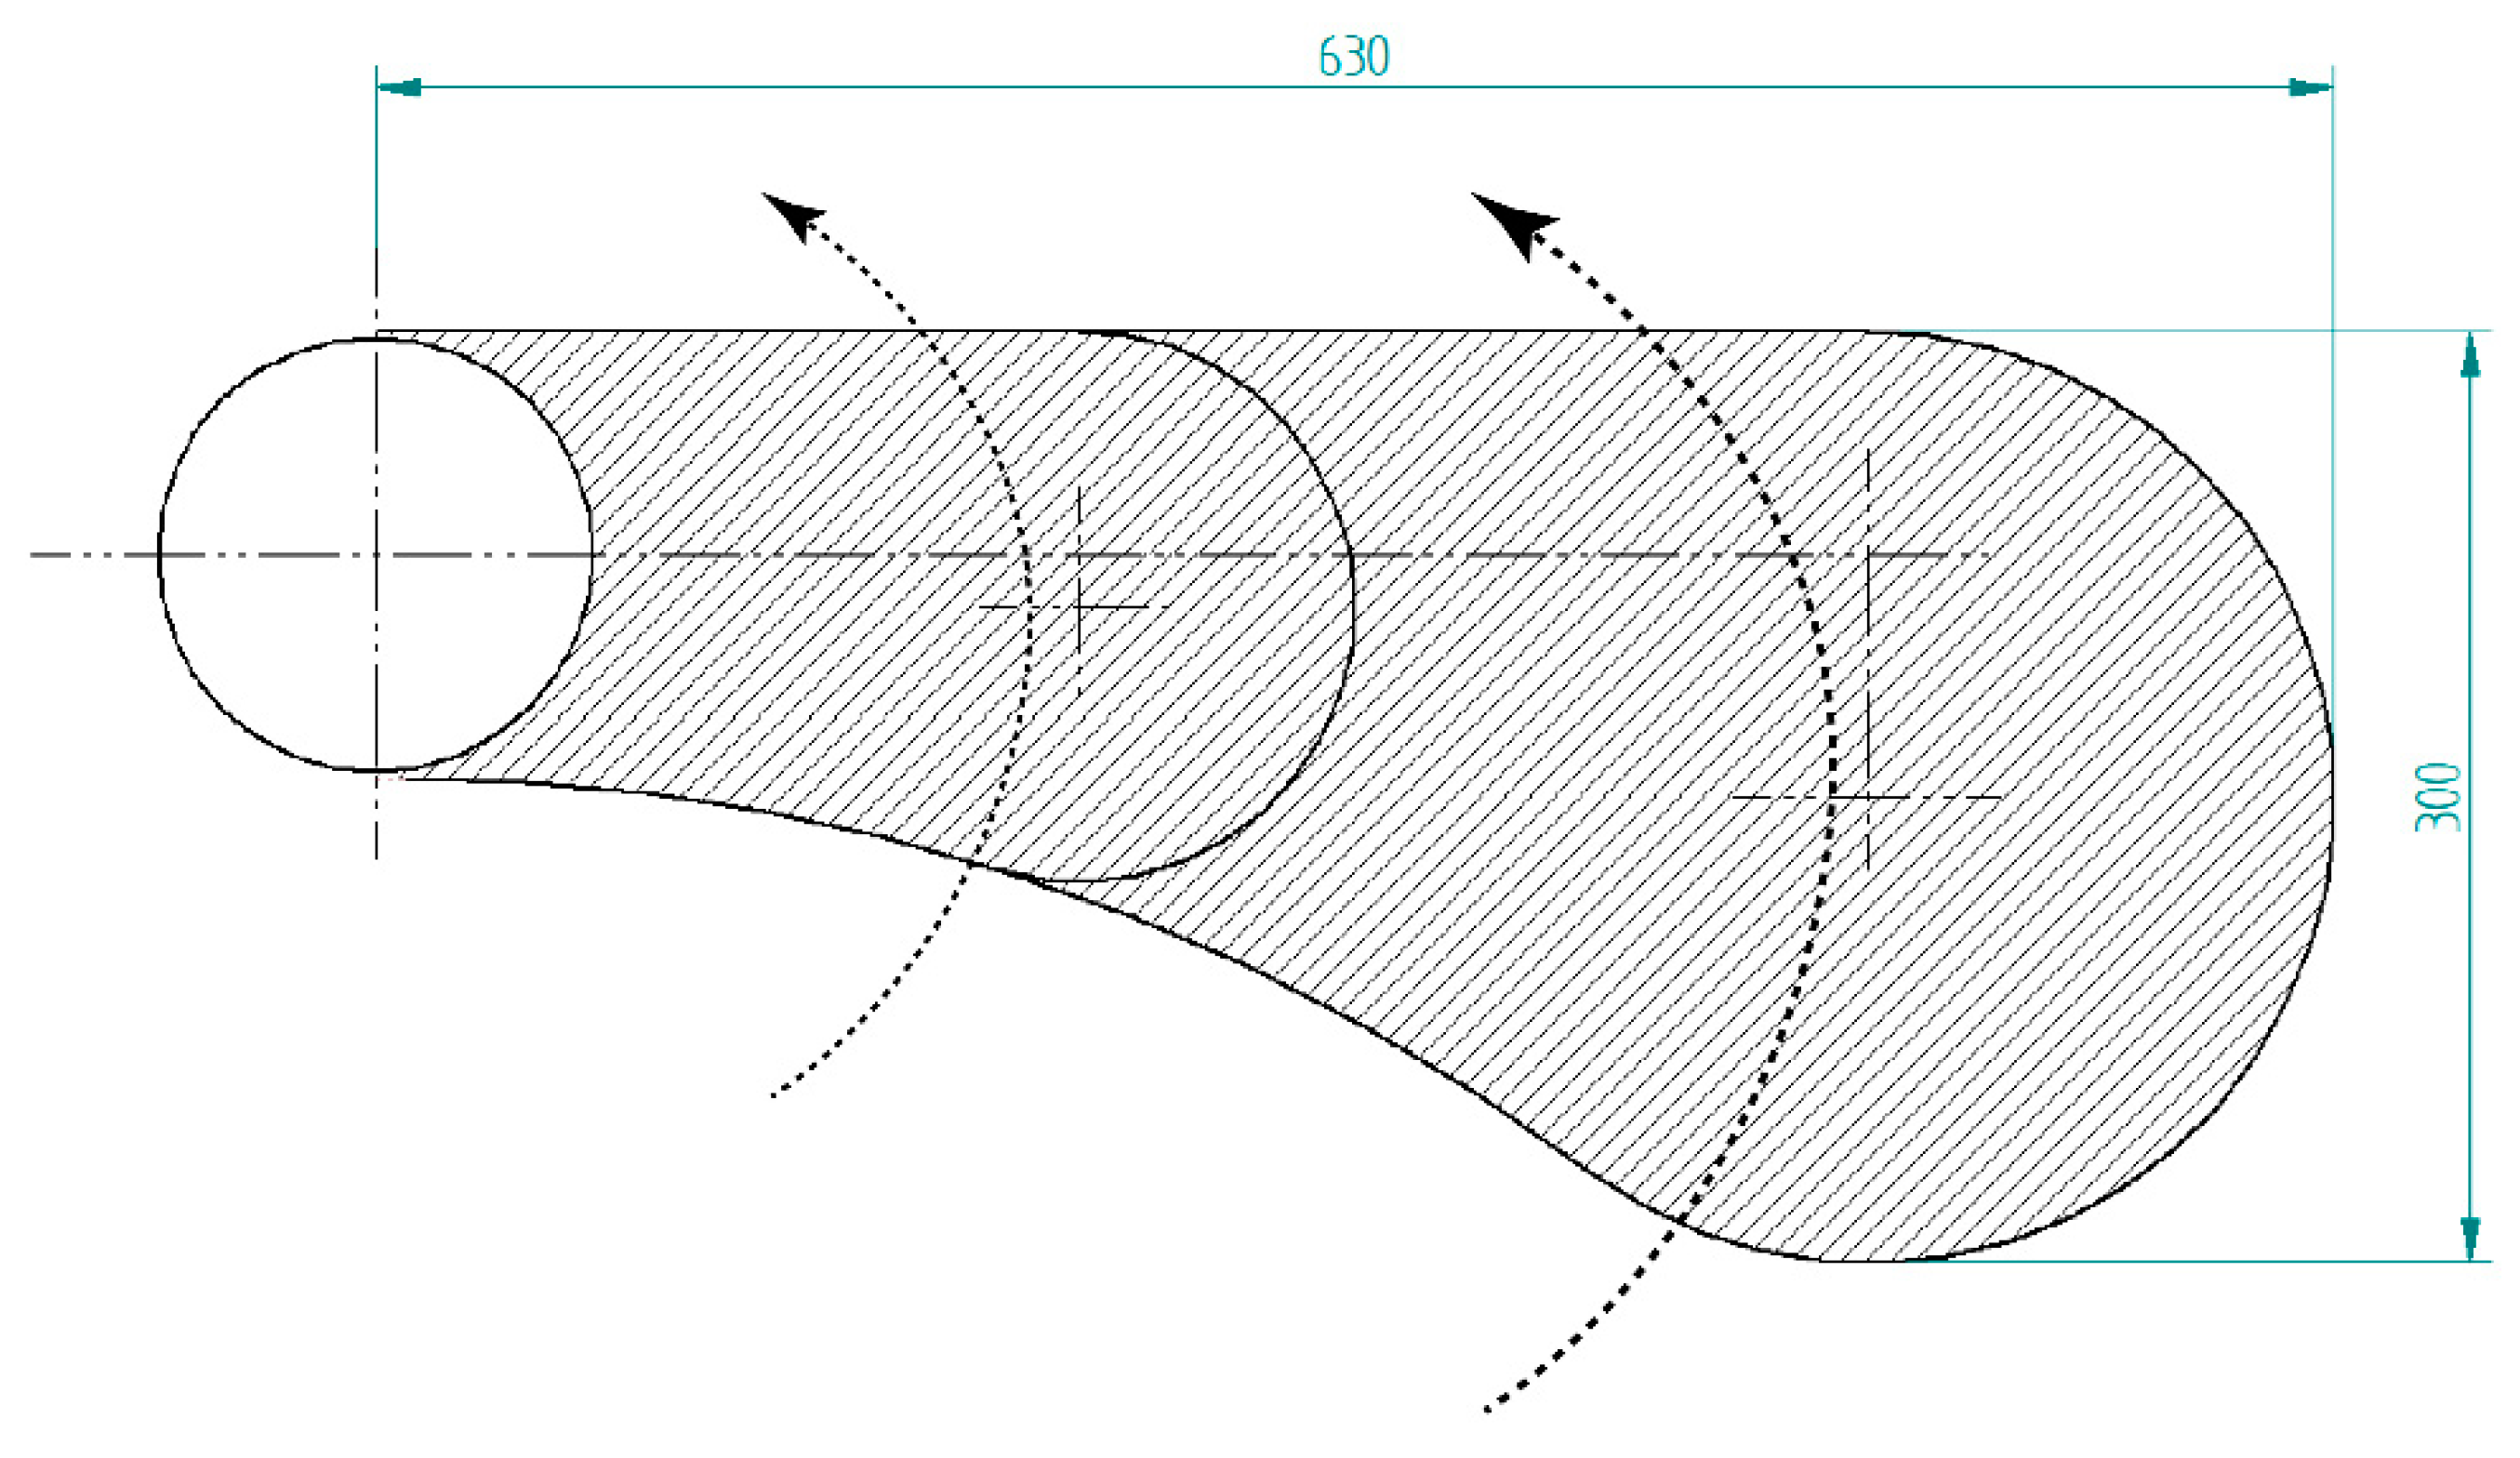
Test Article 2 (TA2) has been designed as another increase in scale from Test Article 1, being ≈10× heavier (while maintaining a similar intrinsic component). TA2 has a wingspan of 630 mm and maximum chord of 300 mm (
Figure 7). The mass in flight condition is 105.3 g and the surface area is 140 × 10
3 mm
2, thus the intrinsic component,
Cint, is 0.87 kg
0.5/m.
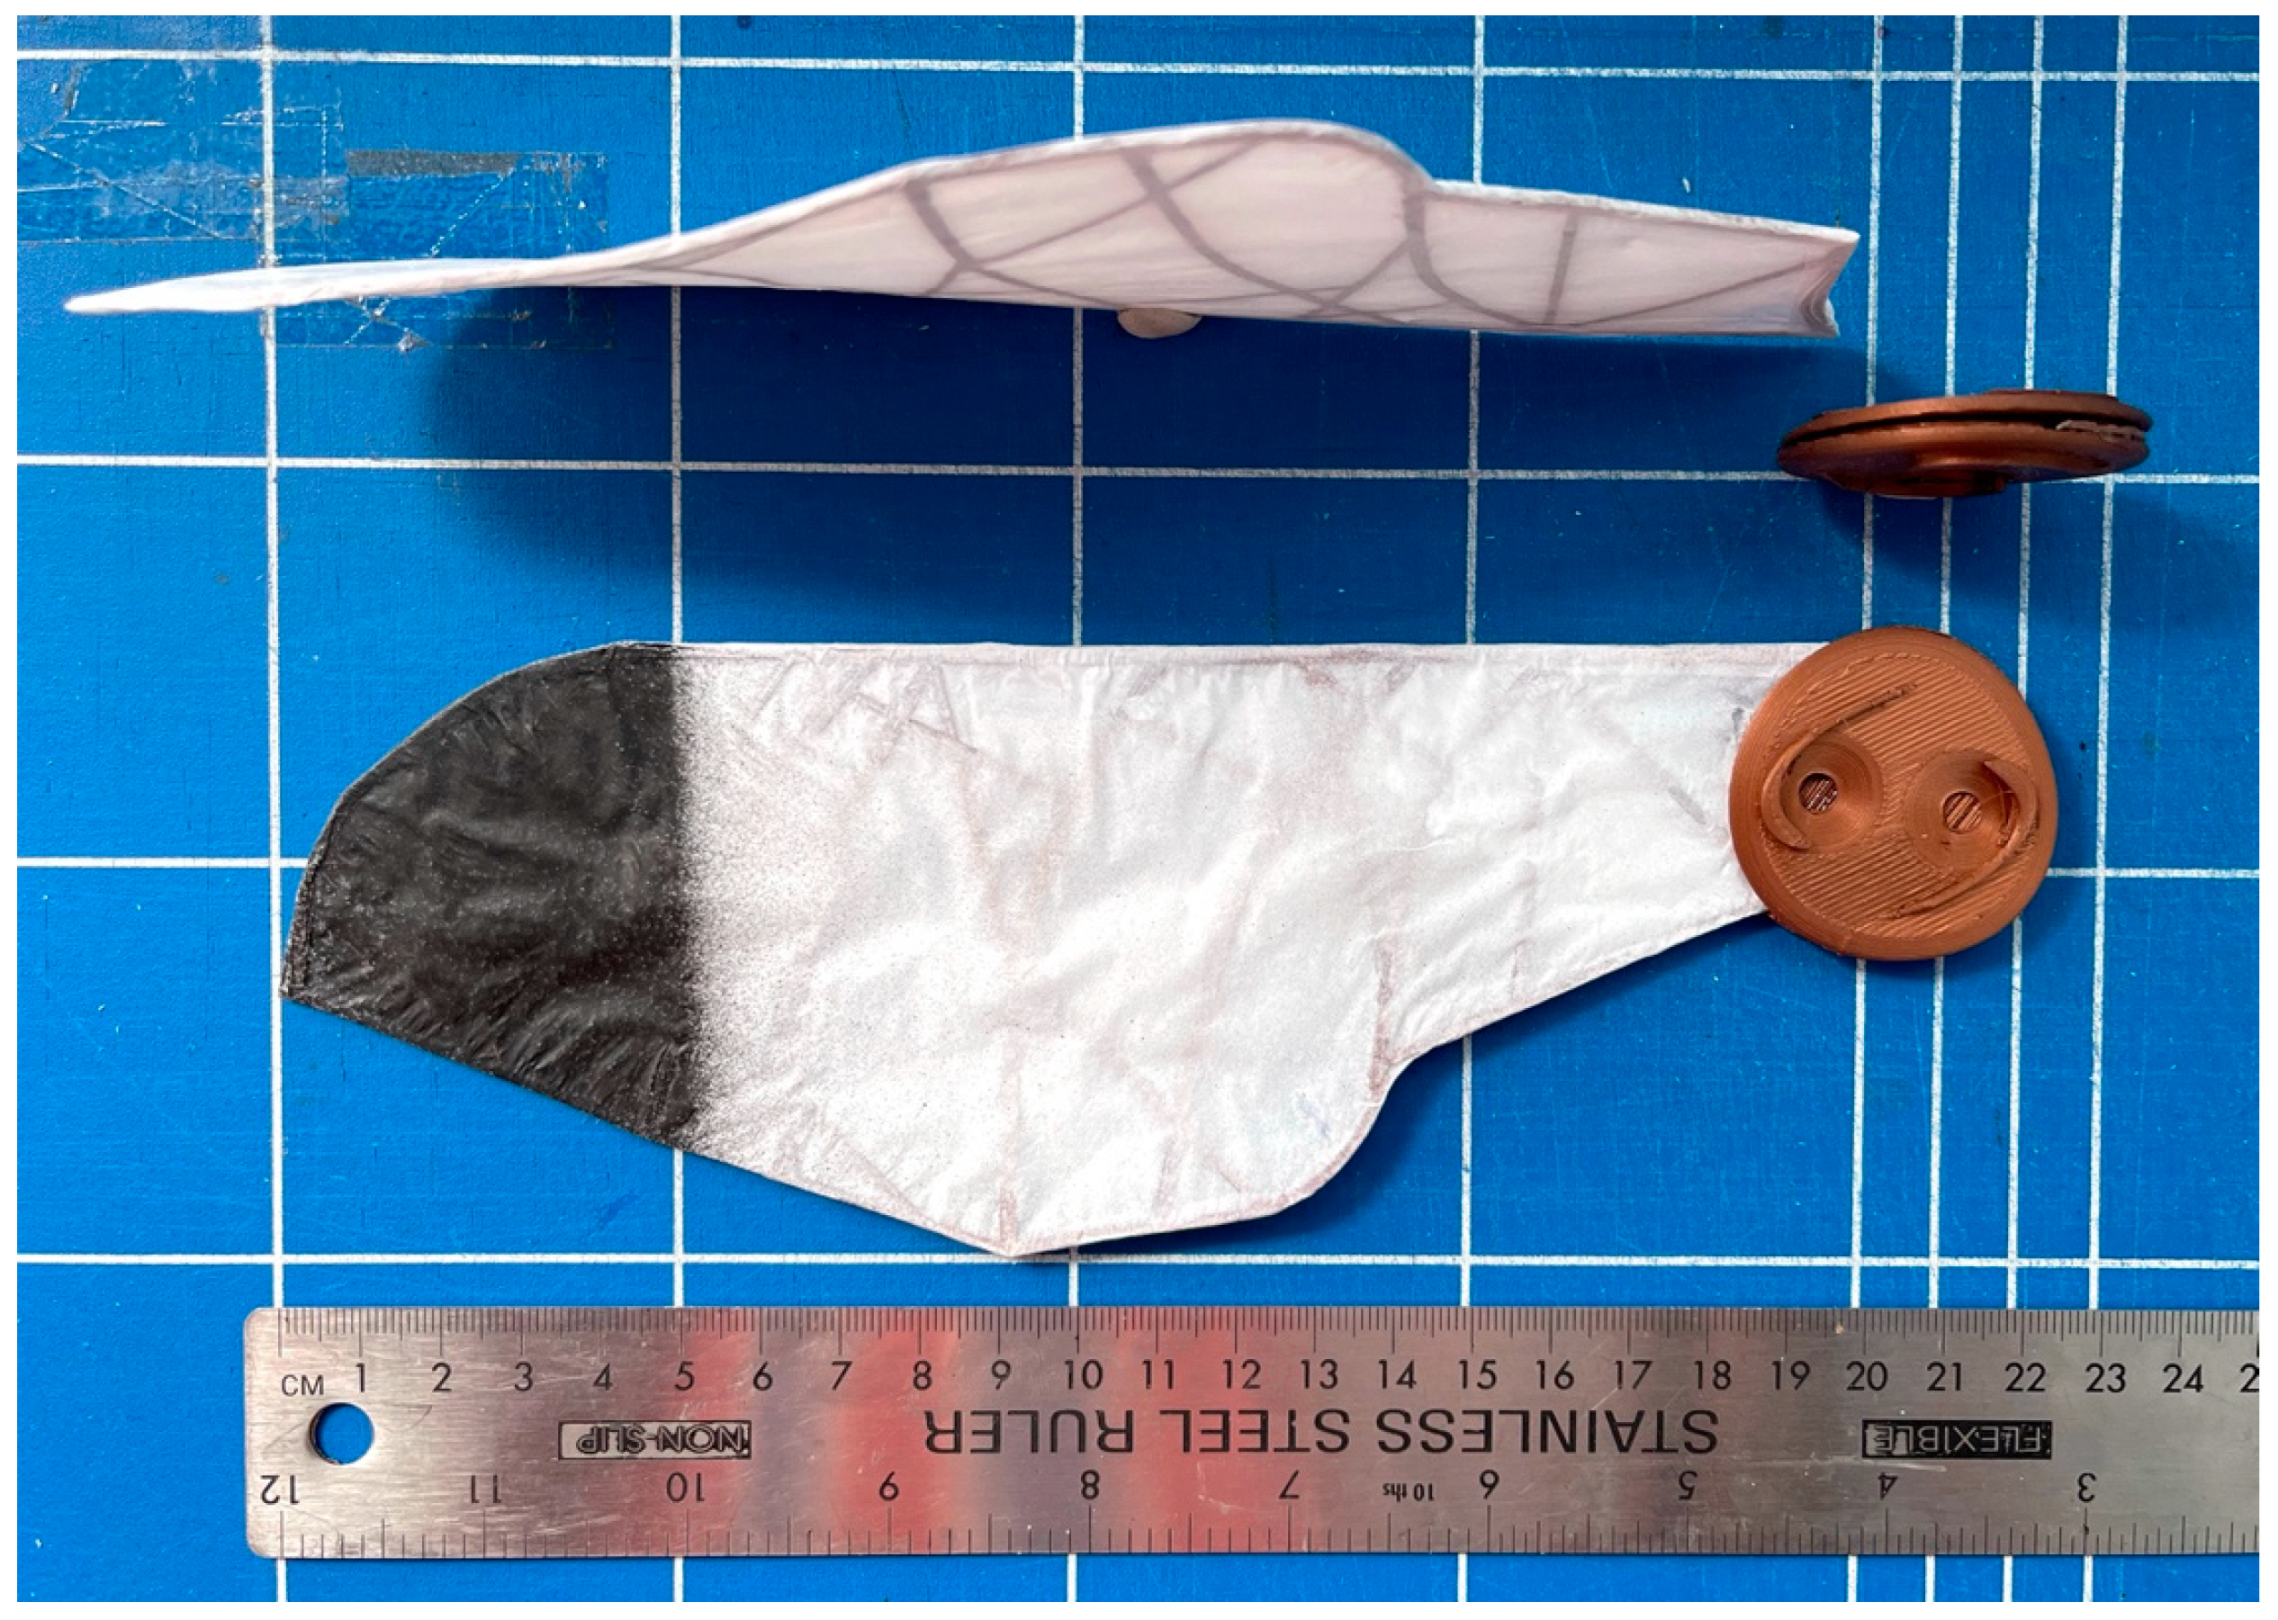
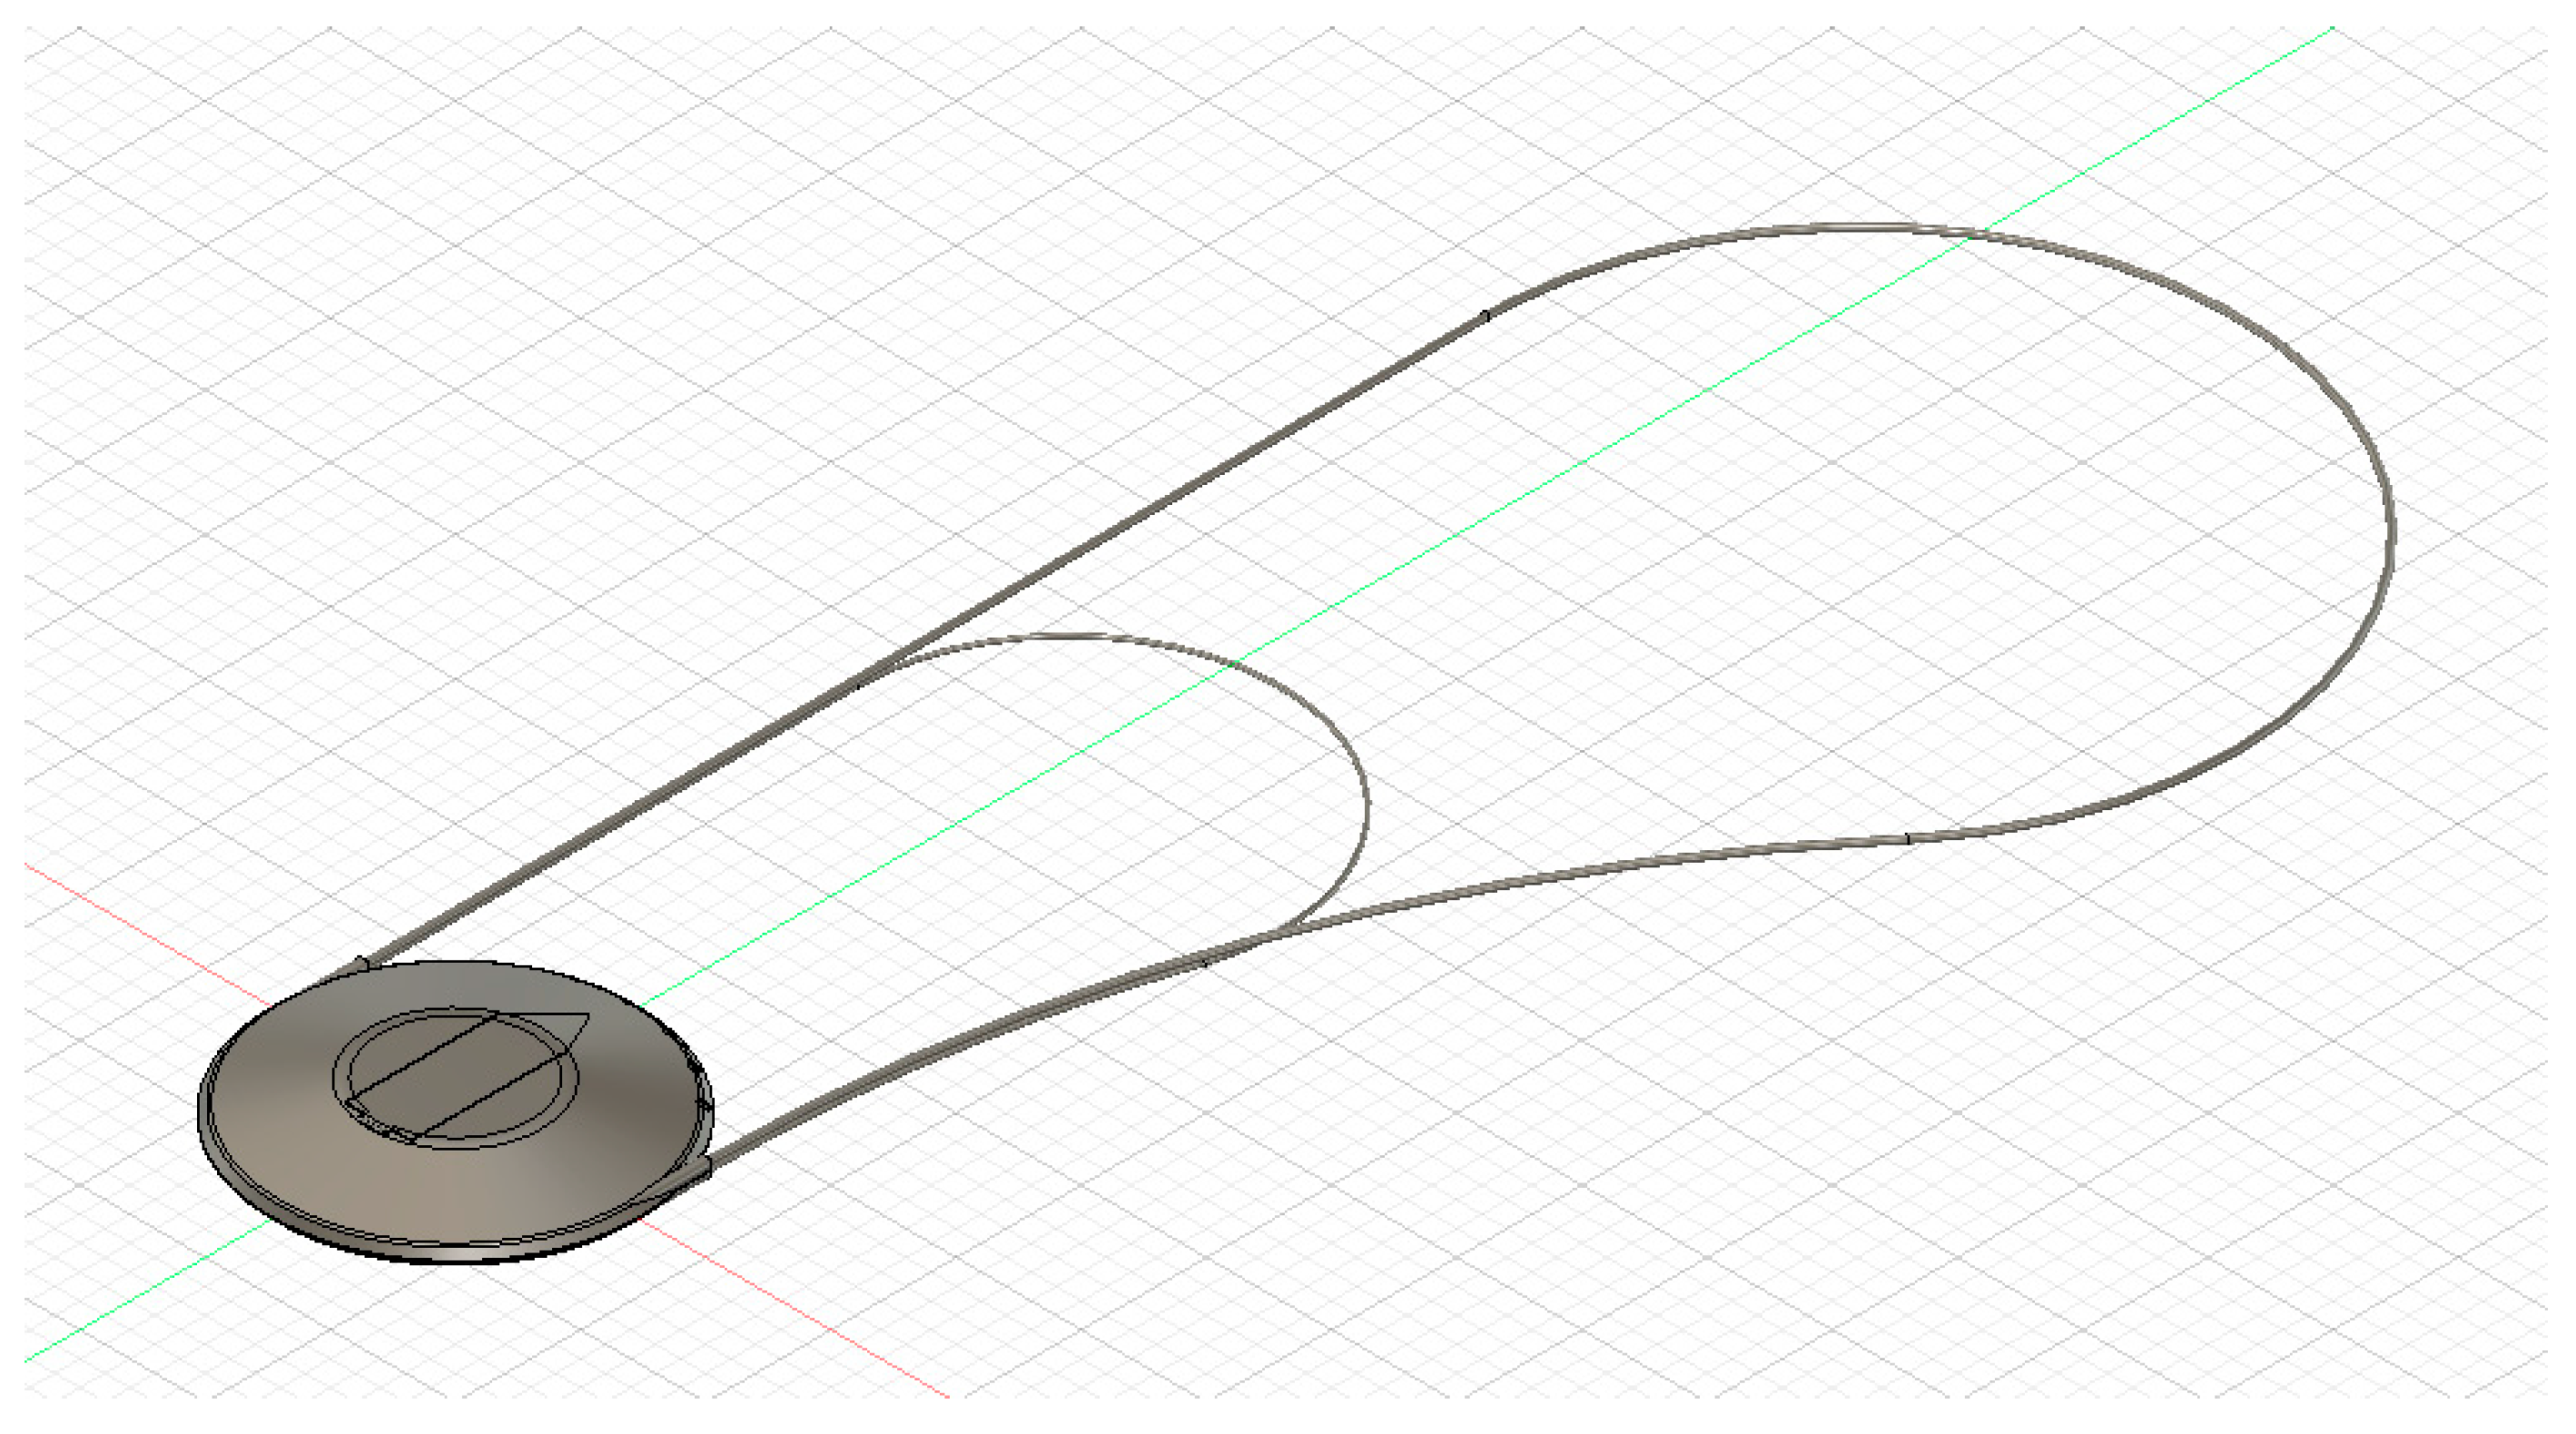
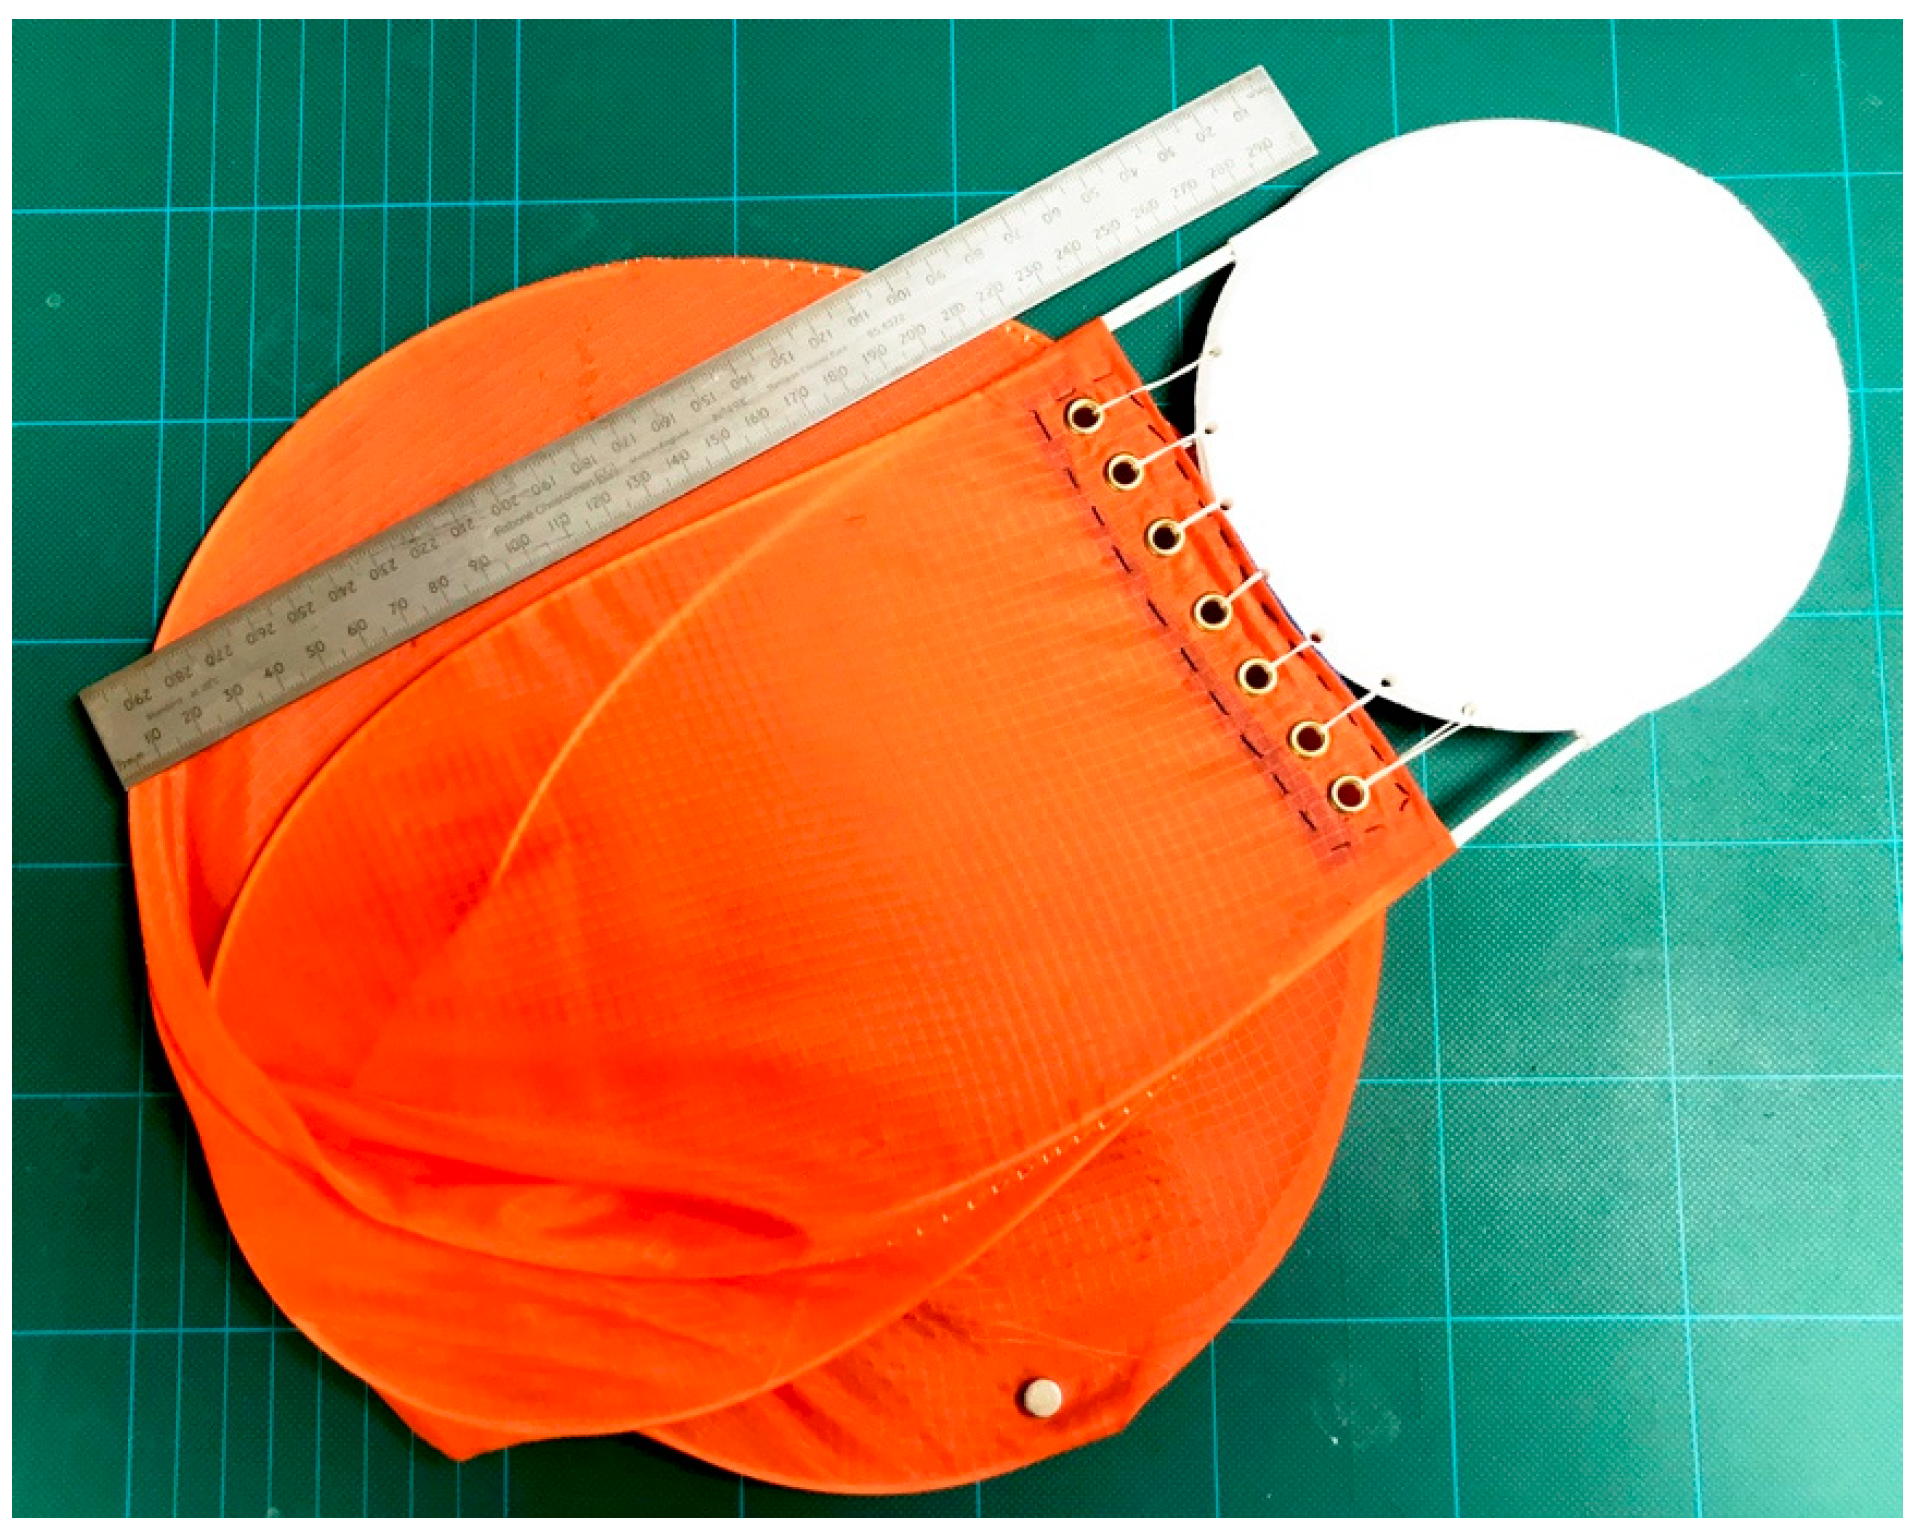
The construction of TA2 (
Figure 8 and
Figure 9) is intended to explore twisted and folded wing “pop-up tent” stowage concepts (
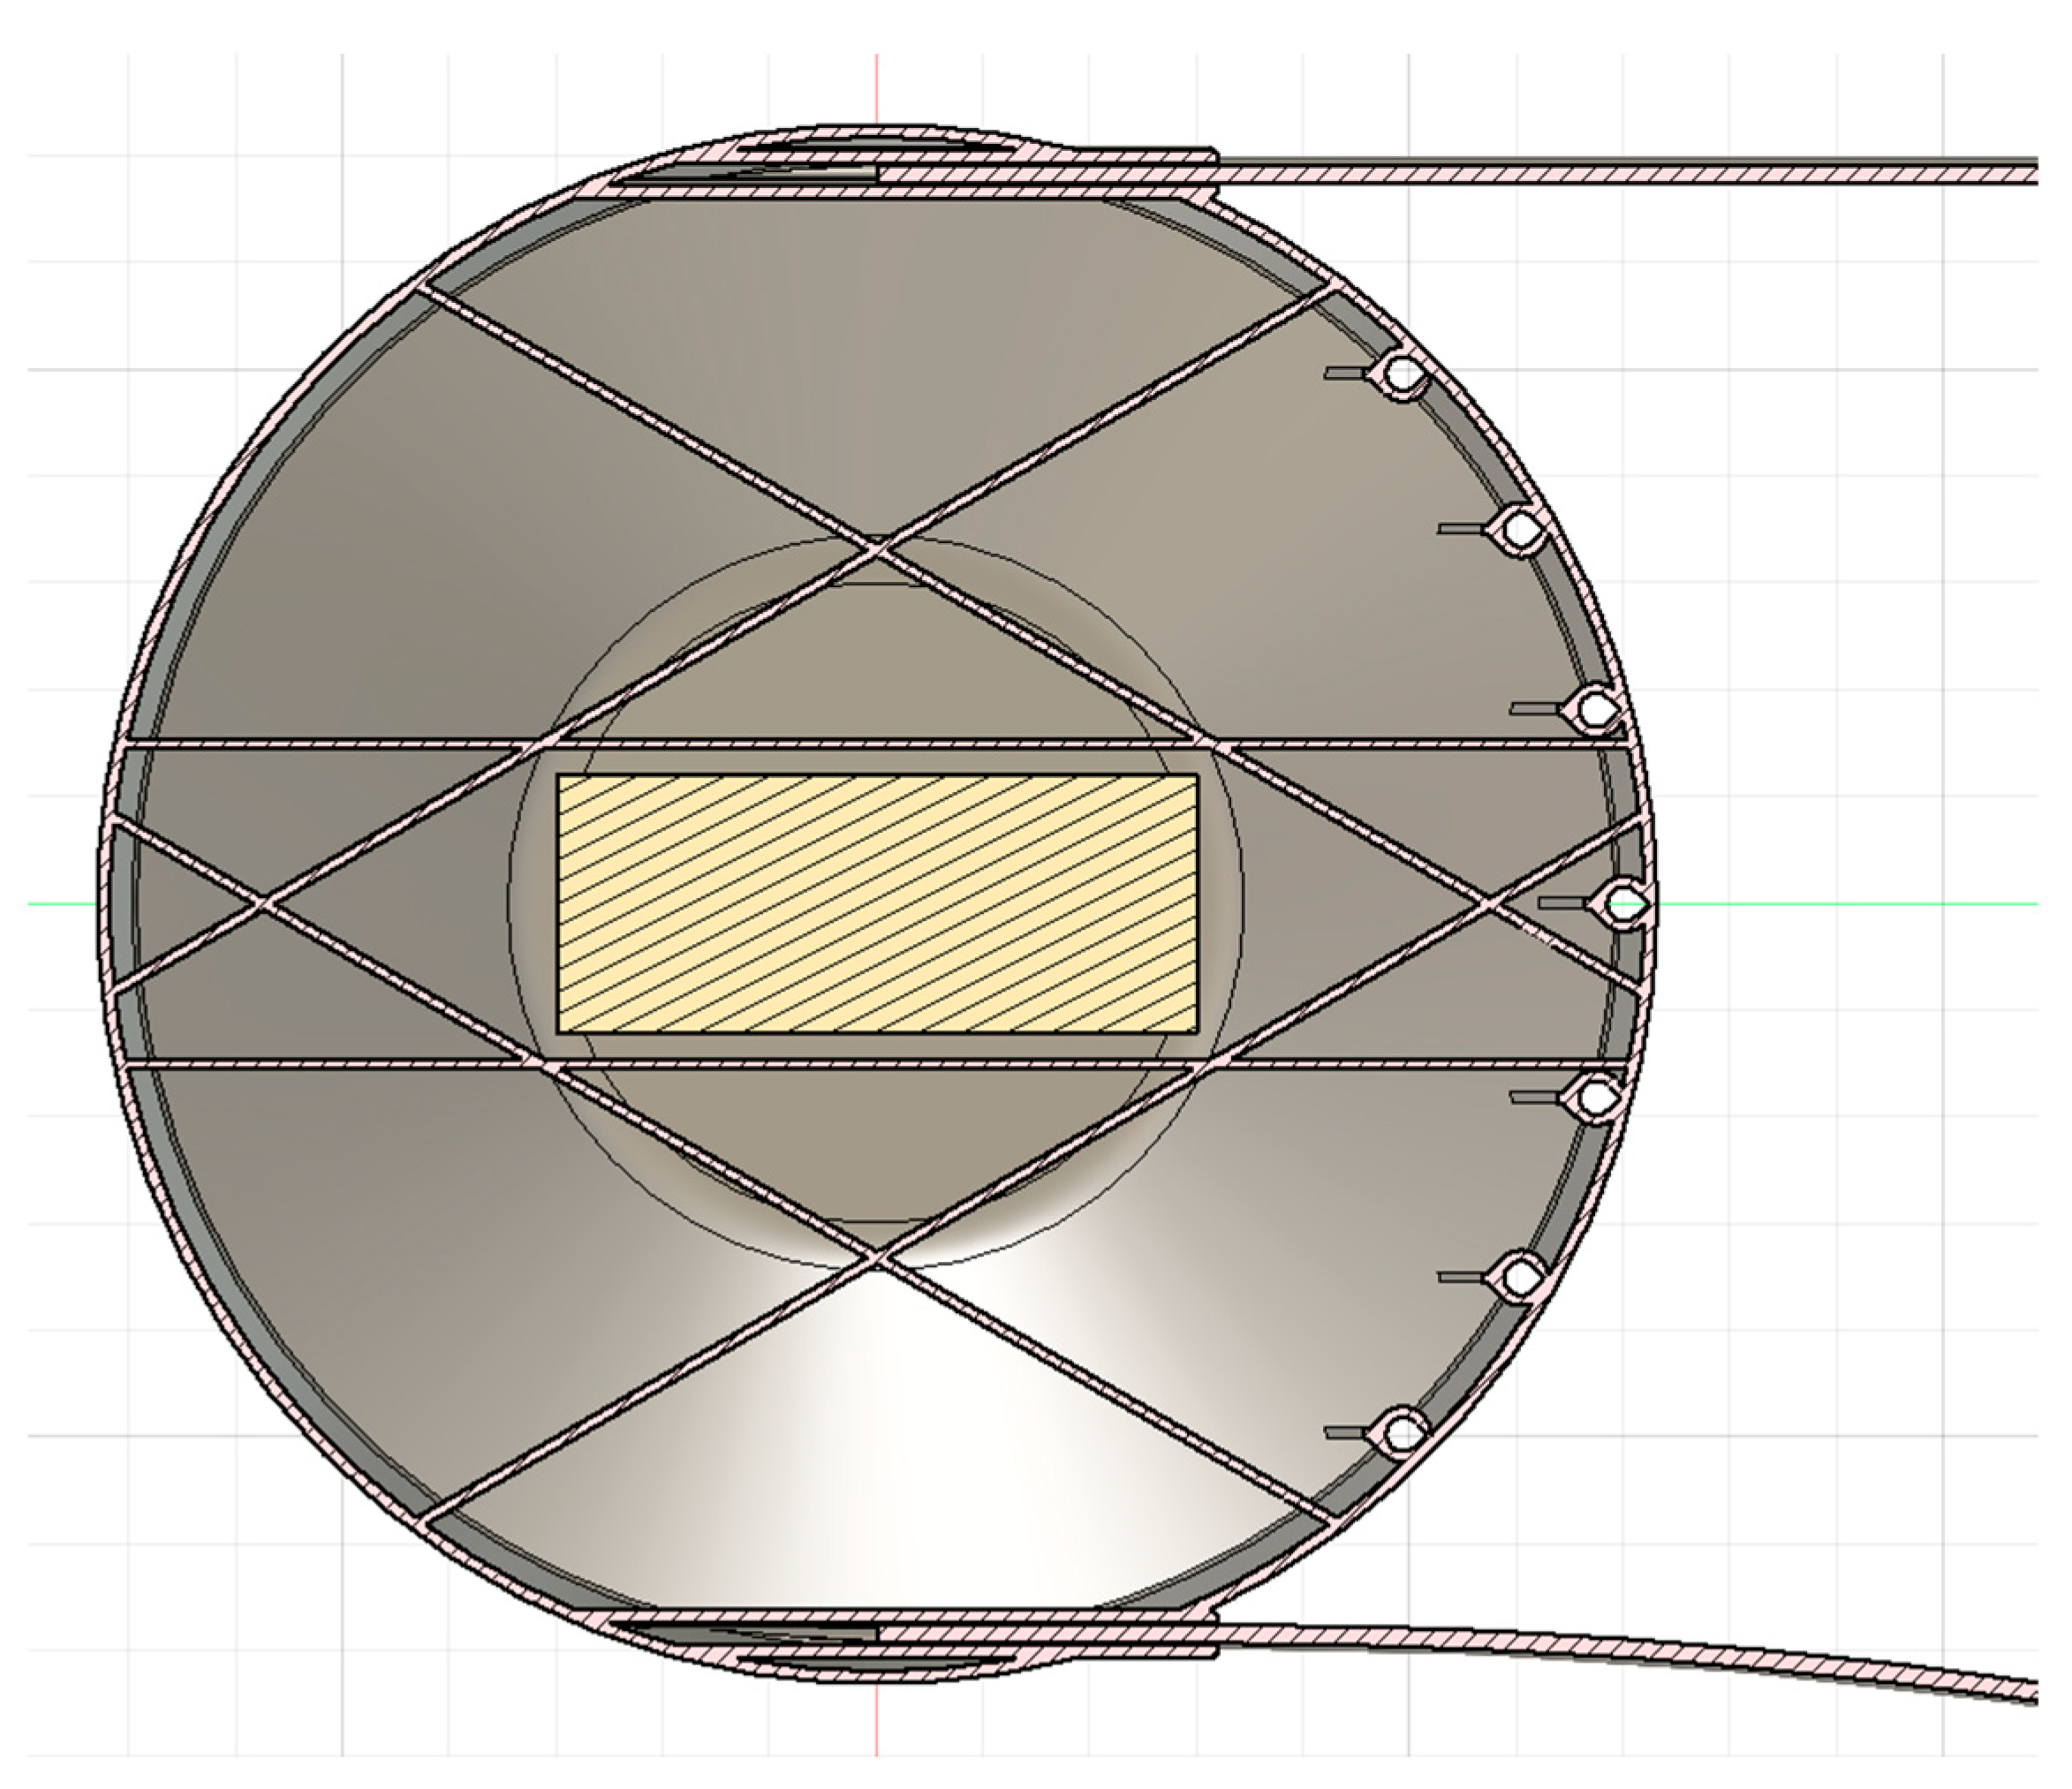
Figure 10), as well as being a convenient method of prototype construction. The seed is again a PLA 3D-printed component; the tail is sewn rip-stop 35 gsm polyester fabric (Mitsui Pertex, Tokyo, Japan) supported by two hoops constructed from ⊘2 mm glass fibre reinforced polyester (GFRP) rod (East Coast Fibreglass Supplies, South Shields, UK). In order to improve the quantity and quality of data collected during flights the seed includes a compartment designed to house an inertial measurement unit (IMU).
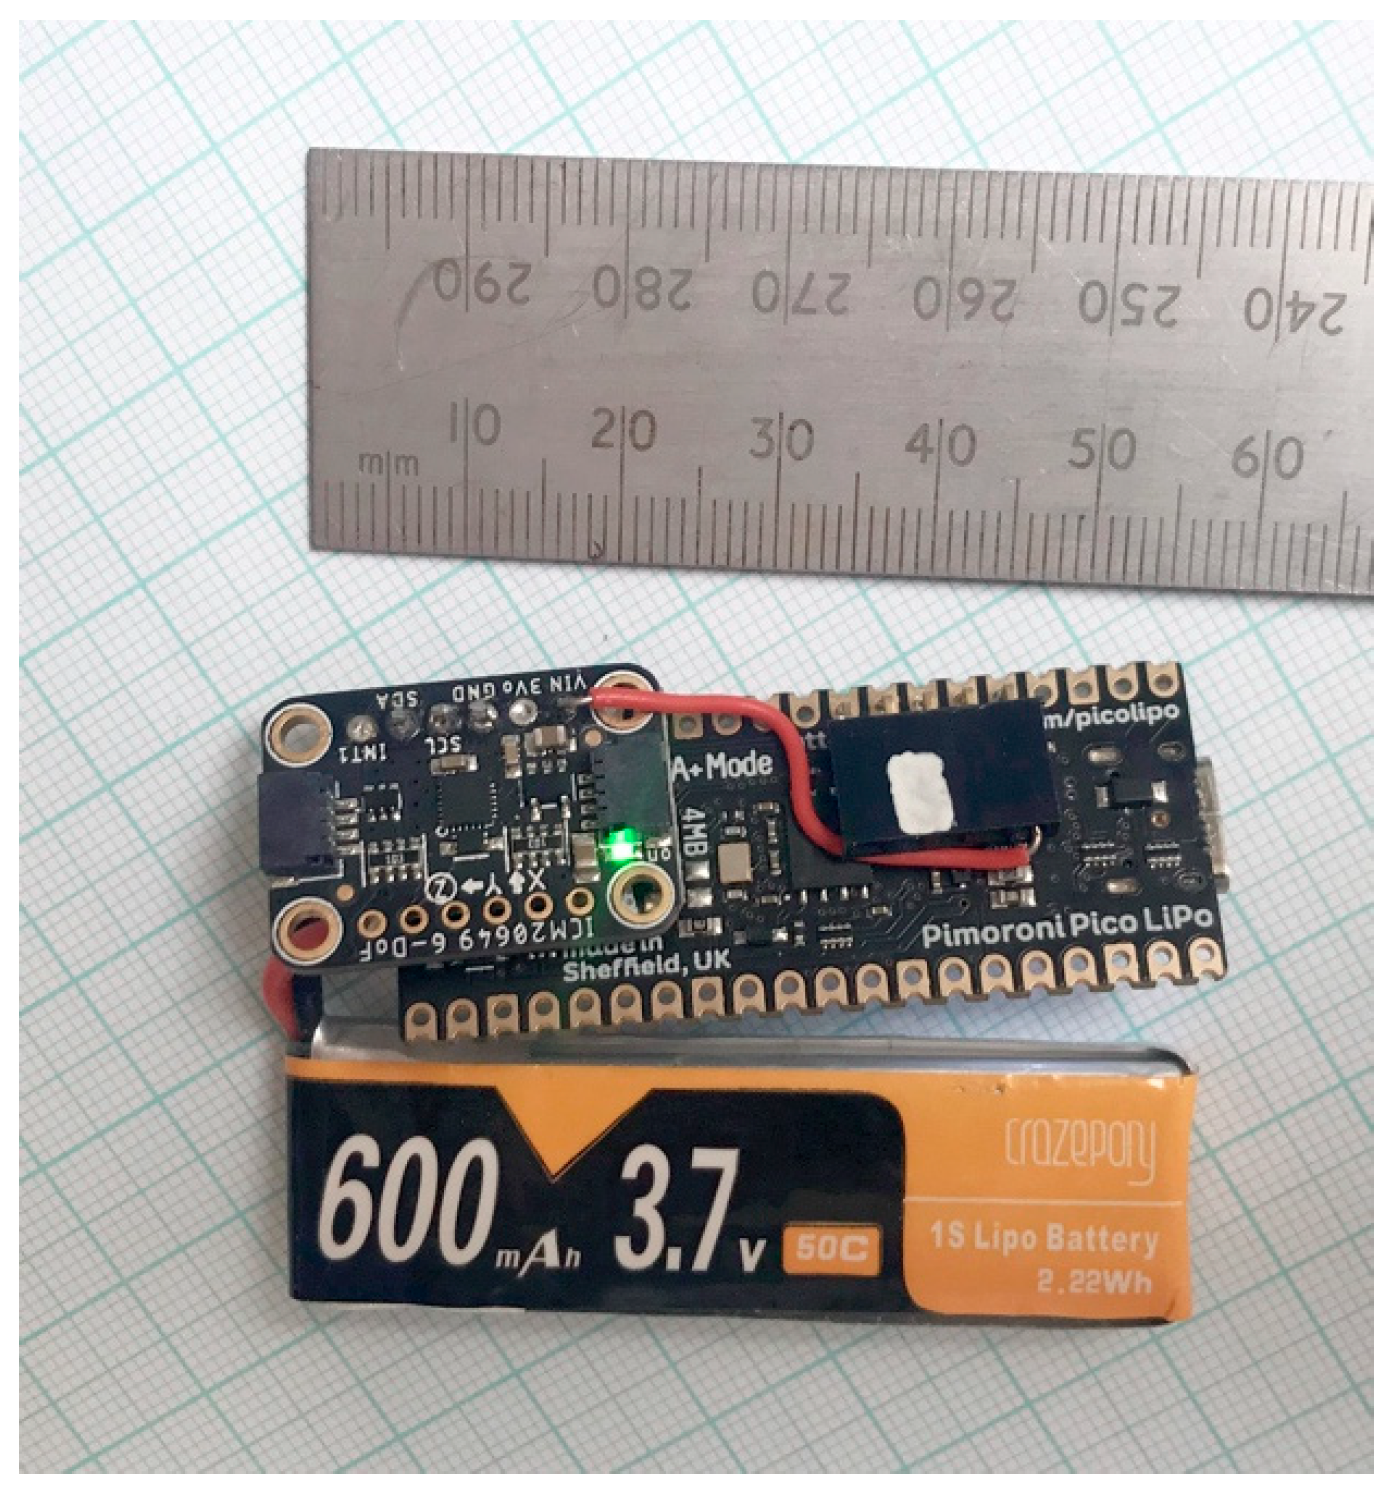
The IMU (
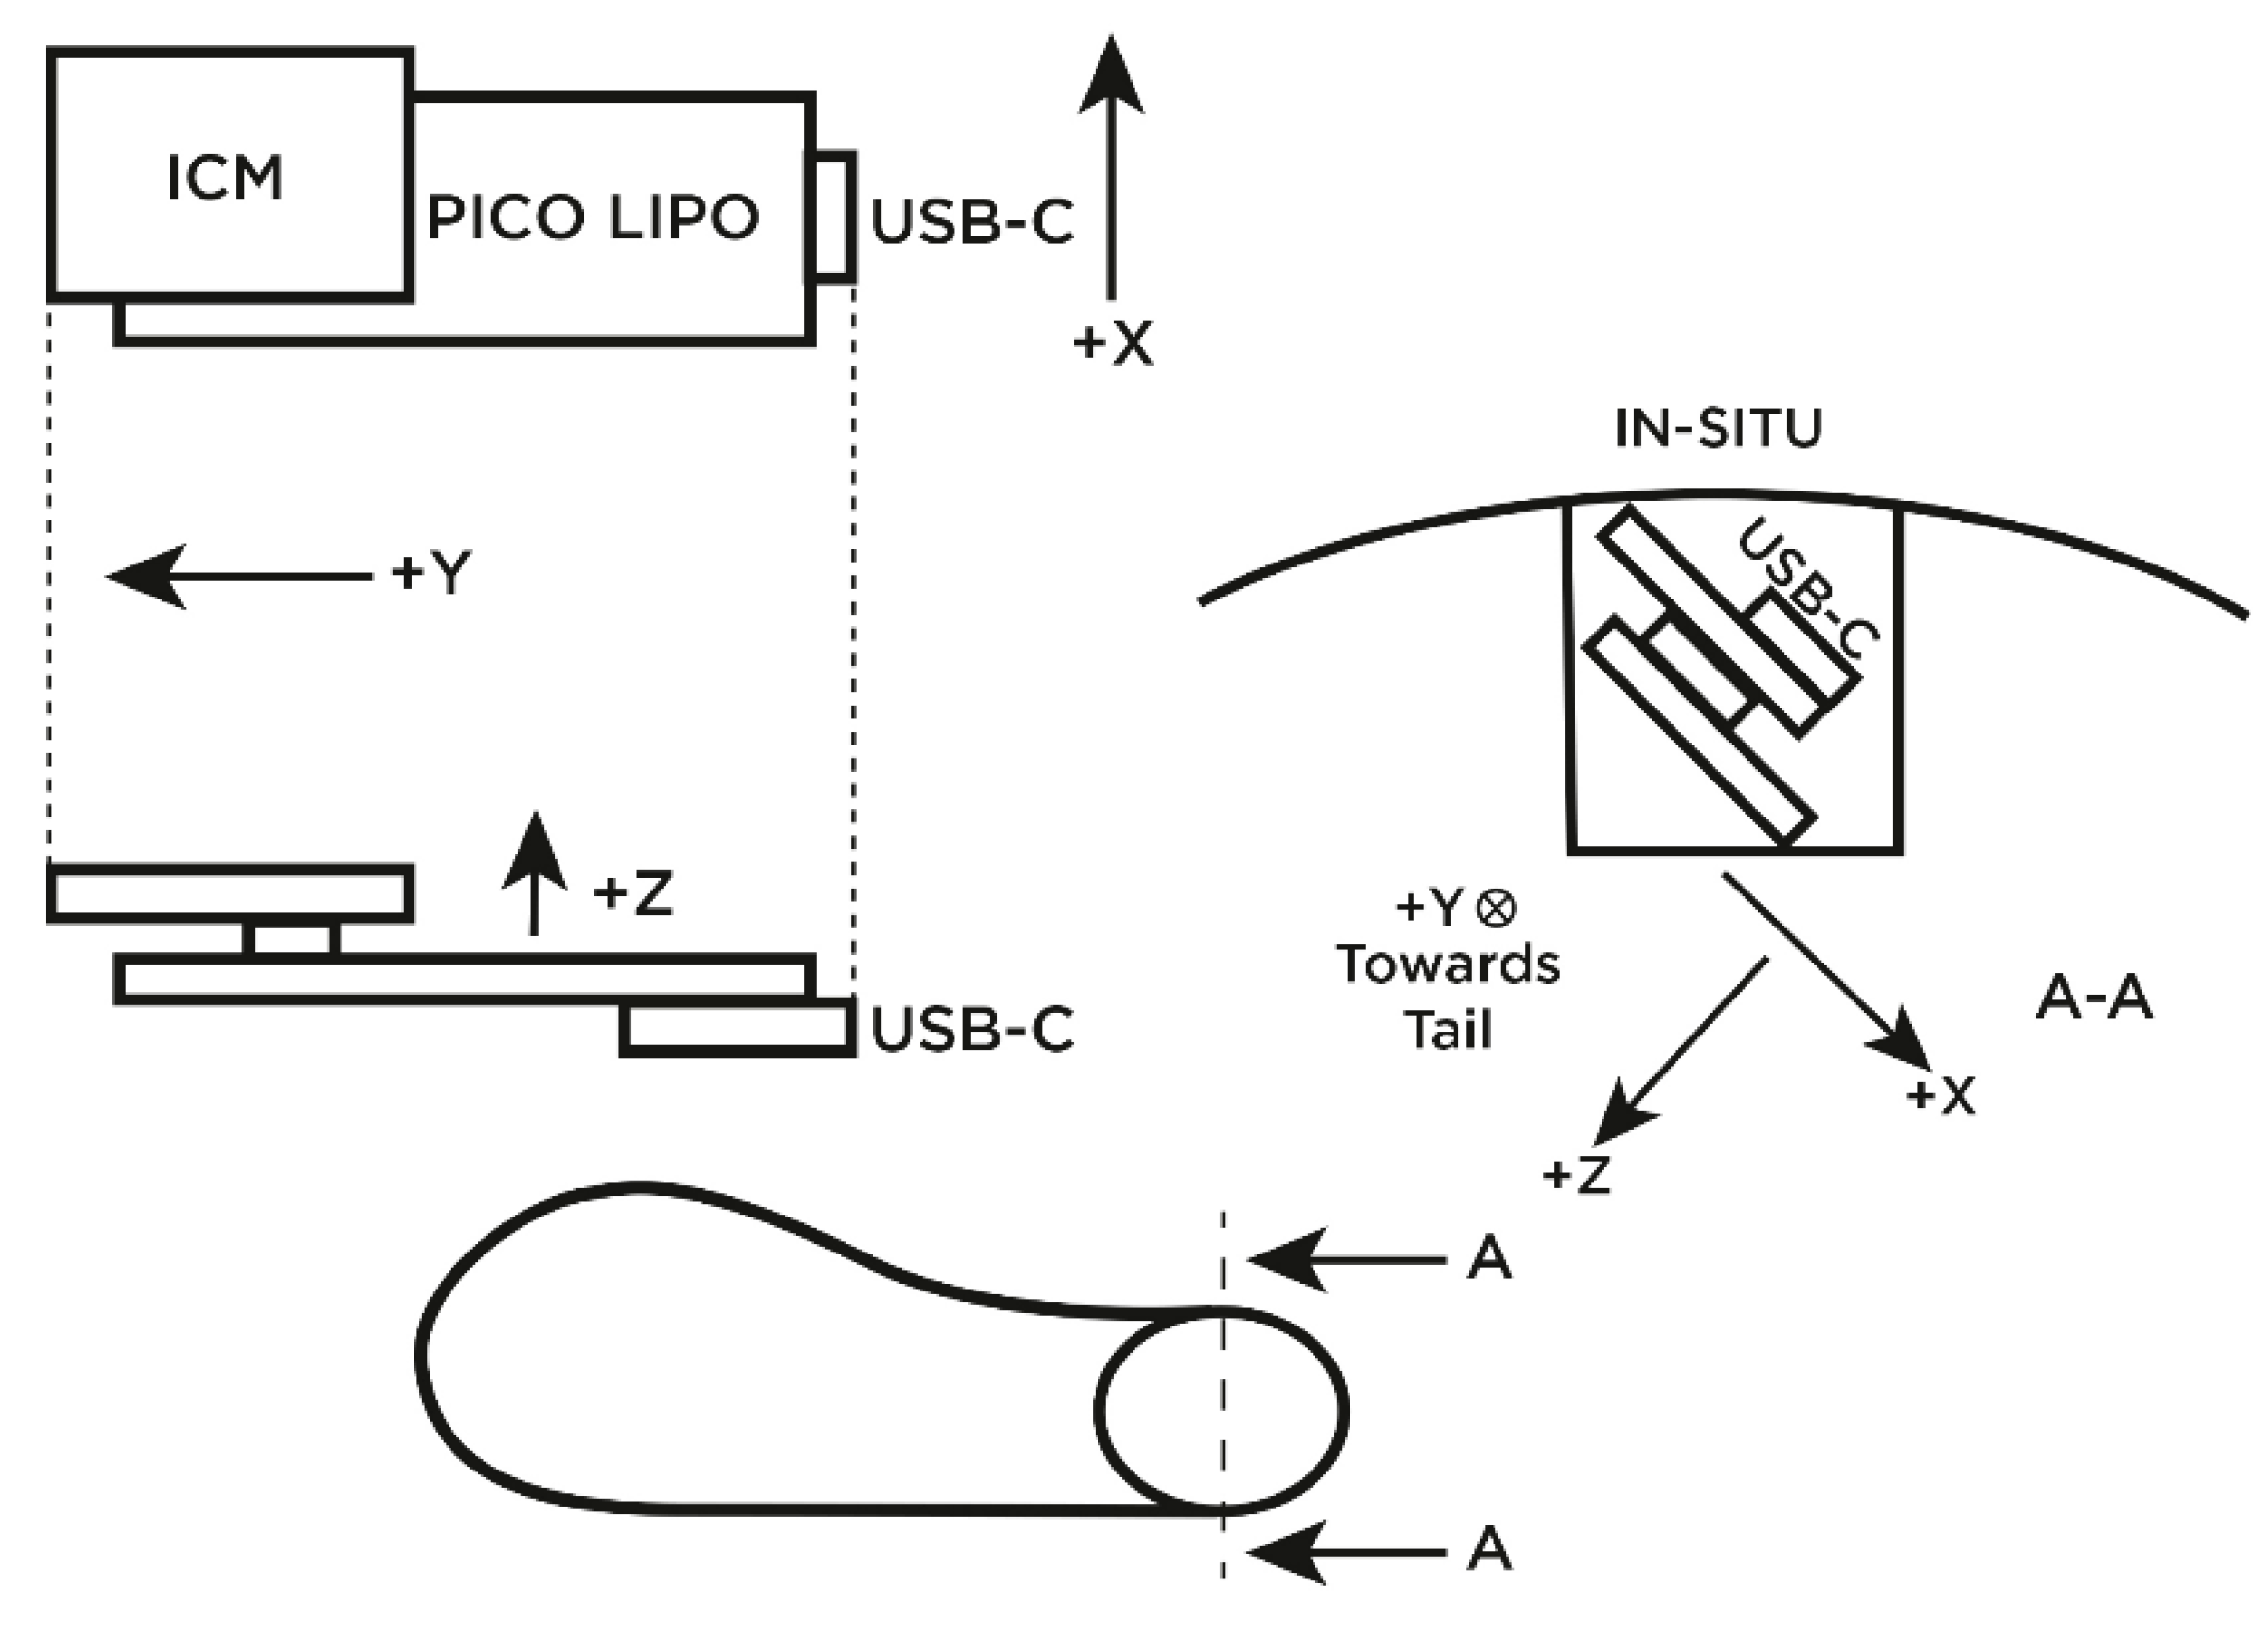
Figure 11) is microcontroller-controlled (Pico Lipo, Pimoroni, Sheffield, UK), logging acceleration (±30 g) and rotation (±4000 dps) from a wide-range MEMS chip (ICM-20649, Invensense, San Jose, CA, USA) to flash memory. The median sampling period is <3 ms, though this is interrupted approximately once per second to allow the data stored in volatile memory to be written to non-volatile flash. The orientation of the IMU axes relative to TA2 is shown (
Figure 12) and the total mass of the IMU including battery is 85.9 g.
TA2 was tested by altimeter-controlled release from a drone at a height of 80 m. The increased mass of TA2 meant a larger drone had to be used and the drop distance needed to be increased to gain level flight. An additional factor to be considered was the UK’s Civil Aviation Authority regulations for drone flights to be kept below 120 m. The IMU was used to collect acceleration and rotation data, from which an accurate estimate of flight time and the location of the axis of rotation can be inferred. Two video cameras were also used to record the flight.
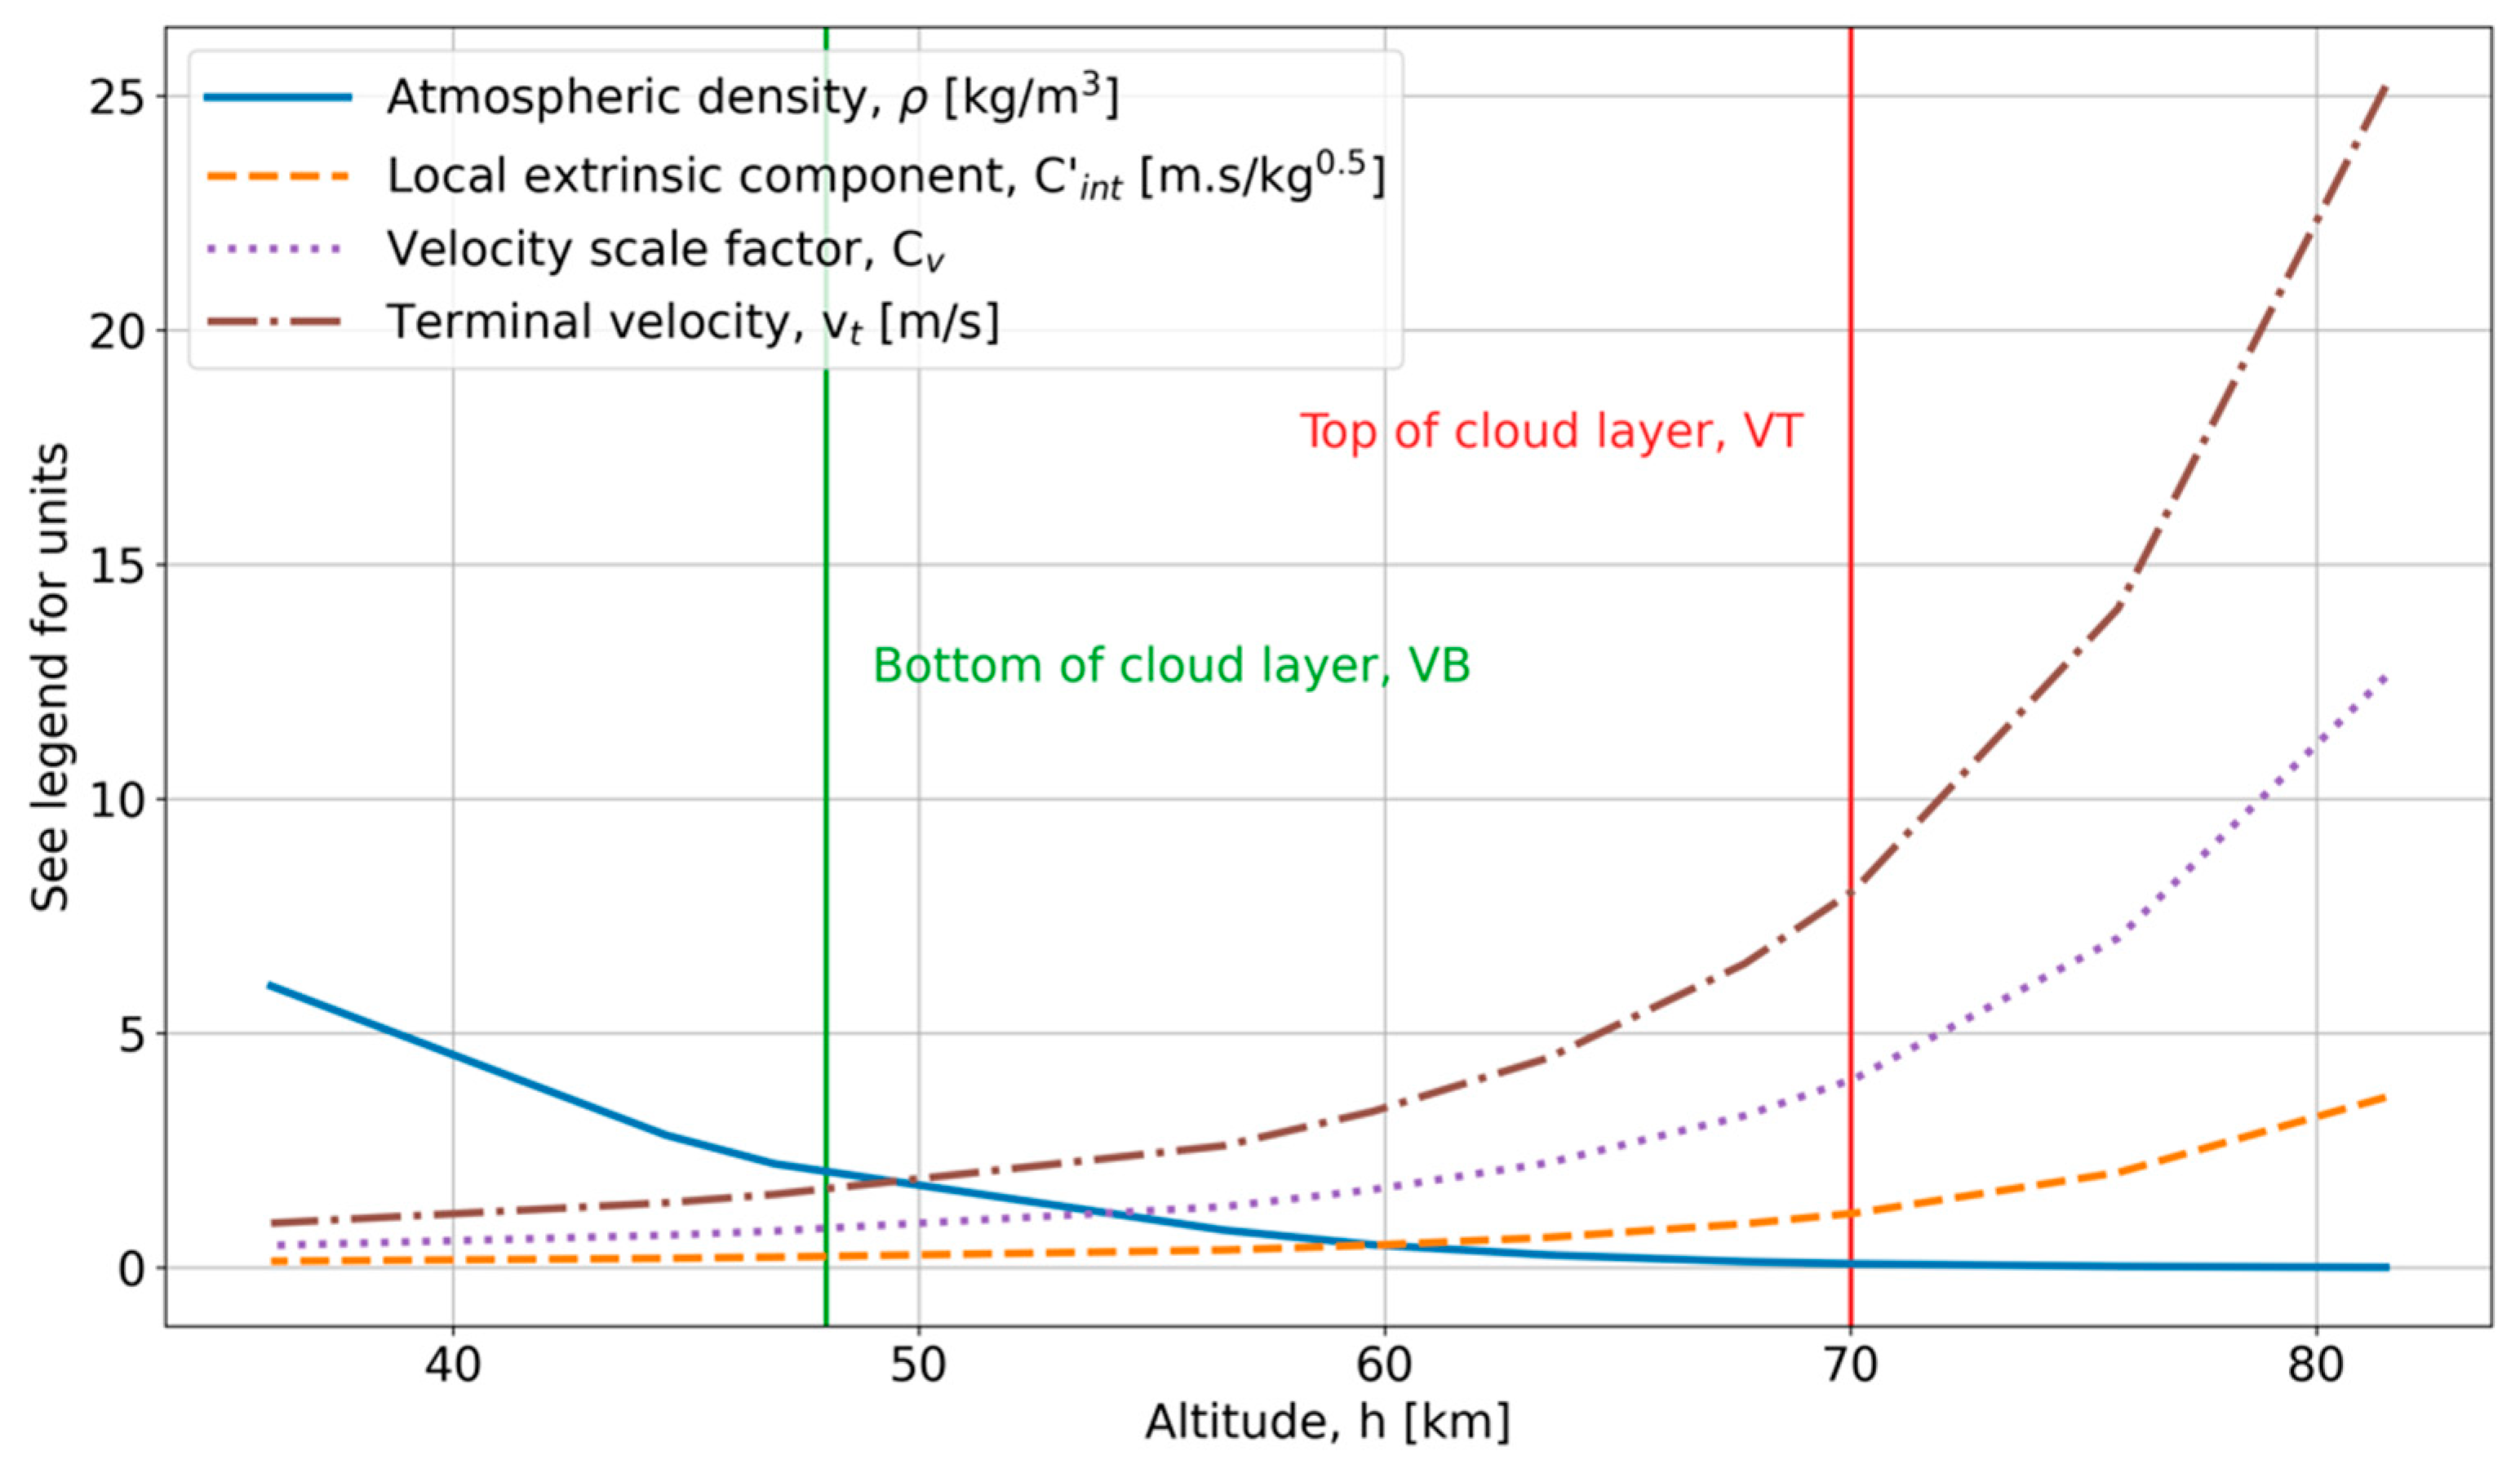
3.6. Extrapolation to Venusian Atmosphere
In order to extrapolate the behaviour of a probe in the Venusian atmosphere from the behaviour of a similar probe in Earth’s atmosphere near sea-level, the following logic is applied.
The density of the Venusian atmosphere is known at various altitudes [
14]. The acceleration under gravity on Venus is also known, enabling a calculation of a local extrinsic component,
C′
ext, at each altitude, h (this analysis ignores the variation in gravity with height since this is less than 3%). It is then possible to calculate a velocity scale factor
Cv by taking the ratio of >
C′
ext to
Cext (the latter calculated for the conditions on Earth at sea-level, i.e., the known conditions).
The local terminal velocity is then the terminal velocity under known conditions scaled by Cv, and the time to fall from one height to another is a simple summation.
This analysis is purely steady-state, ignoring transient effects either on orbital insertion or as the atmosphere thickens, and assumes that the coefficient of lift CL is constant.
4. Results
4.1. Results of the Sycamore Seed Drop Test
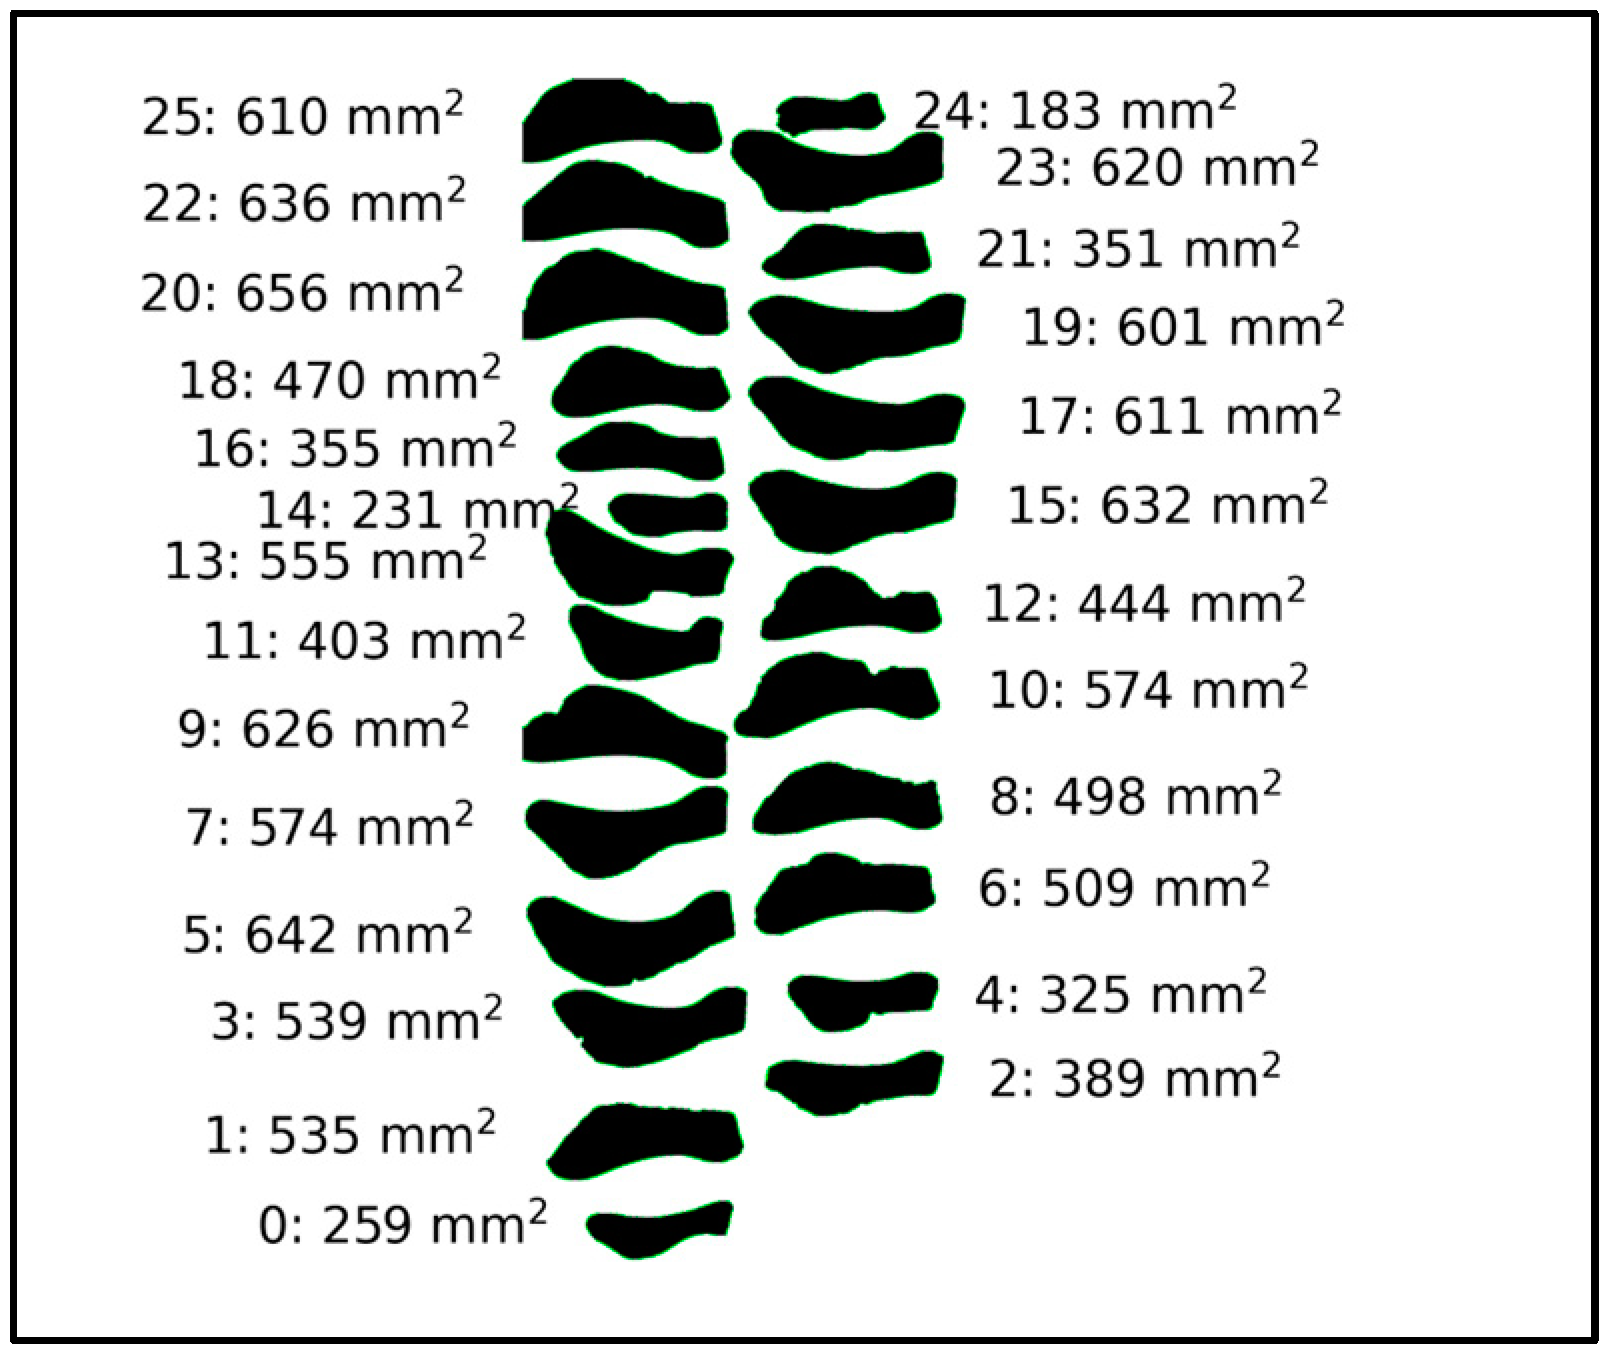
The outlines of the sycamore seeds tested are shown (
Figure 13). The masses; timing; average falling speed,
; surface area and intrinsic component,
Cint, are also shown (
Table 2).
The intrinsic component for these results is plotted against average falling speed (
Figure 13) with the Varshney 2012 [
13] data for comparison.
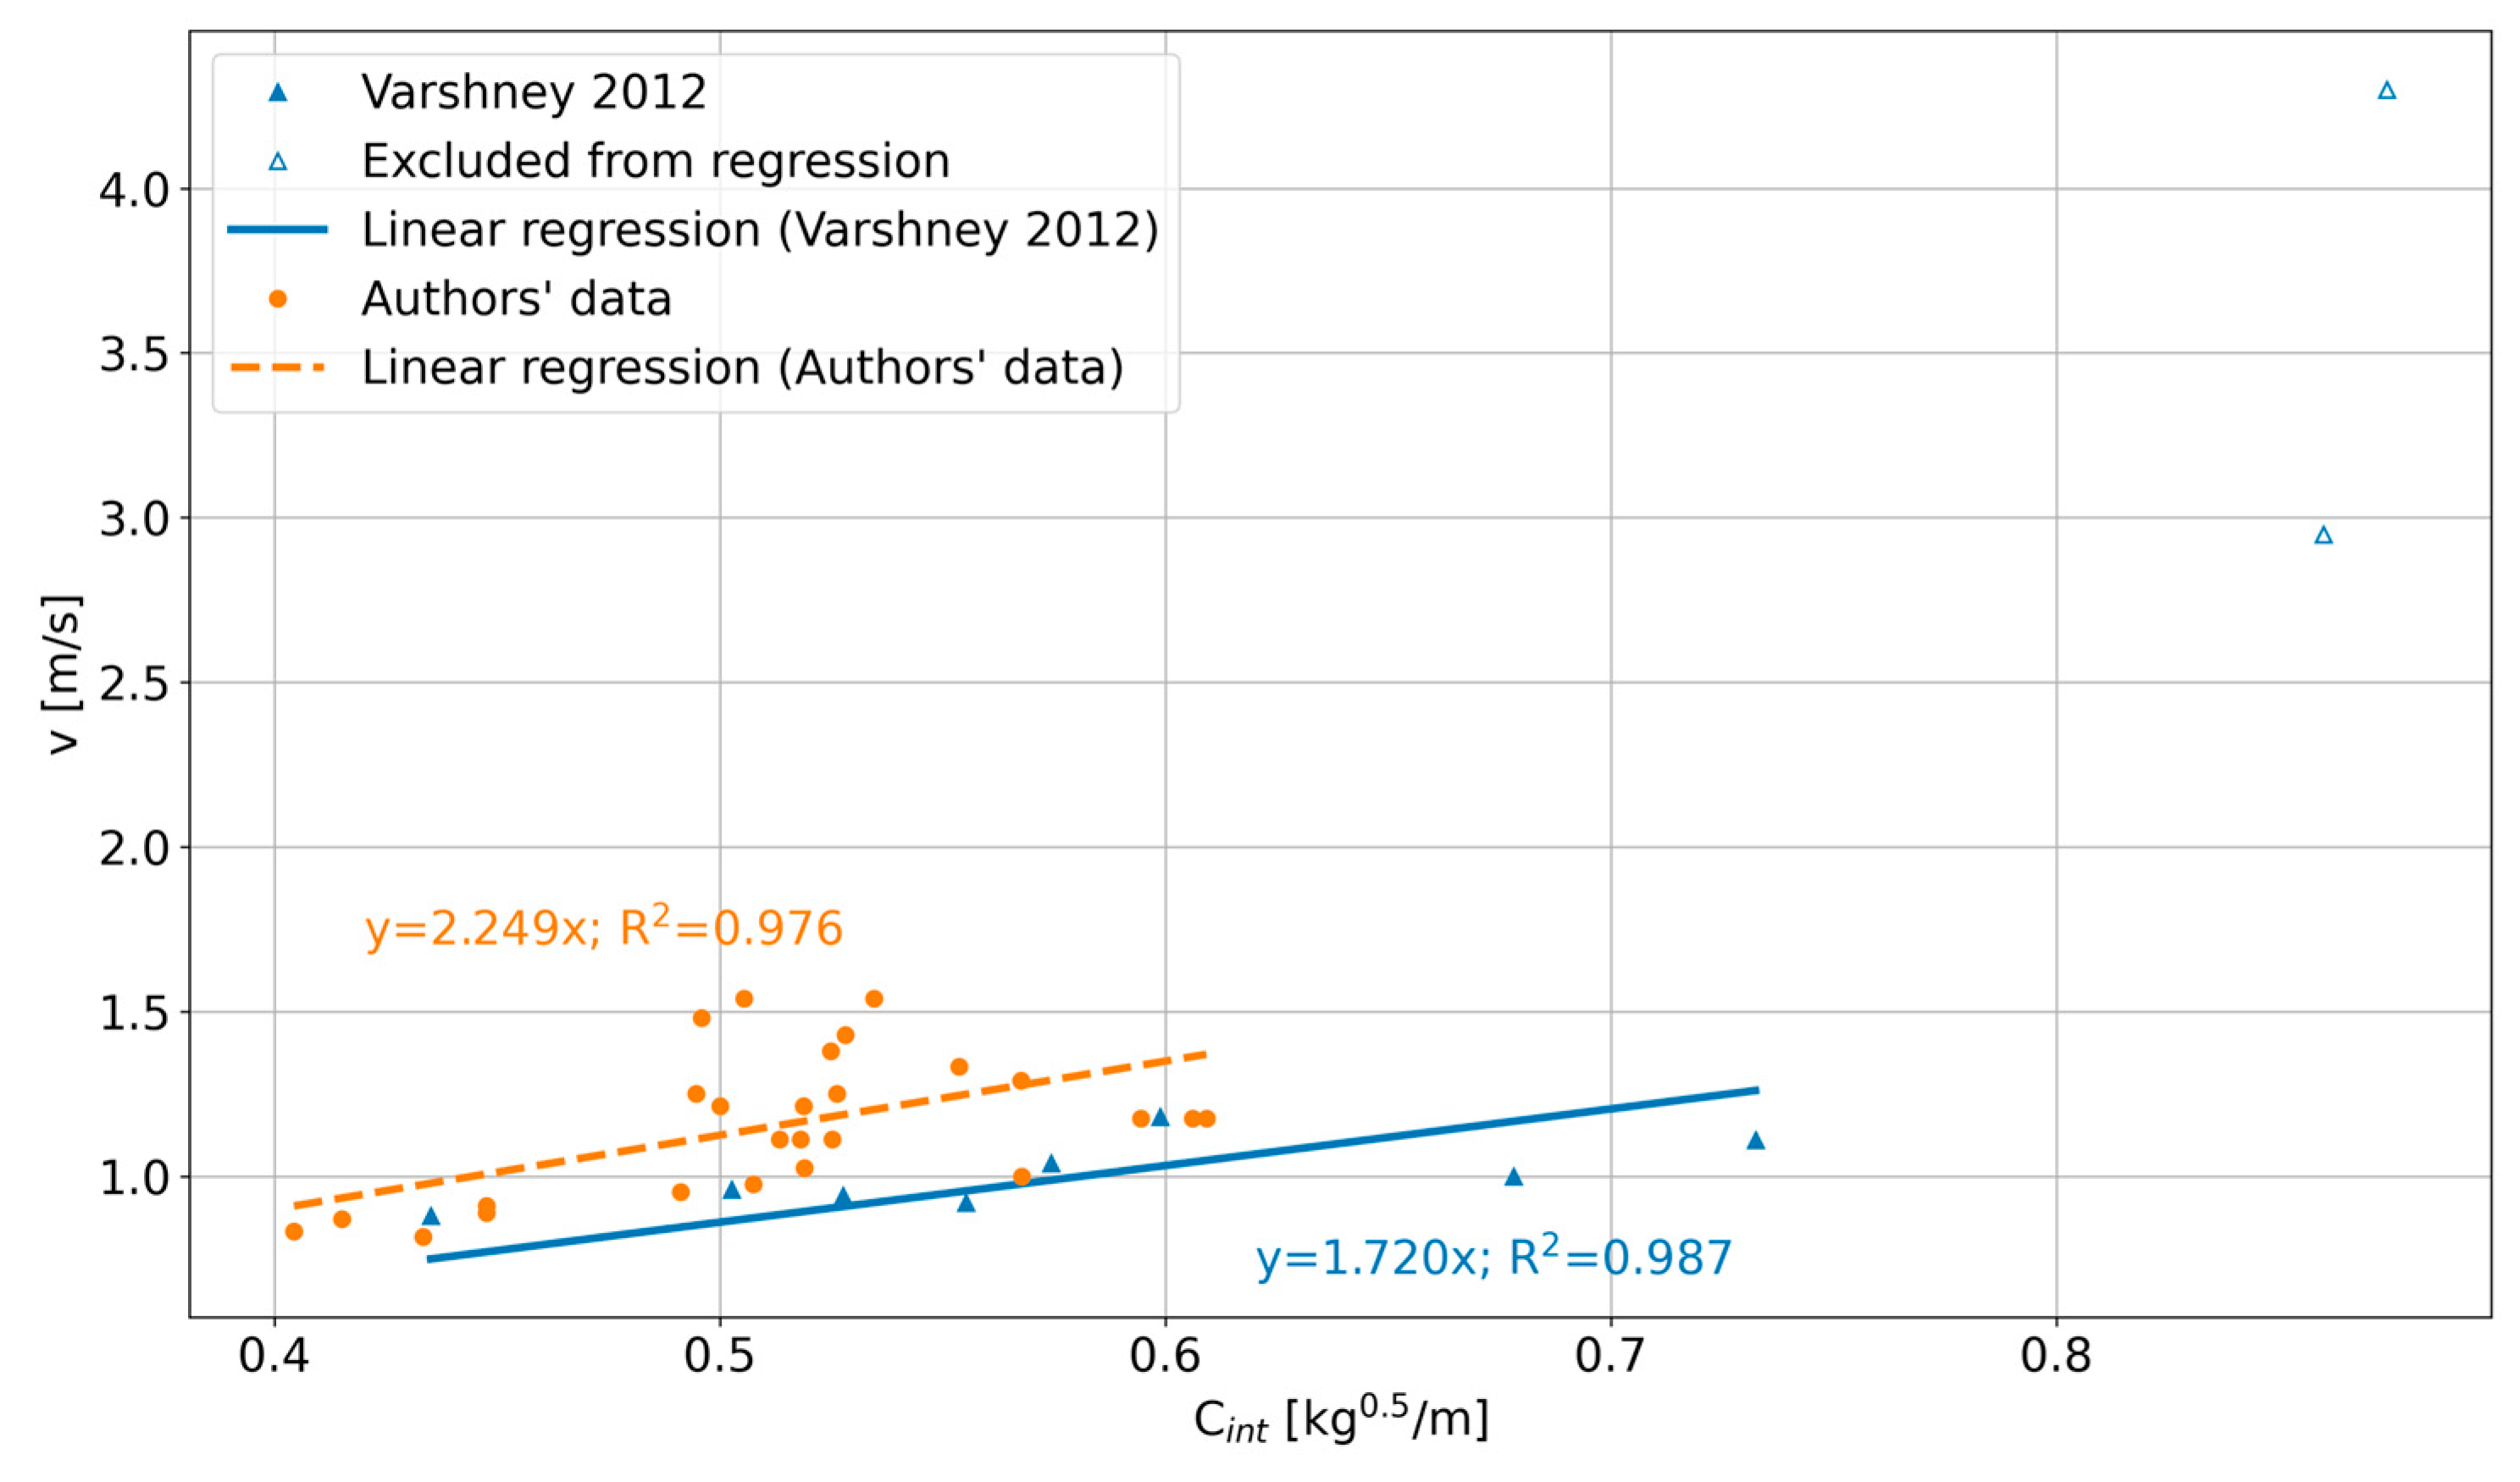
4.2. Results of the Test Article 1
Flight time from 62 m altitude for TA1 was 31.0 s, giving an average speed,
, of 2.0 m/s. This data is added to the plot of velocity against intrinsic component (
Figure 14). TA1 rapidly achieved stable helical flight which continued to the ground.
4.3. Results of the Test Article 2
Flight time from 80 m altitude for TA2 was 15.7 s, giving an average speed,
, of 5.1 m/s. Wind speed during the test was <2.2 m/s (<5 mph). Referring to the video available in
Appendix A, the flight may be broken down into several phases, which are described below in relation to the elapsed flight time, t.
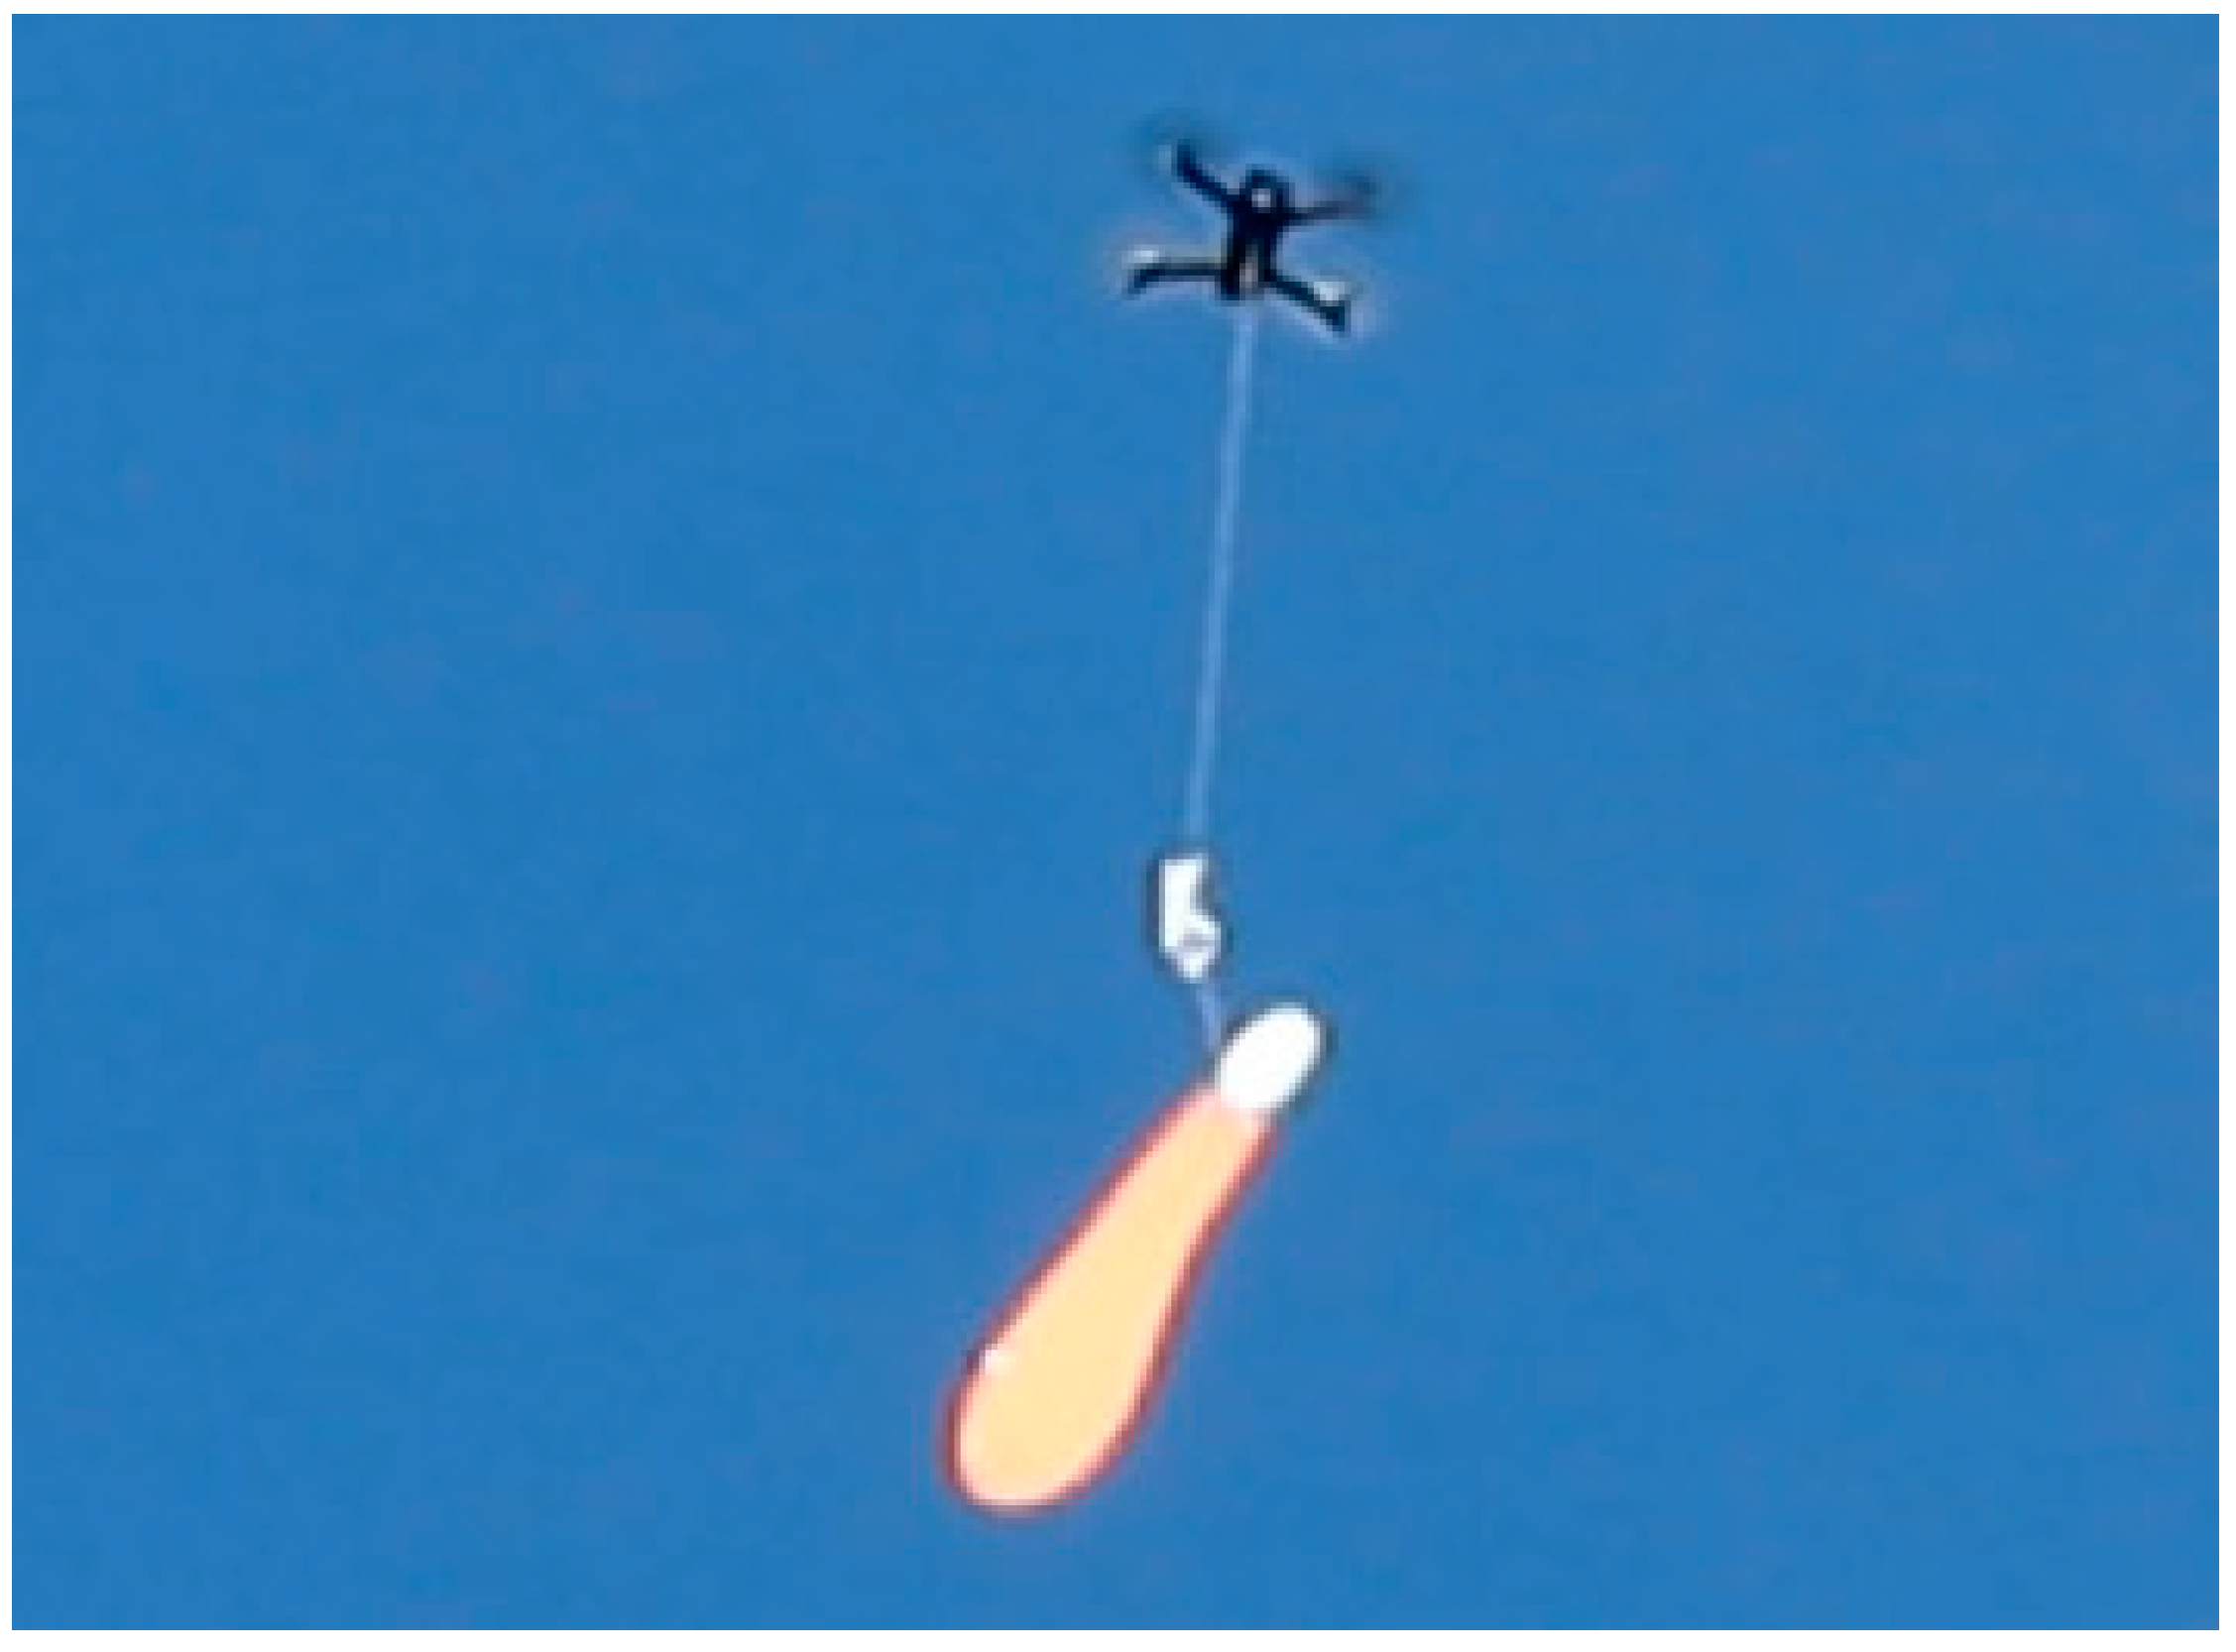
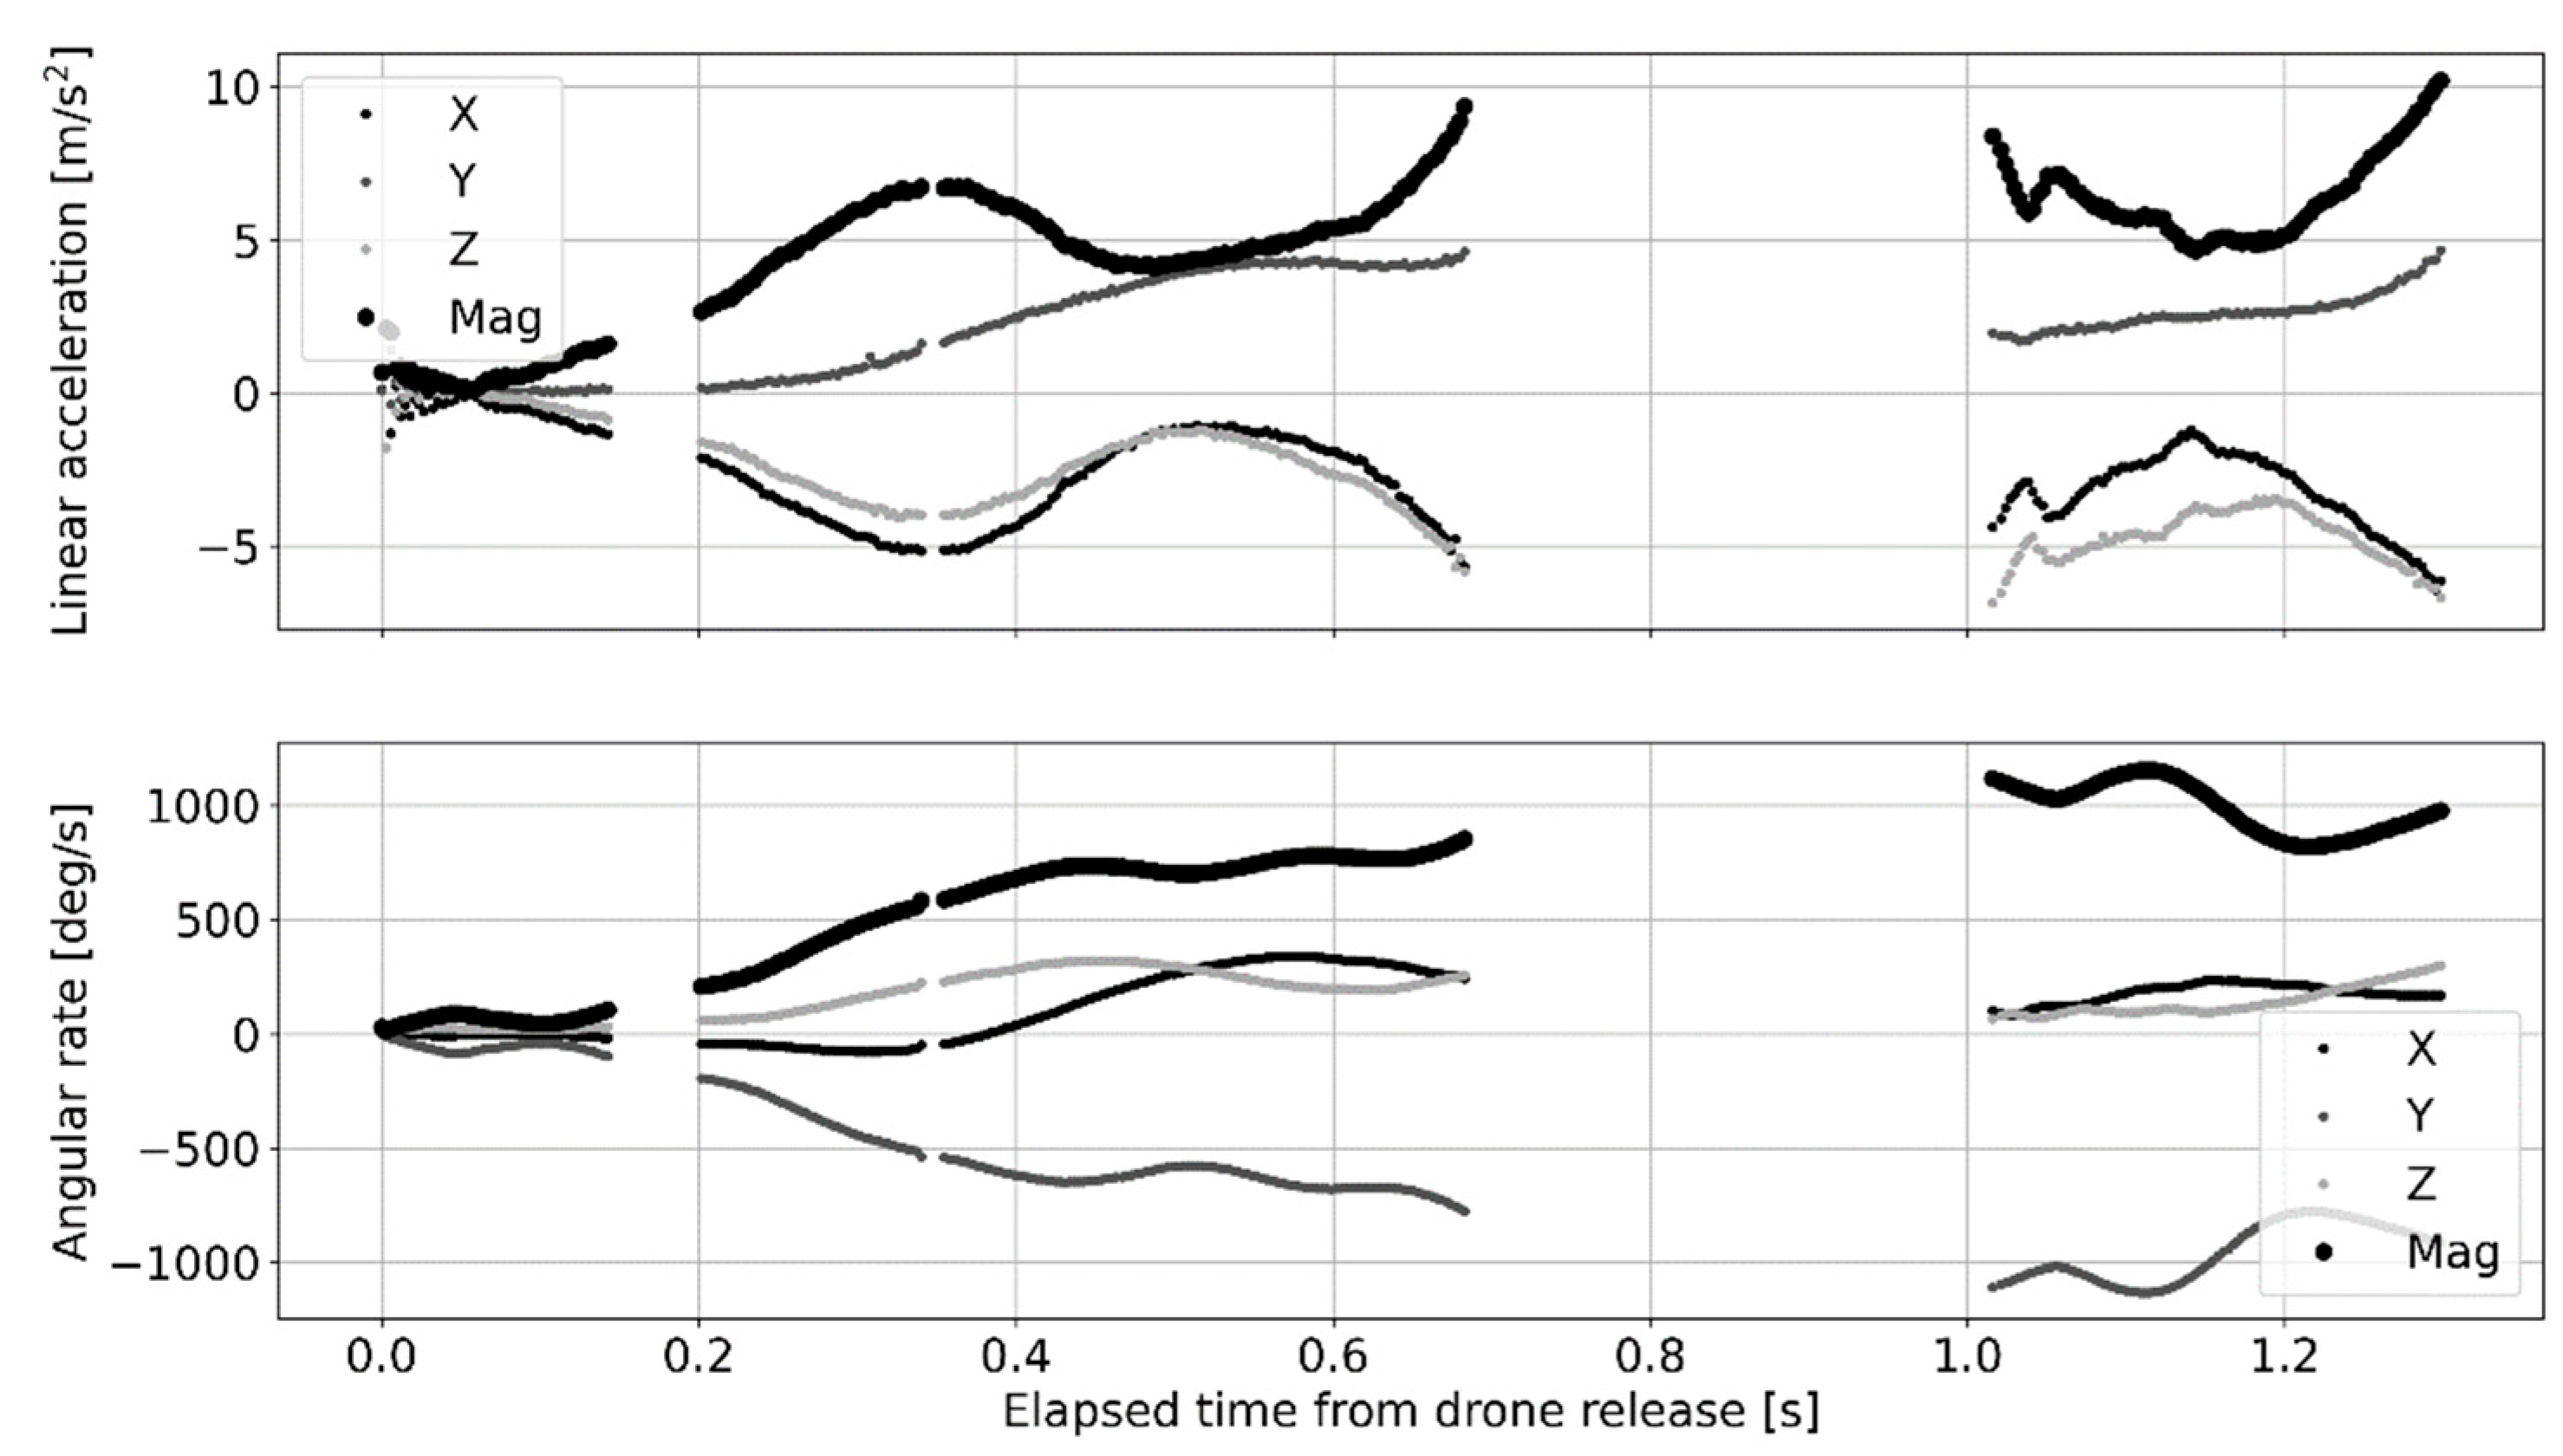
4.3.1. Phase 1: Release and Initial Fall (0 < t < 1.3 s)
TA2 is hanging tail downwards until release (t = 0) (
Figure 15) and remains in this orientation until t ≈ 0.2 s after which the seed begins to rotate lower relative to the tail. TA2 then falls seed first but still without significant rotation until t ≈ 1.3 s (
Figure 16).
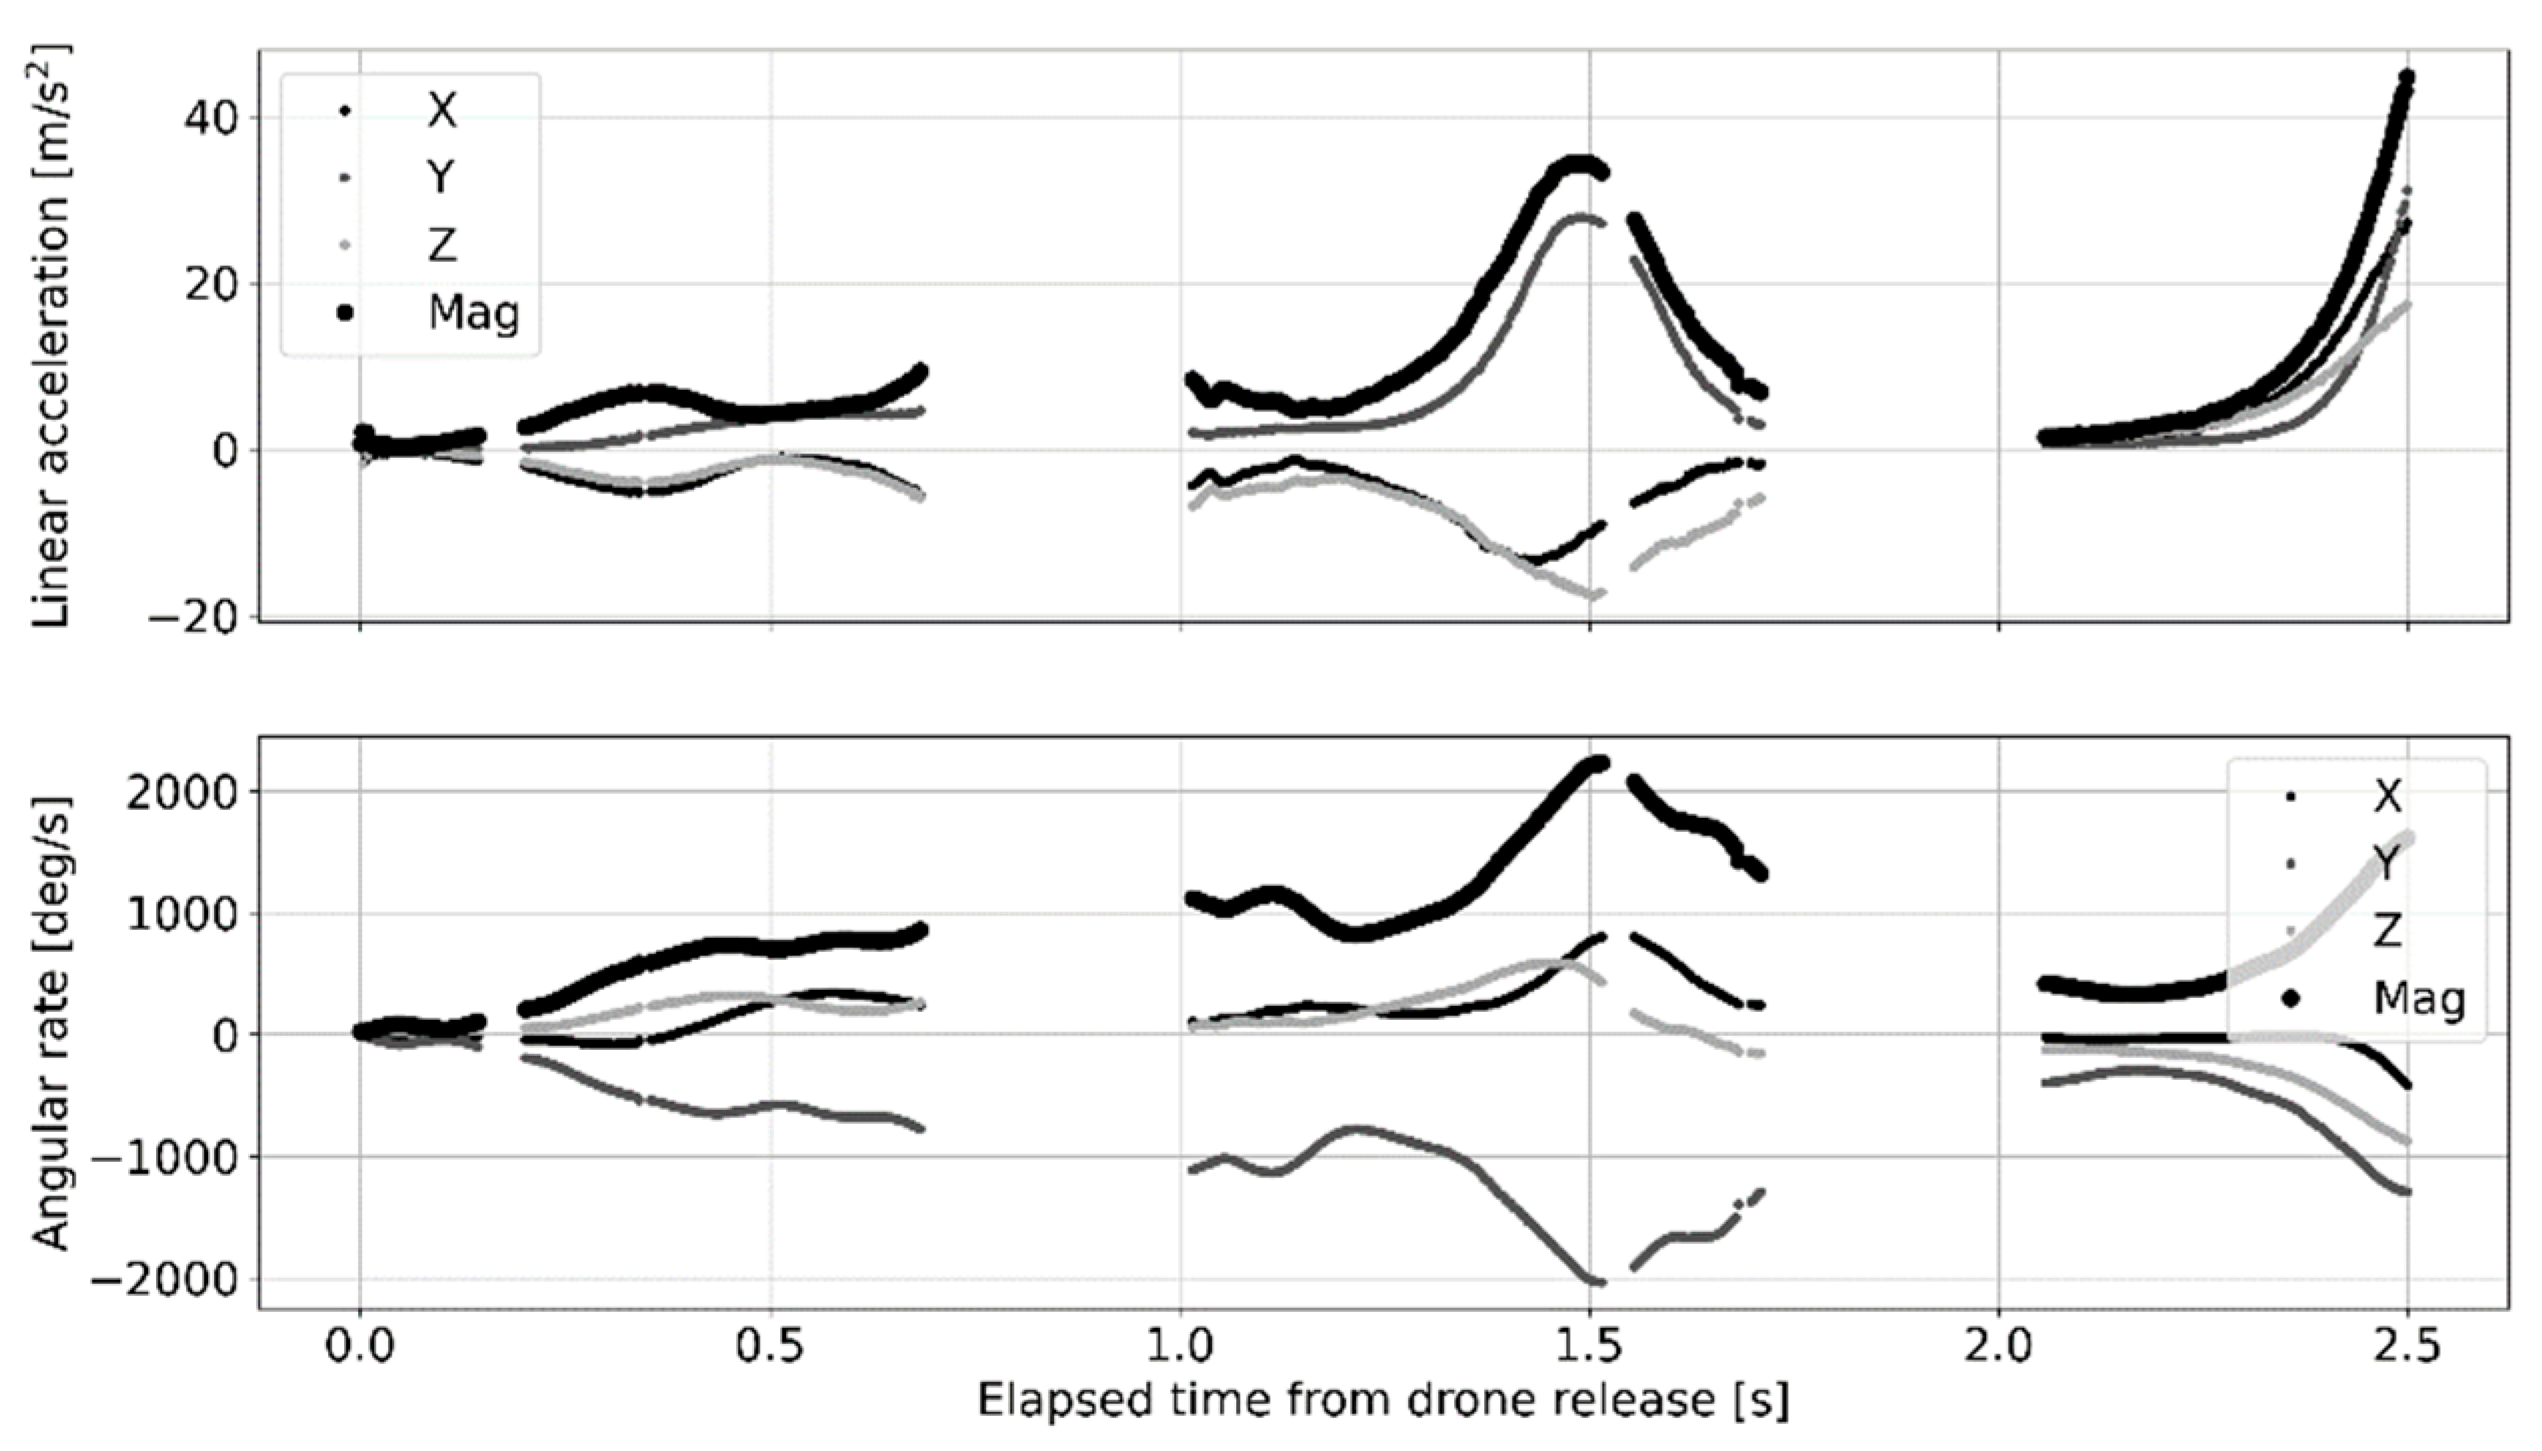
4.3.2. Phase 2: Release and Initial Fall (1.3 < t < 2.4 s)
Rotation commences, but in the reverse direction to that expected given the wing geometry (
Figure 7). However, this rotation quickly ceases, at t ≈ 1.6 s, and TA2 again falls seed downwards (
Figure 17).
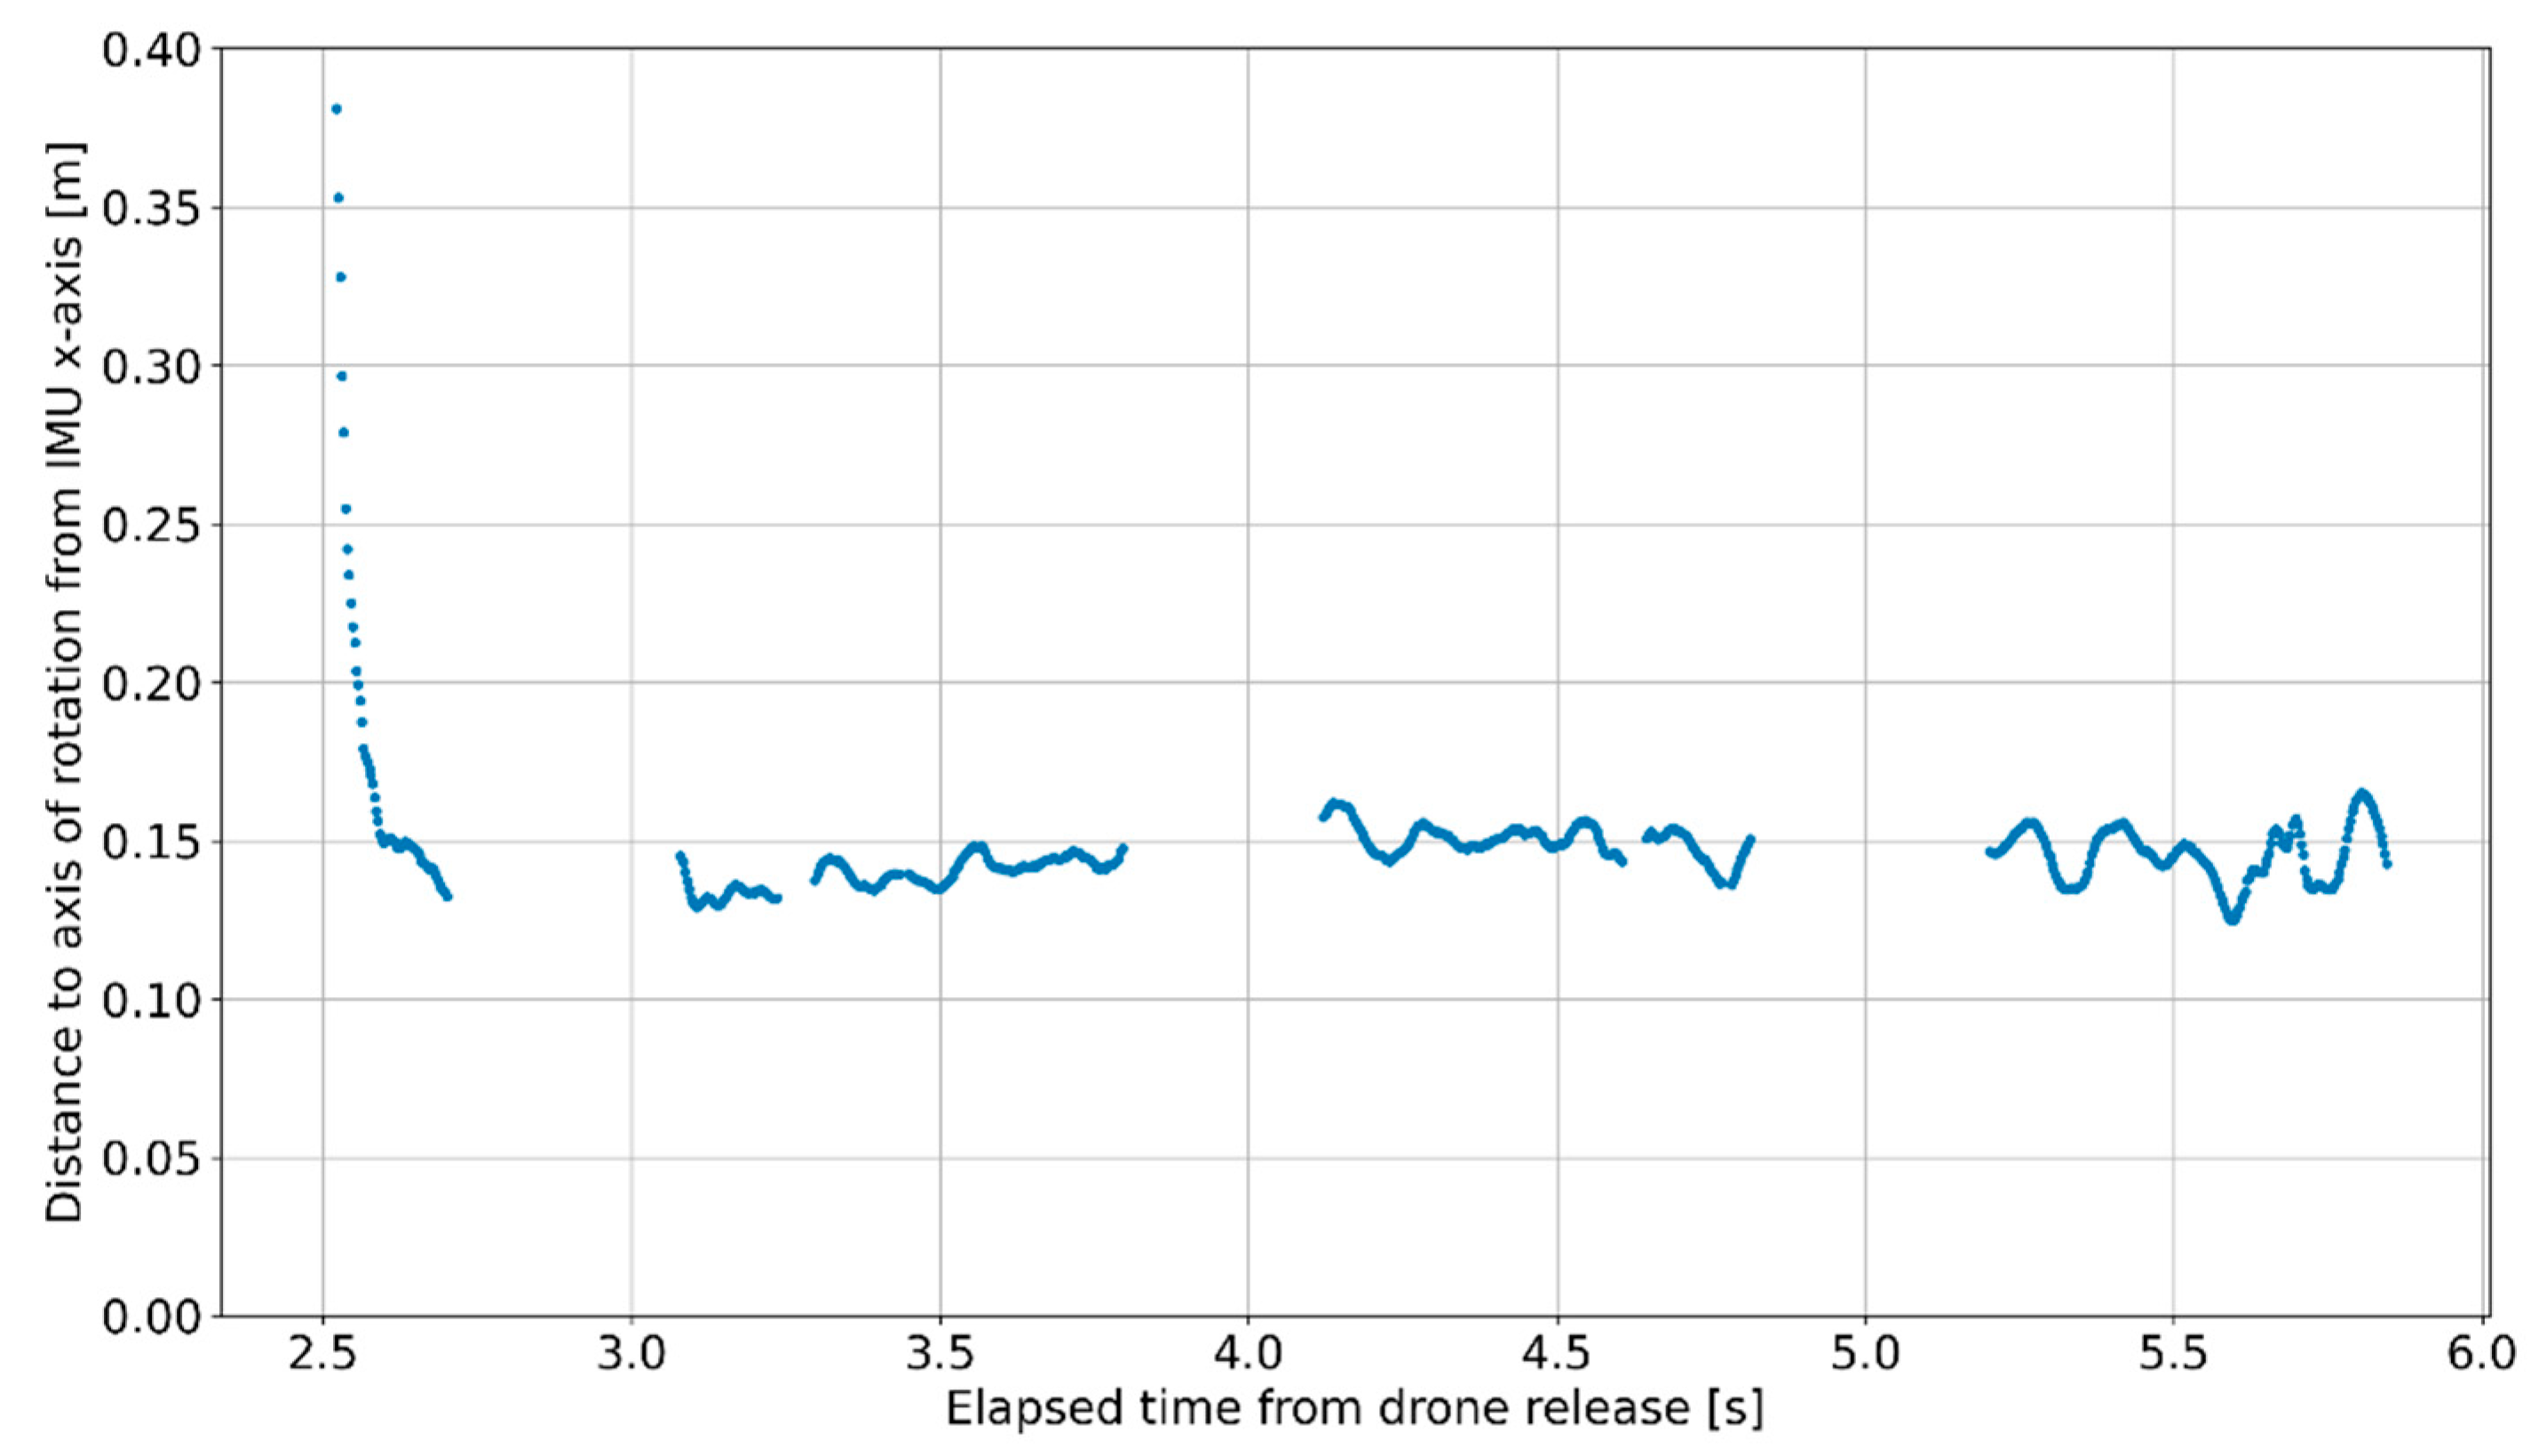
4.3.3. Phase 3: Stable Forward Rotation (2.4 < t < 5.6 s)
Forward rotation commences at t ≈ 2.4 s and continues with stable flight and rotation axis vertical until t ≈ 5.6 s (
Figure 18). The rate of rotation stabilises at ≈1220°/s (200 rpm). The axis of rotation is located ≈140 mm from the IMU during this period (
Figure 19).
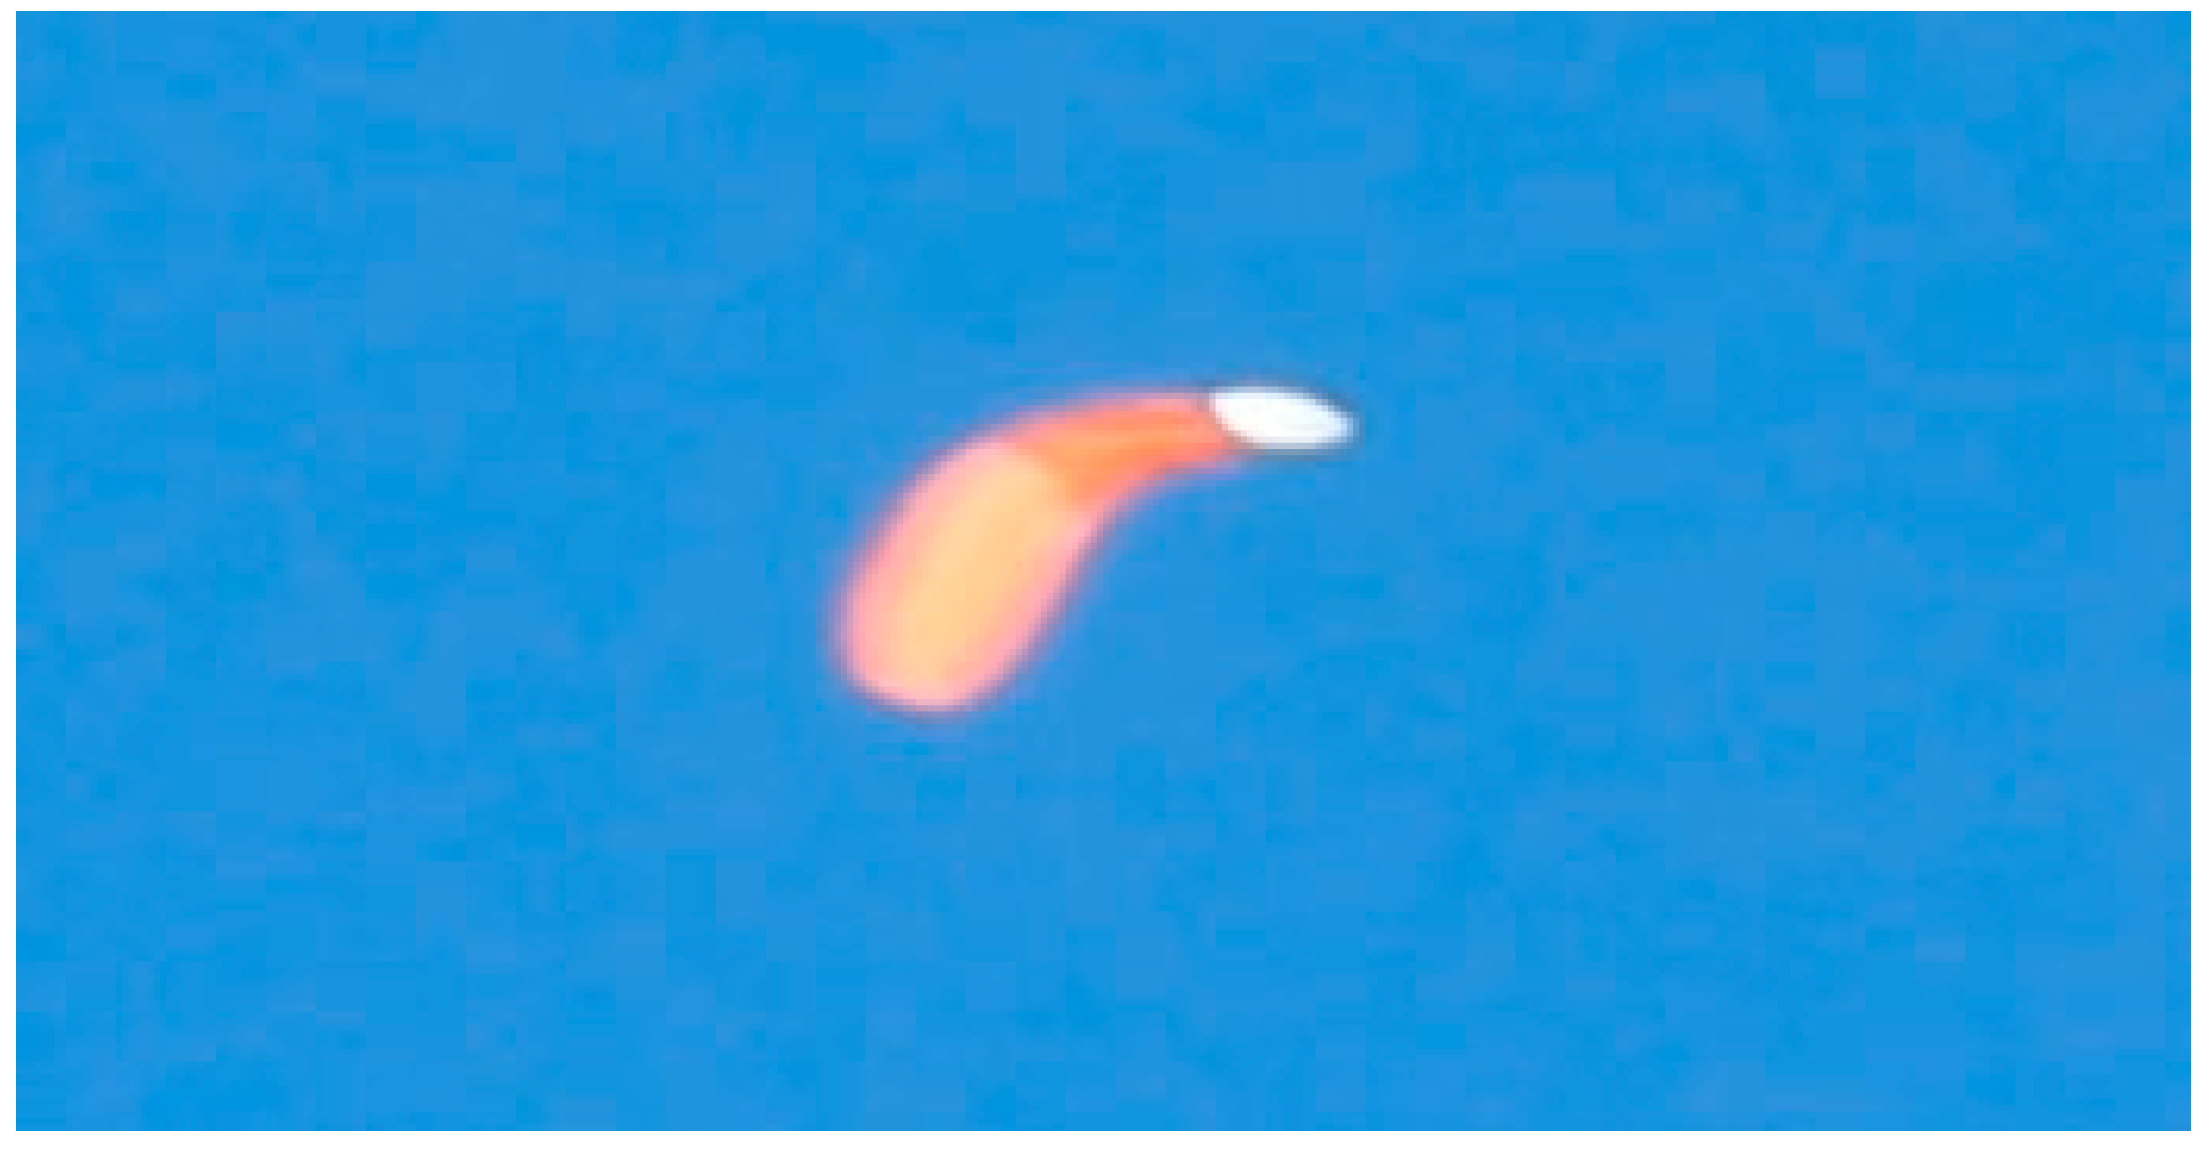
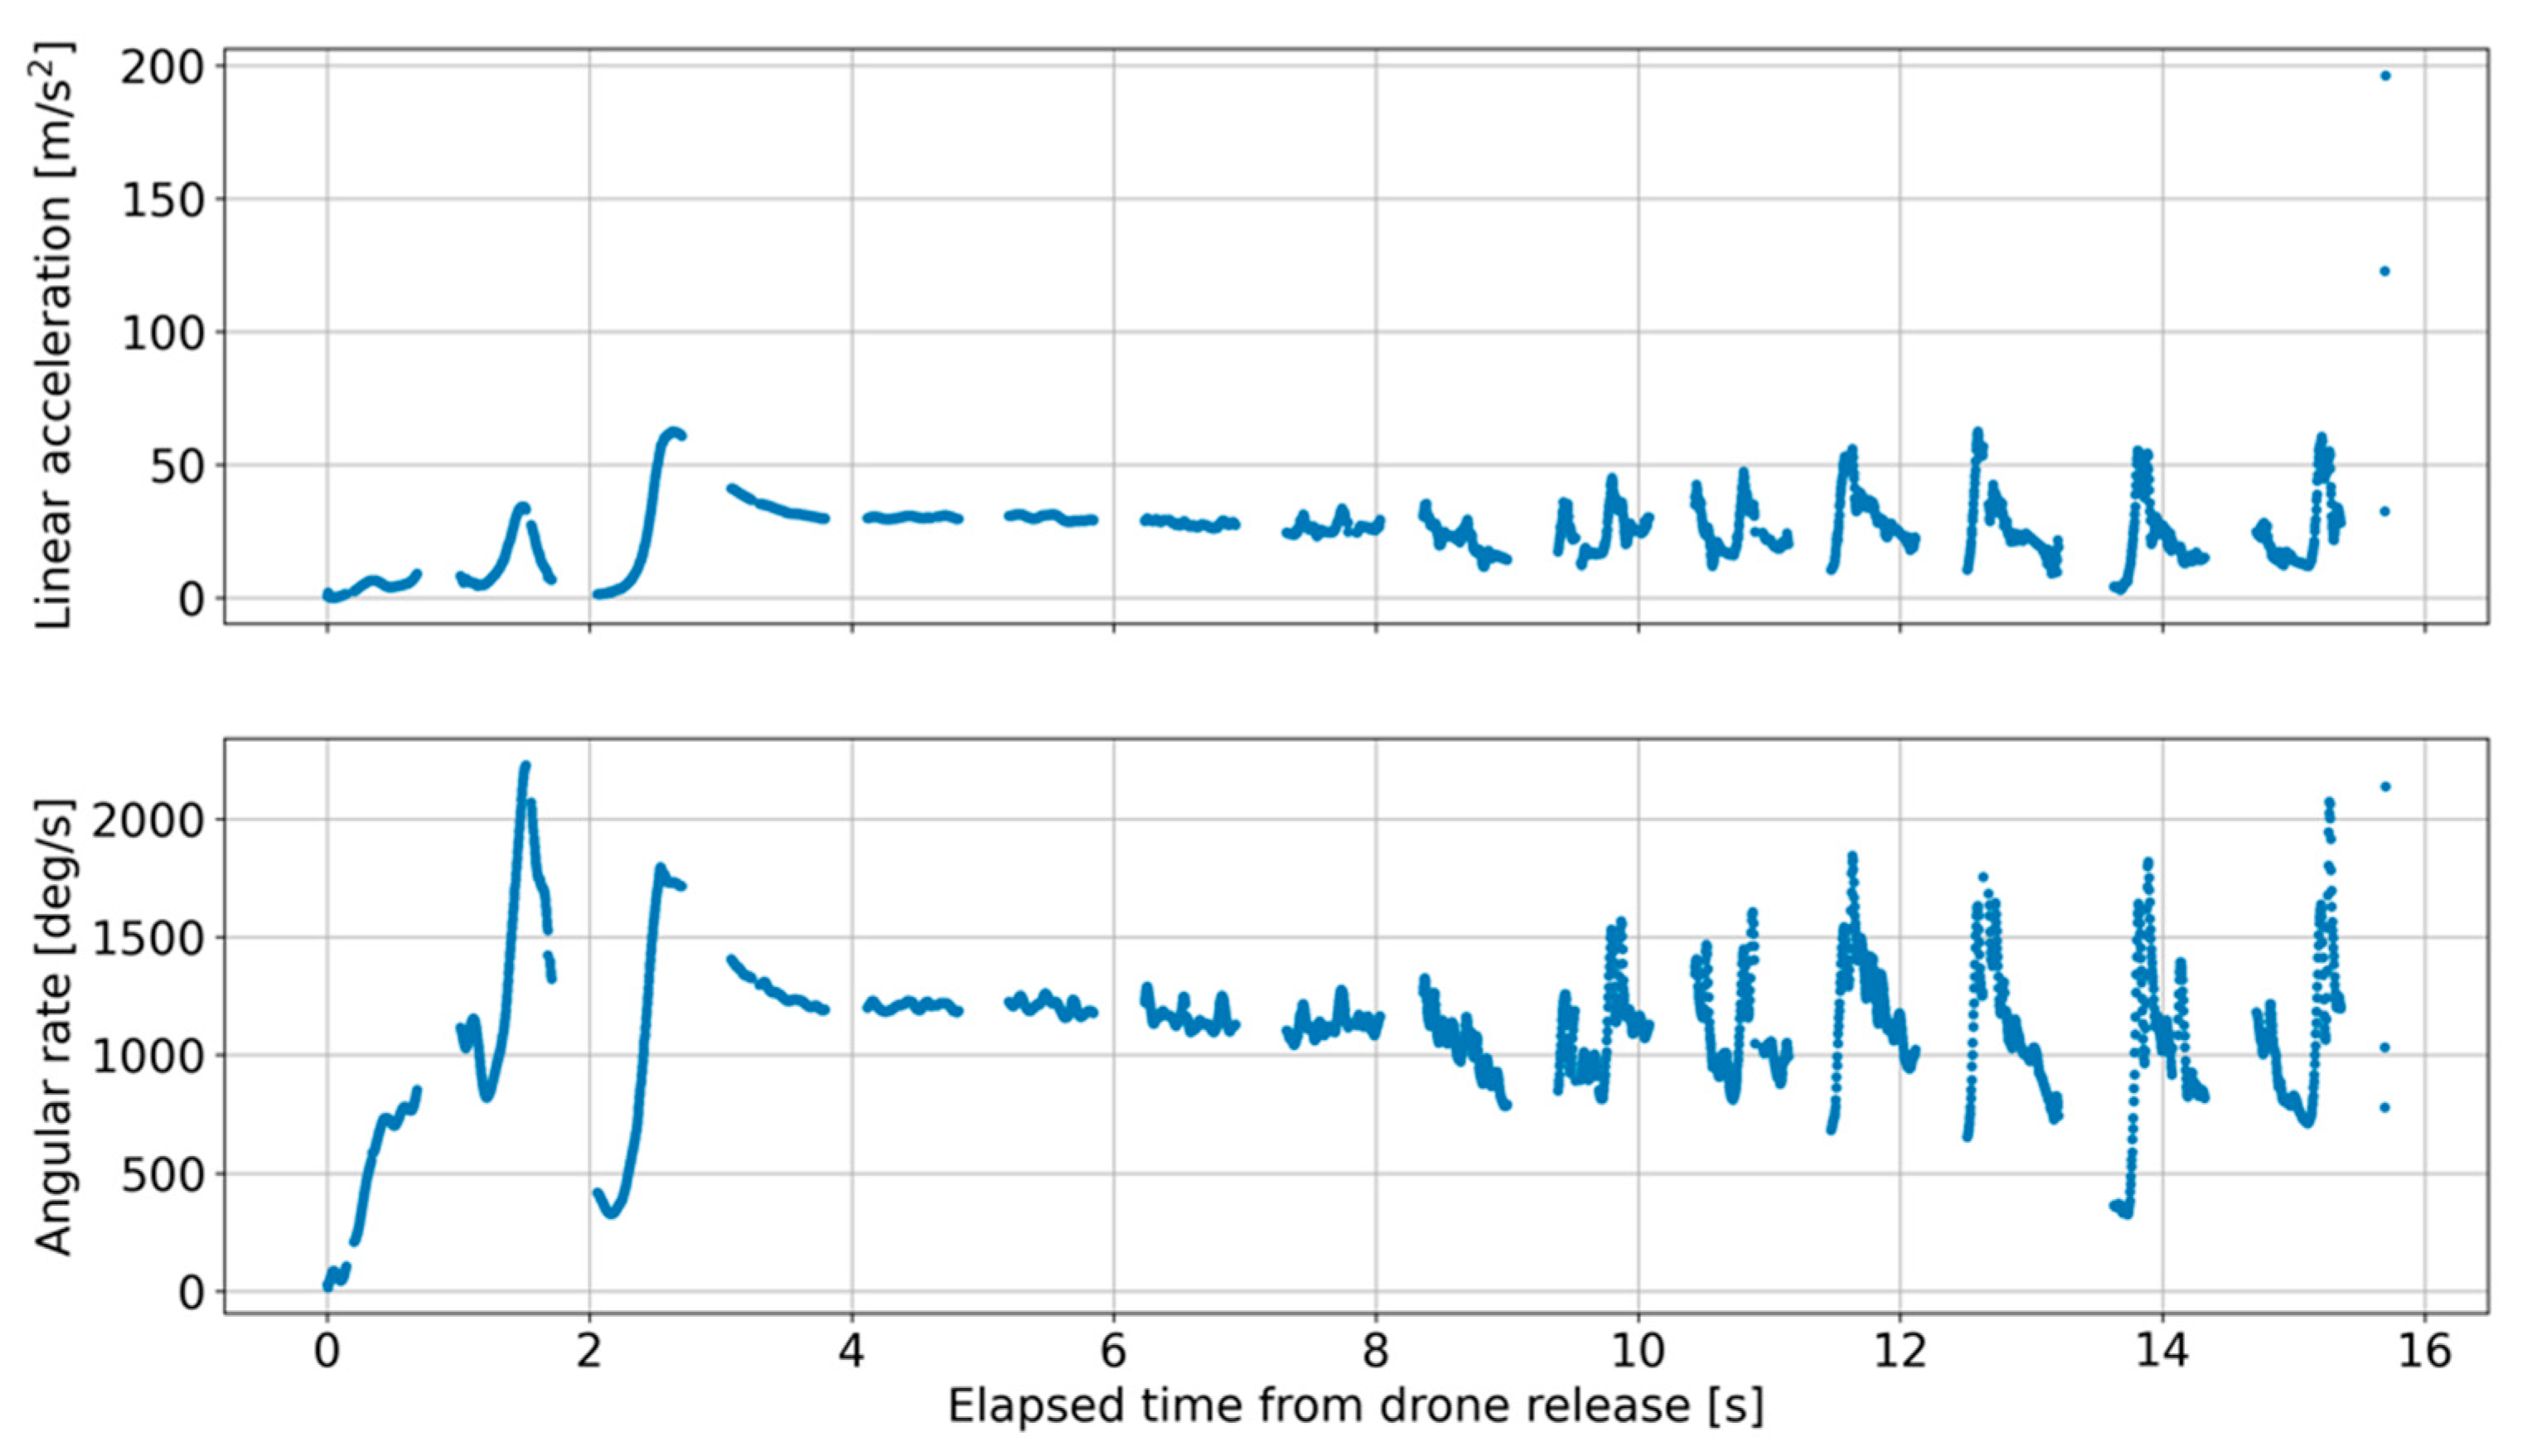
4.3.4. Phase 4: Unstable Forward Rotation (5.6 < t < 15.7 s)
Forward rotation continues but the axis of rotation no longer remains vertical. At several points the wing is observed to momentarily fold under aerodynamic loads (for example
Figure 20). First impact with the ground is recorded at 15.7 s (
Figure 21).
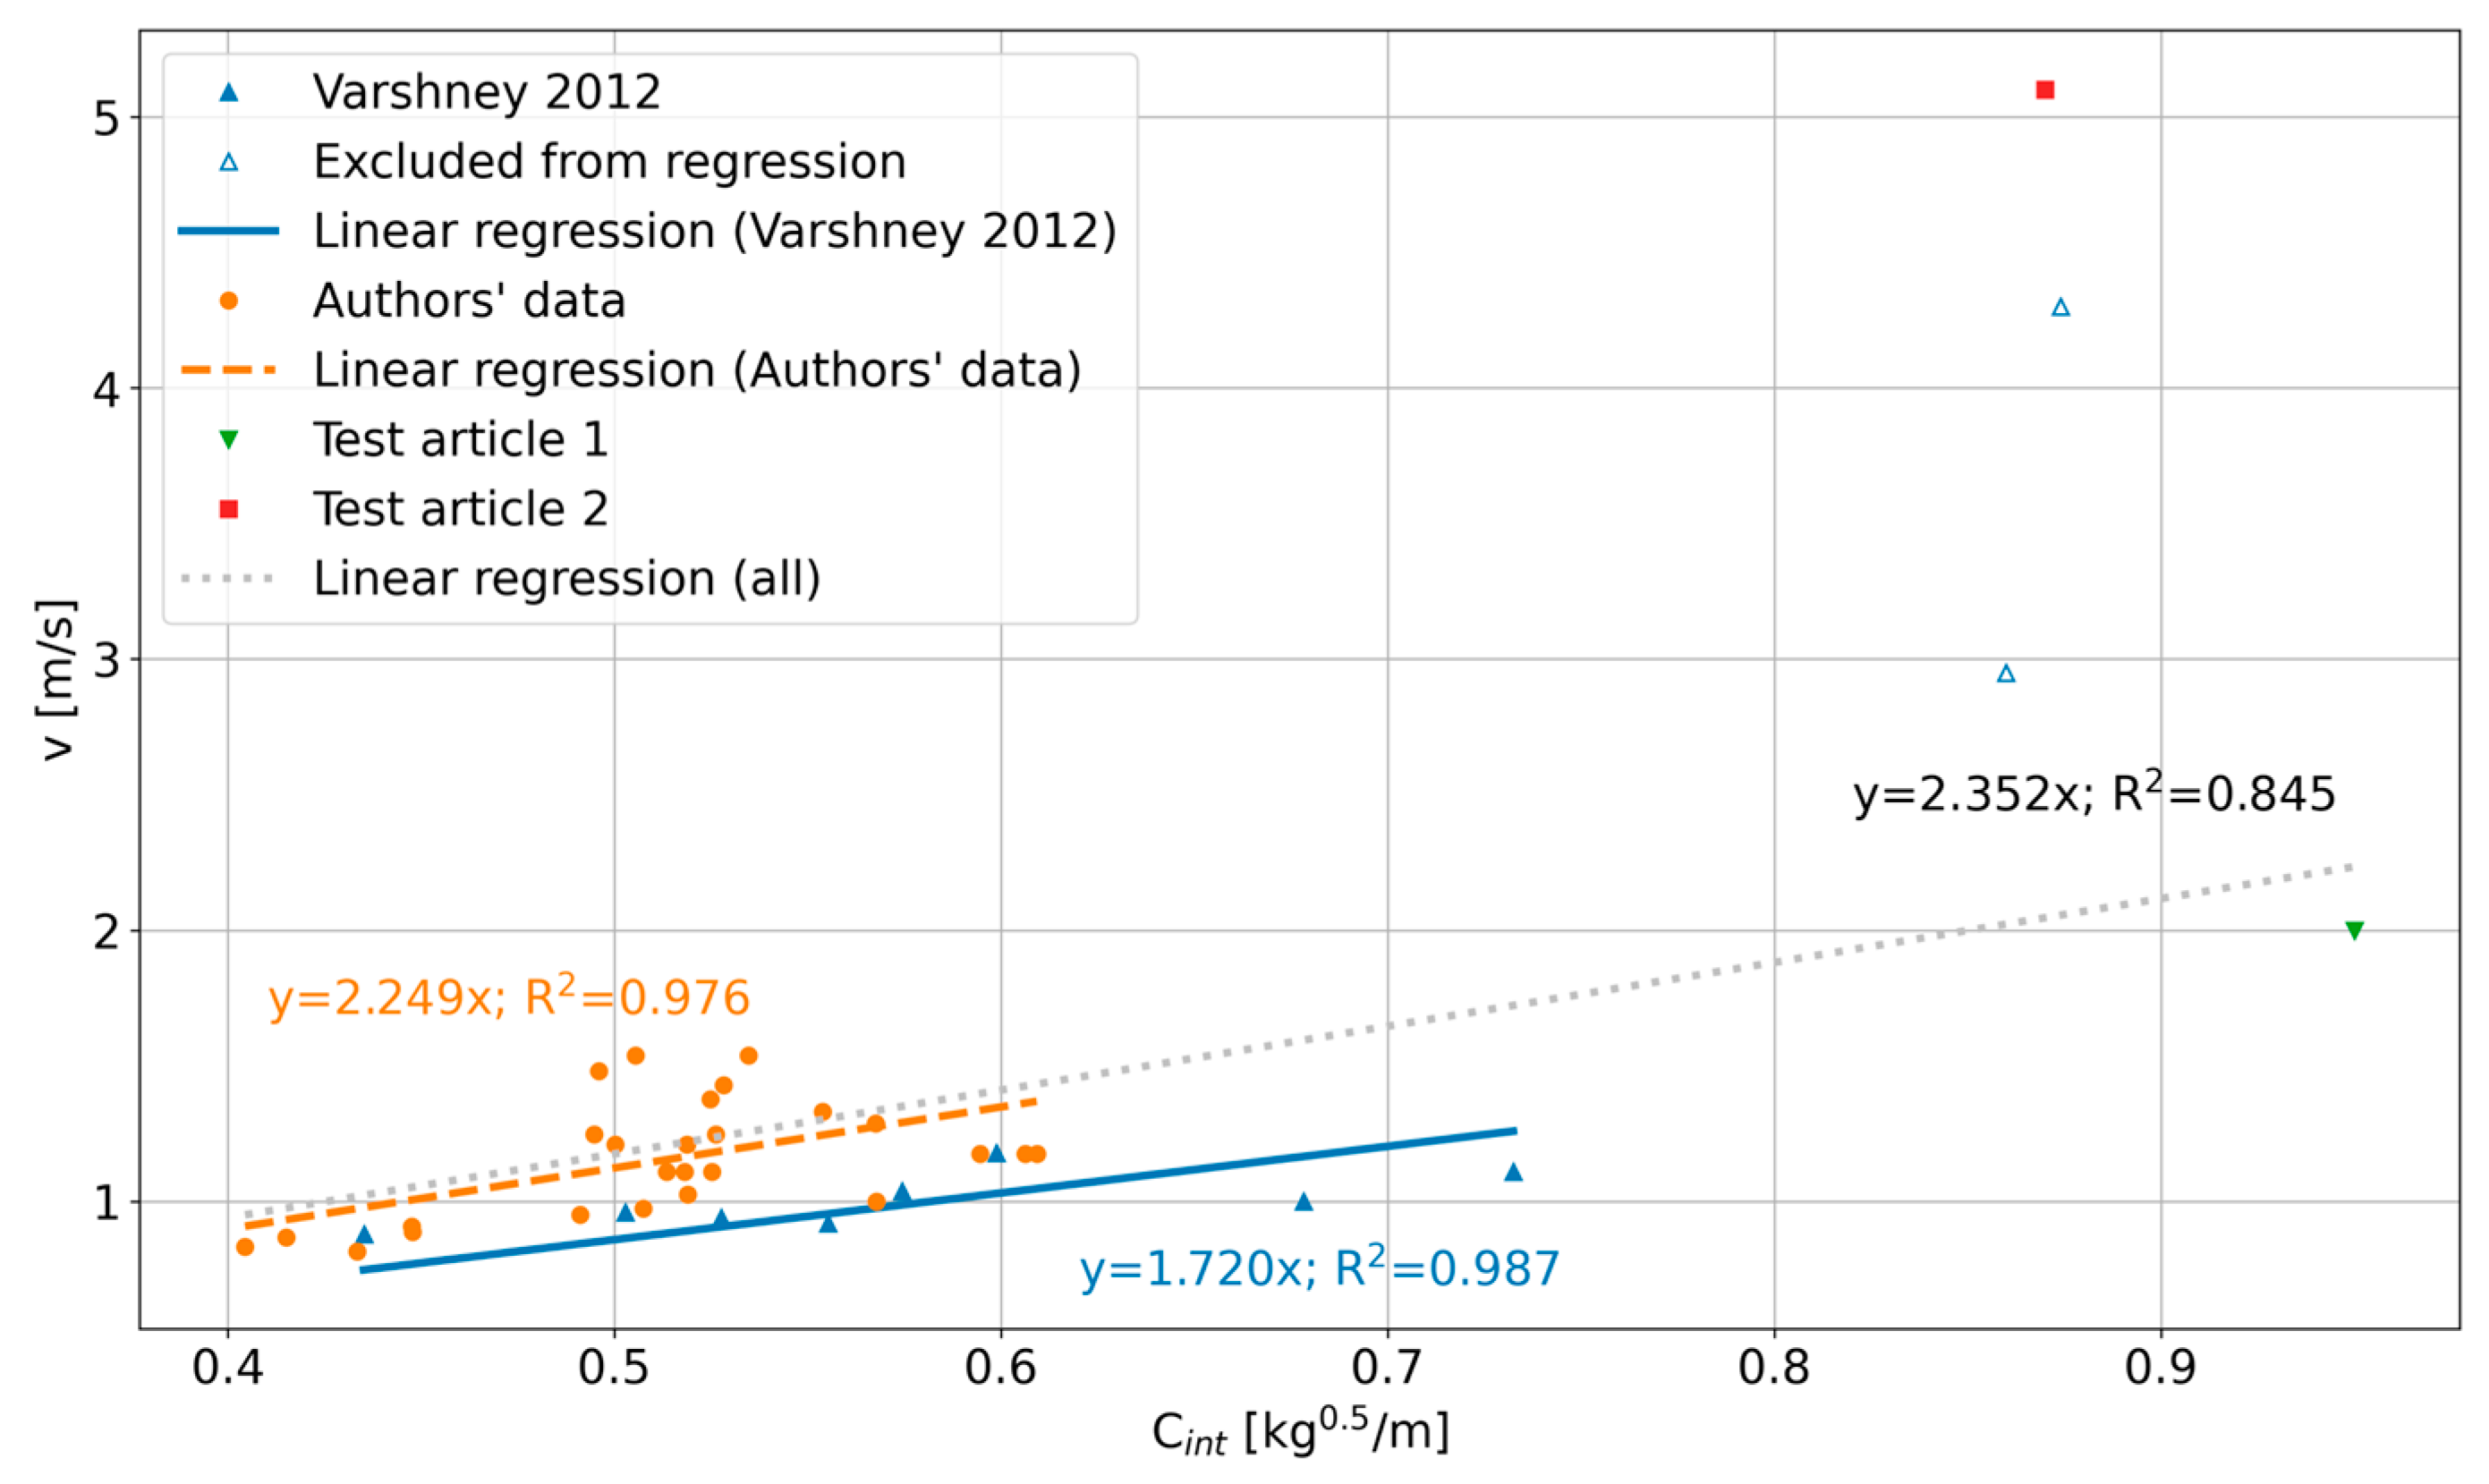
4.4. Aggregate Data
The combined results from Varshney, 2012 [
13], the authors’ sycamore seed data, TA1 and TA2 are shown (
Figure 22). Clearly the TA2 data point lies a long way from the regression line and the other results. Further work is required to understand why the falling speed is 2.5× greater than expected.
4.5. Extrapolation to Venusian Atmosphere
Putting to one side the adverse result from TA2, this section examines the results of extrapolating from expected Earth performance to Venus. Key parameters (
Table 3) and intermediate model outputs are shown (
Figure 23). The total time required to fall from VT to VB is 124 min (compared to 183 min to fall the same distance under Earth sea-level (ESL) conditions). This is considerably longer than the 10 min required to perform a spectrometer cycle.
5. Discussion
Due to its simple design, there are very few parts that could fail on the LEVL probe itself and the largest risks would seem to be the sample collection and analysis in flight. The authors are also exploring the idea of using the wing surface for additional sampling using nanopore technology.
Referring to (
Figure 22), it is apparent that, while it has been possible to scale up from sycamore seeds to TA1 (mass ratio ≈ 70×) and maintain the speed/intrinsic component ratio, this is currently not the case with TA2. The average falling speed of TA2 is some 2.5× greater than predicted and this large discrepancy must be explained before significant further work is undertaken. Nonetheless, the applicability of this concept to a Venusian probe with a flight time of 124 min, and the design and construction which may be required can, at least, be discussed.
At the time of publication Test Article 3, a revision to TA2 with a sturdier wing structure, but still with a mass of 135 g is under construction. This will be dropped from a weather balloon later in 2022. This version will also carry an inertial measurement unit (IMU) to log acceleration, rotation and bearing data in flight. The authors have identified the need Computational Fluid Dynamics (CFD) modelling of flight, additional physical testing of more design concepts nearer final probe size, and more detailed design work.
Additionally, the authors have identified the possibility of using the centripetal force arising from rotation during flight to drive sample flow through the apparatus, and this will be explored further.
6. Conclusions
These initial findings suggest that a Leading-Edge Vortex Lift (LEVL) Sample Probe would fly in the Venusian Atmosphere and would give enough flight time to run a MEMS ion gas micro spectrometer analysis, maybe even a few times before the probe is crushed near the surface of the planet.
The stated requirement is to carry a payload of 340 g with dimensions 100 × 50 × 30 mm in a delivery system with an overall mass of 920 g. Using the concept of intrinsic components, this overall mass implies an area of 1.15 m2 or a wingspan of 1.6 m and chord of 700 mm. In length terms, TA2 is a third of the way there! An oblate spheroidal shell with major-axis 200 mm and minor-axis 80 mm will accommodate the payload and allow space for “plumbing”.
Additive manufacturing techniques capable of producing thin-walled articles in Ti-6Al-4V has been the subject of much research. For example, thin-walled microsatellite fuel tanks successfully produced by laser powder bed fusion (LPBF) with wall thicknesses down to 0.75 mm [
15]. Other authors suggest even more aggressive lower limits for wall thickness [
16].
Constructed from Ti-6Al-4V alloy at 0.8 mm wall thickness, this shell will weigh 180 g. Using fluoropolymer film for chemical resistance and GFRP stiffening, a wing can be constructed within the remaining mass budget.
The authors therefore believe that this is a viable design for sampling the Venusian cloud layer.
7. Patents
Patent application: GB2015141.1.
Author Contributions
C.I.: Initial concept, research and design and build of the test articles. N.J.: Engineering and modelling, design of Test Article 2. All authors have read and agreed to the published version of the manuscript.
Funding
This research received no external funding.
Institutional Review Board Statement
Not applicable.
Informed Consent Statement
Not applicable.
Data Availability Statement
Acknowledgments
We would like to acknowledge both of our wives for putting up with us working evenings and nights on this research. We would also like to thank Matthew Isaac, Eoghan Jones, and Amy Jones for helping with our experiments. Additionally, a special thanks to Sara Seager and Janusz J. Petkowski for their encouragement and insights on this project.
Conflicts of Interest
The authors declare no conflict of interest.
References
- Krishnamoorthy, S.; Martire, L.; Bowman, D.; Komjathy, A.; Cutts, J.A.; Pauken, M.T.; Garcia, R.; Mimoun, D.; Lai, V.H.; Jackson, J.M. Advances towards Balloon-Based Seismology on Venus; Sandia National Lab. (SNL-NM): Albuquerque, NM, USA, 2019. [Google Scholar]
- Babu, K.M.K.; Pant, R.S. A review of Lighter-than-Air systems for exploring the atmosphere of Venus. Prog. Aerosp. Sci. 2020, 112, 100587. [Google Scholar] [CrossRef]
- Hein, A.M.; Lingam, M.; Eubanks, T.M.; Hibberd, A.; Fries, D.; Blase, W.P. A precursor Balloon mission for Venusian astrobiology. Astrophys. J. Lett. 2020, 903, L36. [Google Scholar] [CrossRef]
- Hall, J.L.; Pauken, M.; Schutte, A.; Krishnamoorthy, S.; Aiazzi, C.; Izraelevitz, J.; Lachenmeier, T.; Turner, C. Prototype Development of a Variable Altitude Venus Aerobot. In Proceedings of the AIAA Aviation 2021 Forum, Virtual, 2–6 August 2021; p. 2696. [Google Scholar]
- Arredondo, A.; Hodges, A.; Abrahams, J.N.H.; Bedford, C.C.; Boatwright, B.D.; Buz, J.; Cantrall, C.; Clark, J.; Erwin, A.; Krishnamoorthy, S.; et al. VALENTInE: A Concept for a New Frontiers–Class Long-duration In Situ Balloon-based Aerobot Mission to Venus. Planet. Sci. J. 2022, 3, 152. [Google Scholar] [CrossRef]
- Seager, S.; Petkowski, J.J.; Carr, C.E.; Grinspoon, D.; Ehlmann, B.; Saikia, S.J.; Agrawal, R.; Buchanan, W.; Weber, M.U.; French, R. Venus Life Finder Mission Study. arXiv 2021, arXiv:2112.05153. [Google Scholar]
- French, R.; Mandy, C.; Hunter, R.; Mosleh, E.; Sinclair, D.; Beck, P.; Seager, S.; Petkowski, J.J.; Carr, C.E.; Grinspoon, D.H.; et al. Rocket Lab Mission to Venus. Aerospace 2022, 445, in press. [Google Scholar] [CrossRef]
- Grzebyk, T.; Szyszka, P.; Dziuban, J. Identification of a gas composition based on an optical spectrum of plasma generated in MEMS ion spectrometer. In Proceedings of the 2021 IEEE 20th International Conference on Micro and Nanotechnology for Power Generation and Energy Conversion Applications (PowerMEMS), Virtual, 6–8 December 2021; IEEE: Piscataway, NJ, USA, 2021; pp. 148–151. [Google Scholar]
- Grzebyk, T.; Bigos, M.; Górecka-Drzazga, A.; Dziuban, J.A.; Hasan, D.; Lee, C. Mems Ion Sources For Spectroscopic Identification Of Gaseous And Liquid Samples. In Proceedings of the 2019 19th International Conference on Micro and Nanotechnology for Power Generation and Energy Conversion Applications (PowerMEMS), Krakow, Poland, 2–6 December 2019; IEEE: Piscataway, NJ, USA, 2019; pp. 1–3. [Google Scholar]
- Desenfans, P. Aerodynamics of the Maple Seed; Aircraft Design and Systems Group (AERO), Department of Automotive: Hamburg, Germany, 2019. [Google Scholar]
- Lentink, D.; Dickson, W.B.; Van Leeuwen, J.L.; Dickinson, M.H. Leading-edge vortices elevate lift of autorotating plant seeds. Science 2009, 324, 1438–1440. [Google Scholar] [CrossRef] [PubMed] [Green Version]
- Anderson, J.D. Introduction to Flight; McGraw-Hill Education: New York, NY, USA, 2015; pp. 294–298. [Google Scholar]
- Varshney, K.; Chang, S.; Wang, Z.J. The kinematics of falling maple seeds and the initial transition to a helical motion. Nonlinearity 2011, 25, C1. [Google Scholar] [CrossRef] [Green Version]
- Lebonnois, S.; Schubert, G. The deep atmosphere of Venus and the possible role of density-driven separation of CO2 and N2. Nat. Geosci. 2017, 10, 473–477. [Google Scholar] [CrossRef] [Green Version]
- Haque, A.M.; Bell, A.; Morgan, C.T.; Crossley, M.; Swar, K.; Shadbolt, L.; Staab, D.; Garbayo, A. Development of an Additive Manufactured Mass, Volume and Cost Optimised Ti-6AL-4V Fuel Tank for Microsatellite Propulsion Systems MiniTANK. In Proceedings of the 36th International Electric Propulsion Conference, University of Vienna, Vienna, Austria, 15–20 September 2019. [Google Scholar]
- Wu, Z.; Narra, S.P.; Rollett, A. Exploring the fabrication limits of thin-wall structures in a laser powder bed fusion process. Int. J. Adv. Manuf. Technol. 2020, 110, 191–207. [Google Scholar] [CrossRef]
Figure 1.
Most heavily modified seeds. Profiles of wing-cut samples 4 and 5 (herein labelled W4 and W5). Reprinted/adapted with permission from Ref. [
13]. © IOP Publishing Ltd. and London Mathematical Society 2011. Reproduced with permission. All rights reserved.
Figure 1.
Most heavily modified seeds. Profiles of wing-cut samples 4 and 5 (herein labelled W4 and W5). Reprinted/adapted with permission from Ref. [
13]. © IOP Publishing Ltd. and London Mathematical Society 2011. Reproduced with permission. All rights reserved.
Figure 2.
Sycamore seed results. Terminal velocity, vt, is plotted as a function of intrinsic component, Cint. Actual data points are shown as well as linear regression line covering data for samples N0–N3 and W0–W3.
Figure 2.
Sycamore seed results. Terminal velocity, vt, is plotted as a function of intrinsic component, Cint. Actual data points are shown as well as linear regression line covering data for samples N0–N3 and W0–W3.
Figure 3.
Venusian atmosphere. Atmospheric density (blue solid line) is plotted against the left-hand scale; atmospheric temperature (orange dashed line) is plotted against the right-hand scale. The approximate heights of the bottom (labelled VB, green) and top (labelled VT, red) of the cloud layer are indicated by vertical lines.
Figure 4.
Simple indoor drop test in a controlled environment using harvested sycamore seeds.
Figure 4.
Simple indoor drop test in a controlled environment using harvested sycamore seeds.
Figure 5.
TA1 wing profile scan; area 10,804.6 mm2, centroid at origin.
Figure 5.
TA1 wing profile scan; area 10,804.6 mm2, centroid at origin.
Figure 6.
Photograph of TA1. The probe head has holes which would be used for sample collection in large probe design.
Figure 6.
Photograph of TA1. The probe head has holes which would be used for sample collection in large probe design.
Figure 7.
Key dimensions of TA2, arrow showing expected rotation direction.
Figure 7.
Key dimensions of TA2, arrow showing expected rotation direction.
Figure 8.
TA2 construction (fabric not shown).
Figure 8.
TA2 construction (fabric not shown).
Figure 9.
Cross-section through printed “seed” showing location of IMU; the seed OD is 146 mm and the IMU dimensions (hatched) are 60 × 24 × 23 mm (deep).
Figure 9.
Cross-section through printed “seed” showing location of IMU; the seed OD is 146 mm and the IMU dimensions (hatched) are 60 × 24 × 23 mm (deep).
Figure 10.
Photograph of TA2 in stowed configuration.
Figure 10.
Photograph of TA2 in stowed configuration.
Figure 11.
Photograph of microcontroller-controlled IMU.
Figure 11.
Photograph of microcontroller-controlled IMU.
Figure 12.
Schematic showing orientation of IMU axes relative to TA2.
Figure 12.
Schematic showing orientation of IMU axes relative to TA2.
Figure 13.
Outlines of sycamore seeds tested. Annotation of each seed is “ID: area (mm2)”.
Figure 13.
Outlines of sycamore seeds tested. Annotation of each seed is “ID: area (mm2)”.
Figure 14.
Sycamore seed data. Authors’ own data (orange dashed line) plotted alongside Varshney 2012 data (blue solid line). Note that the authors’ data uses average falling speed, including transition, whereas the Varshney 2012 data is for terminal velocity. Varshney 2012 data reprinted/adapted with permission from Ref. [
13]. © IOP Publishing Ltd. and London Mathematical Society 2011. Reproduced with permission. All rights reserved.
Figure 15.
TA2 beneath drone just before release.
Figure 15.
TA2 beneath drone just before release.
Figure 16.
TA2 linear acceleration and rotation rate for 0 < t < 1.3 s.
Figure 16.
TA2 linear acceleration and rotation rate for 0 < t < 1.3 s.
Figure 17.
TA2 linear acceleration and rotation rate for 0 < t < 2.5 s. Note in particular the change in sign of rotX and rotZ between t = 1.5 s and t > 1.6 s.
Figure 17.
TA2 linear acceleration and rotation rate for 0 < t < 2.5 s. Note in particular the change in sign of rotX and rotZ between t = 1.5 s and t > 1.6 s.
Figure 18.
TA2 linear acceleration and rotation rate for 2 < t < 6 s.
Figure 18.
TA2 linear acceleration and rotation rate for 2 < t < 6 s.
Figure 19.
Distance to axis of rotation from IMU centre for TA2 2.5 < t < 6 s.
Figure 19.
Distance to axis of rotation from IMU centre for TA2 2.5 < t < 6 s.
Figure 20.
TA2 wing deflection under aerodynamic loads.
Figure 20.
TA2 wing deflection under aerodynamic loads.
Figure 21.
TA2 linear acceleration and rotation rate for complete flight, 0 < t < 15.7 s.
Figure 21.
TA2 linear acceleration and rotation rate for complete flight, 0 < t < 15.7 s.
Figure 22.
Velocity against intrinsic component for Varshney 2012 data, the author’s own sycamore seed data, TA1 and TA2. Varshney 2012 data reprinted/adapted with permission from Ref. [
13]. © IOP Publishing Ltd. and London Mathematical Society 2011. Reproduced with permission. All rights reserved.
Figure 23.
Intermediate outputs from extrapolation model.
Figure 23.
Intermediate outputs from extrapolation model.
Table 1.
Properties of falling seeds. Table lists mass and area of seeds in various states of modification of nut and wingplus the resulting terminal velocity. Reprinted/adapted with permission from Ref. [
13]. © IOP Publishing Ltd. and London Mathematical Society 2011. Reproduced with permission. All rights reserved.
| Modification | ID | Mass, m (mg) | Area, A (mm2) | Terminal Velocity, vt (m/s) |
|---|
| | W0 | 170.6 | 612.8 | 0.94 |
| Wing | W1 | 166.1 | 503.6 | 1.04 |
| Wing | W2 | 158.6 | 344.8 | 1.00 |
| Wing | W3 | 154.2 | 287.4 | 1.11 |
| Wing | W4 | 149.4 | 202.0 | 2.95 |
| Wing | W5 | 146.4 | 191.6 | 4.30 |
| | N0 | 195.8 | 546.1 | 1.18 |
| Nut | N1 | 162.9 | 528.5 | 0.92 |
| Nut | N2 | 127.4 | 504.1 | 0.96 |
| Nut | N3 | 92.2 | 486.9 | 0.88 |
Table 2.
Sycamore seed results. Mass, time to fall 2 m, average speed falling 2 m, surface area and intrinsic component. ID denotes the order in which the seed where dropped.
Table 2.
Sycamore seed results. Mass, time to fall 2 m, average speed falling 2 m, surface area and intrinsic component. ID denotes the order in which the seed where dropped.
| ID | Mass, m (mg) | Fall Time, t (s) | Average Speed, (m/s) | Area (mm2) | Intrinsic Component, Cint (kg0.5/m) |
|---|
| 25 | 150 | 1.35 | 1.48 | 610.0 | 0.50 |
| 22 | 159 | 1.65 | 1.21 | 635.8 | 0.50 |
| 20 | 173 | 1.80 | 1.11 | 656.2 | 0.51 |
| 18 | 121 | 2.05 | 0.98 | 469.8 | 0.51 |
| 16 | 58 | 2.40 | 0.83 | 354.6 | 0.40 |
| 14 | 85 | 1.70 | 1.18 | 231.3 | 0.61 |
| 13 | 153 | 1.80 | 1.11 | 554.5 | 0.53 |
| 11 | 111 | 1.45 | 1.38 | 402.9 | 0.52 |
| 9 | 160 | 1.30 | 1.54 | 626.1 | 0.51 |
| 7 | 176 | 1.50 | 1.33 | 574.0 | 0.55 |
| 5 | 179 | 1.40 | 1.43 | 641.6 | 0.53 |
| 3 | 154 | 1.30 | 1.54 | 538.7 | 0.53 |
| 1 | 144 | 1.65 | 1.21 | 535.1 | 0.52 |
| 0 | 52 | 2.25 | 0.89 | 259.5 | 0.45 |
| 24 | 59 | 1.55 | 1.29 | 183.2 | 0.57 |
| 23 | 219 | 1.70 | 1.18 | 619.5 | 0.59 |
| 21 | 66 | 2.45 | 0.82 | 351.4 | 0.43 |
| 19 | 147 | 1.60 | 1.25 | 600.7 | 0.49 |
| 17 | 164 | 1.80 | 1.11 | 611.0 | 0.52 |
| 15 | 175 | 1.60 | 1.25 | 632.0 | 0.53 |
| 12 | 107 | 2.10 | 0.95 | 443.5 | 0.49 |
| 10 | 185 | 2.00 | 1.00 | 574.0 | 0.57 |
| 8 | 185 | 1.70 | 1.18 | 498.4 | 0.61 |
| 6 | 137 | 1.95 | 1.03 | 508.6 | 0.52 |
| 4 | 56 | 2.30 | 0.87 | 325.0 | 0.42 |
| 2 | 78 | 2.20 | 0.91 | 389.3 | 0.45 |
Table 3.
Key parameters for extrapolation of probe behaviour in Venusian atmosphere.
Table 3.
Key parameters for extrapolation of probe behaviour in Venusian atmosphere.
| Earth acceleration under gravity, gₑ | 9.81 m/s2 |
| Density of atmosphere at ESL, ρESL | 1.225 kg/m3 |
| Hence extrinsic component at ESL, Cext | 0.288 kg0.5/m |
| Assumed terminal velocity of probe at ESL | 2 m/s |
| Venusian acceleration under gravity, gᵥ | 8.87 m/s2 |
| Height of top of Venusian cloud deck, VT | 70 km |
| Height of bottom of Venusian cloud deck, VB | 48 km |
| Publisher’s Note: MDPI stays neutral with regard to jurisdictional claims in published maps and institutional affiliations. |
© 2022 by the authors. Licensee MDPI, Basel, Switzerland. This article is an open access article distributed under the terms and conditions of the Creative Commons Attribution (CC BY) license (https://creativecommons.org/licenses/by/4.0/).


