
Assessing the Performance of Hypersonic Inlets by Applying a Heat Source with the Throttling Effect
by
 , ,
, ,
Nurfathin Zahrolayali
1,* ,
,
Mohd Rashdan Saad
1,
Azam Che Idris
2 and
Mohd Rosdzimin Abdul Rahman
1,* 1
Department of Mechanical Engineering, Faculty of Engineering, Universiti Pertahanan Nasional Malaysia, Kem Sg. Besi, Kuala Lumpur 57000, Malaysia
2
Faculty of Integrated Technologies, Universiti Brunei Darussalam, Jalan Tungku Link, Seri Begawan BE1410, Brunei
*
Authors to whom correspondence should be addressed.
Aerospace 2022, 9(8), 449; https://doi.org/10.3390/aerospace9080449
Submission received: 10 July 2022
/
Revised: 30 July 2022
/
Accepted: 31 July 2022
/
Published: 16 August 2022
(This article belongs to the Special Issue Hypersonics: Emerging Research)
Abstract
:Utilization of a heat source to regulate the shock wave–boundary layer interaction (SWBLI) of hypersonic inlets during throttling was computationally investigated. A plug was installed at the intake isolator’s exit, which caused throttling. The location of the heat source was established by analysing the interaction of the shockwave from the compression ramp and the contact spot of the shockwave with that of the inlet cowl. Shockwave interaction inside the isolator was investigated using steady and transient cases. The present computational work was validated using previous experimental work. The flow distortion (FD) and total pressure recovery (TPR) of the inflows were also studied. We found that varying the size and power of the heat source influenced the shockwaves that originated around it and affected the SWBLI within the isolator. This influenced most of the performance measures. As a result, the TPR increased and the FD decreased when the heat source was applied. Thus, the use of a heat source for flow control was found to influence the performance of hypersonic intakes.
1. Introduction
Hypersonic intakes receive and compress oxidizers from scramjet engines, which is critical to hypersonic aircraft function. Depending on the captured qualities of the fluid flow and the flow characteristics within the induction system, hypersonic intakes can function when ignited or not ignited [1]. Inadequate air compression, for example, chokes the flow at the entry throat, leading to the process being halted [2]. Flow changes form due to increases in the Mach value owing to increased contact with the boundary layer. Lower Mach numbers typically experience this shift, although it can also be caused by the existence of fuel injection [3]. Hypersonic inlets must work when ignited in order to derive the best performance, so the captured air and compressor elements of high-speed vehicles need to be considered [1].
Fluid flow is caused by thermal choke, mass addition, backpressure rise, or the combination of such effects, and can induce an intake during non-ignition [4]. According to earlier research work, backpressure can affect flow, which develops and travels upstream. If there is a semi-steady flow of shock trains and sufficiently “low” backpressure, these split flows can remain at a given spot. Separations travel upstream when there is enough backpressure, gradually stopping the incoming flow. The oscillatory flow may then manifest itself as a violently unstable unignited flow phase [5,6,7]. Tan et al. [8] intended to predict inlet non-ignition by investigating the non-ignition operation of generic hypersonic flow at Mach 5 with throttling ratios ranging from 0.14 to 0.85. The following year, Tan et al. [9] demonstrated an active technique for a sequence of shock oscillations across a hypersonic model with intricate background waves at throttling ratios of 0.75 to 0.9. Li et al. [7] evaluated the unstable performance of hypersonic intakes at Mach 6 by placing a stopper around the outflow of the intake isolator. Cyclic unignited streams were discovered at higher TRs with frequencies correlating to the TR, ranging from 222 to 400 Hz. In the same way, Sun et al. [10] investigated the unstable performance of a hypersonic inlet at a TR of 0 and 0.3. The backpressure rose when the TR was increased to 0.3, and the plug-induced detachment flow moved upstream. The isolator’s downstream flow field then became subsonic. Wang et al. [11] explored an oblique shock train using a hypersonic intake and observed that, as the degree of throttling rose, the oblique shock train moved upstream. Moreover, in a study of unignited behaviour caused by subsonic leakages inside a hypersonic inlet at Mach 6 with a throttling ratio of 0 to 0.69, the intake began to exceed Kantrowitz limitations despite being less than the isentropic limits [12]. Researchers suggested that it is vital to analyse shock train oscillations in order to prevent non-ignition intake situations [13,14,15,16].
Gao et al. [17] evaluated the influence of a plug on oscillatory flows at Mach 6 with throttling ratios ranging from 0 to 0.66. According to their data, the additional detachment shock pressure, as assessed by the average value of the centre-body pressure, was larger in plugged situations than in unplugged ones. Chen et al. [18] detected a Dailey interruption in the small throttle, which they attributed to mild disturbances induced by the end shock’s interaction with the separated boundary layer on the ramp surface. Small and large throttling might have the same source. The likelihood of small throttling decreased as the TR increased. To raise the intake backpressure until non-ignition occurred, a throttling mechanism attached to the intake isolator’s outlet was utilized [6]. Because of poor backpressure management, the intake came to a halt as the phase changed [5]. As a result, each component of the high-speed aircraft was subjected to a diverse set of flow fields and flow characteristics as well as time–frequency aspects. As a consequence, the non-ignition operation was aided by the shockwave–boundary layer interaction (SWBLI)-generated flow pattern [19]. When the hypersonic intake was turned off, a huge boundary-layer detachment zone occurred at the cowl’s sidewall edge, resulting in a powerful detachment wave that diverted the pressurized airflow. An unignited hypersonic intake stream may be predominantly supersonic with transient supersonic regions at the intake and isolator edges [20].
Hypersonic intakes, unlike supersonic intakes, have a supersonic area even after the final shockwave. The reason for the hypersonic intake’s unignited behaviour change is a result of this alteration changing the fluid flow. As a consequence, extrapolation of study findings from supersonic intake throttling of hypersonic intakes is problematic [21]. A few studies have been carried out to better understand the unstable flow patterns caused by the non-ignition phenomenon. Studies monitoring and categorizing non-ignition behaviours have been performed [22,23]. In an unstable process, separating boundary layers is crucial. To forecast and comprehend near-critical and unsteady, subcritical inlet flow, researchers have conducted computational investigations [24,25,26]. The findings indicate that the approach shows an inlet throttle-like oscillation pressure and traveling shockwave at TR 0. Later, when the flow attained a steady condition at TR 1.42 and the shock and viscous total pressure drop dictated a normal shock region, there were also zones of flow separation that displayed a high frequency of instability as well as the expected response system of the mirrored shockwaves [24,25].
Dailey buzz flow and organ–pipe flows are two methods that may be used to examine inlet throttle flow issues. It has been discovered that the viscosity factor is crucial in producing the throttle inconsistency in a throttled flow; thus, the acoustic frequency may not always be solely an agitated reaction. Acoustic resonance forms might alter as a consequence of contact resistances, which then indicates the dynamic behaviour provided by the ambient input flow [27]. Moreover, an assessment of complicated flow appears to be best suited to delayed detached-eddy simulations. The conventional shock’s behaviour depicts a large divergence that arose due to the compression ramps and blocks during intake as well as the extra pressure fluctuations that occurred when the conventional shock came into contact with the ramp’s tip. Rather than just on the compression ramps, the detachment developed on the corners and the sides [28]. Under Mach 2 freestream, the inlet throttle was tested at throttling ratios of 0, 0.55, and 0.67. Once throttling occurred, flow patterns were dramatically altered by the detachment vortex bubbles that formed on the external compression wall and inside the neck. Although the TR decreased, the dominant pressure disturbance rate increased, and the disturbance trend became more irregular, although its amplitude decreased in concentration [29].
Several active and passive flow management technologies have been presented over recent years to solve the SWBLI issue [30]. In a 2D hypersonic inlet at Mach 4.9, the influence of the boundary layer featured in the non-ignition condition was quantified. The flow rate inside the intake boundary layer’s characteristic, according to experts, reduced the frequency and magnitude of the pressure oscillations. The ability to estimate the amplitude and frequency of the pressure oscillations was influenced by boundary layer characteristics [31]. The efficiency and stability of a mixed-compression inlet were evaluated based on the effects of the SWBLI. The detachment caused by the SWBLI inside a supersonic inlet reduces the total pressure and improves the flow nonuniformity since it has a significant impact on the inlet and aircraft’s operation. The findings indicate that the stream engagement phenomena have a range of effects on the stability and performance of the intake. When the internal channel boundary layer and endpoint’s normal shock collide, pseudo-shock occurs, which increases the flow distortion (FD) and decreases the total pressure recovery (TPR) [32]. The effectiveness of the supersonic inlet, which depicted an improvement in the overall pressure recovery coefficient of 16.5%, was also influenced by the bleed hole’s ability to lower the minimal start Mach value [33]. Additionally, the analysis found that retraction of the cowl helped improve the strength of the boundary layers across the walls inside the inlet duct, which affected the SWBLI [34].
The impact of modifying the attack SWBLI and airflow Mach number and their effects on efficiency were studied. The study discovered that altering the angle of attack influenced the flow behaviour formed inside the isolator [35]. The features of the flow behaviour within the supersonic intake were examined experimentally and numerically for AoA = 2° and AoA = 4°. Due to the shifting direction of the flow, the researchers noticed that when the intake operated at a restricted attack angle, it caught more air on the windward side than on the leeward side. Furthermore, despite the separated shock, the static pressure on the leeward side was higher than the static pressure on the windward side [36].
Macheret et al. [37] were among the earliest to explore the impact of putting a source of heat in a fast-moving vehicle inlet. As the heated zone forced the stream to streamline through the hypersonic inlet, the authors invented the phrase “virtual cowl”. According to their findings, when the Mach number was below the intended amount, the air velocity of the fluid in the scramjet inlet increased. The researchers subsequently determined the ideal location for the source of heat to reduce air leakage. Kremeyer et al. [38] discovered a strategy to increase high-speed vehicle intake efficiencies by positioning a source of energy upstream on the inlet. Similarly, Russell et al. [39] demonstrated that sources of heat might be used to reduce dispersion and increase the performance of an internal combustion engine in a high-speed vehicle.
The current study builds on previous studies by attempting to manage the SWBLI at hypersonic inlets during throttling. This study investigates how the compression ramp’s shockwave interacts with the presence of a heat source. At Mach 5, the simulation was run in a free-stream mode on a two-dimensional double-ramp inlet. A numerical technique was evaluated using experimental data from previous studies, and the SWBLI was explored. The findings of this work are critical for enhancing our understanding of hypersonic inlet flow patterns and performance.
2. Numerical Work
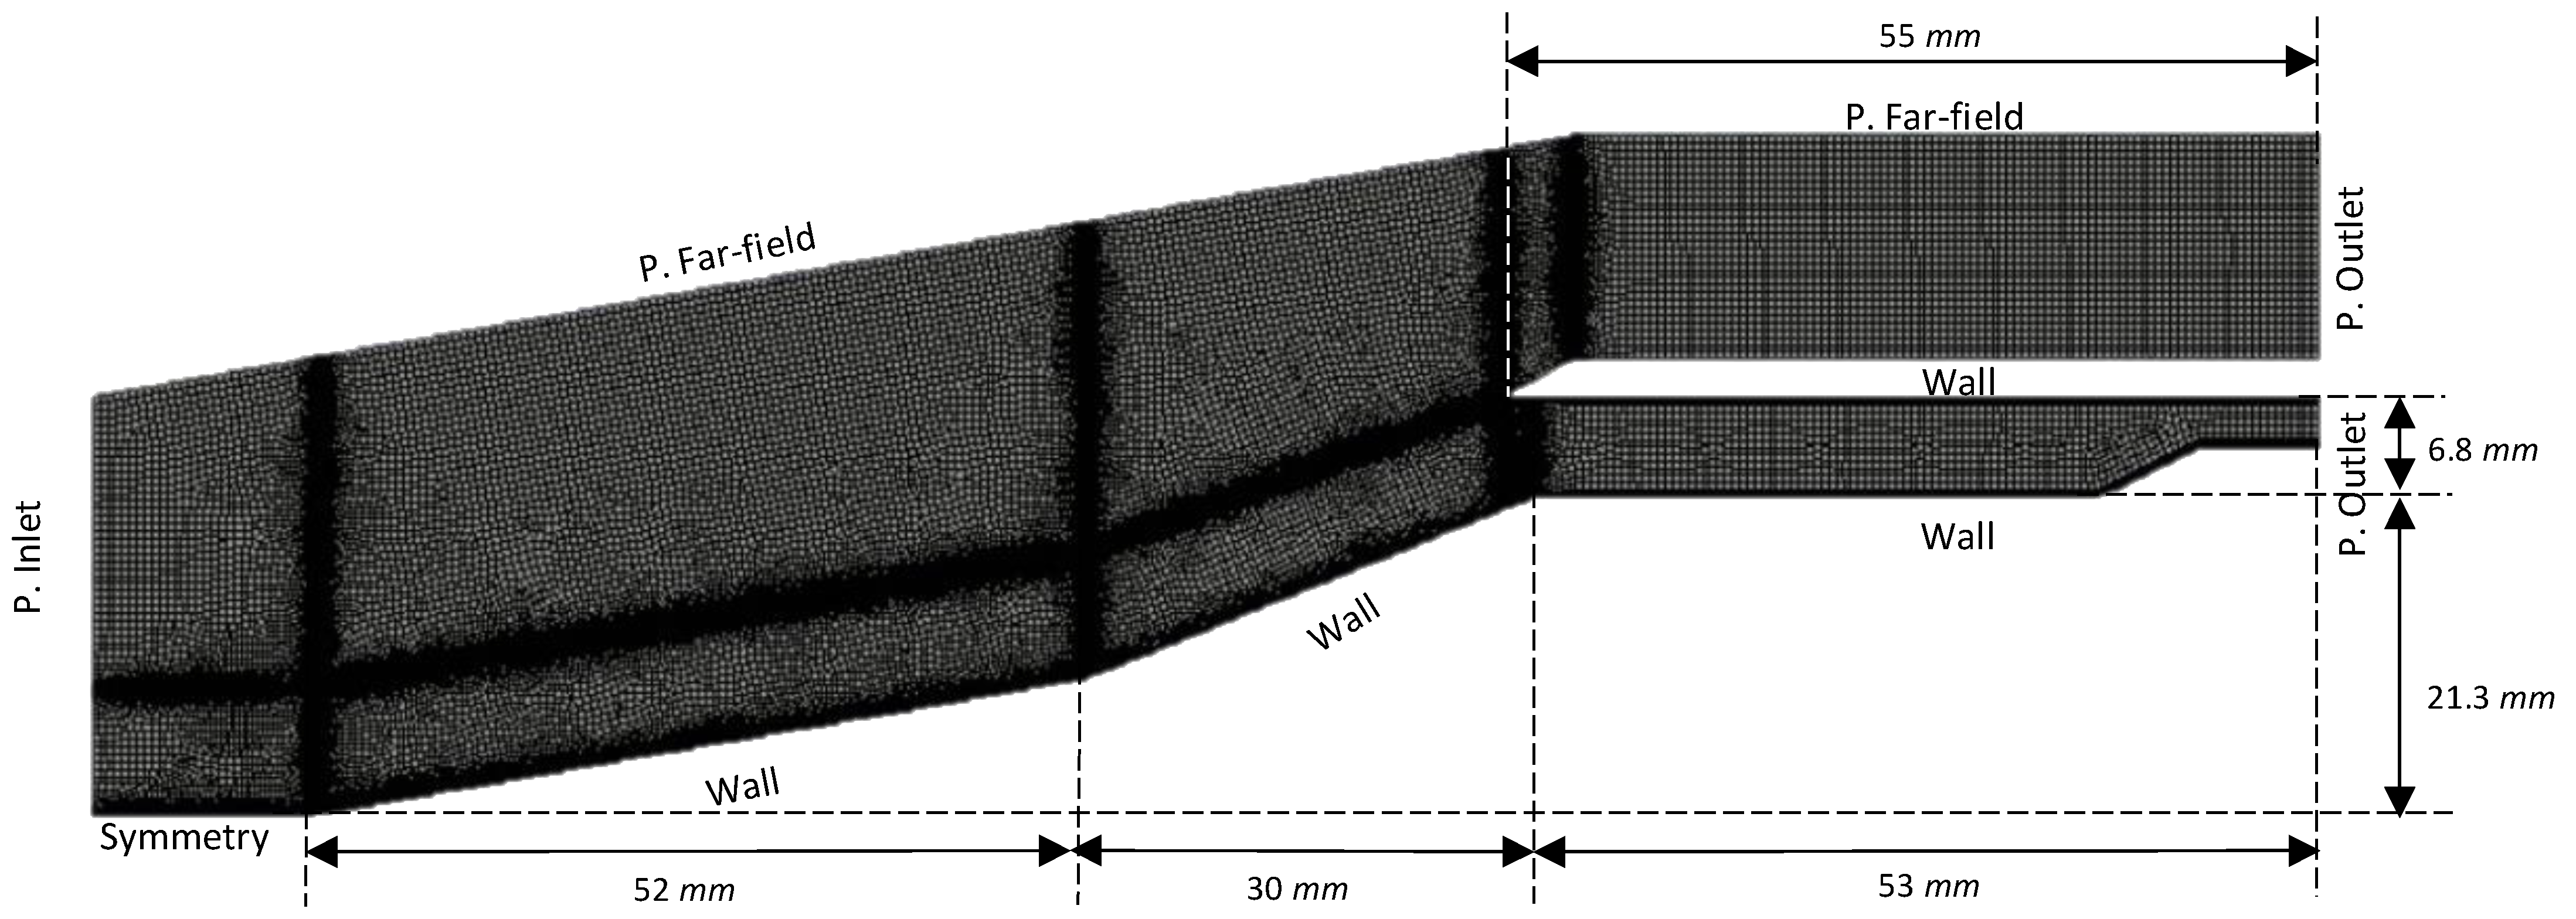
Figure 1 indicates the two-dimensional numerical domain used in the present study. The inlet was set as a pressure inlet and the outlet as a pressure outlet.
ANSYS Fluent was utilized in this study. It was hypothesized that boundary layer detachment would occur at the compression corner, and it has previously been proven that reattachment might cause turbulence [40]. An appropriate turbulence model for the numerical solver was required to simulate the turbulent flow. As a viscous model of turbulence, SST k–ω was adopted in this work due to the lower computational cost. The suitability of the SST k–ω turbulence model was based on previous studies that demonstrated that the results were close to the Reynolds Stress Model (RSM) [41,42,43,44].
The Navier–Stokes equation consists of mass conservation, momentum conservation, and energy conservation and is solved using the finite volume approach. The compressible and unsteady N–S equations are given by:
Mass conservation,
Momentum conservation,
Energy conservation,
where is the density, is the static pressure, is the velocity vector, is the compressible viscous stress tensor, E is the total energy per unit mass, and is the heat flux. The ratio of viscosity to turbulent flow was fixed at 1. The Courant–Friedrichs–Levy (CFL) value was first set at 0.5 but was increased by an equivalent amount every 1000 iterations to preserve stability. As shown in Figure 1, the computational domain was established by a pressure input, a pressure far-field, two pressure exits, fixed heat walls, and the associated symmetry. Because of the symmetry zone between both the pressure inlet border and the main compression ramp barrier, the iterations remained constant. The parameters of the two pressure outputs were estimated with steady flow and the consideration that the flow will exit at the isolator and expand under free-flow circumstances. The baseline model (AoA = 0°) and the models with AoA = 4°, 6°, 8°, and 10° utilized a quadrilateral mesh cell that was placed on a dense grid that was structured across a major flow-shifting zone. The parameters employed in the current investigation are provided in Table 1.
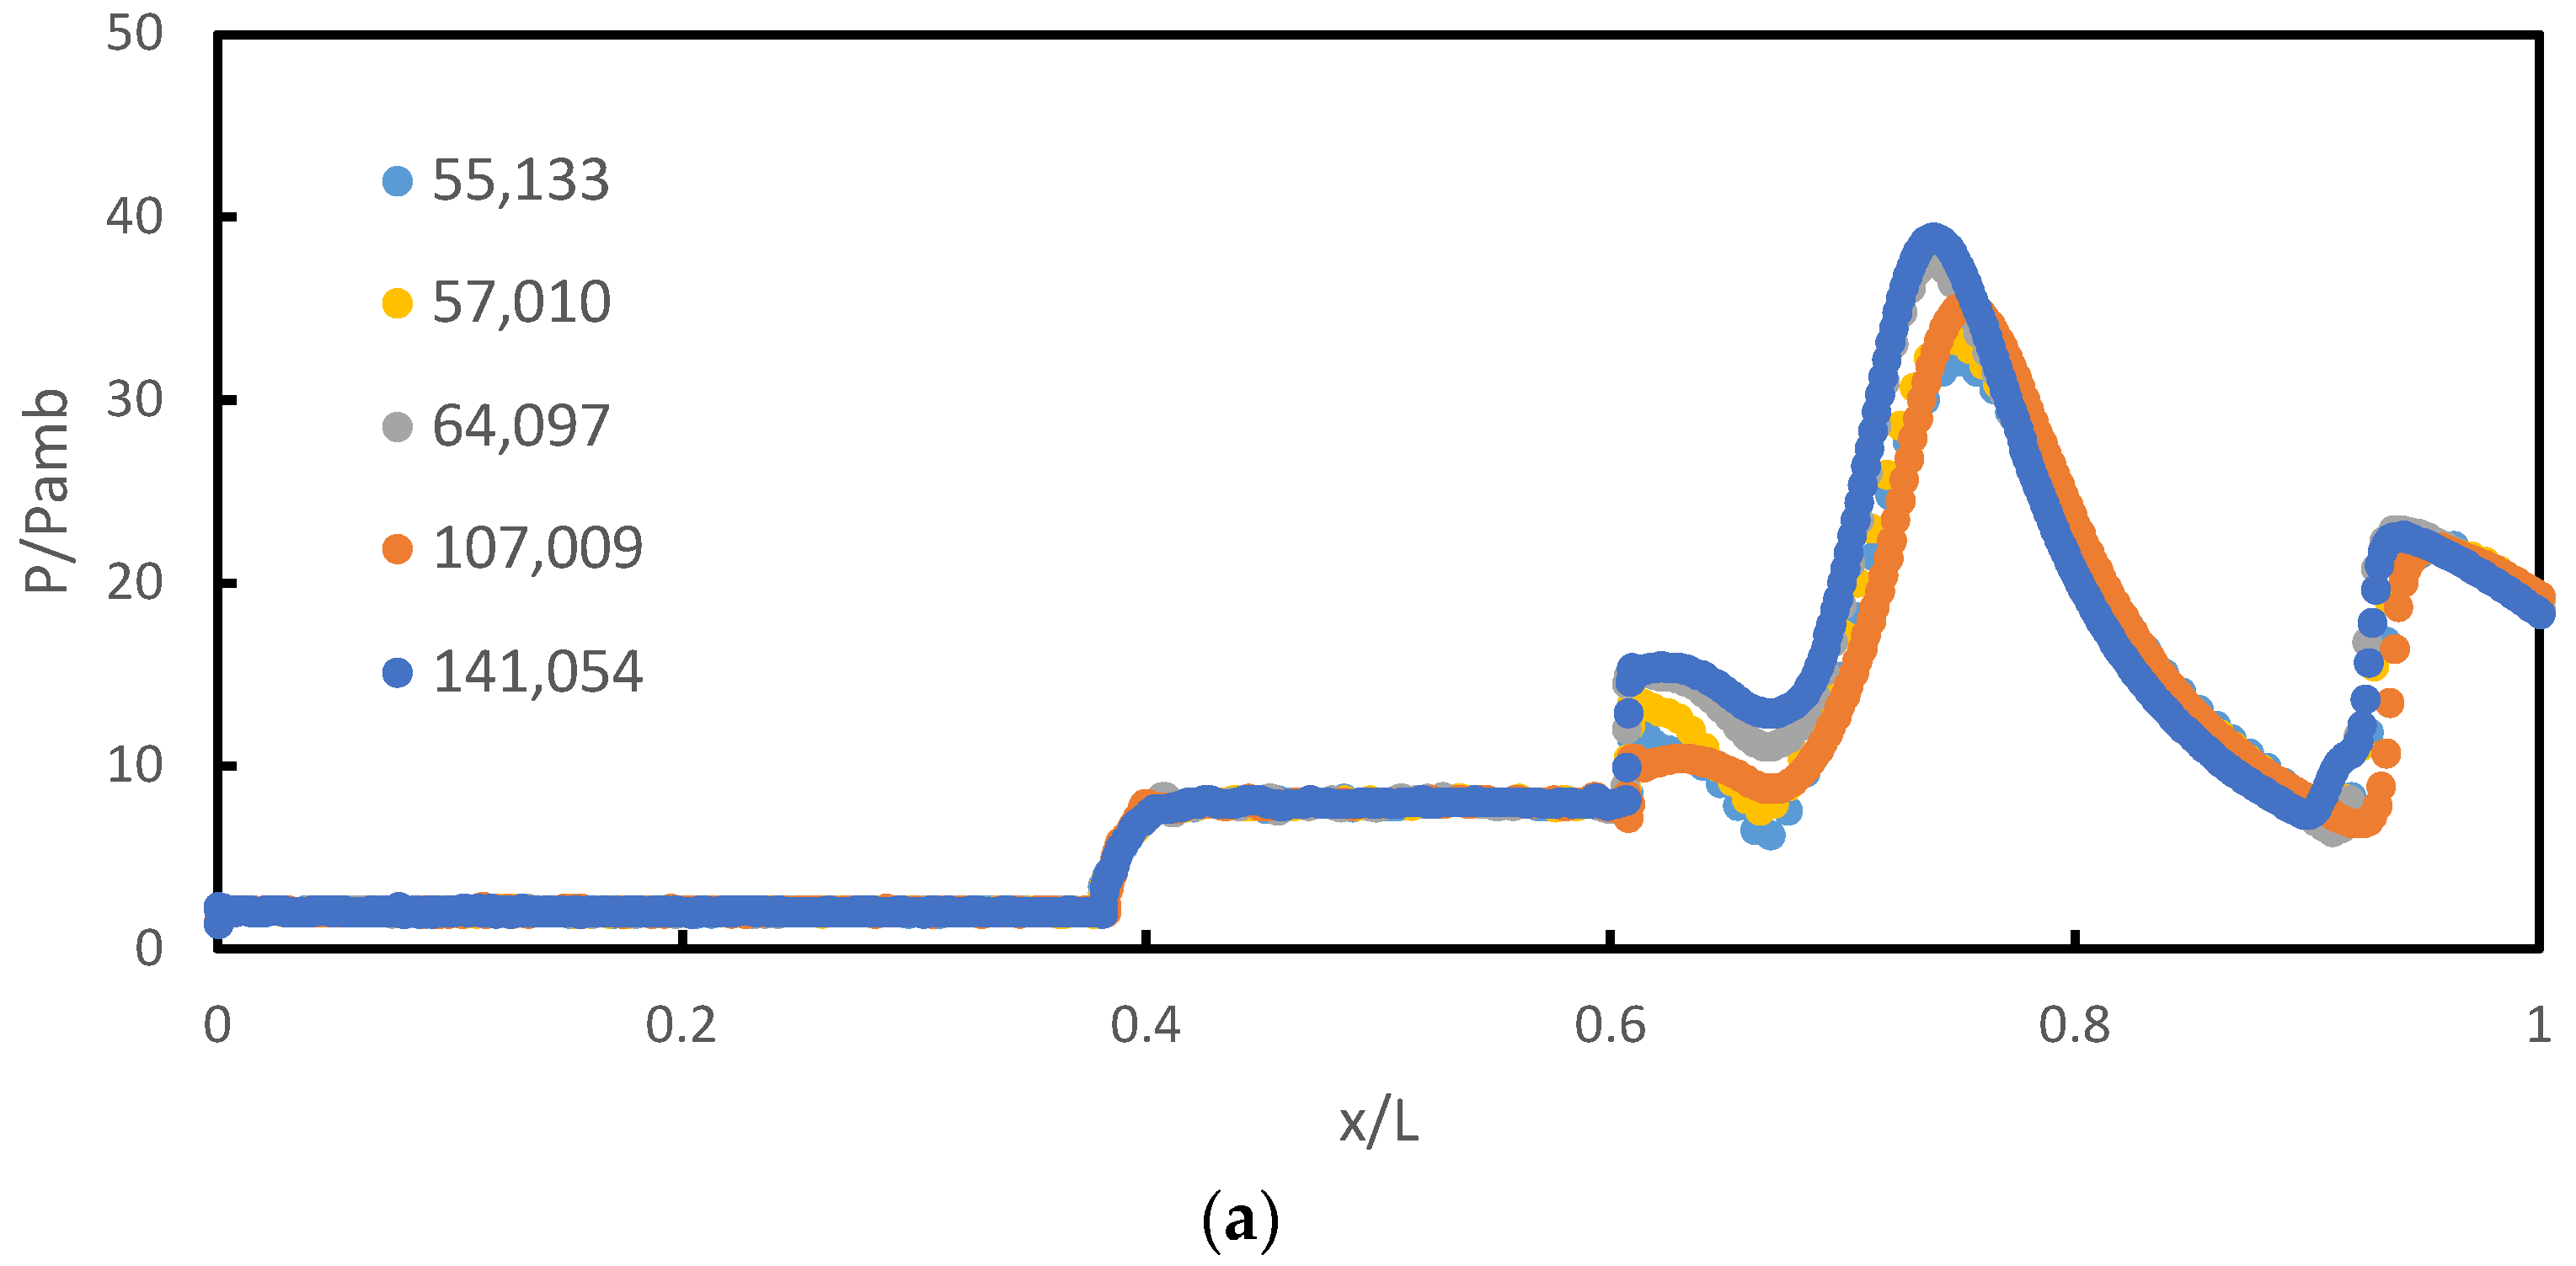
Using five different grid refinement levels, the sensitivity of the results to the grid density was investigated. To lower the computational cost, mesh size optimizations were implemented and the results are shown in Figure 2a–c. Figure 2a shows that a mesh of 64,097 elements fits the pressure data quite well with 141,054 elements compared to 57,010 and 55,133 elements. Therefore, a mesh of 64,097 elements was adopted for all cases in the present numerical analysis to reduce computation time. In the present study, the first cell height for the body-fitted mesh satisfied the criterion of y+ ≤ 1, (Figure 2b). The simulation was performed using an Intel(R) Xeon(R) Platinum 8260 CPU @ 2.40 GHz and 2.39 GHz (two processors) with 128 GB of RAM.
2.1. Position of the Heat Source
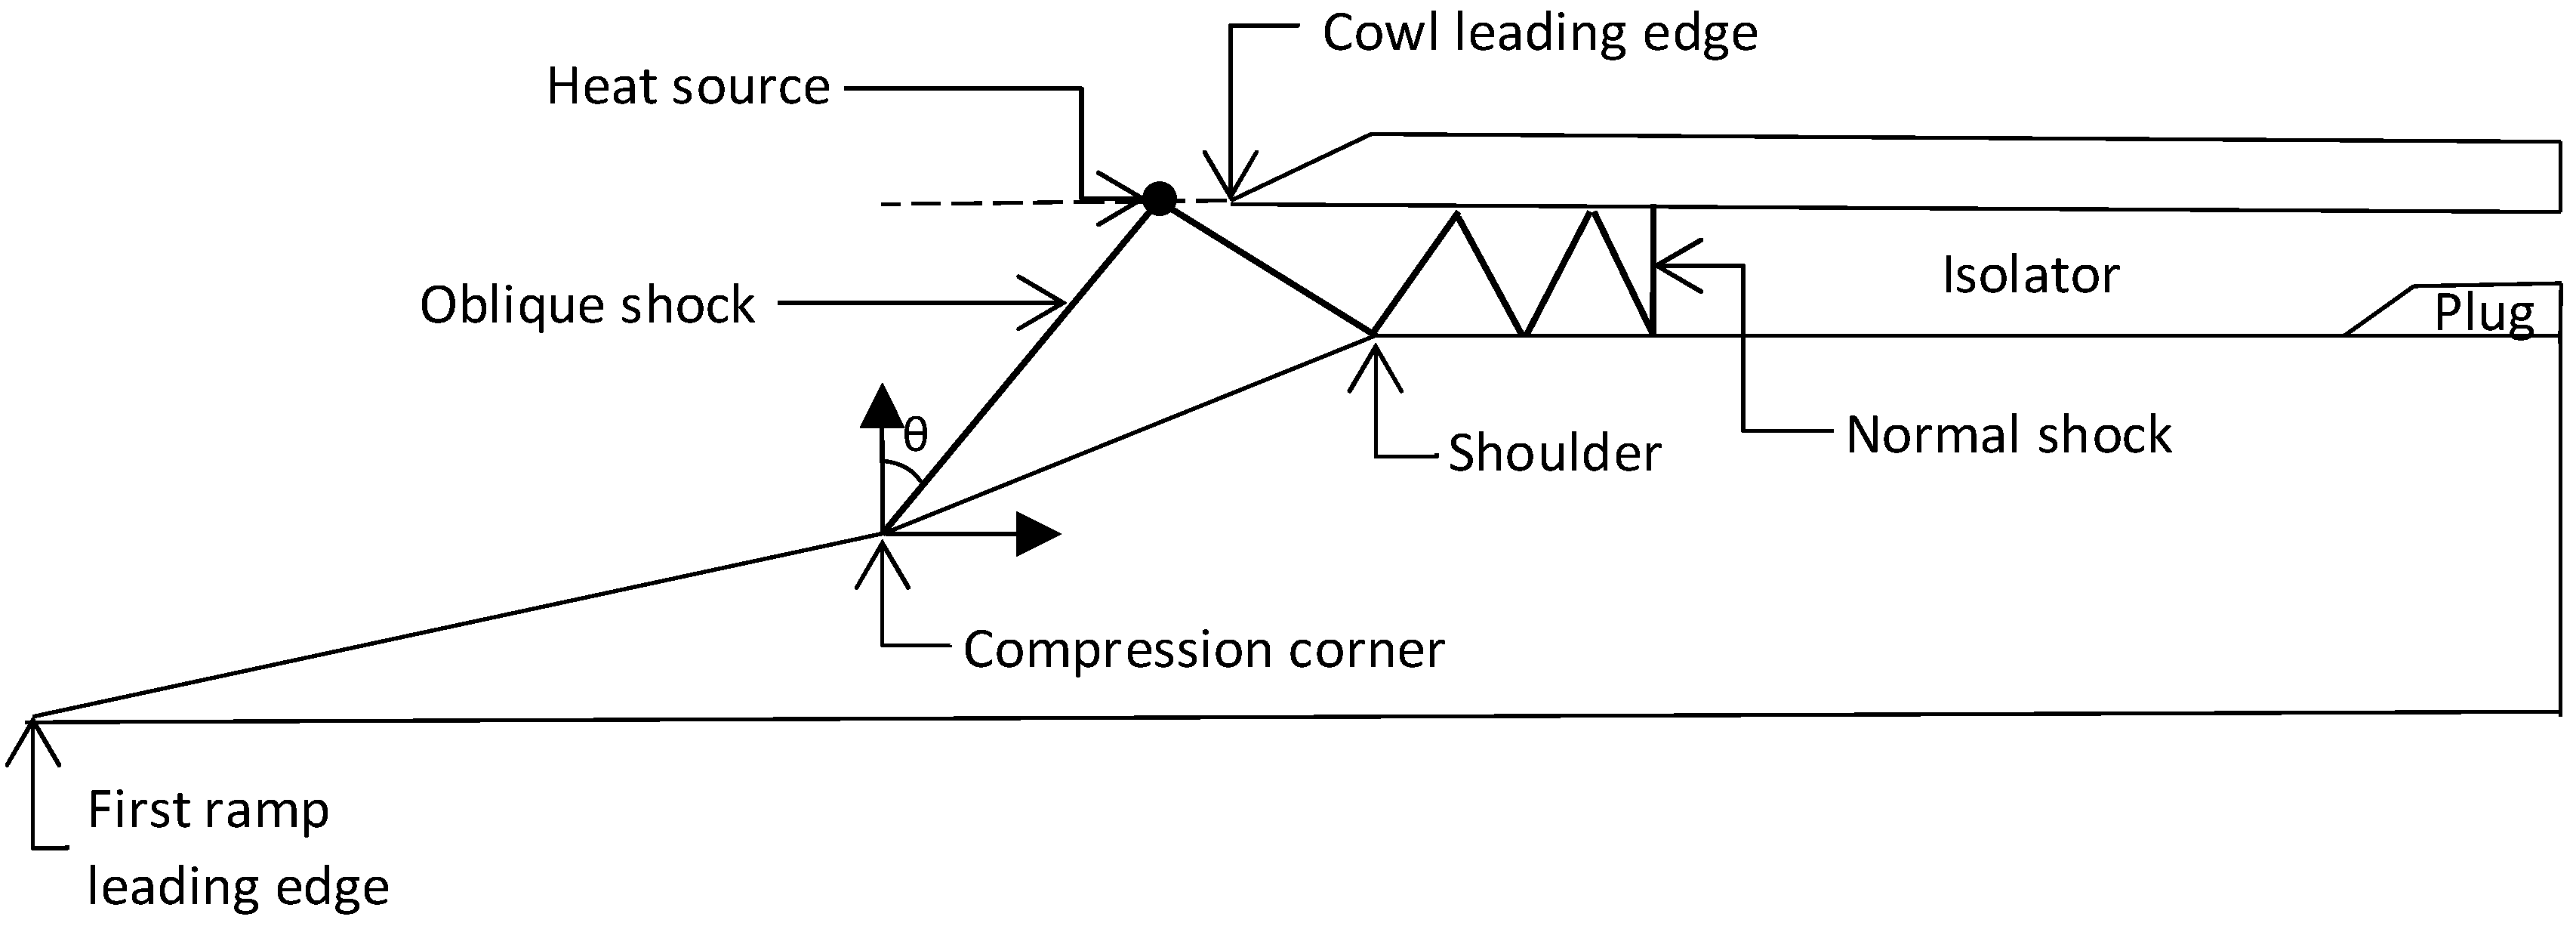
The main factor to consider was the position of the heat source. The heat source used in the present study modelled laser energy deposition, which has been used as an actual active flow control system. Knight [45] pointed out that the flow time of high-speed flow is in micro-seconds, and the duration of the laser energy’s deposition emission is roughly in nanoseconds. Consequently, emission generation would be 100 times quicker than fluid velocity; thus, steady heat generation was justified. The position of the heat source is crucial because it affects how the bow shock from the heat source and oblique shockwaves interact, thereby maintaining the shock train inside the isolator and preventing non-ignition and off-design operation. Figure 3 displays these positions. It should be noted that more locations were predicted in this analysis than are shown in this picture. The interpretations of the findings, on the other hand, match the location’s outcomes. Previously, Sepahi-Younsi and Esmaeili [46] investigated the placement of the source of the heat. However, due to the dimensionless radius ratio, determining the best placement of the source of heat is difficult. In all positions, the source of heat has a spherical cross-section. The heat generation rate is = (1 × 10¹³, 2 × 10¹³, 5 × 10¹³) Wm−3 across all locations, of which is described as the energy source’s heat input value across the area of the cross-section.
2.2. Performance Parameters and Operating Conditions
A stream stopper with a slant angle of 20 degrees and an 8 mm long surface was positioned immediately at the isolator’s exit before each test to imitate the significant backpressure created during combustion (Figure 1). The intake control settings may be changed from one cycle to the next by adjusting the plug’s level, which is connected to the throttling ratio (TR) [7]:
where denotes the plug’s geometrical neck size, and is the isolator’s cross-sectional area. According to Li et al. [7], there was no fluctuation between TR 0 and TR 0.3. Beyond TR 0.3, the oscillatory flow accelerated, and the flow properties changed. TR ranges from 0.4 to 0.6 were employed in the study. Several fluid properties were found based on the TR fluctuations.
The total pressure recovery (TPR) and flow distortion (FD) were used as performance indicators in this investigation. The TPR is defined as the ratio between the total pressure at the inlet exit plane to the total pressure in the airflow [46]:
This is an important indicator, as it has significant influence on the vehicle’s thrust force. As a result, the highest value of this variable was used. Flow separation causes pressure to decrease within the intake. The extent of this pressure reduction concerns the intended constant flow and is determined using the flow distortion; it is estimated as follows [46]:
where the highest and lowest total pressures at the inlet’s exit lip are known as and , correspondingly, and = mean total pressure throughout the inlet’s exit lip.
2.3. Validation
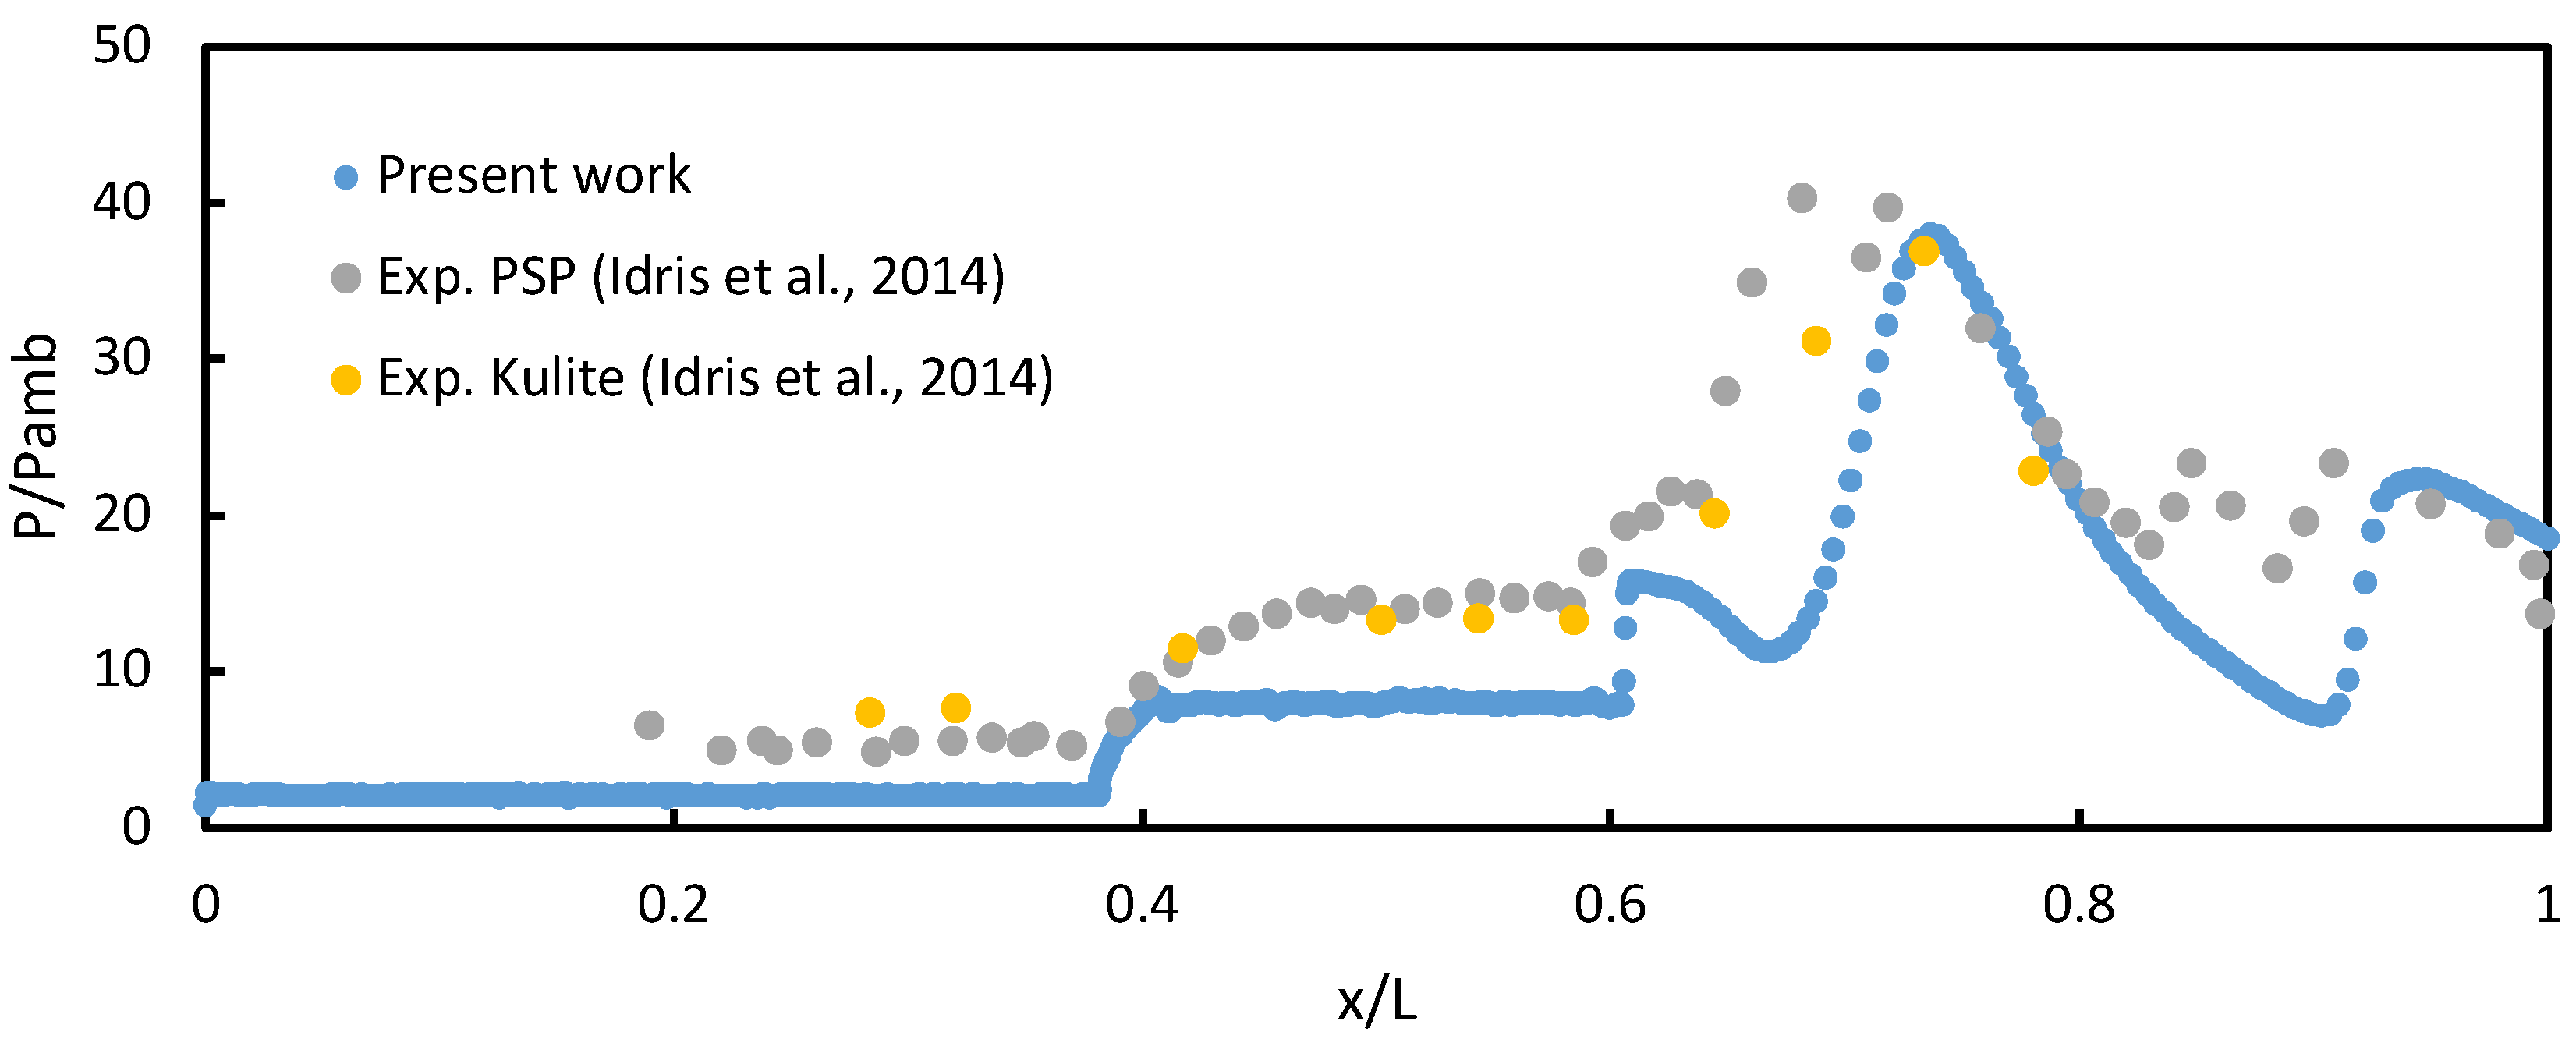
The mean wall-pressure oscillations throughout the inlet-isolator’s floor surface are depicted in Figure 4. The data were gathered from the leading edge of the compression ramp to the outlet of the isolator.
The computational findings produced here are quite similar to the experimental data in [47], although a discrepancy was observed at the compression ramp. The error in the experiment was and the value from all pressure transducers was [47]. The compression ramp in the front of the isolator had an unstructured mesh, and this could affect the numerical results. The numerical results were slightly underpredicted compared to the experiments owing to the boundary layer effects at the compression ramp. However, the numerical results inside the isolator are well-predicted. This study is primarily focused on the isolator. Therefore, sufficient data can be obtained from the current numerical analysis.
3. Results and Discussion
Internal Shock Structures
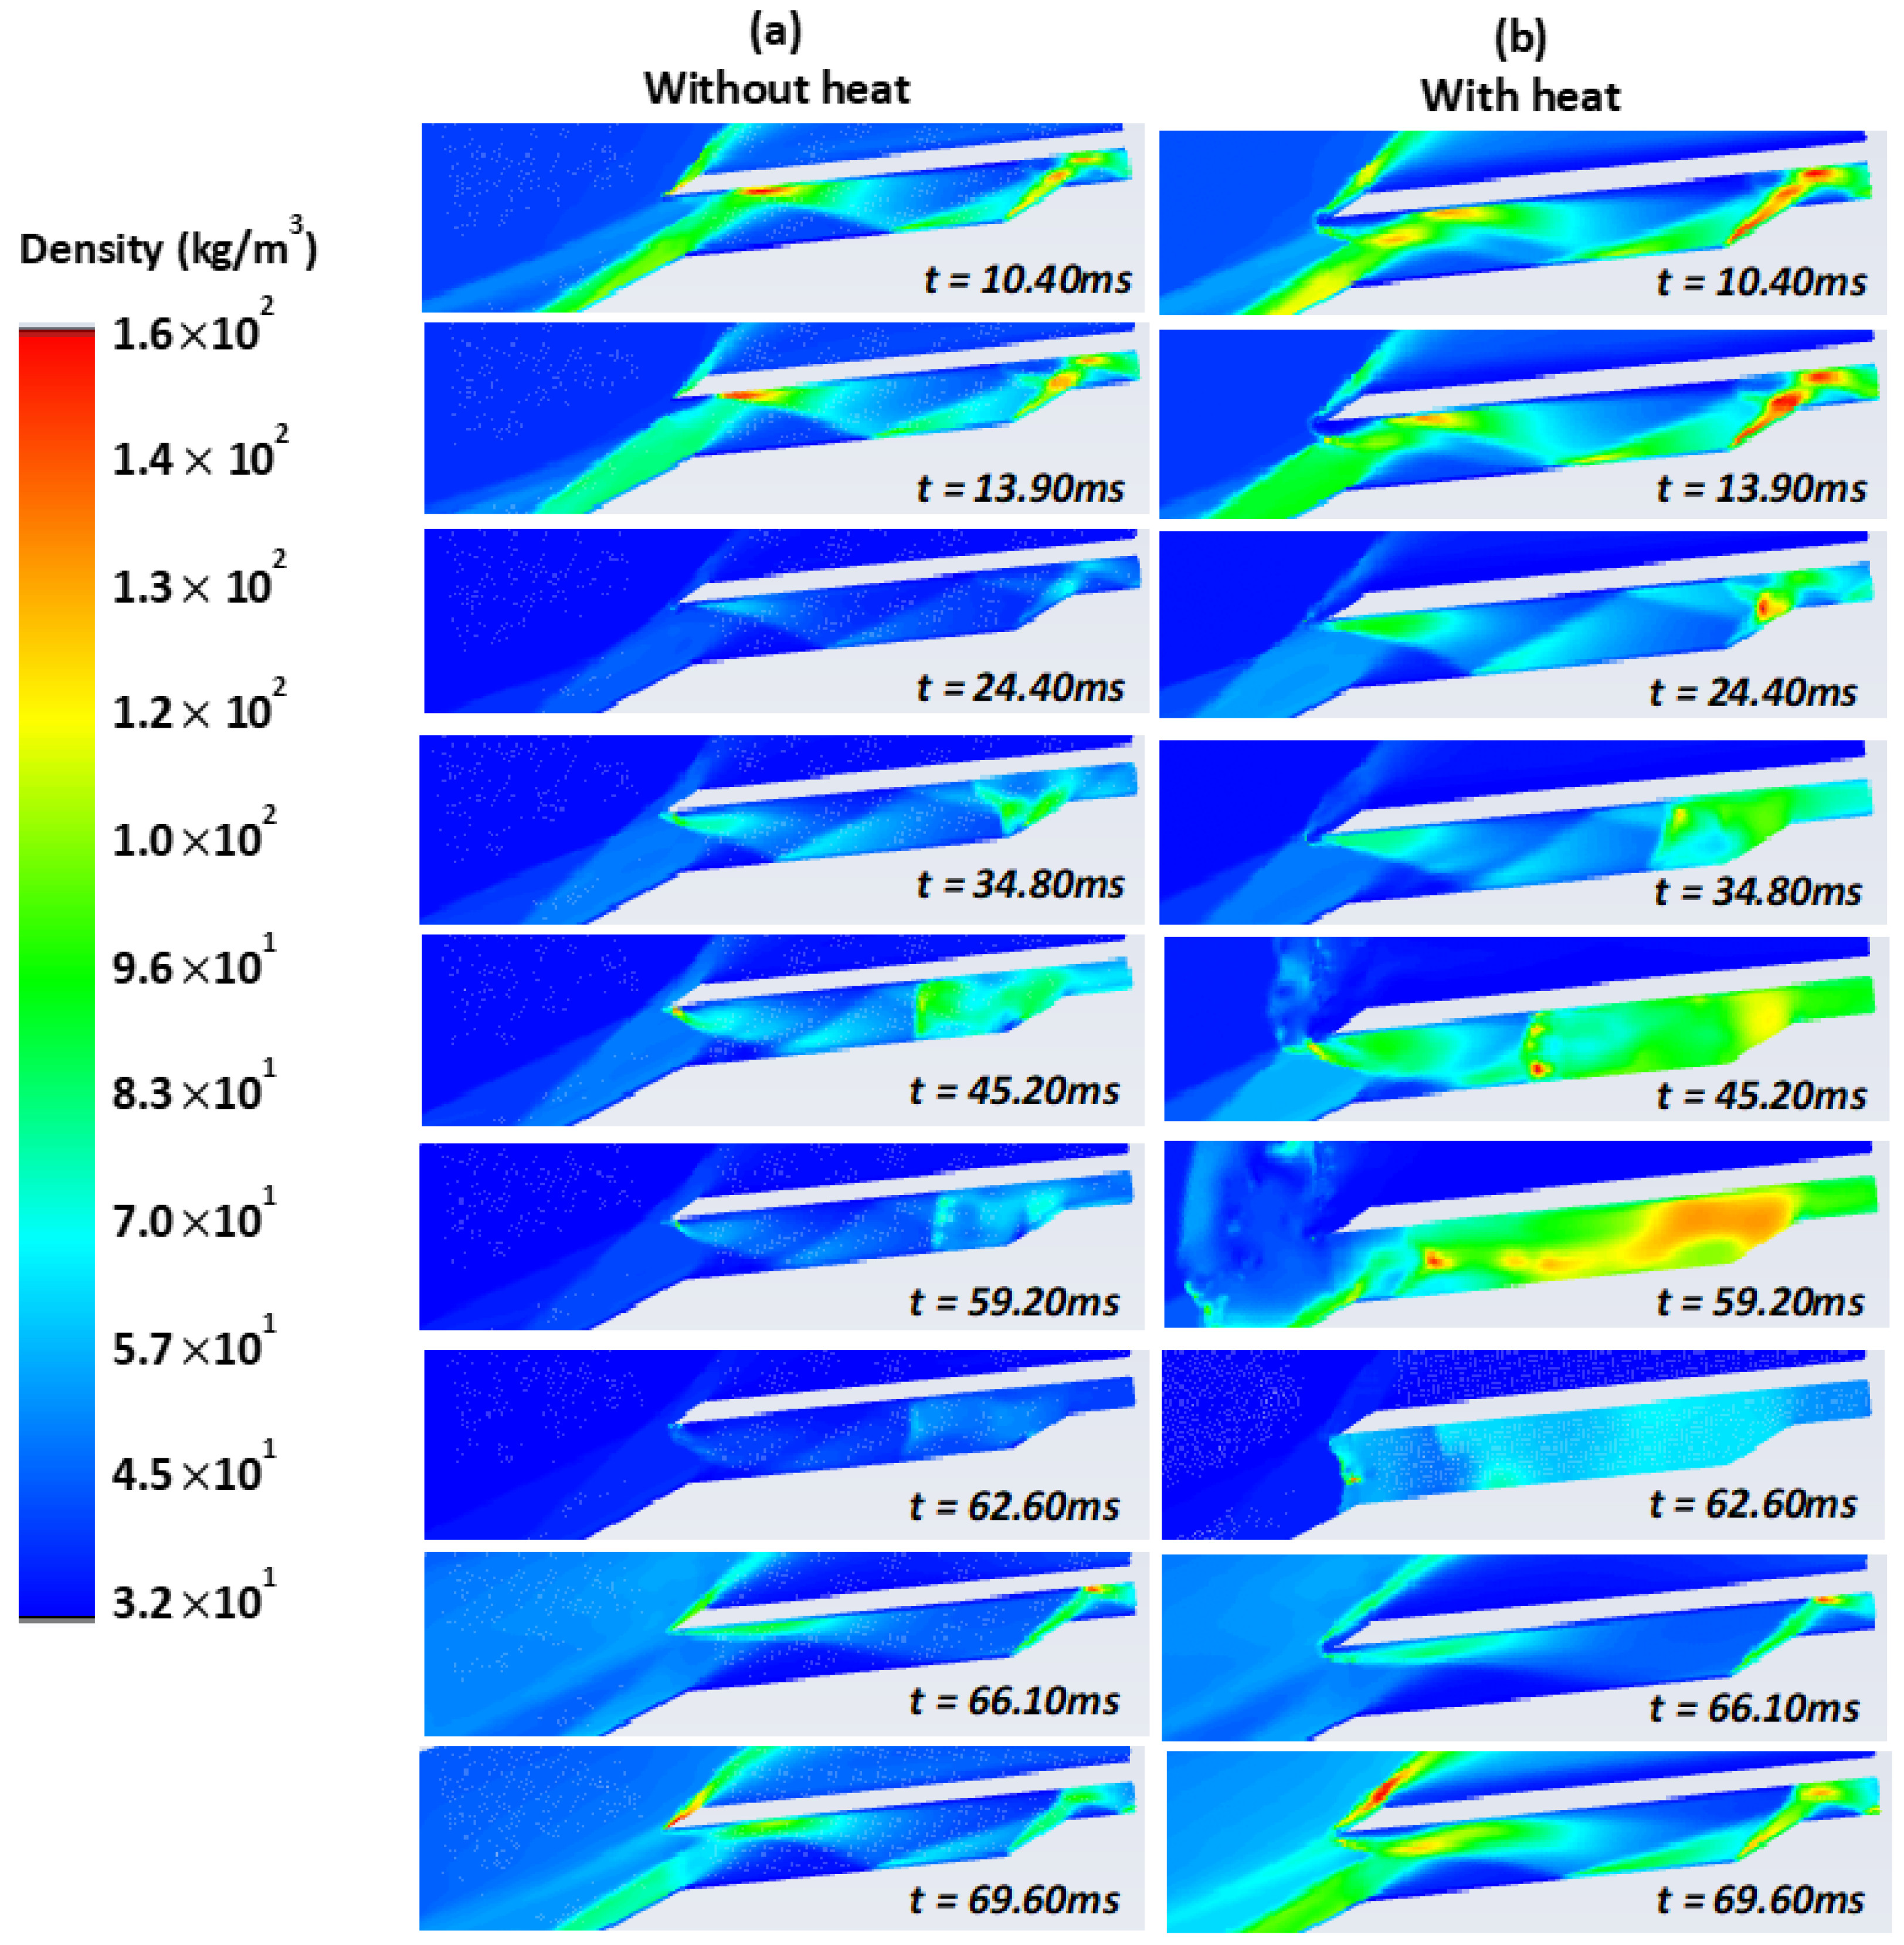
The flow parameters in the isolator without and with a heat source of 5 × 10¹³ Wm−3 and at 5 Mach, AoA 6°, and TR 0.5 are shown in Figure 5a,b, respectively. These figures indicates that the shockwave produced by the heat source influenced the SWBLI within the isolator. As a result, the flow behaviour depicted in Figure 5b was affected. It can be seen that the series without a heat source (Figure 5a) was somewhat different than the image next to it, as there is a tiny difference between them.
The intake flow rate increased, and the detachment shock impacted the cowl tip at t = 10.40 ms. The separation flow at the intake decreased at t = 13.90 ms. The space at the throat was at its narrowest at t = 45.20 ms, at which point the detachment shock had fully reached the intake. Near the shoulder, the separating bubble on the ramp and its isolator floor intersected. After the addition of a source of heat, the shockwave was reflected within the isolator, as seen in Figure 5b, but outside the isolator without a source of heat (Figure 5a), the flow behaviour was affected, and hence, the function of the intake was distorted. Furthermore, as the detachment shock on the shoulder travelled upstream at t = 59.20 ms, a huge barrier formed at the inlet’s opening (Figure 5b). At t = 62.60 ms, the detachment shock was released from the internal compression component, and the whole flow through the intake became practically subsonic. This did not happen in Figure 5b due to shockwaves originating from the heat source, which helped to keep the shockwave inside the isolator. The inlet fluid flow increased at t = 66.10 ms, and a subsequent upstream-moving shock arose in the inlet’s back area. When the separation shock hit the cowl’s edge, a second oscillatory stage occurred. Within the inlet, the separated flow returned. During t = 69.60 ms, the flow patterns were nearly identical to those at t = 10.40 ms. The generation and development of the upstream-moving shock throughout the inlet had a substantial impact throughout the cycle according to a previous study [48]. The density contour appeared to behave similarly to the Schlieren imaging approach described by [7].
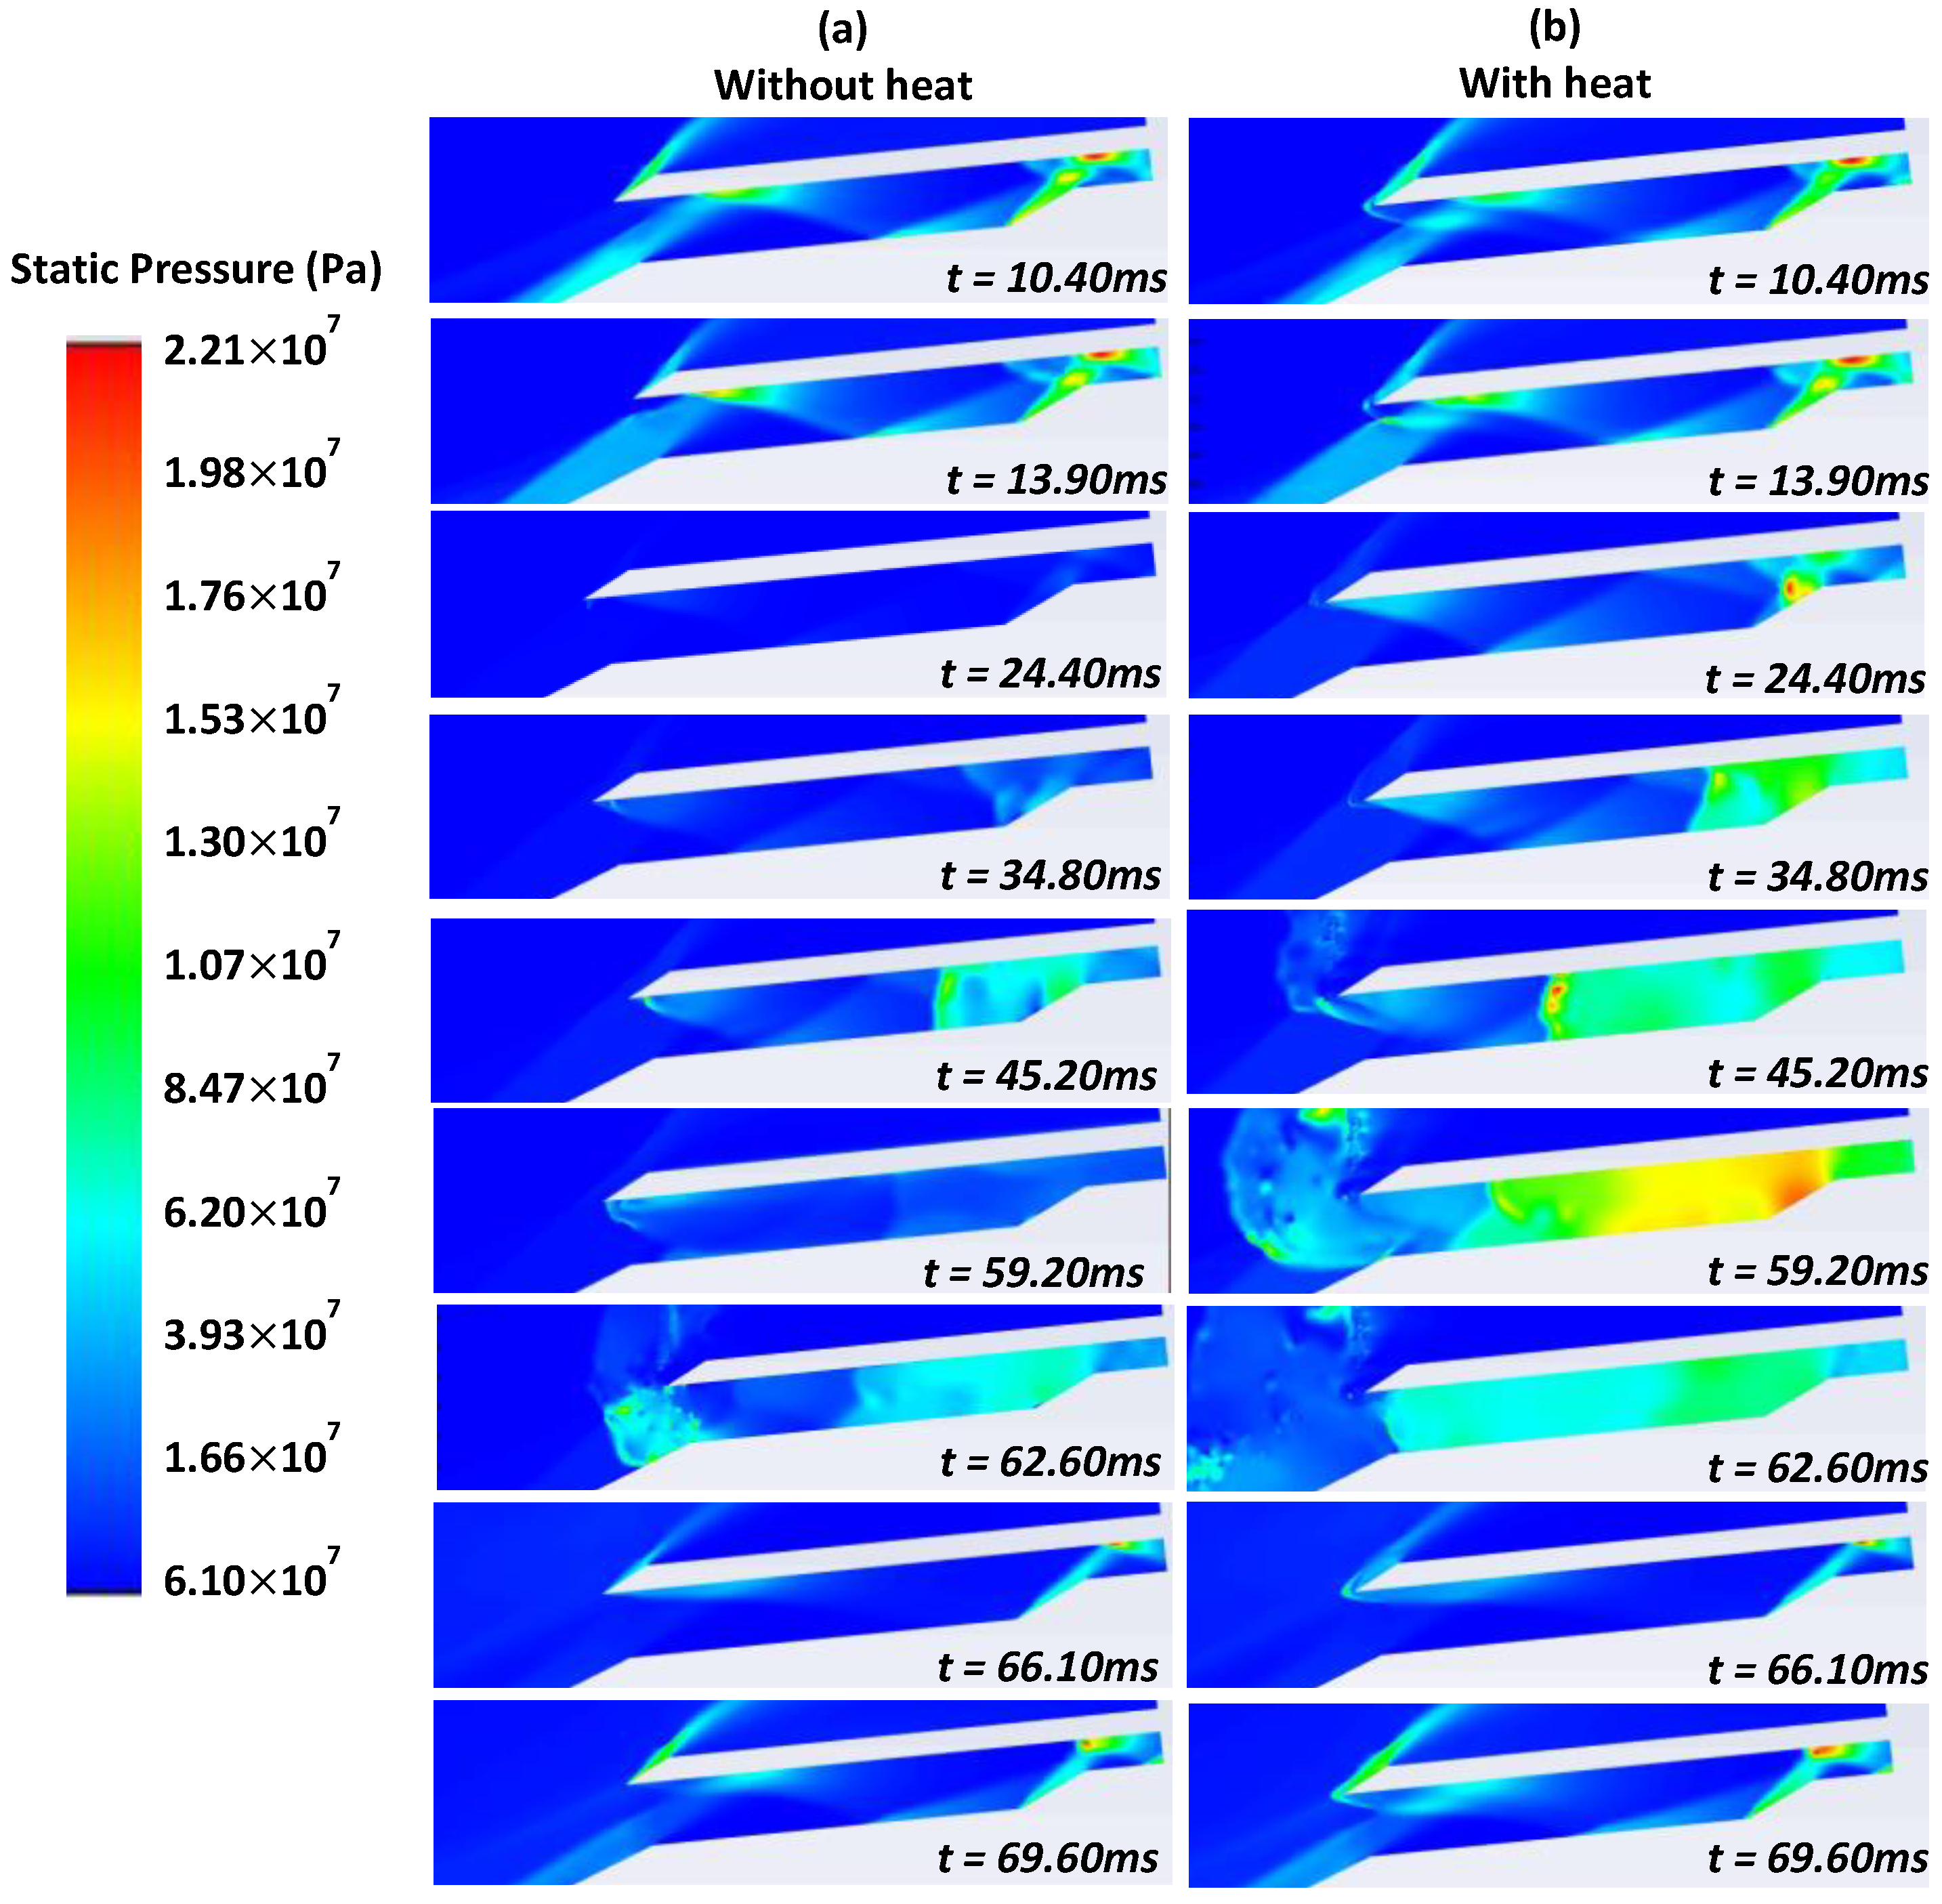
Figure 6 shows the pressure contour of 5 × 10¹³ Wm−3 at 5 Mach, AoA = 6°, and TR = 0.5. It is seen that for the case without heat, at t = 24.40 ms, the pressure inside the isolator was reduced dramatically. This behaviour leads to a non-ignition condition. For the case with heat, the reduction in the pressure was not seen at all and helped to eliminate the non-ignition condition of the scramjet engine.
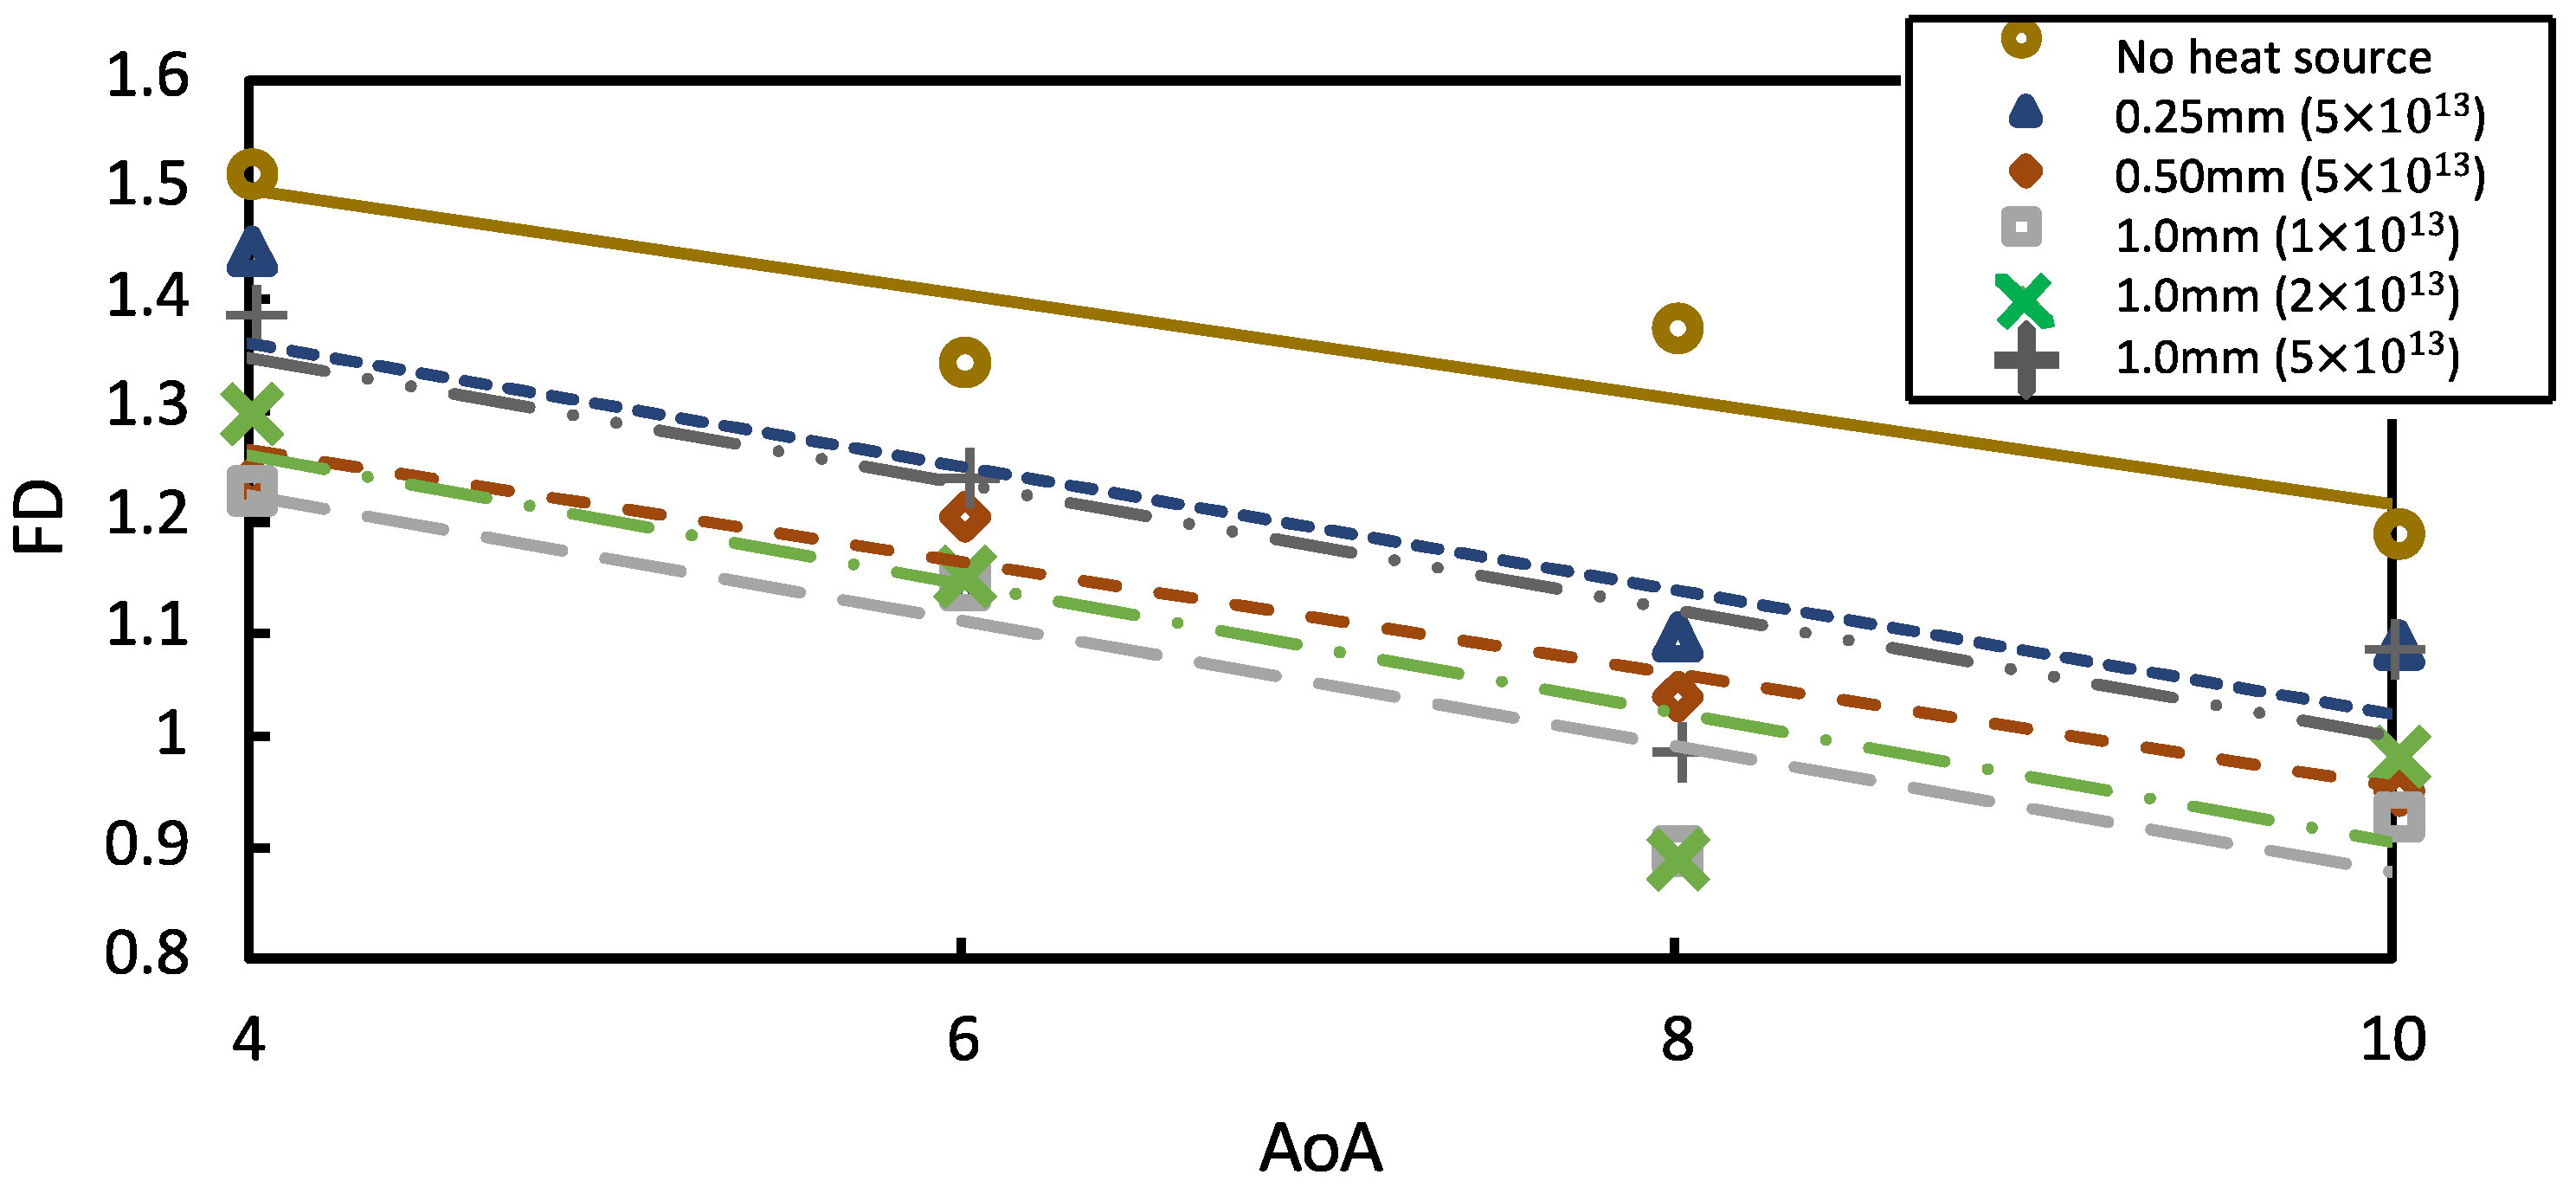
The pattern in the density contour was readily visible, as is the trend in the FD and TPR data. Figure 7 shows the changes in the FD for varying AoAs across varying heat source diameters and power at a steady state. When the heat source is introduced, the value of FD dropped. As the boundary separation at the isolator entry was controlled, the flow distortion was minimized significantly, which contrasted with the existence of a heat source scenario.
The FD value was the highest when the heat source was not employed at the intake. This study replicated various AoAs from AoA = 4° to 10°. This suggests that the current intake will experience flow turbulence or substantial flow distortions for these ranges of angles of attack. It was observed that at AoA = 4° and AoA = 6°, the FD was enhanced by 18.8% and 15.2%, respectively, with a 1.0 mm diameter, 1 × 10¹³ Wm−3 heat source. At AoA = 8°, the FD improved by 15.1% with a 1.0 mm diameter, 2 × 10¹³ Wm−3 heat source, whereas at AoA = 10°, the FD showed an improvement of 21.55% with a 1.0 mm diameter, 1 × 10¹³ Wm−3 heat source. Thus, the FD in the steady-state conditions was influenced by the heat source energy.
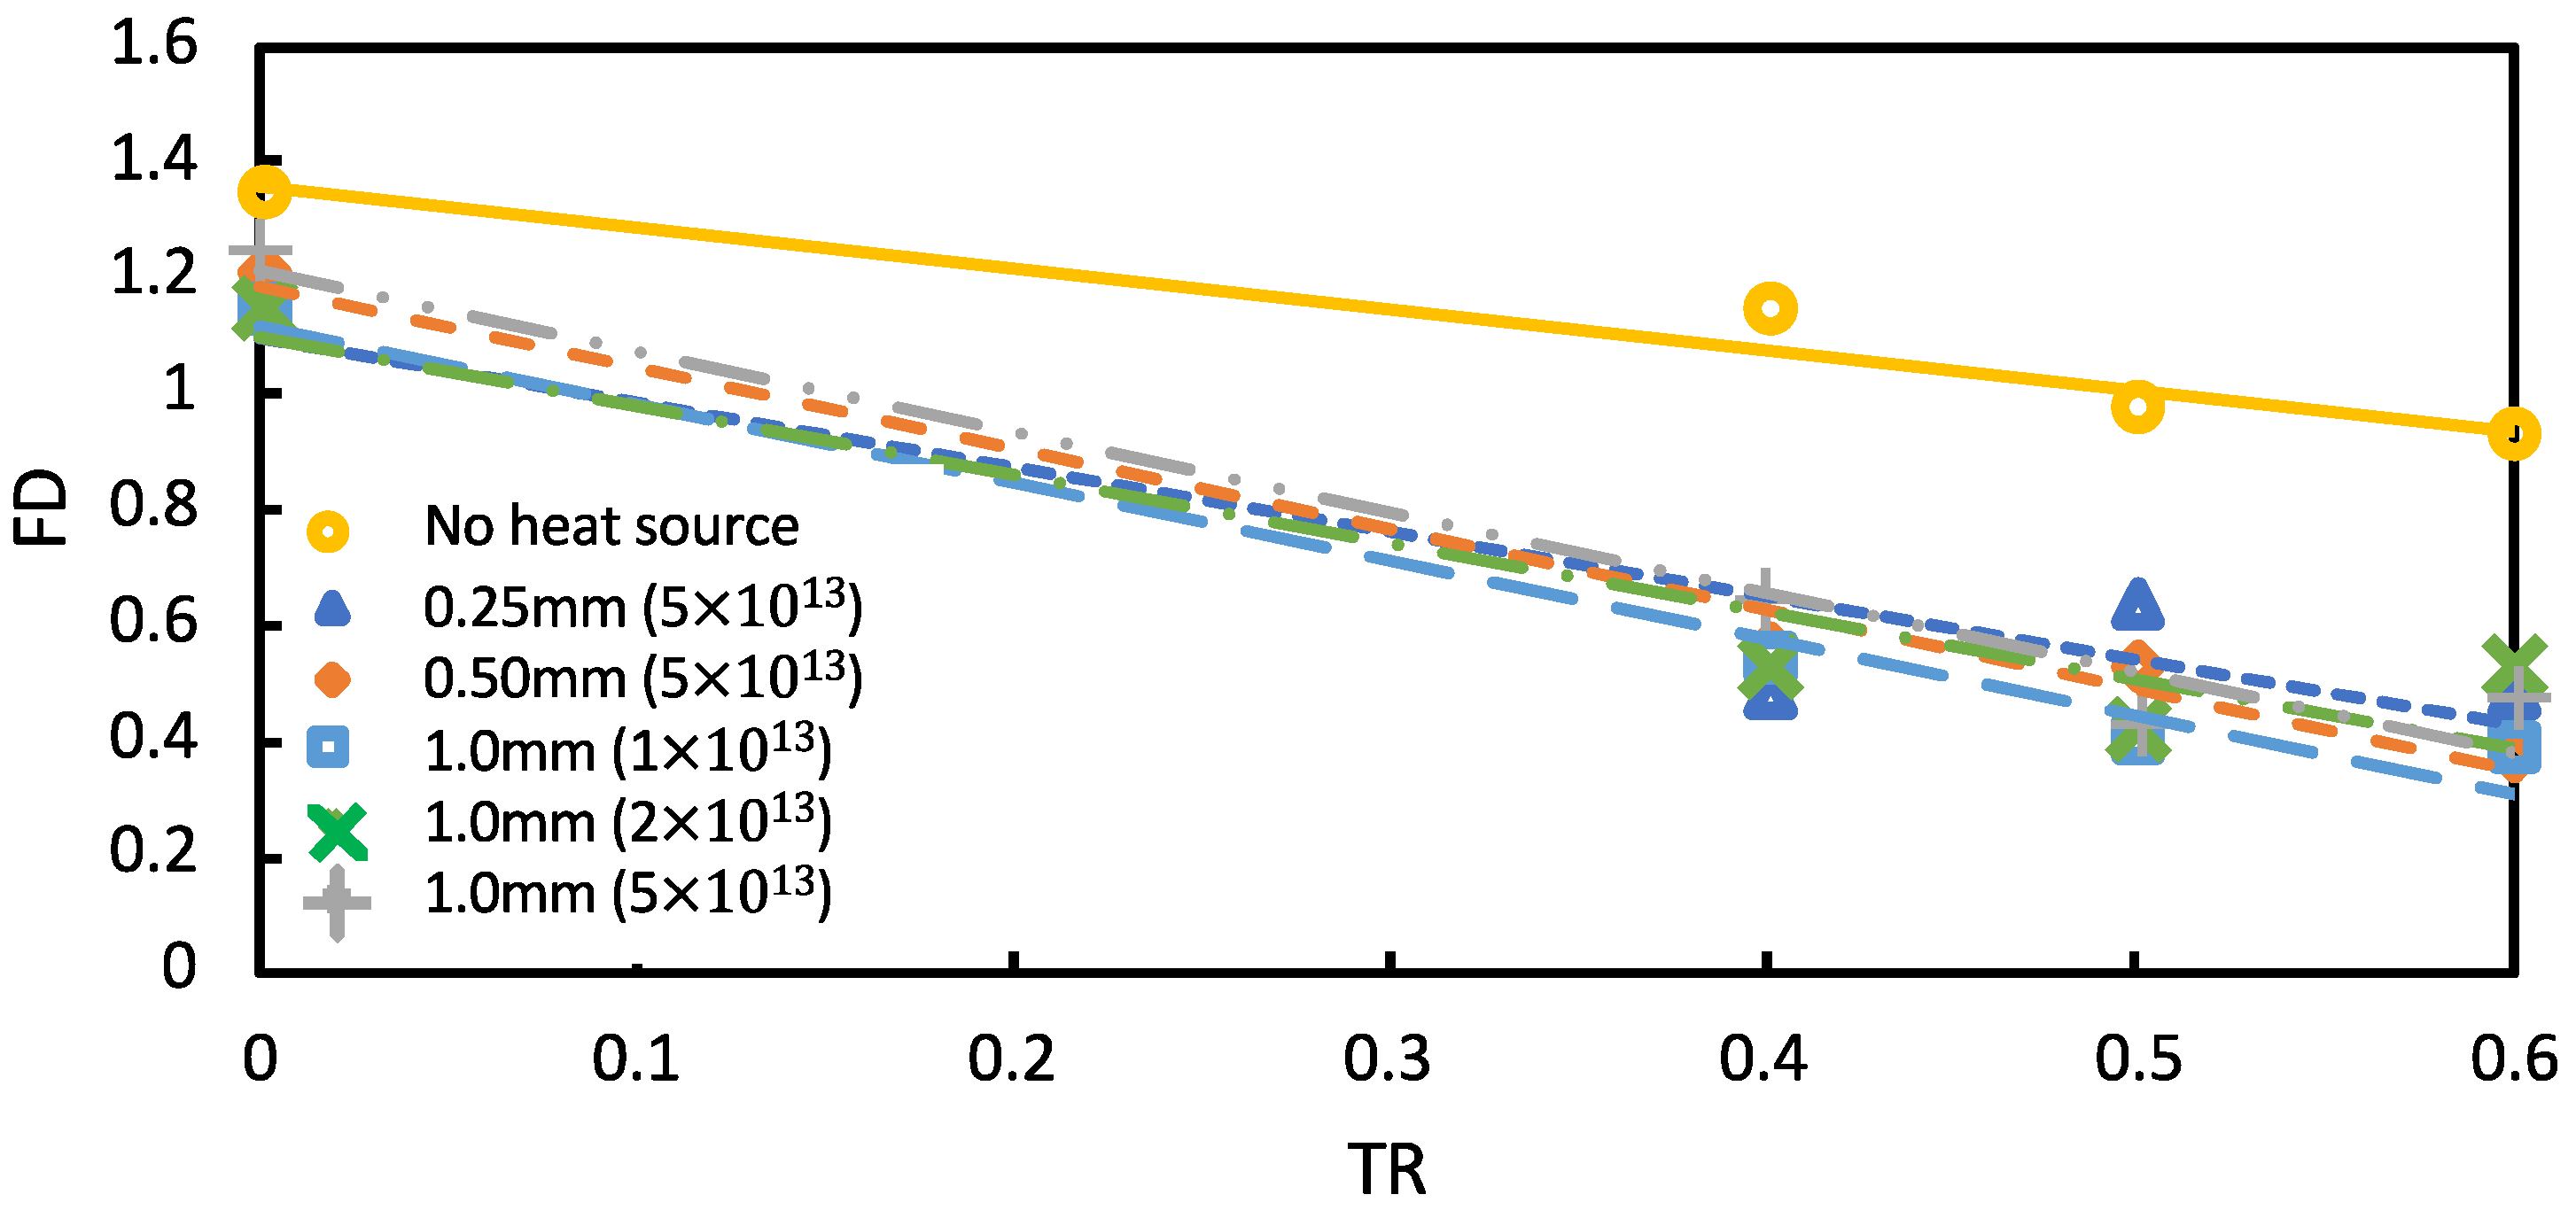
Figure 8 illustrates a comparison of the throttling ratio of the FD under transient-state circumstances with varying heat source powers and diameters.
At TR = 0.4, the FD was enhanced by 58.0% for the 0.25 mm diameter, 5 × 10¹³ Wm−3 heat source. At TR = 0.5, the FD improved by 59.3% for the 1.0 mm diameter, 1 × 10¹³ Wm−3 heat source. At, TR = 0.6 the FD improved by 60% for the 0.5 mm diameter, 5 × 10¹³ Wm−3 heat source; this was the highest pressure drop of FD in this simulation. Thus, the FD in transient-state conditions was influenced by the heat source size. Once the heat source was introduced, the flow distortion increased slightly with large backpressures. The usual shock train within the isolator gradually rose towards the intake exit plane where the FD was determined when a heat source was present, as clearly illustrated in Figure 8. Throughout the influence of the source of heat, the FD decreased, as seen in Figure 7 and Figure 8. The freestream and isolator entry Mach numbers remained constant and were extremely powerful background waves that reduced the flow distortion and boosted the TPR at the isolator entrance. As a result, the SWBLI intake was stronger.
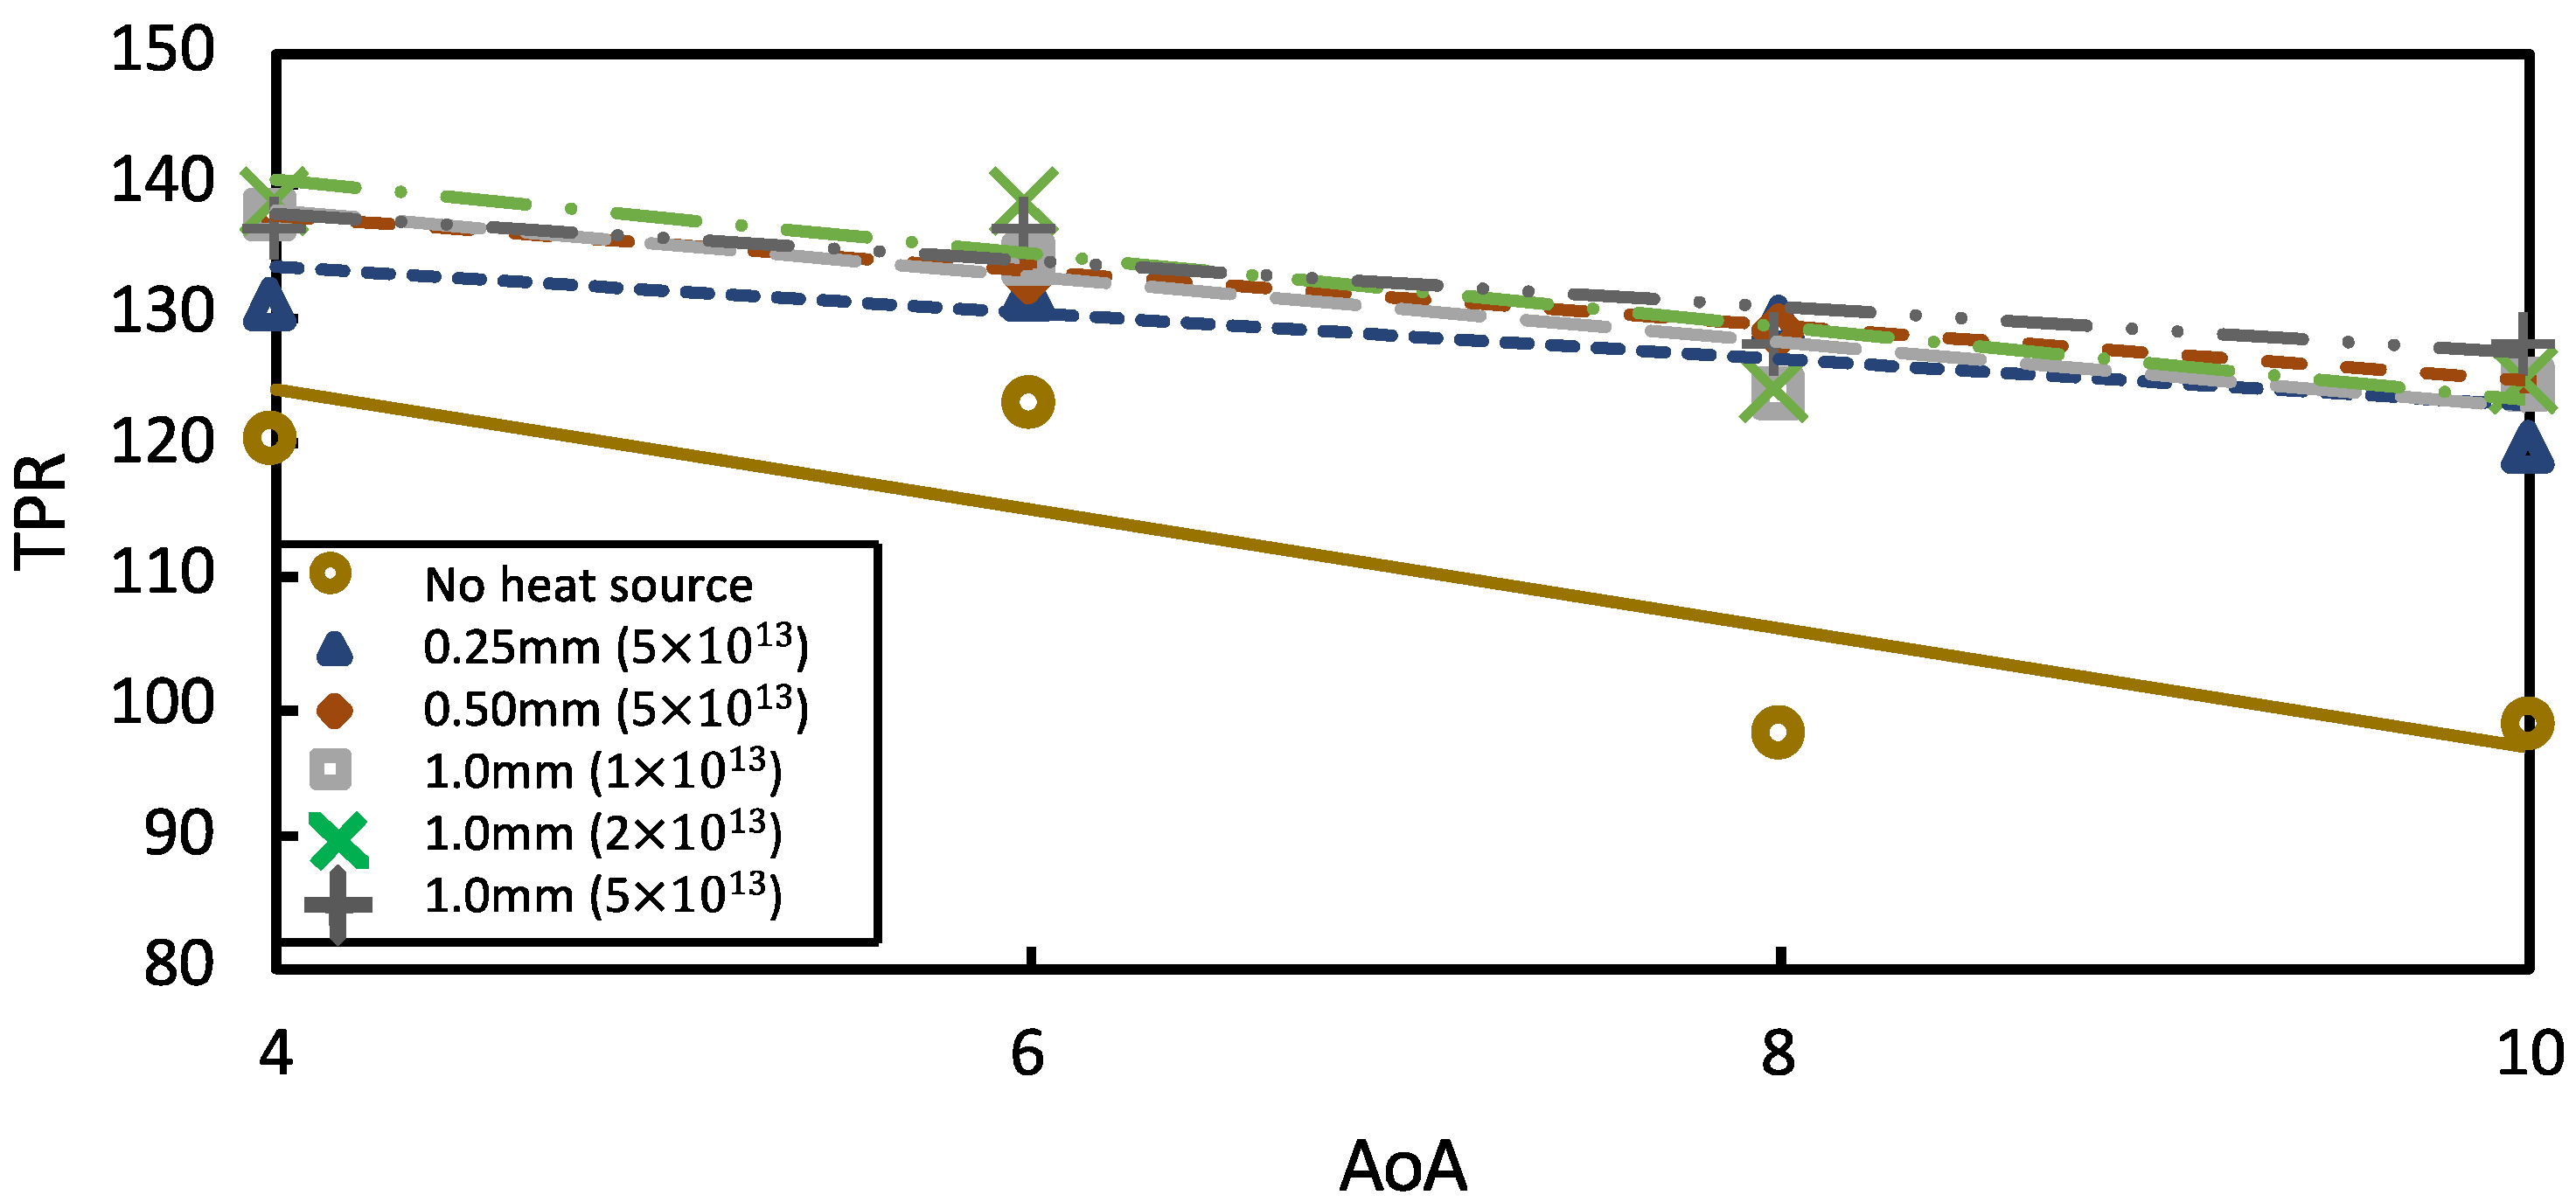
Figure 9 shows that AoA = 4° and AoA = 6° both helped raise the TPR by more than 14.5% and 12.8%, respectively, for a 1.0 mm diameter, 2 × 10¹³ Wm−3 heat source. At AoA = 8°, the 0.5 mm diameter, 5 × 10¹³ Wm−3 heat source had a maximum TPR of 31.4%, whereas AoA = 10° showed a 29.1% improvement with a 1.0 mm diameter, 5 × 10¹³ Wm−3 heat source. Figure 9 shows the fluctuation of the TPR on AoAs with varying heat source energies and diameters under steady-state conditions, for which the heat source energy was more significant.
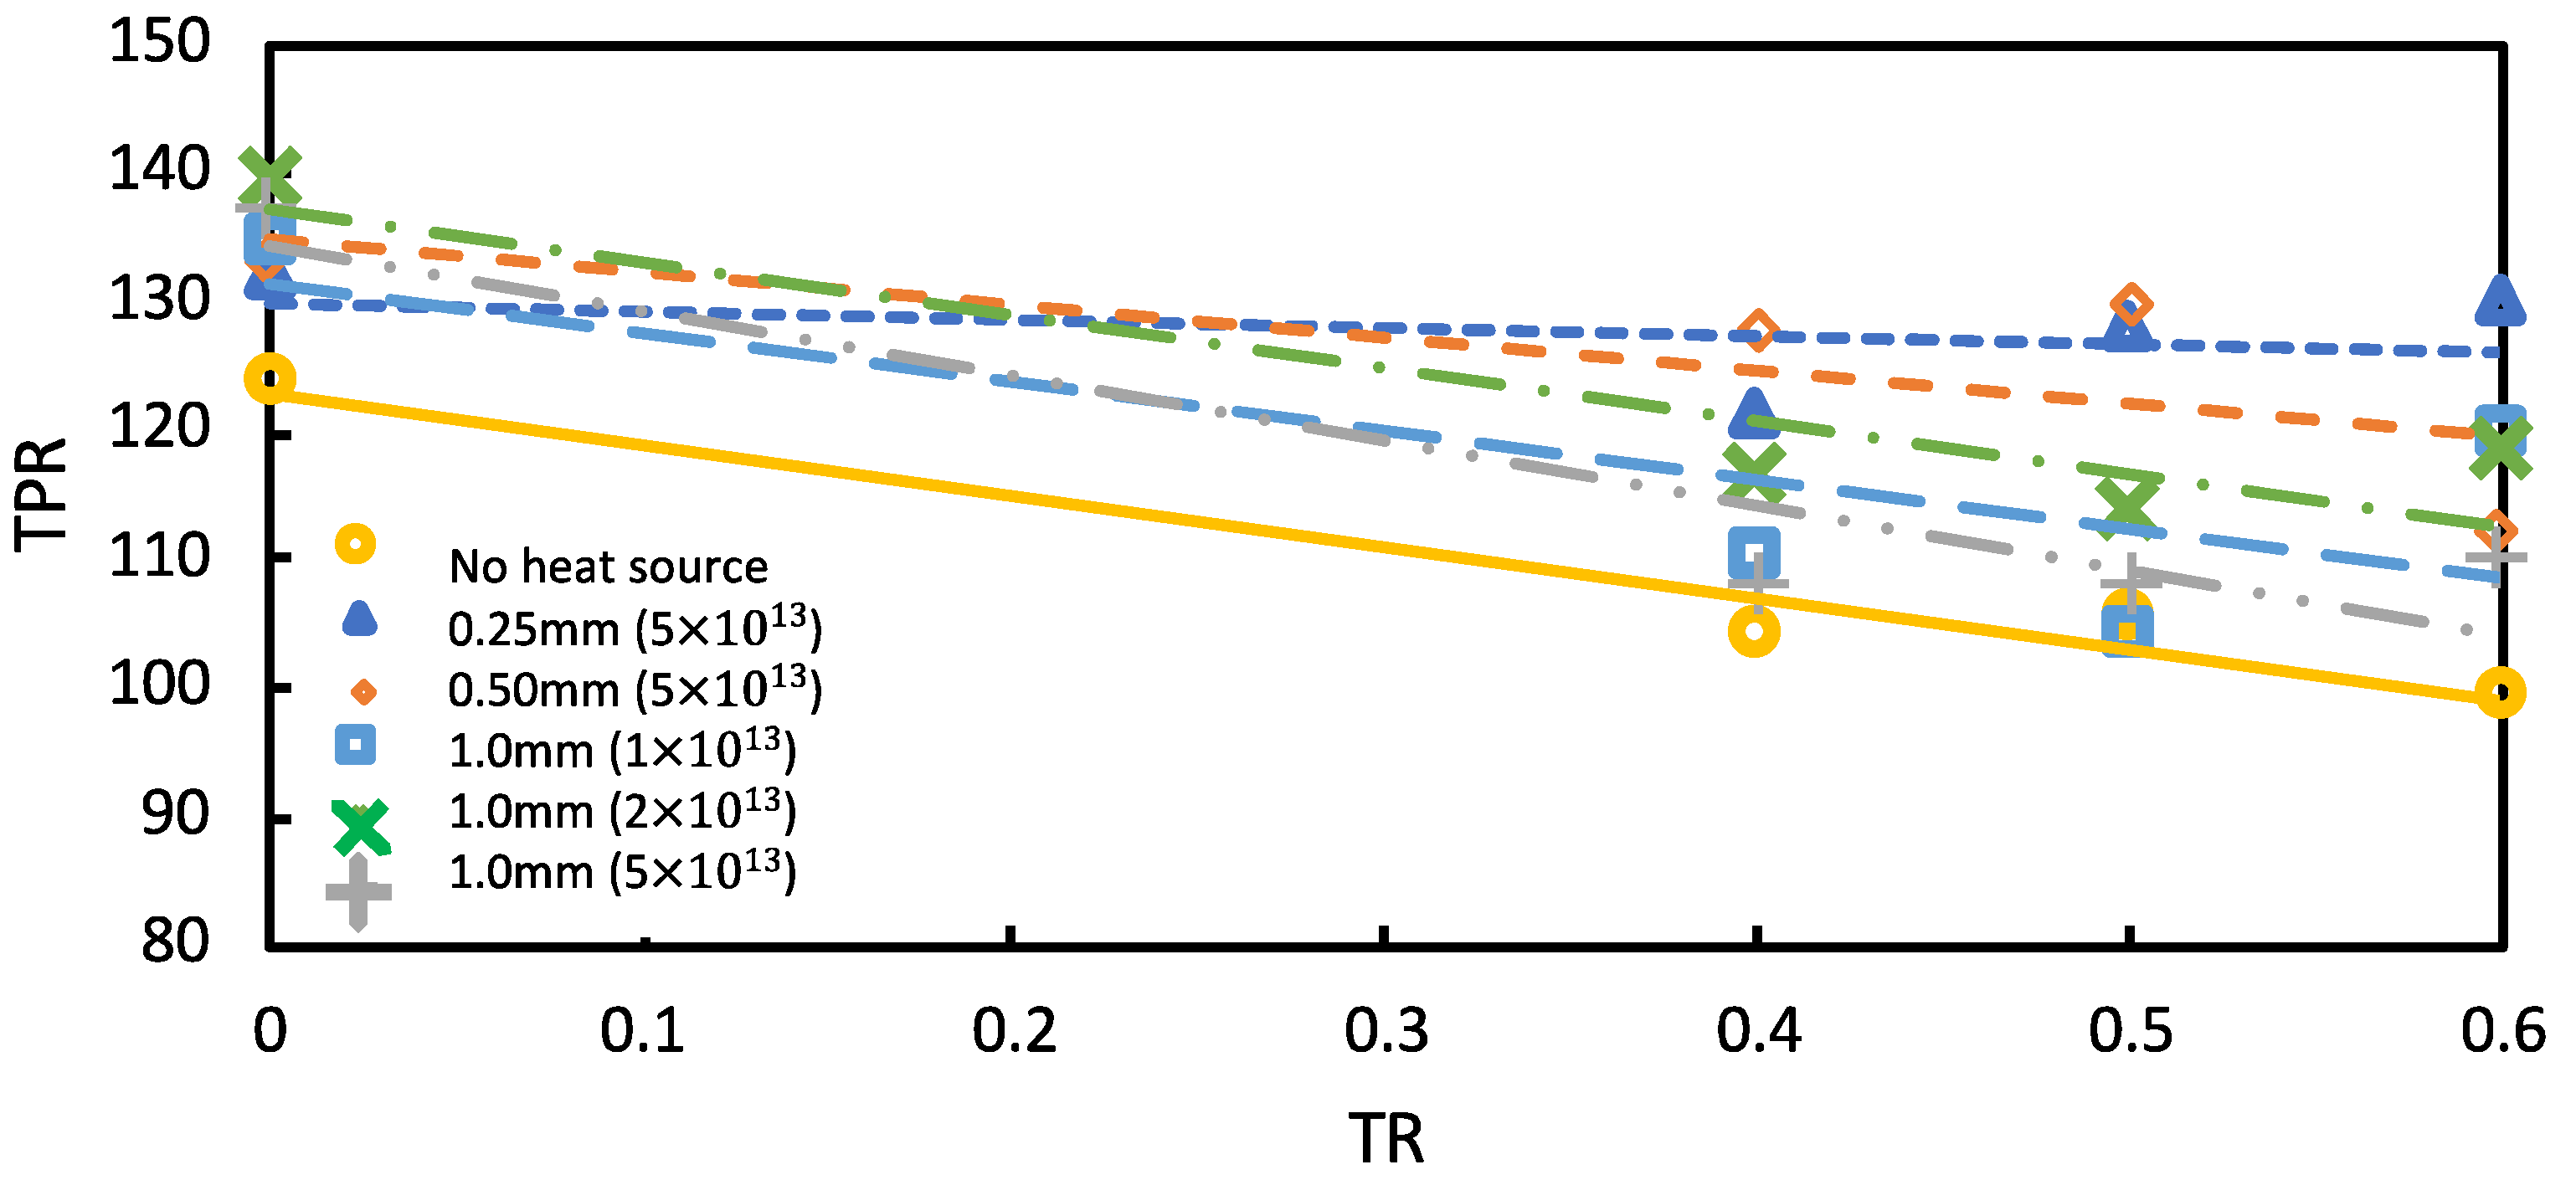
Figure 10 reveals that, during transient-state circumstances, TR = 0.4 and TR = 0.5 improved by 22.3% and 22.8%, respectively, for a diameter of 0.5 mm and heat source of 5 × 10¹³ Wm−3. At TR = 0.6, the greatest TPR transient-state conditions were 24.6% for a 0.25 mm diameter, 5 × 10¹³ Wm−3 heat source. According to the observation results of Figure 10, the TPR during the transient-state settings was influenced by the size of the heat source.
Figure 9 shows the differences in the TPR before and after introducing a heat source under steady-state settings, whereas Figure 10 shows the variations at transient-state settings. The magnitude of the split area reaching the isolator is assumed to be related to the enhancement of the TPR in the diffuser. The TPR rose when a heat source was added because the quantity of the oblique shockwaves just before the intake rose and there was the creation of a minor normal wave at the entry, causing the flow to become subsonic. Therefore, the static pressure at the inlet entry rose above the heat source condition. The required static pressure variation inside the intake decreased when the static pressure variance outside the intake increased. Therefore, the internal normal shock, which is a principal source of total pressure reduction, dropped.
Figure 7, Figure 8, Figure 9 and Figure 10 show that the source of heat seems to have a significant impact on the intake performance. The FD and TPR were majorly impacted when the heat-source energy changed. The TPR improved as an outcome, while the FD declined dramatically. The findings demonstrate that changing the size and power of the heat source has a significant impact on the FD and TPR. The lower the FD, the stronger the hypersonic inlet performance. Because of the compressor’s magnifying impact, the TPR should be maintained as high as possible; otherwise, the separated flow turns fundamentally unstable and needs to be more consistent as it approaches the compressor, thereby reducing its efficiency and operational precision.
4. Conclusions
This study used a constant heat source on the SWBLI to investigate the shockwave characteristics inside the isolator and to improve the overall operation of a hypersonic inlet propulsion system. The outcomes of the flow behaviour agreed well with the findings from previous studies. The analysis showed that a shockwave developed near the heat source and affected the SWBLI within the isolator, altering most of the performance indicators. The source of heat and the throttling device had a substantial impact upon the inlet’s operation. The TPR should be maintained as high as possible, while the FD should be kept as low as possible. We found that in steady-state conditions, the heat source energy was more significant, while in transient conditions, the heat source size was more significant. Lastly, to thoroughly investigate this research, it may be prudent to perform the test at different Mach numbers to establish the optimal heat source energy for improved FDs and TPRs.
Author Contributions
Conceptualization, N.Z., A.C.I. and M.R.A.R.; validation, N.Z., A.C.I. and M.R.A.R.; writing—original draft preparation, N.Z.; writing—review and editing, N.Z., M.R.A.R., M.R.S. and A.C.I.; supervision, M.R.A.R., M.R.S. and A.C.I.; project administration, M.R.A.R.; funding acquisition, M.R.A.R. All authors have read and agreed to the published version of the manuscript.
Funding
This material is based on work supported by the Air Force Office of Scientific Research under award number FA2386-21-1-4016.
Institutional Review Board Statement
Not applicable.
Informed Consent Statement
Not applicable.
Data Availability Statement
Not applicable.
Acknowledgments
The researchers would like to acknowledge the Universiti Pertahanan Nasional Malaysia (UPNM) for providing financial support.
Conflicts of Interest
The authors declare no conflict of interest.
Nomenclature
| Mach number | |
| Stagnation pressure (Pa) | |
| Pressure at Station 0 (Pa) | |
| Pressure at Station 3 (Pa) | |
| FD | Flow distortion |
| TPR | Total pressure recovery |
| TR | Throttling ratio |
| Plug area (m3) | |
| Cross-sectional isolator area (m3) | |
| Total pressure at the inlet’s exit (Pa) | |
| Stagnation pressure at the inlet’s exit (Pa) | |
| Maximum total pressure at the inlet’s exit (Pa) | |
| Minimum total pressure at the inlet’s exit (Pa) | |
| Average total pressure at the inlet’s exit (Pa) |
References
- Van Wie, D.M.; Kwok, F.T.; Walsh, R.F. Starting characteristics of supersonic inlets. In Proceedings of the 32nd Joint Propulsion Conference and Exhibit, Lake Buena Vista, FL, USA, 1–3 July 1996. [Google Scholar] [CrossRef]
- Kantrowitz, A.; Donaldson, C.D. Prelminiary Investigation of Supersonic Diffusors; National Advisory Committee for Aeronautics: Washington, DC, USA, 1945. [Google Scholar]
- Heiser, W.H.; Pratt, D.T. Chapter 5: Compression Systems or Components. In Hypersonic Airbreathing Propulsion; AIAA Education Series; AIAA: Washington, DC, USA, 1994. [Google Scholar]
- Tan, H.J.; Guo, R.W. Experimental study of the unstable-unstarted condition of a hypersonic inlet at mach 6. J. Propuls. Power 2007, 23, 783–788. [Google Scholar] [CrossRef]
- Wagner, J.L.; Yuceil, K.B.; Valdivia, A.; Clemens, N.T.; Dolling, D.S. Experimental investigation of unstart in an inlet/isolator model in mach 5 flow. AIAA J. 2009, 47, 1528–1542. [Google Scholar] [CrossRef]
- Tan, H.J.; Sun, S.; Yin, Z.L. Oscillatory flows of rectangular hypersonic inlet unstart caused by downstream mass-flow choking. J. Propuls. Power 2009, 25, 138–147. [Google Scholar] [CrossRef]
- Li, Z.; Gao, W.; Jiang, H.; Yang, J. Unsteady behaviors of a hypersonic inlet caused by throttling in shock tunnel. AIAA J. 2013, 51, 2485–2492. [Google Scholar] [CrossRef]
- Tan, H.J.; Li, L.G.; Wen, Y.F.; Zhang, Q.F. Experimental investigation of the unstart process of a generic hypersonic inlet. AIAA J. 2011, 49, 279–288. [Google Scholar] [CrossRef]
- Tan, H.J.; Sun, S.; Huang, H.X. Behavior of shock trains in a hypersonic inlet/isolator model with complex background waves. Exp. Fluids 2012, 53, 1647–1661. [Google Scholar] [CrossRef]
- Sun, P.Z.; Shi, H.T.; Lu, X.Y. Numerical Investigation of the Unsteady Behavior of a Hypersonic Inlet under Throttling. Procedia Eng. 2015, 126, 179–183. [Google Scholar] [CrossRef]
- Wang, C.; Xue, L.; Tian, X. Experimental characteristics of oblique shock train upstream propagation. Chin. J. Aeronaut. 2017, 30, 663–676. [Google Scholar] [CrossRef]
- Devaraj, M.K.K.; Jutur, P.; Rao, S.M.V.; Jagadeesh, G.; Anavardham, G.T.K. Experimental investigation of unstart dynamics driven by subsonic spillage in a hypersonic scramjet intake at Mach 6. Phys. Fluids 2020, 32, 026103. [Google Scholar] [CrossRef]
- Sekar, K.R.; Karthick, S.K.; Jegadheeswaran, S.; Kannan, R. On the unsteady throttling dynamics and scaling analysis in a typical hypersonic inlet-isolator flow. Phys. Fluids 2020, 32, 126104. [Google Scholar] [CrossRef]
- Saravanan, R.; Desikan, S.L.N.; Francise, K.J.; Kalimuthu, R. Experimental investigation of start/unstart process during hypersonic intake at Mach 6 and its control. Aerosp. Sci. Technol. 2021, 113, 106688. [Google Scholar] [CrossRef]
- Devaraj, M.K.K.; Jutur, P.; Rao, S.M.V.; Jagadeesh, G.; Anavardham, G.T.K. Investigation of local unstart in a hypersonic scramjet intake at a Mach number of 6. Aerosp. Sci. Technol. 2021, 115, 106789. [Google Scholar] [CrossRef]
- Devaraj, M.K.K.; Jutur, P.; Rao, S.M.V.; Jagadeesh, G.; Anavardham, G.T.K. Length scale for the estimation of buzz frequency in the limit of high mechanical blockage in mixed-compression intakes. J. Fluid Mech. 2021, 916, R3. [Google Scholar] [CrossRef]
- Gao, W.; LI, Z.; Yang, J.; Zeng, Y. Effects of trips on the oscillatory flow of an axisymmetric hypersonic inlet with downstream throttle. Chin. J. Aeronaut. 2018, 31, 225–236. [Google Scholar] [CrossRef]
- Chen, H.; Tan, H.J.; Zhang, Q.F.; Zhang, Y. Throttling process and buzz mechanism of a supersonic inlet at overspeed mode. AIAA J. 2018, 56, 1953–1964. [Google Scholar] [CrossRef]
- Wagner, J.L.; Yuceil, K.B.; Clemens, N.T. Velocimetry measurements of unstart in an inlet-isolator model in Mach 5 flow. AIAA J. 2010, 48, 1875–1888. [Google Scholar] [CrossRef]
- Zhang, Q.F.; Tan, H.J.; Chen, H.; Yuan, Y.Q.; Zhang, Y.C. Unstart process of a rectangular hypersonic inlet at different Mach numbers. AIAA J. 2016, 54, 3681–3691. [Google Scholar] [CrossRef]
- Chang, J.; Li, N.; Xu, K.; Bao, W.; Yu, D. Recent research progress on unstart mechanism, detection and control of hypersonic inlet. Prog. Aerosp. Sci. 2017, 89, 1–22. [Google Scholar] [CrossRef]
- Im, S.K.; Do, H. Unstart phenomena induced by flow choking in scramjet inlet-isolators. Prog. Aerosp. Sci. 2018, 97, 1–21. [Google Scholar] [CrossRef]
- Kang, K.; Wermer, L.; Im, S.; Song, S.J.; Do, H. Fast-acting boundary-layer suction to control unstarting and unstarted flows. AIAA J. 2020, 58, 2475–2485. [Google Scholar] [CrossRef]
- Newsome, R.W.W. Numerical simulation of near-critical and unsteady, subcritical inlet flow. AIAA J. 1984, 22, 1375–1379. [Google Scholar] [CrossRef]
- Yamamoto, J.; Kojima, Y.; Kameda, M.; Watanabe, Y.; Hashimoto, A.; Aoyama, T. Prediction of the onset of supersonic inlet buzz. Aerosp. Sci. Technol. 2020, 96, 105523. [Google Scholar] [CrossRef]
- De Vanna, F.; Picano, F.; Benini, E.; Quinn, M.K. Large-eddy simulations of the unsteady behavior of a hypersonic intake at mach 5. AIAA J. 2021, 59, 3859–3872. [Google Scholar] [CrossRef]
- Lu, P.-J.; Jain, L.-T. Numerical investigation of inlet buzz flow. J. Propuls. Power 1998, 14, 90–100. [Google Scholar] [CrossRef]
- Trapier, S.; Deck, S.; Duveau, P. Delayed detached-eddy simulation and analysis of supersonic inlet buzz. AIAA J. 2008, 46, 118–131. [Google Scholar] [CrossRef]
- Hong, W.; Kim, C. Numerical study on supersonic inlet buzz under various throttling conditions and fluid-structure interaction. In Proceedings of the 29th AIAA Applied Aerodynamics Conference, Honolulu, HI, USA, 27–30 June 2011; pp. 1–16. [Google Scholar] [CrossRef]
- Xie, W.Z.; Wu, Z.M.; Yu, A.Y.; Guo, S. Control of severe shock-wave/boundary-layer interactions in hypersonic inlets. J. Propuls. Power 2018, 34, 614–623. [Google Scholar] [CrossRef]
- Lee, J.; Kang, S.H. Numerical study on the start and unstart phenomena in a scramjet inlet-isolator model. PLoS ONE 2019, 14, e0224994. [Google Scholar] [CrossRef] [PubMed]
- Soltani, M.R.; Daliri, A.; Sepahi Younsi, J. Effects of shock wave/boundary-layer interaction on performance and stability of a mixed-compression inlet. Sci. Iran. 2016, 23, 1811–1825. [Google Scholar] [CrossRef]
- Yuan, H.; Liu, F.; Wang, X.; Zhou, Z. Design and analysis of a supersonic axisymmetric inlet based on controllable bleed slots. Aerosp. Sci. Technol. 2021, 118, 107008. [Google Scholar] [CrossRef]
- De Vanna, F.; Bof, D.; Benini, E. Multi-Objective RANS Aerodynamic Optimization of a Hypersonic Intake Ramp at Mach 5. Energies 2022, 15, 2811. [Google Scholar] [CrossRef]
- Askari, R.; Soltani, M.R.; Mostoufi, K.; Fard, A.K.; Abedi, M. Angle of attack investigations on the performance of a diverterless supersonic inlet. J. Appl. Fluid Mech. 2019, 12, 2017–2030. [Google Scholar] [CrossRef]
- Lee, H.-J.; Jeung, I.-S. Experimental and numerical investigation on the supersonic inlet buzz with angle of attack. In Shock Waves; Springer: Berlin/Heidelberg, Gertmany, 2009; pp. 1111–1116. [Google Scholar] [CrossRef]
- Macheret, S.O.; Shneider, M.N.; Miles, R.B. Scramjet inlet control by off-body energy addition: A virtual cowl. AIAA J. 2004, 42, 2294–2302. [Google Scholar] [CrossRef]
- Kremeyer, K.; Sebastian, K.; Shu, C.-W. Computational study of shock mitigation and drag reduction by pulsed energy lines. AIAA J. 2006, 44, 1720–1731. [Google Scholar] [CrossRef]
- Russell, A.; Myokan, M.; Bottini, H.; Sasoh, A.; Zare-Behtash, H.; Kontis, K. Application of laser energy deposition to improve performance for high speed intakes. Propuls. Power Res. 2020, 9, 15–25. [Google Scholar] [CrossRef]
- Ambe Verma, K.; Murari Pandey, K.; Ray, M.; Kumar Sharma, K. Effect of transverse fuel injection system on combustion efficiency in scramjet combustor. Energy 2021, 218, 119511. [Google Scholar] [CrossRef]
- Krause, M.; Reinartz, B.; Behr, M. Numerical analysis of transition effects in 3d hypersonic intake flows. In High Performance Computing in Science and Engineering 2009; Transactions of the High Performance Computing Center (HLRS): Stuttgart, Germany, 2010; pp. 395–409. [Google Scholar]
- Bosco, A.; Brown, L.M.; Boyce, R.R. Investigation of a Compression Corner at Hypersonic Conditions using a Reynolds Stress Model. In Proceedings of the 17th AIAA International Space Planes and Hypersonic Systems and Technologies Conference, San Francisco, CA, USA, 11–14 April 2011. [Google Scholar]
- Gnoffo, P.A.; Berry, S.A.; Norman, J.W. Van Uncertainty Assessments of 2D and Axisymmetric Hypersonic Shock Wave-Turbulent Boundary Layer Interaction Simulations at Compression Corners. In Proceedings of the 42nd AIAA thermophysics conference, Honolulu, HI, USA, 27–30 June 2011. [Google Scholar]
- Reinartz, B. Parameter study for scramjet intake concerning wall temperatures and turbulence modeling. In High Performance Computing in Science and Engineering 2011; Transactions of the High Performance Computing Center (HLRS): Stuttgart, Germany, 2012; pp. 425–436. [Google Scholar]
- Knight, D.D. Energy Deposition for High-Speed Flow Control; Cambridge University Press: Cambridge, UK, 2019; ISBN 9781316389331. [Google Scholar]
- Sepahi-Younsi, J.; Esmaeili, S. Performance Enhancement of a Supersonic Air Intake by Applying a Heat Source. J. Aerosp. Eng. 2020, 33, 04020048. [Google Scholar] [CrossRef]
- Idris, A.C.; Saad, M.R.; Zare-Behtash, H.; Kontis, K. Luminescent measurement systems for the investigation of a scramjet inlet-isolator. Sensors 2014, 14, 6606–6632. [Google Scholar] [CrossRef] [PubMed]
- Gudmundsson, S. General Aviation Aircraft Design: Applied Methods and Procedures; Elsevier Inc.: Amsterdam, The Netherlands, 2013; pp. 1–1034. ISBN 9780123973085. [Google Scholar]
Figure 1.
Mesh for the baseline case.

Figure 2.
Mesh independence study of (a) pressure ratio, (b) y+, and (c) skin friction coefficient, Cf.
Figure 2.
Mesh independence study of (a) pressure ratio, (b) y+, and (c) skin friction coefficient, Cf.


Figure 3.
Location of the heat source effects.

Figure 4.
Validation of present simulation work with published experimental results [47].
Figure 4.
Validation of present simulation work with published experimental results [47].

Figure 5.
Density of AoA 6° and TR 0.5 (a) without and (b) with the heat of 1 mm 5 × 10¹³ W/m3.

Figure 6.
Static pressure of AoA 6° and TR 0.5 (a) without and (b) with heat of 1 mm 5 × 10¹³ W/m3.

Figure 7.
Flow distortion in steady-state conditions at various diameters and powers of heat source.
Figure 7.
Flow distortion in steady-state conditions at various diameters and powers of heat source.

Figure 8.
Flow distortion in transient conditions at various diameters and powers of heat source.

Figure 9.
Total pressure recovery in steady-state condition at various diameters and powers of heat source.
Figure 9.
Total pressure recovery in steady-state condition at various diameters and powers of heat source.

Figure 10.
Total pressure recovery in steady-state condition at various diameters and powers of heat source.
Figure 10.
Total pressure recovery in steady-state condition at various diameters and powers of heat source.


Table 1.
Simulation parameters.
| Properties | Value |
|---|---|
| Mach number | 5 |
| Stagnation pressure (MPa) | 0.65 |
| Stagnation inlet temperature (K) | 375 |
| Reynolds number (m−1) | 13.2 × 10⁶ |
| Angle of attack (°) | 0–10 |
| Throttling ratio | 0, 0.4, 0.5, 0.6 |
| Diameter of the laser (mm) | 0.25, 0.5, 1 |
| Laser energy (Wm−3) | 1 × 10¹³, 2 × 10¹³, 5 × 10¹³ |
Publisher’s Note: MDPI stays neutral with regard to jurisdictional claims in published maps and institutional affiliations. |
© 2022 by the authors. Licensee MDPI, Basel, Switzerland. This article is an open access article distributed under the terms and conditions of the Creative Commons Attribution (CC BY) license (https://creativecommons.org/licenses/by/4.0/).
Share and Cite
MDPI and ACS Style
Zahrolayali, N.; Saad, M.R.; Idris, A.C.; Rahman, M.R.A. Assessing the Performance of Hypersonic Inlets by Applying a Heat Source with the Throttling Effect. Aerospace 2022, 9, 449. https://doi.org/10.3390/aerospace9080449
AMA Style
Zahrolayali N, Saad MR, Idris AC, Rahman MRA. Assessing the Performance of Hypersonic Inlets by Applying a Heat Source with the Throttling Effect. Aerospace. 2022; 9(8):449. https://doi.org/10.3390/aerospace9080449
Chicago/Turabian StyleZahrolayali, Nurfathin, Mohd Rashdan Saad, Azam Che Idris, and Mohd Rosdzimin Abdul Rahman. 2022. "Assessing the Performance of Hypersonic Inlets by Applying a Heat Source with the Throttling Effect" Aerospace 9, no. 8: 449. https://doi.org/10.3390/aerospace9080449
Note that from the first issue of 2016, this journal uses article numbers instead of page numbers. See further details here.