1. Introduction
At present, the sandwich structure is widely used [
1,
2,
3,
4], especially in aerospace design, due to its excellent weight lightening properties. The mass of an aircraft is one of the most critical performance indicators. Honeycomb sandwich structures are the most commonly used sandwich structures in aircraft construction [
5], and finding a sandwich core with higher specific stiffness and specific strength is necessary for improving an aircraft’s performance. An excellent choice is the faceted regular folded core (RFC).
RFC, consisting of repetitive identical cells, can be expanded along a plane. Those repetitive identical cells are called elementary modules (EM). The following areas have potential applications for RFC: lightweight core sandwich panels, relief surfaces of heat exchangers [
6], sound-absorbing [
7] structures, energy-absorbing sandwich panels [
8], and radio scattering devices. Geometric manufacturing technology for thin-walled relief folded configurations has been established [
9,
10], and the design of multiple folded configurations has also been analyzed [
11,
12,
13]. In aerospace design, the folded configuration is often used as the core of sandwich structures due to its good soundproofing properties and energy absorption properties.
Cai et al. [
14] mainly elaborated on folded sandwich structures, including the design of topological configurations of folded core materials, preparation process research, and studies on mechanical properties, failure modes, numerical simulations, sound insulation, and the thermodynamics of folded sandwich structures. At the same time, the possible applications of the folded sandwich structure were predicted, and its future research directions were anticipated, taking into account its performance and advantages. Wang [
15] summarized the design methods of various folded cores and described their correlations. Zhou [
16] presented a parametric study on the mechanical properties of various Miura-based folded core models, virtually testing the quasi-static compression, shear and bending using the finite element method. In Wang and Zhou’s study [
17], the radar absorbing characteristics were measured by comparing the radar waves on both sides of the sandwich panel, and the effect of the folded core configuration on the absorbing capability was explored. The height of the folded core significantly affects the intensity of the reflected signal. Heimbs et al. experimentally investigated the mechanical behavior of folded configurations under compression, shear, and impact loading. Duan et al. [
18] conducted a study on the stamping and forming process for the folded sandwich structure of aluminum alloy and explored the effects of material properties, plate thickness, stamping speed, the initial temperature of the plate, and other factors on the stamping and forming quality of the folded structure. However, no relationship between the mechanical properties and the geometric parameters of the folded configuration was found [
19,
20]. Kong [
21] studied the design and optimization of VFC, presented a geometric parameters conversion formula for the plane configuration to the folded configuration, and compiled the formation process for VFC based on C + OpenGL + GLUT. By comparing numerical simulations and experiments, Cong [
22] investigated the mechanical response of VFC under pressure. It was found that changes in relative density not only affect the mechanical properties of the structure, but also directly lead to changes in the form of structural damage. The influence rule of each parameter of VFC on the overall structure was investigated by Ren [
23] using the control variable method, and the elastic modulus and shear modulus of VFC were deduced through the energy balance principle. The majority of publications that studied the mechanical properties of folded configurations have focused mainly on the load-bearing capacity and mechanical performance of the folded configuration [
24,
25,
26,
27,
28,
29,
30]. However, a complete analytical expression for the mechanical properties of VFC that can be verified using different loading forms has not been developed.
Unlike many other studies that have examined the variation of the mechanical properties of the folded core, this paper analyzes the geometric transformation of VFC before and after folding, and presents an analytical representation of the mechanical properties of VFC, which simplifies the structural optimization process and eliminates tedious and repetitive modeling of the structure. It is of great engineering significance in aircraft design.
2. Research Methodology
In this paper, the equivalent mechanical properties of VFC are analyzed with the help of the equivalent load–equivalent deformation principle.
The modulus of elasticity and shear modulus of VFC were obtained. These need to be verified with the help of simulations or experiments. Since the validation requires the design of many different structural forms for the working conditions, it is more efficient and reliable to verify numerically with the help of finite element software modeling and simulation.
Moreover, the small amount of errors between the numerical and analytical solutions confirmed the reliability of the analytical solution for deducing the mechanical properties of VFC. To further verify the analytical solution’s calculation of the mechanical properties, VFC was filled in the wing box segment for comparative analysis to ensure its reliability in engineering applications.
With the help of the analytical solution for the mechanical properties of VFC, researchers can choose different geometric forms according to the needs of different mechanical properties in the process of aircraft design optimization, simplifying the analysis steps and speeding up the process of aircraft design.
3. Analysis of Mechanical Properties of VFC
3.1. Geometric Properties of VFC
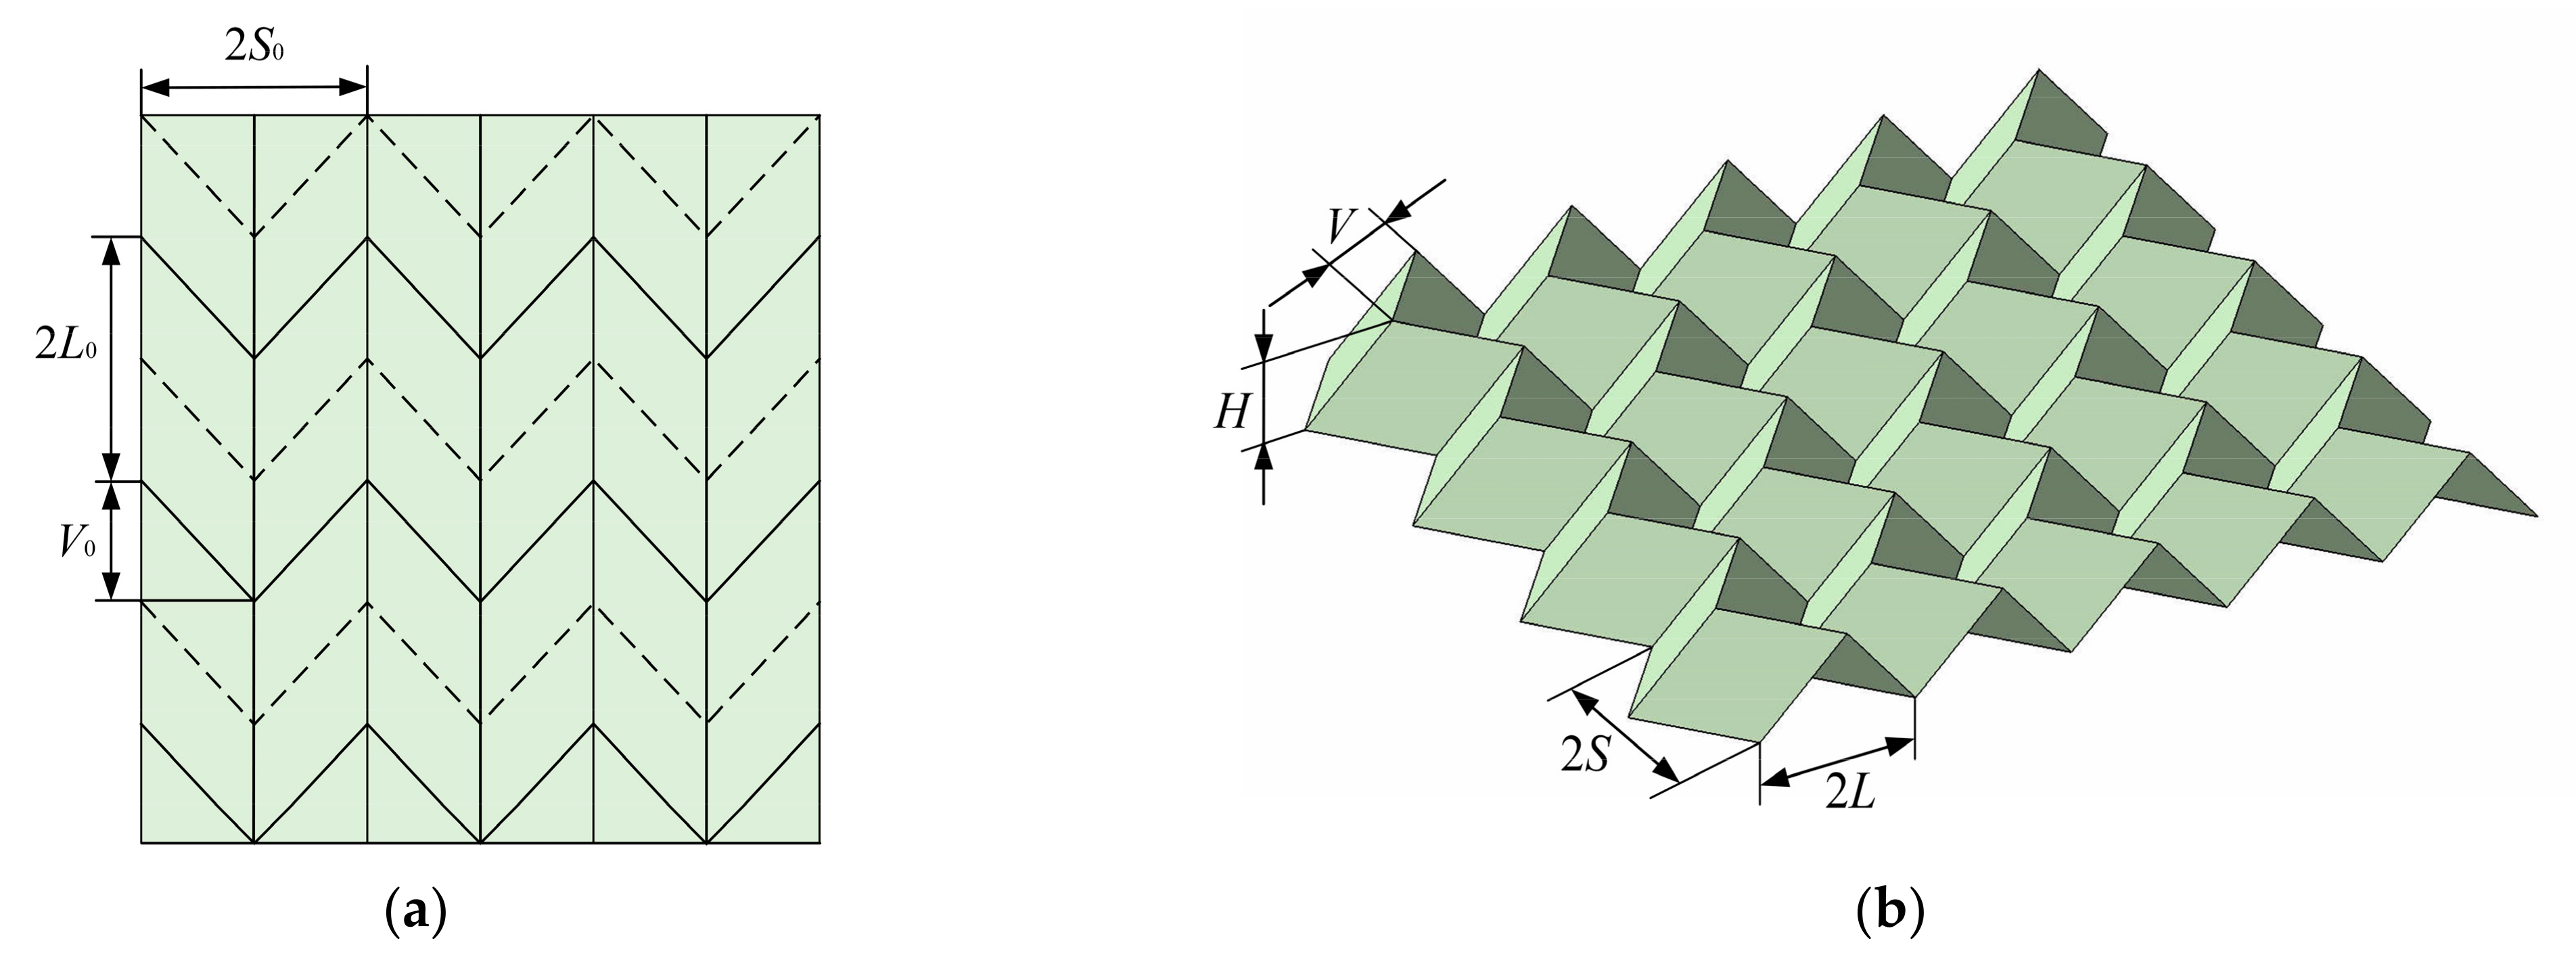
The folded core is folded according to the regular lines, folded out along the solid line, and folded in along the dotted line (
Figure 1a). In the line drawing template, the length of the serrated line step is “2
L0”, the length of the zigzag line step is “2
S0”, and the fold width of the zigzag line is “
V0”. For the 3D VFC, the height is “
H”, the length of the serrated line step is “2
L”, the length of the zigzag line step is “2
S”, and the fold width of the zigzag line is “
V” (
Figure 1b).
The relationships between the geometric parameters before and after VFC folds are as follows:
According to
Figure A1, Equation (3) can be derived from Equations (A1), (A3) and (1). Equation (2) can be derived from Equations (A4), (A5) and (3).
3.2. Equivalent Density ρ
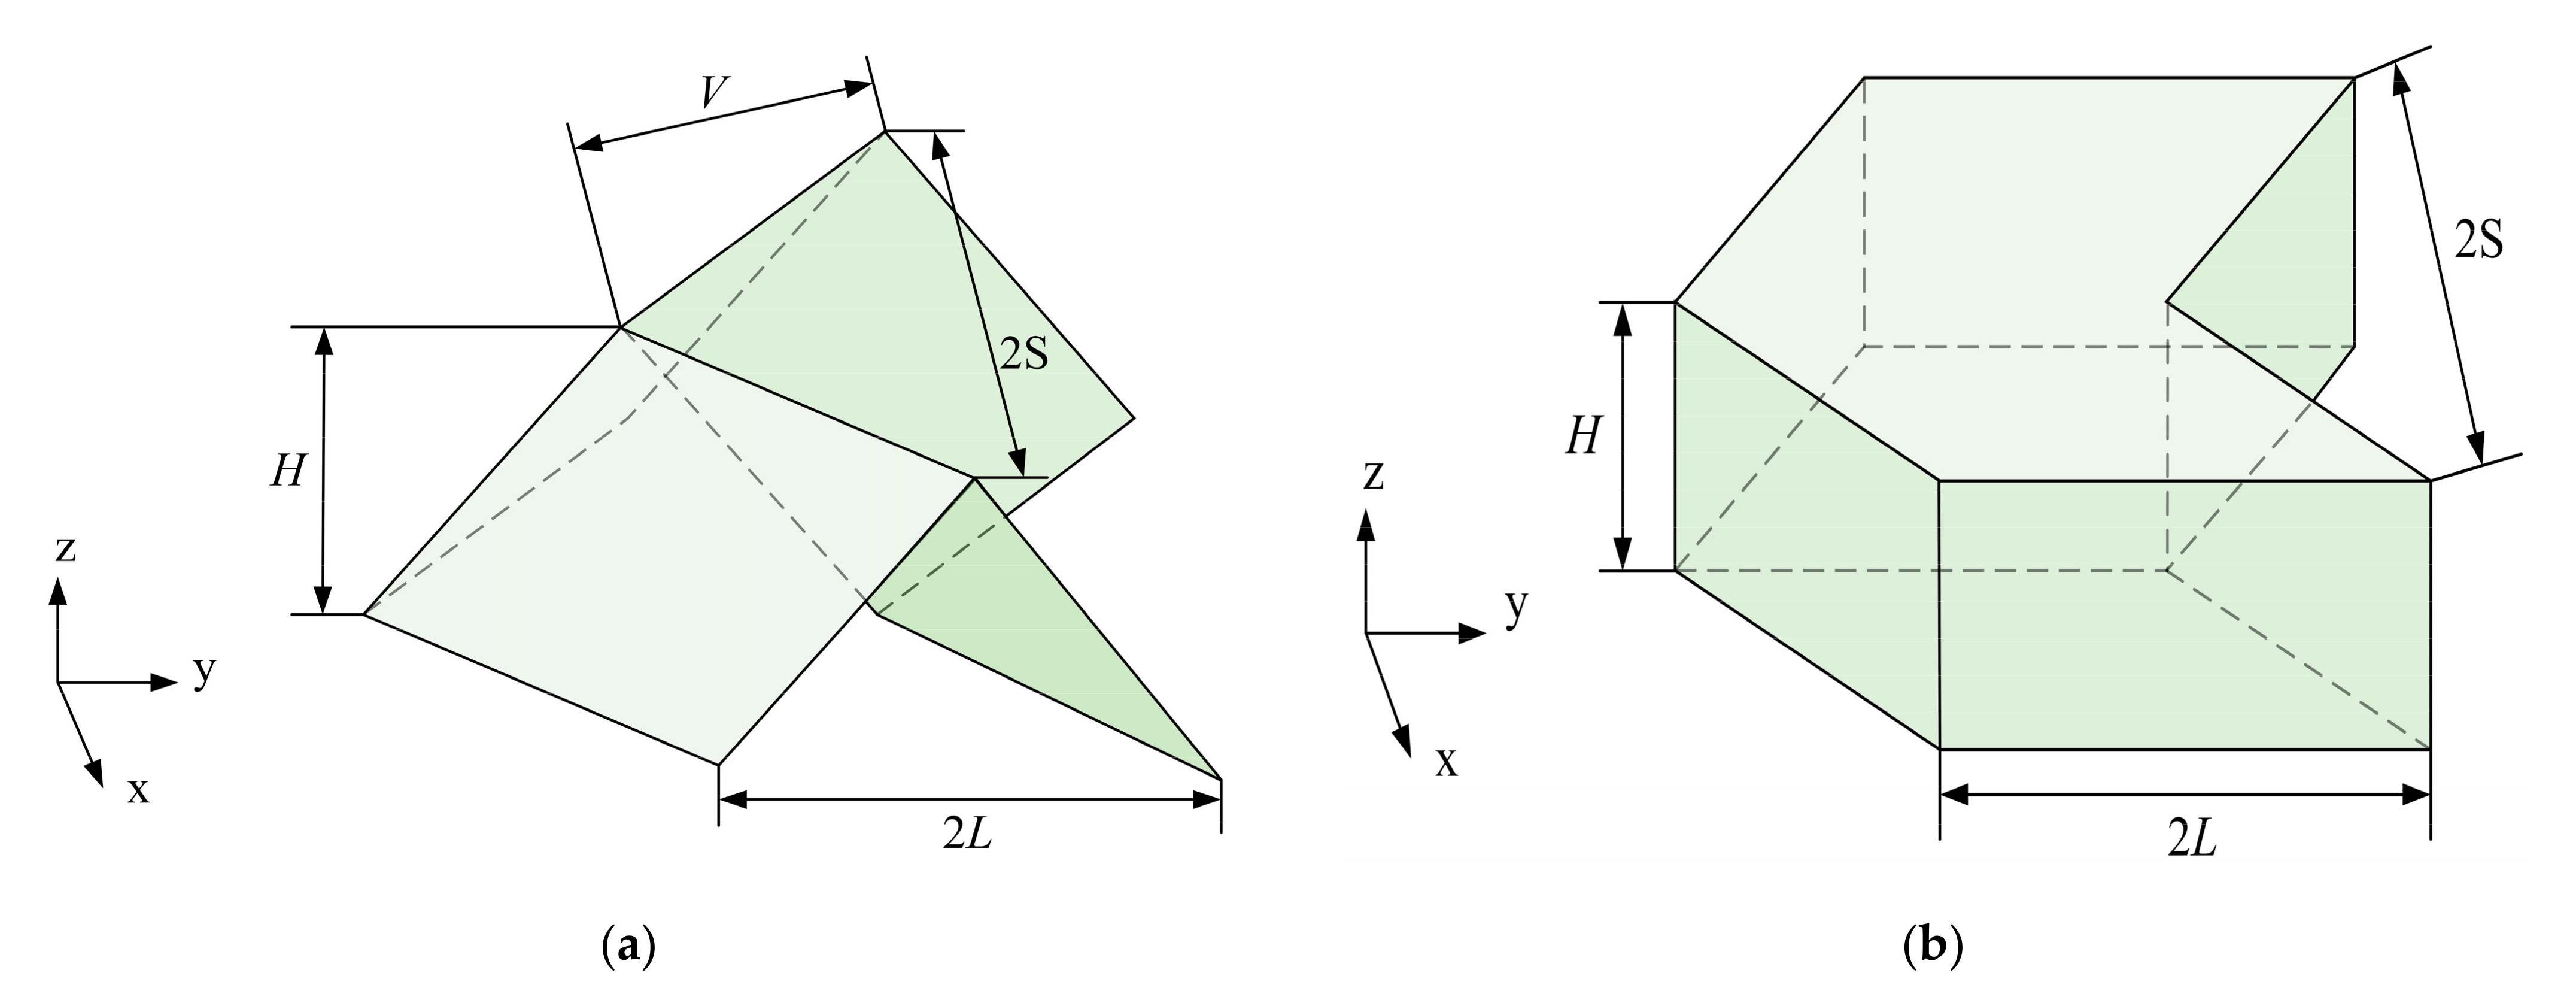
The folded core is composed of many EMs (
Figure 2a), all of which have the same geometric properties and mechanical properties. Each EM is enveloped by an equivalent solid element (ESE) (
Figure 2b). Mesoscopically, the EM configuration is heterogeneous, but macroscopically, the folded configuration contains many identical EMs that have the same geometrical and mechanical properties and can therefore be described as homogeneous.
The mechanical properties of the overall folded core can be represented by the mechanical properties of an individual EM because all EMs have the same configuration and mechanical properties. Therefore, EM will be taken as the research object.
Each EM consists of four panels, and the adjacent edges of every two adjacent panels overlap. The equivalent mechanical properties of VFC can be determined more conveniently with the help of an equivalent solid element, which is very meaningful for many engineering applications.
Defining that, the elastic modulus of the foil material forming the core is
EF, the shear modulus is
GF, the thickness is
tF, and the density is
ρF. The masses of the four plates of each EM are uniformly distributed over the ESE, so the equivalent density
ρ of the EM can be determined.
3.3. Equivalent Elastic Modulus in Direction z Ez
The elastic modulus is an important indicator of structural performance.
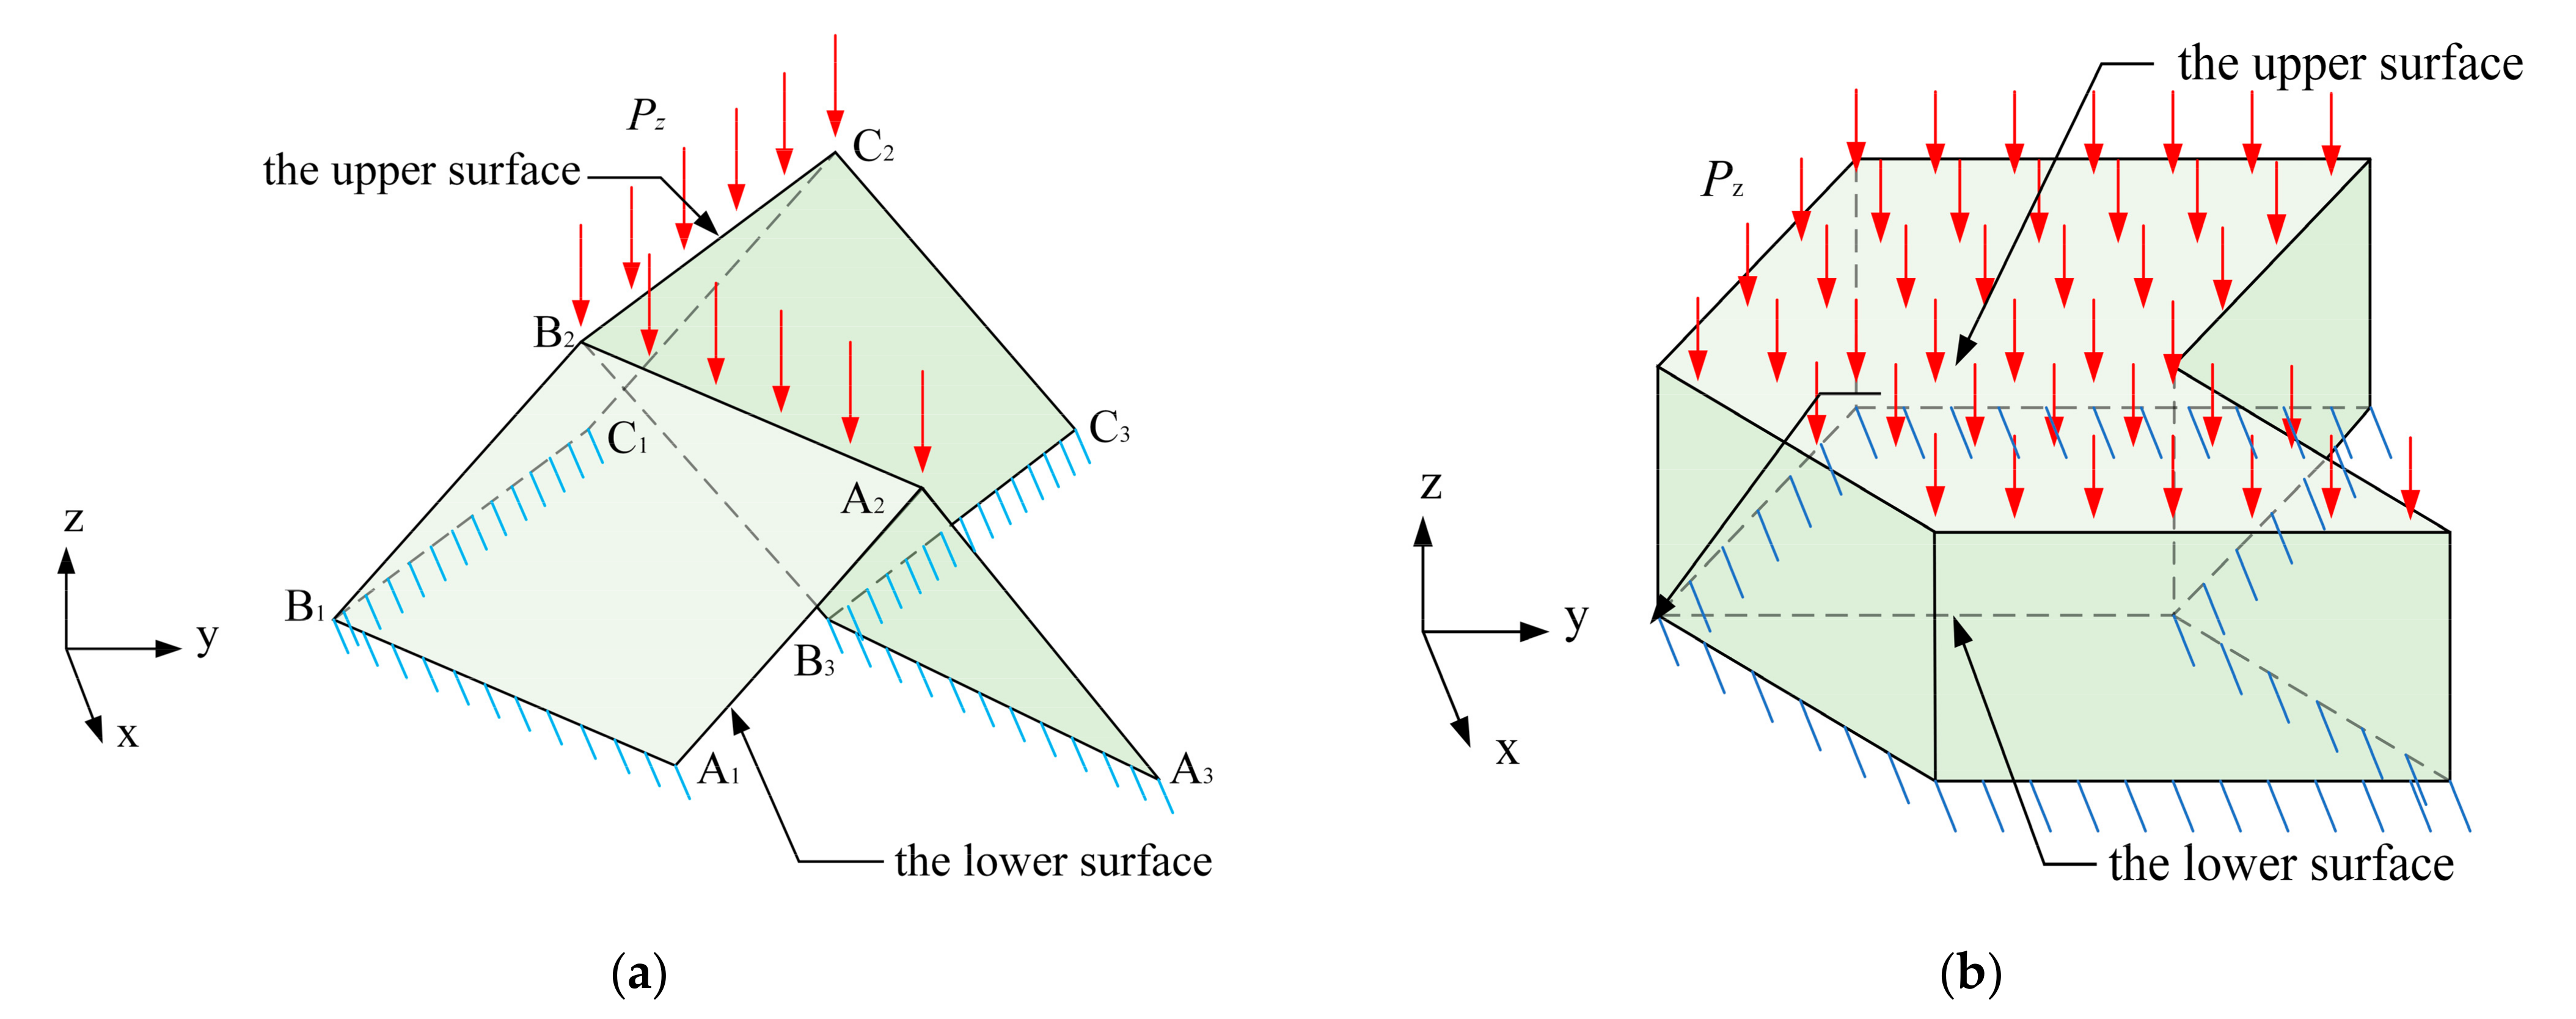
Ez reflects the ability of the configuration to resist elastic deformation in Direction z. In order to obtain the equivalent elastic modulus, EM and ESE are respectively loaded by forces
Pz with the same magnitude and direction (
Figure 3a,b). The displacements of the two models can be calculated by using the basic mechanics’ load-displacement method. From the equivalent displacement, the equivalent elastic modulus can be determined.
For EM,
Pz is uniformly distributed along the upper edge (
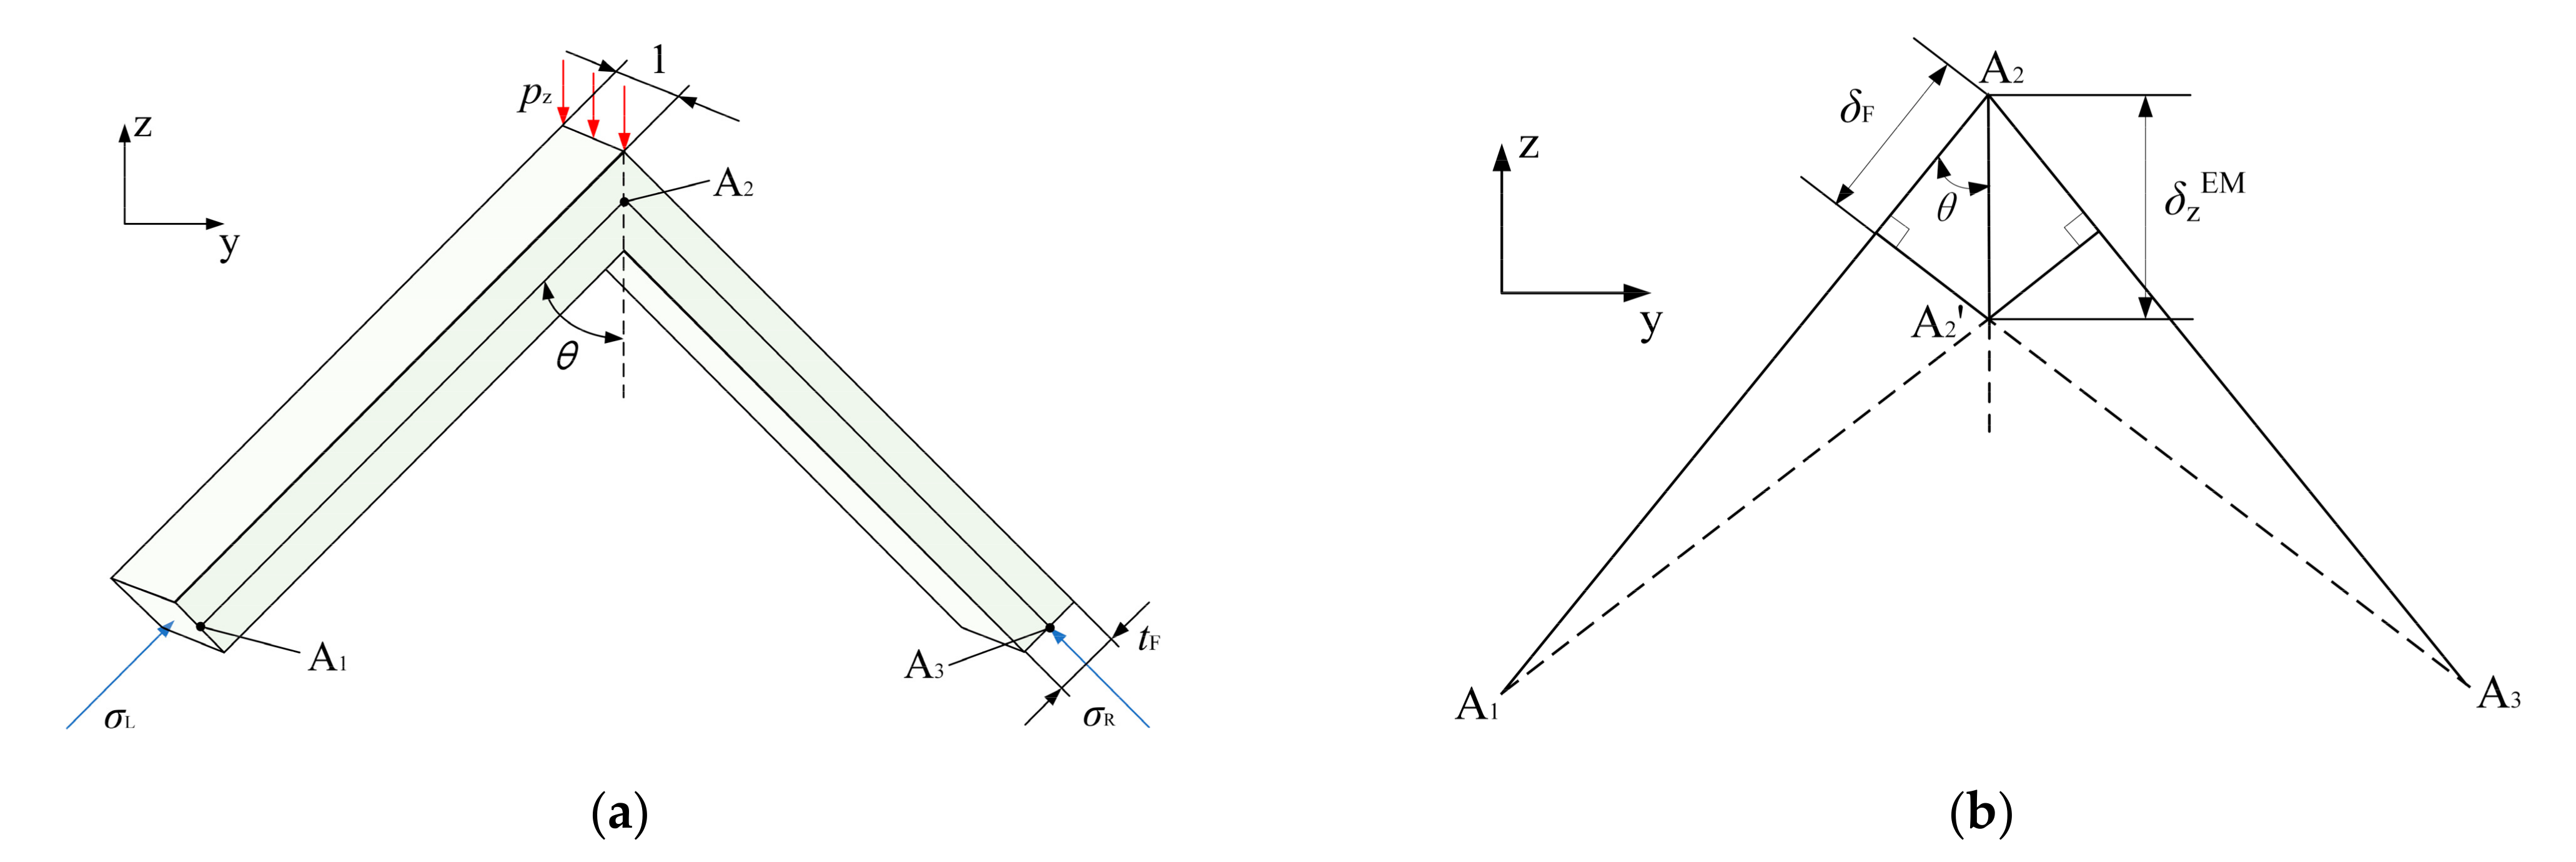
Figure 3a). Take a unit length of EM for analysis (
Figure 4a), the load per unit length on the upper edge of EM is
pz.
pz is balanced with the compressive stress
σL on the left panel and
σR on the right. Then, symmetry dictates that
σL and
σR are equal, and
The compression deformation of the left and right panels is represented by
δF (
Figure 4b)
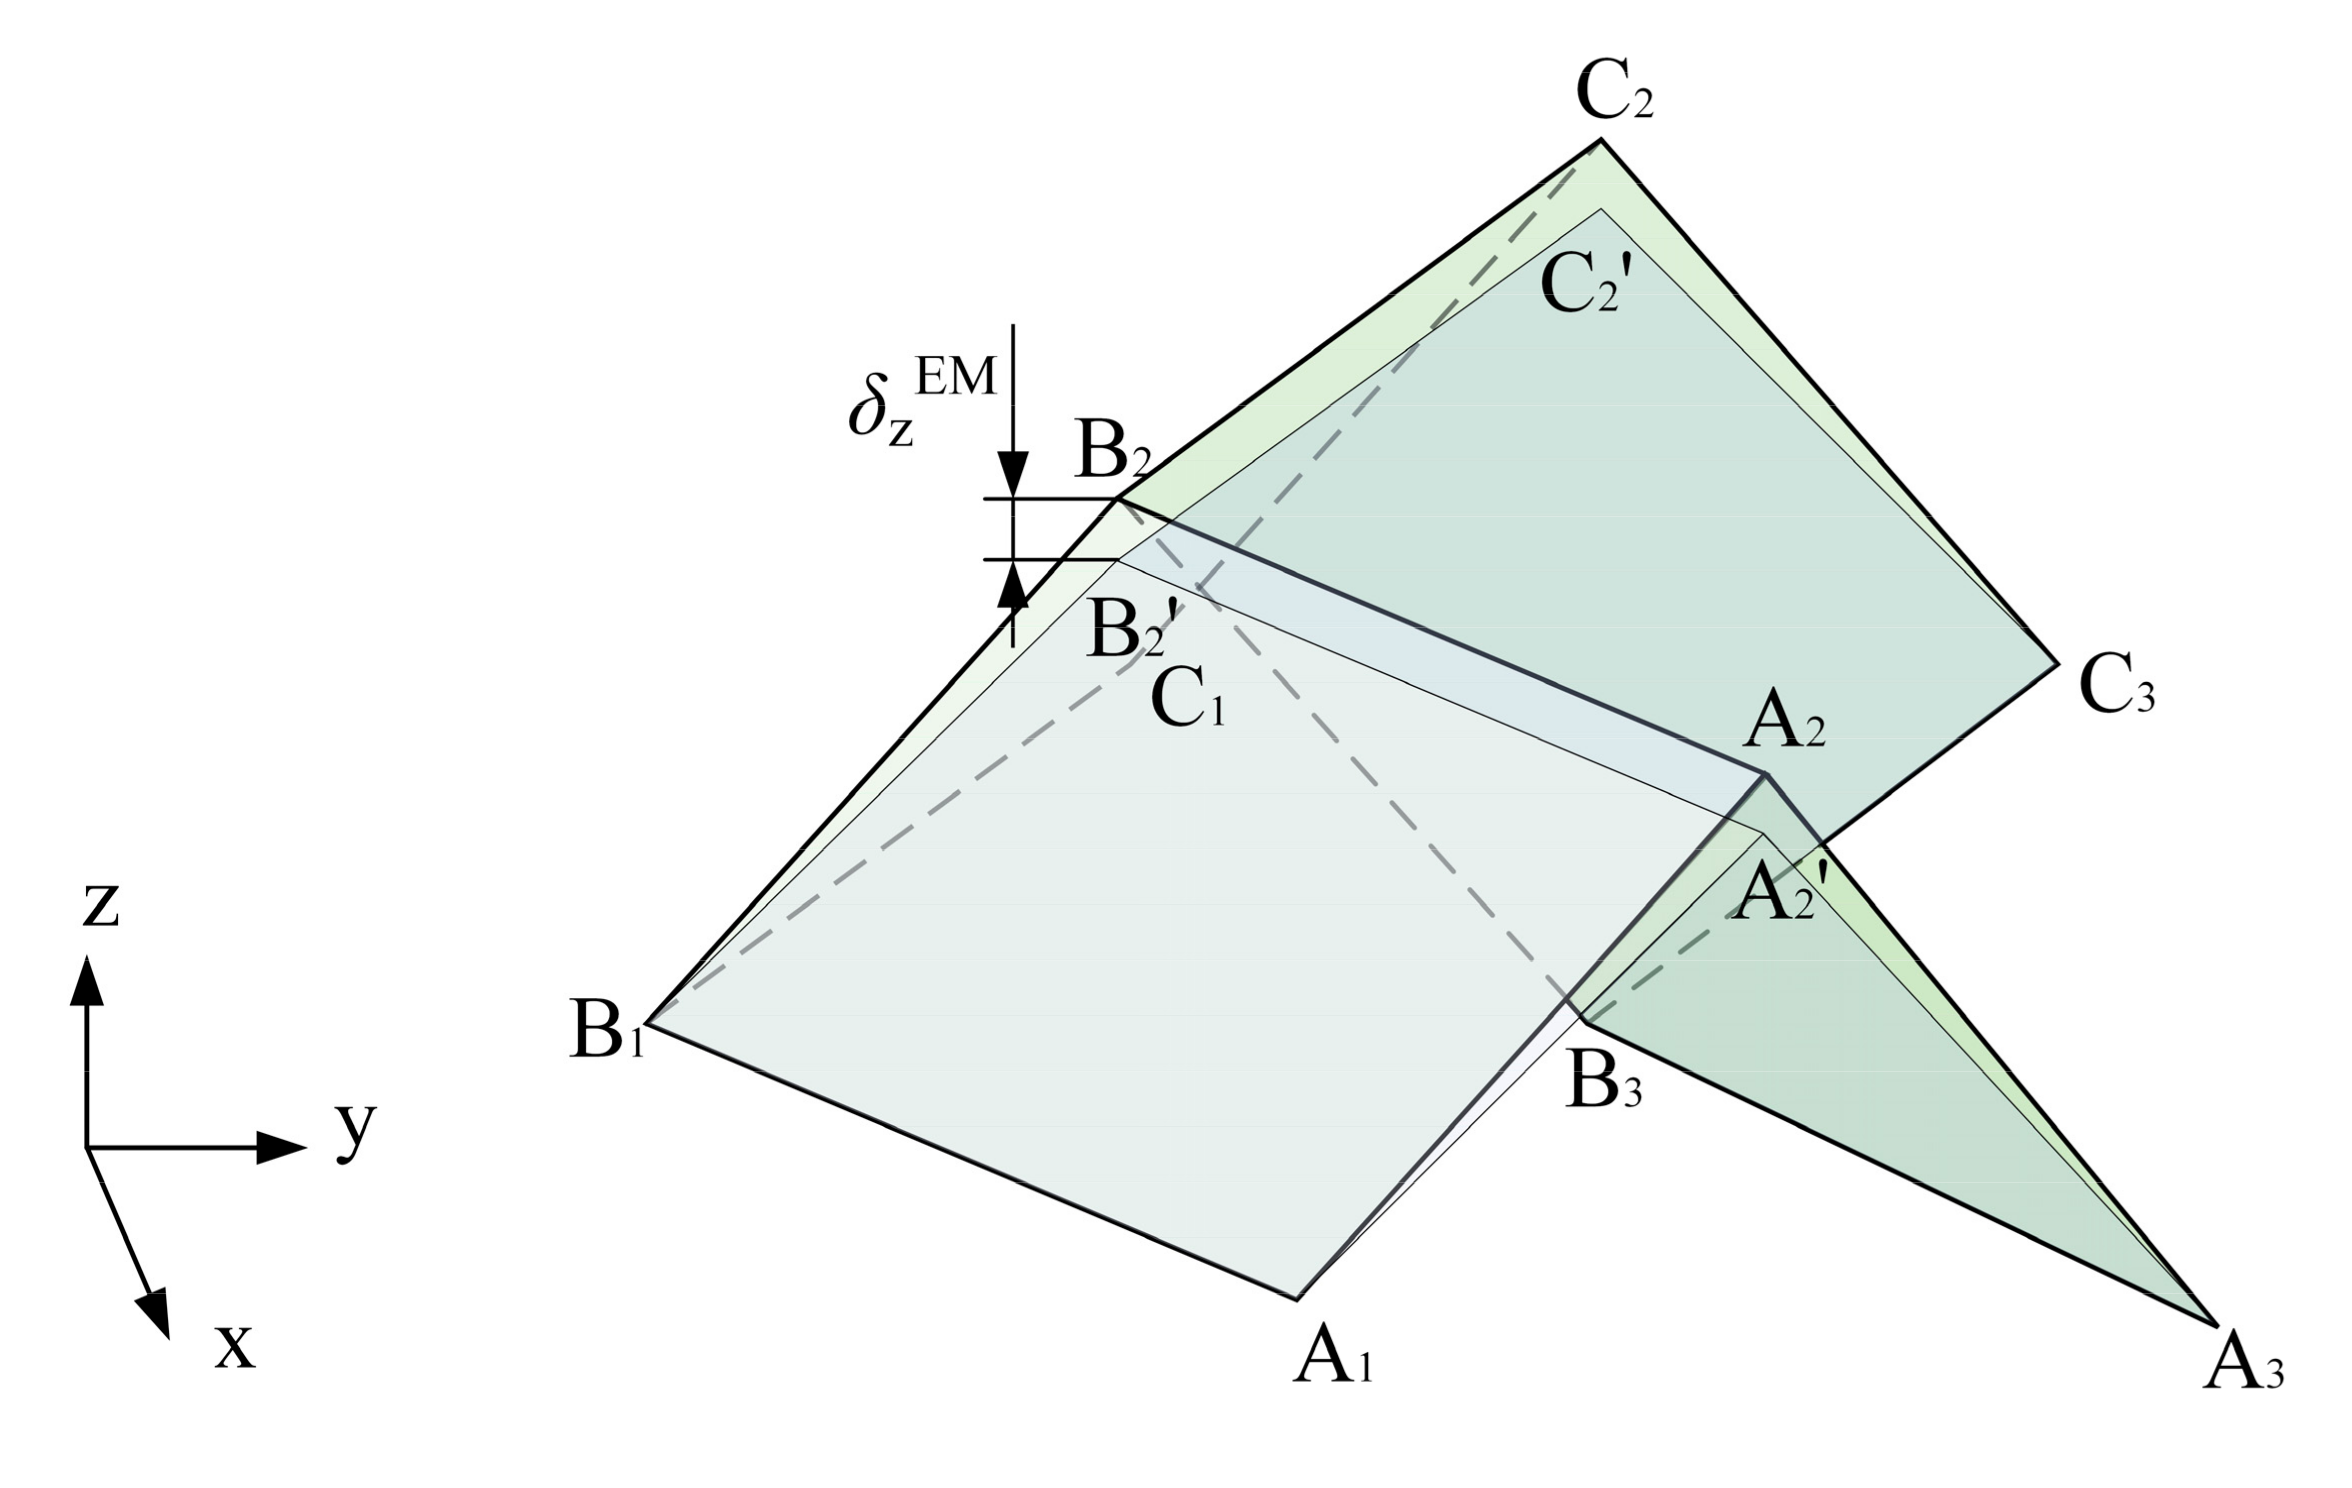
Considering the deformation coordination relationship of EM (
Figure 4b), the displacement of the upper edge of EM in Direction z can be obtained (
Figure 5):
For ESE, the
Pz is applied to the upper surface of the model (
Figure 3b).
According to the basic stress–strain relationship, σzESE and δzESE can be obtained under the action of Pz.
The equivalent stress of ESE in Direction z is:
The displacement of the upper surface of ESE in Direction z is:
As EM and ESE are equivalent, the displacement of the upper edge of EM and the displacement of the upper surface of ESE are equal, so it follows that
δzEM =
δzESE, and the equivalent
Ez can be represented by the geometrical parameters of EM.
3.4. Equivalent Shear Modulus in Plane xz Gxz
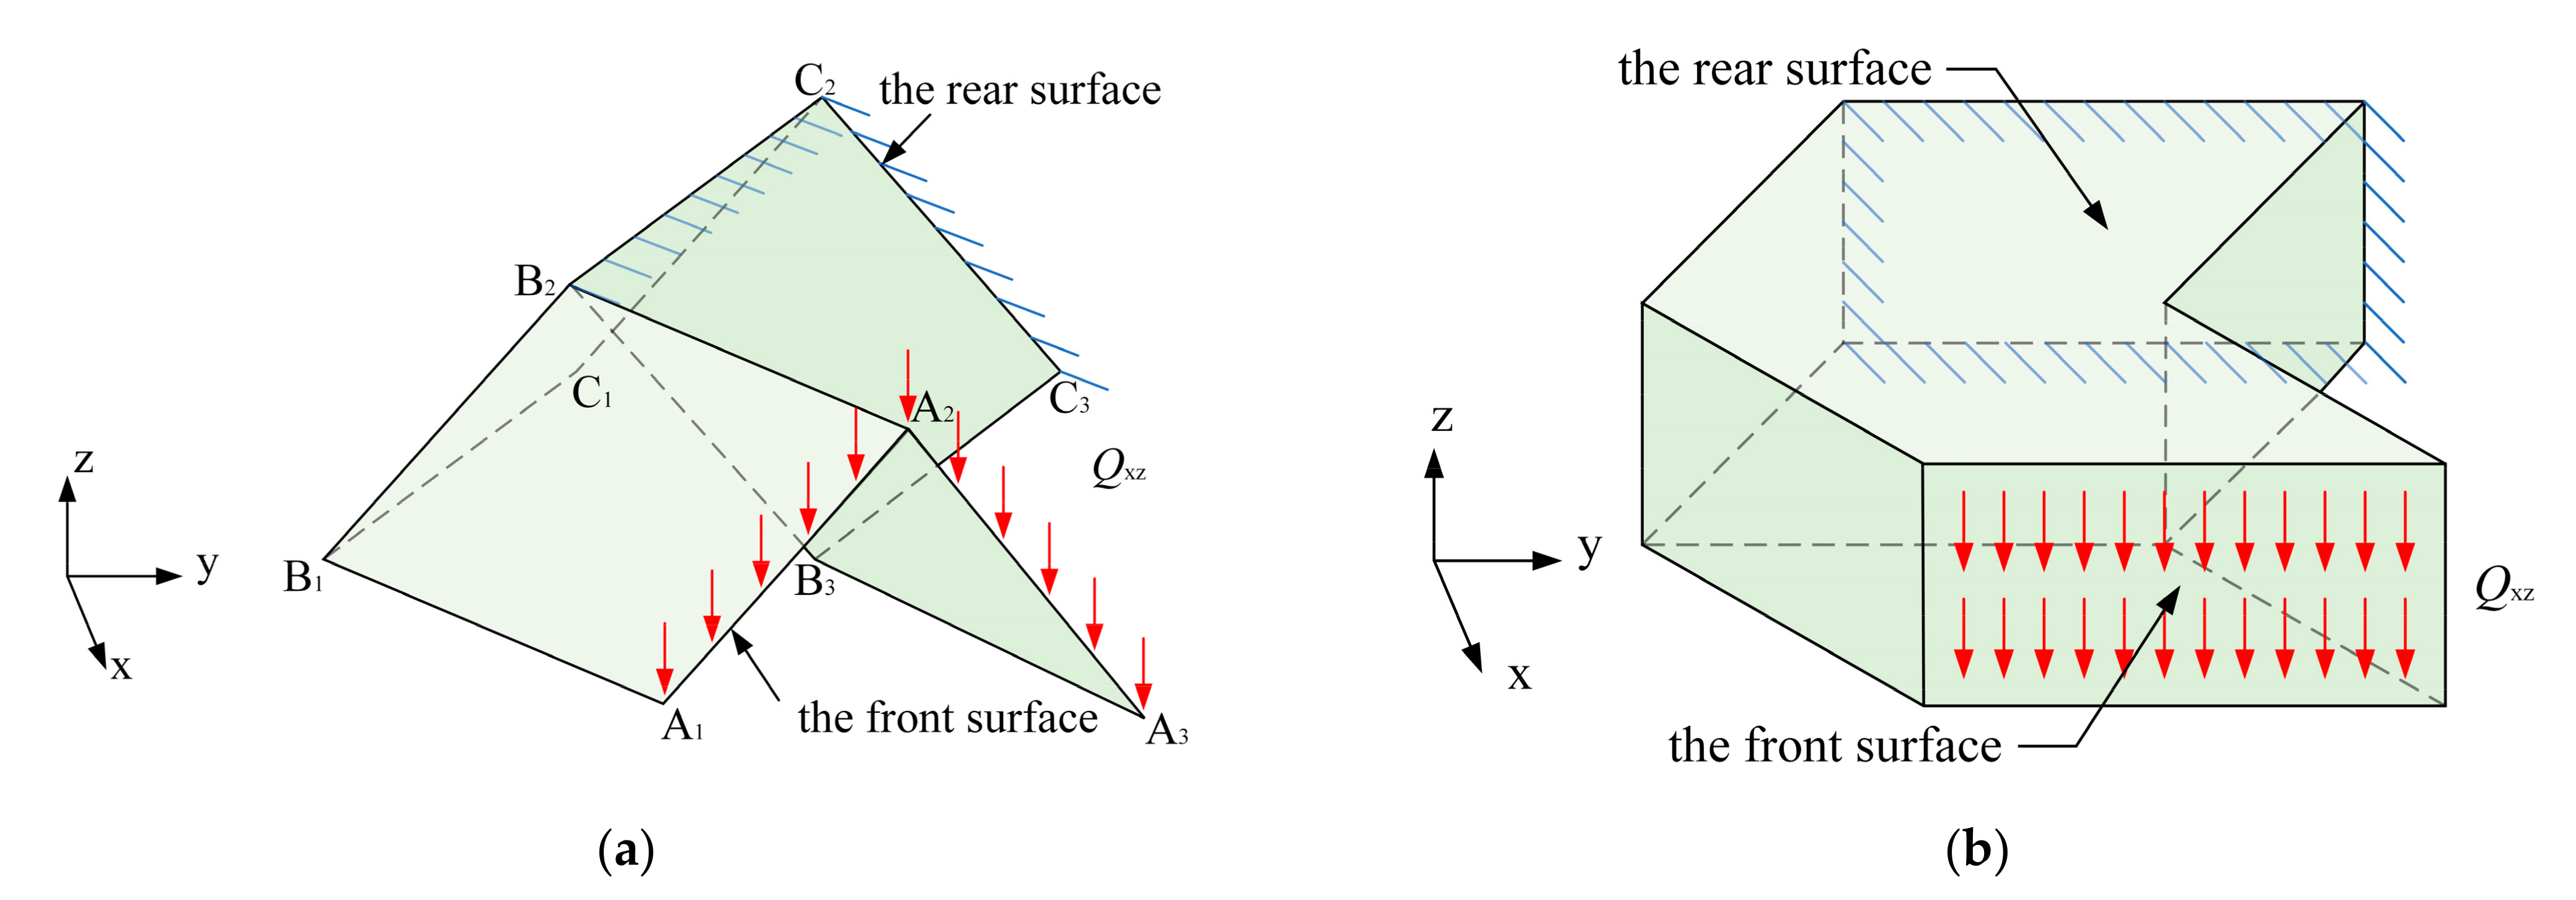
Gxz represents the ability to resist shear deformation in Plane xz. As is the case with
Ez, the front surface of EM and ESE are each subjected to a shear force
Qxz (
Figure 6a,b), the rear surface is fixed, and the relative shearing angle
γxz of the front and rear surfaces is calculated to obtain
Gxz.
For EM, when it is loaded by shear forces
Qxz in Plane xz, then the front edge of EM will be the loaded area (
Figure 6a).
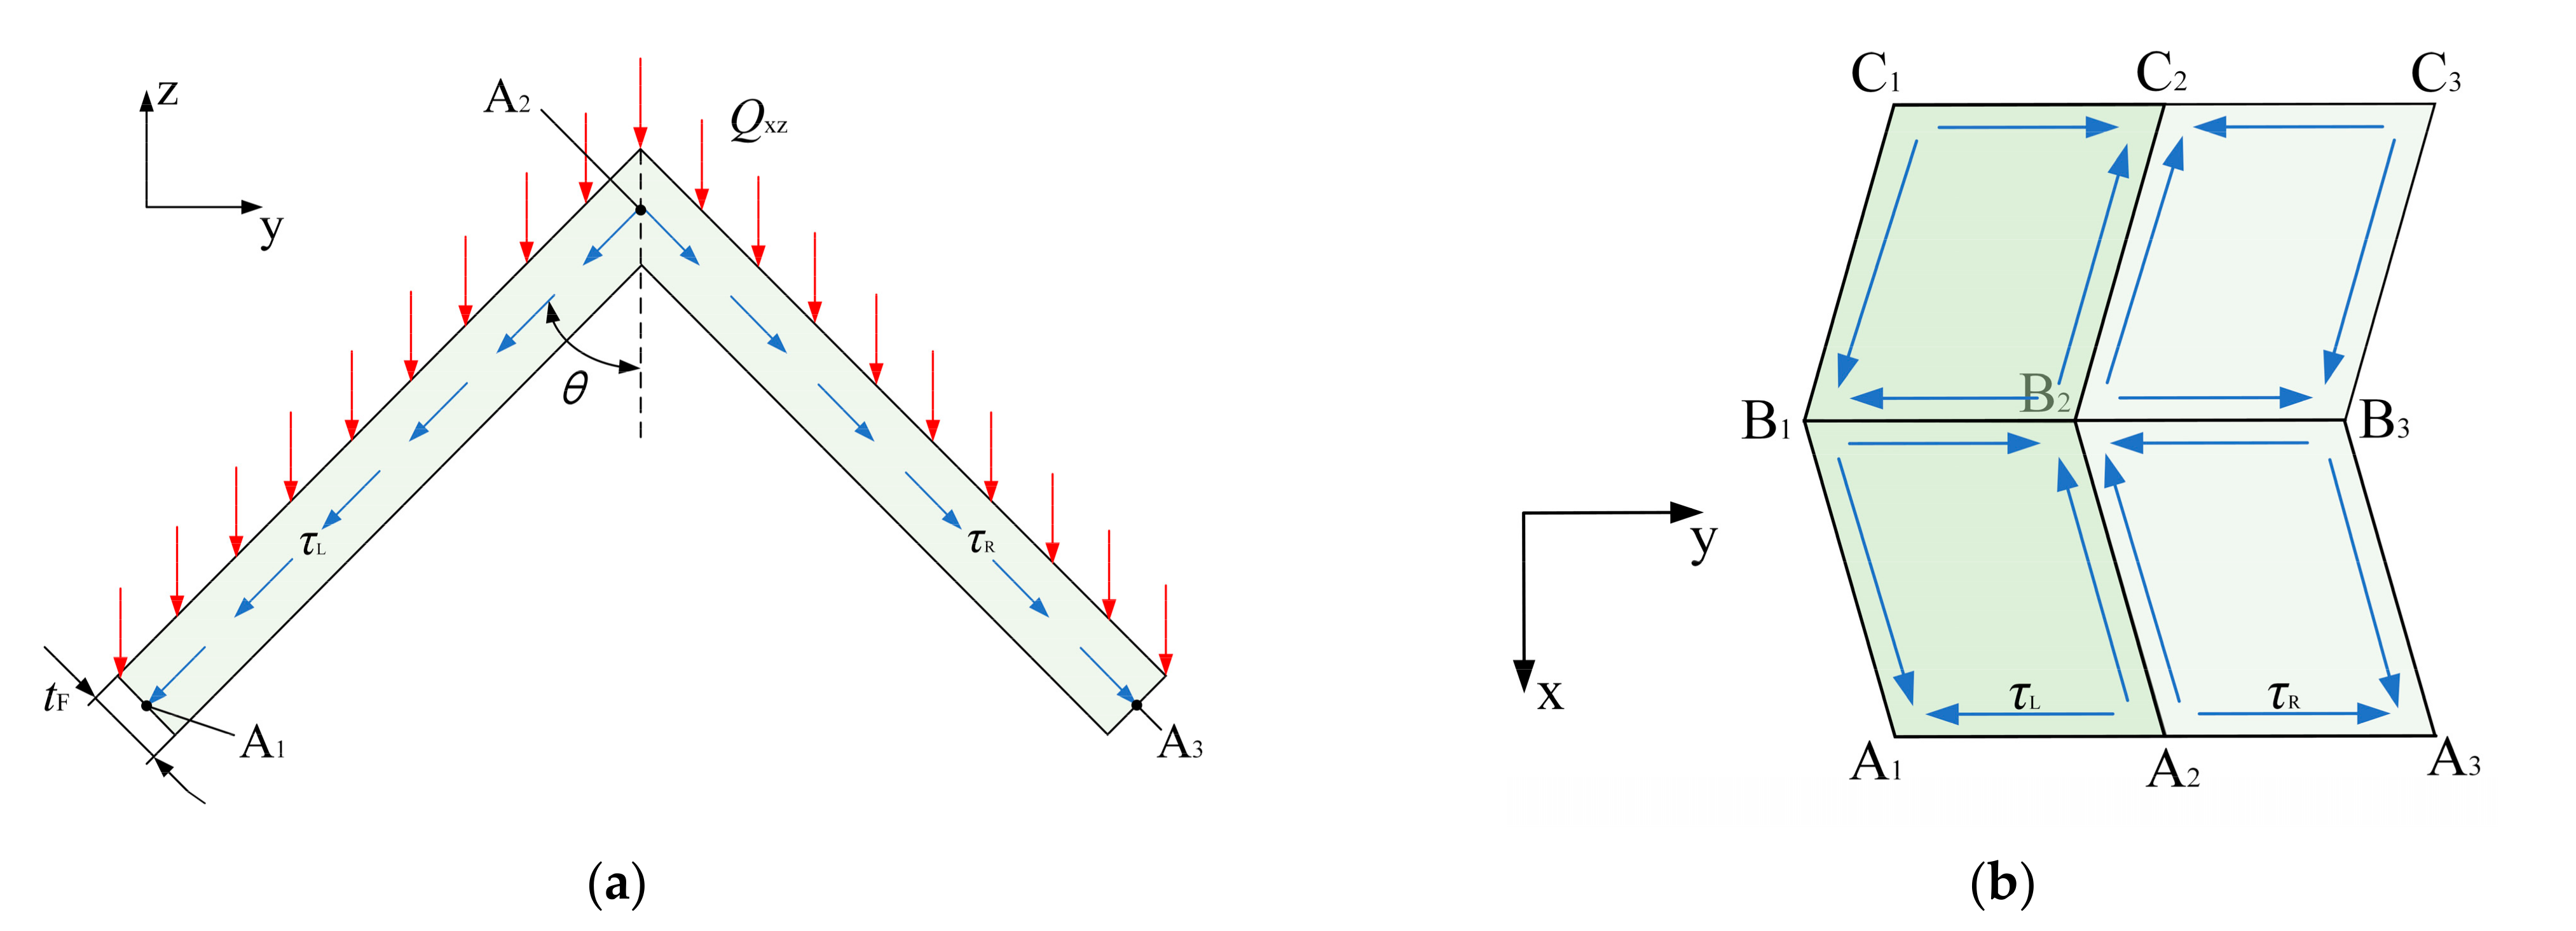
Under the
Qxz, the left and right panels are subjected to the shear stress with the same magnitude due to geometric symmetry (
Figure 7a),
τL =
τR.
In the top view of EM, the shear stress is transmitted in the panel as shown in
Figure 7b. The displacement of Point A
2 with respect to Point B
2 in Panel A
1A
2B
2B
1 is
δABP.
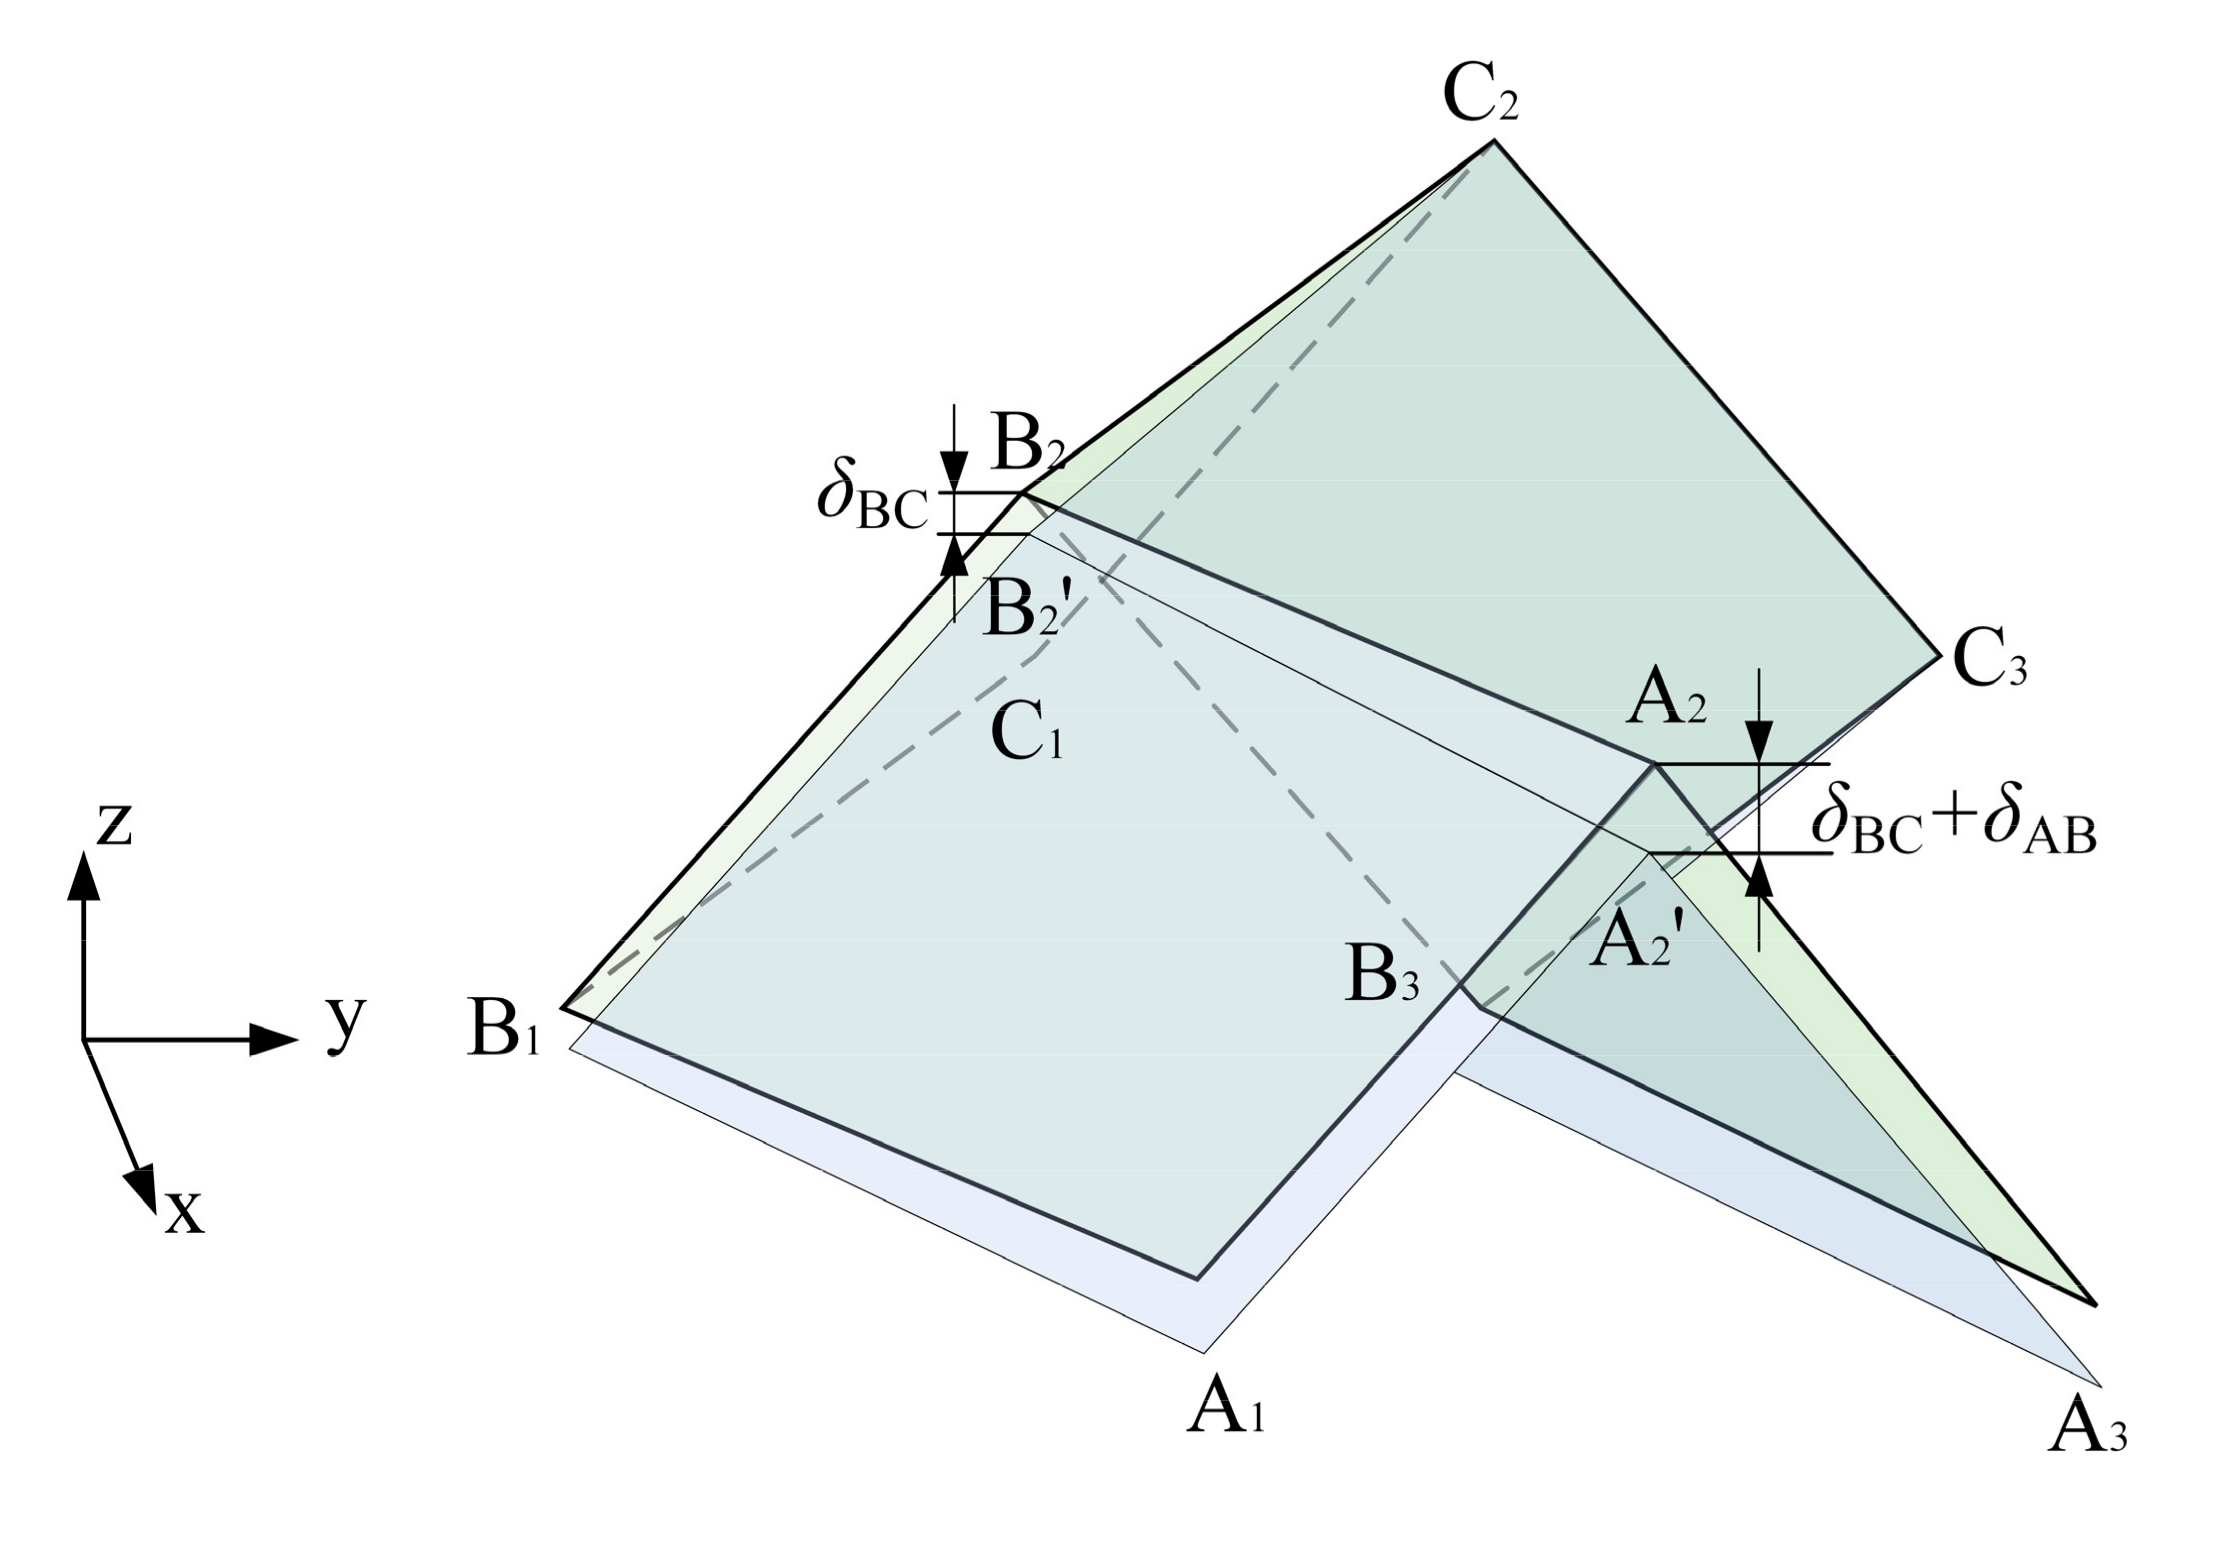
According to the deformation coordination relationship of the EM front edge, the displacement of Point A
2 with respect to Point B
2 in Direction z
δAB can be obtained (
Figure 8), and the displacement of Point B
2 with respect to Point C
2 in Direction z is
δBC. Since the distance between C
2 and B
2 is equal to the distance between B
2 and A
2,
δAB =
δBC.
Then, the shearing angle of Point A
2 on EM under the
Qxz can be obtained, namely
γxzEM.
For ESE, the
Qxz is applied to the front surface of the model (
Figure 6b).
The equivalent shear stress
τxzESE is:
And the shearing angle in Plane xz is
Since EM and ESE are equivalent, the shearing angles of the two different methods are equal, that is
γxzEM =
γxzESE, and the equivalent
Gxz can be represented by the geometrical parameters of EM.
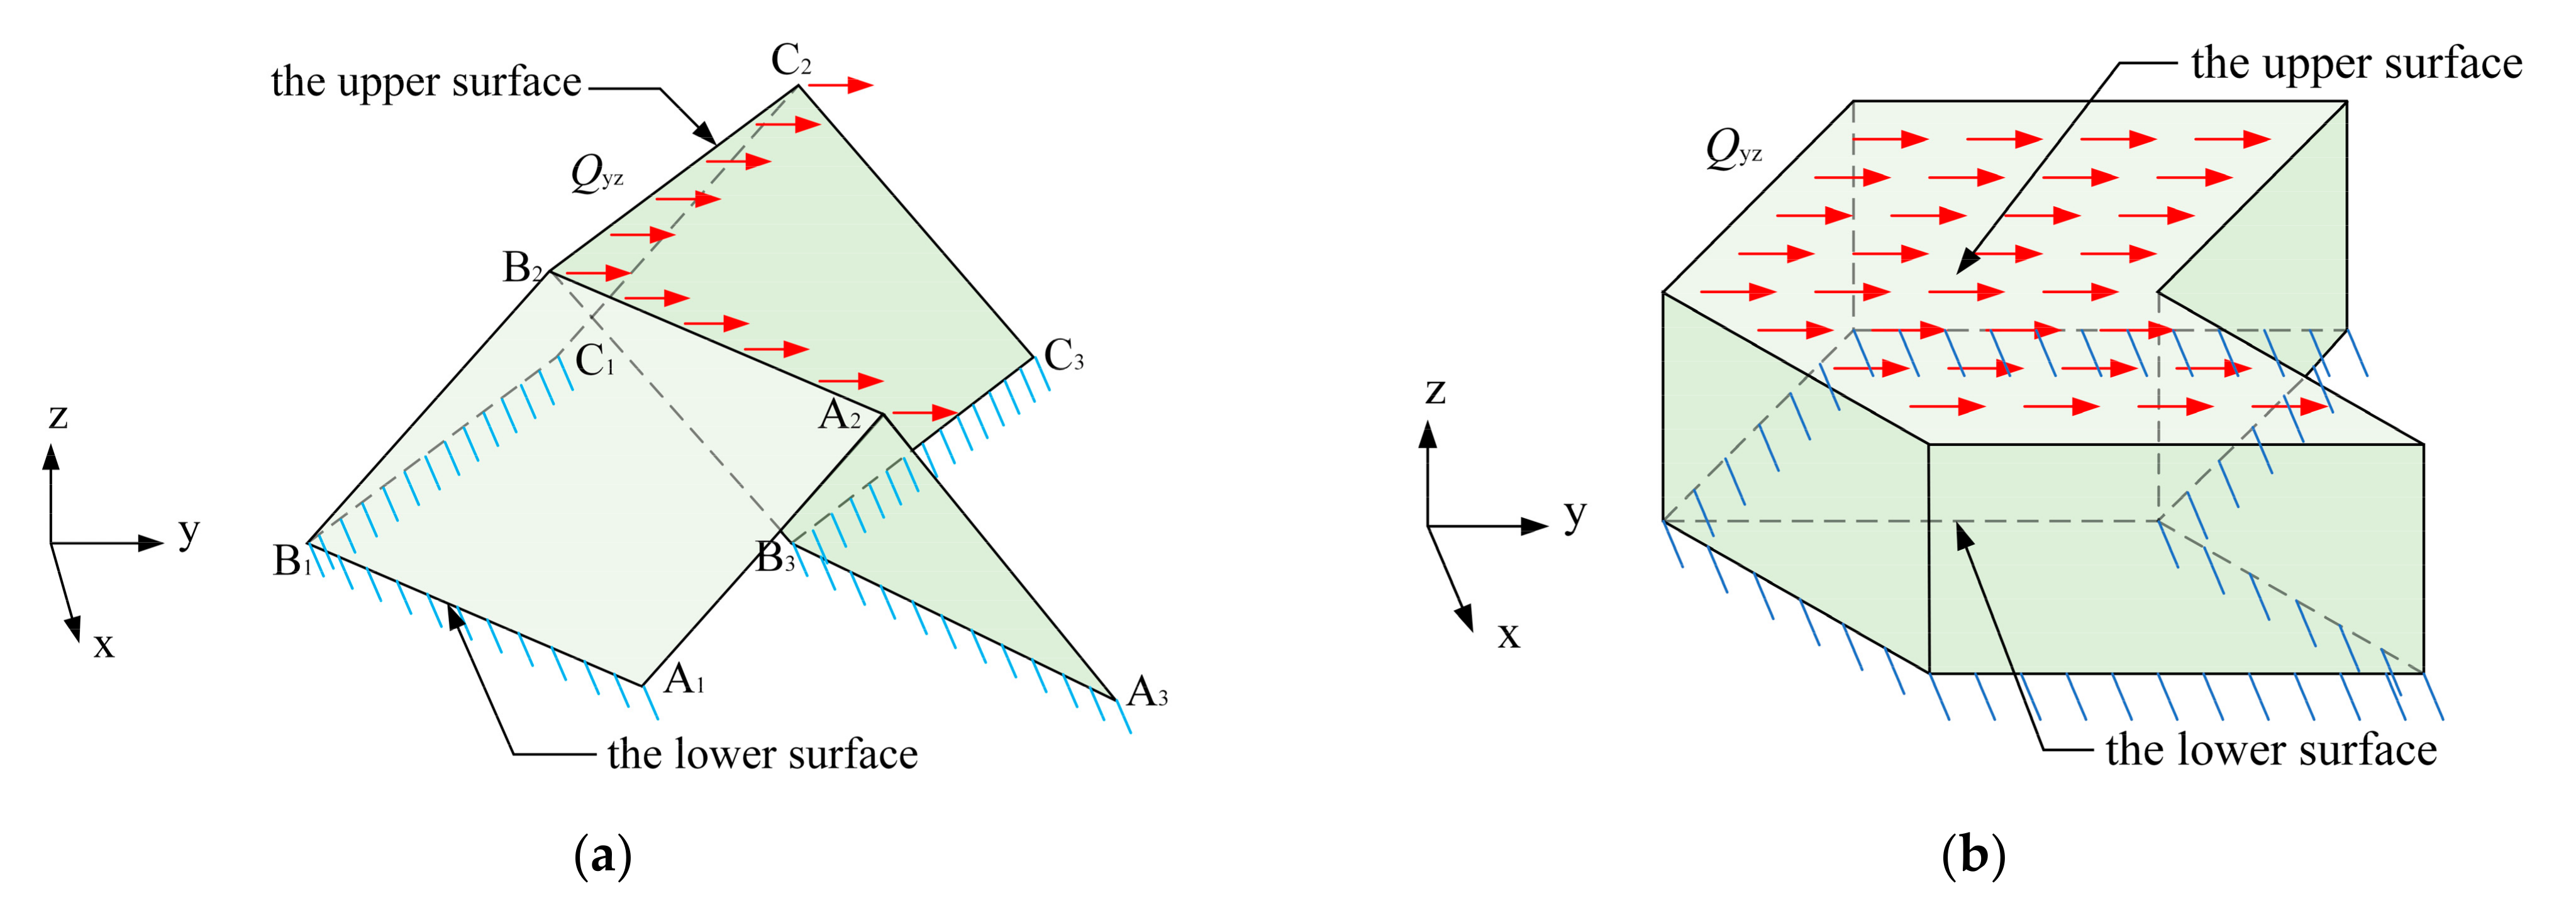
3.5. Equivalent Shear Modulus in Plane yz Gyz
Gyz represents the ability to resist shear deformation in Plane yz. As is the case with
Ez and
Gxz, the upper surface of EM and ESE are each subjected to a shear force
Qyz (
Figure 9a,b), the lower surface is fixed, and the relative shearing angle
γyz of the upper and lower surfaces is calculated to obtain
Gyz.
For EM,
Qyz is uniformly distributed along the upper edge (
Figure 9a). The load per unit length on the upper edge of EM is
qyz.
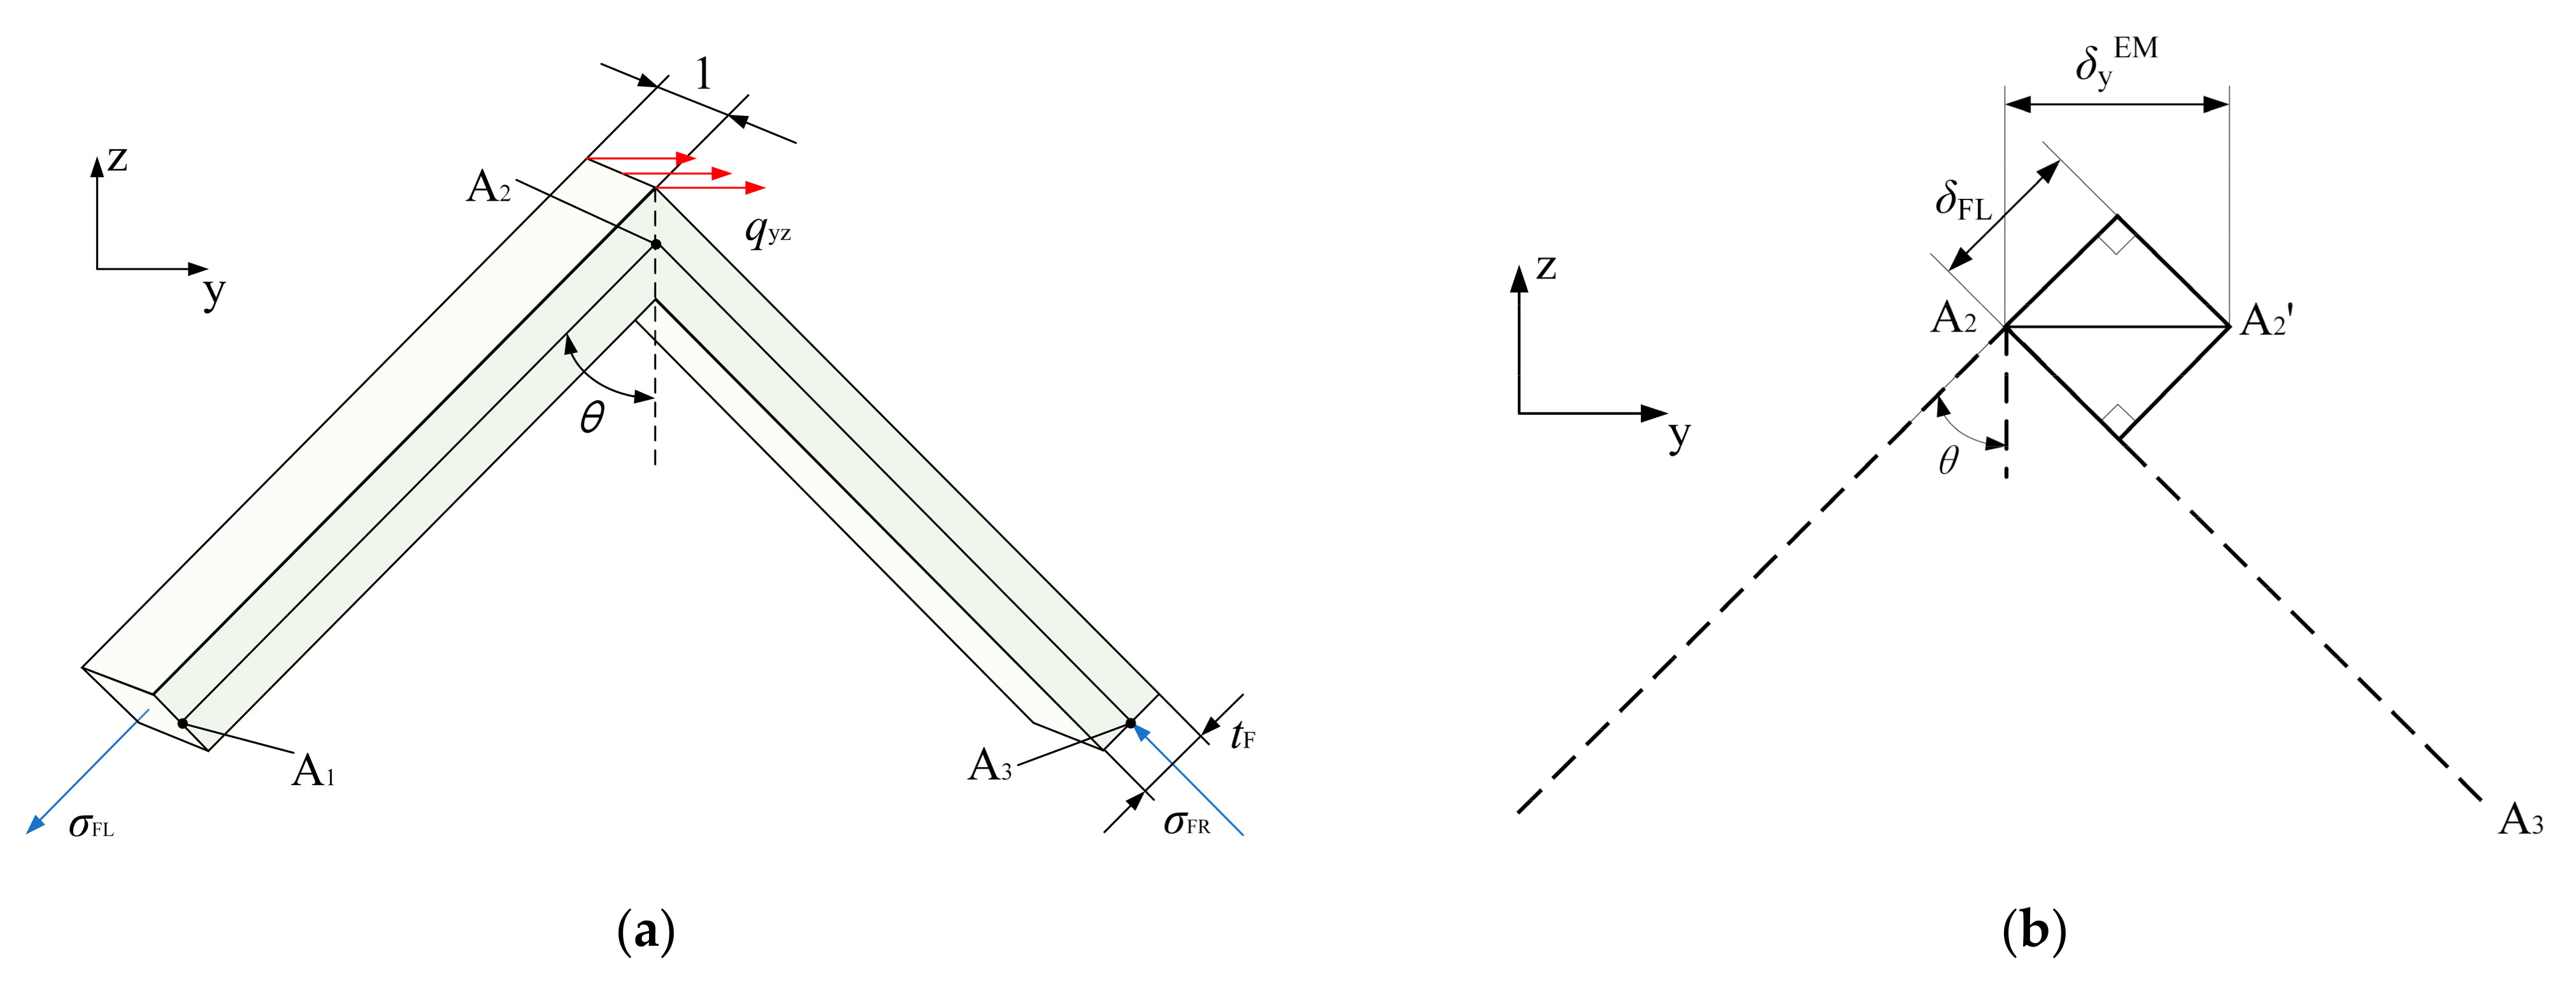
Take a unit length of EM for analysis (
Figure 10a),
qyz is balanced with the tensile stress
σFL on the left panel and compressive stress
σFR on the right. Then, due to the symmetry of the geometry,
σFL =
σFR, then
The deformation of the left panel
δFL and the deformation of the right panel
δFR can be obtained (
Figure 10b)
Considering the coordination of the deformation of the left and right panels (
Figure 10b), the displacement of the upper edge of EM in Direction y (
Figure 11) can be obtained:
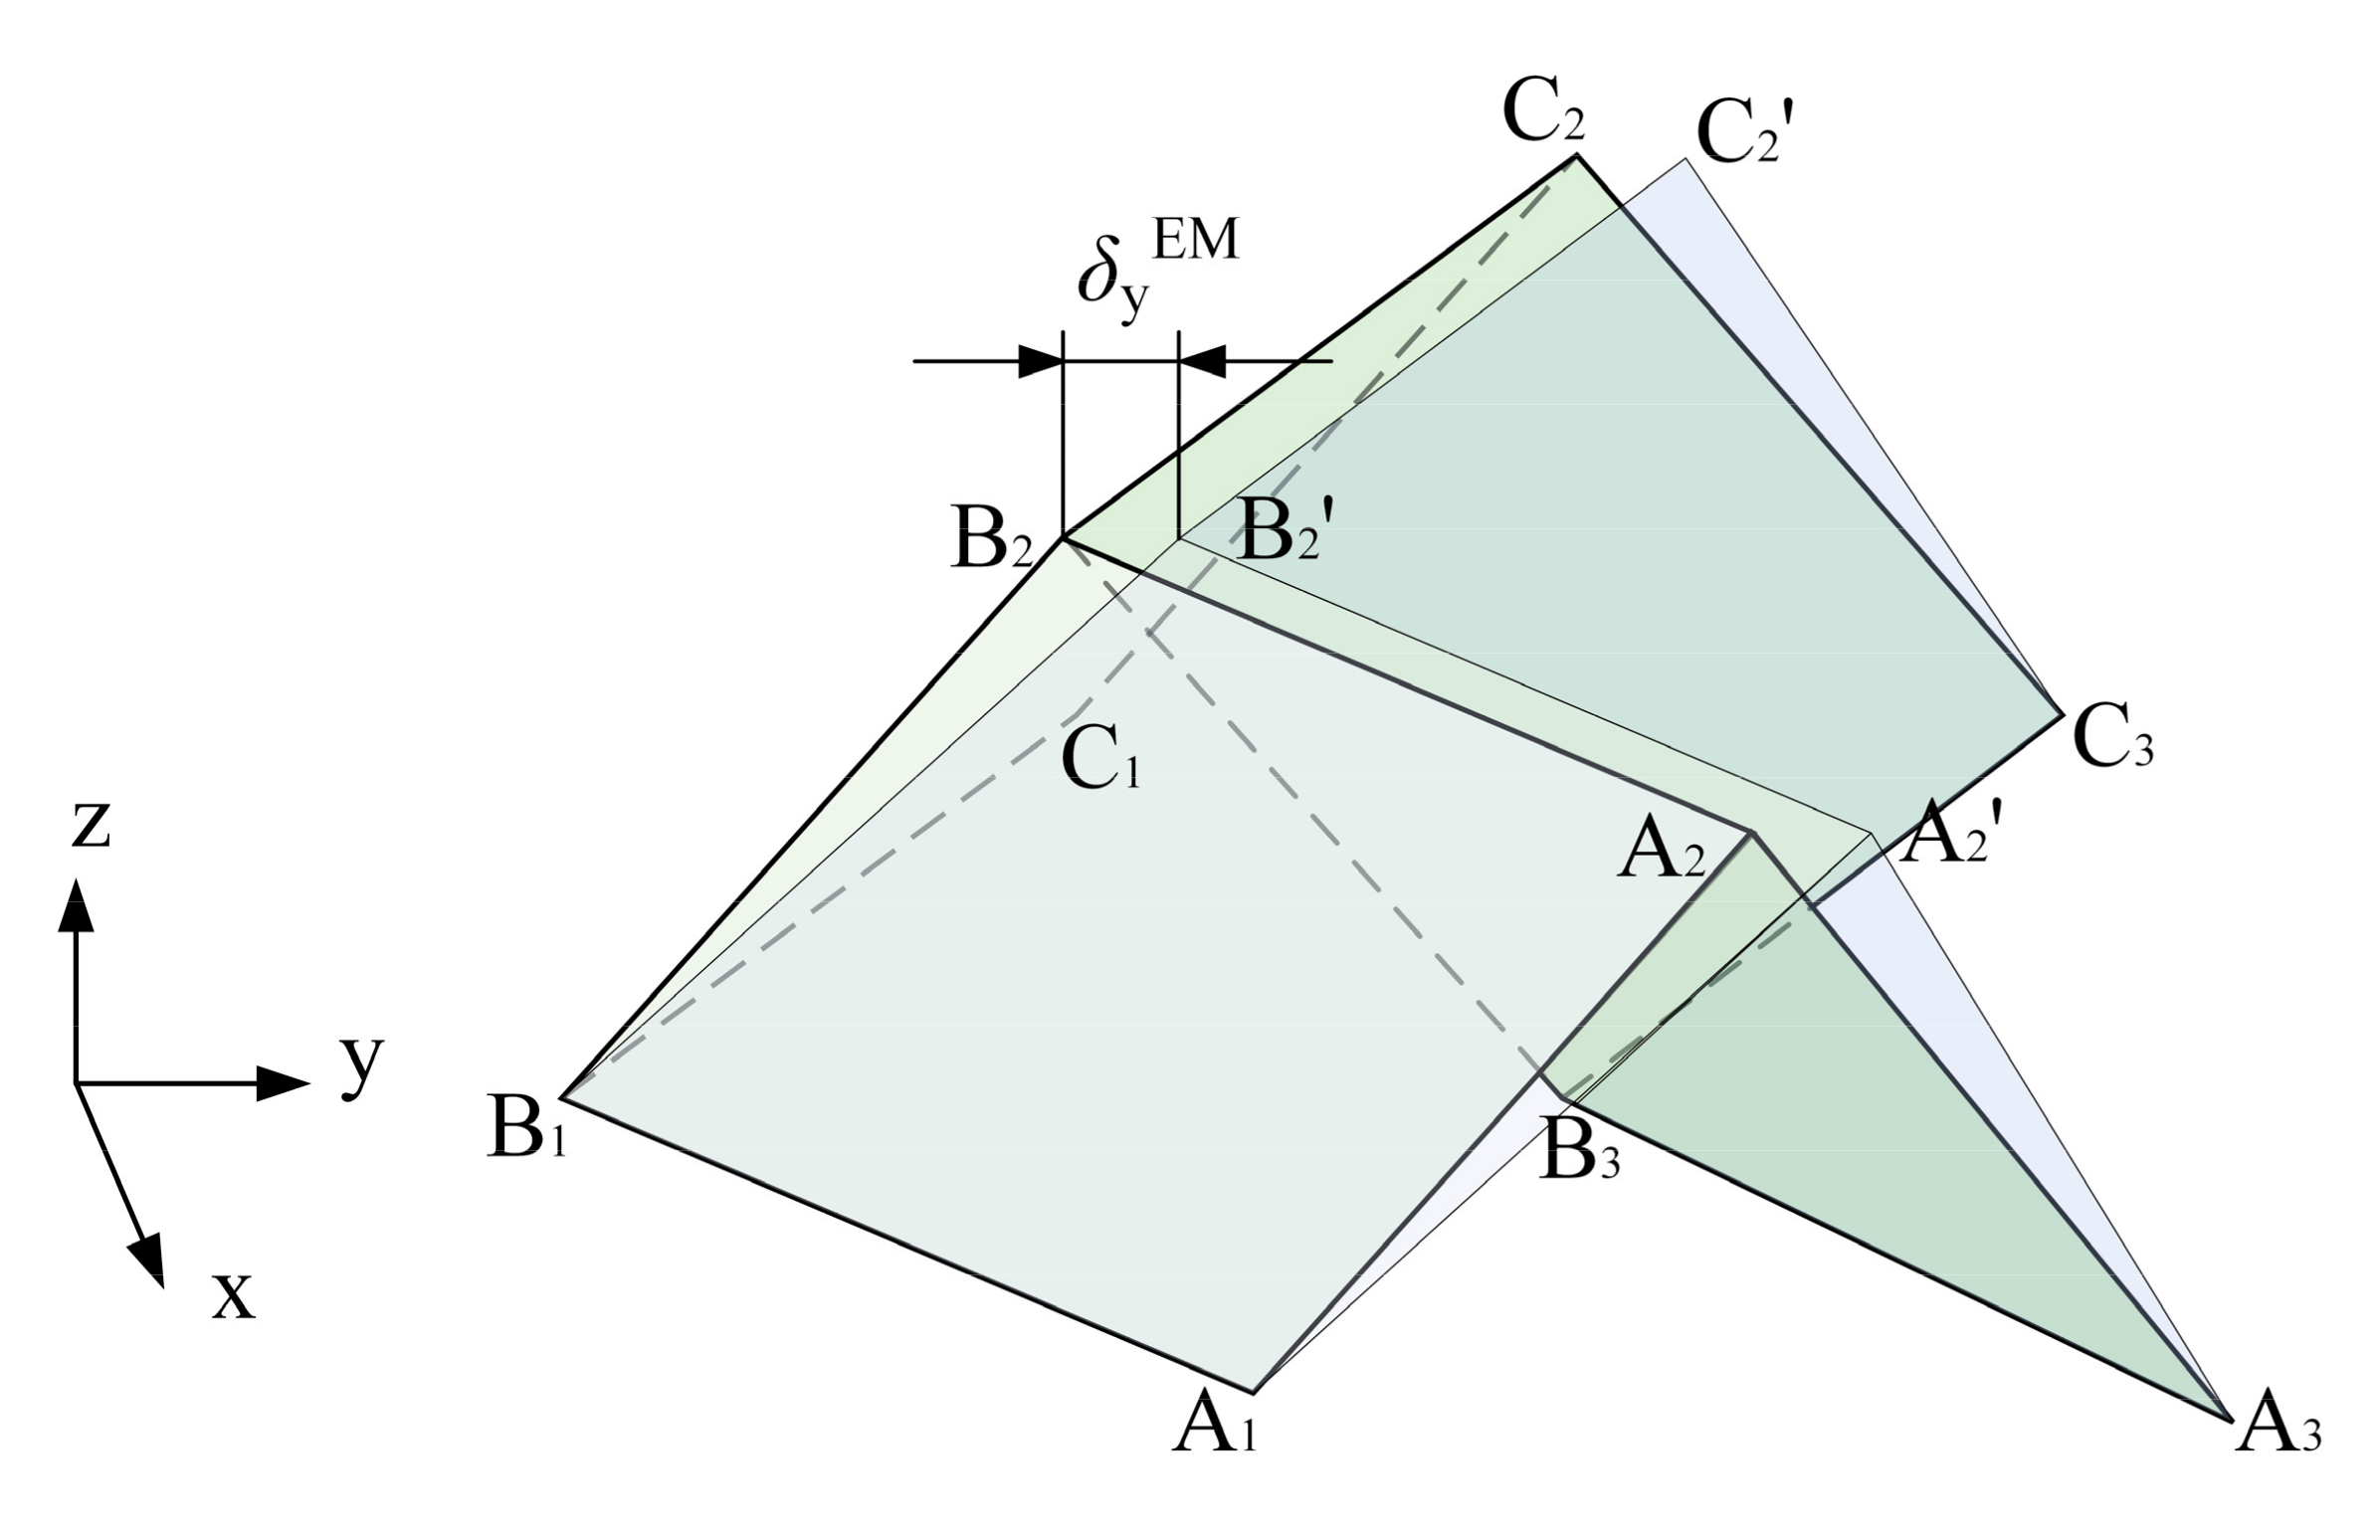
Then, the shearing angle of EM in Plane yz under the
Qyz can be obtained, namely
γyzEM.
For ESE, the
Qyz is applied to the upper surface of the model (
Figure 9b).
The equivalent shear stress
τyzESE is:
And the shearing angle in Plane yz is
Since EM and ESE are equivalent, the shearing angles of the two different methods are equal, that is
γyzEM =
γyzESE, and the equivalent
Gyz can be represented by the geometrical parameters of EM.
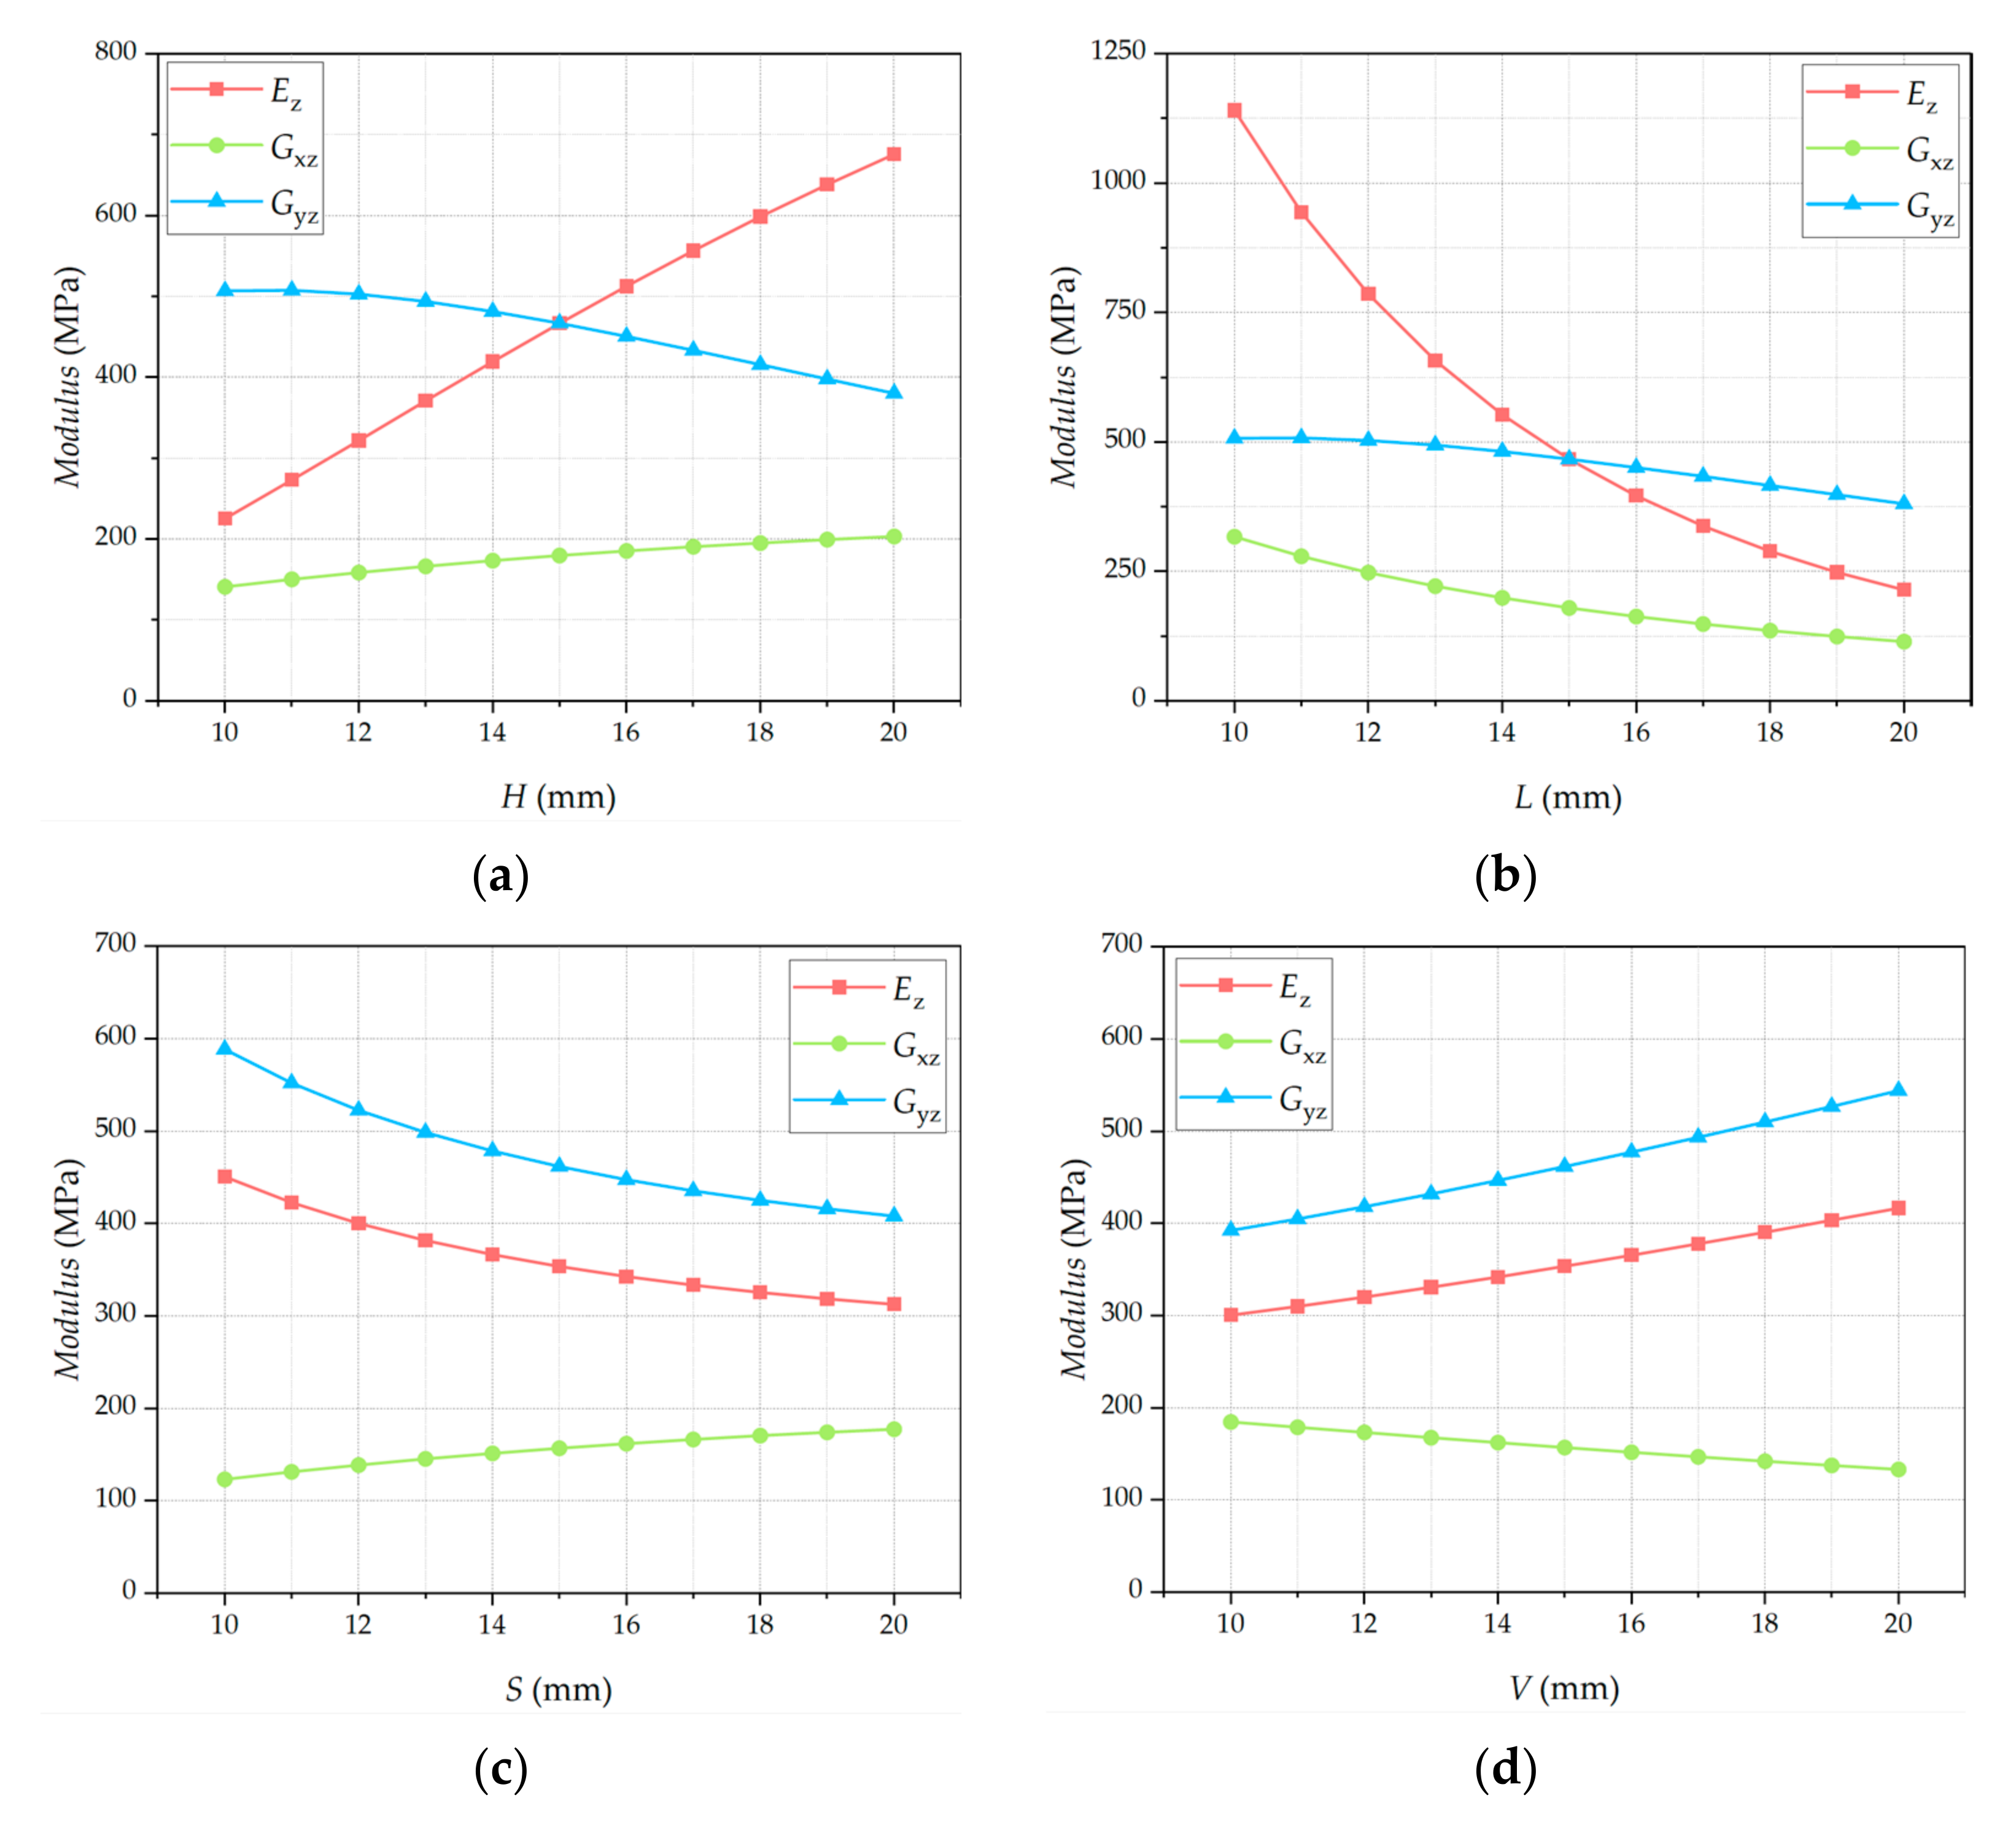
3.6. Mechanical Properties of VFC
As a result, we can calculate the analytical solutions for
Ez,
Gxz, and
Gyz, meaning that the geometrical parameters of VFC can be used to describe its mechanical properties. According to the mathematical relationship between the mechanical properties and the geometric parameters, the influence of the remaining parameters on the mechanical properties can be determined by fixing any three of the four parameters
H,
L,
S,
V (
Figure 12).
4. Verification by Numerical Simulation
Numerical simulation can be performed to verify the analytical solutions obtained above. By using a computer and finite element methods, numerical simulation can be used to study engineering problems, physical problems, and other problems in nature. Patran and Nastran will be used in this article for numerical simulation. Patran is an excellent finite element simulation and analysis software program, and Nastran is a multipurpose finite element analysis program designed for various engineering applications. There are several steps involved in numerical simulation: by building the finite models in the software, assigning the properties, and applying the load, we can determine the stress and deformation.
In this article, the mechanical properties of VFC can be obtained by finite element simulation. The reliability of the analytical solutions can be verified by comparing the numerical and analytical solutions of Ez, Gxz and Gyz.
4.1. Selection of Configuration Parameters
Ten different geometric parameters of VFC are selected in order to make the simulation results more general (
Table 1). Since aluminum alloy is the most widely used material in aerospace structures, aluminum alloy is chosen in the calculation example of this paper, whose basic mechanical properties can be obtained: the elastic module
EF = 70,000 MPa, the Poisson’s ratio
v = 0.3.
4.2. Verification of Ez
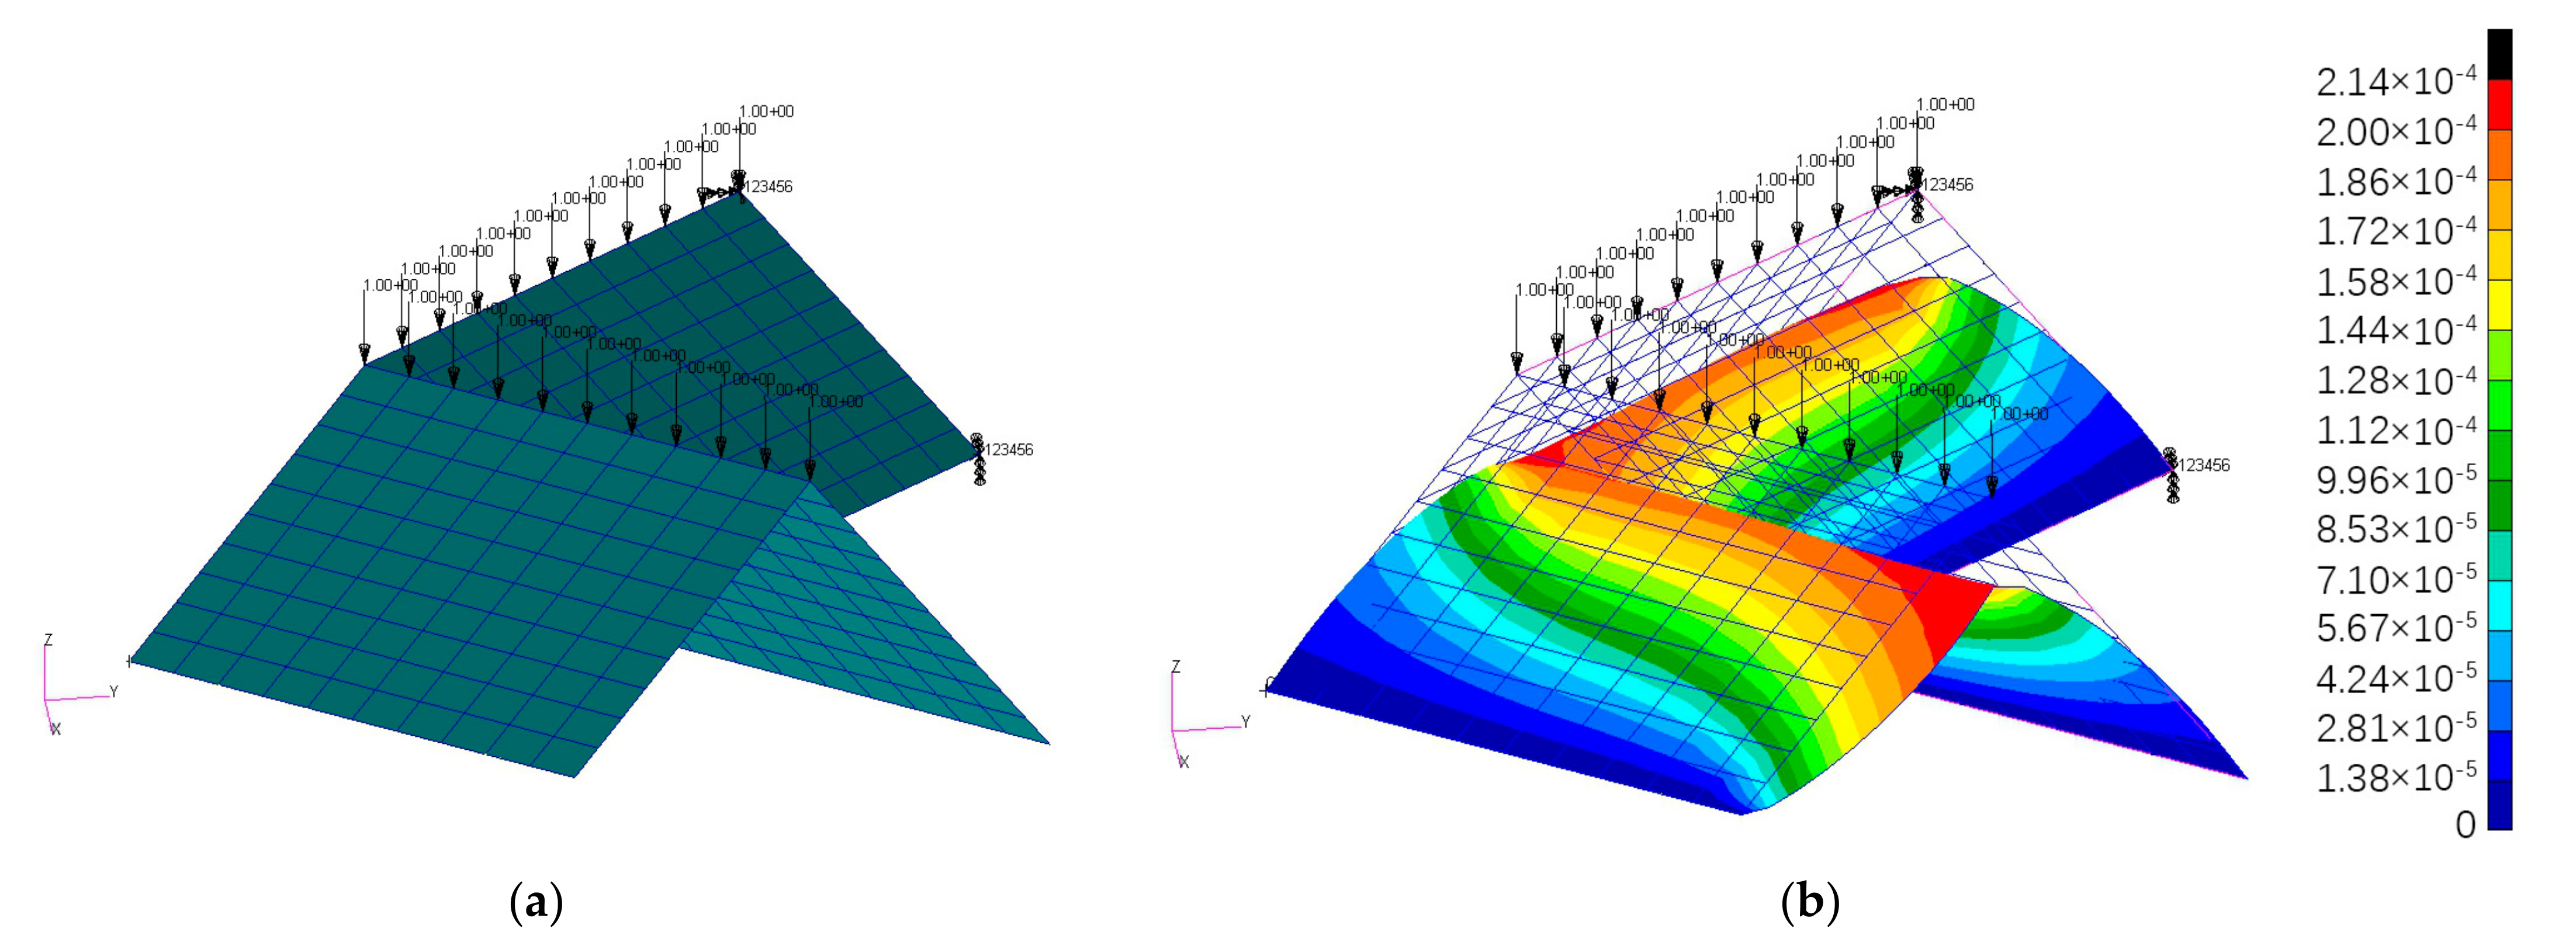
Take one EM for finite element analysis, according to the division of finite element mesh, 1 N load was applied to each node on the upper edge of the finite element model. The load
Pz = 21 N is uniformly applied to its upper edge, the lower edge is fixed, and periodic boundary conditions are applied to the finite element model. (
Figure 13a).
The finite element models are analyzed to obtain the displacement, and the displacement contour is shown in
Figure 13b.
Then, using the average displacement of the upper edge of the finite element model obtained from the numerical simulations, with the help of Equation (10), the numerical solutions of the elastic modulus Ez-Num can be calculated. Comparing with the analytical solutions of the elastic modulus Ez-Ana allows for the error percentage to be obtained, which represents the difference between Ez-Num and Ez-Ana.
As can be seen in
Table 2, the difference between
Ez-Ana and
Ez-Num is not very big, and the error percentages are both below 20%.
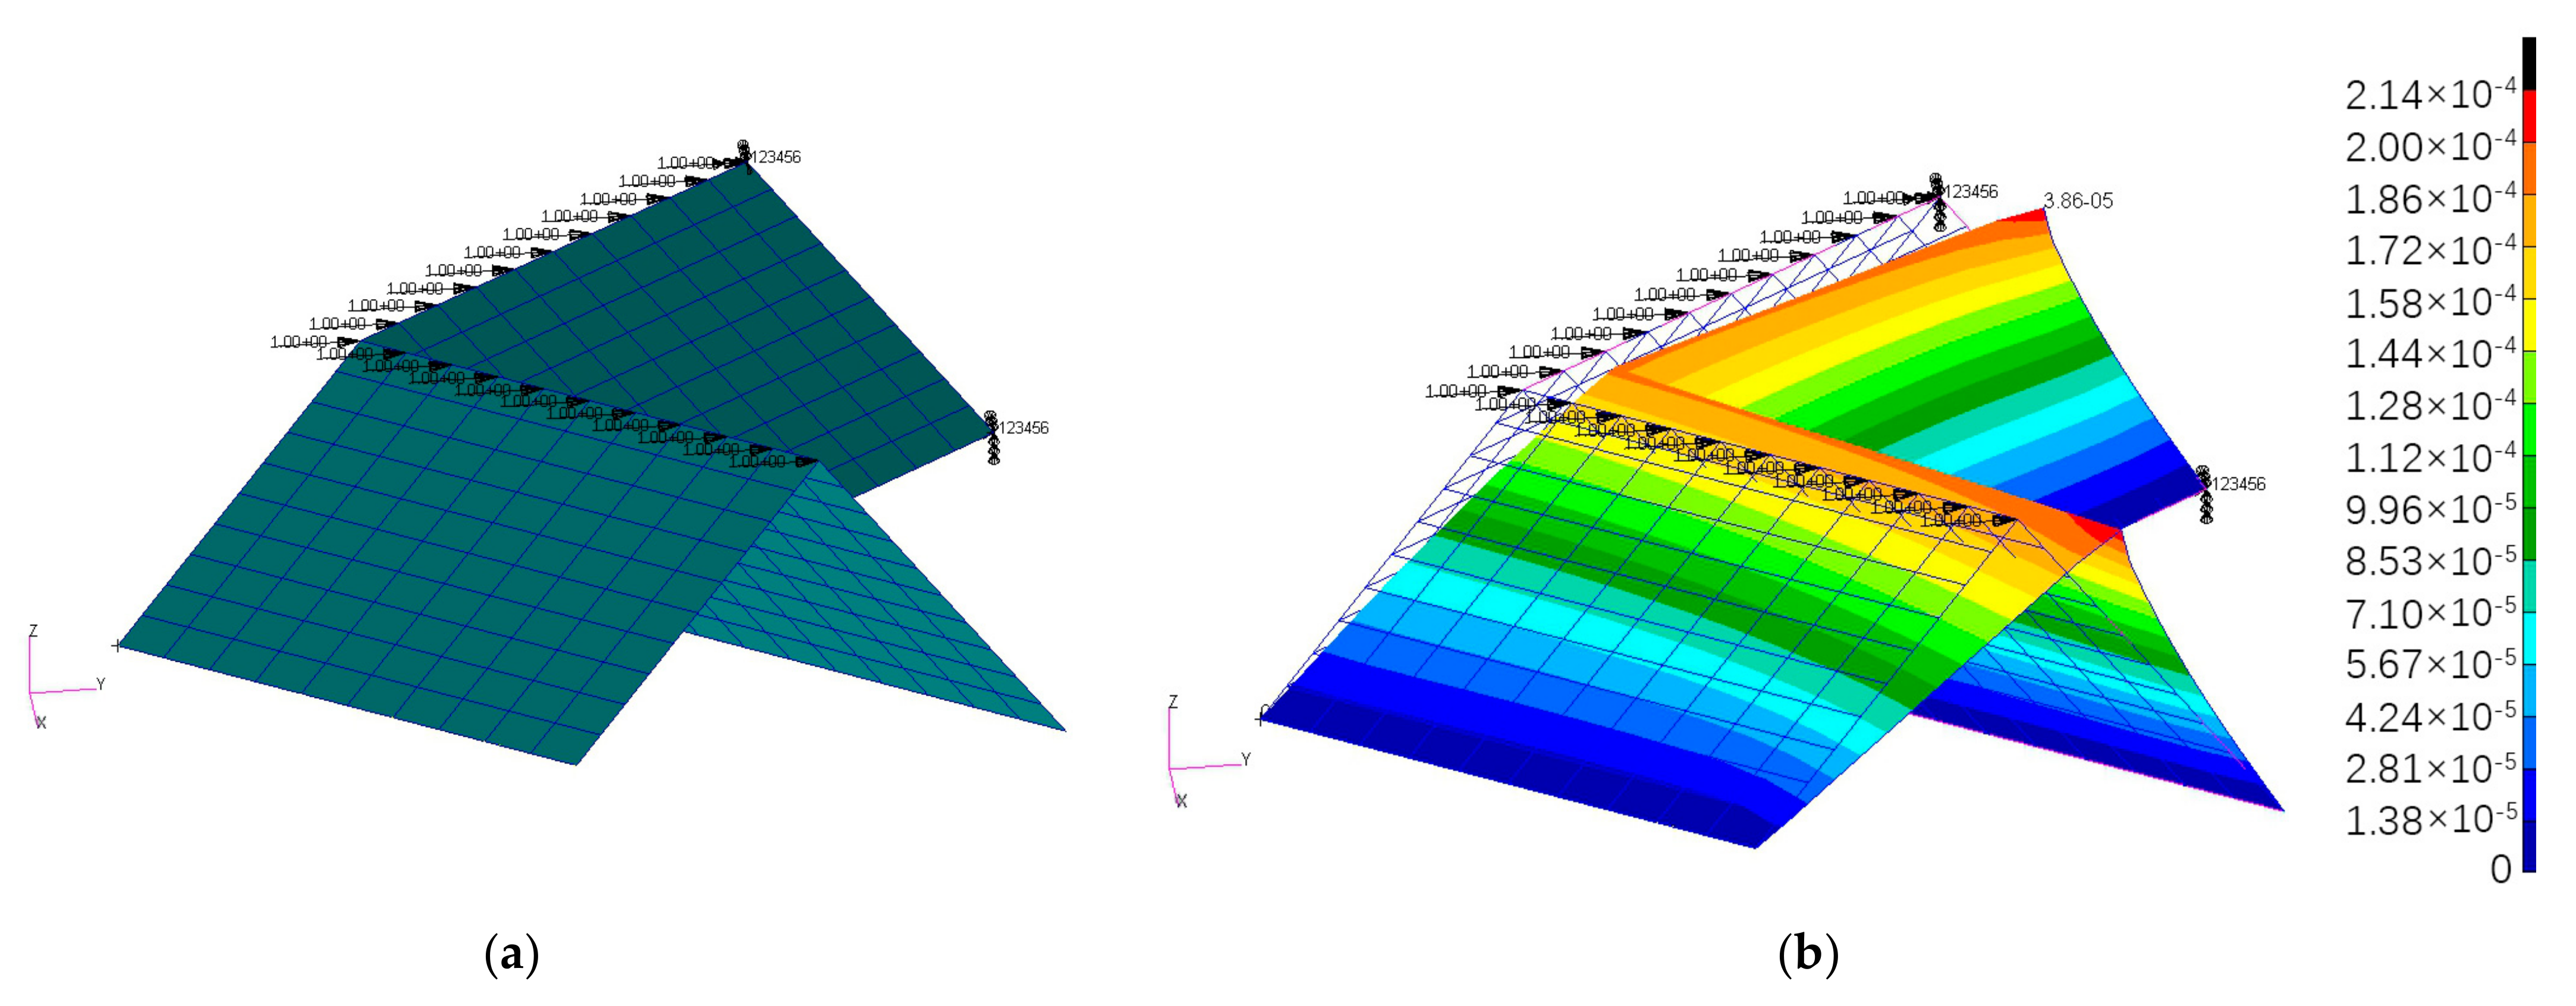
4.3. Verification of Gxz
As is the case for the verification of
Ez, an EM is taken for analysis and a uniform load
Qxz = 21 N is applied to its front edge, the rear edge is fixed, and periodic boundary conditions are applied to the finite element model. (
Figure 14a).
The finite element models are analyzed to obtain the displacement, and the displacement contour is shown in
Figure 14b.
Using the displacement of the upper edge endpoint of the finite element model obtained from the numerical simulations, the shear angles of the finite element model can be obtained by dividing the displacement by the zigzag line step length—2S. Then with the help of Equation (17), the numerical solutions of the elastic modulus Gxz-Num can be calculated. Comparing with the analytical solutions of the elastic modulus Gxz-Ana allows for the error percentages to be obtained, which represent the difference between Gxz-Num and Gxz-Ana.
As can be seen in
Table 3, the difference between
Gxz-Ana and
Gxz-Num is not very big, and the error percentages are both below 20%.
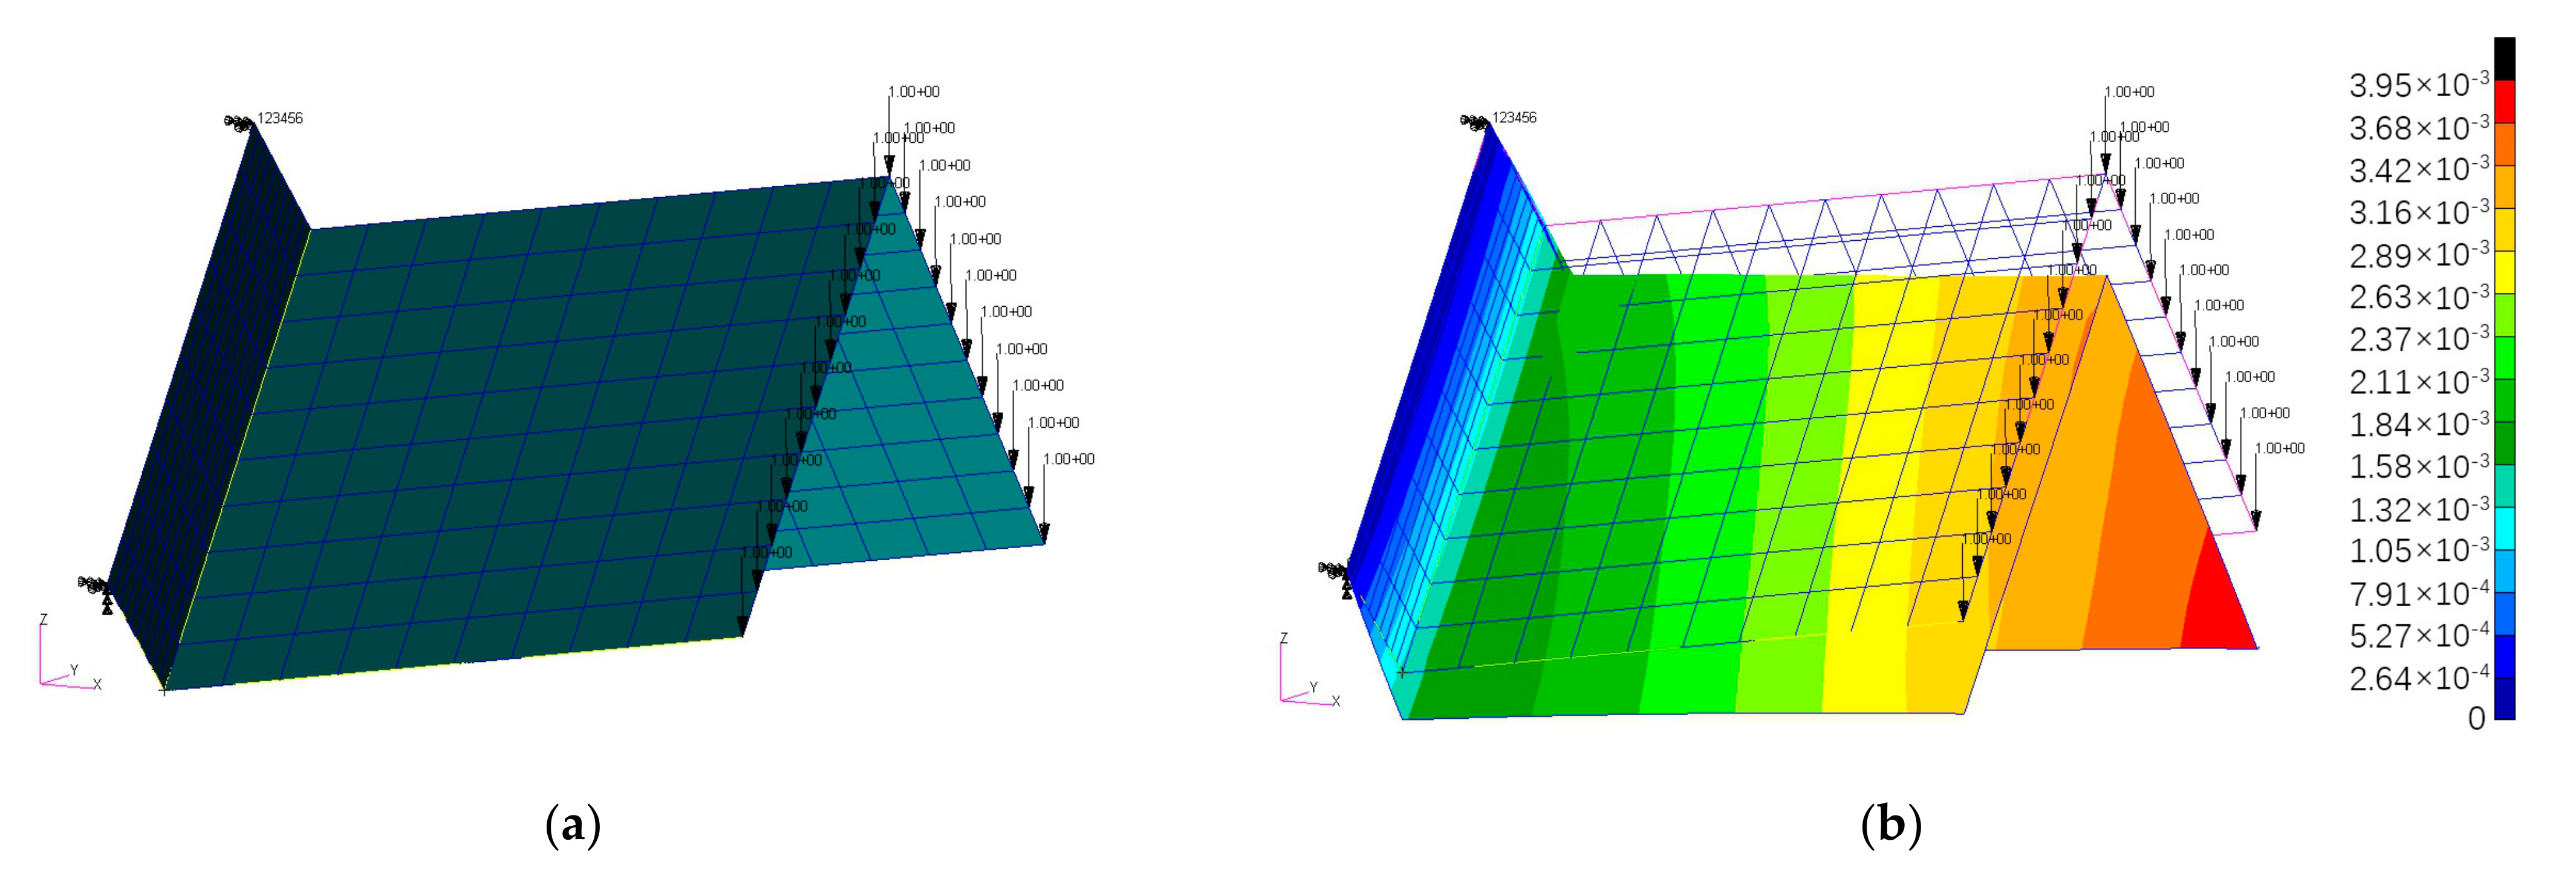
4.4. Verification of Gyz
The same as the verification of
Ez and
Gxz, an EM is taken for analysis and a uniform load
Qyz = 21 N is applied to its upper edge, the lower edge is fixed and periodic boundary conditions are applied to the finite element model. (
Figure 15a).
The finite element models are analyzed by static and get the displacement, and the displacement contour is shown in
Figure 15b.
Using the average displacement of the upper edge of the finite element model obtained from the numerical simulations, the shear angles of the finite element model can be obtained by dividing the displacement by the height of the folded core—H. Then with the help of Equation (25), the numerical solution of the elastic modulus Gyz-Num can be calculated. Comparing with the analytical solution of the elastic modulus Gyz-Ana allows for the error percentages to be obtained, which represent the difference between Gyz-Num and Gyz-Ana.
As can be seen in
Table 4, the difference between
Gyz-Ana and
Gyz-Num is not very big, and the error percentages are both below 20%.
5. Case Study
In order to further verify the equivalent mechanical properties of VFC, the cores of the third group (in
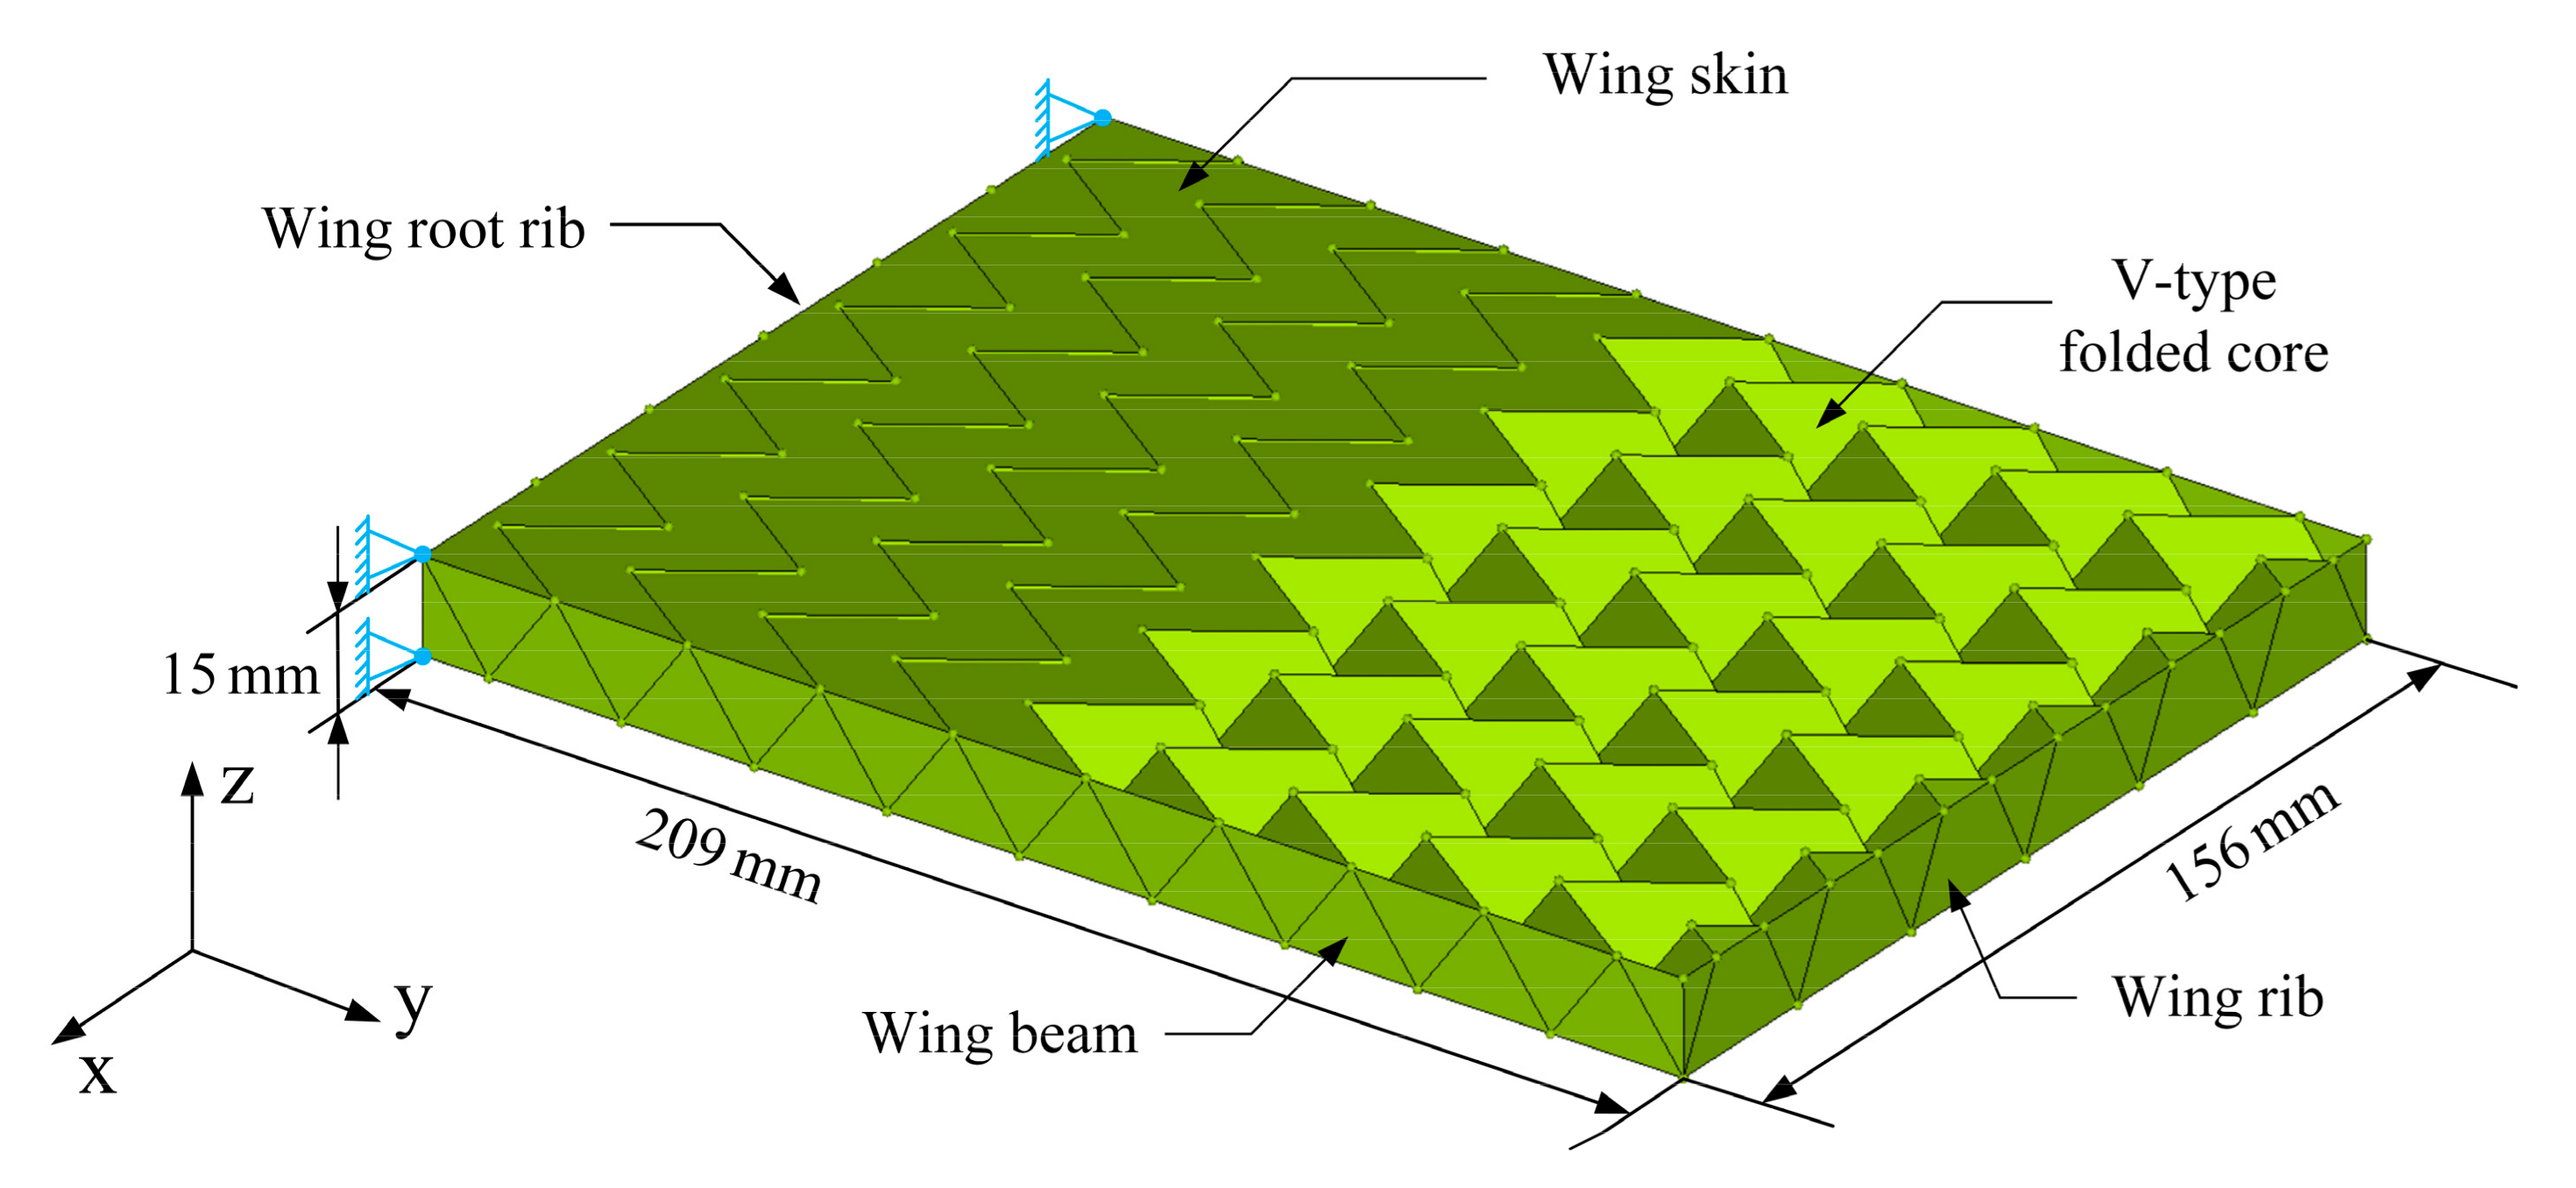
Table 1) are selected for the case study. In the design of small aircraft and unmanned aerial vehicles (UAV), the wing size is small and cannot carry large weight structures such as fuel tanks, therefore, lightweight materials are often chosen to fill the wings. In this case, a small aircraft wing box segment filled with VFC (
Figure 16) was analyzed.
The wing box segment is the main load-bearing structure of the wing, including the skin, the wing beam, the wing ribs, and VFC, and has the following dimensions: length is 209 mm, width is 156 mm, and height is 15 mm. In addition, the roots of the upper and lower edge strips of the wing beams are fixed, and different loads are applied to the structure.
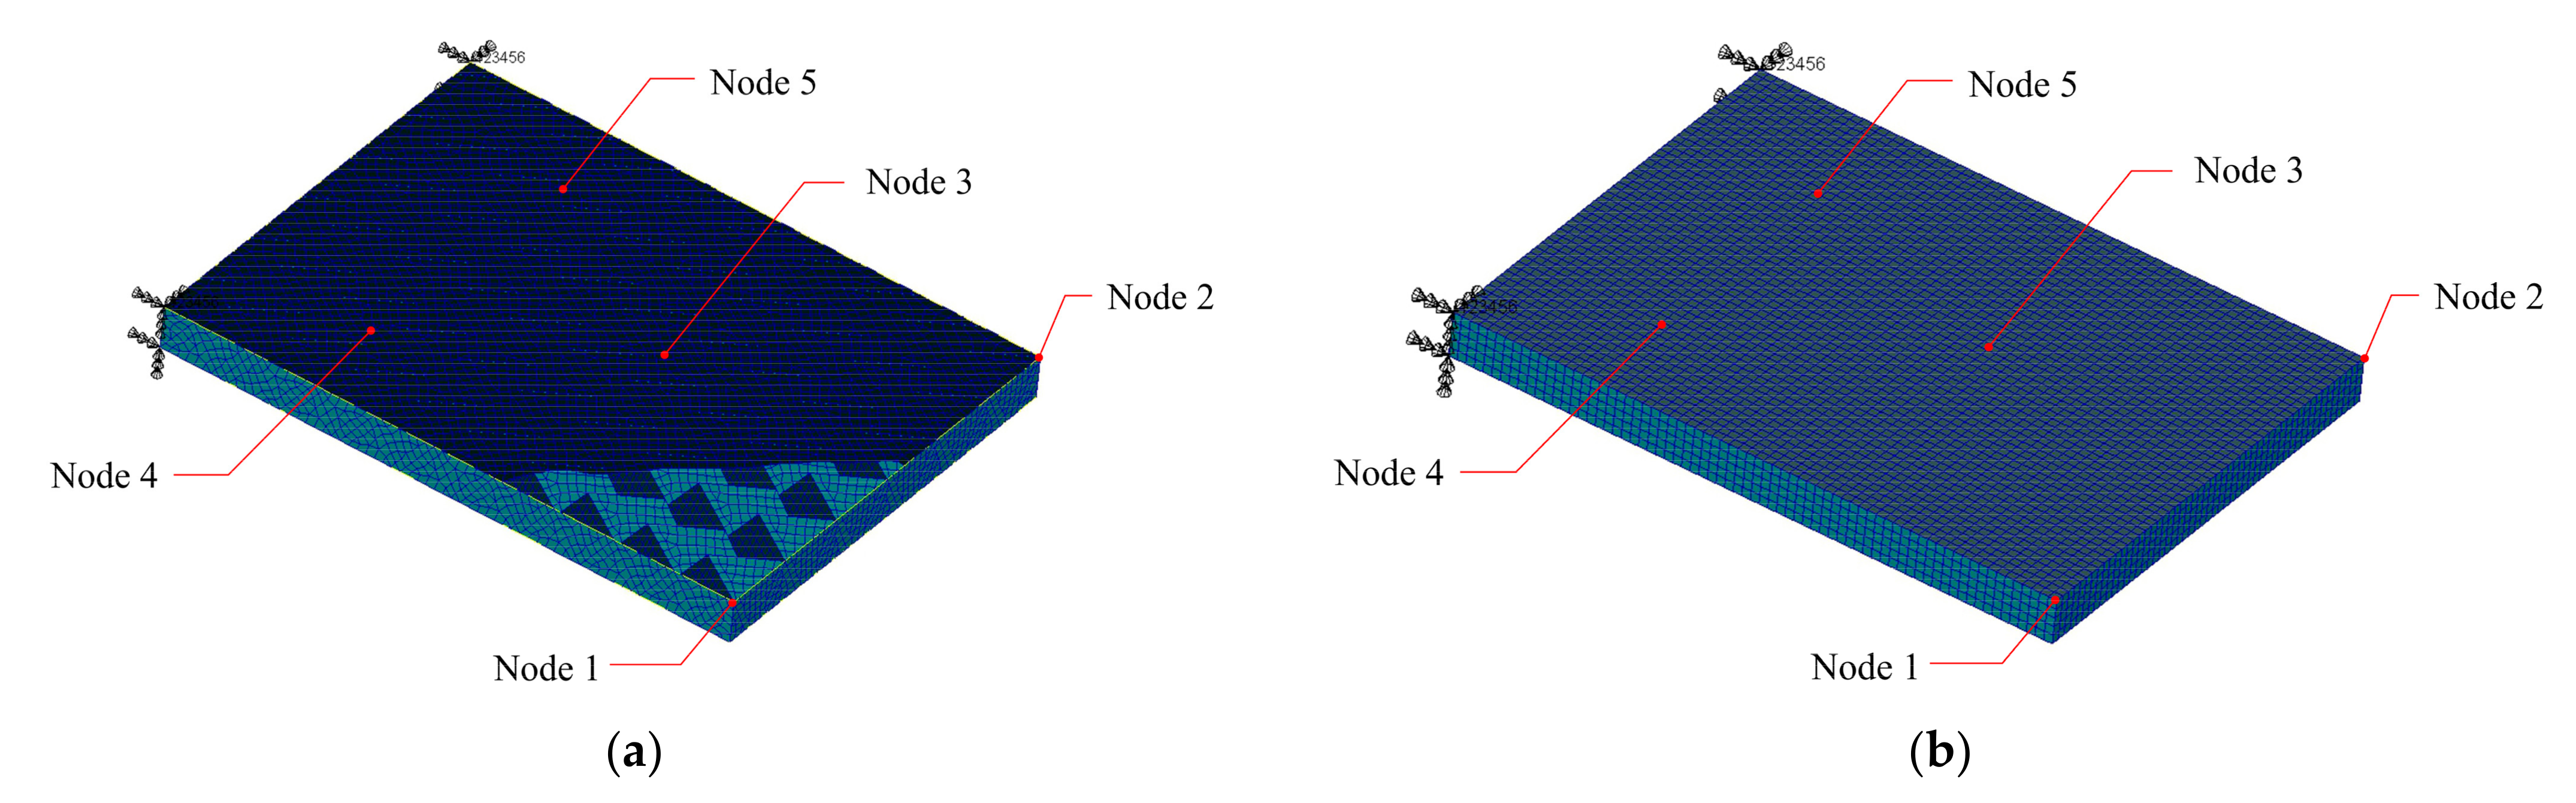
Regarding the creation of two finite element models for the wing box section, in one model, every face of the V-type folded core will be presented by many shell units (
Figure 17a), and in the other, VFC is equivalent to solid, which is divided into many small solid units (
Figure 17b). Its mechanical properties are derived from the analytical solution, and they are:
Ez = 2954.81 MPa,
Gxz = 557.26 MPa,
Gyz = 1589.03 MPa. Other structural members are simplified in the same way in the two models.
A fixed constraint (u = 0, v = 0, w = 0) is applied to the four nodes at the root of the rod units of the front and rear wing beams, and different cases of loads are designed to analyze its deformation.
Different cases of load (
Table 5) are applied to these two finite element models at nodes 1, 2, 3, 4, and 5 (
Figure 17a,b), and the reliability of the analytical solutions of the equivalent mechanical properties of VFC is verified by comparing the difference in deformation between the two finite element models.
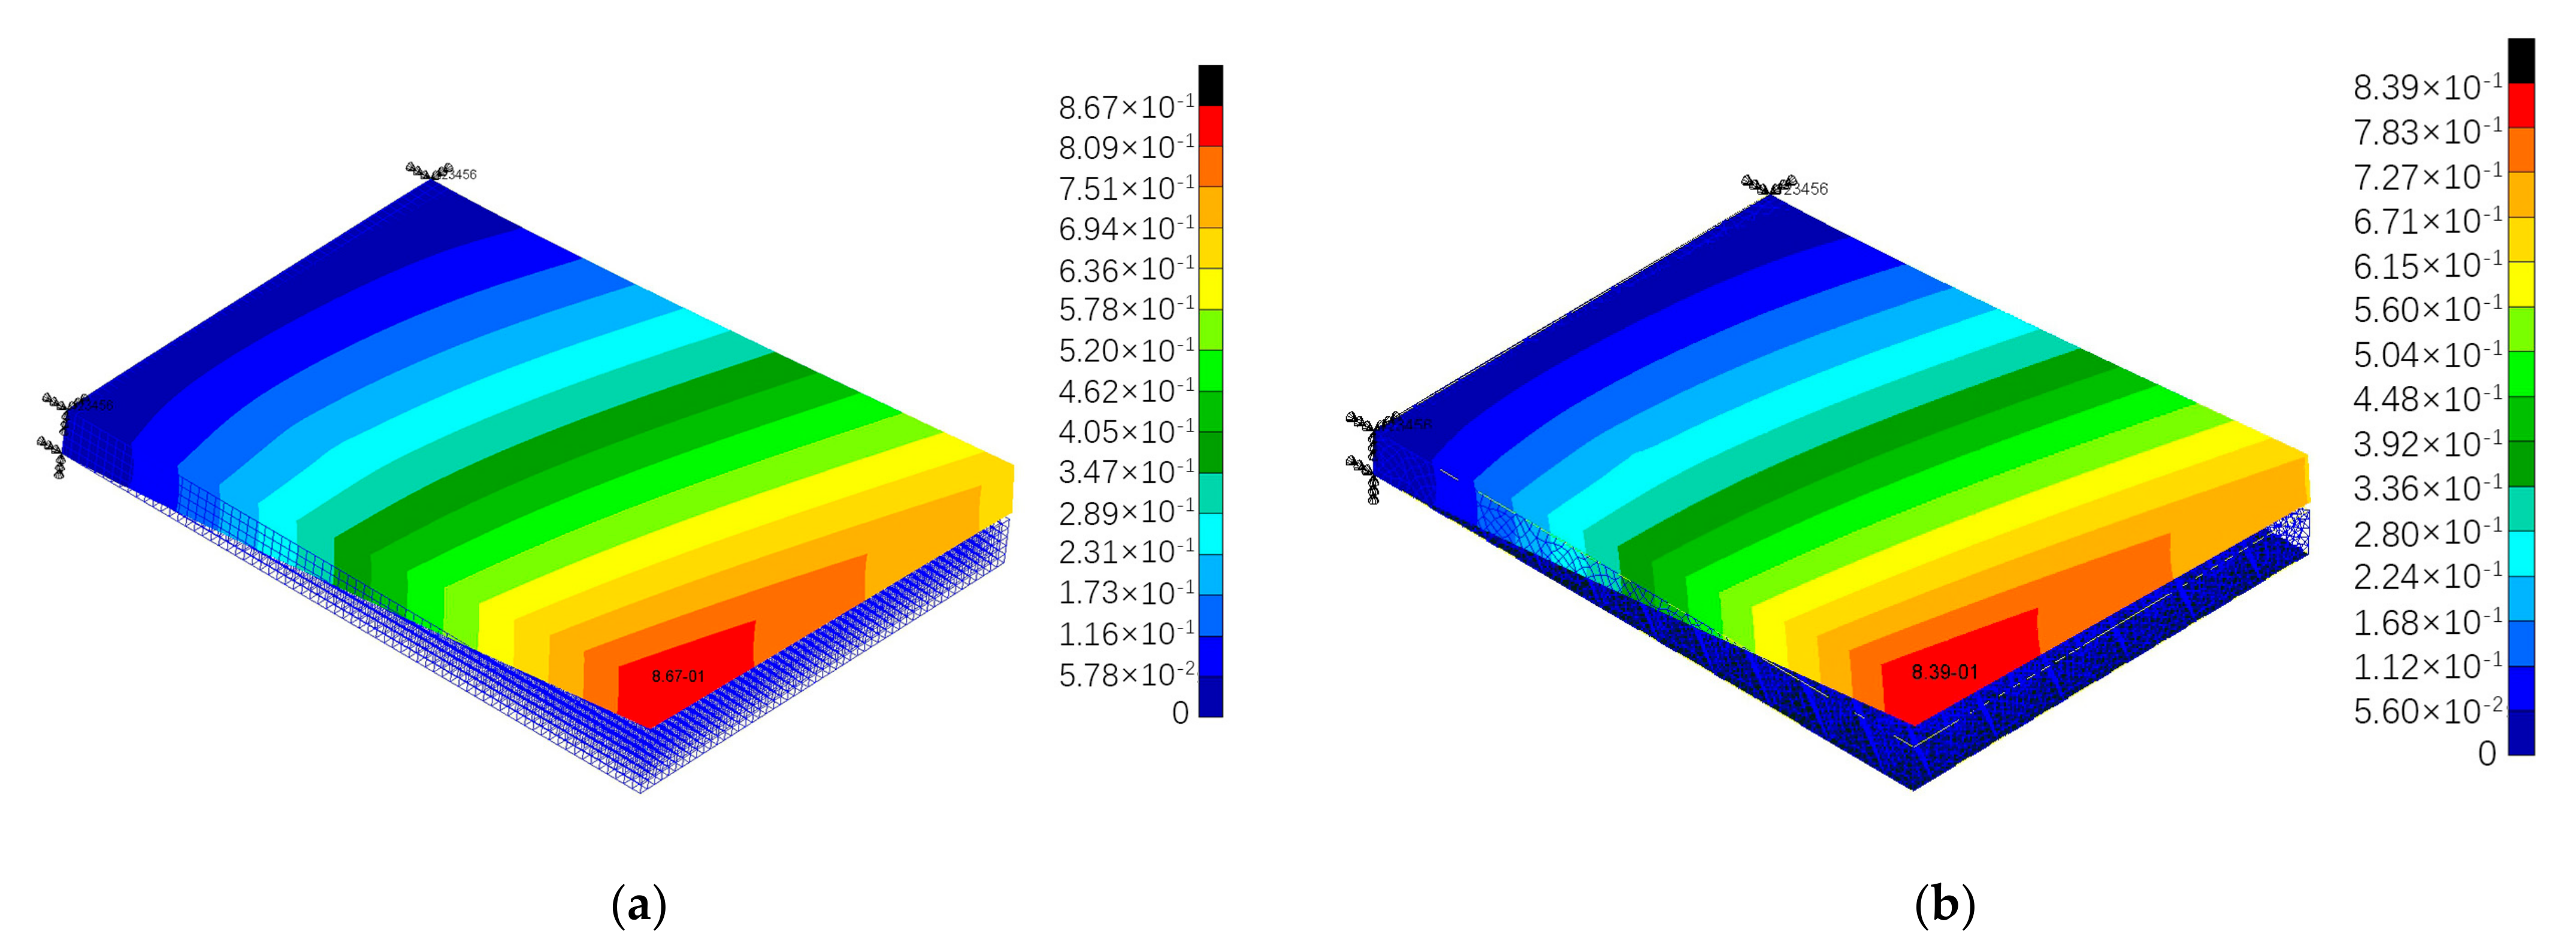
Figure 18 is the comparison of the displacement contours for load case 7.
The two finite element models of the wing box segments have very close displacement contours and very close maximum displacements for the ten load cases (
Table 5), which further confirms the reliability of the analytical solutions for the equivalent mechanical properties of VFC.
As can be seen in
Figure 18, the displacement contours of the two finite element models are very similar. Maximum displacements of two finite element models for the ten load cases are presented in
Table 5, including errors. All of the error percentages are less than 5%, which further confirms the reliability of the analytical solutions for the equivalent mechanical properties of VFC.
6. Optimization for Structural Stiffness
Structures need to be designed to reduce their weight as much as possible while meeting their functional needs. In the analysis of Chapter 2, the analytical solutions for the equivalent mechanical properties of VFC are obtained. Since the analytical solution can directly determine the functional relationship between the optimization target and the design variables, the analytical solution helps to simplify the optimization process in aircraft design and eliminates the complicated modeling and simulation process.
6.1. Optimization Goals
The equivalent mechanical properties of VFC can be expressed by the geometric parameters H, L, S, V, tF, as follows:
Equivalent density: ρ = F1(H, L, S, V, tF)
Equivalent elastic modulus in Direction z: Ez = F2(H, L, S, V, tF)
Equivalent shear modulus in Plane xz: Gxz = F2(H, L, S, V, tF)
Equivalent shear modulus in Plane yz: Gyz = F2(H, L, S, V, tF)
The range of variation of design variables is determined and the equivalent density of VFC is used as a constraint for three optimizations. The maximum values of
Ez,
Gxz, and
Gyz, respectively, and the corresponding values of the design variables, respectively, are sought (
Table 6).
6.2. Optimization Program
The Multi-Island Genetic Algorithm (MIGA) is selected for optimization analysis. The main feature of Multi-Island Genetic Algorithm that distinguishes it from traditional genetic algorithms is the fact that each population of individuals is divided into several sub-populations called “islands”. All traditional genetic operations are performed separately on each sub-population. Some individuals are then selected from each island and migrated to different islands periodically.
The multidisciplinary design optimization software Isight is a product of Enginrous Software and is one of the best comprehensive computer-aided engineering softwares available internationally. Isight automates many tasks that require human intervention, replacing repetitive, error-prone numerical and design processes normally handled by engineering designers. Users can perform process integration, optimization, and automated solving of product designs. The geometry parameters of VFC are optimized by MIGA with Isight software.
6.3. Optimization Results
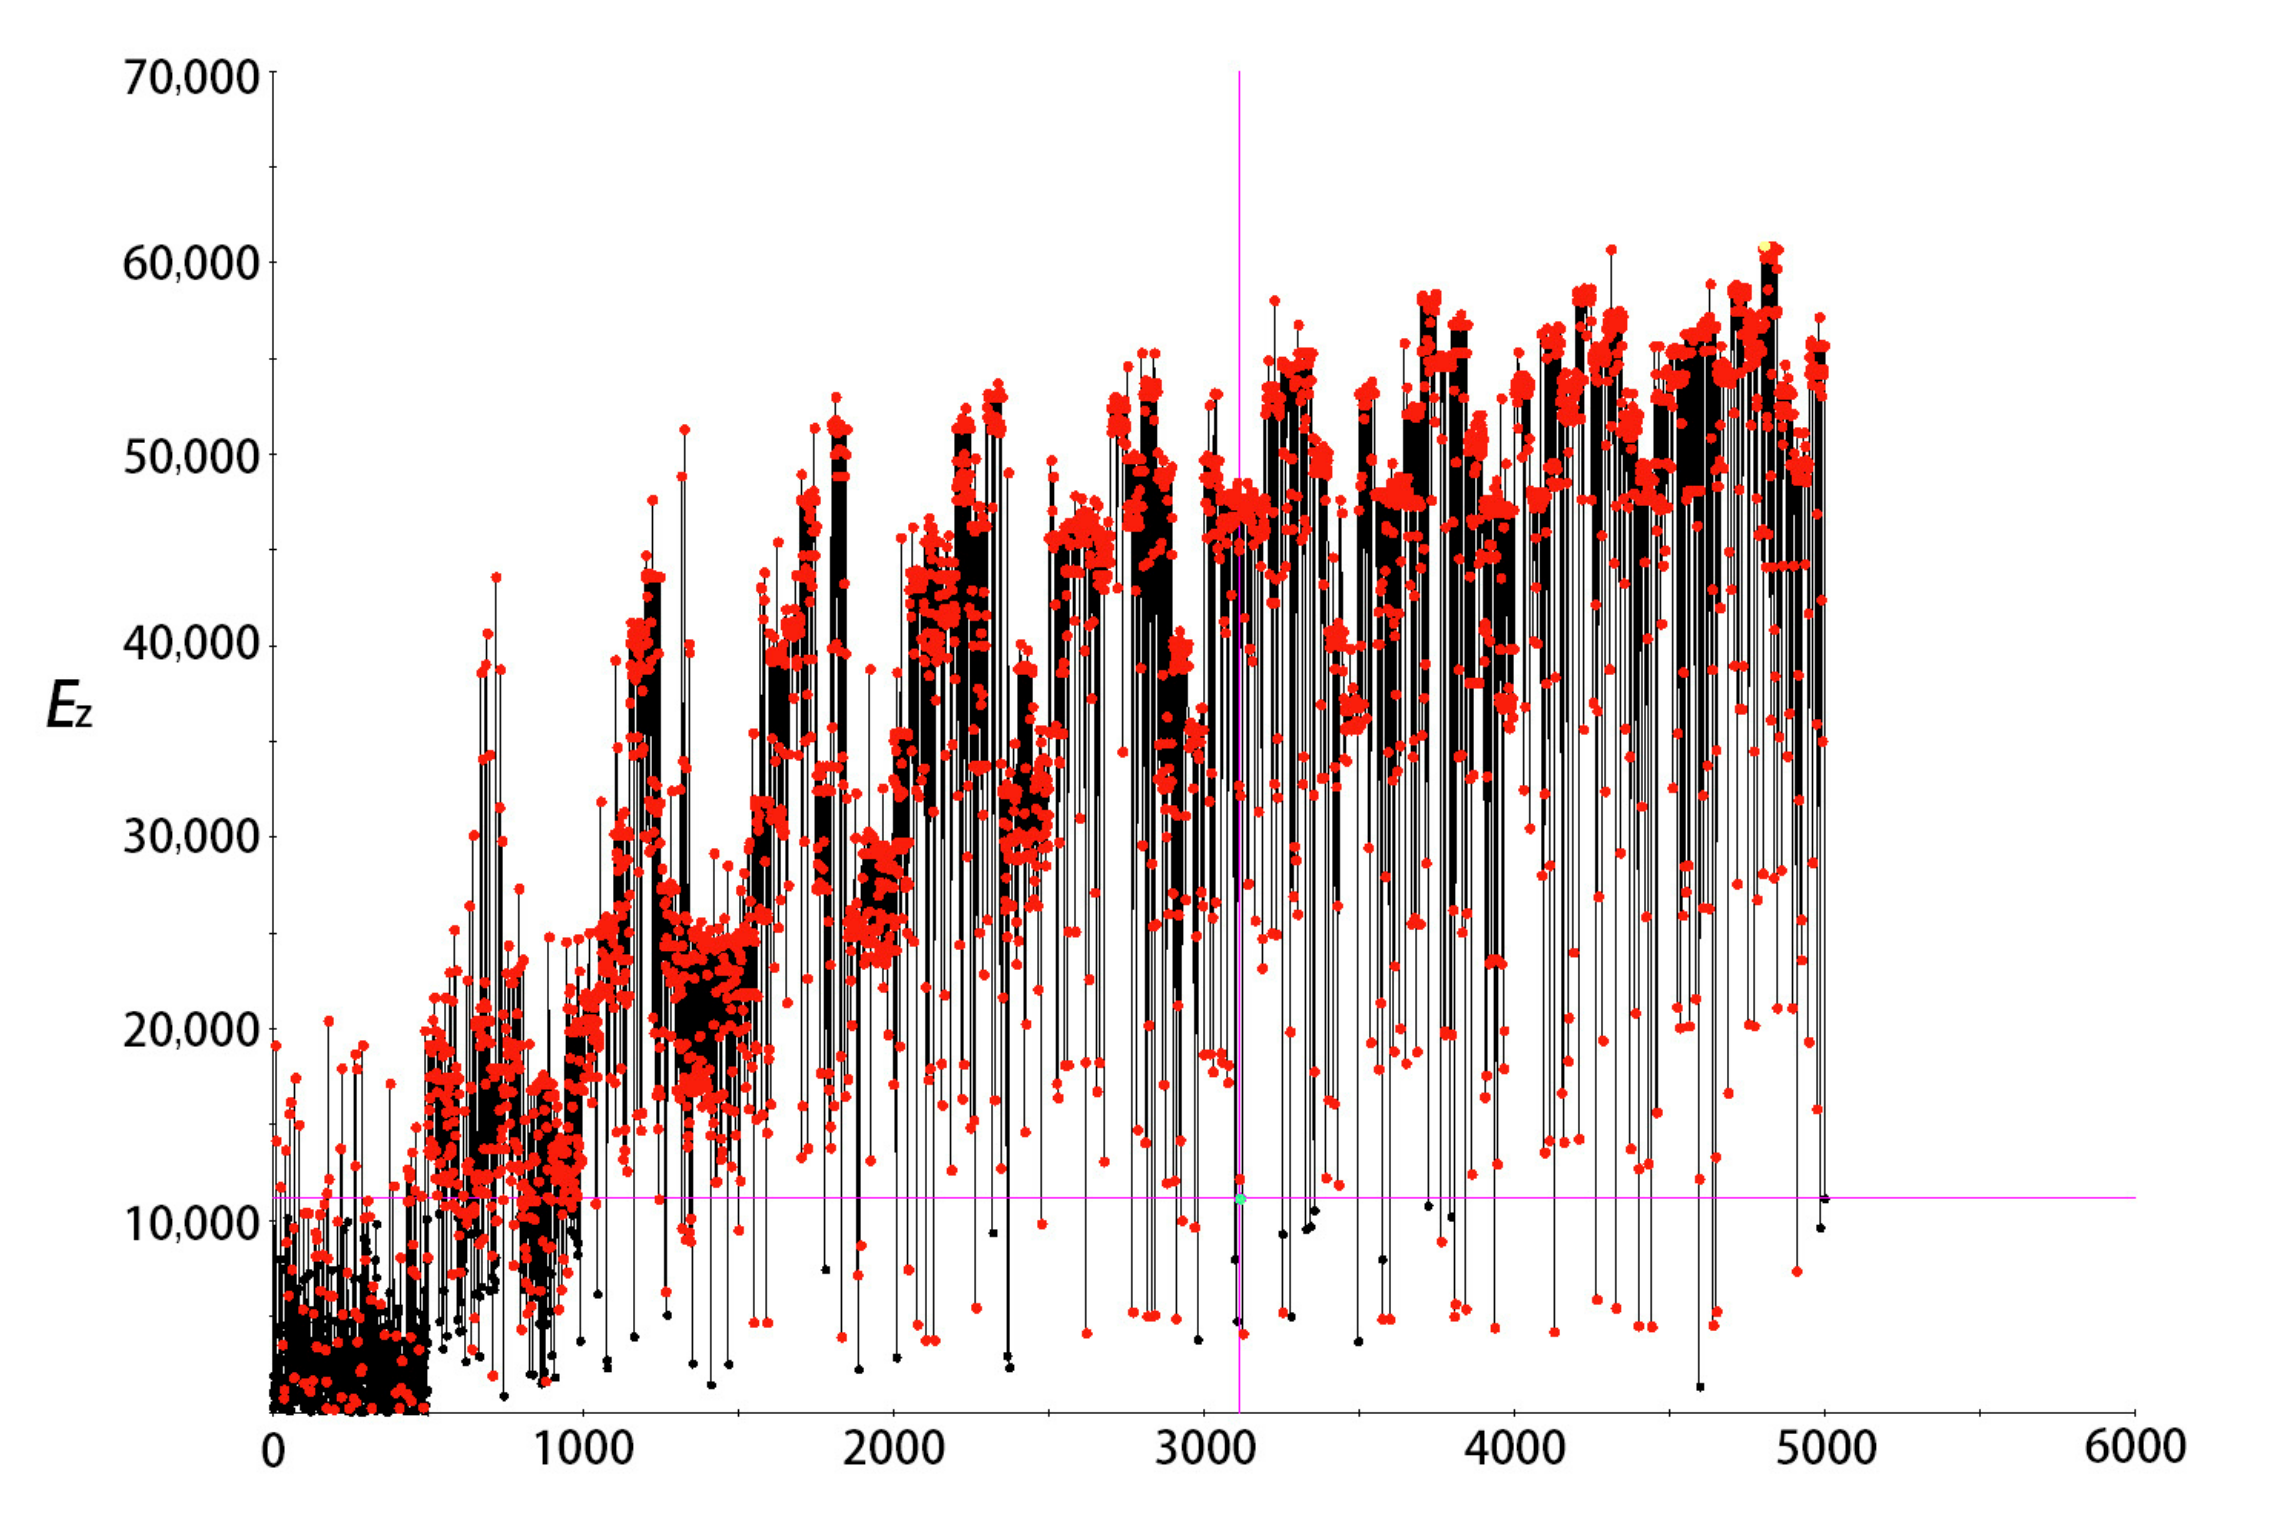
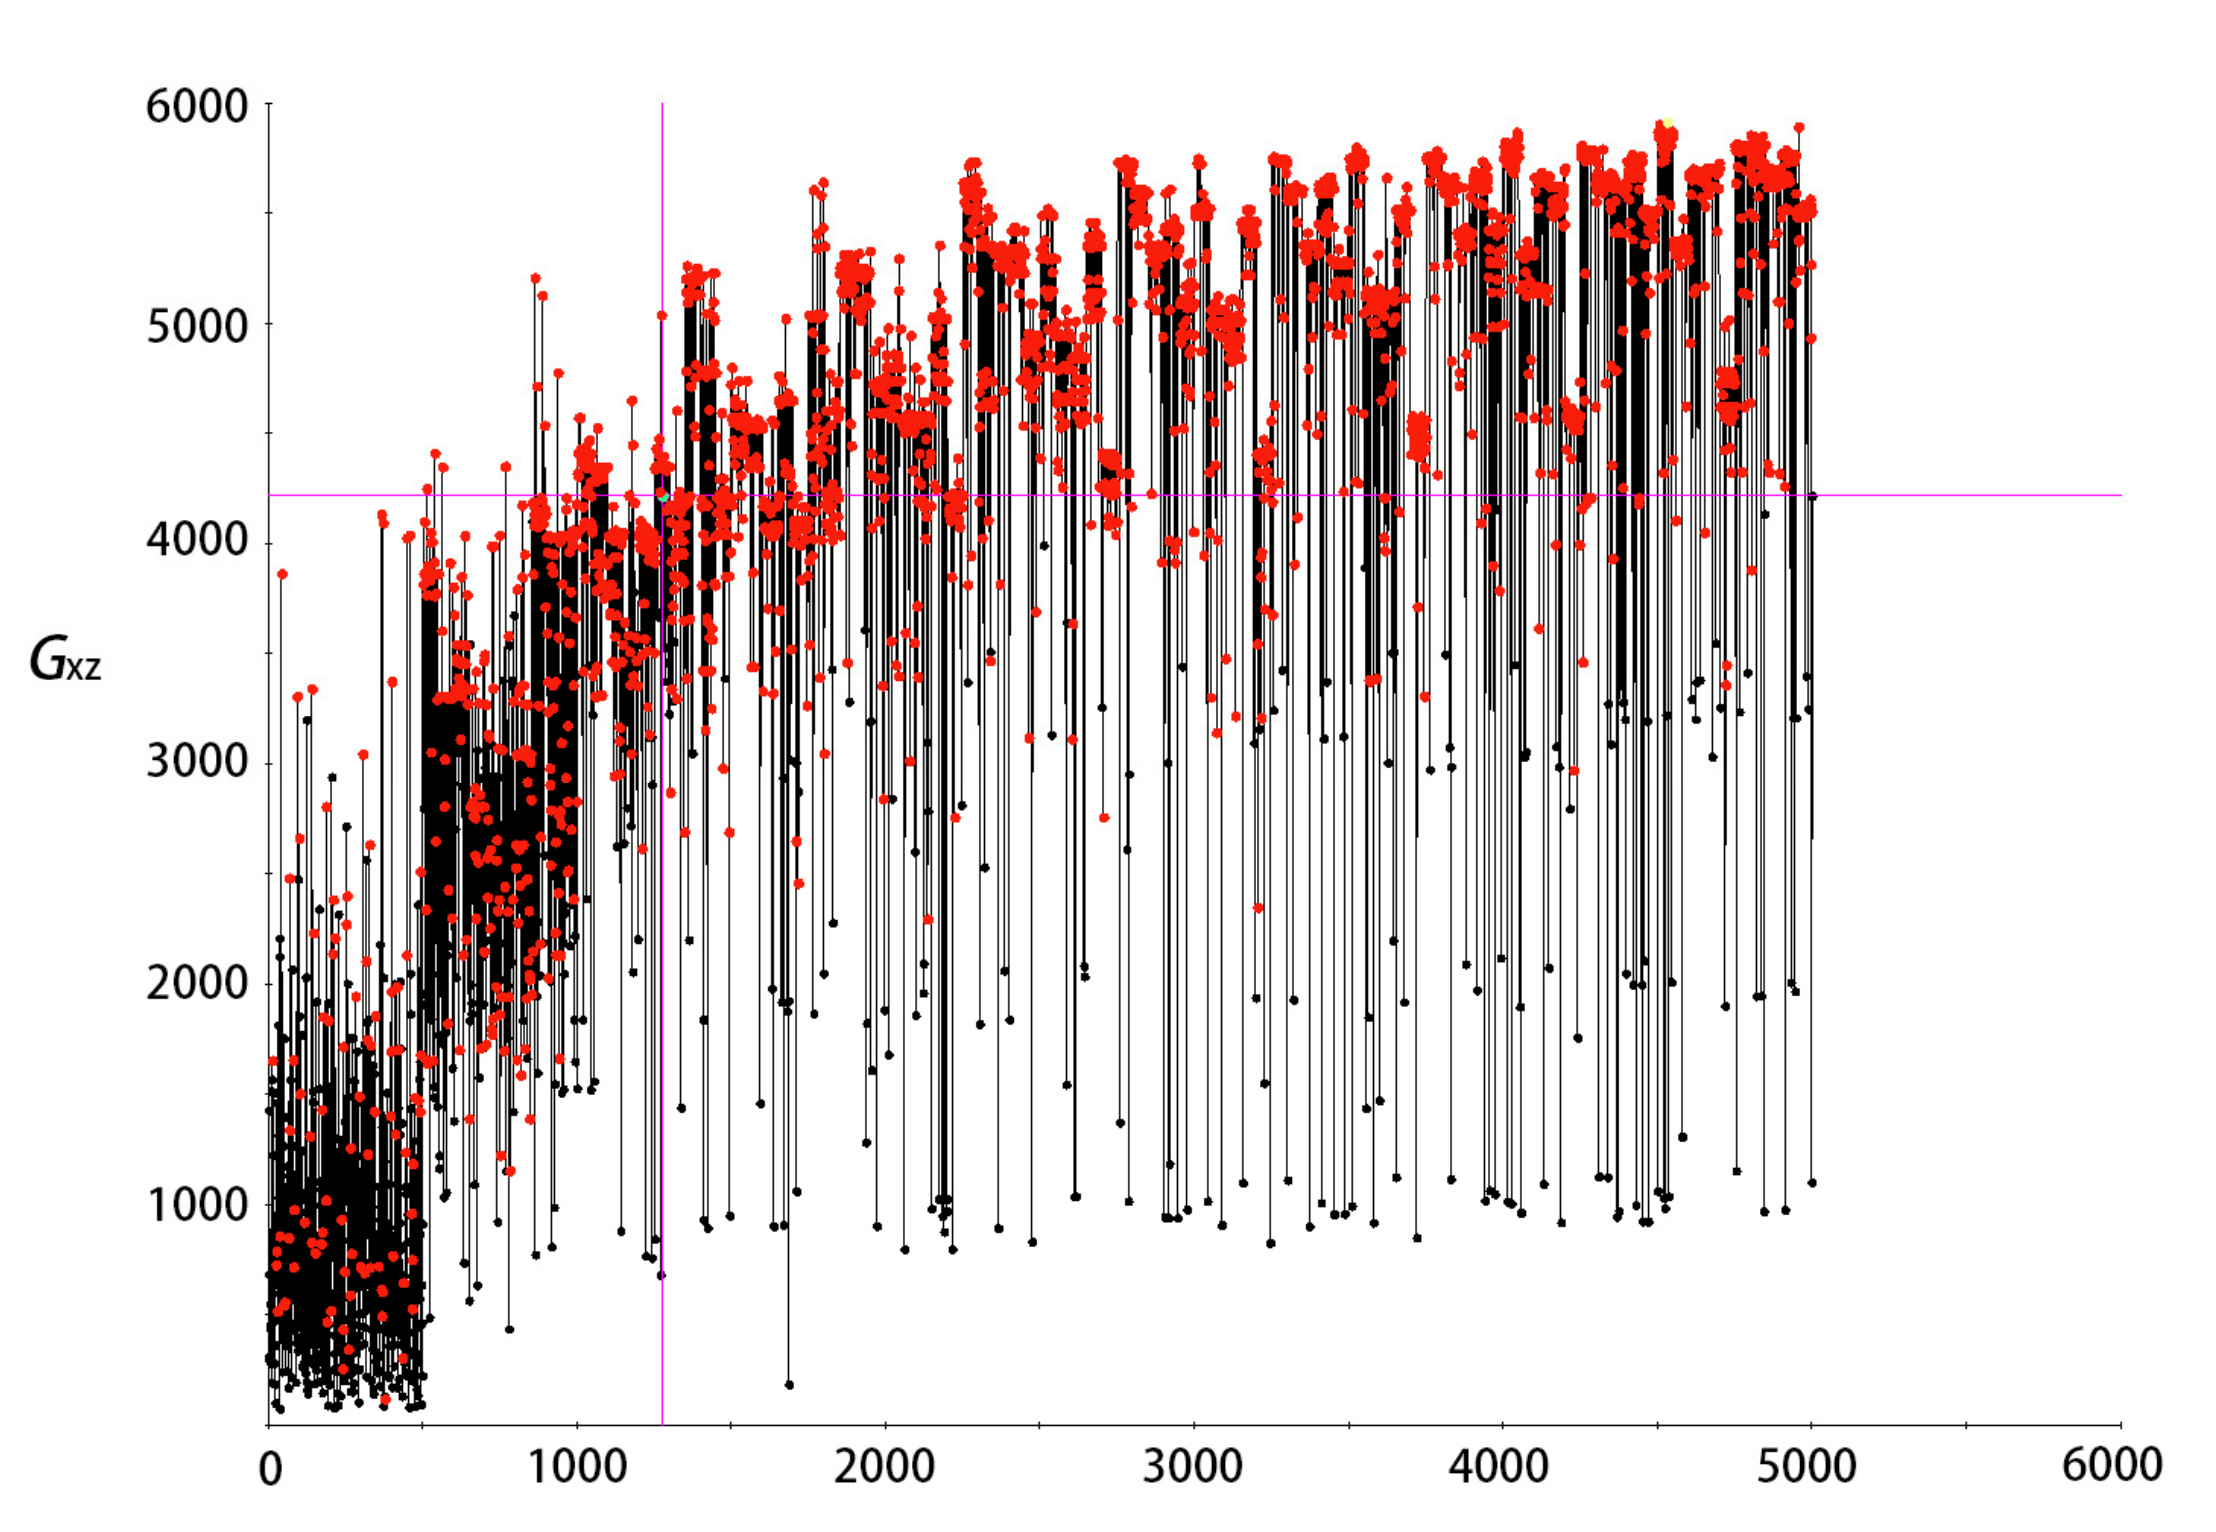
The optimization history of
Ez,
Gxz, and
Gyz can be found in
Figure 19,
Figure 20 and
Figure 21. Under the constraint of the density of VFC, the optimized maximum values of
Ez,
Gxz, and
Gyz are shown in
Table 7. Based on the optimization results, structure designers can choose different geometric parameters for different folded configurations depending on the performance requirements.
The optimization results in
Table 7 show that
H and
V have a more significant effect on
Ez,
H and
S have a more significant effect on
Gxz, and
V has a more significant effect on
Gyz, which are in accordance with the trend of mechanical properties of V-type folded cores with different geometric parameters obtained in
Figure 12. According to the different mechanical properties needed, the design of specific geometric parameters can be addressed.
7. Conclusions
VFC is a three-dimensional configuration formed by simple folding, which is a configuration with excellent mechanical properties and can withstand certain pressures and shear forces. This article studied the analytical solutions of the elastic modulus and the shear modulus belonging to VFC. The equivalent mechanical properties of VFC can be determined using the equivalent load–equivalent deformation principle. The analytical solutions are provided for the calculation of structural performance in engineering. The folded cores with different geometries are designed and numerically simulated by Nastran. Comparing the analytical solutions with the numerical solutions, the lower error percentages prove the reliability of the analytical solutions. In addition, VFC is filled into the wing box segment for analysis, and the deformation of the box filled with VFC and filled with an equivalent solid are compared under different load cases, thus the reliability of the equivalent mechanical properties of VFC is further verified. The derivation of the analytical solutions of VFC simplifies the optimization process and eliminates the complicated modeling process, which is very helpful for the optimization of the folded core in aircraft design.
The paper analyzes V-type folded cores with the help of numerical simulation and verifies the reliability of the analytical solution for their mechanical properties. However, due to the workload limitation and operational difficulty, no experimental approach was taken to produce different structural configurations for secondary verification. For the verification of the analytical solution, the number of working conditions can also be increased. In addition, V-type cores are not the only type of folded cores, and other types of folded core configurations could be investigated.


