Article

Assessment of Future Airframe and Propulsion Technologies on Sustainability of Next-Generation Mid-Range Aircraft

1
Institute of Aircraft Design and Lightweight Structures, Technical University Braunschweig, 38106 Braunschweig, Germany
2
Institute of Fluid Mechanics, Technical University Braunschweig, 38106 Braunschweig, Germany
3
Computational Engineering and Design Group, Department of Aeronautics and Astronautics, University of Southampton, Southampton SO17 1BJ, UK
*
Author to whom correspondence should be addressed.
Aerospace 2022, 9(5), 279; https://doi.org/10.3390/aerospace9050279
Submission received: 30 March 2022 / Revised: 15 May 2022 / Accepted: 16 May 2022 / Published: 23 May 2022
(This article belongs to the Special Issue Aircraft Design (SI-4/2022))

Abstract

:
The present work demonstrates the impact of future airframe and propulsion technologies on the sustainability of potential future medium-range commercial jets with design specifications similar to the Airbus A320-200. Advanced airframe and engine technologies include laminar flow control (LFC), active load alleviation, new materials and structures, and ultra-high bypass ratio turbofan engines. Two aircraft configurations with various design options were compared to determine potentially the best option for the mission profile, which tends to minimize the environmental impact. Each configuration was designed to balance the equivalent CO2 emissions and Direct Operating Costs. Technology sensitivity analyses were performed to investigate the significance of particular technology combinations and determine the ones that improve aircraft sustainability the most. All studies were performed at a conceptual design level using a multi-fidelity design approach to investigate the system-level effects of the technologies. The open-source aircraft design environment SUAVE was extended and integrated with other aircraft design and analysis tools to obtain all required correlations. The aircraft with advanced technologies showed an average reduction in equivalent CO2 emissions of 36% and a 23% reduction in DOC compared to the reference aircraft for a similar mission profile, although aircraft with future technologies may have a 43% higher production cost. The given results indicate that the application of technologies may be commercially successful if technologies achieve expected performance values, despite high development costs. Finally, the technology sensitivity analysis demonstrated the most significant influence of engine-related technologies and laminar flow control compared to other technologies considered in this research. Depending on design and integration complexities, engine technologies can be more achievable in the near future and can substantially reduce the overall emission level.

Graphical Abstract

1. Introduction

Significant climate changes and potential environmental impacts due to increased transportation in the near future have motivated many industries to reduce emissions. As a major transportation method, the aviation industry has also established the goal of reducing the emissions of new generations of aircraft. Improvements in current airframe and engine technologies continue, increasing aircraft efficiency and reducing their overall emissions. However, a potential increase in air transportation may still lead to a substantial increase in overall emissions, even if existing technologies reach their maximum efficiencies. Flightpath 2050 [1] proposed challenging emission levels that shall not exceed the reference year of 2010 with the transportation volumes of the future. Given goals are unlikely to be met using existing technologies and aircraft concepts, so the development of alternative environmentally friendly energy sources, new aircraft concepts and technologies, and more sustainable flight mission profiles are required to achieve significant reductions in aircraft emissions.
Based on the results provided by Epstein and O’Flarity [2], single and twin-aisle aircraft consume the most amount of fuel per year, so they create the majority of emissions. Consequently, improvements in fuel burn for either middle or long-range aircraft segments may significantly affect the aviation sector’s overall environmental impact.
Improvements in airframe technologies and novel aircraft concepts play an important role in the overall system’s sustainability. Xu and Kroo [3] implemented load alleviation and natural laminar flow (NLF) in Boeing 737-800 to demonstrate fuel savings of 18% compared to the conventional aircraft version. The NASA-MIT D8 ’DoubleBubble’ concept that featured boundary-layer ingestion (BLI) and active load alleviation showed fuel burn reduction by 70% compared to the B737-800 [4,5]. Welstead and Felder [6] investigated a single-aisle commercial aircraft that featured a turbo-electric propulsion system with BLI for the aft-mounted engine. The new aircraft improved the design mission by 12% compared to a conventional configuration. Seitz and Gologan [7] investigated a ’Propulsive fuselage’ aircraft concept that featured three engines, one of which was aft-mounted and utilized the BLI. The results showed an improvement in the energy-specific air range of up to 20% compared to a conventional configuration. Under the TuLam project [8], DLR designed a medium-range aircraft that featured an NLF wing and demonstrated a 12% reduction in fuel burn compared to an A300-200 reference aircraft. The Truss-braced-wing concept introduced by NASA and MIT with hybrid-electric propulsion has a 70% fuel burn reduction at a very low range condition [9]. Saeed et al. [10], from Cambridge University, have designed a flying wing concept with laminar flow control and concluded that with 84% of the total wetted area being laminarized, they had achieved 70% fuel savings when neglecting the system penalties. Karpuk et al. [11] demonstrated an initial conceptual design of a Blended-wing-body (BWB) aircraft that featured hybrid laminar flow control (HLFC), active load alleviation, BLI, and advanced materials and structural concepts. The presence of novel technologies in the aircraft improved the fuel burn by 59% compared to a reference B777 aircraft. Liu [12] provided initial estimations of the impact of novel technologies for a range of aircraft from the short-range to the long-range, and Karpuk [13] investigated the effects of airframe technologies on the feasibility of short-range regional aircraft and assessed the emission and cost effects from applications of airframe and propulsion technologies. The initial design with airframe technologies was performed by Karpuk for a specific design with a conventional mission profile and the aircraft that fully followed certification constraints and was designed for minimum fuel burn [14]. Ma [15] performed a conceptual design of ultra-high aspect ratio strut-braced and twin-fuselage aircraft with hybrid laminar flow control, load alleviation, and advanced structures to investigate potential aircraft efficiency improvements of such aircraft. The assessment was performed for various market categories starting from short-range regional to long-range trans-Atlantic aircraft. The fuel burn reduction in the order of 30–40% relative to reference aircraft in each category was achieved.
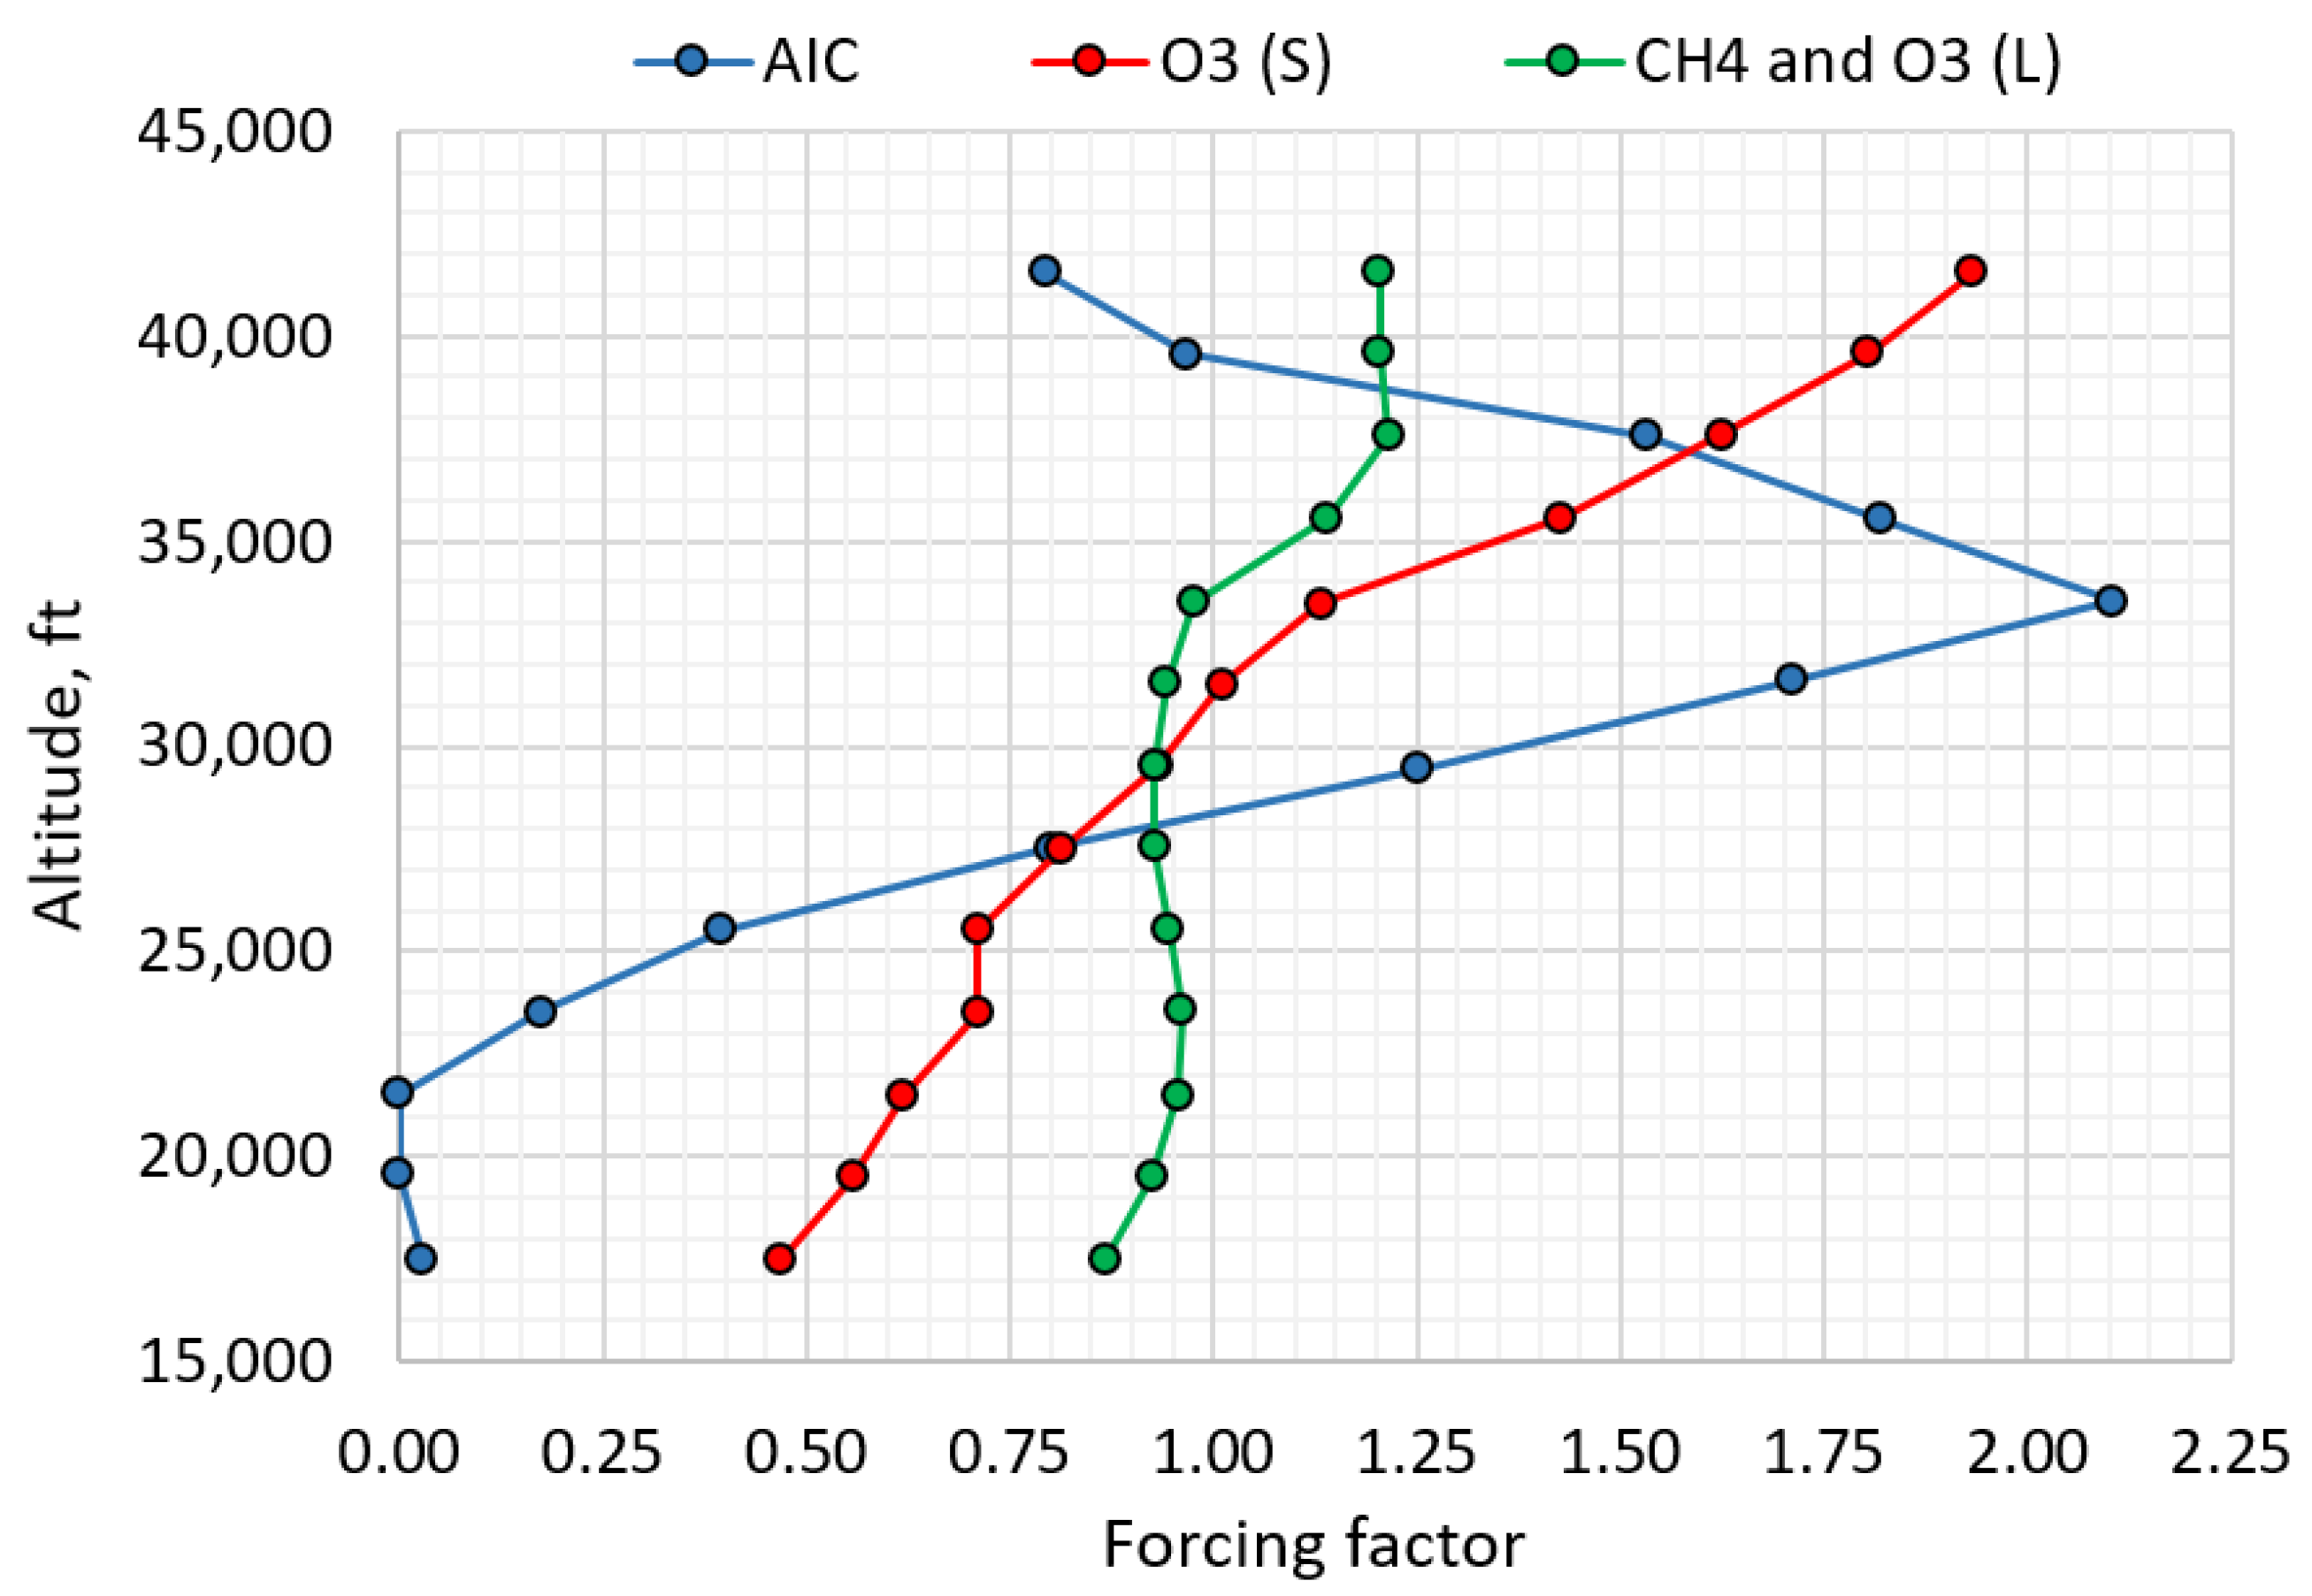
Although aircraft technologies play a significant role in the reduction of overall emissions, the problem of flight altitude generates a significant difference between emissions of aircraft and other means of transportation. Although aviation shares only 2.8% of total emissions [16], the altitude at which the emission happens significantly affects the global warming potential. Emission components, such as NOx and water vapor, which creates contrail and cirrus clouds, highly depend on the altitude [17]. At the typical cruise altitudes of modern commercial jets, the atmospheric forcing of these components significantly surpasses the emission of CO2 [18], although such altitudes correspond to the most efficient fuel flight levels with respect to costs for typical flight missions. Therefore, a combination of aircraft technologies and flight mission profiles is essential to achieve a substantial reduction in overall emissions and acceptable changes in aircraft operating costs.
Under the Research Cluster of Excellence SE2A (Sustainable and Energy Efficient Aviation), several future technologies that may significantly improve aircraft energy efficiency have been considered for the design of future transport aircraft. The research goal of the SE2A project is to advance a selected set of airframe and propulsion technologies, investigate their combined influence on the emission reduction of civil aviation and suggest potential aircraft configurations that minimize the environmental impact. The following airframe technologies are identified in the SE2A project for detailed investigation: laminar flow control (LFC), load alleviation, and advanced materials and structure concepts. Further, ultra-high bypass ratio turbofan engines have been considered for the present research.
The objective of the present research article is to investigate the potential effects of those technologies on the overall energy efficiency of a medium-range commercial aircraft similar to the Airbus A320. Multiple questions will be answered in the present work:
  • Given that technologies reach desired performance levels, what aircraft variant of a conventional tube-and-wing aircraft may give the highest emission reduction with acceptable changes of DOC?
  • What flight conditions for each of the considered configurations help achieve minimum emission and applicable DOC with the account of future technologies?
  • How significantly does each technology affect the aircraft sustainability, and which of them show the highest emission reduction?
The present work is divided into multiple sections. Section 2 describes future technologies implemented in the new mid-range aircraft and a range of technology assumptions based either on existing studies or cluster goals. Section 3 describes the methodologies, models, design assumptions, and software used to perform technology assessments to size aircraft. Section 4 describes the conceptual design of two configurations and investigates the potentials of each configuration with respect to emission reduction and DOC values. Finally, Section 5 performs sensitivity analyses of aircraft emissions and operating costs to technology deviations from desired goals.

2. Advanced Airframe and Propulsion Technologies

2.1. Laminar Flow Control

The generation and extension of laminar flow over the aircraft surface significantly affect the overall aircraft drag, reducing aircraft masses, fuel burn, and operating costs. Preliminary estimations of an aircraft that features extended laminar flow along the wing, empennage, and fuselage demonstrated significant reduction (up to 50%) in overall drag and proved the importance of laminar flow control [19].
Two approaches can be applied to extend the laminar flow. Natural laminar flow (NLF) uses only geometric shaping to extend the proverse pressure gradient as much as possible and, as a consequence, the laminar flow. A significant amount of numerical and experimental research regarding NLF technologies has been done over the last fifty years [20]. Furthermore, Seitz [8] demonstrated a combination of the NLF airfoils and a forward-swept wing to be able to maximize the NLF for commercial aircraft. However, two significant disadvantages exist for the NLF. First, the surface quality needs to be exceptionally high to avoid large gaps or excessive waviness, which may lead to early transition [21]. Moreover, it is not always possible to maintain a sufficiently favorable pressure gradient as much as desired due to geometric limitations. To extend the laminar flow as much as possible, active flow control (AFC) techniques can be used. In this scenario, suction of the boundary layer from the surface is applied, as shown in Figure 1a. Here, the airfoil skin features micro-holes that suck the boundary layer from the surface and prevent the transition. Ideally, if enough suction power is delivered to the porous surface, the flow can maintain laminar until the control surface. Finally, to maximize the benefits of both solutions, hybrid laminar flow control (HLFC) technology, where NLF and AFC are combined, can be used. The present research focuses on assumptions related to the application of the HLFC technology.
The effect of HLFC was investigated by multiple researchers. Beck [19] demonstrated simulations with the ability to achieve laminar flow until 80% chord and 50% of the fuselage. Risse [22] applied HLFC technology estimation methods for the conceptual design of a transonic aircraft and demonstrated an 11% reduction in fuel burn. The leading-edge suction system managed to extend the laminar flow between 30% and 50% of the chord, depending on the spanwise location. Sudhi [23] demonstrated applications and airfoil optimization of an HLFC airfoil for subsonic speeds with the ability to extend the laminar flow until 80% chord if suction is applied. Suction is applied closer to the middle of the airfoil while the front portion is treated as an NLF surface. A similar HLFC technology was applied for the multidisciplinary design optimization of the wing by Mosca [24] to deeper investigate the HLFC effect on the aircraft design. For transonic aircraft, Sudhi [25] demonstrated an application of the HLFC at the leading edge, which is potentially capable of extending the laminar flow until the location of the shock (which may reach up to 65% chord) for the airfoil’s upper surface and until 60% chord for the bottom surface.

2.2. Load Alleviation

Load alleviation introduces various techniques to reduce the wing bending moment using passive or active approaches. The reduction of maximum bending moment enables the design of lighter wings for lower limit load factors, which will improve aircraft fuel efficiency.
Passive load alleviation solutions consider a nonlinear stiffness material design [26], viscoelastic damping design, new structural concepts [27,28], and local morphing structures [26]. Nonlinear stiffness materials may improve the load distribution on the wing under low load cases and improve performance efficiency under those conditions.
For viscoelastic damping composites, the viscoelastic layer experiences shear deformations under vibration loads due to gusts or flight maneuvers. Consequently, some vibration energy is dissipated so that the structure can be designed for lower limit loads. Finally, both aeroelastic tailoring and local morphing structures aim to extend the aeroelastic design space. Morphing is considered in two scenarios: deliberate structural non-linearity that affects the wing deformation and reduces the wing section’s effective angle-of-attack under the load and change in airfoil shape to achieve load reduction. The wing active load alleviation uses different types of flow control over the wing to achieve a more favorable wing load distribution and reduce the wing bending moment. Previously, researchers have approached the design of active load alleviation systems in different ways. Sun et al. [29] looked at active load alleviation from the control system perspective, and Zing et al. [30] demonstrated experimental results of a high aspect-ratio wing wind-tunnel test with active load alleviation while using piezoelectric control. The work of Fezans et al. focused on novel sensors and control systems technologies to enable rapid and robust active load alleviation [31,32]. Finally, active load alleviation could also be achieved by fluidic or micro-mechanical flow actuators that change the load distribution along the wing and reduce the bending moment [33].

2.3. New Materials and Structure Concepts

Novel structural concepts and materials are being developed to improve the aircraft structure in terms of stiffness and mass. Materials may include carbon nanotube (CNT). Further, tow-steered composites may be considered for further research. The forecast of the NASA N+3 project [4] reported the potential reduction of the airframe mass by 30% if the desired composite performance is reached. Brooks [34] performed an aero-structural optimization to investigate potential improvements in the aircraft mass if tow-steered composites are used. The structural mass reduction could be 24% compared to conventional composite materials. For structure concepts, Bishara [35] describes advanced structural design with the integration of active flow control, which is directly applicable to the presented research.

2.4. Ultra-High Bypass Ratio Turbofan Engines

To improve the Specific Fuel Consumption (SFC), an engine with an ultra-high bypass ratio (UHBPR) was considered. The potential capabilities of such engines were shown by Giesecke [36], where the one was designed for a short-range regional aircraft. Engine sizing demonstrated the capability of achieving a 21% reduction in SFC compared to a conventional turbofan engine, which gives significant potential to this technology. Therefore, this engine type will be considered in the present work as well.

3. Implementation of Novel Technologies in Aircraft Analysis and Design

3.1. Initial Aircraft Sizing

The aircraft sizing process is divided into two major steps, as shown in Figure 2. The first step performs the initial sizing of aircraft by combining the constraint analysis implemented in SUAVE and the default SUAVE mission analysis routine. After the aircraft is initially sized, the analysis and optimization block is used for aircraft refinements. The present section describes the methodology used in both design modules.

3.2. Initial Sizing Block

An initial sizing block was developed as a separate analysis capability to strengthen default SUAVE mission analysis capabilities. The initial sizing block consists of the constraint and mission analyses combined together in one sequence. Multiple steps are required to size the aircraft. First, the user specifies top-level requirements necessary for the constraint diagram, such as the cruise altitude and speed, turn angle, take-off ground roll, and climb rate. In addition, the designer specifies the initial aircraft configuration and important metrics, such as the wing aspect ratio, wing sweep, taper ratio, average thickness, and the type and relative size of high-lift devices. However, the fuselage needs to be sized according to the required cabin volume before the initial sizing. Initial parameters for the empennage could be obtained using classical recommendations from Refs. [37,38,39,40]. The initial aerodynamic and mass inputs, such as maximum take-off mass (MTOM) and the maximum zero-fuel mass (MZM), can also be estimated using classical textbook estimates or based on known parameters of similar aircraft. Finally, the mission profile is defined by the designer. After the initial input is created, SUAVE performs the first calculation of the constraint diagram. After the constraint diagram is created, the code searches for the minimum thrust-to-weight ratio for a user-specified wing loading ratio with respect to the maximum feasible one. After the design point is selected, the SUAVE mission analysis is initiated to calculate the total mission fuel. The new MTOM is calculated based on obtained fuel mass and calculated empty mass, which depends on geometry. The difference between the old and the new MTOM is checked for tolerance. If the tolerance value is not achieved, then the new geometry is updated using the given design point and basic geometric relations. Moreover, physics-based take-off and landing analyses using the methods of Gudmundsson [38] are used to calculate the field performance more accurately and extract the information about the low-speed aerodynamics. Then, the new geometry with aerodynamic values obtained during the mission analysis is passed to the constraint analysis block to update the constraint diagram and search for the new design point. The new design point is then used to resize the aircraft geometry again and repeat the iteration. The sizing is finished when the difference between the masses reaches the tolerance.

3.2.1. Constraint Diagram

The equations defined by Gudmundsson [38] and Loftin [41] are used to calculate the constraint diagram. Within the constraint analysis script, the estimation of high-lift devices’ aerodynamics is performed using the methods of Torenbeek and Roskam [39,40] to have the capability to use various types of high-lift devices. Various models to simulate the effect of altitude on the turbofan thrust are also implemented into the constraint analysis to enable more flexibility for the model calibration with respect to reference aircraft. The Oswald efficiency required for the constraint diagram is estimated using the method introduced by Nita and Scholz [42] to account for the wing sweep, taper, and aspect ratio. To enable a wide range of applications, the factor responsible for the compressibility drag adjusted for modern aircraft was ignored, and the compressibility drag method of [43] was used.

3.2.2. Wing Planform Definition

Two planform definitions are possible within the sizing algorithm. If the kink is not expected for the designed wing, classical formulations for a straight tapered wing can be used to fully define the planform. If the wing features the kink, and its location along the wingspan is prescribed by the designer, the planform with the kink can be full-sized using the methodology described in Appendix B. The present research utilizes both methods depending on the aircraft configuration.

3.2.3. Aerodynamics

Aerodynamic analysis was performed using a combination of semi-empirical methods for the parasite, compressibility, and miscellaneous drag, while the vortex-lattice AVL software [44] was used for the induced drag estimation. The parasite drag model uses the laminar-turbulent flat plate analogy described by Gudmundsson [38], while compressibility drag is defined using the method of Shevell [43].

3.2.4. Mass Estimation

The FLOPS [45] method is used to calculate the aircraft’s empty mass. In addition, to account for unconventional aircraft wing geometric characteristics, such as high aspect ratios, a physics-based EMWET method [46] was implemented within SUAVE. Further, possible cases of wing folding and corresponding wing mass penalties were taken into account using the method of Yarygina [47]. The method accounts for the masses of the folding insert, the pin that connects two wing parts, and the mechanism that performs the folding.

3.2.5. Propulsion

The gas turbine energy network is modeled using a physics-based approach, where each engine component features particular characteristics and a cycle analysis is performed. Ref. [48] describes the definition of the turbofan energy network in more detail.

3.3. Design Refinement Block

After the initial sizing is finished and the design point is selected, the obtained aircraft characteristics are passed to the design refinement block, where all required performance analyses, tail sizing, emission analysis, and aircraft balancing are performed. Moreover, the design refinement using multidisciplinary design optimization (MDO) can also be used. Performance analyses include take-off and landing time-marching analysis using the method of Gudmundsson [38], climb performance, the cruise flight envelope, descent, and a payload-range diagram.

3.3.1. Tail Sizing

The tail sizing is based on the fixed tail volume ratio selected using typical values for a given aircraft type. The refinement of the tail sizing after the SUAVE initialization is performed manually and accounts for required trim and CG envelope requirements. The aerodynamic analysis for the tail sizing refinement is performed using AVL [44].

3.3.2. Costs Analysis

The cost analysis is performed to estimate the aircraft’s Direct Operating Costs (DOC) and compare them with the reference aircraft. The DOC estimation is performed using relations used by Hoelzen [49]. The DOC is divided into energy, maintenance, capital, crew costs, and fees and is defined by
D O C T o t a l = D O C E n e r g y + D O C C r e w + k g D O C M a + D O C C a p + D O C F e e s
where k g is the maintenance gain factor that accounts for the maintenance complexities of advanced aircraft with new technologies. At the moment, it is uncertain how large k g can be. In addition, it is unclear what load alleviation and structure concepts will be used to maximize aircraft performance. These factors may significantly increase the aircraft maintenance cost and must be considered when more information about potential maintenance complexities becomes available. However, at the moment, a cost gain factor of 2.0 was assumed, so maintenance costs are twice as expensive as conventional aircraft maintenance costs. A total of 2000 flight cycles per year were assumed for the aircraft being investigated. To have a valid comparison of both aircraft, the target year 2050 and the reference year 2020 were used for all rates used in the DOC estimation equation. Fuel cost was estimated using forecasts of 2050 from Ref. [50] for conventional Jet-A fuel and a potential extra carbon tax of 0.42 EUR/kg [51] that may reach the value up to 1.07 EUR/kg, while labor costs and fees were taken from the reference year of 2010 and were corrected by the inflation factor with respect to the year 2020. The airframe price used for the capital cost estimation was calculated using the method of Roskam [40], where all parameters related to design complexity and material cost gains were maximized to model the design difficulty of new aircraft development.

3.3.3. Emission Analysis

Emission analysis is an additional block that was implemented into SUAVE to increase its capabilities. The analysis is performed using methods defined by Scholz [52]. The overall effect of the emission on global warming is estimated using the equivalent CO2 emission m C O 2 , e q , which accounts for the effect of NOx, contrails, and cirrus clouds. Since the emission of gas turbine engines highly depends on the altitude at which the emission takes place, the emission model was integrated into the SUAVE mission analysis to calculate local emissions at each point during the mission. The equivalent gas turbine emission for an incremental distance is defined by
m C O 2 , e q , G T i = ( E I C O 2 f k m + E I N O x f k m C F m i d , N O x + C F m i d , A I C ) Δ R k m
where E I C O 2 is the emission index equal to 3.16 and E I N O x is calculated using the Boeing Method 2 [53]. Δ R k m represents the incremental range in km, f k m is the local fuel flow rate in kg per km, and C F m i d is the correction factor to convert the value into the equivalent CO2 emissions defined by
C F m i d , N O x = S G T P O 3 s , 100 S G T P C O 2 , 100 s O 3 s + S G T P O 3 L , 100 S G T P C O 2 , 100 s O 3 L + S G T P C H 4 , 100 S G T P C O 2 , 100 s C H 4
C F m i d , A I C = S G T P c o n t r a i l s , 100 S G T P C O 2 , 100 s c o n t r a i l s + S G T P c i r r u s , 100 S G T P C O 2 , 100 s c i r r u s
where S G T P is the sustained global temperature potential, and s is the forcing factor, which depends on the altitude. The values of S G T P and s are provided by Dallara [17] and are shown in Table 1 and Figure 3, respectively.
After calculating the equivalent emissions for each mission increment, the total gas turbine emission is computed by adding all increments together.
It is important to note that the aircraft-level emission does not represent the complete environmental impact picture since the fuel needs to be obtained and delivered to the destination to be used. According to Pavlenko [54], the equivalent CO2 emission of petroleum-based jet fuel ranges between 85 to 95 grams per megajoule of fuel, with about 73 g CO2e/MJ attributable to fuel combustion and the remainder to fuel extraction, processing at refineries, and transportation. That gives around 22% extra emission level if the complete life cycle is considered. Therefore, the overall equivalent CO2 emission for the whole mission with the additional correction for production and transportation becomes
m C O 2 , e q , G T = 1.22 i = 1 N R m C O 2 , e q , G T i

3.3.4. Multidisciplinary Design Optimization Module with MATLAB

The Multidisciplinary Design Optimization MATLAB package was connected to SUAVE to perform all required design optimization studies. The choice of MATLAB was motivated by a relative ease of methods implementation and robustness of its methods. For all optimization studies in the present work, the Genetic Algorithm was used for the optimization to avoid difficulties with potential design space discontinuities. To account for the constraints in GA, the penalty function similar to one defined in [55] was used. The penalty function is defined by
f p = μ ( y y c ) y y c 3
where y is the design variable, y c is the design variable constraint, and μ is the unit step function equal to zero for y y c . With the introduction of the penalty function, the objective function becomes
f = f + i = 1 N f p
where N is the total number of design variables. The number of species for each optimization study depends on the optimization problem and the number of design variables.

3.4. Validation of the Initial Sizing Block

To ensure that the initial sizing methodology is working correctly, a validation case was performed for the reference A320-200 aircraft. The harmonic range (the range at the maximum possible payload) mission was simulated in SUAVE using a limited amount of information: the mission profile, wing sweep, taper ratio, kink spanwise ratio, engine characteristics, wing loading, and field performance. Geometric characteristics and essential masses of A320-200 were obtained from Ref. [56], while important characteristics of the CFM56-5B engine were obtained from the EASA certification data sheet [57]. Figure 4 shows the mission profile used for the A320-200 simulation. The validation is performed using multiple important criteria: the wing planform shall converge to the one similar to the reference aircraft, aircraft masses shall be similar to reference masses, the field performance shall be similar to the one reference aircraft, and the design thrust-to-weight ratio for the given wing loading shall be within the design space computed with the constraint analysis.
Figure 5 shows the constraint diagram calculated using the initial sizing capability implemented into SUAVE, the reference design point of A320, and the design point calculated using SUAVE. Figure 6 compares the calculated and reference planforms and Table 2 compares aircraft masses, thrust, and field performance. Observing the constraint diagram, the design space is limited by three lines: the take-off line, the landing field length constraint, and the wingspan constraint line, which appears as constraint based on ICAO Annex 14 regulations [58] of 36 m. For a given aircraft wing loading, a combination of aircraft weight and wingspan for a given aircraft aspect ratio may reach an unacceptable value that prevents the applicability of this design point. Therefore, although the original design space excluding the wingspan constraint is substantially larger, the span constraint significantly limits the actual design space. Regarding the planform, weights, and performance results, minor differences were observed. The only tangible difference is related to the landing distance, which may be the consequence of the landing analysis simulation methodology. For the landing analysis, the time-marching solution with recommended constant values provided by Gudmundsson [38] was used. Assumptions of reverse thrust, as well as the touch-down and flare distances, may significantly affect the overall landing field length. Consequently, minor analysis deviations from the reference aircraft are expected and need to be taken into account during the conceptual design phase. Overall, a good agreement was reached for the reference aircraft sized using SUAVE.

3.5. Technoology Modeling

To model the effect of advanced airframe and propulsion technologies within the design environment, several modifications based on either available research outcomes of previous studies or cluster design goals were performed. The present subsection will describe the key assumptions of each implemented technology.

3.5.1. Laminar Flow Control

The modeling of laminar flow was performed using existing flight test data and several numerical studies of previous and current research projects. Figure 7 shows a summary provided by Hepperle [20] and also includes data from the TuLam project [8] and recent numerical results of Sudhi [25] for the HLFC airfoils. Hepperle also provides approximate trend lines for the bounds of NLF and HLFC transition Reynolds number as a function of the wing leading-edge sweep. The curve fit of this data was used within SUAVE to calculate the transition location on the wing and empennage during the aircraft sizing process. Both trend lines were can be described using the following relation
R e T 10 6 = 4.444 · 10 6 Λ L E 4 + 3.855 · 10 4 Λ L E 3 1.888 · 10 2 Λ L E 2 + 3.519 · 10 2 Λ L E + 29.965 , HLFC bound 1.141 · 10 2 Λ L E 2 0.139 Λ L E + 22.212 , NLF bound
where Λ L E is the wing leading edge sweep.
The fuselage laminarization was assumed to be provided by the porous skin until the wing-body fairing, so the fuselage surface upstream of the wing has laminar flow. The amount of the fuselage laminar flow depends on the wing positioning, which is determined during the sizing, estimation of the CG envelope, and allocation of all critical aircraft components and systems.

3.5.2. Advanced Materials and Structure Concepts

Given the existing approximations of the effect of advanced materials, an assumption of 19% airframe mass reduction with respect to current metallic designs was assumed. Such assumption includes the wing, fuselage, and empennage. However, in the case of the forward-swept configuration, a more conservative consideration of 9% airframe reduction was considered since studies of the LamAir project [59] showed that a CFRP forward-swept wing has masses similar to a metallic one. Given further advancements in materials, the assumption of 9% was derived.
An additional consideration was taken to estimate the effect of the suction system mass on laminar flow. Kalarikovilagam [60] and Iyer [61] performed preliminary sizing of vertical and horizontal stabilizers of mid-range and long-range commercial jets using the physics-based approach and also performed design trade studies with respect to the number of compressors required for the suction system. Studies showed that horizontal and vertical stabilizers correspond to 0.11% and 0.16% of the empty mass, respectively, for two airplanes of different classes. Given the existing information, the wing suction system weight can be estimated by using the following proportion
m s u c , w i n g S s u c , w i n g = m s u c , e m p e n n a g e S s u c , e m p e n n a g e
where m s u c , w i n g and m s u c , e m p e n n a g e represent the suction system weight for the wing and the empennage, respectively, while S s u c , w i n g and S s u c , e m p e n n a g e are wetted areas where the suction is applied for the wing and the empennage. Knowing the empennage suction system weight and the area covered by the suction system, the wing suction system weight can be found.
Suction systems mass estimations for fuselages of sizes of commercial aircraft have currently not been reported. Consequently, it can be assumed that the suction system mass is proportional to the suction system wetted area ratio and then can be used for the fuselage suction system mass estimation. However, a high-fidelity aerodynamic simulation of the fuselage with suction performed by Beck [19] and a two-dimensional simulation of the airfoil with the leading-edge suction performed by Sudhi [25] demonstrated significant differences in the suction coefficient requirement. Observing the fuselage suction simulation in Figure 8, a rather conservative constant suction coefficient of 1 × 10⁻⁴ can be assumed if the fuselage suction profile is assumed as a uniform profile instead of the one with the lower suction velocity ratio downstream of the fuselage. Note that for a typical airfoil with the leading-edge suction, the suction coefficient is 4.5 × 10⁻⁴. That leads to the preliminary conclusion that the suction ratio between the fuselage and wing is in the order of 0.22 and will affect the compressor, tubing, and electrical system masses. An additional simplifying assumption of the suction system mass being proportional to the ratio of suction velocities coefficient was considered along with the area ratio. Knowing the wetted area covered on the wing and its corresponding mass, the fuselage suction system mass was scaled with respect to the wing system mass according to the wetted area ratio and the suction coefficient ratio, so
m s u c , f u s e = K F S s u c , f u s e S s u c , w i n g m s u c , w i n g
where S s u c , f u s e represents the wetted area of the fuselage covered by the suction system, and K F is the suction velocity ratio between the fuselage and the wing equal to 0.22.
An additional mass estimation must be provided to estimate the potential mass penalty of the fuselage suction skin. The fuselage must have two shells: the porous shell, which is responsible for the boundary layer suction, and the structural shell, which carries loads and covers the cabin. To account for extra skin mass, the fuselage skin mass was increased by 15% with respect to its metallic analogy to account for a potential range of mass gains between 10% and 20%. The skin mass is found by
m s k i n , f u s e = K s u c t s k i n m f u s e ρ m a t π D f u s e L s u c , f u s e
where K s u c represents the skin-mass gain equal to 0.15, ρ m a t is the fuselage material density, D f u s e is the fuselage equivalent diameter, L s u c , f u s e is the length of the fuselage portion covered by the suction system, and t / c is the fuselage skin thickness, which can be estimated as a function of the fuselage mass. This way, the skin thickness is proportional to the aircraft size. Fuselage skin thickness is based on information found in the textbooks of Niu and Obert [62,63] where A320, B757, and B747 were defined as a function of the fuselage mass, as shown in Figure 9. Skin thickness as a function of the fuselage weight is then defined by
t s k i n = 3.2468 · 10 8 m f u s e l a g e + 7.5938 · 10 4
where m f u s e l a g e is the fuselage mass.

3.5.3. Load Alleviation

Load alleviation possibilities were taken into account via reducing the limit load factor from 2.5 obtained using CS 25.337 [64] to 2.0. These numbers assume that load alleviation can counter gust and maneuver loads by at least 20%, while flight safety in the case of load alleviation system failure is retained by assuming safety factors similar to conventional aircraft.

3.5.4. UHBPR Engines

To model the UHBPR engine, the conventional physics-based engine model of SUAVE was used. However, to include the benefits of a higher bypass ratio, the engine SFC gain of 21%, similar to results obtained by Giesecke [36], was implemented. Moreover, according to the final results of Giesecke, the nacelle diameter was increased by 30% compared to a conventional engine.

4. Design of the SE2A MR Aircraft

The goal of the present study is to evaluate the potential of a new-generation aircraft with advanced airframe and propulsion technologies to minimize its environmental impact. Aircraft emissions can be reduced using two approaches: by improving the overall aircraft efficiency and minimizing the fuel burn and by modifying the mission profile such that emission components, such as contrails, are reduced. Several researchers [18,65] emphasized that contrails significantly affect the overall equivalent emission. Therefore, the present work considers a different flight altitude and cruise speed as a design point for low emission while sufficient flexibility of aircraft operation must be maintained. For the present design, the altitude margin of 7650 m was assumed to ensure that the aircraft is capable of flying above the majority of clouds. The aircraft shall also be able to climb to higher altitudes to be operationally flexible. The true cruise speed at the reduced altitude was assumed to be 5% lower than a typical cruise speed at the altitude of 10500 m and the Mach number of 0.78. The constraint on the cruise speed of an eco-design mid-range aircraft was driven by the assumption that the turnaround time between the flight could be optimized by future technological advances in aircraft operations.
Finally, current ICAO Annex 14 [58] category C regulations for aircraft of a similar class have a strong limit on the aircraft wingspan of 36 m, which limits the application of aircraft to a particular set of airports. The present study, therefore, considers cases with a wing folding mechanism as well as an optimistic scenario of a relaxed wingspan regulation.
For the remaining design requirements, such as the harmonic range, reserve requirements, and field performance, values similar to the reference Airbus A320-200 were used. Table 3 shows the summary of the SE2A MR top-level requirements.

4.1. Concept Definition

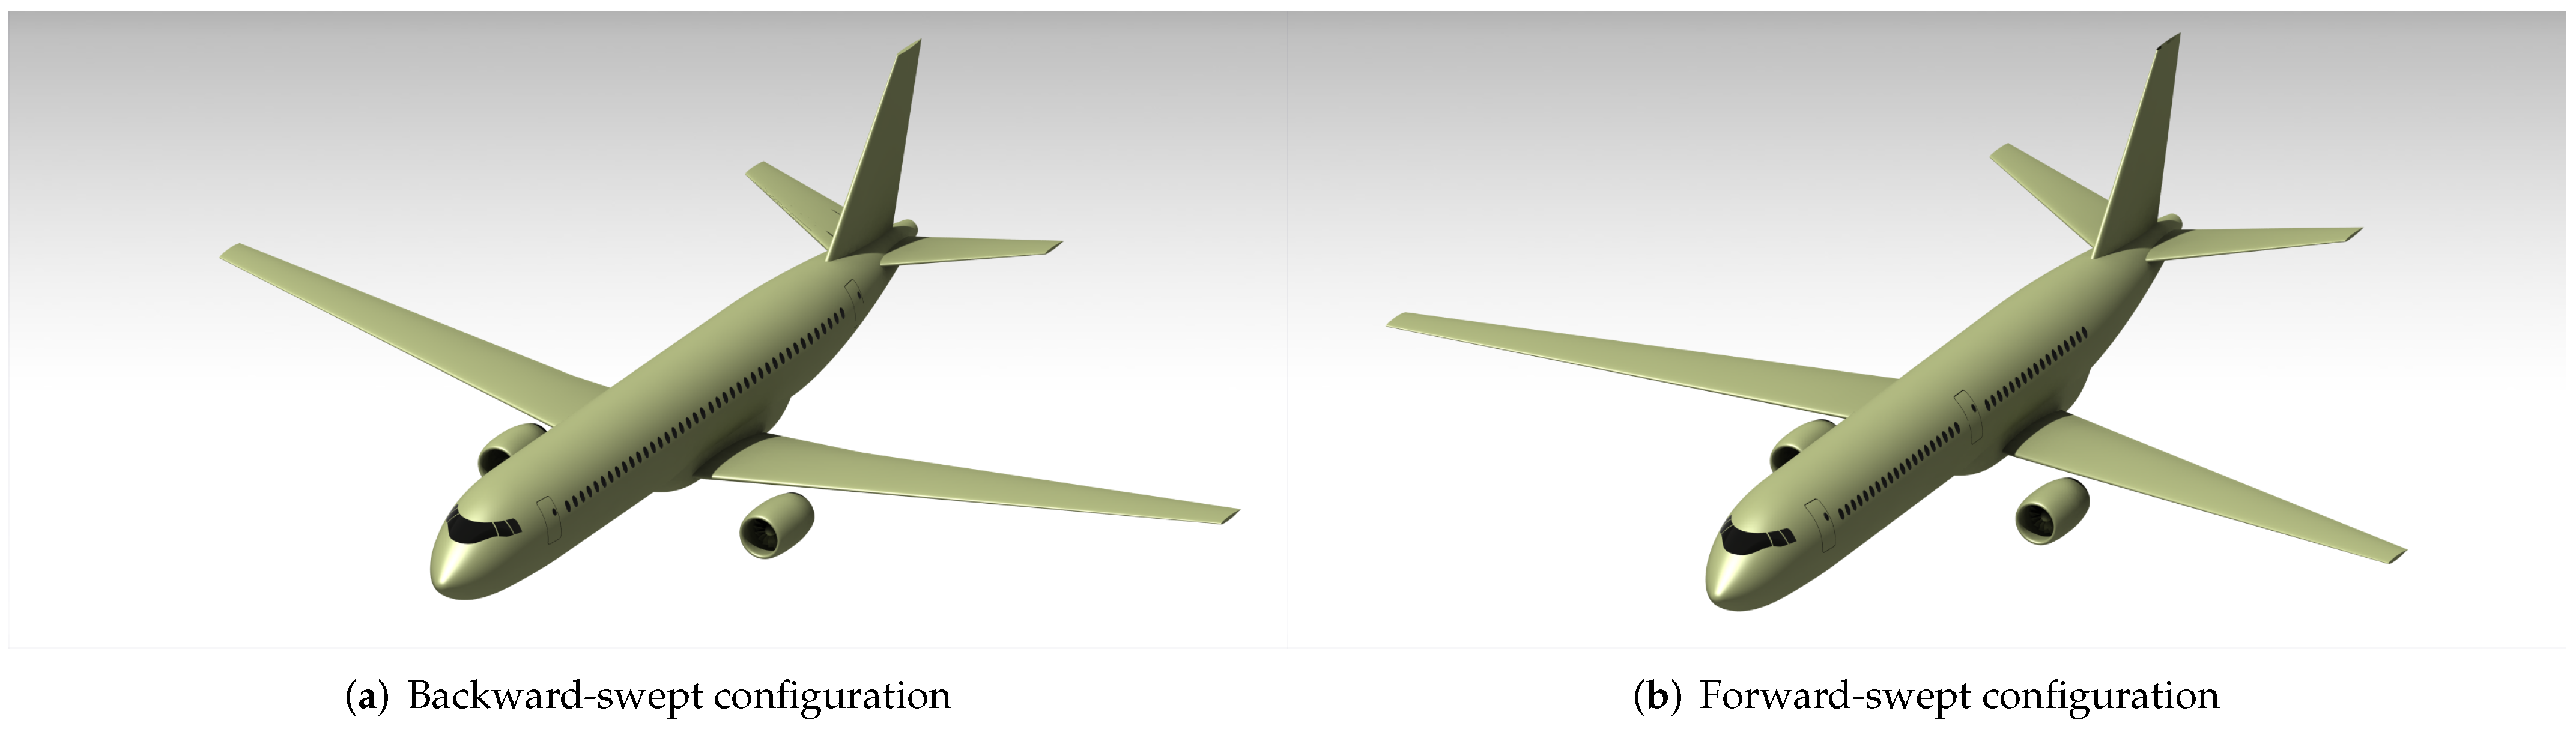
For the present study, two tube-and-wing concepts were considered: the forward-swept wing with NLF and the backward-swept wing with HLFC. Both configurations have a significant difference in their capabilities for applying advanced technologies. The forward-swept concept has a low leading-edge sweep, which enables the possibility of including NLF instead of the leading-edge suction. At the same time, a high half-chord sweep enables a reduction of compressibility drag. Moreover, the wing-body fairing is located further downstream of the fuselage, which enables more fuselage laminarization. Note that the forward-swept wing is prone to aeroelastic divergence, which increases its mass. However, studies of the LamAir project [59] demonstrated that it is possible to tailor the wing such that its mass does not exceed the metallic one. Therefore, given the assumption of advanced technologies, the structural mass reduction of 9% instead of 19% was assumed for the given aircraft. The backward-swept configuration, on the other hand, generally needs a relatively high leading-edge sweep to minimize compressibility drag. On the other hand, a high sweep prevents laminar flow due to cross-flow instabilities. Therefore, the leading-edge suction with a corresponding mass penalty was applied. Contrary to the forward-swept configuration, a structural mass reduction of 19% was used due to the lack of the divergence problem.
Both configurations initially feature under-the wing-mounted engines as a conventional variant, as shown in Figure 10a. However, a potential option of an over-the-wing engine is also considered due to the possibility of having a cleaner wing and a reduced engine noise [36]. The engine location trade study is presented in a separate subsection.

4.2. Aircraft Pre-Sizing

The initial pre-sizing using SUAVE constraint and mission analyses were used to investigate potential sensitivities of key design parameters, such as DOC, emissions, maximum take-off mass, and wingspan to the aircraft wing loading and aspect ratio. Knowing design sensitivities, bounds used for the refinement using MDO can be defined. Figure 11 demonstrates the analysis summary for a sample design case. For each discrete point displayed by the contour plot, the design point that corresponds to the maximum wing loading is determined iteratively. Then, depending on the wing loading ratio with respect to the maximum allowable wing loading and the given aspect ratio, the design point is found along the constraint bound. Finally, all important parameters of sized configurations are obtained and collected for sensitivity analysis.
Based on the obtained results, multiple trends were observed. First, the minimum emission point approaches high aspect ratios and higher wing loading. On the other hand, the wingspan increases significantly for the minimum emission point. On the contrary, the minimum DOC point approaches rather low aspect ratios due to lower aircraft mass that affects several DOC components. Therefore, the best combination between DOC and emission is located for aspect ratios between 9 and 17.

4.3. Aircraft Refinement

Aircraft refinement is divided into two main steps. First, a refined sizing using a multi-objective MDO, as described in Section 3.3.4, was used to select the design that corresponds to the best design trade-off. Then, manual refinements to satisfy sizing and performance requirements not covered by the MDO were performed. Moreover, additional trade studies based on MDO refinements were completed at this design stage.

4.3.1. Refinement Using MDO

The MDO refinement was performed for a number of design cases: a forward-swept wing with NLF, a forward-swept wing with NLF and wing folding, a backward-swept wing with HLFC, a backward-swept wing with HLFC and wing folding, and a backward-swept wing with NLF. The reason for such a large set of design cases is motivated by the desire to understand the sensitivity of concepts to the folding mechanism for all concepts and the possibility of having a combination of HLFC and NLF for the backward-swept configuration. The folding mechanism location depends on the aircraft’s wingspan. If the wingspan is up to 10% larger than the ICAO limit of 36 m, then tip folding is possible. However, a larger span will force the mechanism to intersect the aileron, so in the case of a significantly larger wingspan, the folding mechanism is located at the inboard end of the aileron. Table 4 summarizes the MDO problem specified for all cases. The objective of the study is to find the combination of the emission level and DOC to have a balance between emissions and operating costs. Design variables include wing planform parameters, as well as the thrust-to-weight ratio. Constraints include the field performance, maximum possible throttle at all mission segments, minimum tip chord length to ensure that its length is not excessively short, and the wingspan to avoid excessively large wingspans.
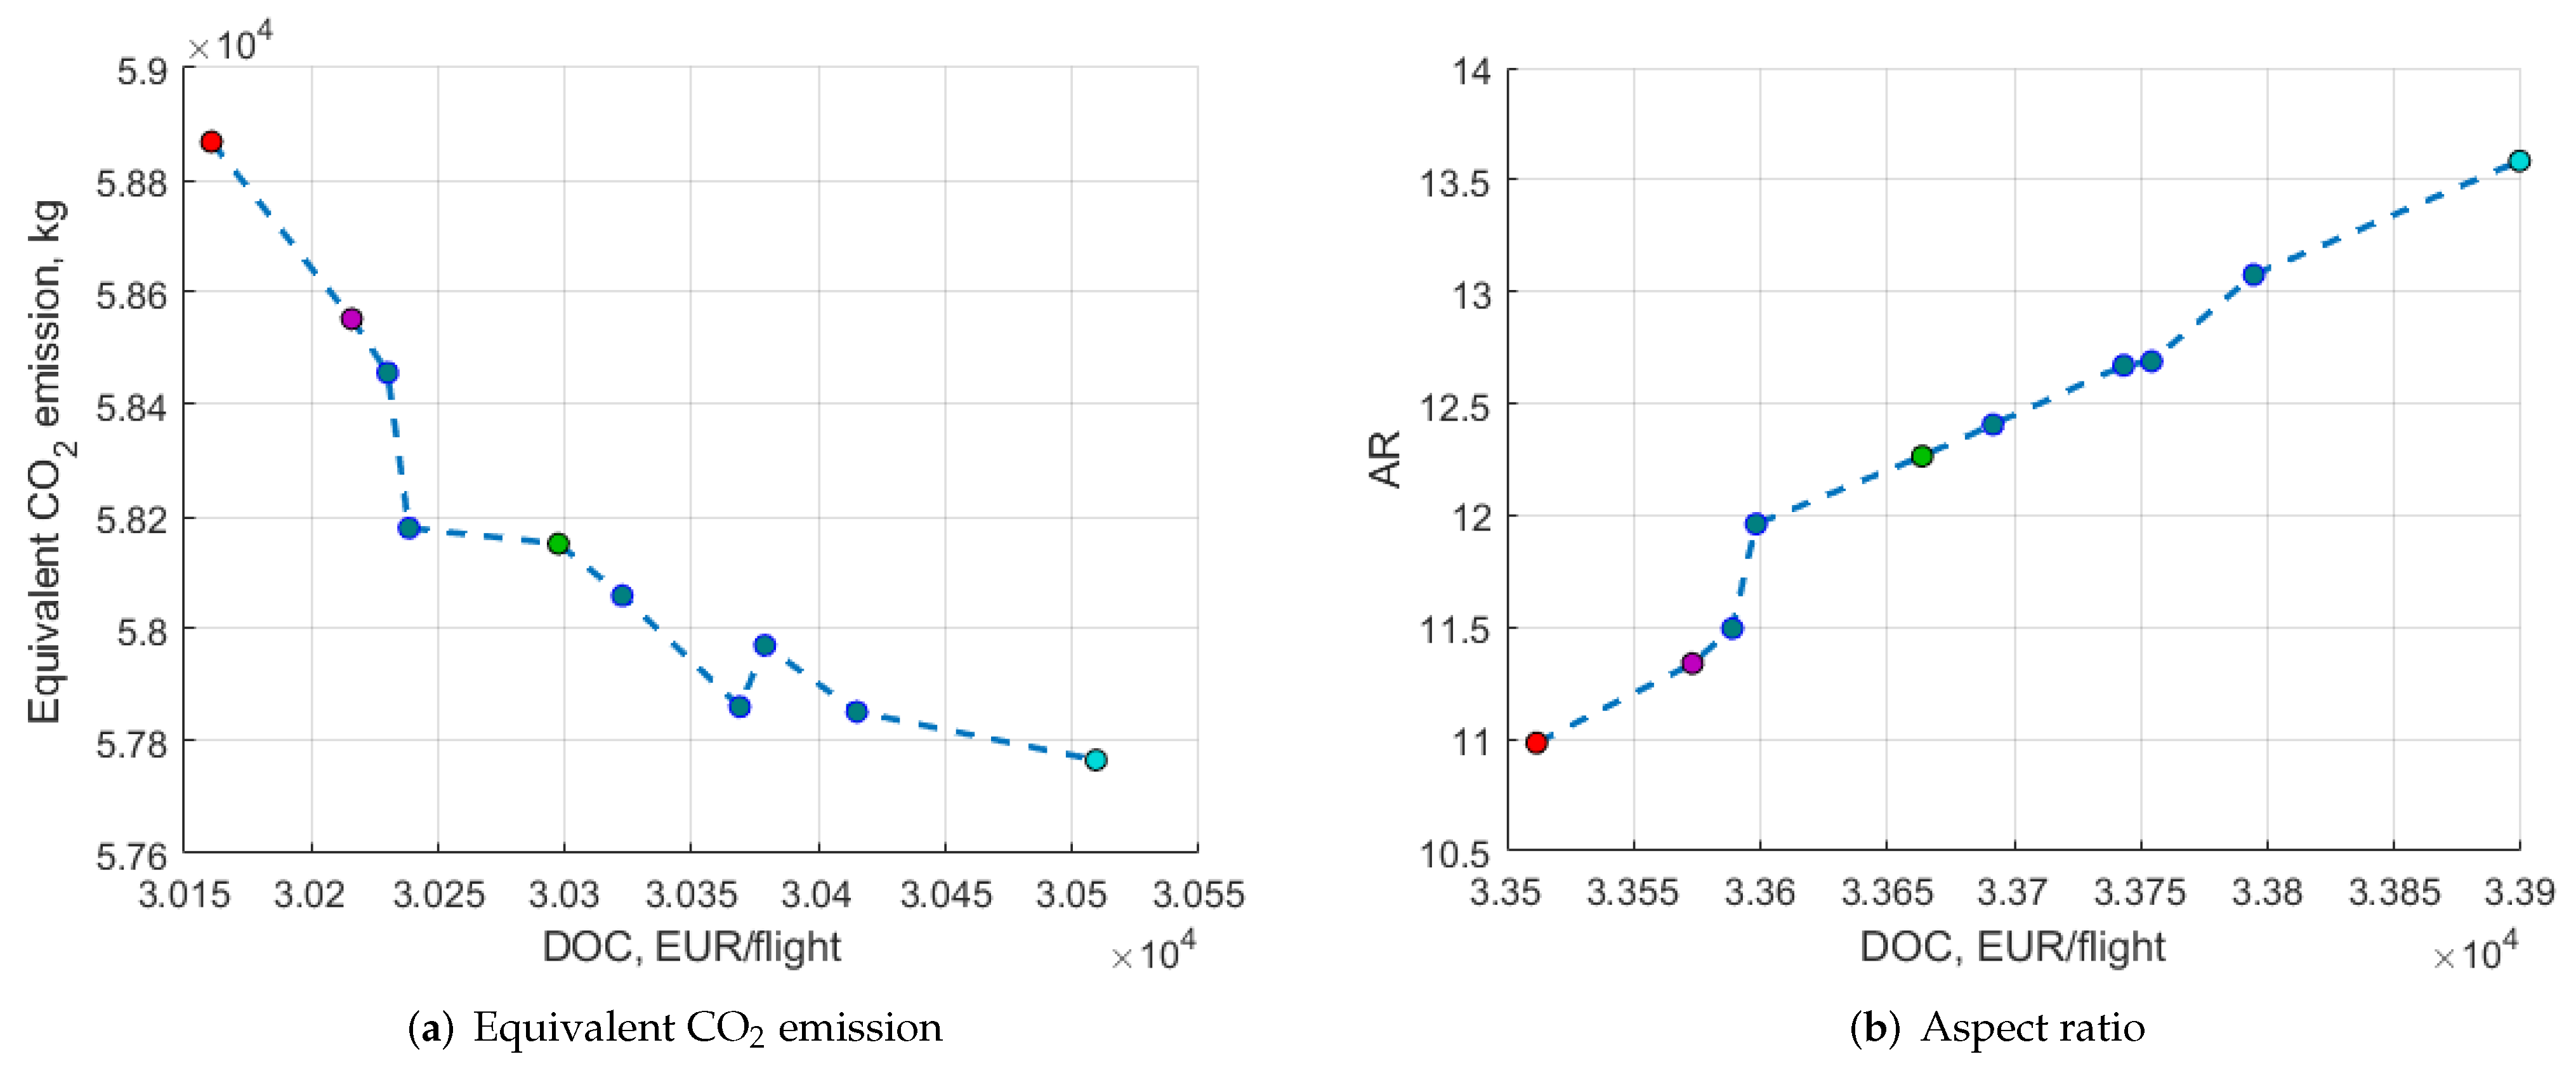
Pareto fronts for all design cases are shown in Figure 12. Several trends were observed. First, the presence of the folding mechanism divides the Pareto front into two regions: the region where there may be no folding or a tip folding and the region where the folding is located at the boundary between the aileron and the flap. The trend mostly affects the DOC and limits the possible gains in the overall emission due to the folding mechanism mass penalty. Folding mechanisms also have a strong influence on the emission level and costs, especially for the backward-swept configuration, due to the larger overall masses of the backward-swept configurations. The general increase in the backward-swept configuration masses was obtained due to a significantly lower fuselage portion with laminar flow (44% for the backward-swept versus 52% for the forward-swept). This fact created a snowball effect, which increased the fuel burn, which affected both DOC and the emission level. Another interesting outcome deals with the fact that the NLF version without folding has similar values of emissions and DOC as the HLFC version with folding. That demonstrates that the reduction of laminar flow in the case of NLF is comparable to the introduction of the folding mechanism with the leading-edge suction.
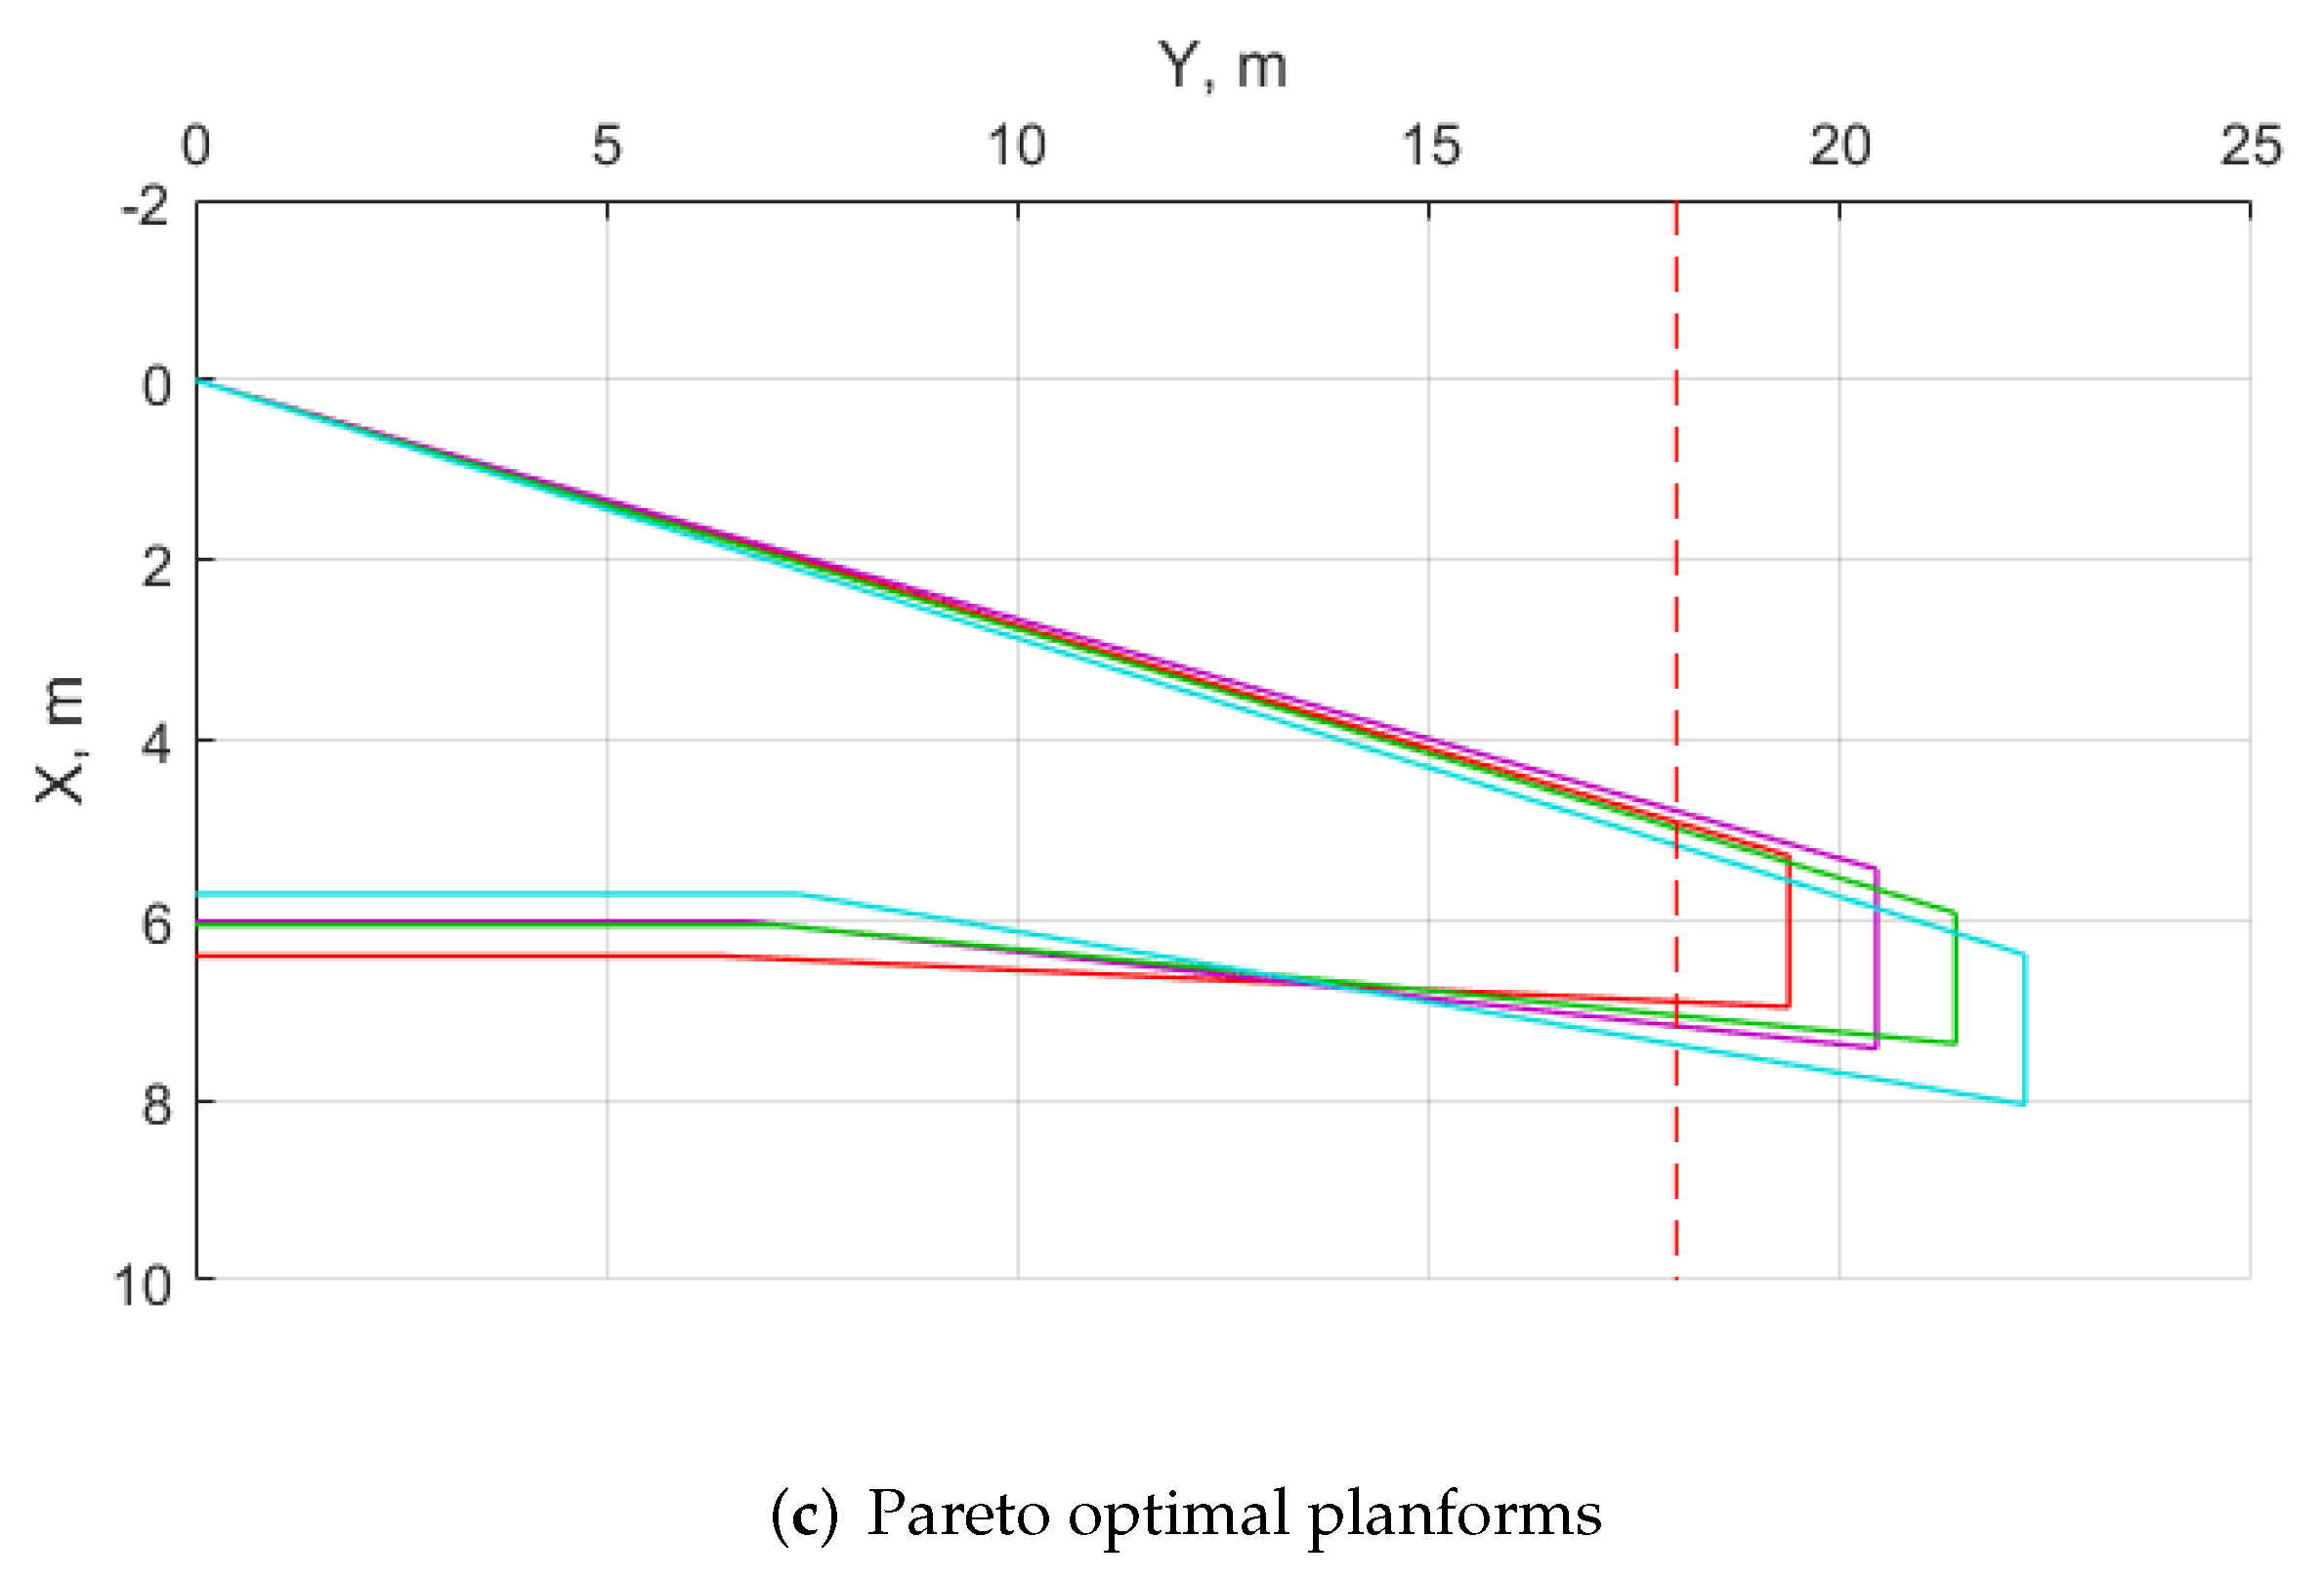
Figure A1, Figure A2, Figure A3, Figure A4 and Figure A5 summarize the results for each MDO study and presents several planforms from Pareto fronts. In the case of the forward-swept NLF optimization without folding, relatively modest increases in the wingspan were observed. The wingspan ranges from 39 to 44 m. Changes in emission between the best DOC design and the best emission design are equal to 2%, while the DOC difference equals 1.2%. Therefore, the aircraft is more sensitive to emissions rather than DOC. Aspect ratios are generally higher than conventional ones and range from 11 to 13.5. The leading-edge wing sweep ranges from −14 to −17.5 degrees, which enables a 65% laminar flow along the chord for almost the whole wing except for a small portion near the root, where the laminar flow reaches the range of 40–50%.
Similar trends were observed for the case with NLF and a folding wing. However, the optimization trends fall more towards the lower wingspan and aspect ratio to avoid an excessive mass penalty due to folding. However, these planforms suffer from higher DOC values. The range of emissions between extreme cases is 1.5%, while the DOC range is 3%. The best design case features a maximum possible wing aspect ratio while having a tip folding. In this case, the aspect ratio of 12 is a good compromise between the costs and emissions.
The optimization of the backward-swept configuration showed a lower wing sweep compared to the conventional aircraft wing sweep range, from 15.5 to 16.5 degrees. The sweep was reduced due to a reduced cruise Mach number, which reduced the compressibility drag and attempts of the solver to maximize laminar flow at the kink section where the Reynolds number is higher than for the outer wing. The range of emissions between extreme cases equals 1.0%, while the DOC changes equal 2.5%. Therefore, for this case, the range is a lot more sensitive to DOC rather than emissions. Maximum wingspan equals 45 m for the minimum emission case. Given Pareto front results, the design case approaches the minimum emission cases.
In the case of the folding wing with LFC, a clear differentiation between tip folding cases and cases with the folding before the aileron was observed. The emission range equals 1%, while the DOC range equals 2%. Consequently, the folding case is more sensitive to DOC changes rather than emissions, similar to the forward-swept folding case. The best design combination is reached for the folding tip case with minimum possible emissions. The leading-edge sweep ranges from 17.5 to 19 degrees for the case of the folding wing.
Finally, a special case of the backward-swept NLF wing was carried out to determine how much different optimal configurations are and if a compromise between the fully LFC case and the NLF case is possible to reach a large laminar flow portion with the lower suction system mass. After the optimization, wing sweeps of optimal configurations range from 14.5 to 16 deg, so it is not much different from the LFC case. Therefore, there is a capability of having a mixture of LFC and NLF where the inner portion with the kink can be laminarized using LFC, while the outer wing can exploit NLF. The emission level has a range of 1.5%, while the DOC range equals 1.1%, so differences in optimal configurations are minor. Any configuration can be selected given such small differences in objective functions.
If forward-swept and backward-swept wing configurations are compared within each Pareto front, relatively minor changes in both emissions and DOC are observed. However, if the backward and forward-swept configurations are considered, changes in DOC are less than 2%, while the emission change equals 2.6%. Differences in emissions are motivated by a higher fuel burn of the backward-swept configuration due to a lower percent of the fuselage laminarization, which also causes a snowball effect on overall masses. The difference between the fuel burn rates for both forward and backward-swept configurations equals 4.8%.

4.3.2. Over-the-Wing Engine Trade Study

An important trade study is related to opportunities to further improve aerodynamic efficiency by positioning the engines. The studies by Hooker [66,67] and Tsagi [68] demonstrated the potential of improving the aerodynamic efficiency by 3–5% compared to the conventional configuration by putting engines above and aft of the wing. On the other hand, two design considerations on the overall aircraft level are unclear: how will an aft-mounted engine affect the CG envelope, and how heavy will the pylon for the over-the-wing engine be? Two configurations shown in Figure 13a for the forward-swept configuration were modeled in SUAVE to investigate the effect of the engine position on masses and to determine the new CG envelope. An average value of 4% increase in L / D was assumed for the over-the-wing engine configuration. The wing planform, however, remained constant and equal to the one obtained after the set of MDO studies.
Multiple trends were observed after the updated aircraft sizing for the over-the wing configuration. First, an opportunity to have a shorter landing gear became available, which reduced the landing gear mass, as shown in Table 5. A relatively small reduction in the landing gear height saved 230 kg. Moreover, the increase in the aerodynamic efficiency improved the fuel burn, which was also strengthened by lighter landing gear and created a snowball effect. Overall, the fuel burn was reduced by 7.5% compared to the initial configuration. Note that the horizontal tail dihedral angle was increased to make sure that the engine exhaust did not meet the tail, so the configuration became similar to the Fokker 614. However, uncertainty regarding high angle-of-attack behavior still remains and needs to be checked. In the worst case, a cruciform tail option will be applied, which will create minor losses in masses due to structural mass and interference drag. The CG envelope shifted towards the rear of the aircraft, as expected, but it did not affect the aircraft significantly.
The present analysis assumed that the pylon mass is not affected by the engine location, which may not be true since the over-the-wing engine may introduce static loads and dynamic instabilities that are not covered by SUAVE’s semi-empirical approach. Therefore, it is important to quantify how much additional pylon mass and mass required to stabilize wing dynamics is acceptable to ensure that the engine location remains beneficial for the aircraft. Additional studies with the pylon mass penalty as a set of constants were performed in SUAVE. A mass penalty of 900 kg, which is equivalent to the mass of the A320 pylon [63] was added to the empty mass to model a twice as heavy pylon. The results showed that the fuel burn changed from 7272 to 7346 kg (an increase of the mass by 1%), although the empty mass increased from 34,998 to 36,043 kg, which increased DOC from 29,848 EUR/flight to 30,214 EUR/flight, which is equivalent to 1.2%. Consequently, changes in both fuel burn and DOC are equivalent, while the fuel burn remains lower than for the under-the-wing configuration. Therefore, the over-the-wing configuration is preferred since there is also an acoustic benefit by shielding the fan noise during take-off of the aircraft. However, the difficulty of providing access for engine maintenance must yet be solved for such an engine position.
The selected engine location configuration was hence used for both configurations. The backward-swept configuration had to enlarge its kink to ensure that the landing gear could be retracted, but such differences were relatively minor and did not significantly affect the overall performance.

4.3.3. Aircraft Design Summary and Performance Comparison

Figure 14 shows a comparison between the forward and the backward swept wing configurations. Table 6 compares the masses of both configurations, while Figure 15 shows the extent of laminar flow for both designed wings, and Table 7 compares the geometric characteristics of both aircraft.
As mentioned earlier, the forward-swept configuration features NLF along the complete wingspan, while the backward-swept configuration has LFC at the inner portion of the wing, as shown in Figure 14, and the outer wing uses NLF. Based on obtained results, multiple trends are observed. The portion of laminar wing flow for both configurations reaches the maximum values at the middle of the wing and further towards the tip, while the root segment has a reduced laminar region. Since the backward-swept configuration features LFC, the transition position is slightly further downstream compared to the forward-swept one, but the differences are not significant. It must be mentioned that the analysis did not consider three-dimensional effects at the wing root and tip that would reduce the overall laminarization of the wing. However, major trends in laminar flow improvements can be captured with a simplified assumption of the absence of those effects. The empty mass of the forward-swept configuration is slightly larger than the backward-swept one, which is the outcome of the penalty on the wing structure compared to the backward-swept configuration. Although the backward-swept configuration features the leading-edge suction, it is considered only for the inner wing portion, which does not add mass significantly and makes the overall suction system weigh 1742 kg compared to 1810 kg for the forward-swept configuration. Moreover, the forward-swept wing is heavier than the backward-swept one according to the wing mass reduction assumption due to technologies (9% for the forward-swept wing and 19% for the backward-swept wing).
The empennage of the backward-swept configuration is smaller than the forward-swept one due to the CG envelope trend. The CG range for the backward-swept configuration equals 19%, while the forward-swept configuration has the CG range of 25%. While the backward-swept CG envelope has a CG range close to the quarter chord of the mean aerodynamic chord, the forward-swept one is located more aft, with the empty mass CG being at 56%, which is similar to the Tu-154 [39]. That leads to the larger horizontal tail to ensure a sufficient static margin and a sufficient elevator deflection for the landing configuration.
On the other hand, the forward-swept configuration has a more efficient wing due to a higher half-chord sweep angle and a slightly lower compressibility drag of this configuration. Moreover, the fuselage of the forward-swept configuration is more laminar, which also improves the aerodynamic efficiency of the aircraft overall. That leads to the reduction of the fuel burn by almost 13% compared to the backward-swept configuration.
Although the aircraft was designed for a rather low altitude, sufficient operational flexibility needs to be proven to ensure that the aircraft can adapt to variations of the atmospheric requirements around the globe and is flexible with respect to requirements from air traffic management. 
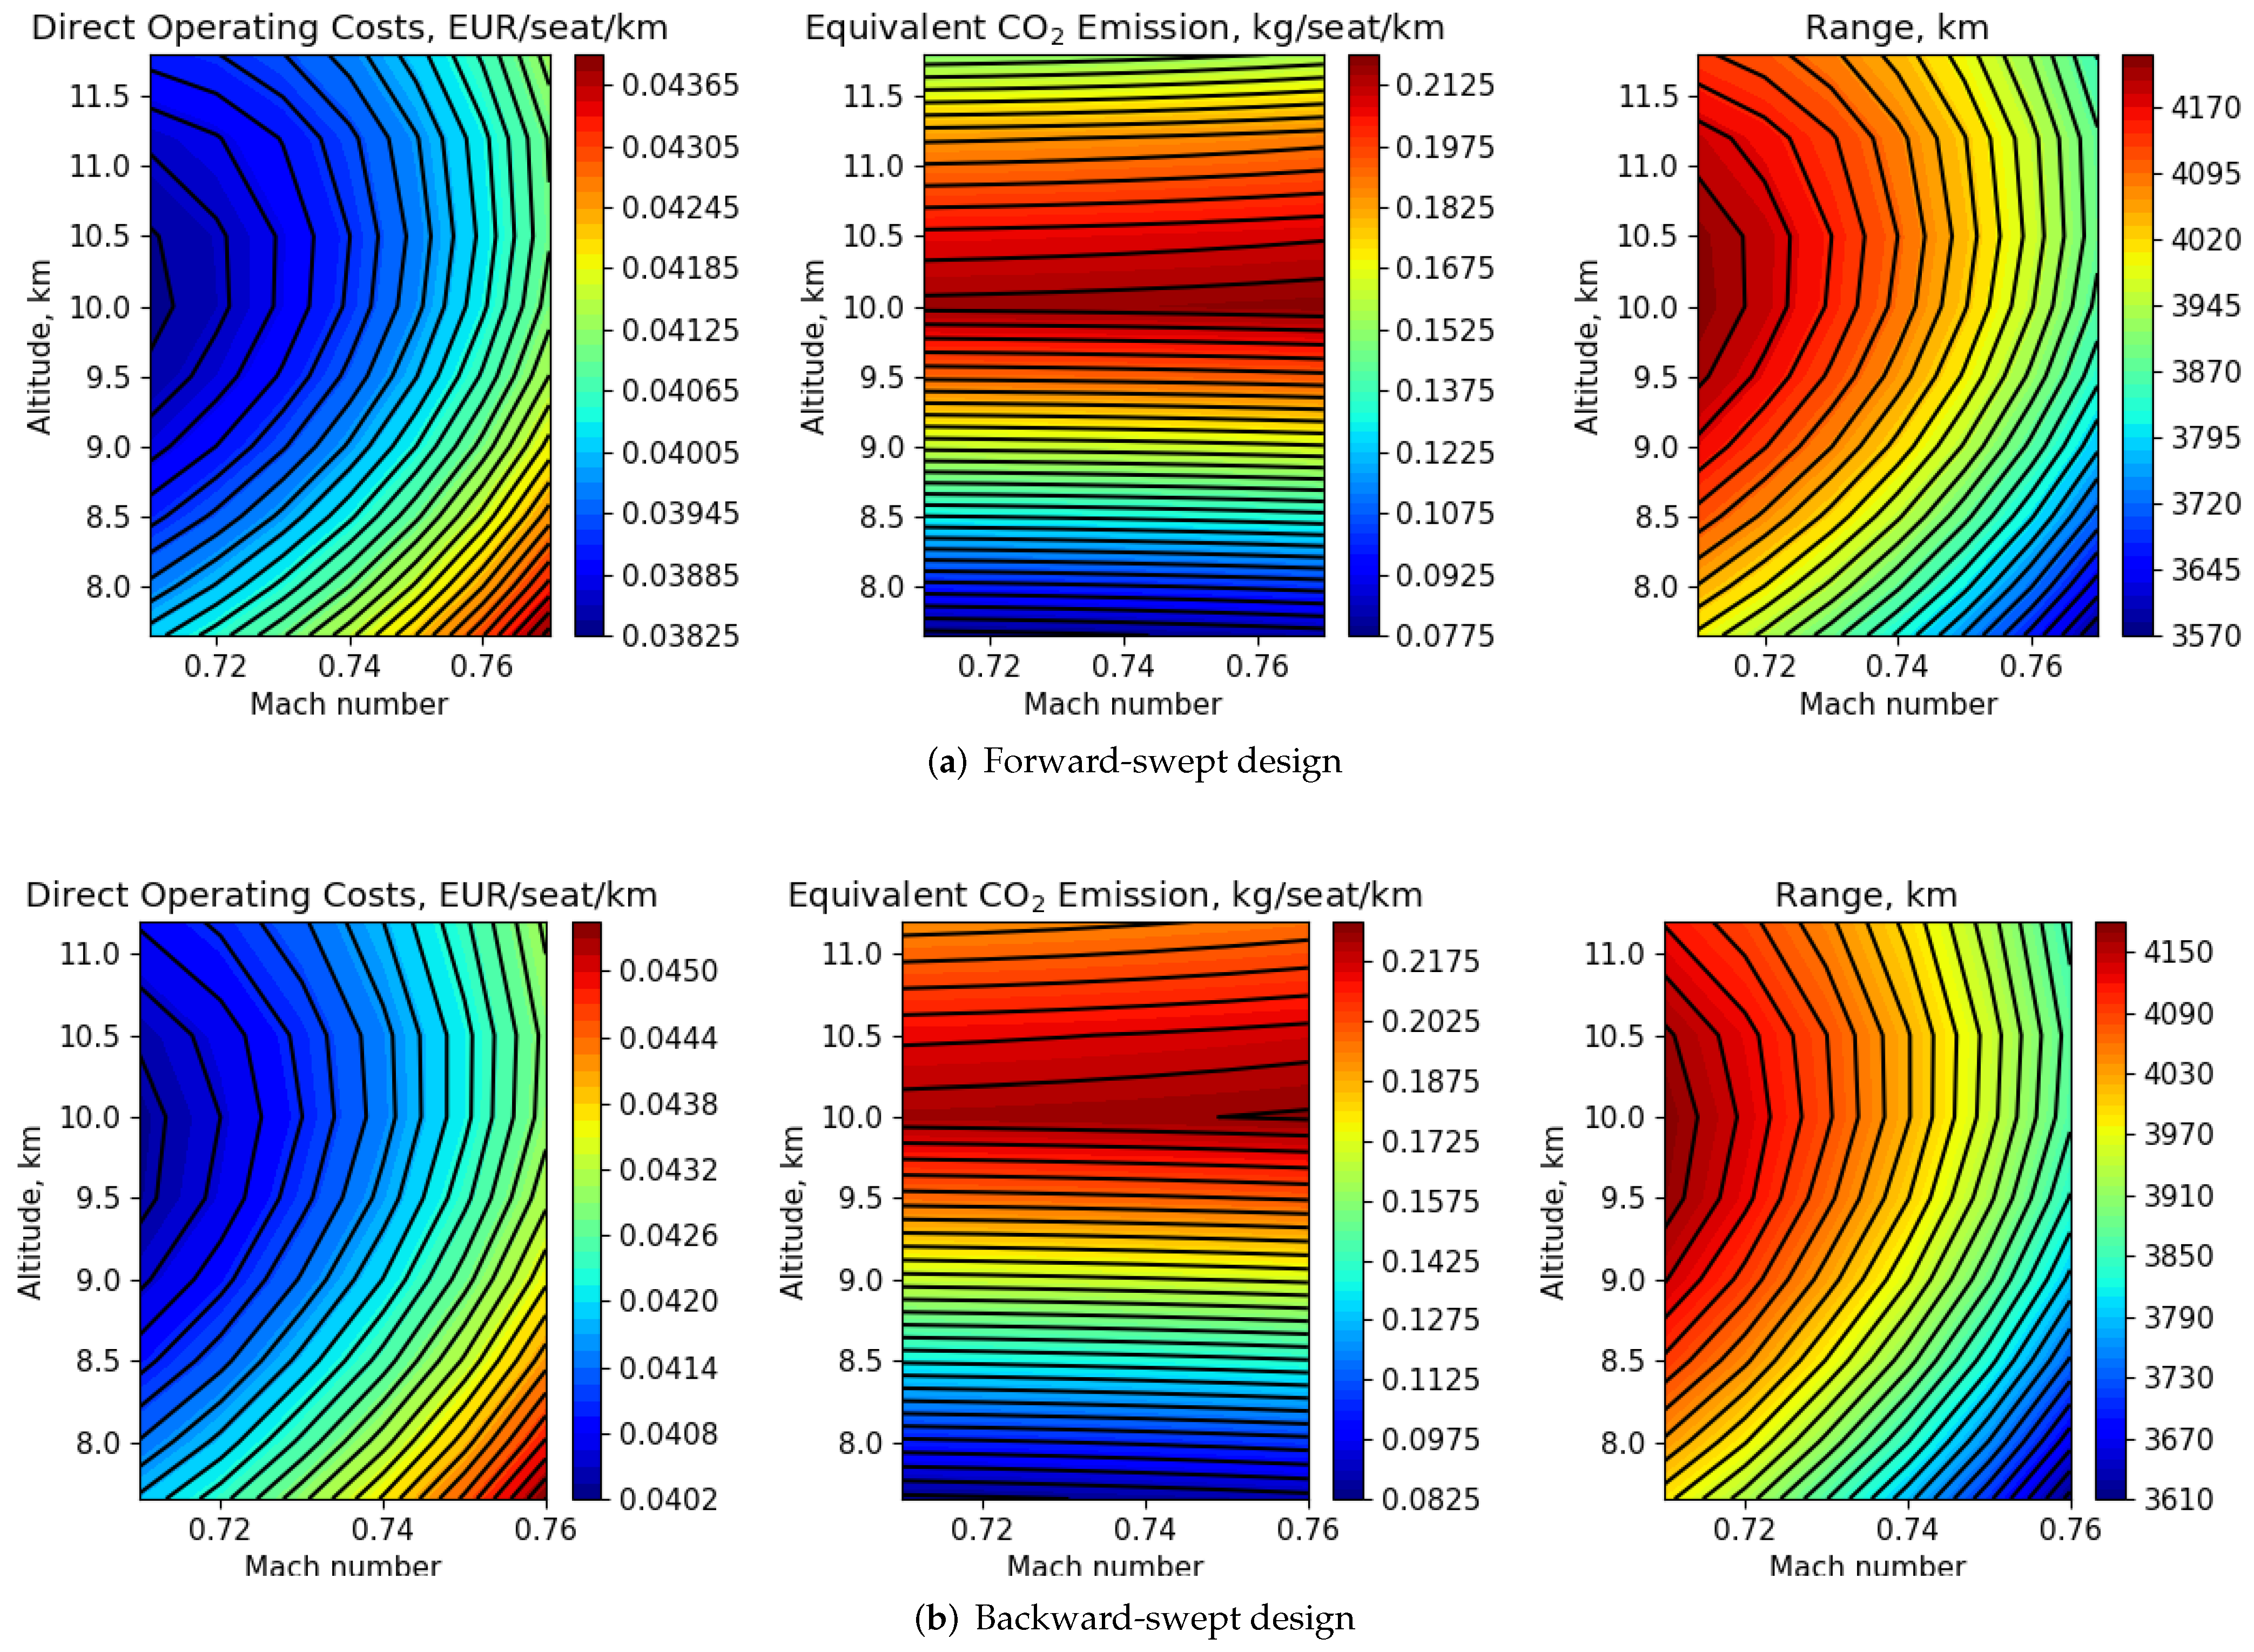
Figure 16 shows the flight envelope and the payload-range diagram, while Figure 17 shows the range, DOC, and emission sensitivities to the flight Mach number and the cruise altitude. Based on the given airframe and propulsion characteristics, the forward-swept configuration is capable of reaching an absolute ceiling of 11,800 m and the maximum operating Mach number of 0.77, while the backward-swept configuration can reach an altitude of 11,200 m and the maximum operating Mach of 0.76. However, the stall line of the backward-swept configuration is located further to the left compared to the forward-swept one, which indicates better low-speed performance due to its lower trailing edge sweep. Payload-range diagrams show almost similar trends for both configurations and have a larger range with full fuel compared to the A320-200 reference aircraft. However, the ferry range does not have a significant difference compared to the reference aircraft.
Sensitivities to the Mach number and flight altitudes show similar trends but with different magnitudes that come from the benefits and drawbacks of each configuration. As was previously shown for the A320, minimum DOC and maximum range are reached at typical flight altitudes between 9500 and 10,500 m, while similar altitudes are also responsible for the highest emission amount.
Table 8 shows that the forward-swept and the backward-swept aircraft are 44% and 43% more expensive than A320, respectively, which is a significant difference in price. On the other hand, the DOC for those aircraft is lower than for the reference aircraft. Both aircraft are 22–25% cheaper to operate than the reference aircraft due to a substantially lower fuel burn. Moreover, the emissions of designed aircraft are 31–34% lower at the altitude of 10,500 m and 37–42% lower at the altitude of 7600 m, which is achieved by advanced technologies.

5. Influence of Technologies on the Emission Reduction Potential

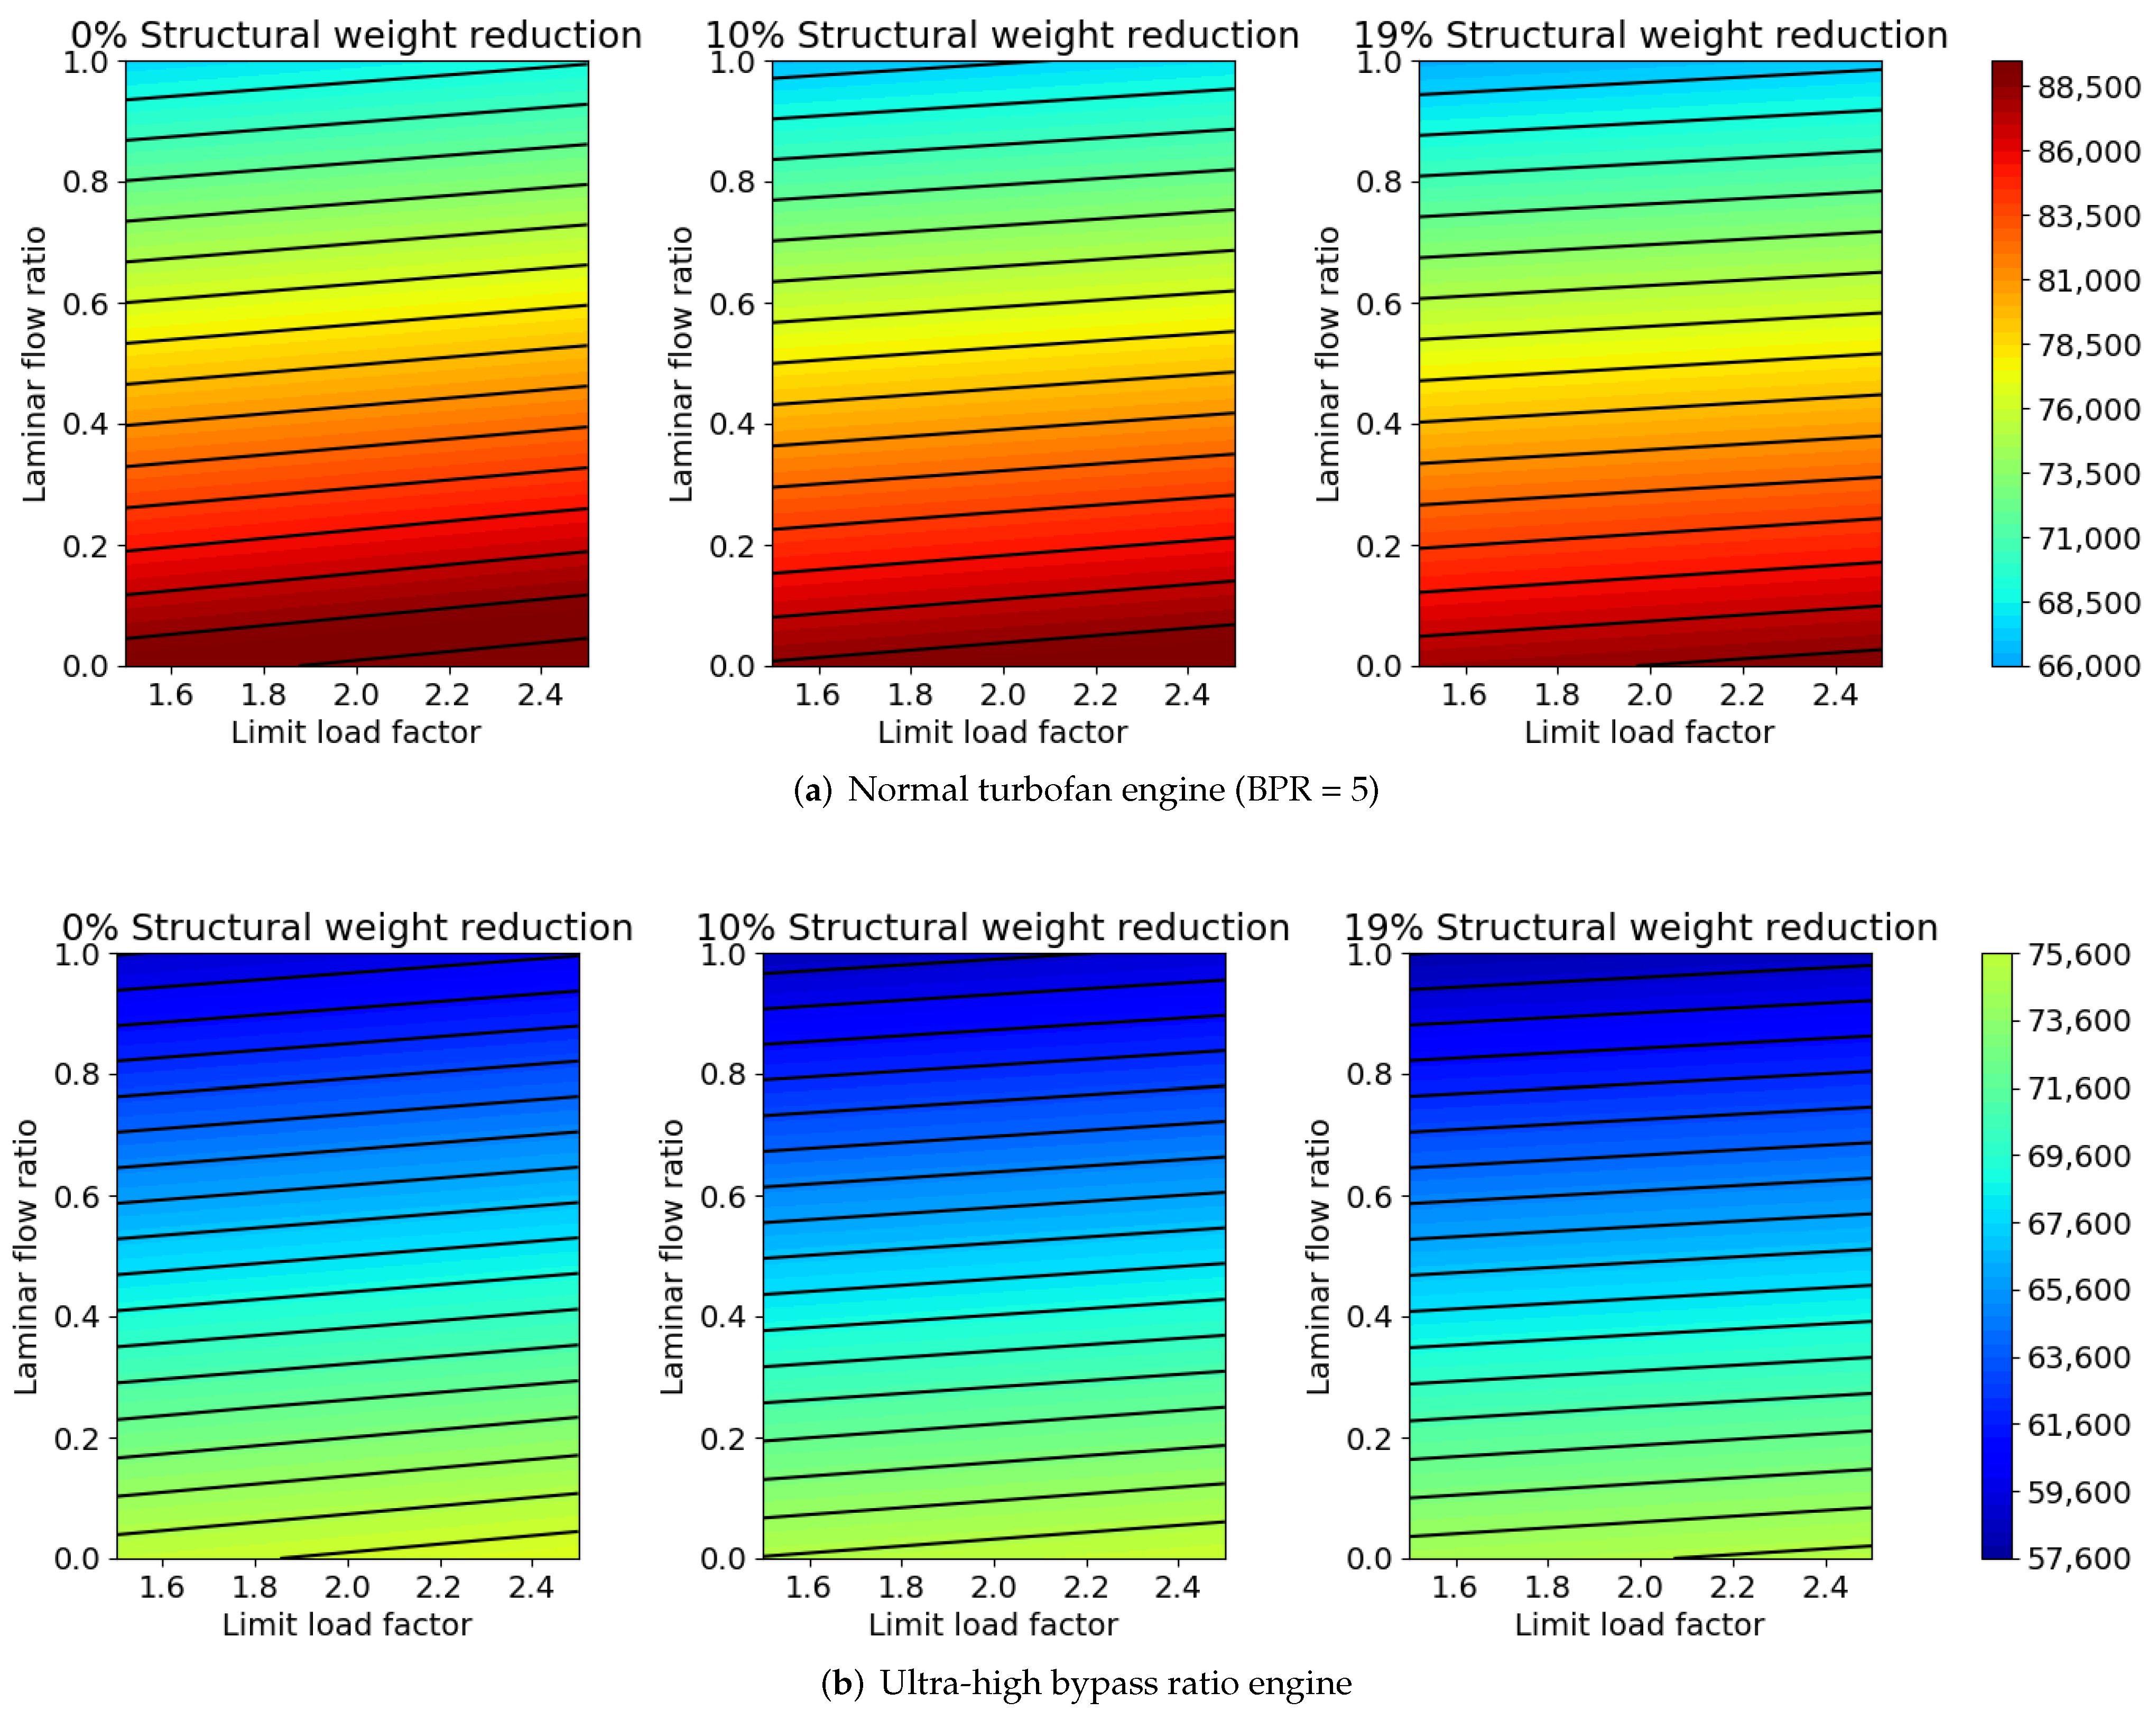
Although aircraft configurations have been proposed and significant changes in overall emissions are observed, all technologies are subject to significant uncertainties. To understand the influence of technology deviations on the equivalent CO2 emission of the aircraft, a technology deviation trade study was performed. The forward-swept configuration was used for the technology sensitivity analysis. The laminar flow ranges from 0% to 100% of the initially obtained laminar boundary layer, the limit load factor ranges from 1.5 to 2.5, the structural mass reduction factor ranges from 0% to 19% for all aircraft components, and the engine can have a typical bypass ratio of 5 and an ultra-high bypass ratio, according to the technology assumption. The planform of the aircraft remains constant, and only masses are updated based on available capabilities of technologies. Figure 18 summarizes obtained emission trends.
Multiple trends have been observed. Table 9 summarizes the applications of each technology separately for the design mission profile shown in Figure 4. Based on the obtained results, laminar flow control has the highest influence on emission reduction compared to all other technologies. Then, engine technologies have the second-highest influence, and load alleviation and advanced materials and structures have the lowest emission influence. On the other hand, reaching laminar flow parameters for the aircraft is exceptionally challenging, especially for the fuselage. Therefore, although the increase of the engine bypass ratio is also challenging, its implementation may not be as demanding as the flow laminarization, which makes this technology as promising as the laminar flow control. In addition, since both engine technologies and the flow laminarization give the highest impact on the emission level, their combination covers the majority of the emission reduction compared to all other technology combinations. Finally, it is important to note that the aircraft version without technologies shows a lower emission level compared to the A320 since the reference aircraft was calculated at the off-design condition.

6. Conclusions

The present work demonstrates the influence of advanced airframe and propulsion technologies on the design of a medium-range commercial aircraft similar to the Airbus A320, designed for reduced emissions. Multiple airframes and propulsion technologies were considered: hybrid laminar flow control, load alleviation, advanced materials and structure concepts, and ultra-high bypass ratio turbofan engines.
Multiple tools were used and improved to design the aircraft. Initial pre-sizing was performed using SUAVE, which featured a developed iterational sizing algorithm to determine the design point based on the top-level requirements and the mission profile. The multi-fidelity approach using tools such as EMWET and AVL was used for masses, aerodynamics, and aircraft stability analysis. The coupled MDO environment between MATLAB and SUAVE was used to perform the optimization studies.
During the design process, a dedicated mission profile was adopted to further mitigate the environmental impact. Moreover, various configurations with different wing sweeps and the presence or absence of the wing folding mechanism were studied. Finally, an engine configuration trade study was performed to find a more advantageous configuration. The best possible configuration features an extended wingspan of 7 m compared to the ICAO Annex 14 category C span regulation, a forward-swept wing with NLF, and over-the-wing mounted engines. The aircraft was proven to have a rather wide range of airspeeds and altitudes to be flexible enough for operations, although maximum speeds are lower than the reference A320. The average equivalent CO2 emissions reduction of 39% compared to the reference A320 for the similar low-speed and low-altitude mission profile was demonstrated, while the high-altitude and high-speed mission showed an emission reduction of 33%. Moreover, although the price of such an aircraft is 43% higher than the reference, Direct Operating Costs are 23% lower, which gives a possibility of this aircraft to be economically viable if all technologies reach expected performance levels and cost increases match expected assumptions.
The technology sensitivity analysis demonstrated a significant influence of engine technologies and laminar flow control compared to other technologies. The strongest influence was observed for the laminar flow control, while the UHBPR engines became the second most important technology to minimize emissions. Moreover, given the complexities of the laminar flow control technology implementation, UHBPR engine technologies may be more achievable in the near future.
Future research steps will include a more detailed conceptual design of the SE2A MR aircraft with both forward and backward-swept configurations. Particularly, an introduction of higher-fidelity aerodynamic analysis, such as high-fidelity CFD and FEA, will help design the wing appropriate for all studied technologies. Moreover, the aeroelastic assessment of composite structures with future technologies will be performed to investigate potential wing mass penalties that were not covered in the present research in detail. Finally, system sizing and more detailed mass estimations for all advanced technologies will be performed to determine their mass contributions and resize the aircraft.

Author Contributions

Conceptualization, S.K.; methodology, S.K.; software, S.K.; validation, S.K.; formal analysis, S.K.; investigation, S.K.; resources, A.E.; data curation, A.E. and R.R.; writing—original draft preparation, S.K.; writing—review and editing, S.K., A.E. and R.R.; visualization, S.K.; supervision, A.E. and R.R.; project administration, A.E.; funding acquisition, A.E. All authors have read and agreed to the published version of the manuscript.

Funding

This research was funded by the Deutsche Forschungsgemeinschaft (DFG, German Research Foundation) under Germany’s Excellence Strategy-EXC 2163/1-Sustainable and Energy Efficient Aviation-Project-ID 390881007.

Institutional Review Board Statement

Not applicable.

Informed Consent Statement

Not applicable.

Data Availability Statement

The data presented in this study were generated using an open-source publicly-available software SUAVE (https://suave.stanford.edu/, accessed on 18 May 2022). The final data presented in this study are available on request from the corresponding author.

Acknowledgments

We would like to acknowledge the funding by the Deutsche Forschungsgemeinschaft (DFG, German Research Foundation) under Germany’s Excellence Strategy-EXC 2163/1-Sustainable and Energy Efficient Aviation-Project-ID 390881007.

Conflicts of Interest

The authors declare no conflict of interest.

Abbreviations

The following abbreviations are used in this manuscript:
Λ Sweep angle
λ Taper ratio
AICAviation-induced cloudness
A R Aspect ratio
bWingspan
C 0 Kink chord
C r Root chord
C t Tip chord
SArea
CO 2 , e q Equivalent CO2 emission
DOCDirect Operating Costs
HLFCHybrid laminar flow control
ISAInternational Standard Atmosphere
K f Suction velocity ratio
L / D Lift-to-drag ratio
LFCLaminar flow control
MDOMultidisciplinary design optimization
MLMMaximum landing mass
MTOMMaximum take-off mass
mMass
m s u c Suction system mass
N R Number of flight segments
NLFNatural laminar flow
OEIOne engine inoperative
R e T Transition Reynolds number
S s u c Wetted area covered by the suction system
SLSea-level
t s k i n Skin thickness
T / W Thrust-to-weight ratio
UHBPRUltra-high bypass ratio
v 0 / U Suction speed ratio
W / S Wing loading

Appendix A. MDO Summary for All Considered Configurations

Figure A1. Optimization results for the forward-swept NLF aircraft.
Aerospace 09 00279 g0a1aAerospace 09 00279 g0a1b
Figure A2. Optimization results for the forward-swept NLF aircraft with a folding wing.
Aerospace 09 00279 g0a2
Figure A3. Optimization results for the backward-swept LFC aircraft.
Aerospace 09 00279 g0a3
Figure A4. Optimization results for the backward-swept LFC aircraft with a folding wing.
Aerospace 09 00279 g0a4aAerospace 09 00279 g0a4b
Figure A5. Optimization results for the backward-swept NLF aircraft.
Aerospace 09 00279 g0a5
Figure A6. Trapezoid planform definition with a kink.
Aerospace 09 00279 g0a6

Appendix B. Derivation of the Wing Planform for the Initial Sizing and Optimization

Figure A6 shows the half of the wing planform that features an arbitrary kink having the trailing edge sweep angle Λ T E and a local span b 0 from the aircraft center line. The wing aspect ratio, taper ratio, and kink span ratios provided as sizing inputs are defined by
A R = b 2 S w i n g
λ = C t C r
k b = 2 b 0 b
The total planform area is defined by splitting the wing into the inboard segment with the kink and the outboard segment without the kink and calculating corresponding areas of two trapezoidal segments
S w i n g = S i n b + S o u t b = b 2 C r k b + C 0 + C t C t k b
The chord length at the end of the kink is defined by
C 0 = C r b 0 tan Λ L E + tan Λ T E
The planform definition depends on the sizing procedure. If the sizing is performed using the constraint analysis, then the wing planform area is known and the goal is to find find the root chord, which is then used to fully define the wing. Combining Equations (A4) and (A5) with an implementation of Equations (A2) and (A3) obtains the following representation of the wing area
S w i n g = b 2 C r k b + C r k b b 2 tan Λ L E + tan Λ T E + λ C r λ C r k b = C r k b b 2 k b b 2 tan Λ L E 4 k b b 2 tan Λ T E 4 + λ C r b 2 λ C r k b b 2 + C r b 2 = C r k b b 2 + λ b 2 λ k b b 2 + b 2 k b b 2 4 tan Λ L E + tan Λ T E
Solving Equation (A6) for C r and using Equation (A1), we obtain the following relation
C r = 2 S w i n g + k b A R · S w i n g 4 tan Λ L E + tan Λ T E k b + λ λ k b + 1 A R · S w i n g
Finally, the rest of the geometry can be obtained using the root chord, initial conditions, and definitions defined by Equations (A1)–(A3).
On the other hand, if the wing planform information is unavailable but the wing root chord is given, which may be the case of the optimization algorithm, then the wingspan needs to be obtained. Combining Equations (A1) and (A4), the wing aspect ratio becomes
A R = 2 b C r k b + C r k b b 2 tan Λ L E + tan Λ T E + λ C r λ C r k b
Combining common elements and solving for the wingspan, the final expression becomes
b = C r A R 1 + k b + λ 1 k b 2 + k b A R 2 tan Λ L E + tan Λ T E
Finally, the planform can again be fully defined using initial inputs and Equations (A1)–(A3).

References

  1. European Commission. Flightpath 2050-Europe’s Vision for Aviation: Advisory Council for Aeronautics Research in Europe; Publications Office of European Union: Brussels, Belgium, 2011. [Google Scholar]
  2. Epstein, A.; O’Flarity, S. Considerations for Reducing Aviation’s CO2 with Aircraft Electric Propulsion. J. Propuls. Power 2019, 35, 572–582. [Google Scholar] [CrossRef]
  3. Xu, J.; Kroo, I. Aircraft Design with Active Load Alleviation and Natural Laminar Flow. J. Aircr. 2014, 51, 1532–1545. [Google Scholar] [CrossRef]
  4. Greitzer, E.; Bonnefoy, P.; de la Rosa Blanco, E.; Dorbian, C.; Drela, M.; Hall, D.; Hansman, R.; Hileman, J.; Liebeck, R.; Lovegren, J.; et al. N+3 Aircraft Concept Designs and Trade Studies, Volume 1; NASA/CR—2010-216794/VOL1; NASA: Cleveland, OH, USA, 2010; Available online: https://core.ac.uk/display/10557299 (accessed on 28 April 2022).
  5. Greitzer, E.; Bonnefoy, P.; de la Rosa Blanco, E.; Dorbian, C.; Drela, M.; Hall, D.; Hansman, R.; Hileman, J.; Liebeck, R.; Lovegren, J.; et al. N+3 Aircraft Concept Designs and Trade Studies, Volume 2; NASA/CR—2010-216794/VOL2; NASA: Cleveland, OH, USA, 2010; Available online: https://core.ac.uk/display/10557296 (accessed on 28 March 2022).
  6. Welstead, J.; Feldder, J. Conceptual Design of a Single-Aisle Turboelectric Commercial Transport with Fuselage Boundary Layer Ingestion. In Proceedings of the 54th AIAA Aerospace Sciences Meeting, San Diego, CA, USA, 4–8 January 2016. [Google Scholar] [CrossRef] [Green Version]
  7. Seitz, A.; Gologan, C. Parametric Design Studies for Propulsive Fuselage Aircraft Concepts. CEAS Aeronaut. J. 2015, 6, 69–82. [Google Scholar] [CrossRef]
  8. Seitz, A.; Hübner, A.; Risse, K. The DLR TuLam Project: Design of a Short and Medium Range Transport Aircraft with Forward Swept NLF Wing. CEAS Aeronaut. J. 2020, 11, 449–459. [Google Scholar] [CrossRef] [Green Version]
  9. Bradley, M.; Droney, C. Subsonic Ultra-Green Aircraft Research Phase II: N+4 Hybrid Electric Design Exploration; NASA/CR-2015-218704; NASA: Huntington Beach, CA, USA, 2015; Available online: https://core.ac.uk/display/42706577 (accessed on 5 May 2022).
  10. Saeed, T.; Graham, W. Design Study for a Laminar-Flying-Wing Aircraft. J. Aircr. 2015, 52, 1373–1385. [Google Scholar] [CrossRef] [Green Version]
  11. Karpuk, S.; Liu, Y.; Elham, A. Multi-Fidelity Design Optimization of a Long-Range Blended Wing Body Aircraft with New Airframe Technologies. Aerospace 2020, 7, 87. [Google Scholar] [CrossRef]
  12. Liu, Y.; Elham, A.; Horst, P.; Hepperle, M. Exploring Vehicle Level Benefits of Revolutionary Technology Progress via Aircraft Design and Optimization. Energies 2018, 11, 166. [Google Scholar] [CrossRef] [Green Version]
  13. Karpuk, S.; Elham, A. Influence of Novel Airframe Technologies on the Feasibility of Fully-Electric Regional Aviation. Aerospace 2021, 8, 163. [Google Scholar] [CrossRef]
  14. Karpuk, S.; Elham, A. Conceptual Design Trade Study for an Energy-Efficient Mid-Range Aircraft with Novel Technologies. In Proceedings of the AIAA Scitech 2021 Forum, Virtual Event. 19–21 January 2021. [Google Scholar] [CrossRef]
  15. Ma, Y.; Zhang, W.; Zhang, Y.; Zhang, X.; Zhong, Y. Sizing Method and Sensitivity Analysis for Distributed Electric Propulsion Aircraft. J. Aircr. 2020, 57, 730–741. [Google Scholar] [CrossRef]
  16. IEA. Tracking Aviation 2020; IEA; NASA: Huntington Beach, CA, USA, 2015; Available online: https://perma.cc/2QM6-9BCV (accessed on 28 April 2022).
  17. Dallara, E. Aircraft Design for Reduced Climate Impact. Ph.D. Dissertation, Stanford University, Stanford, CA, USA, 2011. Available online: https://perma.cc/3TDH-TB2S (accessed on 28 April 2022).
  18. Scholz, D. Design of Hydrogen Passenger Aircraft—How much ‘Zero-Emission’ is Possible; Hamburg Aerospace Lecture Series; HAW Hamburg: Hamburg, Germany, 2020. [Google Scholar] [CrossRef]
  19. Beck, N.; Landa, T.; Seitz, A.; Boermans, L.; Liu, Y.; Radespiel, R. Drag Reduction by Laminar Flow Control. Energies 2018, 11, 252. [Google Scholar] [CrossRef] [Green Version]
  20. Hepperle, M. MDO of Forward Swept Wings. In Proceedings of the AKATnet II Workshop, Braunschweig, Germany, 28–29 January 2008; Available online: https://perma.cc/P6CL-AAWU (accessed on 28 April 2022).
  21. Holmes, B.; Obara, C.; Martin, G.; Domack, C. Manufacturing Tolerances for Natural Laminar Flow Airframe Surfaces. SAE Trans. 1985, 94, 522–531. [Google Scholar] [CrossRef]
  22. Risse, K.; Stumpf, E. Conceptual Aircraft Design including Hybrid Laminar Flow Control. CEAS Aeronaut. J. 2014, 5, 333–343. [Google Scholar] [CrossRef]
  23. Sudhi, A.; Elham, A.; Badrya, C. Coupled Boundary-Layer Suction and Airfoil Optimization for Hybrid Laminar Flow Control. AIAA J. 2021, 59, 5158–5173. [Google Scholar] [CrossRef]
  24. Mosca, V.; Karpuk, S.; Badrya, C.; Elham, A. Multidisciplinary Design Optimisation of a Fully Electric Regional Aircraft Wing with Active Flow Control Technology. Aeronaut. J. 2021, 126, 730–754. [Google Scholar] [CrossRef]
  25. Sudhi, A.; Radespiel, R.; Badrya, C. Design of Transonic Swept Wing for HLFC Application. In Proceedings of the AIAA Aviation 2021 Forum, Virtual Event. 2–6 August 2021. [Google Scholar] [CrossRef]
  26. Horst, P.; Elham, A.; Radespiel, R. Reduction of Aircraft Drag, Loads and Mass for Energy Transition in Aeronautics; Deutsche Gesellschaft für Luft- und Raumfahrt: Bonn, Germany, 2021. [Google Scholar] [CrossRef]
  27. Dähne, S.; Hühne, C. Gradient Based Structural Optimization of a Stringer Stiffened Composite Wing Box with Variable Stringer Orientation. In Proceedings of the World Congress of Structural and Multidisciplinary Optimisation, Braunschweig, Germany, 5–9 June 2020; pp. 814–826. [Google Scholar] [CrossRef]
  28. Wunderlich, F.T.; Dähne, S.; Reimer, L.; Schuster, A.; Brodersen, O. Global Aero-Structural Design Optimization of More Flexible Wings for Commercial Aircraft. In Proceedings of the AIAA Aviation 2020 Forum, Virtual Event. 15–19 June 2020; Volume 33, pp. 1–18. [Google Scholar] [CrossRef]
  29. Liu, X.; Sun, Q. Gust Load Alleviation with Robust Control for a Flexible Wing. Shock Vib. 2016, 2016, 1060574. [Google Scholar] [CrossRef] [Green Version]
  30. Ying, B.; Changchum, X. Gust Load Alleviation Wind Tunnel Tests of a Large-aspect-ratio Flexible Wing with Piezoelectric Control. J. Aeronaut. 2017, 30, 292–309. [Google Scholar] [CrossRef]
  31. Beyer, Y.; Kuzolap, A.; Steen, M.; Diekmann, H.; Fezans, N. Adaptive Nonlinear Flight Control of STOL-Aircraft Based on Incremental Nonlinear Dynamic Inversion. In Proceedings of the 2018 AIAA Aviation Forum, Atlanta, GA, USA, 25–29 June 2018. [Google Scholar] [CrossRef] [Green Version]
  32. Ehlers, J.; Fezans, N. Airborne Doppler LiDAR Sensor Parameter Analysis for Wake Vortex Impact Alleviation Purposes. In Proceedings of the 2015 CEAS Conference on Guidance, Navigation and Control, Toulouse, France, 13–15 April 2015. [Google Scholar] [CrossRef]
  33. Khalil, K.; Asaro, S.; Bauknecht, A. Active Flow Control Devices for Wing Load Alleviation. In Proceedings of the AIAA Aviation 2020 Forum, Virtual Event. 15–19 January 2020; pp. 1–22. [Google Scholar] [CrossRef]
  34. Brooks, T.; Kennedy, G.; Martins, J. High-fidelity Multipoint Aerostructural Optimization of a High Aspect Ratio Tow-steered Composite Wing. In Proceedings of the 58th AIAA/ASCE/AHS/ASC Structures, Structural Dynamics and Materials Conference, Virtual Event. 9–13 January 2017. [Google Scholar] [CrossRef] [Green Version]
  35. Bishara, M.; Horst, P.; Madhusoodanan, H.; Brod, M.; Daum, B.; Rolfes, R. A Structural Design Concept for a Multi-Shell Blended Wing Body with Laminar Flow Control. Energies 2018, 11, 383. [Google Scholar] [CrossRef] [Green Version]
  36. Giescke, D.; Lehmler, M.; Friedrichs, J.; Blinstrub, J.; Bertsch, L.; Heinze, W. Evaluation of Ultra-high Bypass Ratio Engines for an Over-wing Aircraft Configuration. J. Glob. Power Propuls. Soc. 2018, 2, 493–515. [Google Scholar] [CrossRef]
  37. Raymer, D. Aircraft Design: A Conceptual Approach, 6th ed.; American Institute of Aeronautics and Astronautics: Washington, DC, USA, 2018. [Google Scholar] [CrossRef] [Green Version]
  38. Gudmundsson, S. General Aviation Aircraft Design: Applied Methods and Procedures, 1st ed.; Butterworth-Heinemann: Oxford, UK, 2013. [Google Scholar] [CrossRef]
  39. Torenbeek, E. Synthesis of Subsonic Airplane Design; Springer: Delft, The Netherlands, 1982. [Google Scholar] [CrossRef]
  40. Roskam, J. Airplane Design, 2nd ed.; Darcorporation: Lawrence, KS, USA, 2003; Volume 1–8. [Google Scholar]
  41. Loftin, L. Subsonic Aircraft: Evolution and the Matching of Size to Performance; NASA RP 1060; NASA Langley: Hampton, VA, USA, 1980; Available online: https://perma.cc/EJY8-VZ47 (accessed on 28 April 2022).
  42. Nita, M.; Scholz, D. Estimating the Oswald Factor from Basic Aircraft Geometrical Parameters. In Proceedings of the Deutscher Luft- und Raumfahrtkongress 2012, Berlin, Germany, 10–12 September 2012; Available online: https://nbn-resolving.org/urn:nbn:de:101:1-201212176728 (accessed on 28 April 2022).
  43. Shevell, R.; Bayan, F. Development of a Method for Predicting the Drag Divergence Mach Number and the Drag due to Compressibility for Conventional and Supercritical Wings; Research Report SUDAAR 522; Stanford University: Stanford, CA, USA, 1980; Available online: https://perma.cc/XN5X-EUZN (accessed on 28 April 2022).
  44. Drela, M.; Youngren, H. Athena Vortex-Lattice Method. Available online: https://perma.cc/RWM5-NFK9 (accessed on 28 April 2022).
  45. Wells, D.; Horvath, B.; McCullers, L. The Flight Optimization System Weights Estimation Method; NASA TM 20170005851; NASA: Hampton, VA, USA, 2017; Available online: https://core.ac.uk/display/84913944 (accessed on 28 April 2022).
  46. Elham, A.; La Rocca, G.; van Tooren, M. Development and Implementation of an Advanced, Design-sensitive Method for Wing Weight Estimation. Aerosp. Sci. Technol. 2013, 29, 100–113. [Google Scholar] [CrossRef]
  47. Yarygina, V.; Popov, M. Development of the Weight Formula for a Folding Wing. Russ. Aeronaut. 2012, 55, 120–126. [Google Scholar] [CrossRef]
  48. Lukaczyk, T.; Wendroff, A.; Colonno, M.; Economon, T.; Alonso, J.; Orra, T.; Ilario, C. SUAVE: An Open-Source Environment for Multi-Fidelity Conceptual Vehicle Design. In Proceedings of the 16th AIAA ISSMO Multidisciplinary Analysis and Optimization Conference, Dallas, TX, USA, 22–26 June 2015. [Google Scholar] [CrossRef] [Green Version]
  49. Hoelzen, J.; Liu, Y.; Bensmann, B.; Winnefeld, C.; Elham, A.; Friedrichs, J.; Hanke-Rauschenbach, R. Conceptual Design of Operation Strategies for Hybrid-Electric Aircraft. Energies 2018, 11, 217. [Google Scholar] [CrossRef] [Green Version]
  50. Wollf, C.; Riefer, D. Clean Skies for Tomorrow: Sustainable Aviation Fuels as a Pathway to Net-Zero Aviation. In Proceedings of the World Economic Forum, Davos-Klosters, Switzerland, 21–24 January 2020; Available online: https://perma.cc/BB7G-CTQK (accessed on 28 April 2022).
  51. Valdes, R.; Comendador, V.; Campos, L. How Much Can Carbon Taxes Contribute to Aviation Decarbonization by 2050. Sustainability 2021, 13, 1086. [Google Scholar] [CrossRef]
  52. Scholz, D. Limits to Principles of Electric Flight; Deutscher Luft- und Raumfahrtkongress: Darmstadt, Germany, 2019. [Google Scholar] [CrossRef]
  53. Baughcum, S.; Tritz, T.; Henderson, S.; Pickett, D. Scheduled Civil Aircraft Emission Inventories for 1992: Database Development and Analysis; NASA Contractor Report 4700. 1996. Available online: https://perma.cc/8BFX-33R9 (accessed on 28 April 2022).
  54. Pavlenko, N.; Searle, S. Assessing the Sustainability Implications of Alternative Aviation Fuels. The International Council on Clean Transportation. 2021. Available online: https://perma.cc/XPG7-UK79 (accessed on 28 April 2022).
  55. Andersson, J.; Krus, P. A Multi-Objective Optimization Approach to Aircraft Preliminary Design. In Proceedings of the SAE World Aviation Congress, Montreal, QC, Canada, 8–11 September 2003. [Google Scholar] [CrossRef]
  56. A320 Aircraft Characteristics. Airport and Maintenance Planning; Airbus S.A.S, November 2019. Available online: https://perma.cc/7AGL-YQXJ (accessed on 28 April 2022).
  57. Type-Certificate Data Sheet No. E.003 for CFM56-5B and CFM56-5C Series Engines; EASA, December 2019. Available online: https://perma.cc/XUX6-B22H (accessed on 28 April 2022).
  58. Annex 14 to the Convention on International Civil Aviation, Aerodromes, Volume 1, 8th ed.; July 2018. Available online: https://perma.cc/H853-AMWW (accessed on 28 April 2022).
  59. Kruse, M.; Wunderlich, T.; Heinrich, L. A Conceptual Study of a Transonic NLF Transport Aircraft with Forward Swept Wings. In Proceedings of the 30th AIAA Applied Aerodynamics Conference, New Orleans, LA, US, 25–28 June 2012. [Google Scholar] [CrossRef] [Green Version]
  60. Kalarikovilagam Srinivasan, G.; Bertram, O. Preliminary Design and System Considerations for an Active Hybrid Laminar Flow Control System. Aerospace 2019, 6, 109. [Google Scholar] [CrossRef] [Green Version]
  61. Iyer, V.; Bertram, O. Assessment of a Chamberless Active HLFC System for the Vertical Tail Plane of a Mid-Range Transport Aircraft; Deutsche Gesellschaft für Luft- und Raumfahrt: Munich, Germany, 2017. [Google Scholar] [CrossRef]
  62. Niu, M. Airframe Structural Design; Conmilt Press: Los Angeles, CA, USA, 1988. [Google Scholar]
  63. Obert, E. Aerodynamic Design of Transport Aircraft; IOS Press BV: Amsterdam, The Netherlands, 2009. [Google Scholar]
  64. Certification Specifications and Acceptable Means of Compliance for Large Aeroplanes CS-25. June 2020. Available online: https://perma.cc/9K76-KJPW (accessed on 28 April 2022).
  65. Filippone, A. Advanced Aircraft Flight Performance; Cambridge University Press: Cambridge, UK, 2012. [Google Scholar] [CrossRef]
  66. Wick, A.; Hooker, J.; Walker, J.; Chan, D.; Plumley, R.; Zeune, C. Hybrid Wing Body Performance Validation at the National Transonic Facility. In Proceedings of the AIAA SciTech Forum 2017, Grapevine, TX, USA, 9–13 January 2017. [Google Scholar] [CrossRef]
  67. Hooker, J.; Wick, A.; Walker, J.; Zeune, C.; Agelastos, A. Over Wing Nacelle Installations for Improved Energy Efficiency. In Proceedings of the 31st AIAA Applied Aerodynamics Conference, San Diego, CA, USA, 24–27 June 2013. [Google Scholar] [CrossRef]
  68. Bolsunovsky, A.; Buzoverya, N.; Chernyshev, I.; Cherny, K.; Pushchin, N. The numerical and experimental studies on the over-wing-engine configurations aerodynamics. In Proceedings of the EUCASS2019, Madrid, Spain, 1–4 July 2019. [Google Scholar] [CrossRef]
Figure 1. Schematic views of the active suction system. Adapted from [19].
Aerospace 09 00279 g001
Figure 2. Initial aircraft sizing framework using SUAVE.
Aerospace 09 00279 g002
Figure 3. Forcing factor as a function of altitude. Adapted from [17].
Aerospace 09 00279 g003
Figure 4. A320-200 mission profile.
Aerospace 09 00279 g004
Figure 5. Constraint diagram and comparison against A320-200 reference data.
Aerospace 09 00279 g005
Figure 6. Planform comparison between reference and sized configurations of A320-200.
Aerospace 09 00279 g006
Figure 7. Summary of experimental and numerical analyses of wings and airfoils. Adapted from [20].
Aerospace 09 00279 g007
Figure 8. Fuselage suction profile at Mach = 0.8. Adapted from [19]. The red line represents the selected conservative value for the analysis.
Aerospace 09 00279 g008
Figure 9. Fuselage skin thickness for medium and long–range aircraft.
Aerospace 09 00279 g009
Figure 10. Aircraft configurations considered for the design study.
Aerospace 09 00279 g010
Figure 11. Sensitivity study of the aircraft to wing loading and aspect ratio (Mach = 0.71, Altitude = 7600 m, Sweep = +20 deg, Taper ratio = 0.25).
Aerospace 09 00279 g011
Figure 12. Summary of MDO studies for several design cases.
Aerospace 09 00279 g012
Figure 13. The two engine configurations considered for the trade study.
Aerospace 09 00279 g013
Figure 14. Comparison between two aircraft planforms.
Aerospace 09 00279 g014
Figure 15. Boundary layer transition profile for designed configurations.
Aerospace 09 00279 g015
Figure 16. Aircraft performance for optimized mid-range aircraft.
Aerospace 09 00279 g016
Figure 17. Emission, DOC, and range sensitivities to cruise Mach number and altitude.
Aerospace 09 00279 g017
Figure 18. Technology sensitivity summary for the equivalent CO2 emissions for the designed flight mission (Mach = 0.71, Altitude = 7600 m, maximum payload).
Aerospace 09 00279 g018
Table 1. SGTP indeces. Adapted from [17].
ComponentParameterUnits
C O 2 3.58 × 10 14 K/kg C O 2
O 3 s 7.79 × 10 12 K/kg N O x
O 3 L −9.14 × 10 13 K/kg N O x
C H 4 −3.90 × 10 12 K/kg N O x
Contrails1.37 × 10 13 K/km
Cirrus4.12 × 10 13 K/km
Table 2. Comparison between reference and calculated values of A320-200.
ParameterReferenceSUAVE% Error
Maximum take-off mass, kg78,00077,840−0.2
Operating empty mass, kg42,60042,497−0.2
Payload mass, kg19,90019,9000.0
Fuel burn, kg15,50015,447−0.3
Wing loading, kg/m26296290.0
Thrust-to-weight ratio, N/N0.3140.3150.3
Take-off field length (MTOM, SL, ISA), m21002091−0.4
Landing field length (MLM, SL, ISA), m150016036.87
Table 3. SE2A MR top-level requirements.
RequirementValueUnits
Harmonic range4000km
Maximum payload19,650kg
Cruise Mach number0.71
Design cruise altitude7650m
Take-off field length2100m
Landing distance1500m
Mission reserveCS-25 [64]
Table 4. SE2A MR aircraft optimization problem definition.
ParameterLowerUpperUnits
minimize1. C O 2 , e q
2. D O C
wrtAspect ratio8.0018.00
Taper ratio0.20.5
Root chord3.008.00m
Root thickness0.130.15
Tip thickness0.100.12
Thrust-to-weight ratio0.200.35N/N
subject toTake-off field length2100 m
Landing field length1500 m
Wingspan 45.0m
Tip chord 1.35m
Table 5. Comparison between two forward-swept wing configurations with under and over-the-wing engines. Fuel mass is specified for the maximum payload scenario.
ParameterUnder-the-Wing EnginesOver-the-Wing EnginesUnits
m M T O M 62,74461,921kg
m e m p t y 35,49934,998kg
m e n g i n e 34613297kg
m n a c e l l e s 333314kg
m l a n d i n g g e a r 26402413kg
m f u e l 75957272kg
m w i n g 62406178kg
m f u s e l a g e 69316931kg
m e m p e n n a g e 12741274kg
m s y s t e m s 14,19714,172kg
m p a i n t 418418kg
Table 6. Final masses summary of two configurations. Fuel mass is specified for the maximum payload scenario.
ParameterForward-SweptBackward-SweptUnits
m M T O M 61,92162,715kg
m e m p t y 34,99834,705kg
m e n g i n e 32973293kg
m n a c e l l e s 314313kg
m l a n d i n g g e a r 24132421kg
m f u e l 72728359kg
m w i n g 61785898kg
m e m p e n n a g e 12741138kg
m f u s e l a g e 69316922kg
m s y s t e m s 14,17214,272kg
m p a i n t 418428kg
Table 7. Final design summary of two configurations.
ParameterForward-SweptBackward-SweptUnits
Wing
Aspect ratio12.412.11-
Span42.4643.4m
Taper ratio0.310.26-
Leading-edge sweep−16.716.0deg
Dihedral6.03.0deg
Root thickness0.130.13-
Tip thickness0.1040.105-
Root incidence1.02.0deg
Tip incidence1.0−1.0deg
Flap chord ratio0.20.2-
Flap span ratio0.60.6-
Aileron chord ratio0.250.25-
Aileron span ratio0.250.25-
Vertical tail
Aspect ratio1.891.89-
Span7.457.45m
Taper ratio0.30.3-
Leading-edge sweep36.036.0deg
Root thickness0.090.09-
Tip thickness0.090.09-
Rudder chord ratio0.250.25-
Rudder span ratio0.90.9-
Horizontal tail
Aspect ratio6.024.86-
Span15.613.0m
Taper ratio0.40.4-
Leading-edge sweep30.030.0deg
Dihedral8.08.0deg
Root thickness0.090.09-
Tip thickness0.090.09-
Elevator chord ratio0.250.25-
Elevetor span ratio0.90.9-
Table 8. Design-point summary and an off-design comparison of sized aircraft to A320.
ParameterForward-
Swept
Backward-
Swept
A320Units
Acquisition price130.6129.890.6mil EUR
Mach 0.71, 7600 m
DOC29,84831,19739,773EUR/flight
CO 2 , e q 57.4 × 10 3 62.4 × 10 3 98.9 × 10 3 kg
L / D c r u i s e 25.621.7516.25-
Mach 0.71, 10,500 m
DOC29,50930,59940,182EUR/flight
CO 2 , e q 145.7 × 10 3 150.6 × 10 3 224.1 × 10 3 kg
L / D c r u i s e 29.525.617.0-
Mach 0.76, 10,500 m
DOC29,82431,23039,816EUR/flight
CO 2 , e q 148.3 × 10 3 154.9 × 10 3 224.4 × 10 3 kg
L / D c r u i s e 25.821.816.4-
Table 9. Equivalent CO2 emissions for each technology applied separately at their maximum capabilities for the designed flight mission.
ParameterCO2,eq EmissionUnits
No technologies90,953kg/flight
Load alleviation89,433kg/flight
Advanced materials and structures89,057kg/flight
UHBPR engines76,706kg/flight
Laminar flow control68,857kg/flight
Publisher’s Note: MDPI stays neutral with regard to jurisdictional claims in published maps and institutional affiliations.

