1. Introduction
With the development of science and technology and the improvement of the war system, the current mode of war has changed from the original mechanized war to the information war; the combat unit has changed from an original single-service operation to a multi-service joint operation. The type of war has also changed from the original quantity-scale type and manpower-intensive type to the quality-efficiency type and technology-intensive type [
1]. With the evolution of modern warfare, highly informatized weapon systems, sensitive information resources and ultra-multi-dimensional combat space are the directions for the development of today’s informatized warfare [
2]. Under this trend, weapons and equipment are also being upgraded towards generalization, networking and miniaturization [
3]. With the evolution of the form of warfare and the continuous enhancement of the information perception capability of aerospace equipment, the information processed and interacted by the human–machine interface of aerospace equipment is changing from traditional situational information to multi-dimensional complex information of land, sea, air, sky, and electricity [
4,
5]. The human–machine interface of the command-and-control system needs to process complex information such as multi-dimensional, high-density, and multi-form battlefield situations, equipment status, and combat instructions in a shorter time [
6]. Through the investigation and study of various existing aerospace equipment, it is found that the current aerospace equipment mainly performs information perception and acquisition on a two-dimensional basis. With the continuous evolution and development of war forms, multidimensional information and situation bring great pressure to the original two-dimensional information perception and acquisition mechanism, and also bring obstacles and limitations in information perception to operators [
7]. It is difficult to meet the multi-dimensional and complex information display and interaction of land, sea, air, sky and electricity, and unable to adapt to the combat needs of air and space equipment in future wars [
8]. The development of mixed reality (hereinafter referred to as MR) technology provides a new display interaction mode to solve this problem, which can display information in a higher dimension and realize holographic perception of the overall situation information [
9]. Moreover, with the evolution of war forms, the advantages of small size and portability of MR become particularly important. However, while it brings good interactive modes of information display and also brings higher visual fatigue and cognitive load to users [
10]. Multi-channel interaction is an important interaction method in human–computer interaction. Through the cooperation of multiple sensory channels, task performance and cognitive load can be significantly improved [
11]. Using multi-channel interaction in the improvement of MR can not only improve performance, reduce visual fatigue and cognitive load, but users are no longer limited by complex interactions and can focus more on actual tasks [
12].
The command and control of air defense tasks were all carried out under the two-dimensional display interaction system. This display interaction method has several problems such as insufficient information display dimensions, low display quality, and complex interactive operations, which greatly affect the performance of air defense missions [
13,
14,
15]. However, mission performance is a key factor in selecting and optimizing display interaction systems in air defense missions. An MR display interactive system has good immersion and interaction modes. When the MR display interactive system is used to complete a complex command and control task, it can achieve higher task performance, establish a better interaction system [
16,
17], and has good portability. However, the MR display interactive system has the defect of high cognitive load [
18]. Therefore, how to optimize and improve the display interactive system is an urgent problem to be solved when completing the same complex command and control task.
Therefore, the research content of this paper is as follows. In the case of completing the same complex command and control task, the performance and cognitive load of the MR display interactive system and two-dimensional display interactive system were compared, and the two display interactive systems were evaluated by combining task completion time, eye movement, EEG and subjective cognitive load data. In this way, the problems of the MR display interactive system in complex command and control tasks are explored and multi-channel improvement is carried out to address the existing problems. A comprehensive evaluation was conducted between the improved MULTI-channel MR display interactive system and the first two display interactive systems to determine the most suitable display interactive system for the complex command and control system.
Patrzyk and M. Klee pointed out that when users use the traditional two-dimensional display interactive system, it leads a lack of depth perception, and the novice will have a high error rate when using the traditional two-dimensional display interactive system to perform complex tasks [
19]. Nicolas Gerig and Johnathan Mayo and others pointed out in their research that the quantity and quality of visual information cues displayed by traditional two-dimensional display modes are limited, which will affect the performance and quality of user interaction [
20]. After comparing and analyzing various display modes, Chiuhsiang Joe Lin et al. concluded that the traditional two-dimensional display mode has low immersion and visual search efficiency [
21]. It can be seen that the traditional two-dimensional display cannot meet the information display and interaction of the complex task of early warning and interception proposed in this paper. There is an urgent need to explore a new way of display interaction.
MR is a new technology that seamlessly integrates real world information and virtual world information [
22]: the physical information (visual information, sound, taste, touch, etc.) that is difficult to experience in a certain time and space of the real world is simulated and superimposed by computer science and other science and technology, and virtual information is applied to the real world [
23,
24,
25]. Perceived according to human senses, it is possible to experience a feeling beyond reality [
26,
27]. The real environment and virtual objects coexist in the same picture or space [
28]. Mixed reality technology not only displays real-world information, but also displays virtual information at the same time. The user uses the helmet display to combine the real world with computer graphics and can see the real world superimposed. The virtual world surrounds him [
29].
MR head-mounted displays are highly immersive, but due to conflicting multi-sensory inputs, head-mounted displays in MR environments are highly prone to visually induced motion sickness (VIMS) [
30,
31,
32]. Additionally, the research of Hoffman, Shibata, Jeng shows that due to the physiological characteristics of the vergence regulation system of the human eye, the degree of visual fatigue is very high when people receive information in a mixed reality environment [
33,
34,
35]. Kim, Kane, Banks, and Kanda et al., in their study, explained that the convergency-divergency-mediating conflicts in mixed reality environments caused greater binocular pressure [
36,
37].
Because MR head-mounted displays project parallax images directly into both eyes, it will cause greater visual stress to the human eye [
38,
39]. Therefore, in the same usage time, the visual stress and fatigue of MR head-mounted displays will be greater than that of 2D screens [
40].
2. Method
2.1. Subject
Twenty healthy male students aged 20–30 years old from an engineering university were selected (SD = 2.4). Everyone participated voluntarily in this experiment, and everyone underwent an eye exam with a visual acuity or corrected visual acuity of 5.0, and no color blindness or color weakness. Before the experiment, each subject was informed of the research nature of the experiment and possible complications, and their consent was obtained. The 20 students were randomly divided into two groups with 10 students in each group.
Experimental Site and Experimental Equipment
The experimental site is located indoors and the experiments were carried out in a special mixed reality training room. The site area was about 40 m2. The indoor temperature was constant at 25 °C and the humidity was 52%.
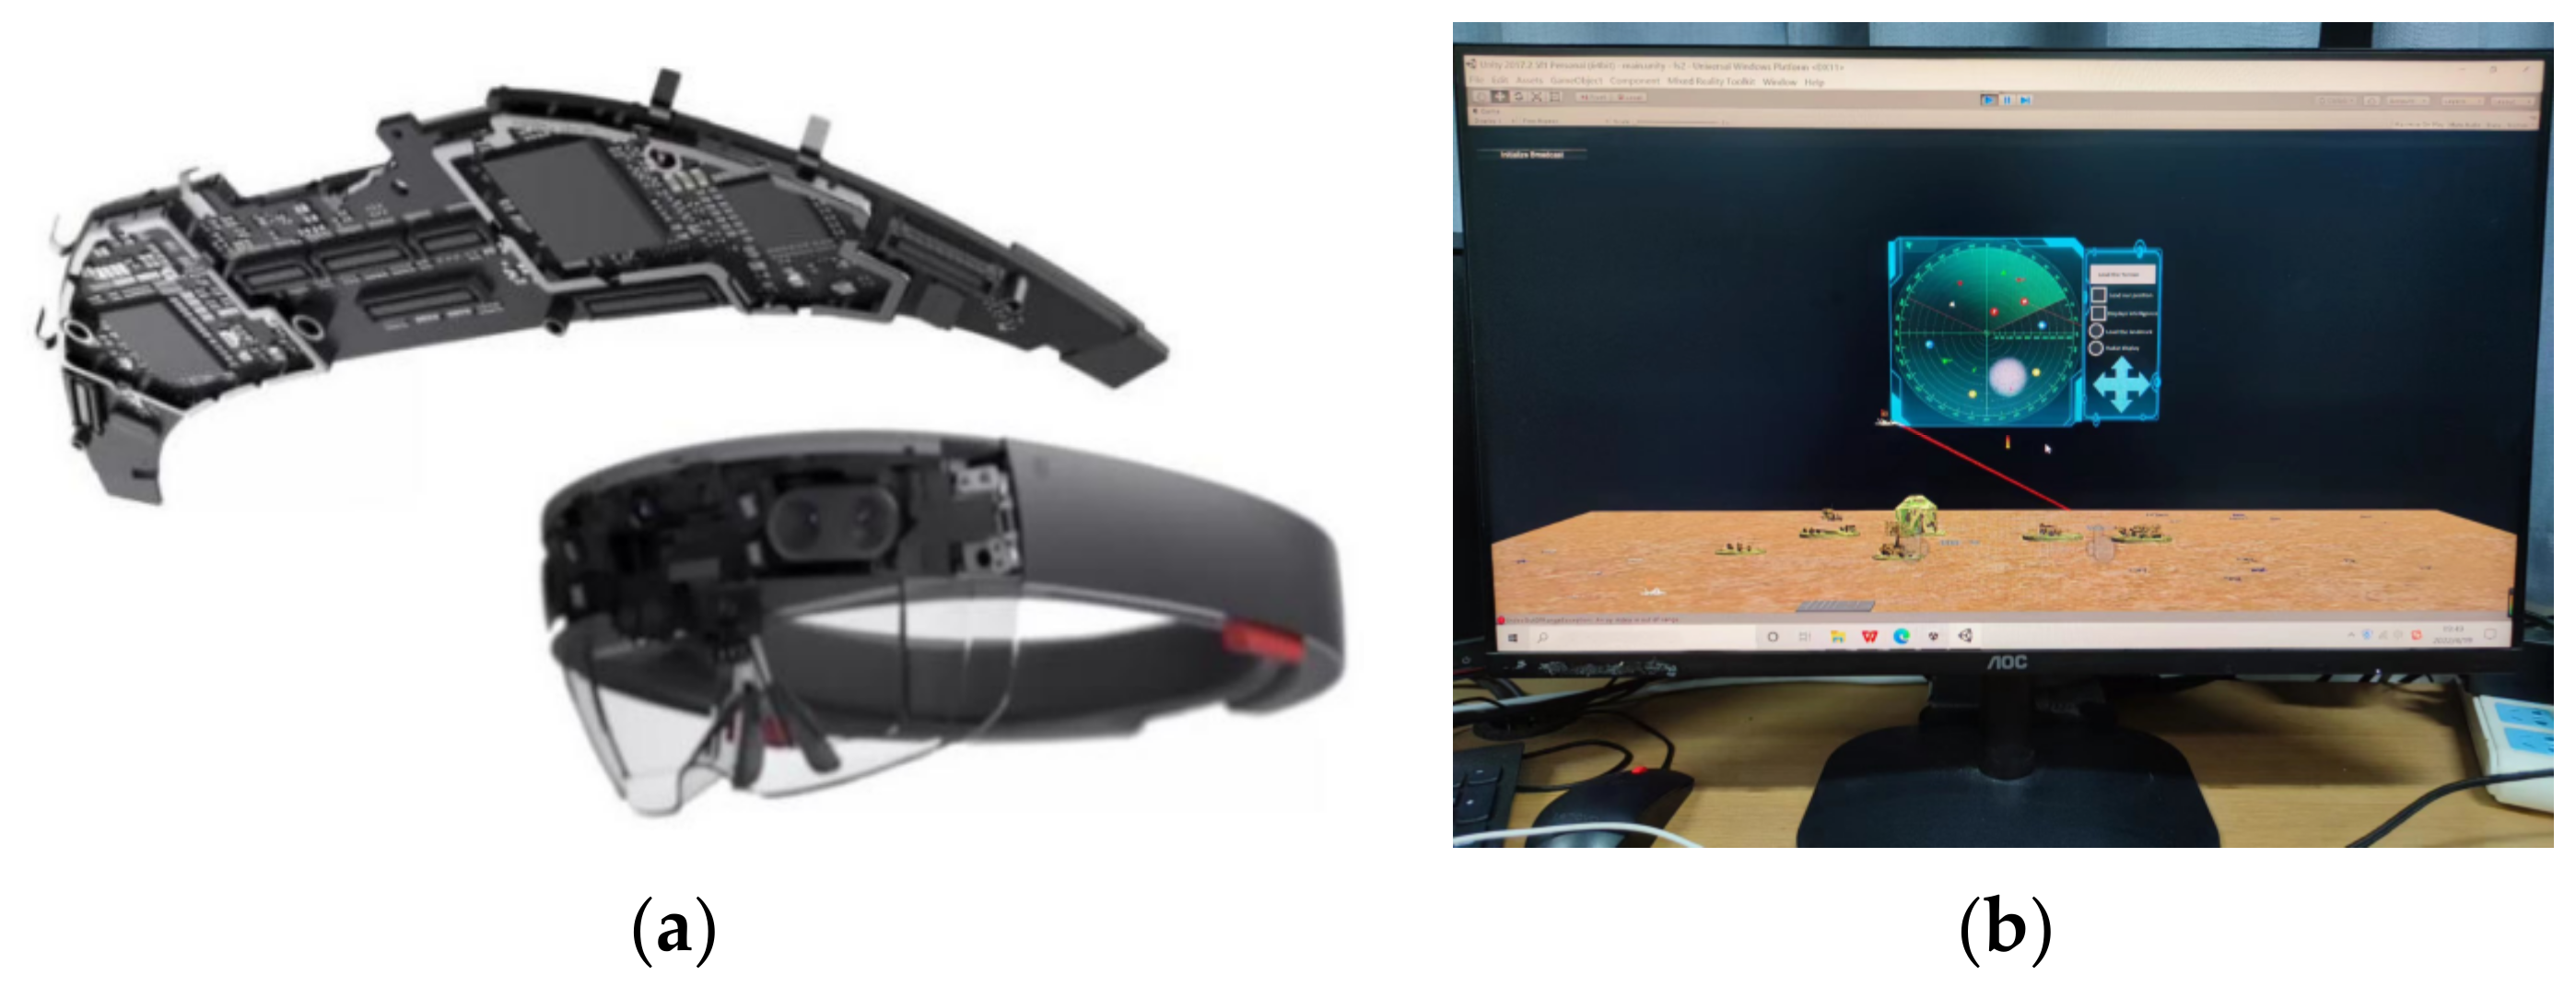
The MR display device uses Microsoft’s HoloLens2 generation, and
Figure 1a is a real photo. As a typical hardware device of mixed reality technology, users can still walk in real space without being cut off when using the device. HoloLens2 can track the user’s movement and line of sight changes and project virtual holograms onto the user’s eyes through light projection, supporting real-time interaction between users and virtual objects in gestures, sounds, and gazes in various forms. The two-dimensional display device is an AOC27-inch display with a resolution of 1920 × 1080 dpi, a screen refresh rate of 75 Hz, a screen ratio of 16:9, and a brightness adjustment of 200 cd/m
2.
Figure 1b is a real photo.
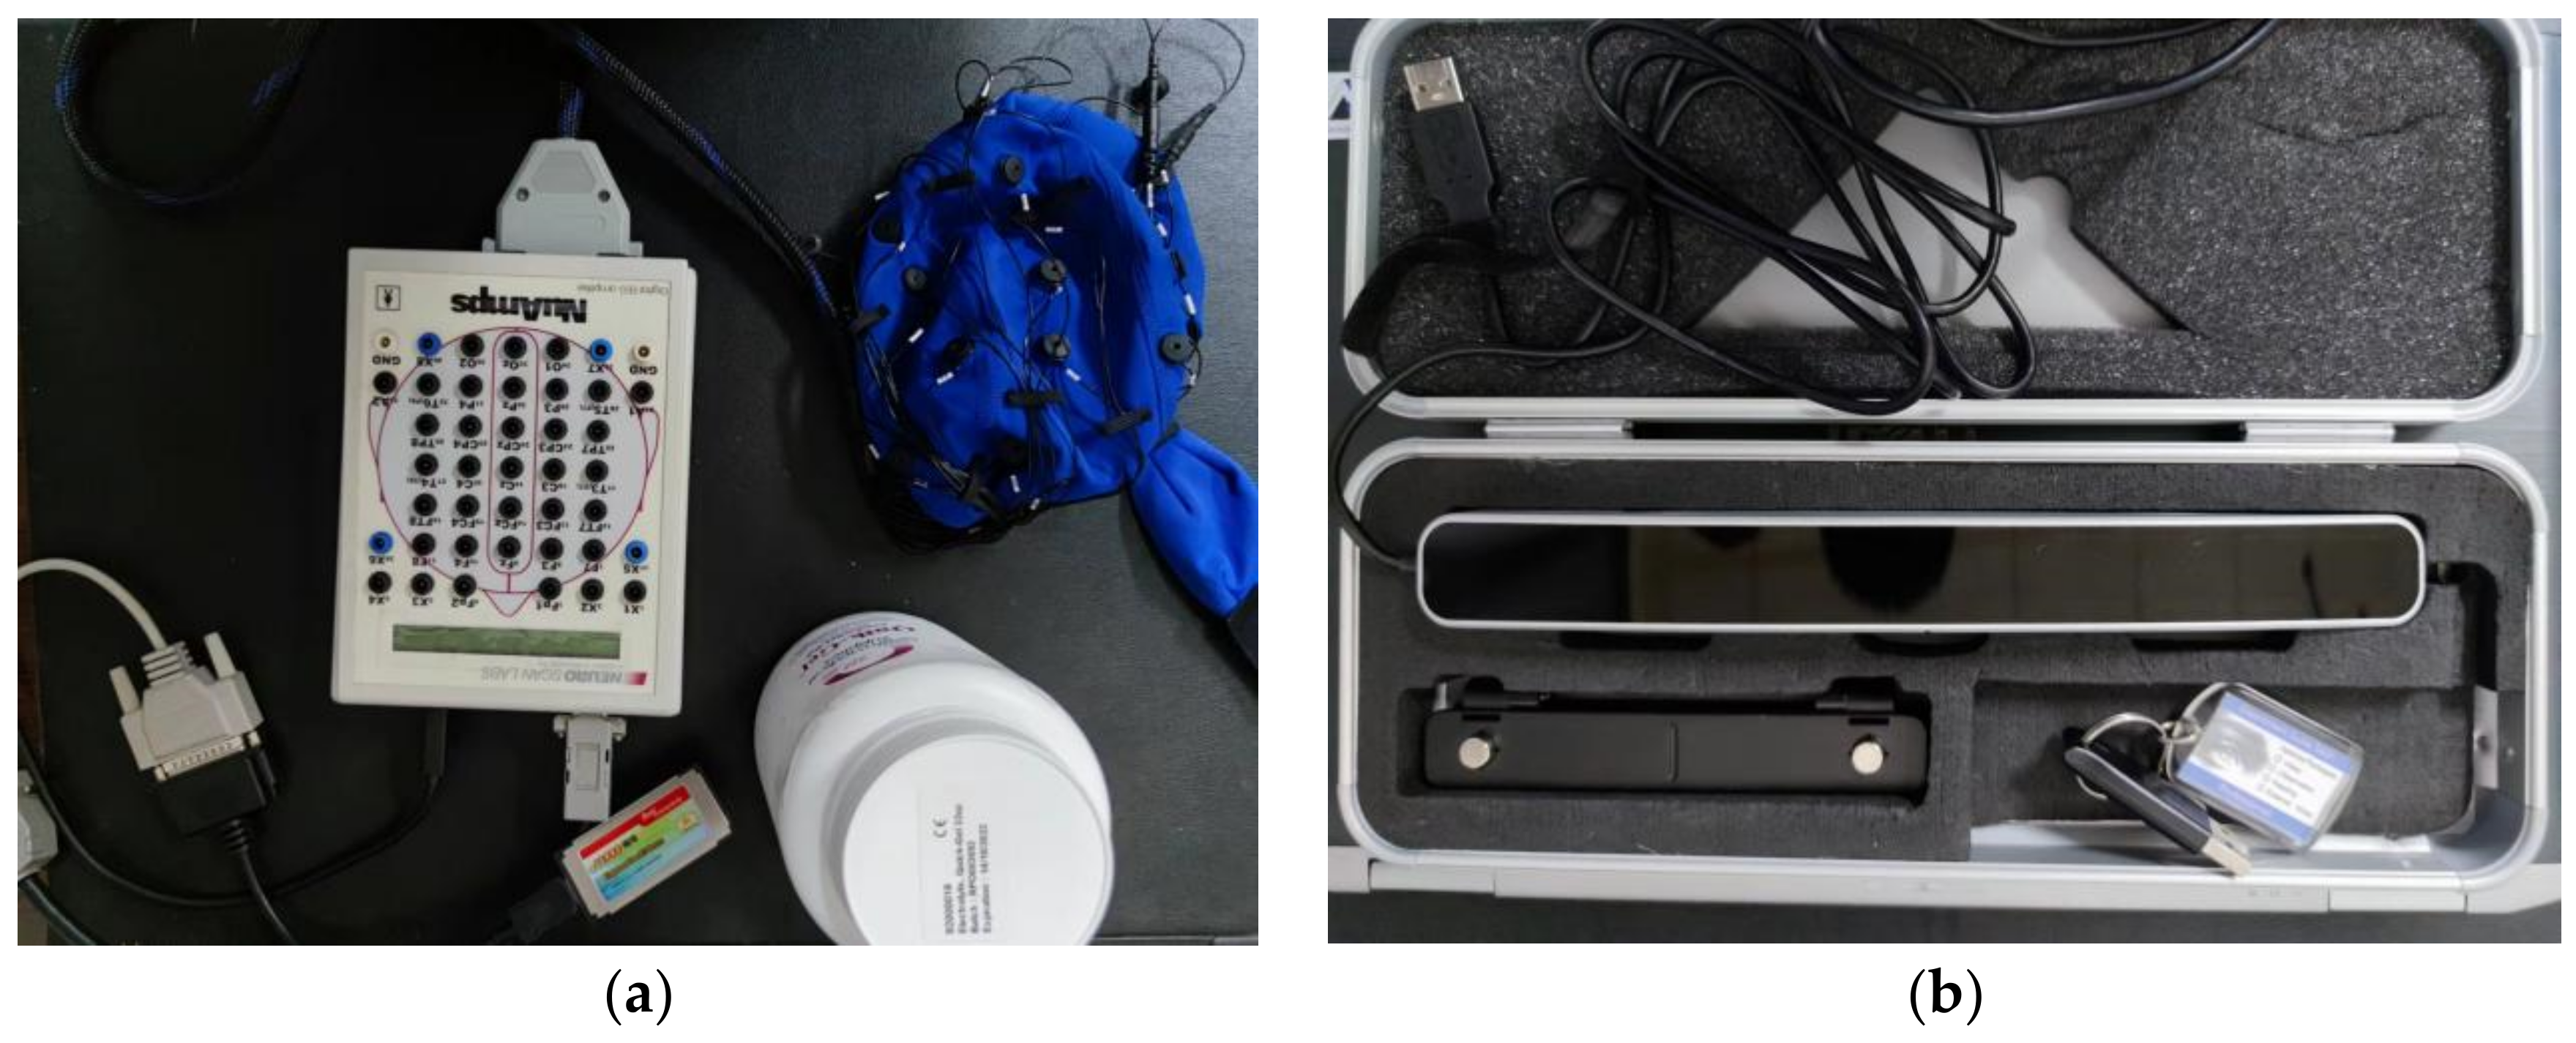
The experimental test device includes an EEG and an eye tracker. The EEG model is Nuamps7181. Its analog input is 40-lead monopole, the sampling frequency is 125, 250, 500, 1000 Hz per lead, the input range is ±130 mV, and the input impedance is not lower than 80 MOhm, Common Mode Rejection Ratio is 100 dB at 50/60 Hz, Input Noise is 0.7 μV RMS (4 μV peak-to-peak), the interface is USB, fully supports hot-plug technology,
Figure 2a is a real picture. The eye tracker model is Tobii Pro Glasses 2, with a sampling rate of 50 Hz/100 Hz, which can automatically perform parallel parallax correction, and has built-in slip compensation and tracking technology. The device also supports the absolute value measurement of the pupil, and its interface supports HDMI, USB and 3.5 mm interface.
Figure 2b is a real picture.
2.2. Experimental Task Model
The experimental task model is a command-and-control sand table system developed by Microsoft Visual C# programming language; 3D max software is used for 3D modeling, and Unity 3D is used for animation production and rendering. For the simulated air defense early warning and interception mission scenario, there were two blue-side planes, one conducting low-altitude penetration and the other conducting reconnaissance at high altitude. The red side deployed two air defense positions on the battlefield, each with radar and missile vehicles. However, the radars of the two positions of the red team could not directly detect the high-speed and low-altitude aircraft, so the red team used the drone group to conduct situational awareness on the battlefield, so as to detect the low-altitude penetration aircraft of the blue team. At the same time, the drone group transmitted the situational awareness results to the commander. The commander locked the position of the blue plane according to the data transmitted by the drone group and used the missile vehicle in the air defense position close to the blue plane to launch the missile and shoot down the blue-side plane. The high-altitude blue-side reconnaissance plane could be directly discovered by the red-side radar, and the radar could directly lock the position. The commander controlled the missile vehicle in the air defense position closer to the high-altitude blue plane to fire missiles to shoot down the blue plane according to the radar information.
Task Model Establishment
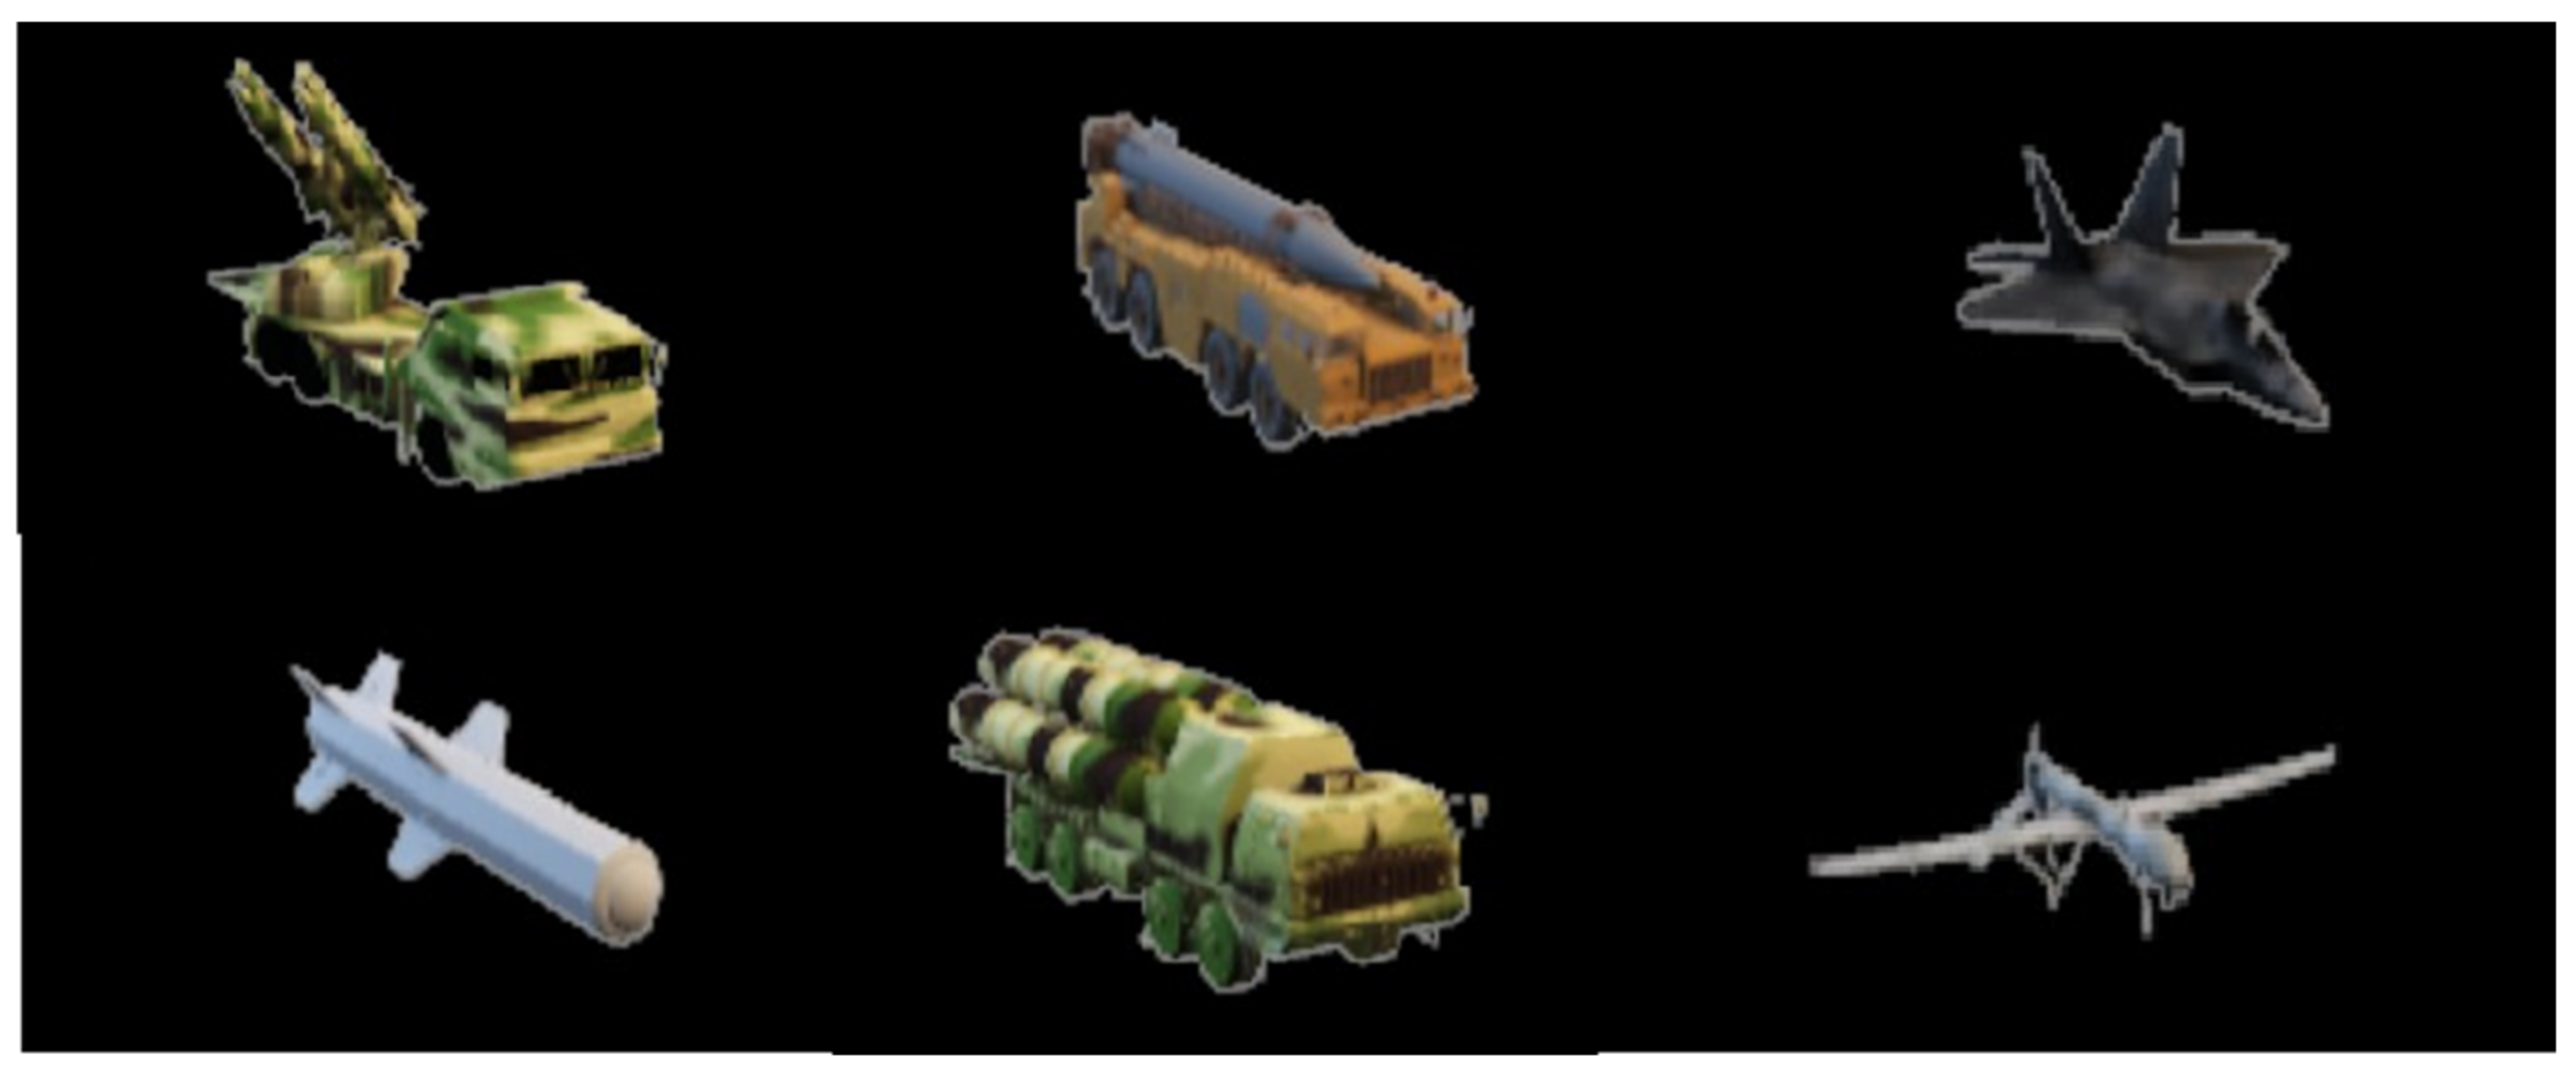
To establish a virtual model and a holographic human–computer interaction interface, using 3DMAX software, the equipment models such as radar vehicles, drones, and fighter jets required for the experiment were established [
41], as shown in
Figure 3.
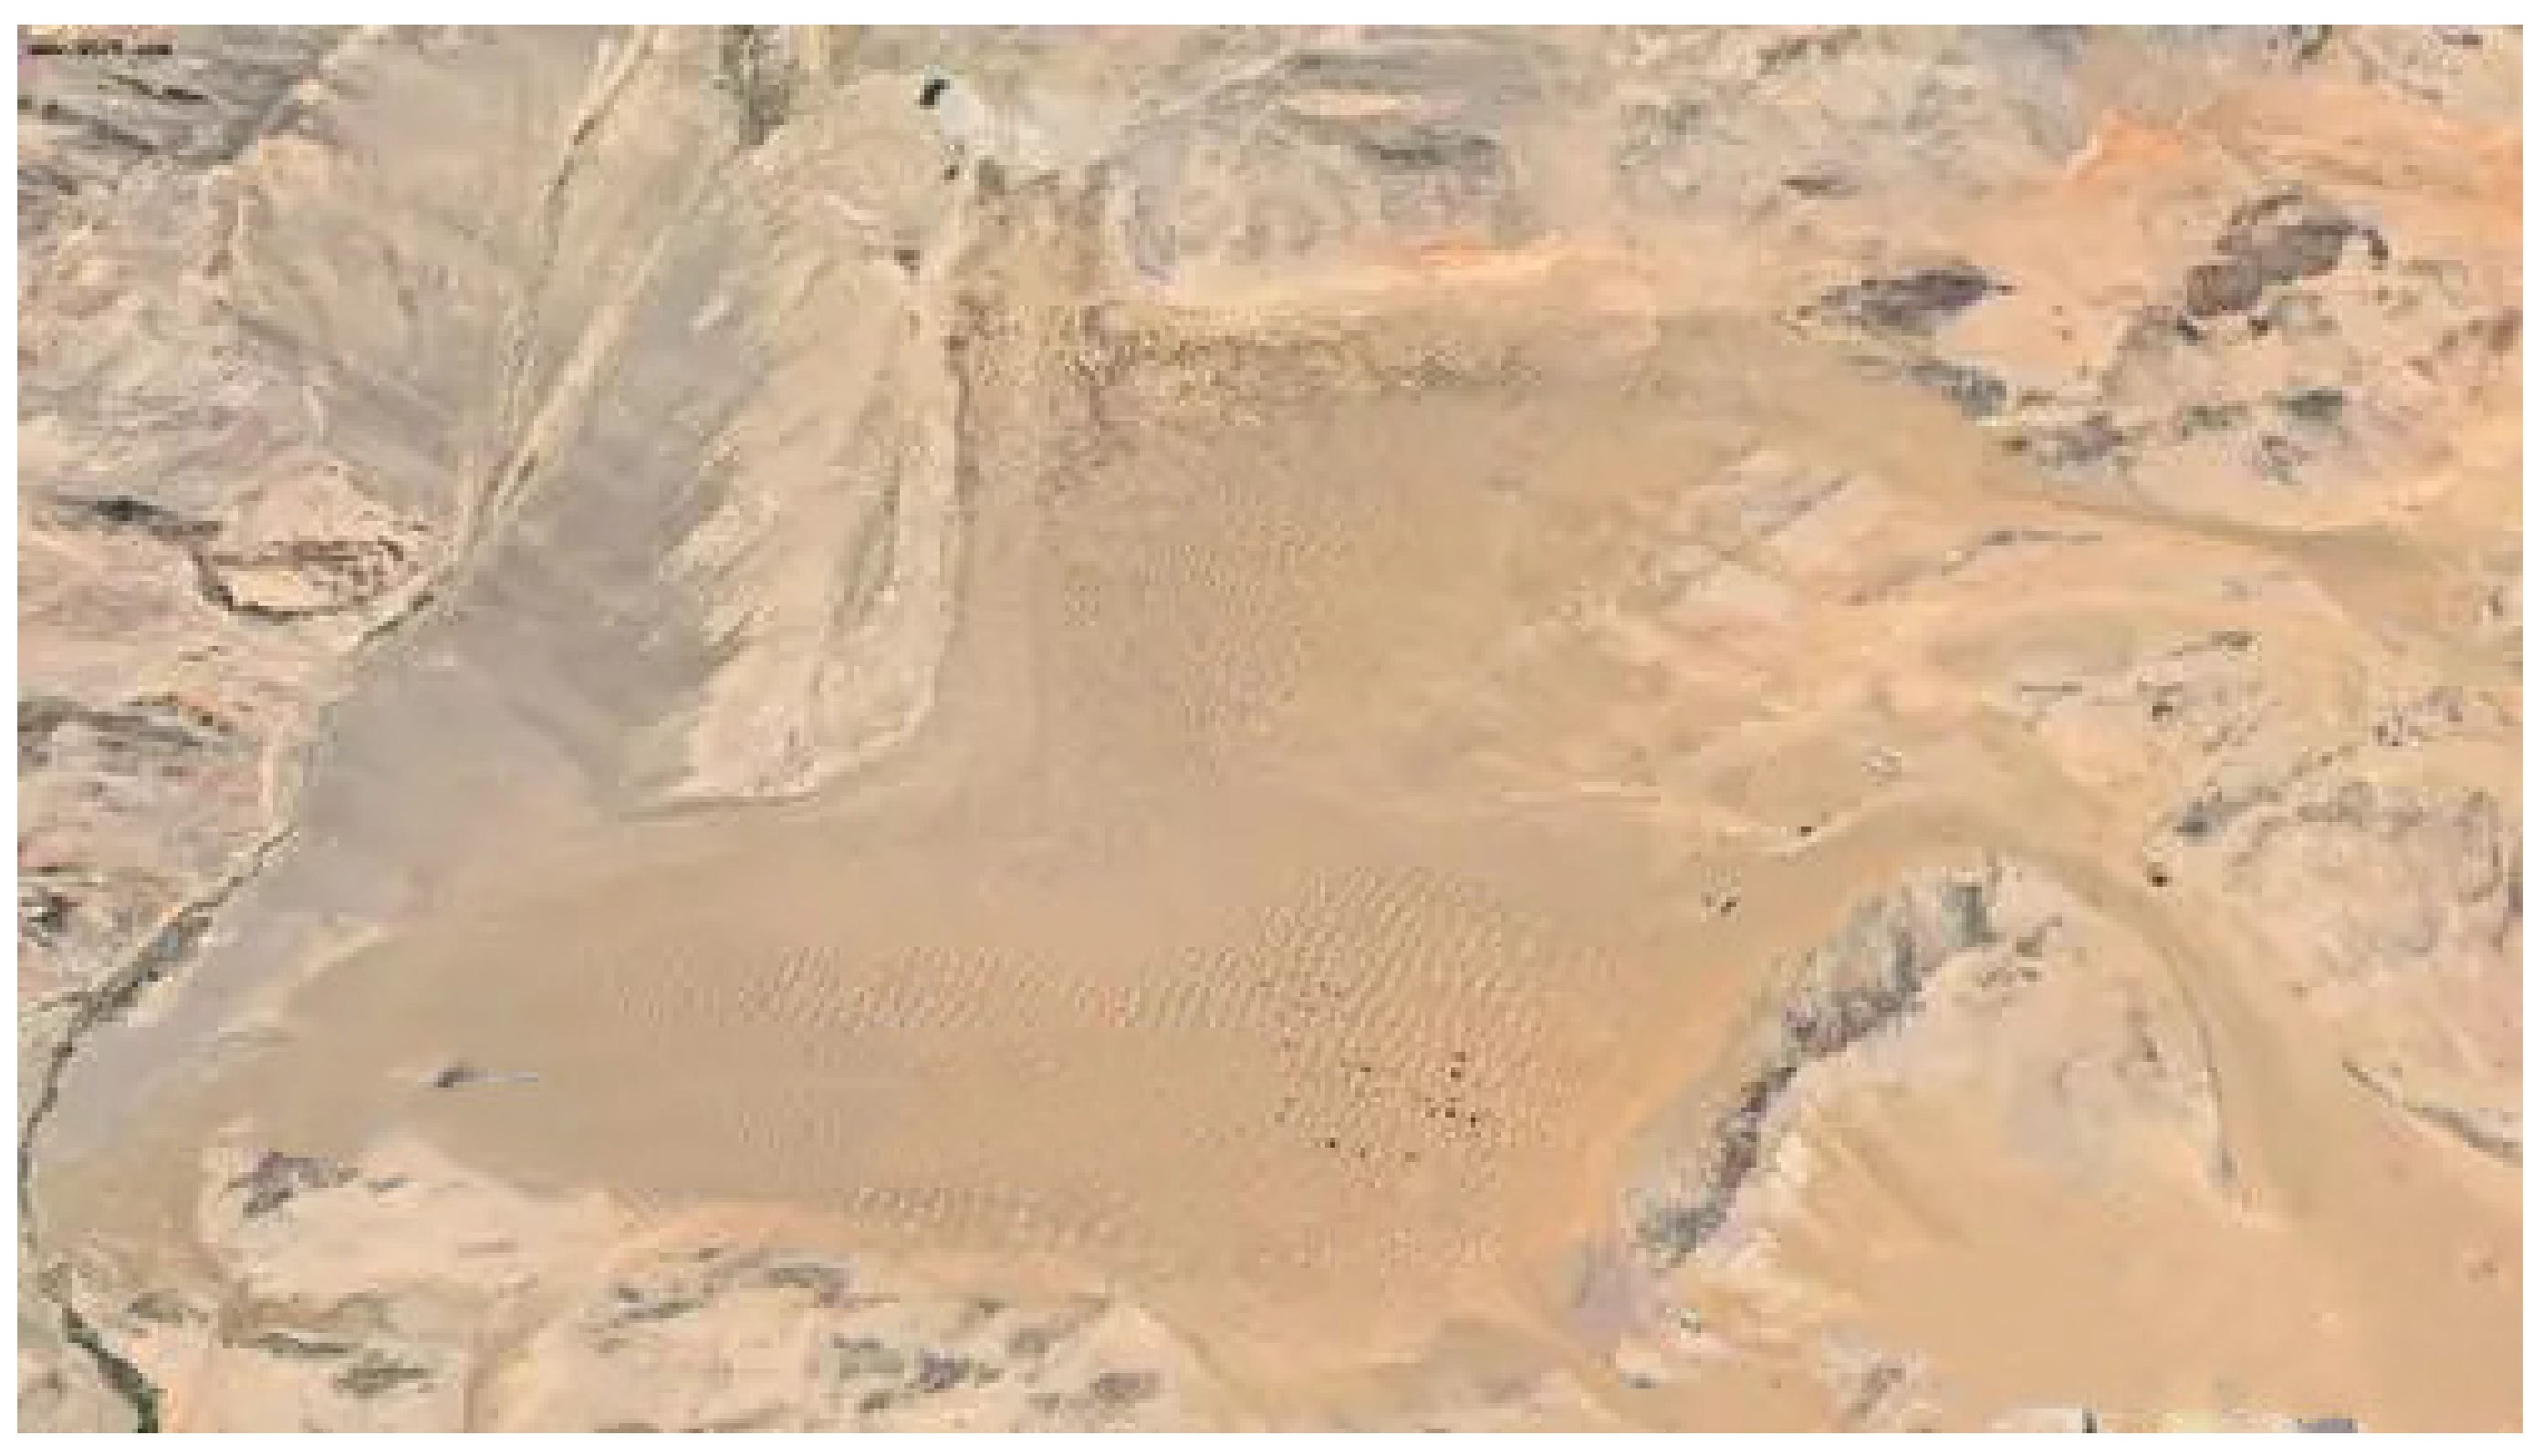
The selection of domestic and foreign air defense exercise venues was analyzed and it was concluded that the exercise locations for air defense tasks are mainly concentrated in the desert, such as the Gobi, and other sparsely populated terrain areas. A desert terrain was chosen as the map for this experiment in order to better fit the actual exercise scene, as shown in
Figure 4. In practical exercises, commanders often erase terrain details in order to reduce operational burden and error rate when conducting command and control of air defense weapons. Therefore, the selection of a terrain basically meets the general requirements of the exercise and does not affect the process and results of the experiment.
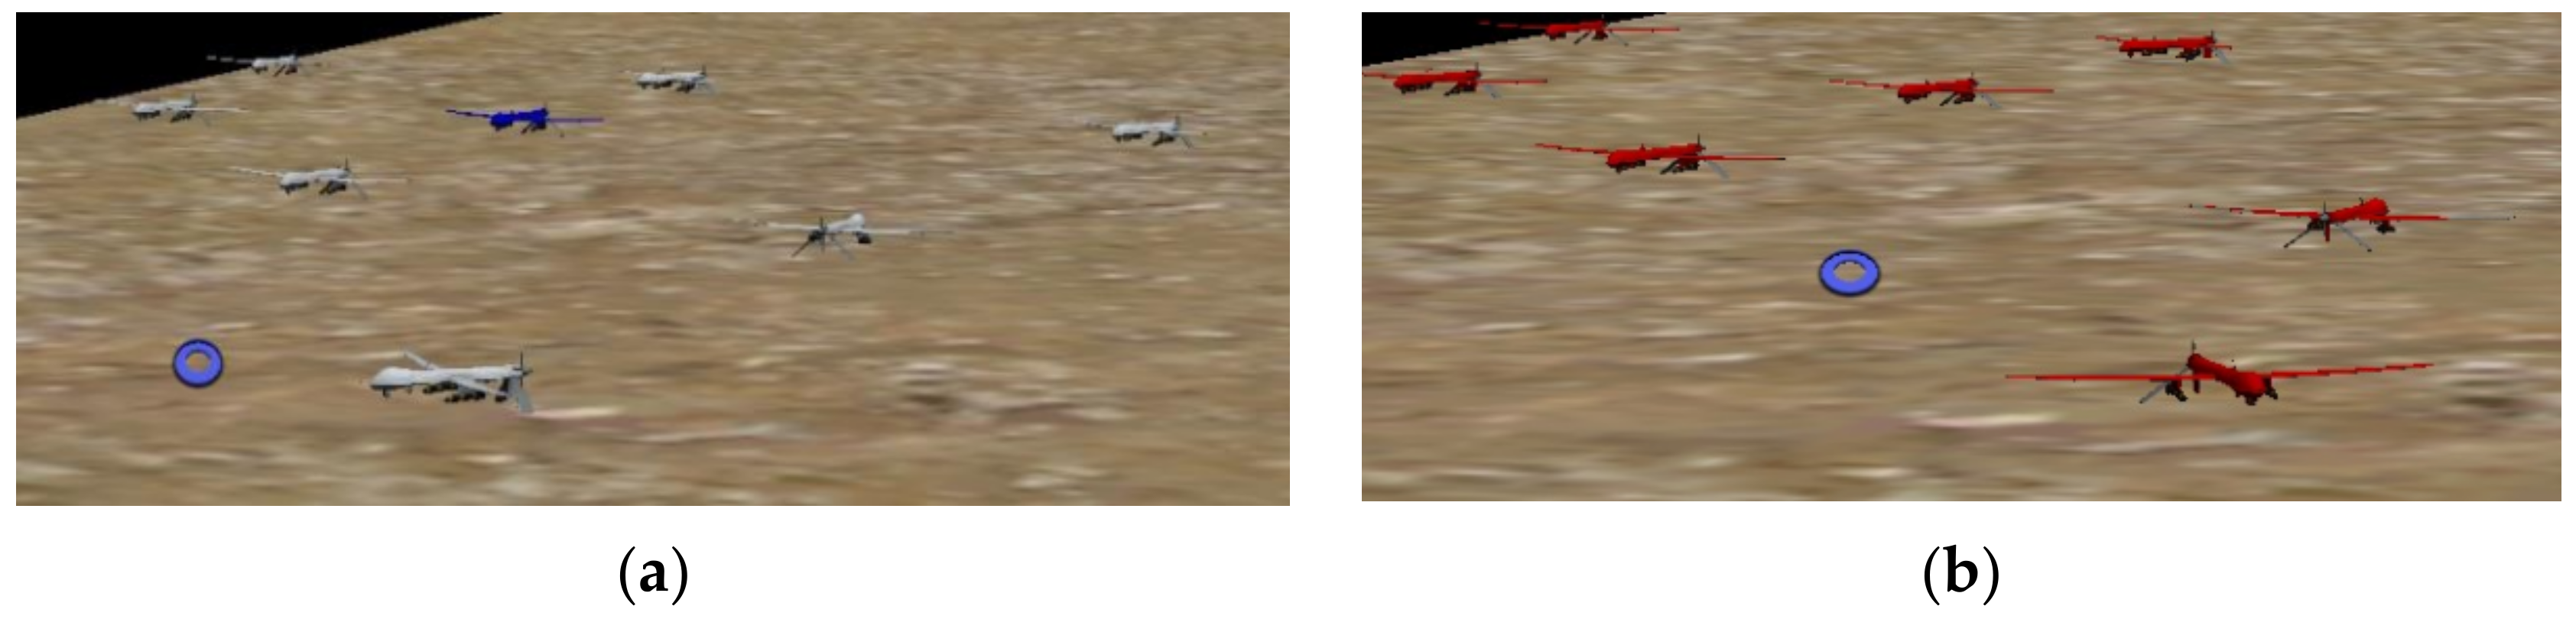
Three groups of UAV swarms were designed. When no enemy situation is found, in order to prevent the blue-side aircraft from attacking at low altitudes, the drone groups of these three formations will use an edited search lineup to perceive the situation on the battlefield, as shown in
Figure 5a. In the formation of UAVs, when one of the UAVs spots the blue-side plane, the UAVs will change the formation of the UAVs.
Figure 5b is the response of the executive aircraft after finding the blue-side aircraft.
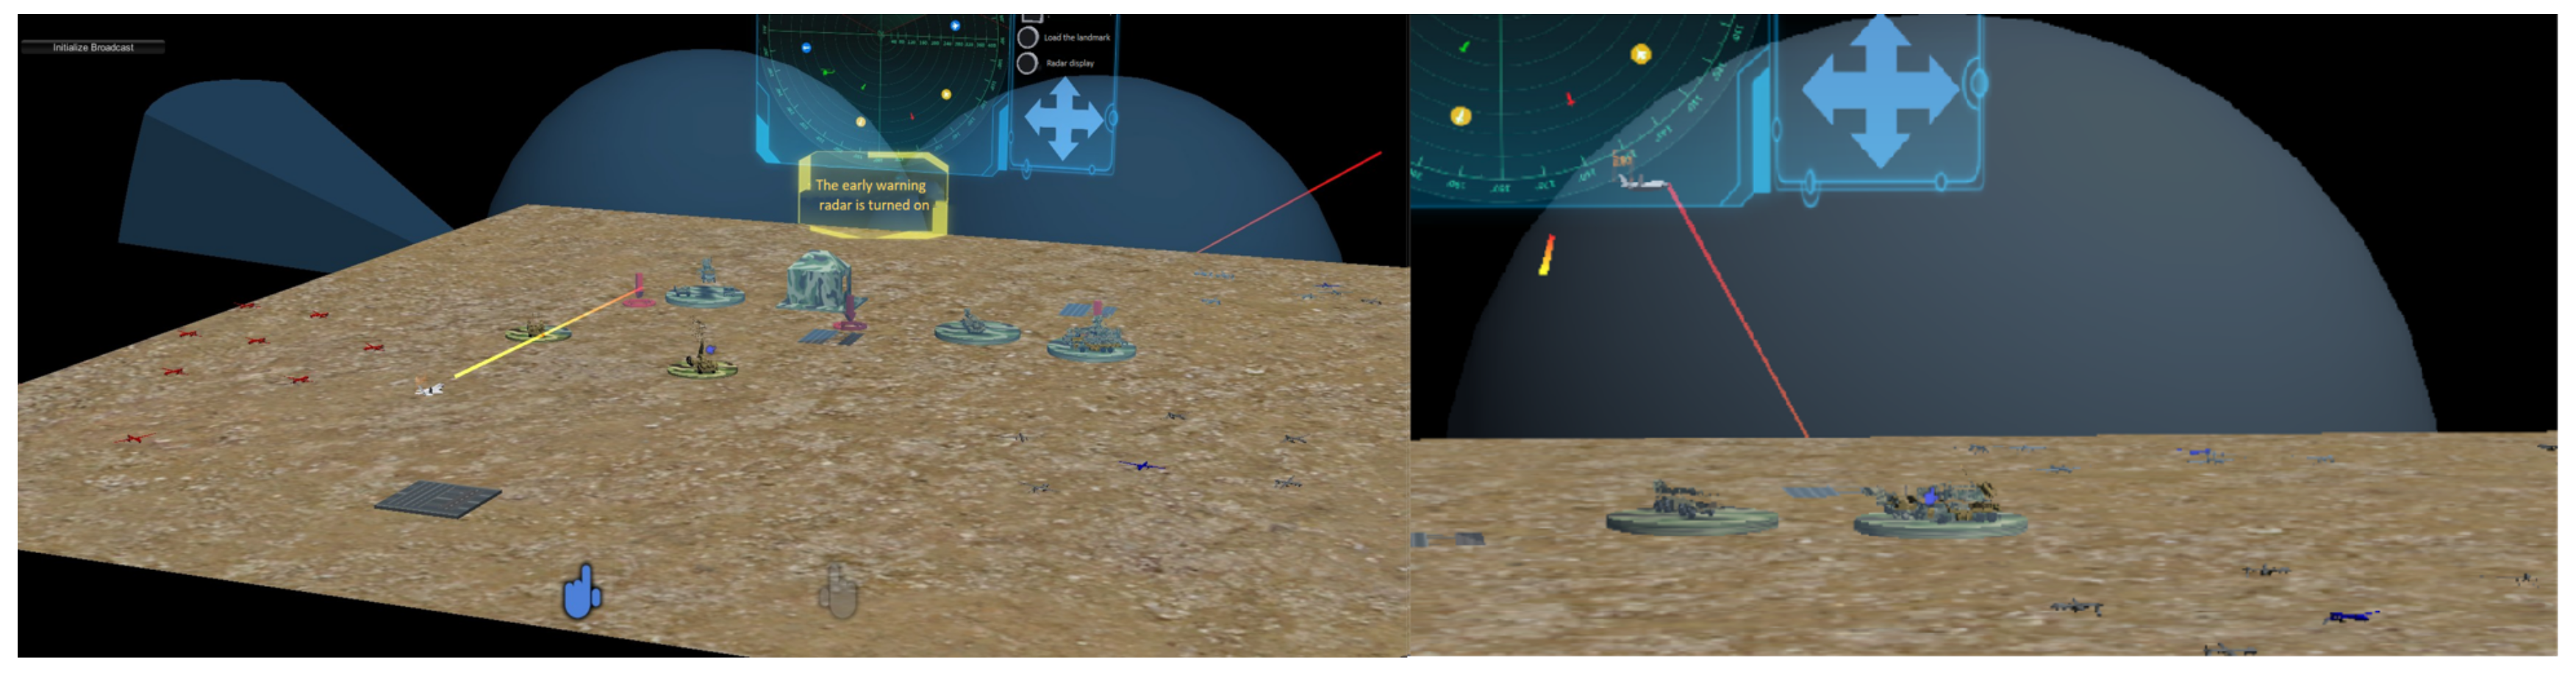
In the real world, radar waves cannot be observed with the naked eye and can only be reacted by plane scanning. In order to visually display the radar beam, this paper adopts the 3D animation of hemispherical and sector scanning, which intuitively expresses the effect of radar waves. In addition, in order to avoid blocking the line of sight, the material selected light blue translucent. The specific effect is shown in
Figure 6.
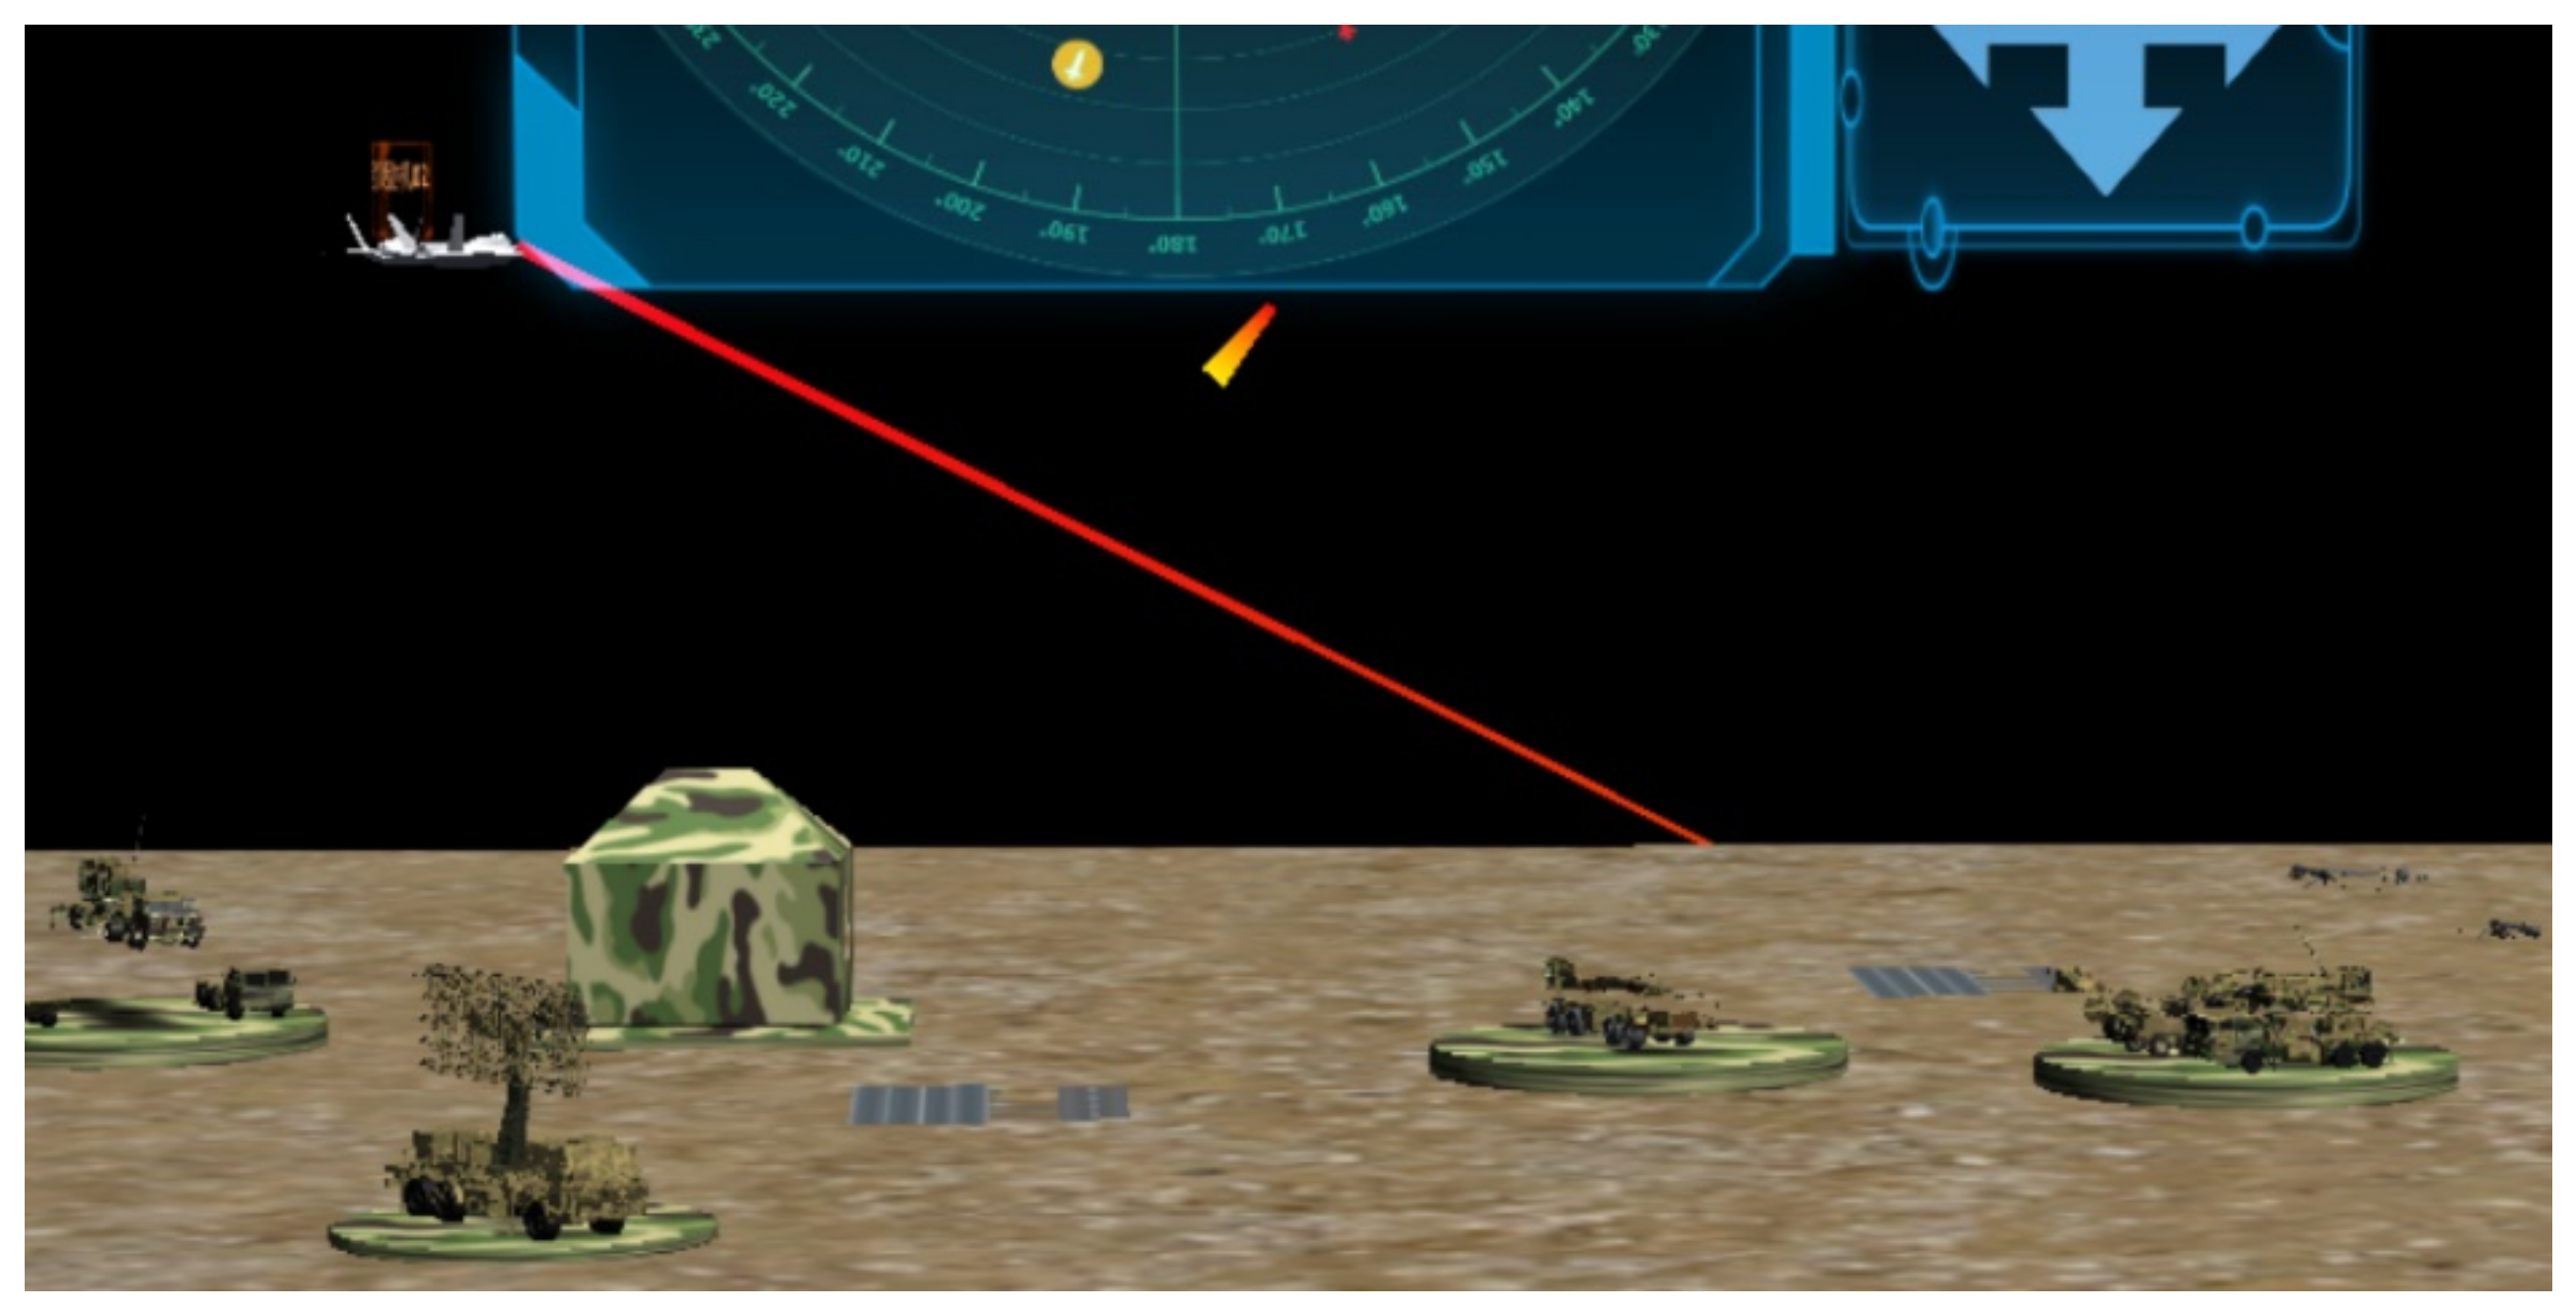
After the blue-side aircraft is detected by the warning radar, the blue-side aircraft is exposed, and the dynamic connection line between the blue-side aircraft and the target in the system is locked. The specific effect is shown in
Figure 7.
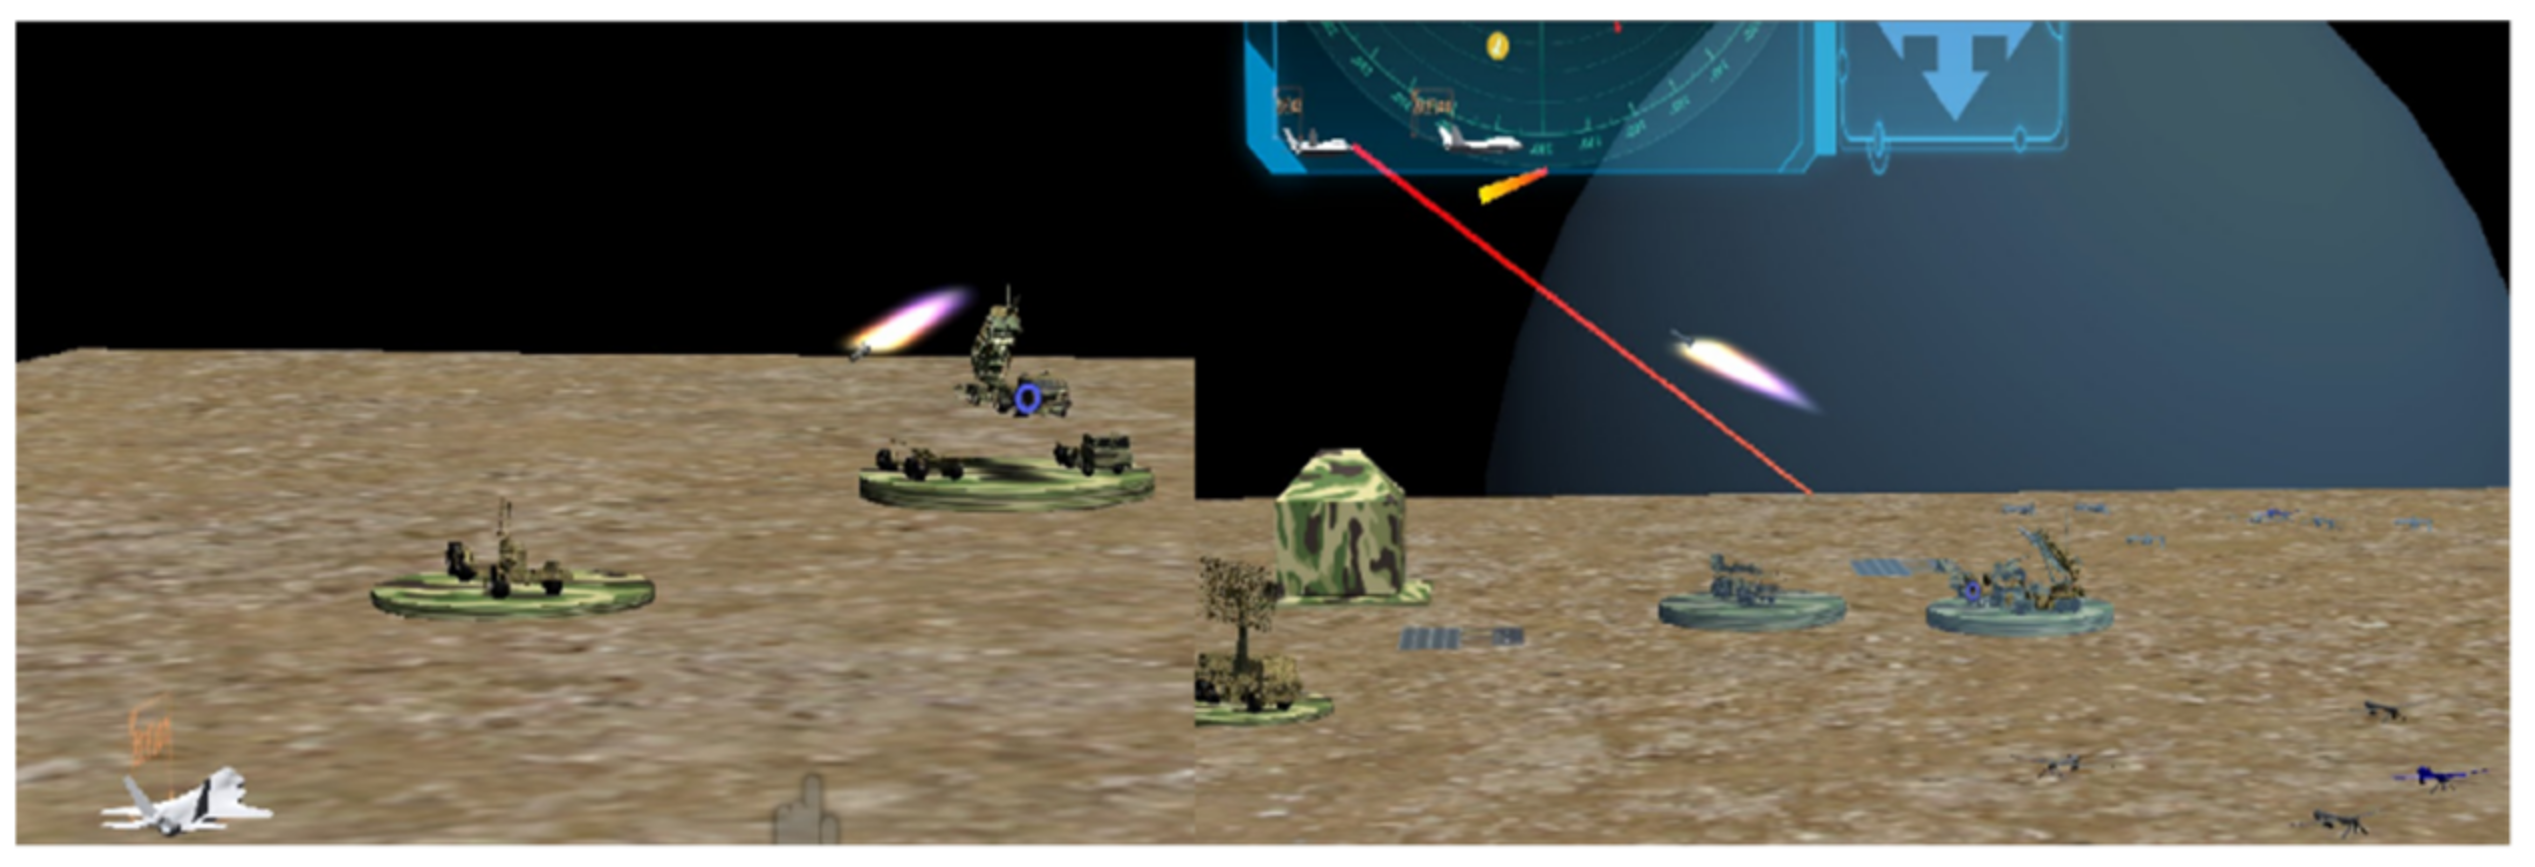
After the blue plane was stably tracked, the missile vehicle entered the ready state. After the commander’s orders, the missile flew to the enemy plane at high speed. After approaching the blue-side plane, the missile exploded, and the blue-side plane and missile disappeared. The above actions were made by UNTY3D animation, and were realized in various forms such as kiefrem animation, particle animation, sprite animation and so on. The specific effect is shown in
Figure 8.
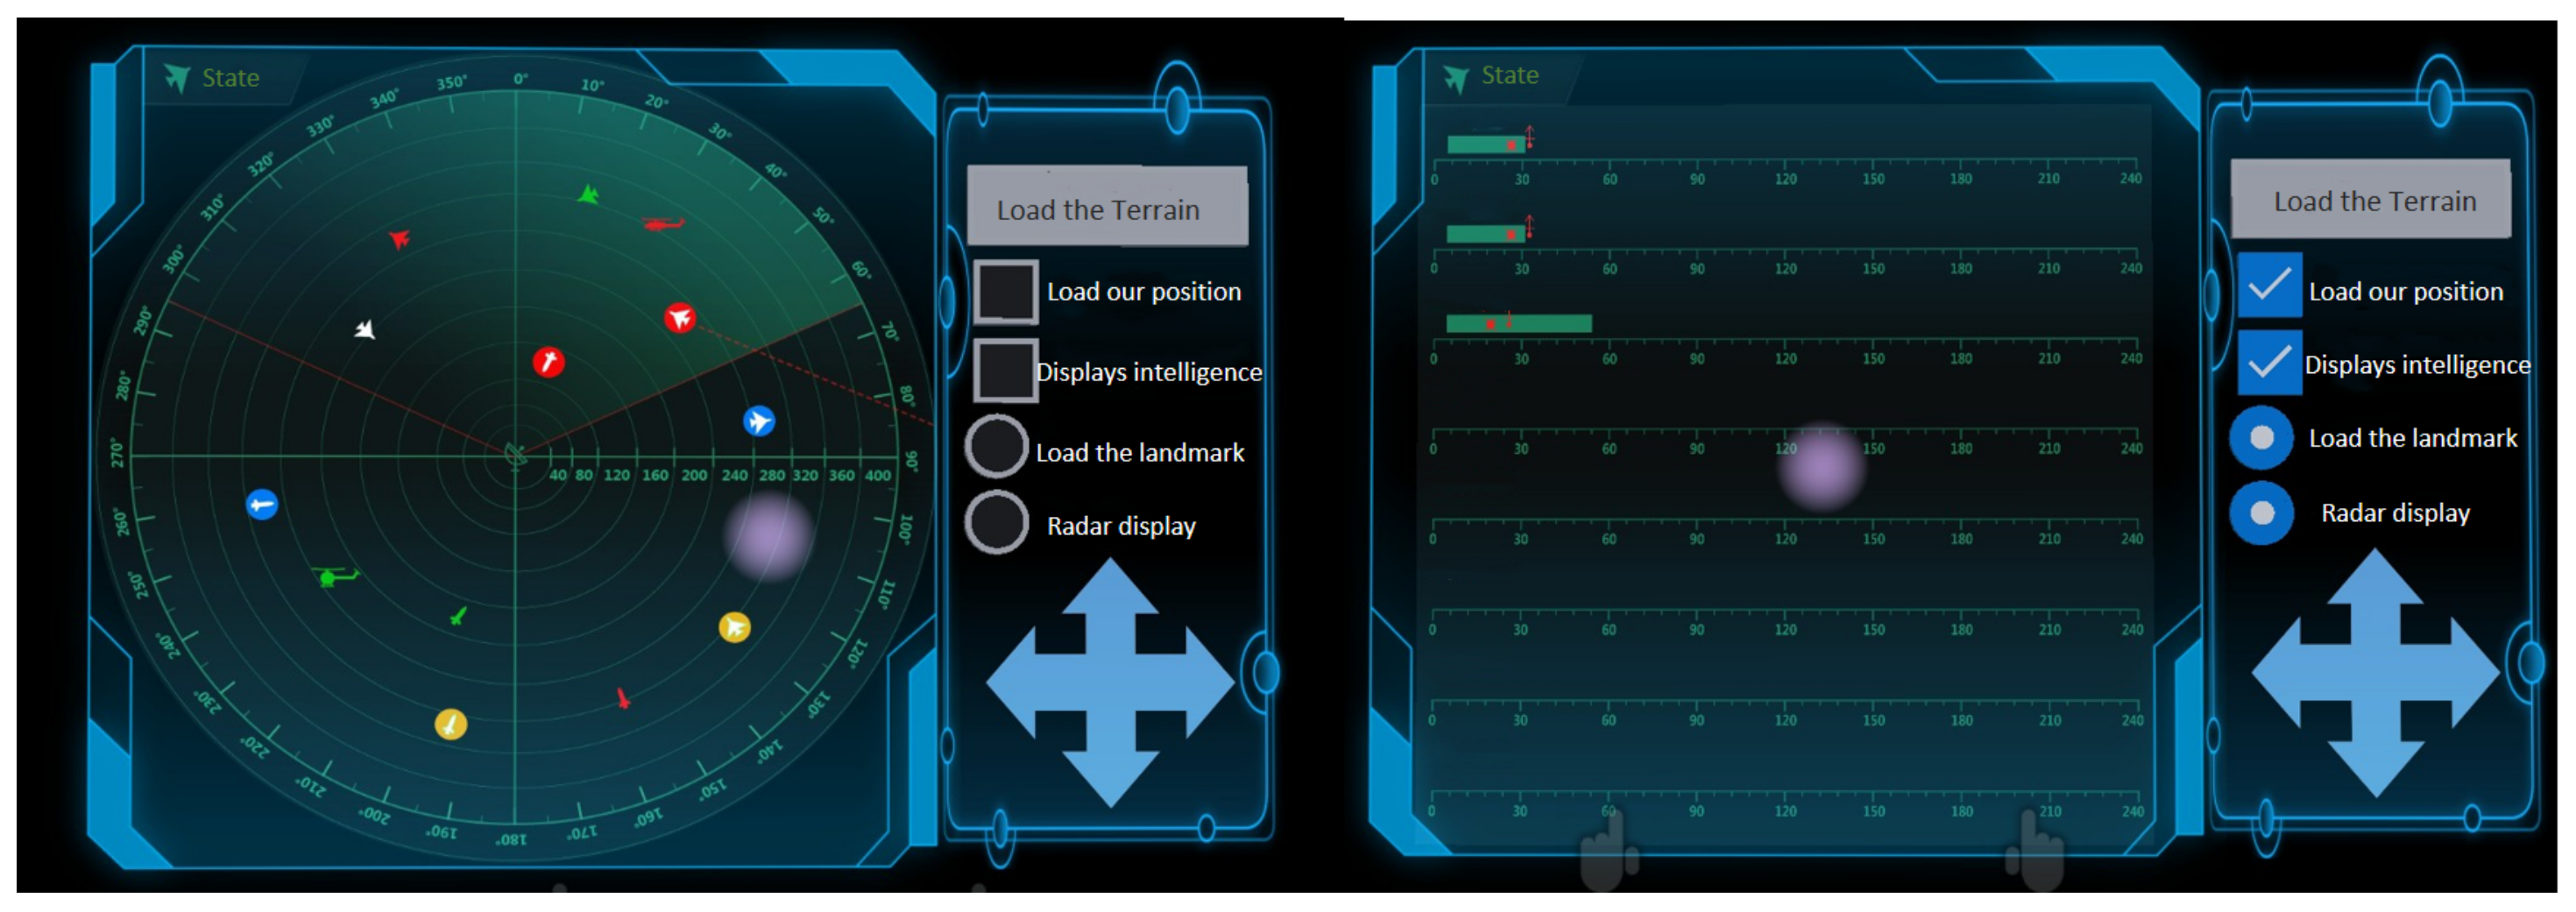
Finally, the load red-side terrain and the blue-side information, load landmark and radar display were checked. The specific effect is shown in
Figure 9.
2.3. Task Flow
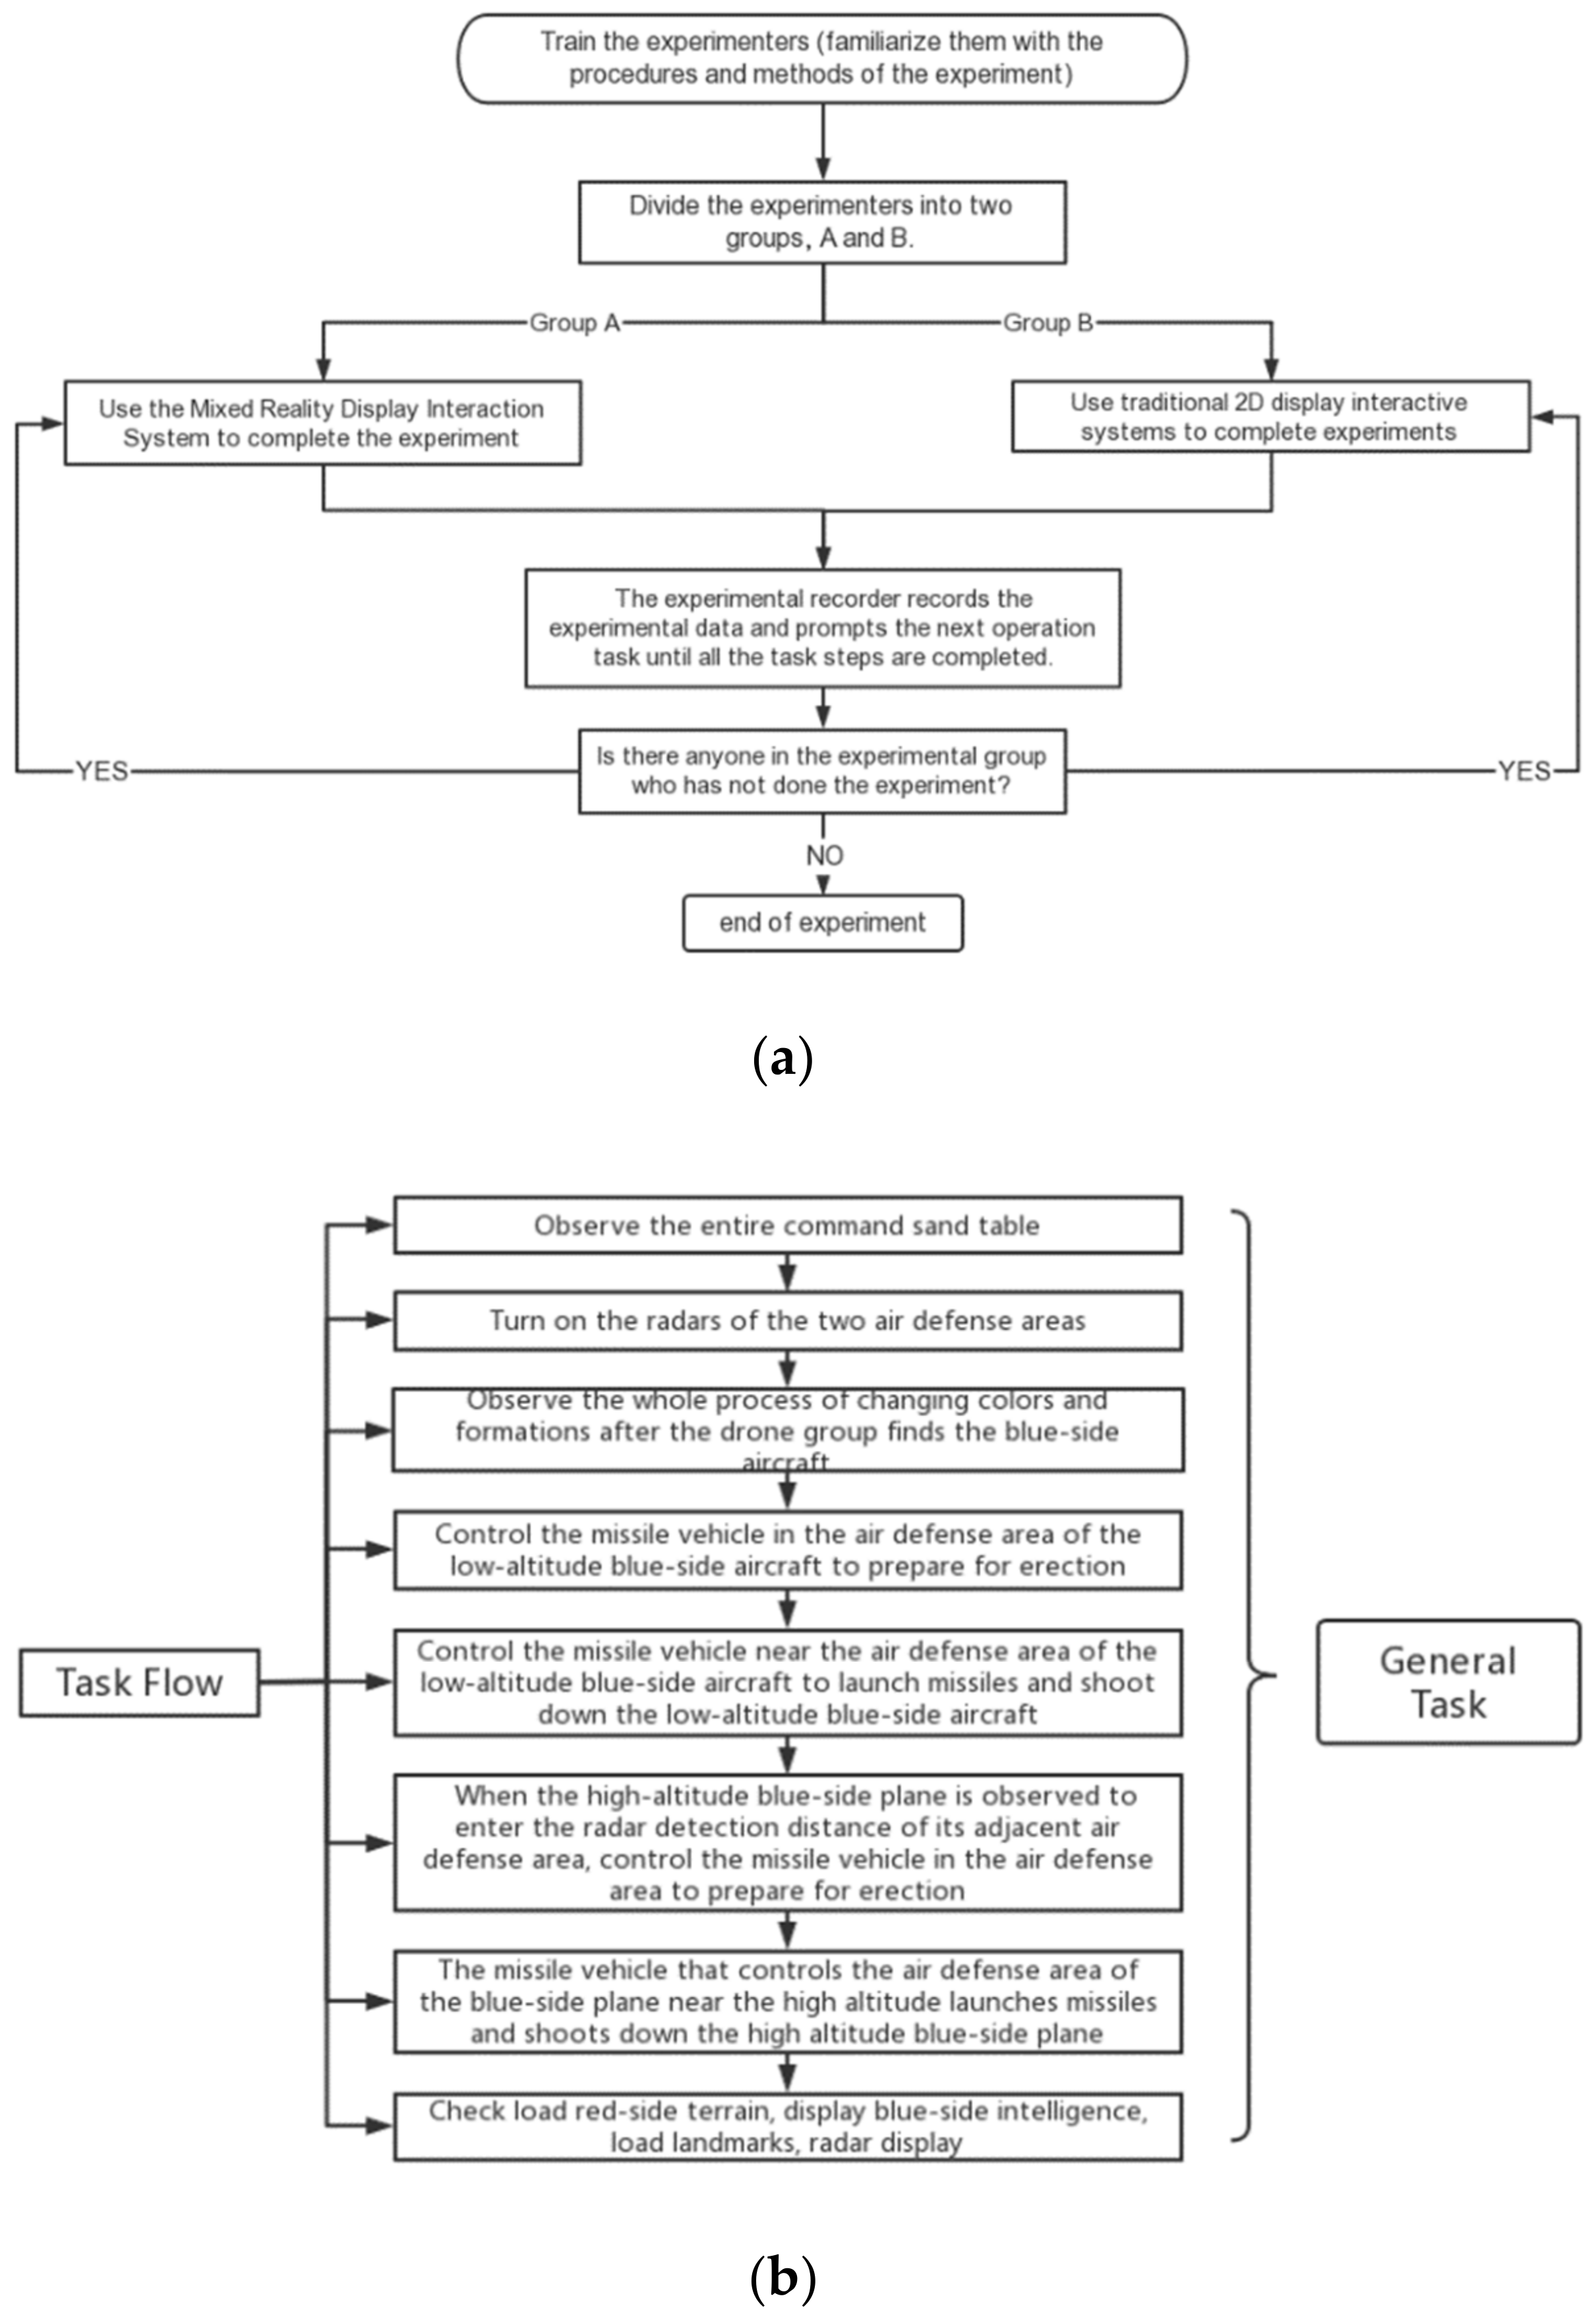
Task 1: Observe the entire command sand table; Mission 2: Turn on the radars of the two air defense areas; Task 3: Observe the whole process of changing colors and formations after the drone group finds the blue-side aircraft; Task 4: Control the missile vehicle in the air defense area of the low-altitude blue-side aircraft to prepare for erection; Task 5: Control the missile vehicle near the air defense area of the low-altitude blue-side aircraft to launch missiles and shoot down the low-altitude blue-side aircraft; Task 6: When the high-altitude blue-side plane is observed to enter the radar detection distance of its adjacent air defense area, control the missile vehicle in the air defense area to prepare for erection; Task 7: The missile vehicle that controls the air defense area of the blue-side plane near the high altitude launches missiles and shoots down the high altitude blue-side plane; Task 8: Check load red-side terrain, display blue-side intelligence, load landmarks, radar display. Operational Approach:
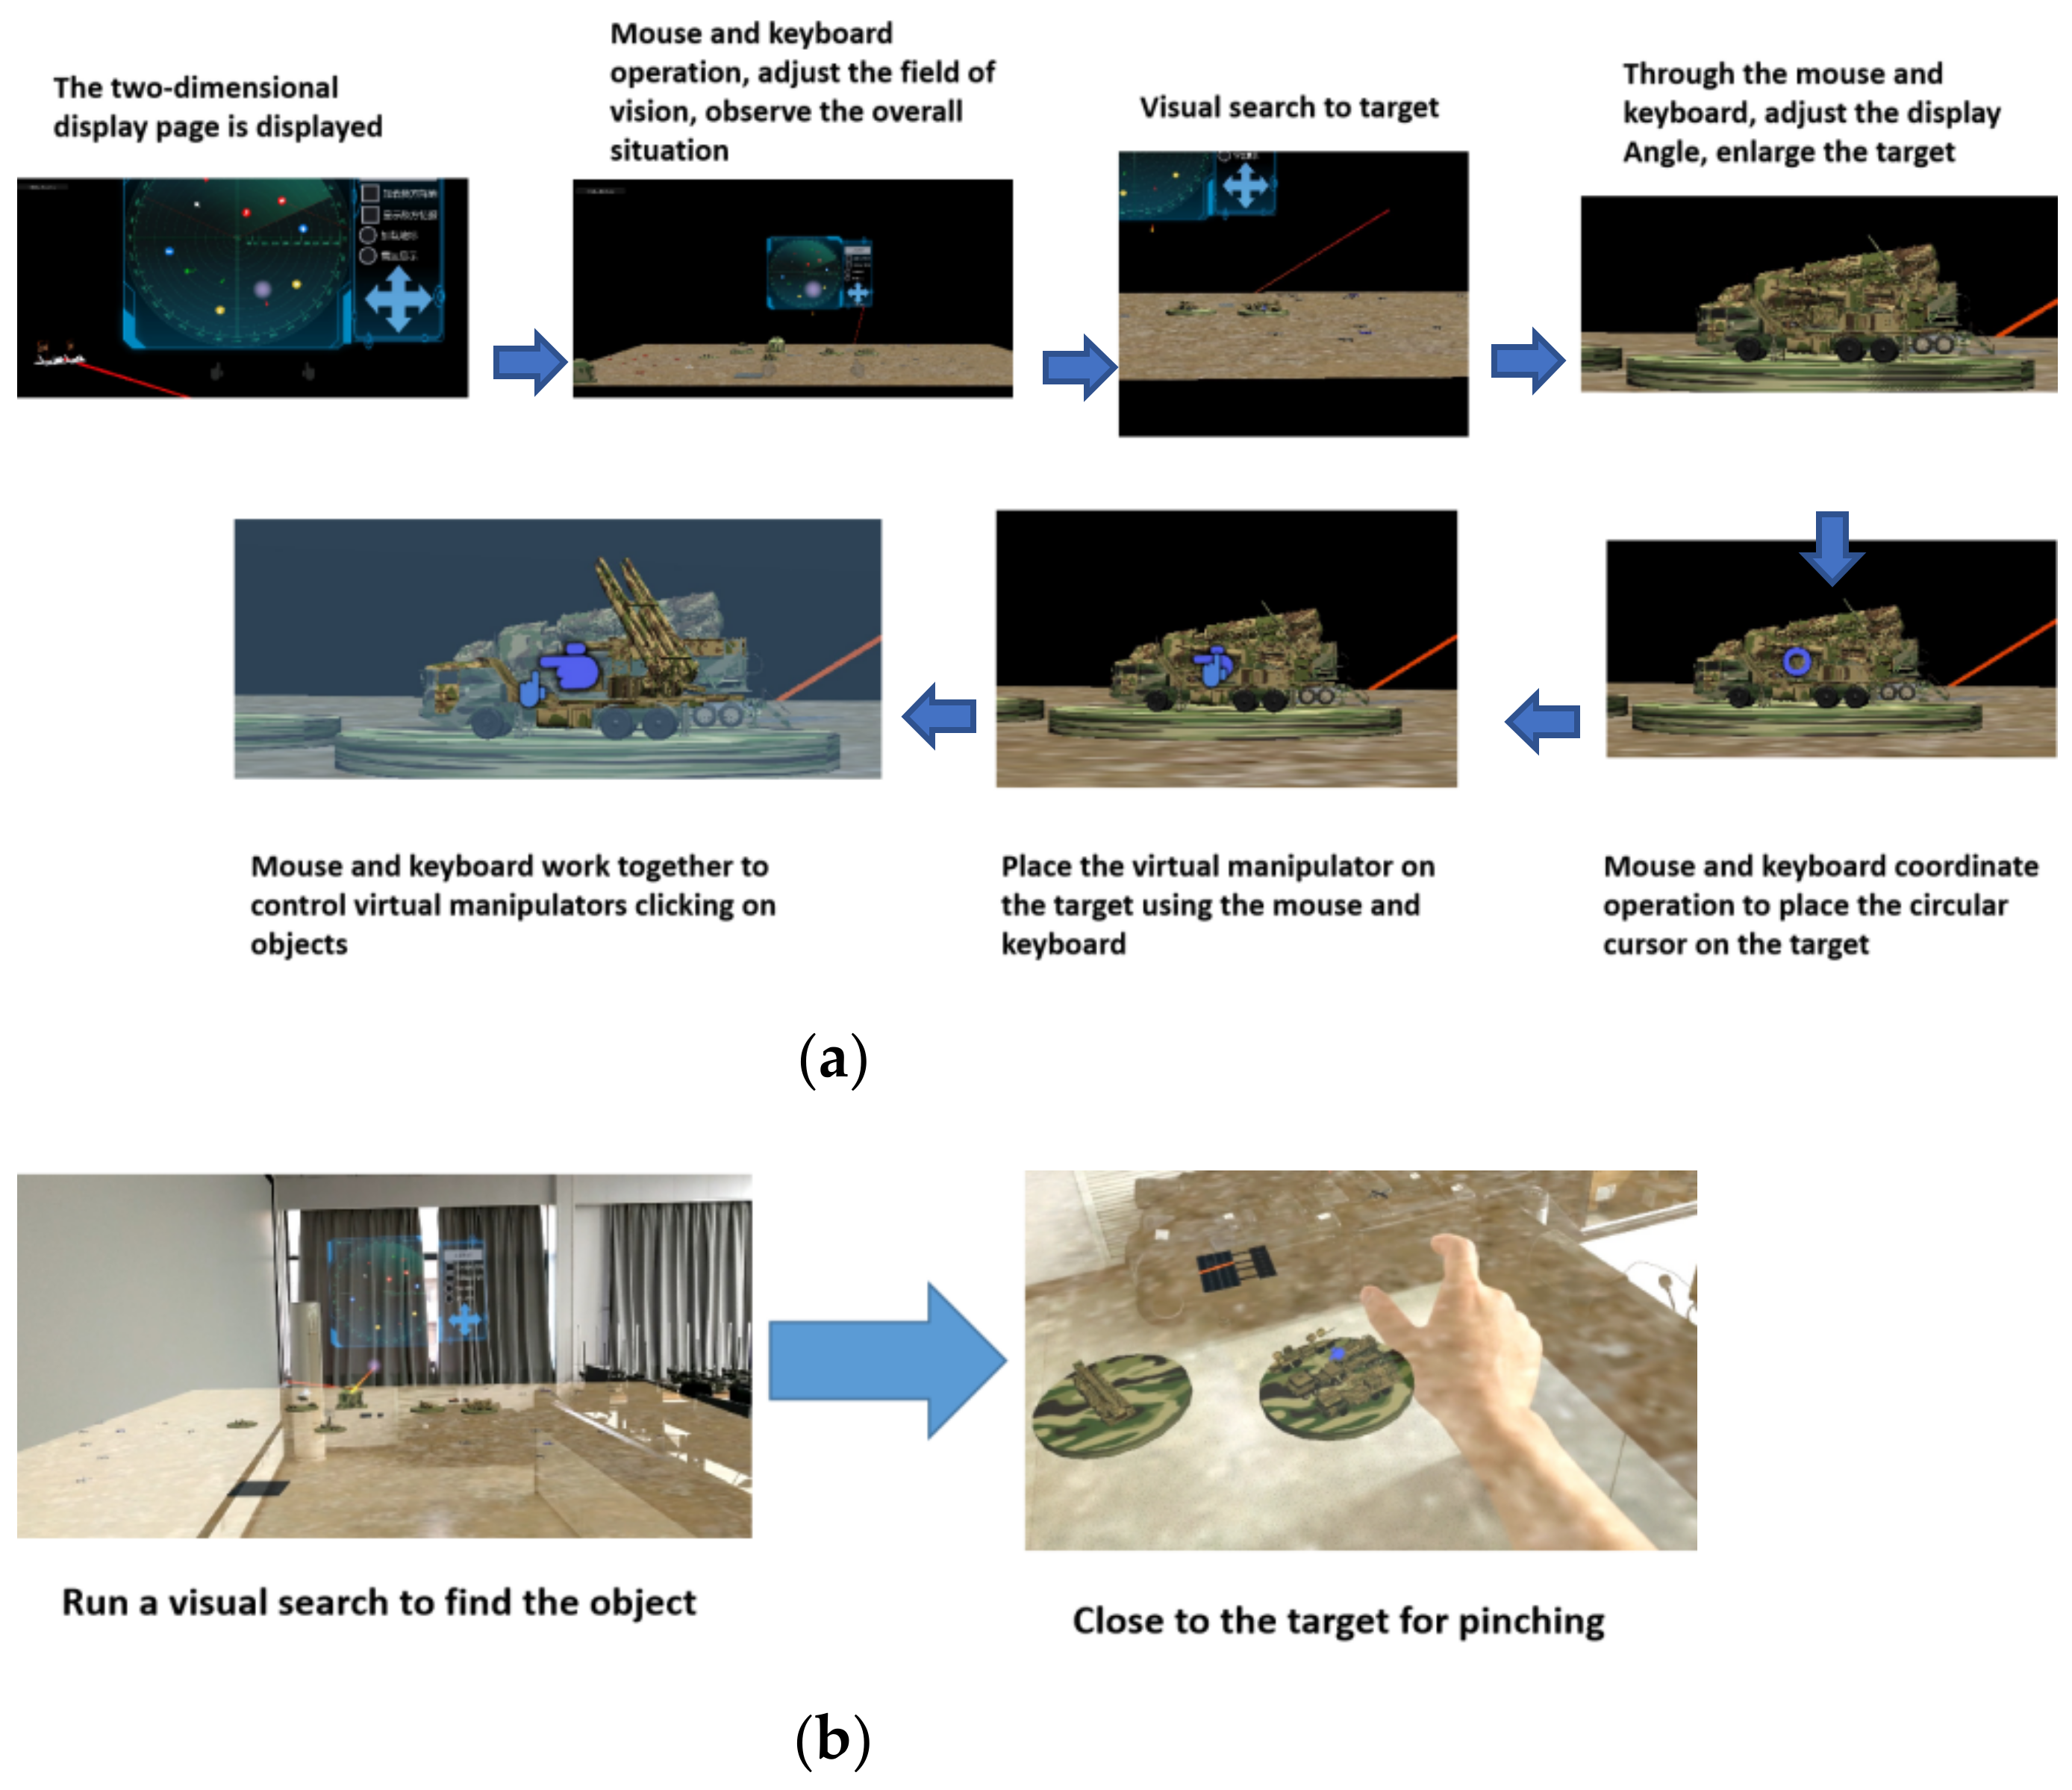
Figure 10a shows the general process of interactive operation in the traditional two-dimensional display mode, and
Figure 10b shows the general process of interactive operation in the MR environment.
Table 1 shows the operation flow of the two display interactive systems when they complete various tasks.
2.4. Experimental Objective
In the experiment, the tasks completed by the two display interaction systems were completely consistent in task flow and task effect. In this case, collecting and analyzing the differences in performance and cognitive load of the two display interaction systems can reveal the pros and cons of the performance and cognitive load of the two display interaction systems under the same task.
The experimenter used the traditional two-dimensional display interactive system and the MR display interactive system to complete the same task, so as to explore the task performance and cognitive load of these two display interactive systems under the condition of completing the same task. A comparative analysis of the task performance and cognitive load of the two display interactive systems was also conducted. The advantages and disadvantages of the two display interactive systems in task performance and cognitive load were obtained.
The selected tasks include the observation of the overall and local situation, the interactive operation and situation display of detection equipment, the erection and launching of weapons and equipment, and the checking of status display. The above task types are proposed by experts in the field of air defense, which are typical tasks in air defense missions and can represent the general process of the commander’s command operation in air defense missions.
2.5. Experiment Process
In order to avoid the learning effect, all the testers were trained to be familiar with the operation process and operation method of the whole experiment and performed a rehearsal first.
It was important that the tester was in a good state of mind and relaxed.
The experimenters were divided into two groups, A and B, and conducted the experiments on the mixed reality display interaction system and the traditional two-dimensional display interaction system, respectively.
The experimental data recorder prompts the next operation task, the tester raises his hand to signal after completion, and the recorder records the interval between the prompt operation task and the tester raising his hand as the completion time of this operation task; this cycle was repeated until the entire experimental task was completed.
The experimental process and task flow are shown in
Figure 11.
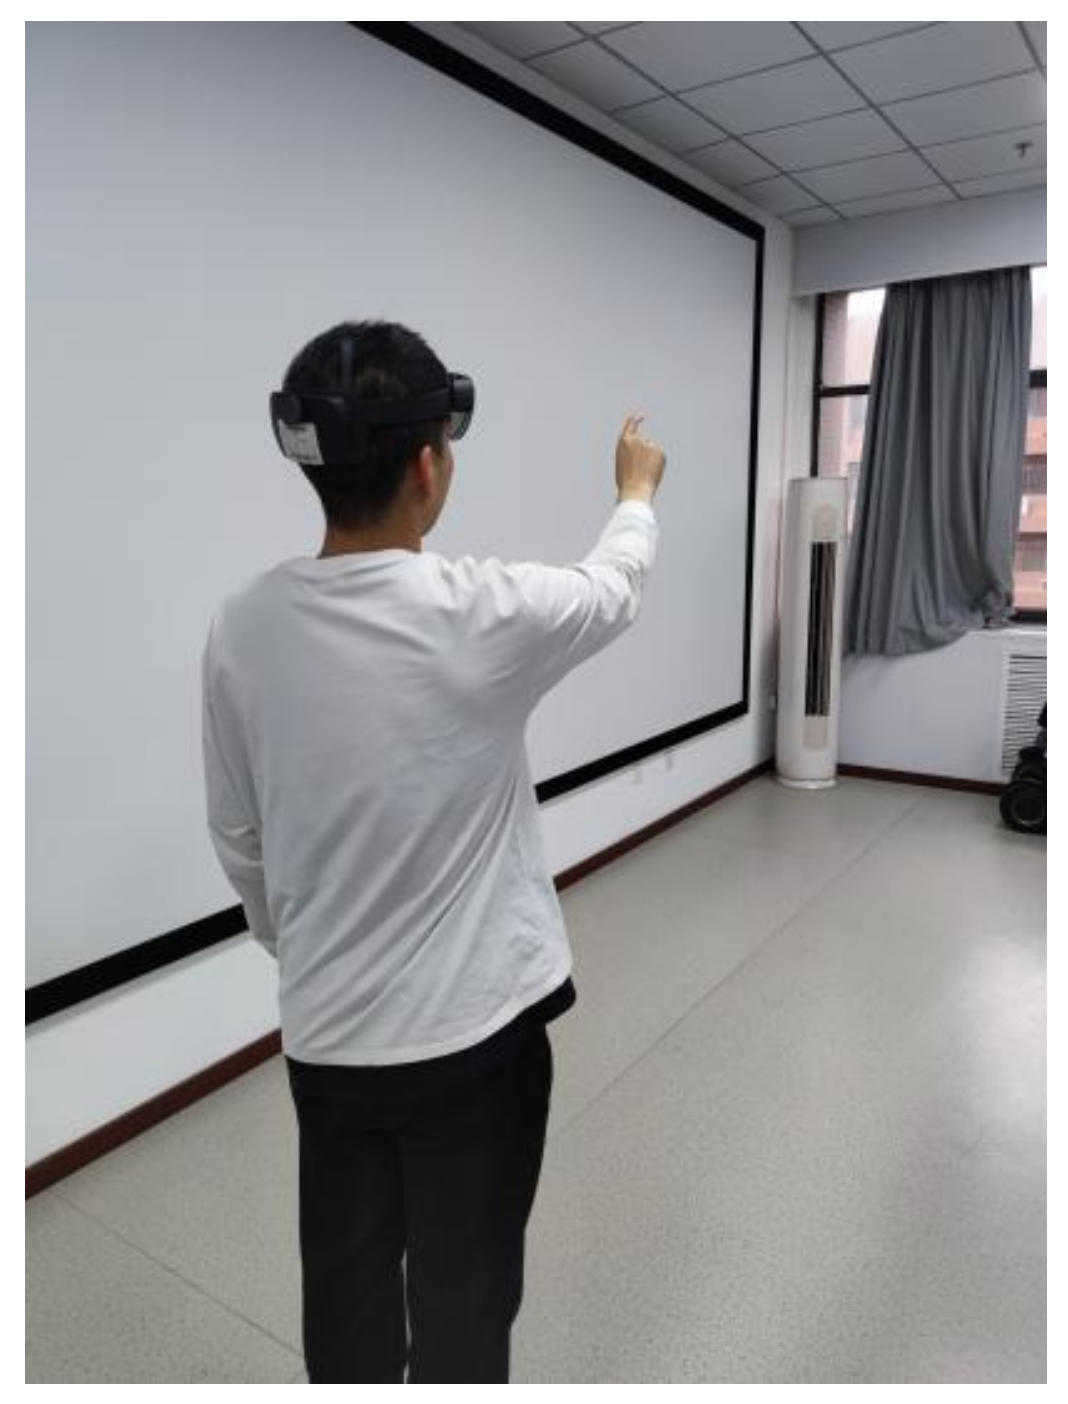
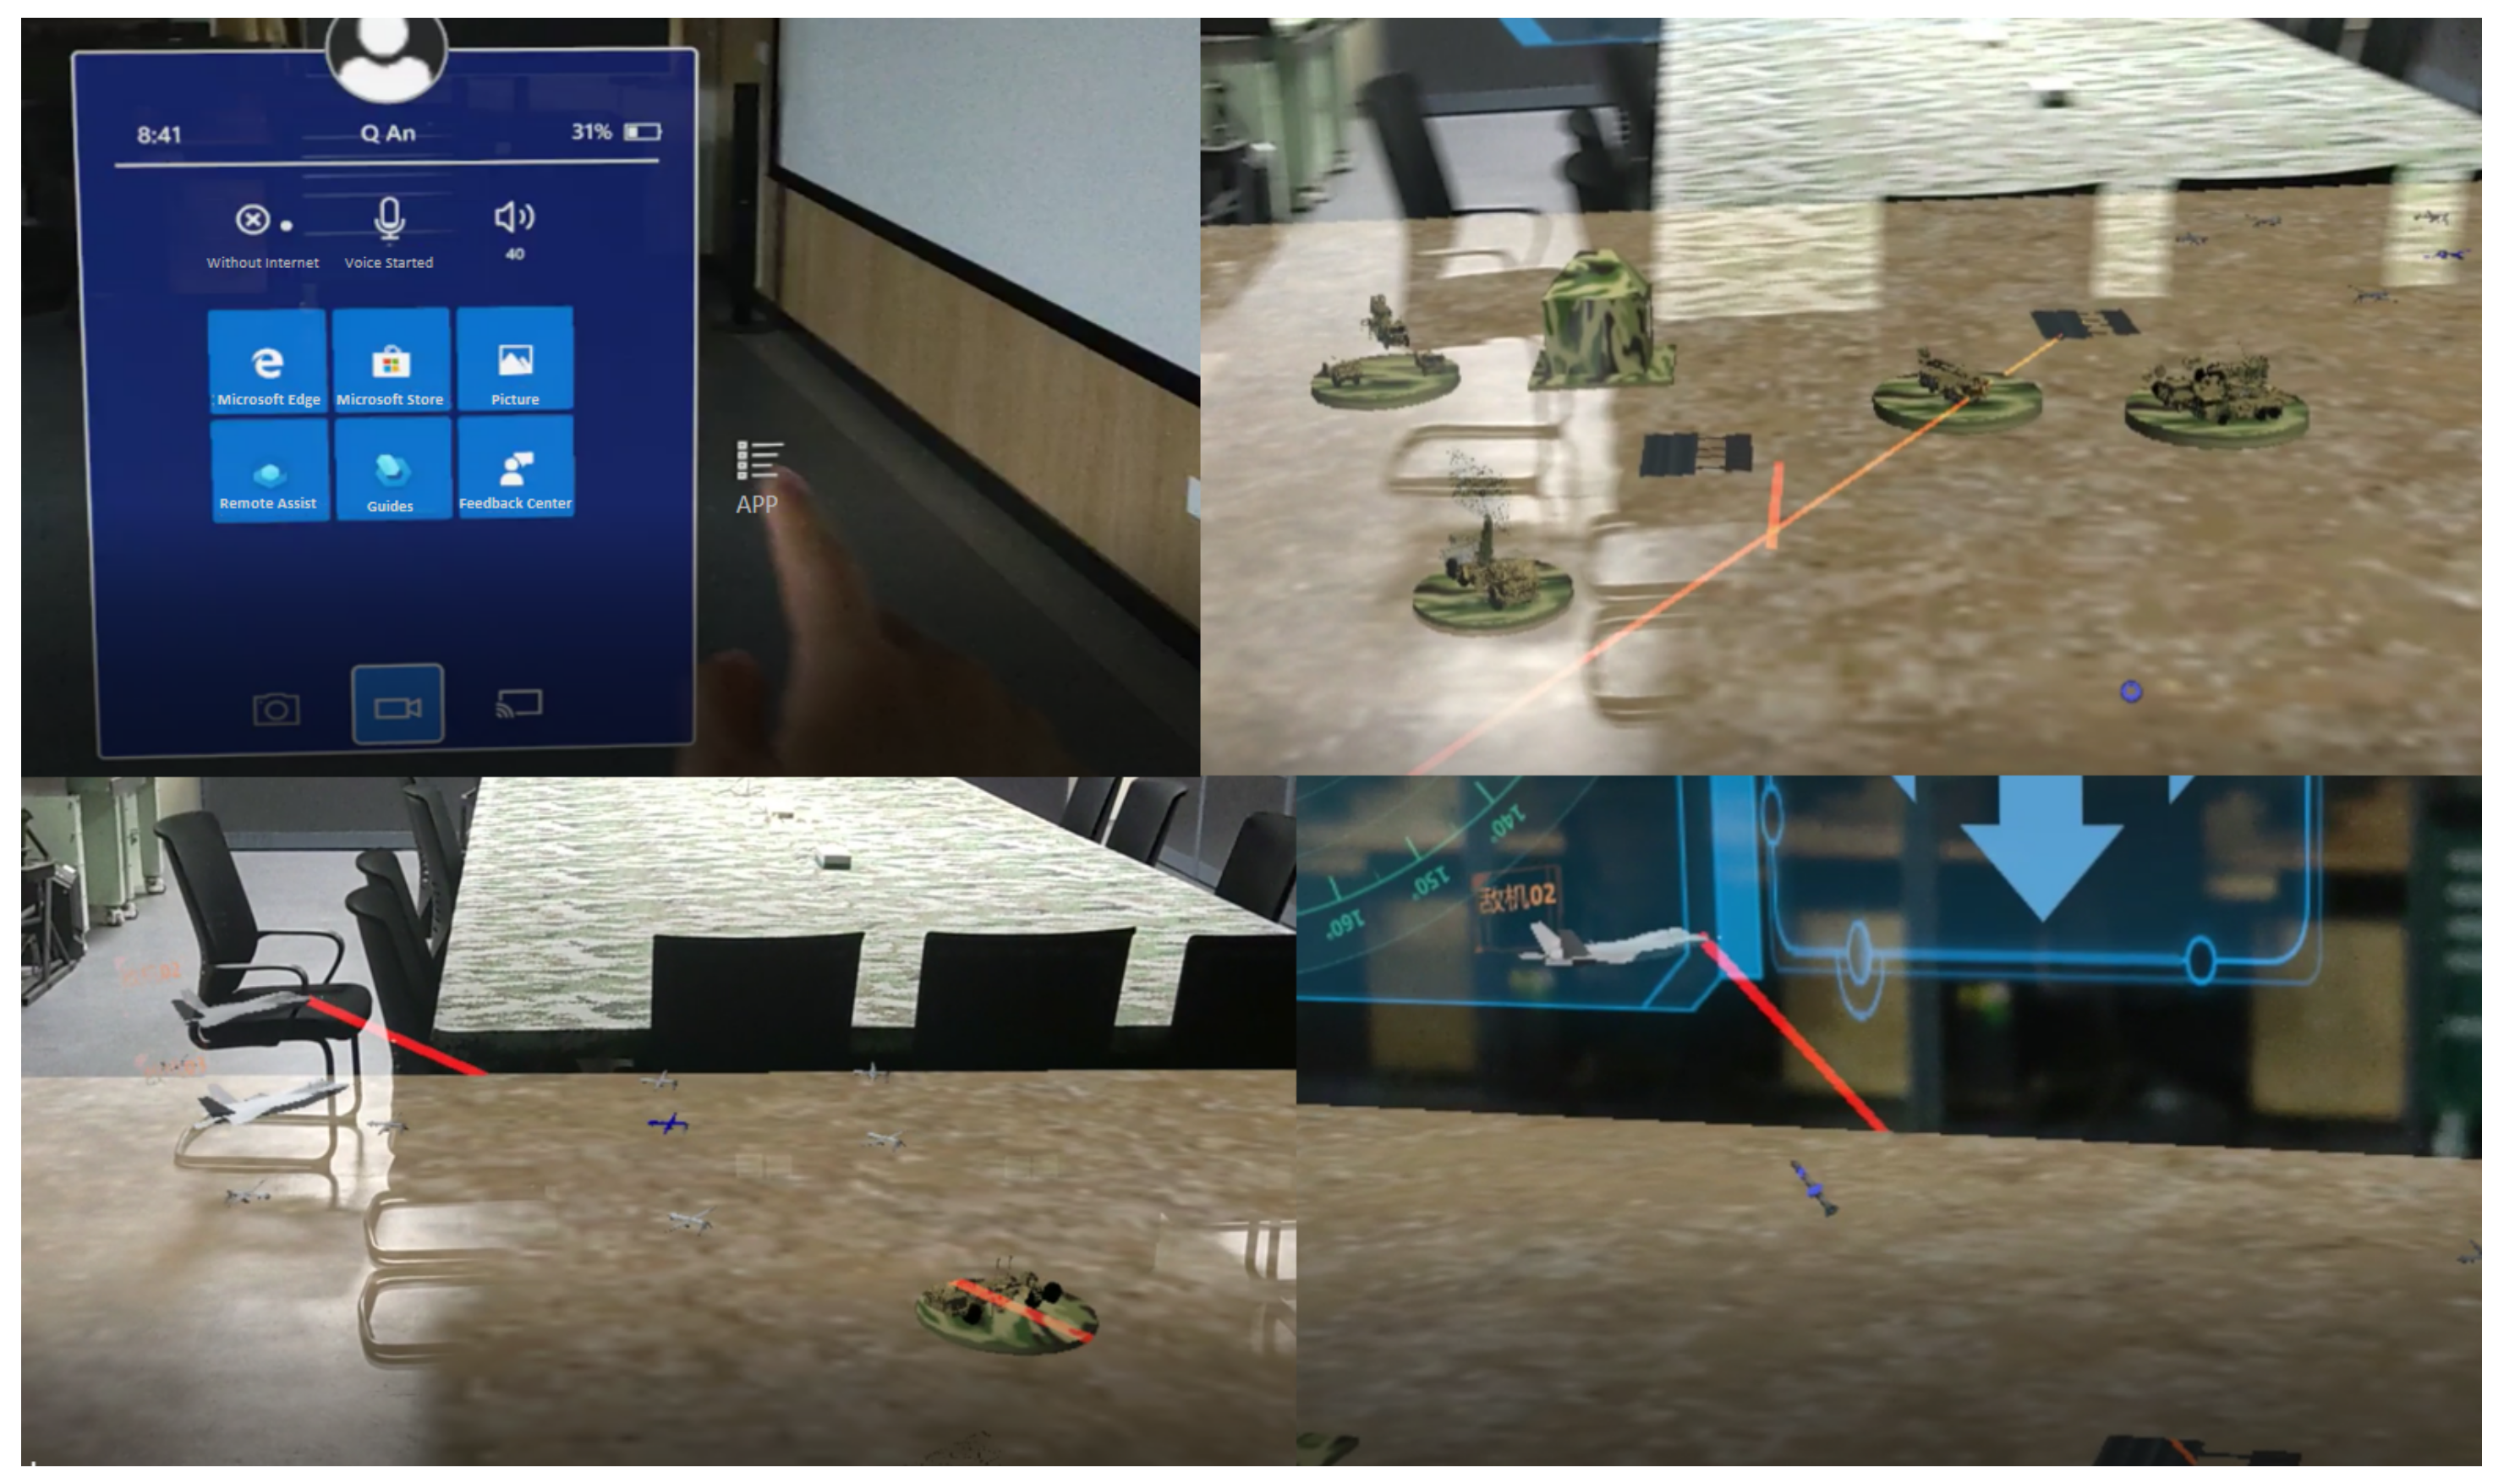
After the experimenter puts on the HoloLens2, the corresponding program is opened, and the glasses are registered in three dimensions according to the natural characteristics.
Figure 12 shows the experimenter’s on-site operation diagram.
In the actual operation, the overall process is clear, consistent and smooth, and the expected effect is achieved. The first view of the operation is shown in
Figure 13.
2.6. Experimental Data Type
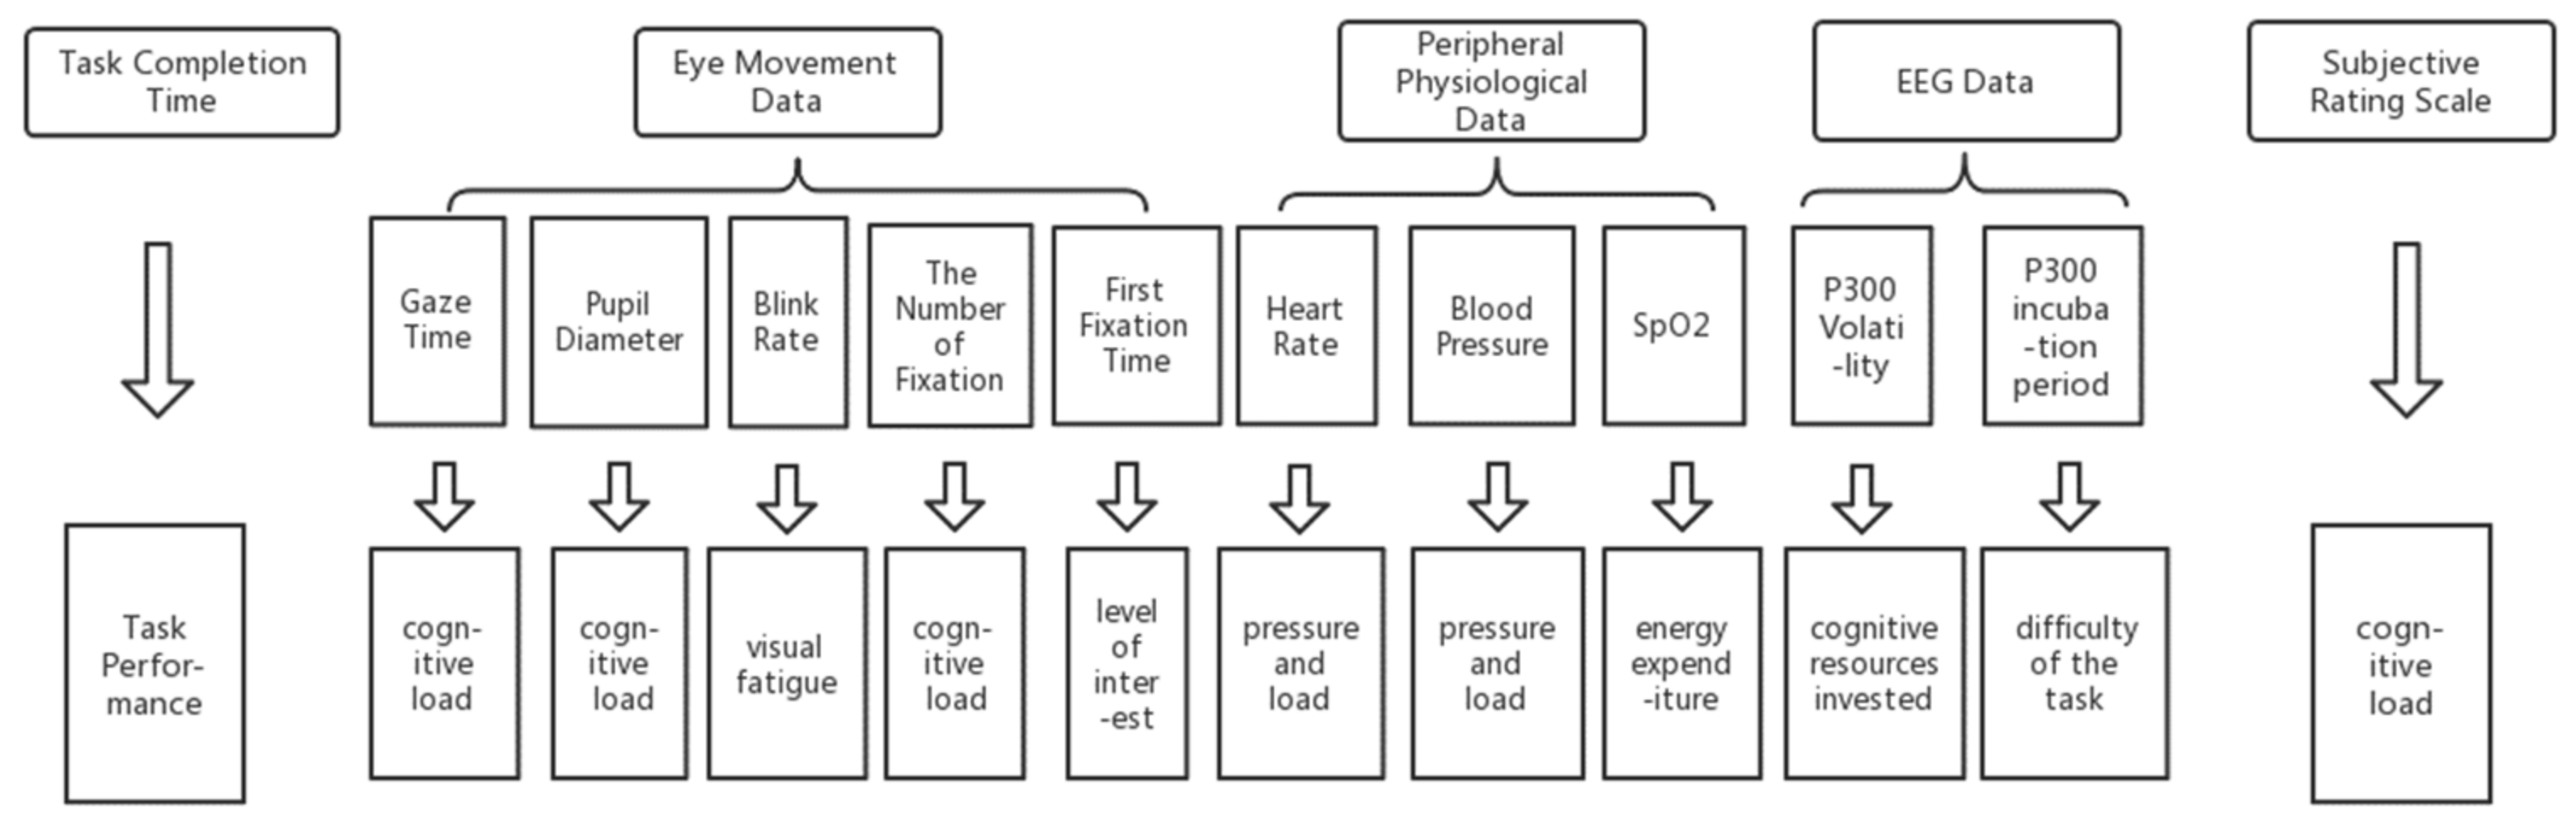
The types of data collected in the experiment are as follows: 1. Task completion time, 2. Eye movement data, 3. Peripheral physiological data, 4. EEG data, and 5. Subjective evaluation scale scoring. Eye movement data included average fixation time, pupil diameter, blink frequency, number of fixation points, and first fixation time; peripheral physiological data included heart rate, blood pressure and blood oxygen saturation; EEG data collected were the amplitude and latency of P300 when subjects completed the task. The specific data types and their contributions to the experimental results are shown in
Figure 14.
3. Result
3.1. Task Performance
Task completion performance: The average time and total average time to complete each task of the experimental group using the traditional two-dimensional display interactive system and the experimental group using MR display interactive system are shown in
Table 2.
Through the data analysis in
Table 2, it was concluded that the total average time of the traditional two-dimensional display interaction system to complete the task is 258.8 s, which is much higher than the total average time of 111.2 s for the MR display interaction system to complete the task. Paired
t-test for two display interaction systems (
). One-Sample
t-test analysis of traditional two-dimensional display interactive system (
) and MR display interactive system (
).
The results show that different display interaction systems have a significant impact on the task completion time, and the MR display interaction system can improve the time performance of the total task more than the traditional display interaction system under the same air defense command and control task.
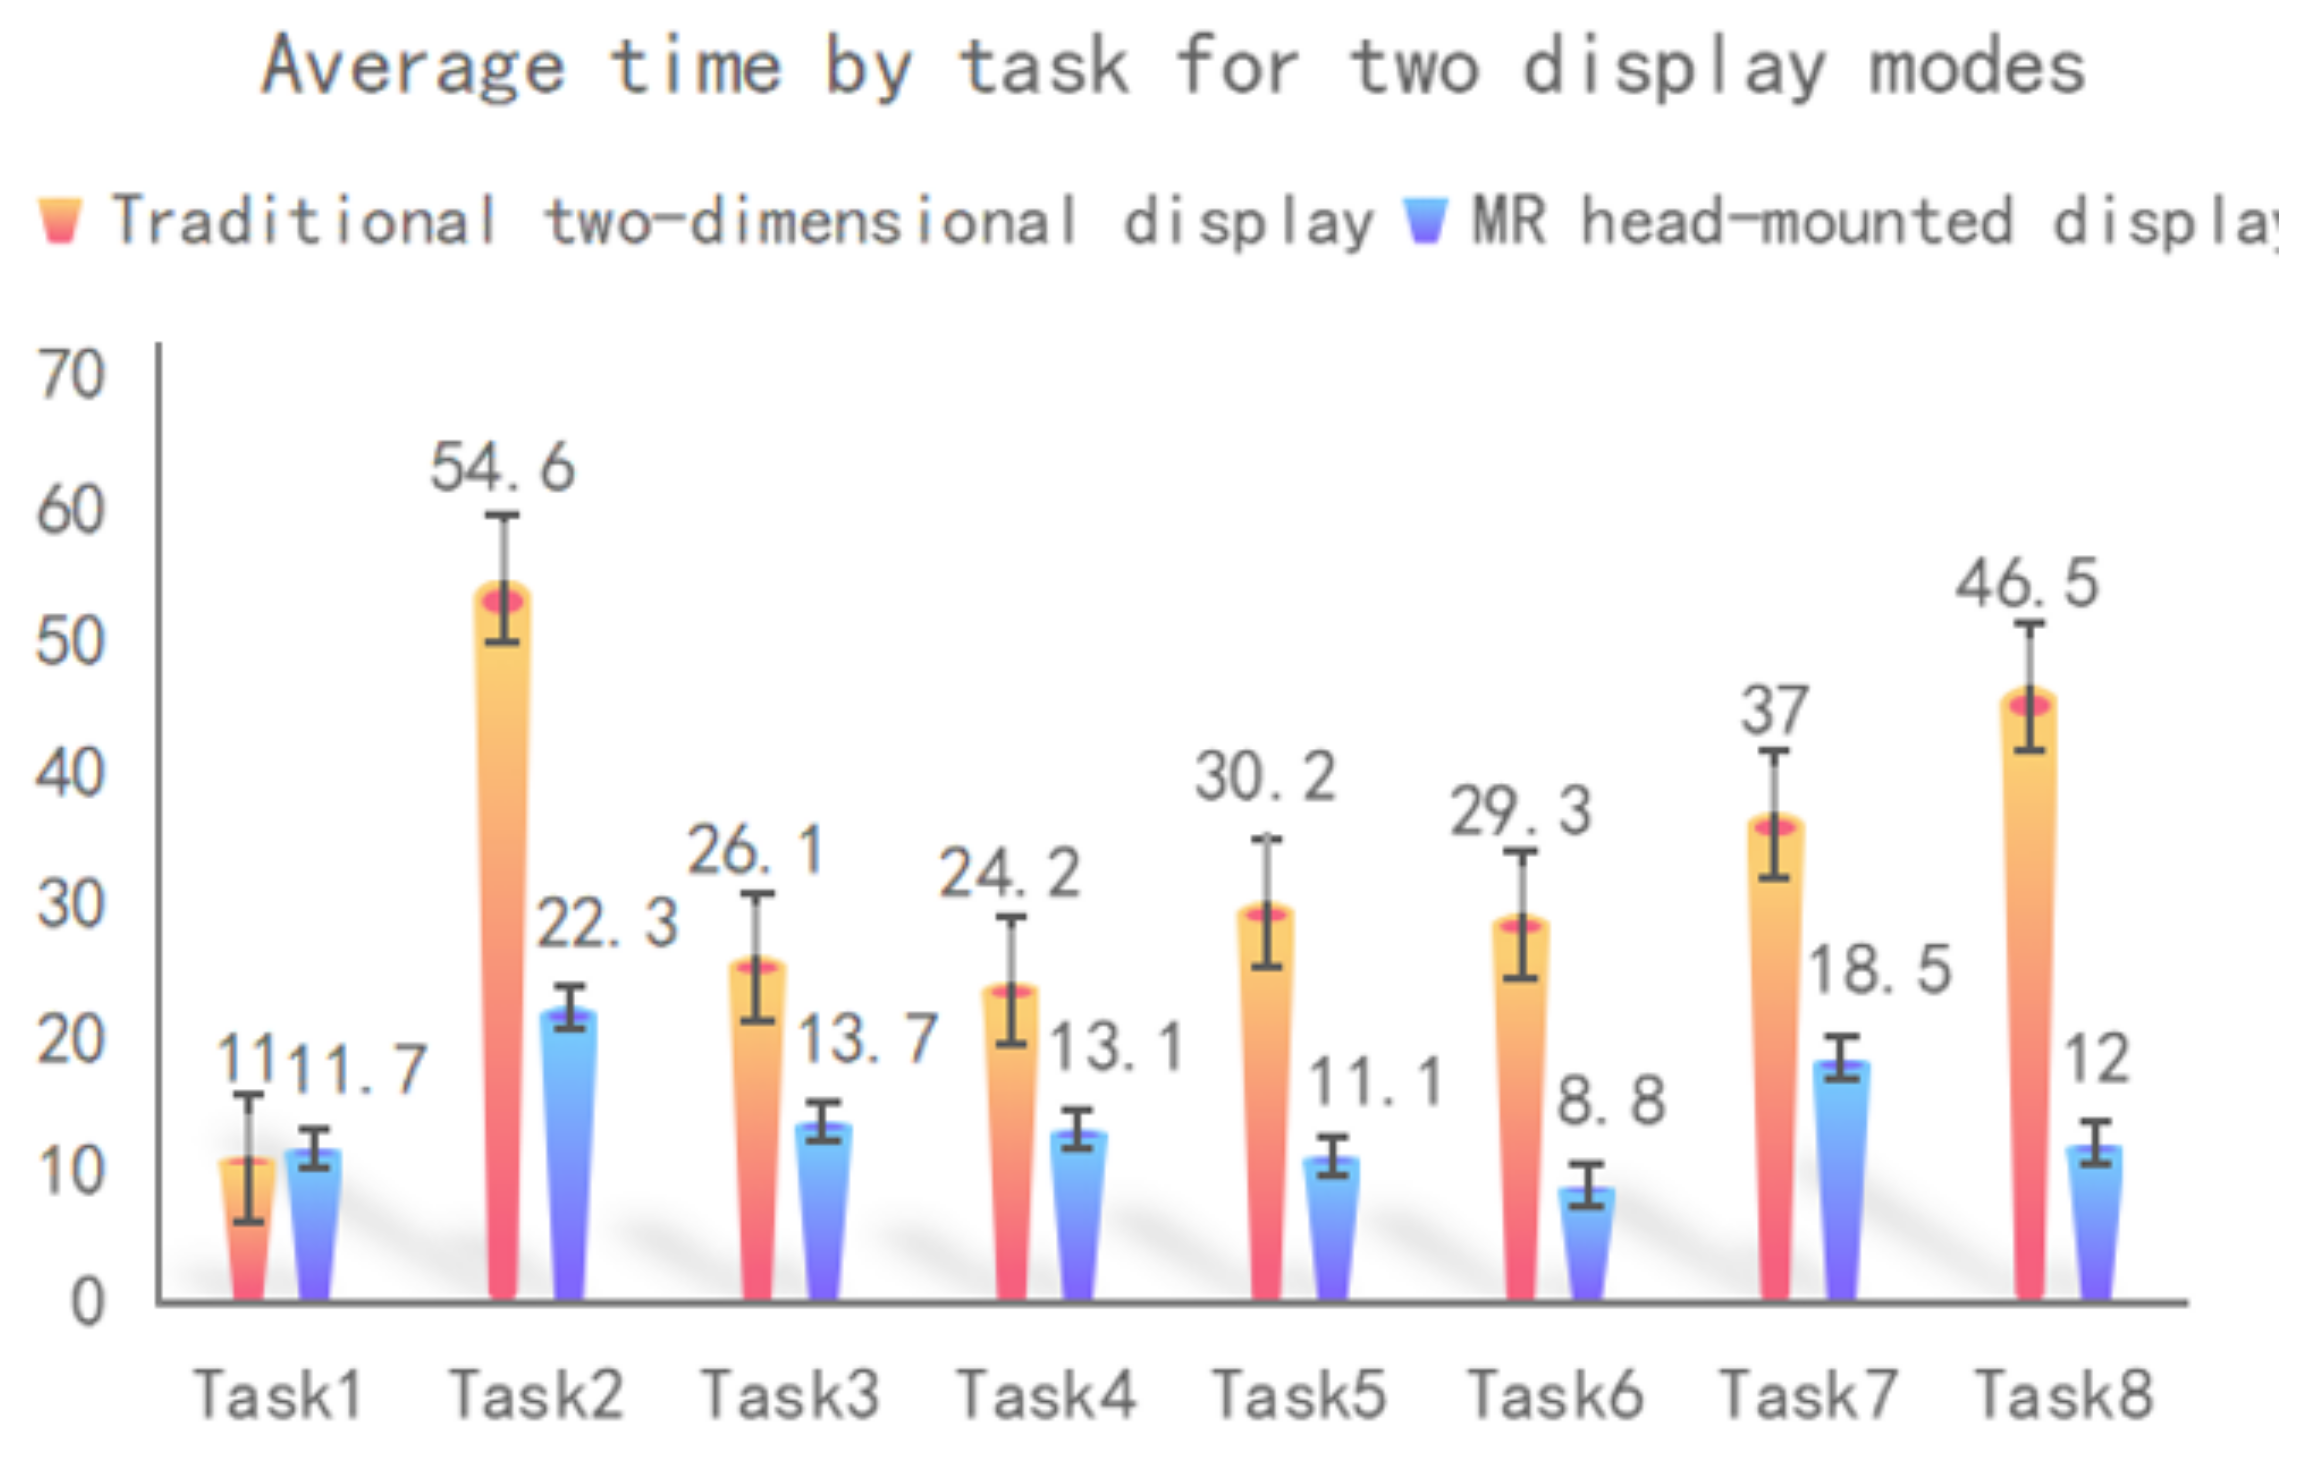
Figure 15 was obtained by analyzing the average time for the two display interactive systems to complete 1–8 sub-tasks.
The analysis of
Figure 15 shows that the traditional two-dimensional display interactive system has advantages over the MR display interactive system for observing the whole environment in task 1. However, for tasks 2 to 8, including operational tasks, the performance of the MR display interactive system is higher than that of the traditional two-dimensional display interactive system.
3.2. Eye Movement Data
Blink frequency in the eye movement index can show the degree of visual fatigue [
42], while the first fixation time can reflect the degree of interest of the experimenter, pupil diameter, number of fixation points and average fixation time can represent the cognitive load of the experimenter level [
43]. Because the subjects in the MR display interactive system could not wear the HoloLens2 and eye tracker at the same time, the solution proposed by Hirota, Masakazu, Kanda and Hiroyuki was adopted in this experiment [
44]. Using the demonstration screen casting function in HoloLens2, the experimenter and the tester were separated. The experimenter performs real-time screen projection from the first perspective in the process of completing the task. The tester cooperates with the experimenter to watch the first perspective of the experimenter completing the task. The eye movement data of the test subjects were collected using an eye tracker. Although the experimental data vary from person to person, the visual fatigue law and visual cognitive load characteristics of people are consistent; therefore, the data obtained by this experimental method is valid, and can reflect the difference in visual fatigue and cognitive load between the traditional two-dimensional display interactive system and the MR display interactive system.
Table 3 is the mean and standard deviation of the eye movement data of 10 male experimenters under the two display interaction systems. The data analysis results show that the average fixation time, pupil diameter, blink frequency, number of fixation points and first fixation time of the MR display interaction system are higher than those of the traditional two-dimensional display interaction system. The paired T-test results show that the eye movement data of the traditional two-dimensional display interaction system and the MR display interaction system are significantly different.
3.3. Peripheral Physiological Characteristics
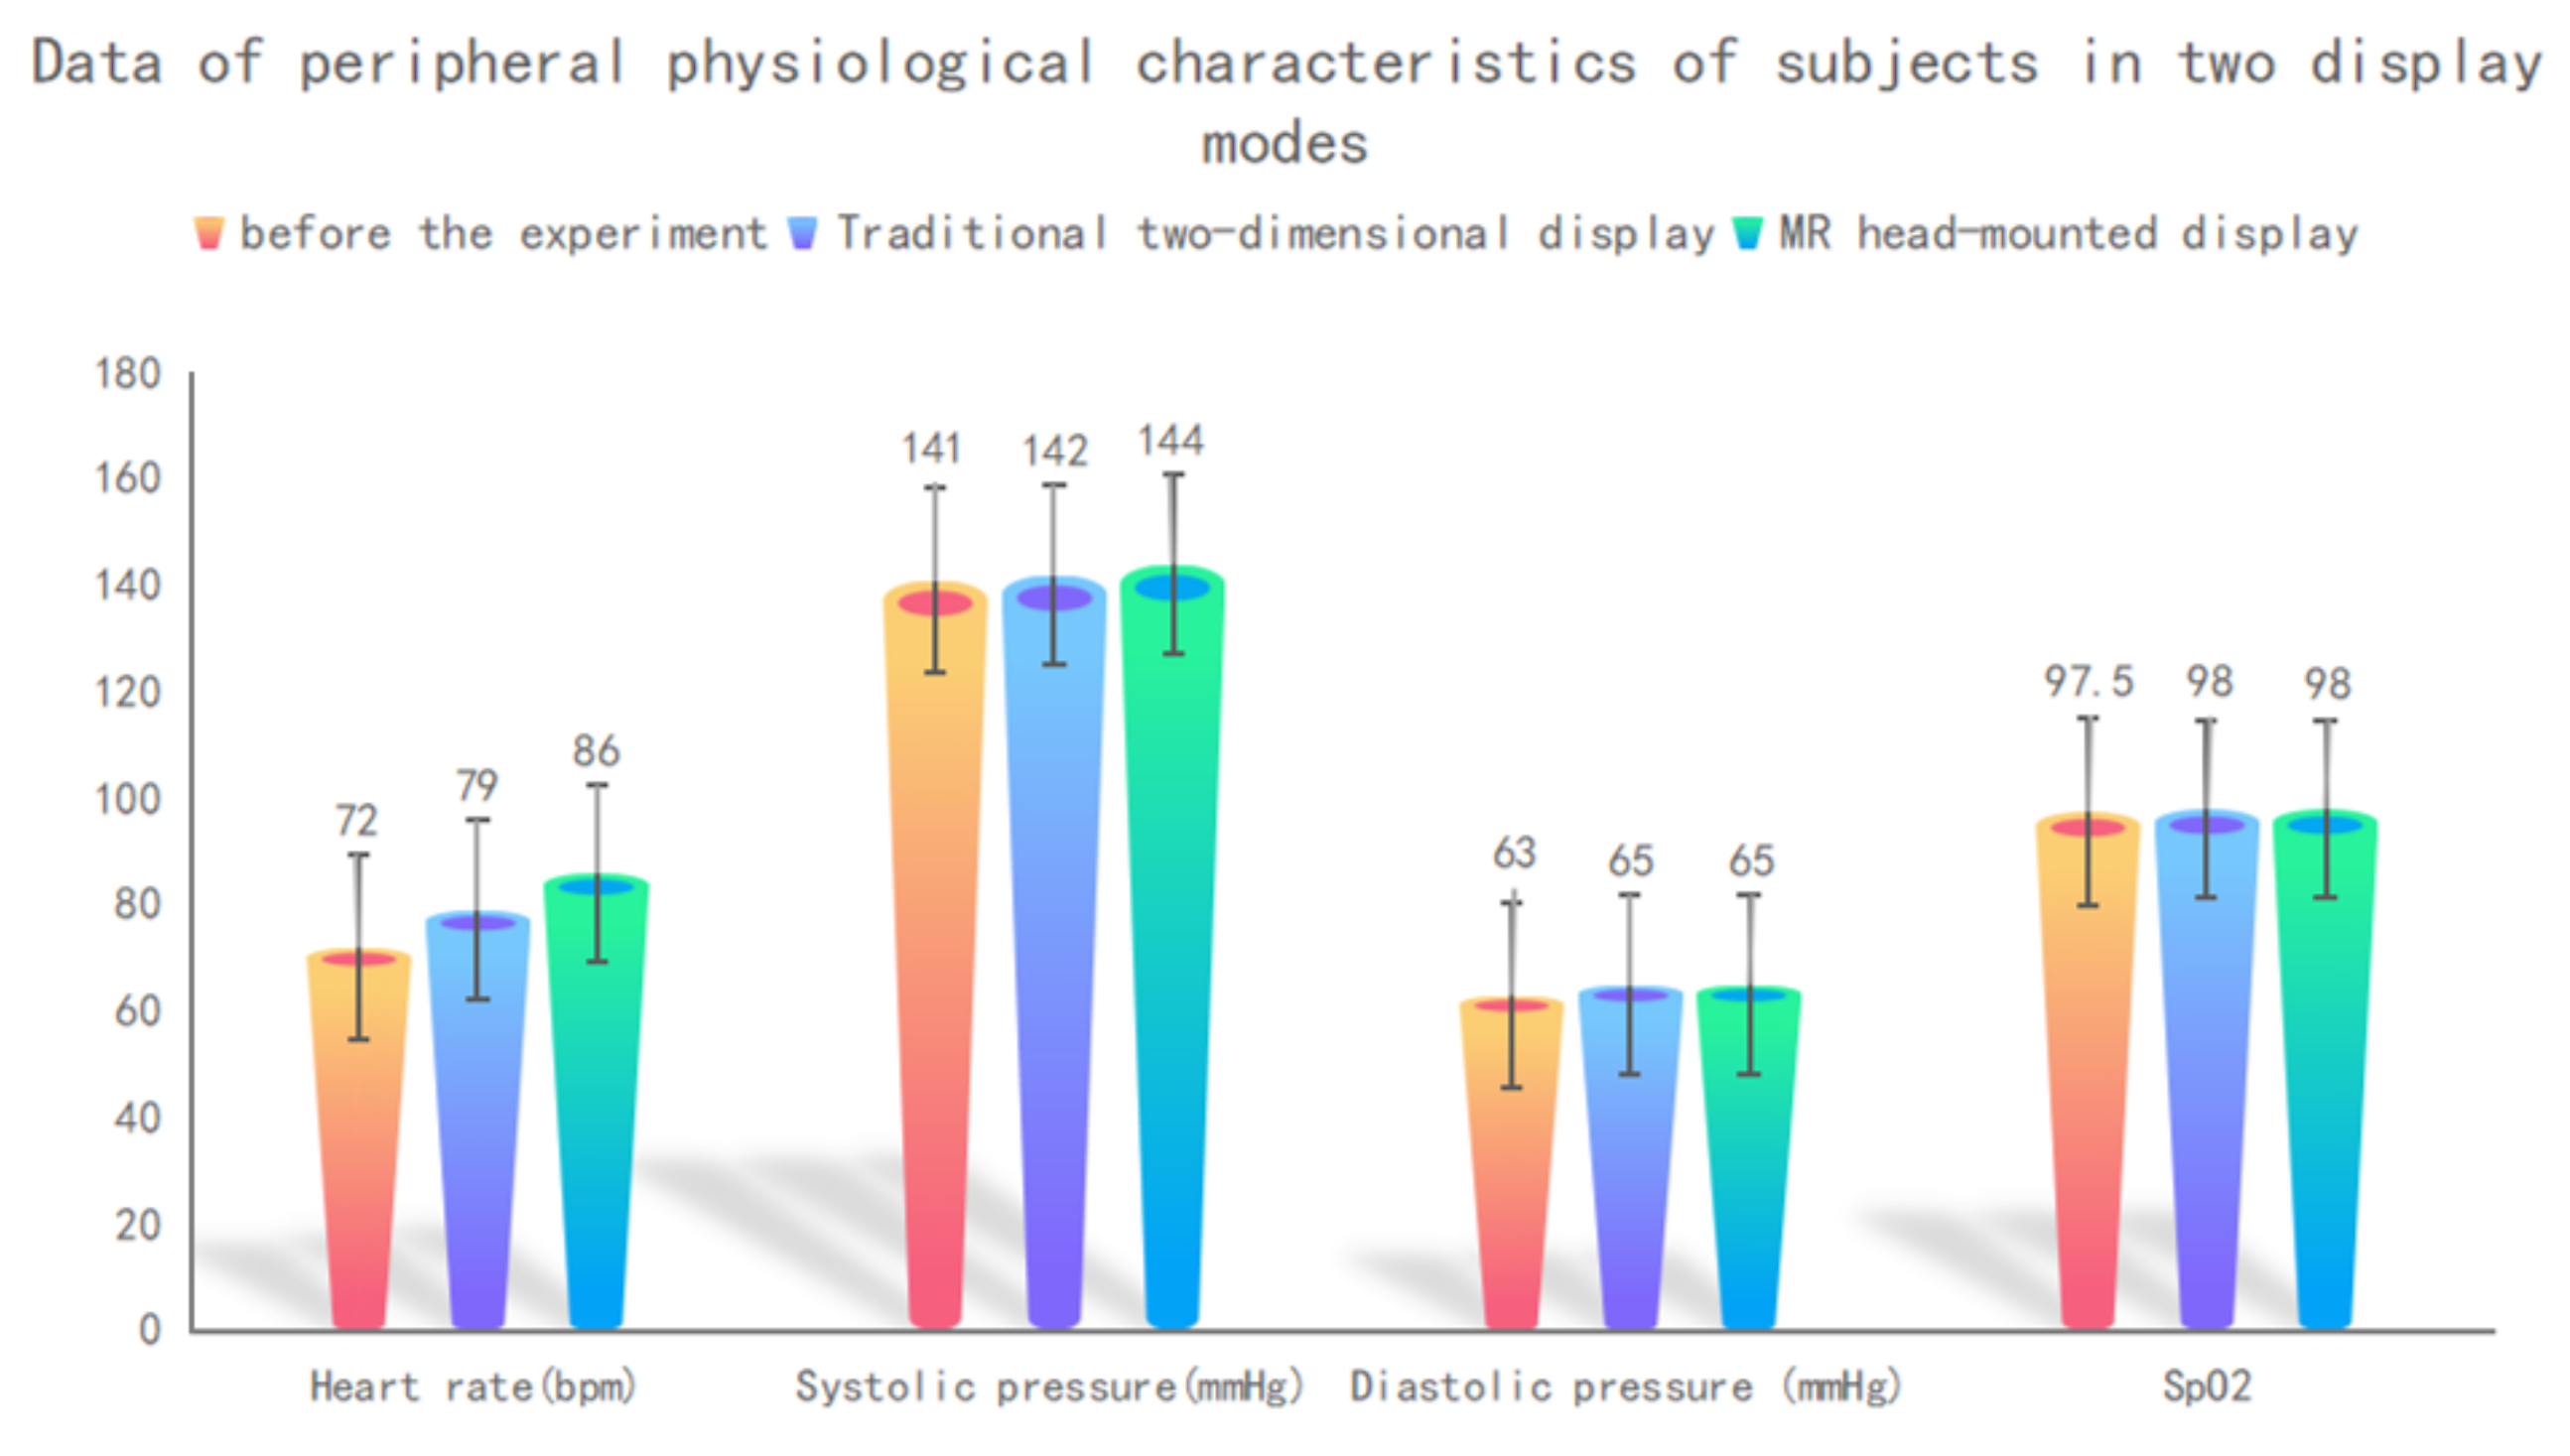
The peripheral physiological characteristic data were collected when the experimenter did not conduct the experiment, after the traditional two-dimensional display interactive system experiment and after the MR display interactive system experiment [
44], as shown in
Table 4 and
Figure 16.
In
Table 4, the data values of systolic blood pressure, diastolic blood pressure and blood oxygen saturation in the traditional two-dimensional display interactive experiment and MR display interactive experiment were not significantly different, but these three data were higher in both groups than before the experiment. From the heart rate data in
Table 4, it can be seen that the experimenter using the MR display interactive system and the traditional two-dimensional display interactive system will cause the heart rate to increase. Additionally, the heart rate of the experiment using the MR display interaction system is higher than that of the traditional two-dimensional display interaction system.
3.4. EEG Data
The amplitude and latency of P300 EEG components are closely related to human cognitive load [
26]. The larger the amplitude and the longer the latency, the greater the human cognitive load [
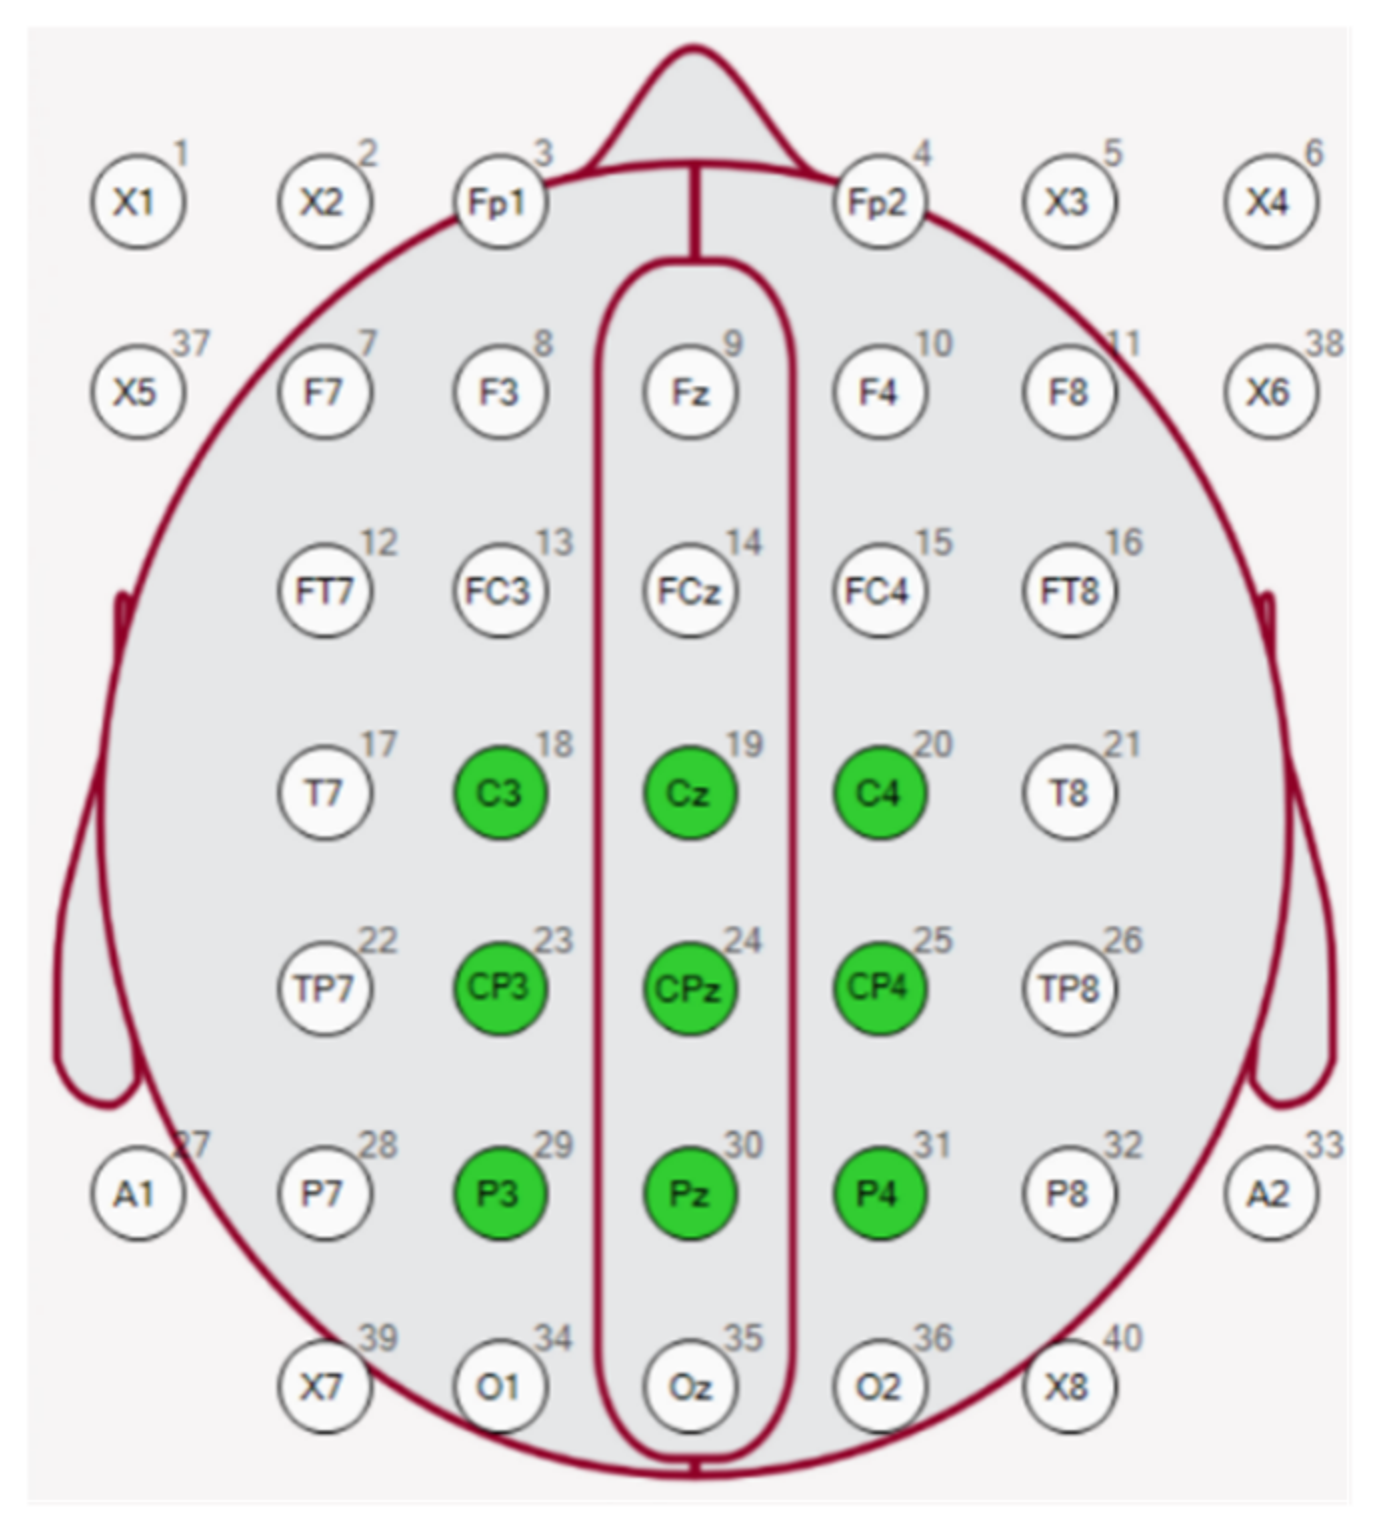
45]. In this experiment, nine electrode points (C3, CZ, C4, CP3, CPZ, CP4, P3, PZ and P4) from the central region to the top region, as shown in
Figure 17, were selected as the analysis electrodes of P300 composition. Participants in the EEG experiment were all men with normal hair volume.
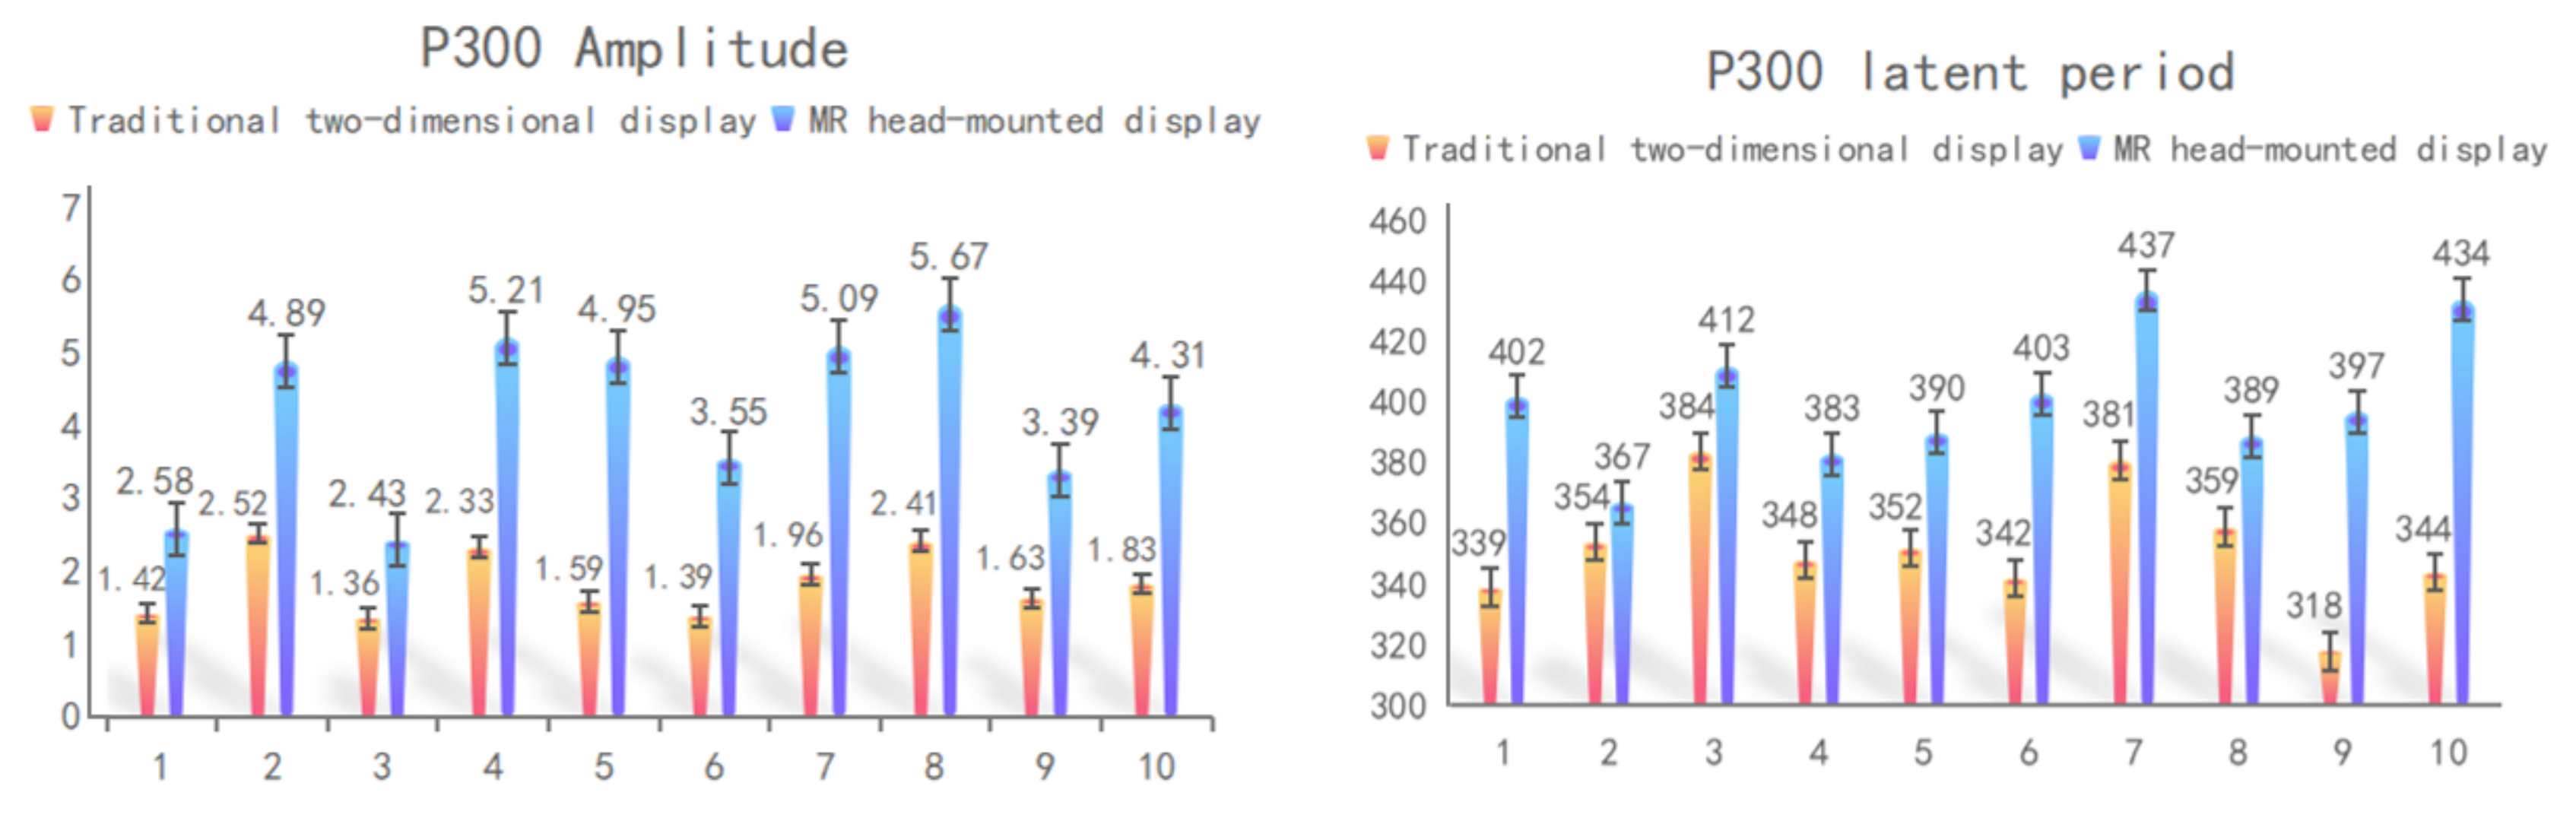
Table 5 and
Figure 18 were obtained from the statistical P300 EEG data of the experimenter.
Further analysis of the EEG data of P300 shows that the average amplitudes of the traditional two-dimensional display interactive system and the MR display interactive system are 1.84 and 4.21. The average latency of the traditional 2D display interaction system and the MR display interaction system was 352.1 and 401.4. The results of paired t-test showed that the P300 EEG data of the experimenters using the traditional two-dimensional display interaction system and the MR display interaction system were significantly different. The amplitude and latency of the MR display interactive system are higher than those of the traditional two-dimensional display interactive system. Among them, the average amplitude of the EEG components of the P300 of the MR display interactive system is 2.29 times higher than that of the traditional two-dimensional display. This shows that the experimenter invests more cognitive resources when using the MR display interaction system to conduct experiments compared with the traditional two-dimensional display interaction system.
3.5. Subjective Evaluation
In addition to exploring the objective performance data and eye movement and EEG data in the use of the two display interaction systems, the subjective feelings of the experimenter when interacting with the display mode are also an important part of reflecting cognitive load and visual fatigue [
46,
47]. The NASA-TLX scale is a relatively accurate method for collecting subjective cognitive load data in cognitive experiments, and it is also widely used. The scale includes six evaluation dimensions: mental demand, physical demand, time demand, effort level, performance level, and frustration level [
48]. An evaluation dimension will have 20 equivalent scales, one scale represents 5 points, the more scales on a dimension means the higher the load of the dimension. Finally, the scale cognitive load value is obtained by multiplying the score of the dimension by its corresponding weight. The weight is determined by the experimenter comparing the importance of the six dimensions in pairs and recording the more important dimension selected by the experimenter. After
= 15 comparisons, the statistics of each dimension are selected by the experimenter as more important times, 1/15 of the value is the weight of this dimension.
Then, the NASA-TLX evaluation scores of the two display interaction systems are shown in Equation (1).
where
is the number of times that the
ith dimension is selected as an important dimension by the experimenter.
where
is the score of the
dimension, and
is the weight of the
dimension.
Following this method, the cognitive load values obtained are shown in
Table 6.
The paired t-test () on the above data showed significant differences, and the score of the traditional two-dimensional display interactive system is lower than that of the MR display interactive system.
3.6. Experimental Result 1
In the MR environment, the whole scene is constructed in a three-dimensional space, and the experimenter needs to constantly change the perspective and orientation to observe the whole environment. In the traditional two-dimensional interactive display system, the experimenter can adjust the display size of the sand table by mouse and keyboard, so that the whole command sand table can be directly observed. Additionally, because in the MR environment, the experimenter can directly interact with the target after searching for the target. In the traditional two-dimensional display interaction system, the experimenter needs to adjust the position, angle and target size of the interface display through the cooperation of the mouse and the keyboard to complete the interaction process. Moreover, in the two-dimensional mode, it is impossible to directly interact with the target, and the interaction process is also more complicated. Therefore, when observing the whole environment in the experiment, the performance of the two-dimensional display interactive system is higher than that of the head-mounted display mode, but once the interaction process is involved in the task, the performance of the MR display interactive system is much higher than that of the two-dimensional display interactive system.
HoloLens2 generation builds a mixed reality environment by directly projecting parallax images to people’s eyes, which will cause the visual focus of the experimenter’s eyes to be not at the same depth, and the pressure of the convergence and divergence adjustment of the eyes will increase, and the experimenter’s eyes will have higher visual fatigue. In the mixed reality environment, the experimenter has a better sense of immersion, and often shows strong interest after entering the mixed reality environment. However, in the MR environment, the experimenter receives more information and has more information dimensions, so for the experimenter there is often a higher cognitive load in the MR environment. It can be seen that the experimenter is more interested in the MR display interaction mode, but in the case of completing the same task, the cognitive load and visual fatigue of the MR display interaction system are slightly higher than those of the traditional two-dimensional screen display.
When people are in a stressful, tense environment or have physical exertion, their heart rate will increase. The greater the pressure and the higher the load, the higher the heart rate will be. It can be seen that when experimenters use the MR display interaction system and the traditional two-dimensional display interaction system to carry out experimental tasks, there is a certain degree of pressure and tension, and they also have a certain cognitive load. However, experimenters had a higher cognitive load and were more physically exhausted when using MR to display the interactive system.
Among them, the average amplitude of the EEG components of the P300 of the MR display interactive system is 2.29 times higher than that of the traditional two-dimensional display. This shows that the experimenter invests more cognitive resources when using the MR display interaction system to conduct experiments compared with the traditional two-dimensional display interaction system. Among them, the average latency of the EEG component of the P300 of the MR display interactive system is 1.14 times longer than that of the traditional two-dimensional display interactive system. This shows that it is more difficult for the experimenter to obtain visual information when using the MR display interaction system to perform experimental tasks. It can be seen from the above that the cognitive load of the traditional two-dimensional display interactive system is significantly lower than that of the MR display interactive system, and the traditional two-dimensional display interactive system can obtain visual information more easily.
The experimenter is more adaptable to the traditional two-dimensional display interactive system in the process of completing the task, which is related to the experimenter’s daily habits. Compared with the MR display interactive system, the experimenter uses the traditional two-dimensional display more in daily life. Therefore, it is more acceptable for experimenters to use traditional two-dimensional display interactive system to complete experimental tasks in subjective evaluation. The results of the data show that the experimenter believes that the cognitive load of the traditional two-dimensional display interactive system is lower than that of the MR display interactive system.
5. Multi-Channel Interaction Improvements for MR Display Interactive System
Because of its good immersion and the complexity and diversity of display information, the MR interactive display system needs to occupy higher cognitive resources when people obtain the information they need in real time, which is why the cognitive load and visual fatigue of MR interactive display system is higher than that of the traditional two-dimensional interactive display system. A single visual channel is hardly suitable for today’s complex command and control tasks. Therefore, multiple channels of gesture and language are added to the MR display interactive system to cooperate with vision for task operation [
49,
50,
51].
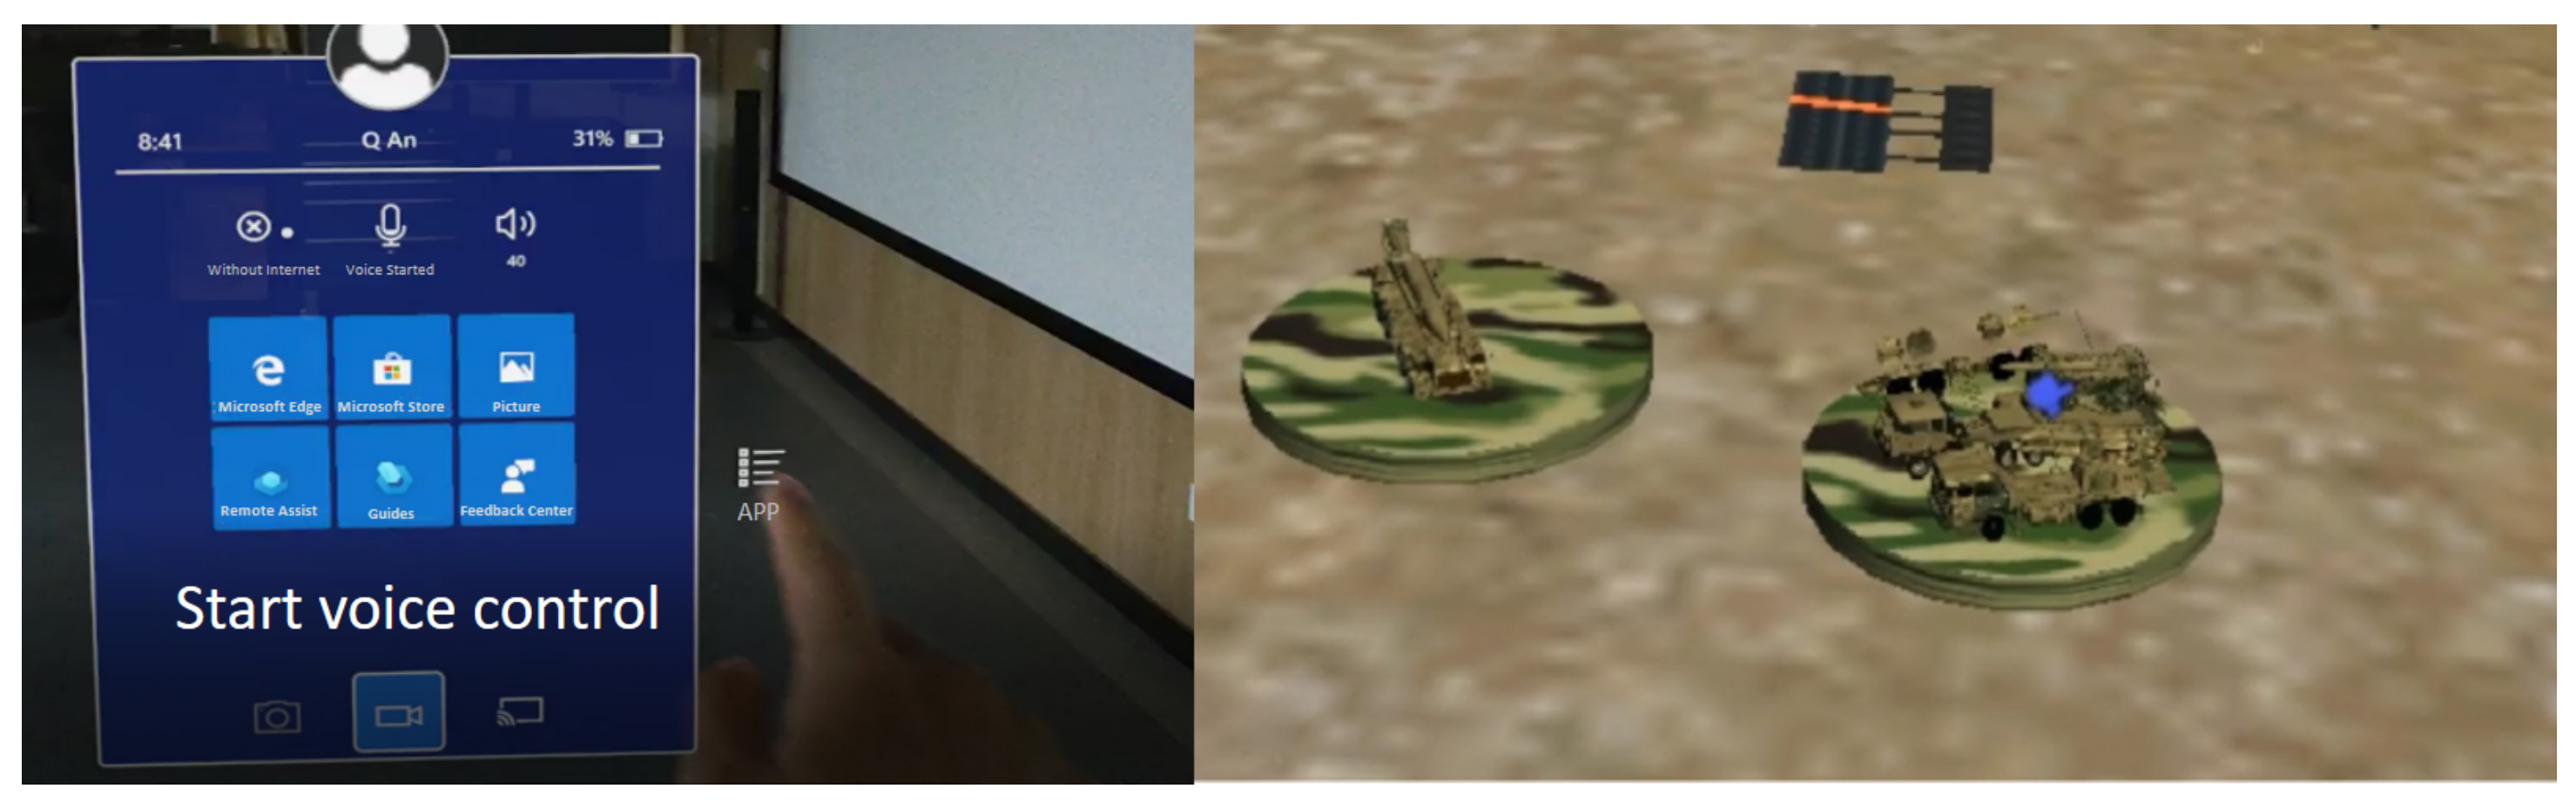
In the mixed reality environment, radar was enabled, the missile vehicle was controlled for erection preparation, and the missile vehicle was controlled to launch missiles from the original pinch start to the language start. The check box was changed to load our terrain and blue information was displayed, along with load landmarks and radar display from the original click to gesture operation. For example, when multi-channel improvements are made to MR, the task process of controlling a missile vehicle to launch a missile to shoot down an aircraft becomes the following steps. 1. The experimenter puts on the HoloLens2 and starts the language. 2. The experimenter said: “missile vehicle launch”. At this time, the virtual hand in the mixed reality environment will automatically move to the missile car and click the target automatically.
Figure 19 shows the task process of the language-controlled missile vehicle launching missiles.
The multi-channel improved MR as a new display interaction system is compared with the unimproved MR display interaction system and the traditional two-dimensional display interaction system. The subjects used the multi-channel improved MR display interaction system to complete the same experimental task as above and collected the task performance and cognitive load of the improved MR display interaction system under this task condition. The performance and cognitive load of the improved MR display interactive system were compared with those of the unimproved MR display interactive system and the traditional two-dimensional display interactive system in the above experiments, so as to obtain the advantages and disadvantages of the three display interactive systems under the same task.
In this experiment, the experimental steps and task flow of the improved multi-channel MR display interactive system are consistent with
Figure 11.
The performance experiment of the multi-channel improved MR display interaction system is carried out, and the results are shown in
Table 7.
Through data analysis in
Table 2 and
Table 7, it is concluded that the total average time for the traditional two-dimensional display interactive system to complete the task is 258.8 s, the total average time for MR display interactive system to complete the task is 111.2 s, and the total average time for MR display interactive system to complete the task is 61.9 s after multi-channel improvement. One-Way ANOVA for three display interaction systems (
F(2, 27) = 748.79,
p < 0.001). One-Sample
t-test Analysis of Multi-channel Improved MR display interaction system (
t(9) = 61.89,
p < 0.001). The results show that different display interactive systems have a significant impact on the task completion time. Under the same task condition, the improved MR display interactive system had the highest task performance under the three display interactive modes.
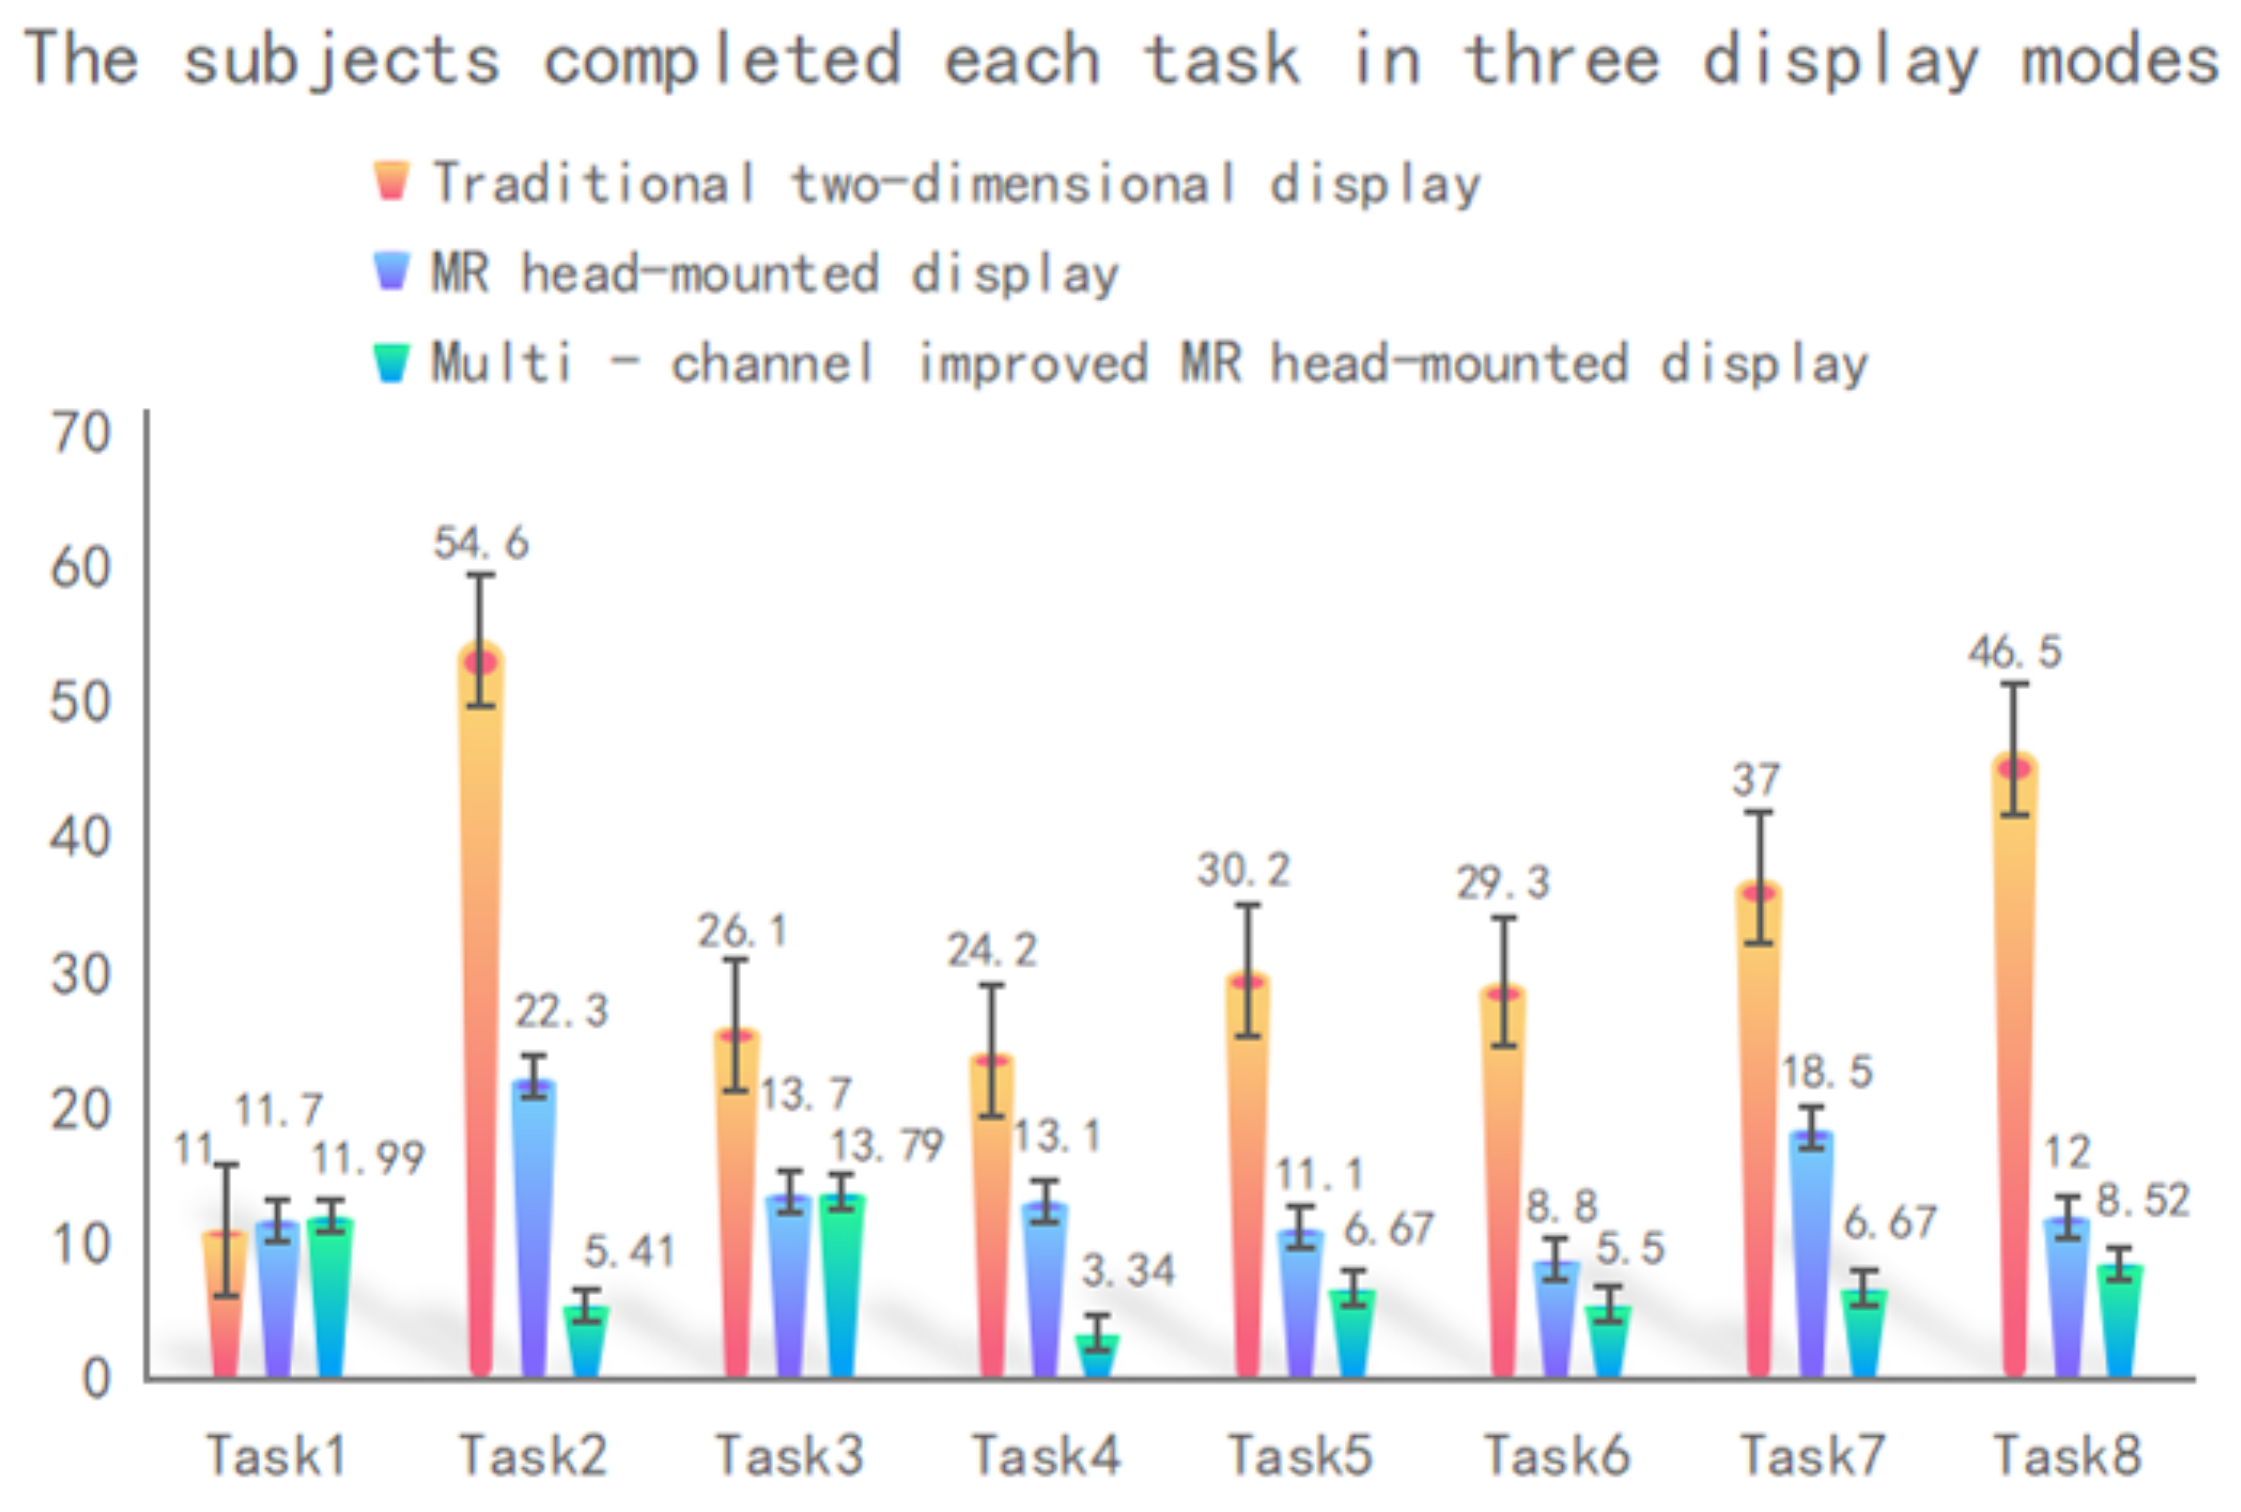
The average time for completing 1–8 sub-tasks in the three display interaction systems was analyzed and
Figure 20 was obtained.
Analysis of
Figure 20 shows that after multi-channel improvement, the completion time of the MR display interaction system is significantly reduced in tasks requiring interactive operation such as task 2, task 4, task 5, task 6, task 7 and task 8, and the total task completion time is also significantly reduced.
The eye movement data, peripheral physiological data and EEG data of the multi-channel improved MR display interaction system are shown in
Table 8 and
Table 9.
As shown in
Table 8, the eye movement data and peripheral physiological characteristic data of the MR display interaction system after the multi-channel improvement are significantly lower than those of the MR display interaction system without the multi-channel improvement, and even lower than the traditional two-dimensional display interaction system.
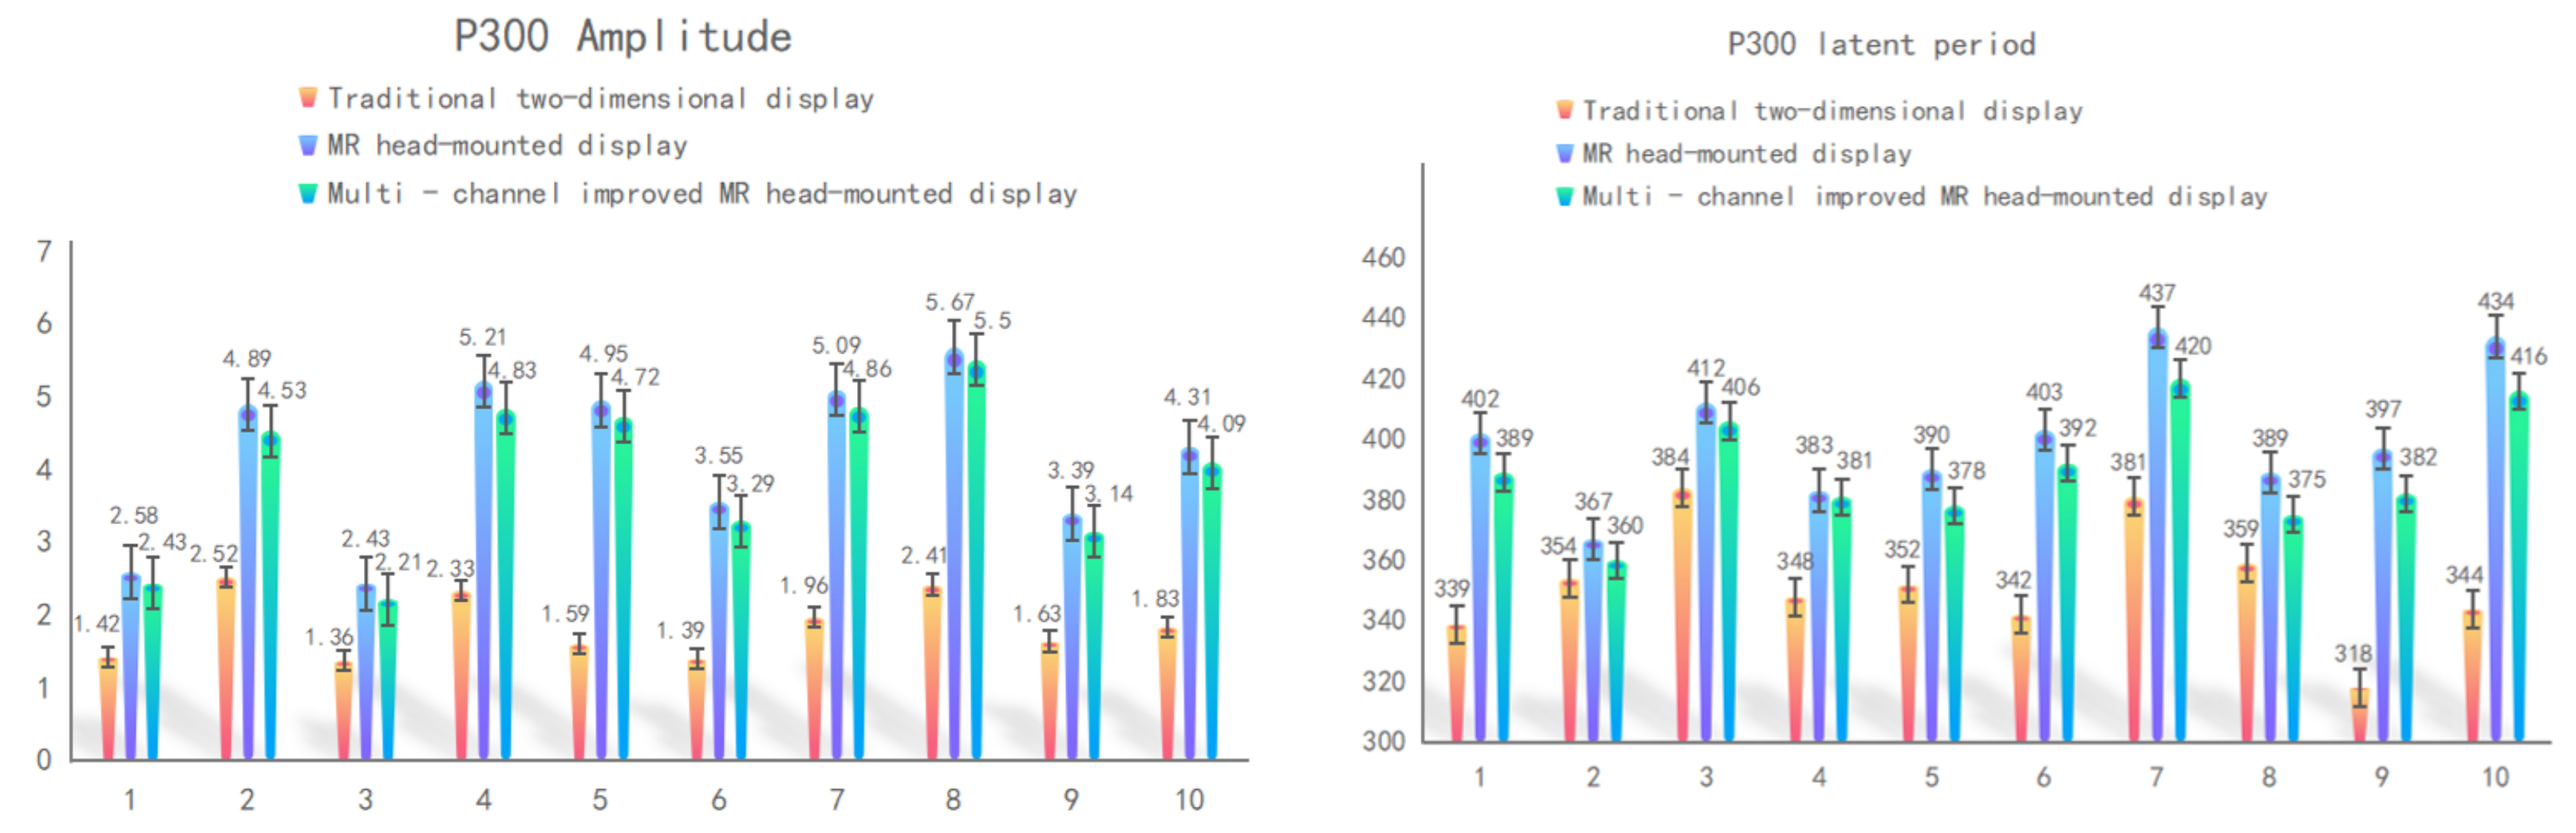
Combined analysis of the P300 EEG data of the experimenter in three display interaction systems is shown in
Figure 21.
By analyzing the P300 EEG data, the average P300 amplitude and latency of the multi-channel improved MR display interaction system were 1.56 and 347.3, respectively. The amplitude and latency are lower than those of the conventional 2d display interaction system and the unmodified MR display interaction system.
Subjective scores were given to the improved MULTI-channel MR display interaction system, and the data are shown in
Table 10.
Comparing
Table 6 and
Table 10, the experimenter believes that the cognitive load of the improved multi-channel MR display interaction system is lower than that of the traditional two-dimensional display interaction system and the unimproved MR display interaction system. The results of one-way ANOVA show that the three display interaction systems have significant differences in the subjective feelings of the experimenters (
).
5.1. Experimental Result 2
After the multi-channel improvement, the interaction mode of MR display interactive system becomes more concise, which not only improves the performance of interactive task in the MR display interactive system, but also greatly simplifies the process of visual search for objects. This resulted in a dramatic increase in performance after the multi-channel improvement of the MR display interaction system.
After the multi-channel improvement of the MR display interactive system, both the cognitive load and visual fatigue of the subjects were improved, and the visual fatigue and cognitive load of the improved MR display interactive system were even slightly lower than that of the traditional two-dimensional display interactive system. The reasons for this were analyzed. After the multi-channel improvement of the MR display interaction system, the task time was greatly reduced, which greatly reduced the visual resources and cognitive resources the experimenter paid after completing the entire task process, and after the multi-channel improvement of the MR, the difficulty of interactive operations was reduced, the visual search process was simplified, the overall task difficulty was reduced, and the proportion of vision in the task process was reduced to a certain extent.
After the multi-channel improvement of the MR display interaction system, the convenient and fast interaction mode, low visual fatigue, cognitive fatigue and high task performance make this display interaction system favored by experimenters; experimenters will feel more comfortable when performing tasks in this display interaction system.
5.2. Data Normalization Processing
Further statistical processing was performed on the measured subjective and objective data [
52], and the results are shown in
Table 11.
Build matrix
, represents the data of the
jth indicator under the
ith scheme.
Obtain the normalized matrix
Put the data into the matrix to obtain:
.
Data normalization processing:
The normalized data were solved and weighted.
5.3. Determine the Weight of Evaluation Indicators
The AHP hierarchical structure model was established using the Analytic Hierarchy Process [
53]. A total of 12 experts participated in the establishment of the evaluation index weights, all of whom have a rich knowledge of human–machine efficacy, human–machine evaluation and mixed reality. After statistics, analysis and calculation, the weight of each indicator was obtained as shown in
Table 12.
The weighted quantitative scores for the three display interaction systems are as follows.
Sum the weighted scores of each indicator for the three display interaction systems to calculate the weighted total score for each system mode:
After calculation, the total score of the traditional two-dimensional display interaction syste-m is 96.45, the total score of the MR display interaction system without multi-channel improvement is 95.04, and the total score of the MR display interaction system with multi-channel improvement is 108.51.
Summarizing the above data, it can be seen that after the multi-channel improvement of the MR display interaction system, its performance has been improved, and the cognitive load and visual fatigue was also significantly optimized compared with the unimproved MR display interaction system. It even has advantages in terms of cognitive load and visual fatigue compared to the traditional two-dimensional display interaction systems. The multi-channel improved MR display interaction system scored the highest among the three systems on the overall evaluation of completing the same task.
This result indicates that the use of the MR display interaction system improved by multi-channel is a better choice in terms of comprehensive performance, cognitive load, visual fatigue and subjective evaluation when completing the same operational task.
6. Conclusions 2
When performing the same complex task, the direct use of the MR display interaction system can improve the performance to a certain extent compared with the traditional two-dimensional display interaction system and reduce the time to complete the task using the system, but because of its greater cognitive load and Visual fatigue, when completing this task, the cognitive load and visual fatigue of the MR display interactive system are still higher than that of the 2D display. After the multi-channel improvement of MR, the performance of completing the task is further improved, and the cognitive load and visual fatigue of completing the same task are also significantly reduced, which are even lower than the traditional two-dimensional display interactive system. The scoring results of comprehensive task performance, cognitive load and visual fatigue were multi-channel improved MR (108.51) > traditional two-dimensional (96.45) > unimproved MR (95.04).
The research results show that under complex command and control tasks, the multi-channel improved MR display interaction system is the best display method to complete the task, integrating performance, visual fatigue, cognitive load and subjective evaluation.
There are two limitations of this paper. 1. The paper only qualitatively compares the cognitive load of the two display interactive systems, and concludes that the cognitive load of the MR display interactive system is higher, but it is not clear how much higher. 2. The experimental tasks in this paper are only typical tasks in air defense tasks, and the types of experimental tasks are not extended.


