Article

Performance Analysis of Empennage Configurations on a Surveillance and Monitoring Mission of a VTOL-Plane UAV Using a Computational Fluid Dynamics Simulation

by
Gesang Nugroho
*,
Galih Zuliardiansyah
and
Azhar Aulia Rasyiddin
Department of Mechanical and Industrial Engineering, Faculty of Engineering, Universitas Gadjah Mada, Yogyakarta 55284, Indonesia
*
Author to whom correspondence should be addressed.
Aerospace 2022, 9(4), 208; https://doi.org/10.3390/aerospace9040208
Submission received: 11 February 2022 / Revised: 31 March 2022 / Accepted: 7 April 2022 / Published: 11 April 2022
(This article belongs to the Section Aeronautics)

Abstract

:
A Vertical Take-Off and Landing-Plane (VTOL-Plane) is an Unmanned Aerial Vehicle (UAV) that combines multirotor and fixed-wing configurations. It has a good cruise range compared to a VTOL vehicle. Furthermore, it can take-off and land vertically. This technology is ideal for surveillance/monitoring missions and transmitting data in real-time. This study discusses the design of a VTOL-Plane with a preset Design Requirement Objectives (DRO), namely a Maximum Take-Off Weight (MTOW) of 14 kg, a cruise speed of 23 m/s, and a cruising range of 6 h. To maximize the performance, the empennage configurations on the VTOL-Plane varied, and then a Computational Fluid Dynamics (CFD) simulation was carried out. The empennage configurations analyzed were a U-shaped boom, an inverted U-shaped boom, an inverted V-tail boom, and a semi-inverted V-tail boom. The interpreted performance related to the stalling angle, flight efficiency, stability, stall speed, and maneuverability. The relative wind directions toward the longitudinal axis of the UAV, also called the sideslip angle, were varied. The CFD simulation results showed that the empennage configuration of the inverted U-shaped boom is suitable for a surveillance mission. This article also optimized the final empennage design by adding a vertical fin to improve stability.

1. Introduction

Surveillance areas need technology that can monitor and transmit data in real-time. Area managers should acquire information promptly and make choices swiftly before disasters or unlawful actions worsen. Drones are crewless aircraft of remarkably reduced dimensions, a low energy consumption, a low cost utilization, a minimal risk to human life, and a promising future for forestry applications [1]. Moreover, drones are also commonly used for military needs [2]. In this case, the optimization of the drone design is important for a surveillance mission.
Drones come in a variety of shapes and sizes, and their applications are expanding as technology advances. A Vertical Take-Off and Landing-Plane (VTOL-Plane) is a drone that combines fixed-wing and rotary-wing configurations, making it ideal for surveillance missions [3]. A VTOL-Plane or quad plane is suitable for this mission since it can hover, cruise efficiently in fixed-wing mode, and complete smooth transitions [4]. A VTOL-Plane can take-off and land without a runway and has a high cruising range, making it ideal for usage in rough terrain. Moreover, a VTOL-Plane with a different energy source, such as electricity for VTOL motors and gasoline for plane propulsion, could improve the cruising range.
The design of a VTOL-Plane Unmanned Aerial Vehicle (UAV) varies depending on the mission. Numerous designs are available, such as a TURAC VTOL tiltrotor and a fixed-wing VTOL, each with its own concept. This research includes several innovations for overcoming various VTOL problems, such as thrust vectoring, transition flights, and mechanical transformation from VTOL to Conventional Take-off and Landing (CTOL) flights [5]. Unfortunately, there is a complicated mechanism for the tiltrotor and a complex control system, so it is not used as a design reference. The fixed-wing-VTOL design is similar to the twin tail boom layout, but there are a few differences, such as the boom structure for VTOL motors [6]. This concept is simple to grasp and can be further expanded.
There are many empennage geometry concepts for a twin tail boom VTOL-Plane. The inverted U-shaped boom [7,8], U-shaped boom [9], inverted V-tail boom [10], semi-inverted V-tail boom [11] are some of the most frequent empennage geometries. Furthermore, no research has been undertaken to determine which empennage geometries work better on a twin tail boom VTOL-Plane. As a result, this paper will discuss which empennage geometries have an excellent performance, including the final empennage design optimization.
A UAV is designed in several processes [12], beginning with the conceptual design, preliminary design [13], and detailed design [14,15,16,17]. A reliable UAV can be obtained by following these references. The important parameters to comprehend are the stall phenomenon, efficiency, stability, and maneuverability. However, a number of factors could cause those main parameters to be disrupted. These issues could be caused by fluid dynamics, which provide interference airflow between the wing and the fuselage, causing the aircraft to become unstable and lose the amount of lift force. The sideslip angle, which is formed by the relative wind directions and the aircraft’s direction, can affect the plane’s stability. The sideslip angle is crucial to understand since it influences lateral and directional stability [18,19,20]. The sideslip angle could induce a more obscure and complicated flight safety [21]. Meanwhile, the VTOL-Plane needs a precise fly position to approach tough terrain for landing. Before the UAV is tested to fly, further study of the empennage geometry is required to confirm that the UAV design can eliminate the difficulties.
The overall design of the UAV is analyzed using the Computational Fluid Dynamics (CFD) approach [22]. The CFD method is applied because it is simple to implement and does not require high costs as the wind tunnel method does. In addition, this simulation uses the accurate turbulence model which is applied to provide accurate data [23]. Moreover, the CFD simulation is very suitable for varying parameter variations, particularly the sideslip angle.
Every empennage geometry has a different characteristic. The H-tail or U-shaped boom empennage is the most efficient for the low-wing, mid-wing, and high-wing configurations [24]. However, that study merely looked at the wing and the empennage, not the rest of the aircraft parts. So, the analysis was less accurate regarding the aerodynamics effect from the fuselage. In crosswind situations, the V-tail empennage is quietly stable [25]. They found that the V-tail has an advantage in having positive lateral stability at all tested sideslip angles (up to 60°) compared to conventional empennage configurations. Unfortunately, the V-tail empennage layout is not compatible with a dual tail boom VTOL-Plane. This study will invert the shape of the V-tail respecting the VTOL-Plane twin tail boom configuration used in this research and analyze the aerodynamic performance.
The VTOL-Plane empennage configuration in this research used a twin tail boom configuration. On the other hand, twin-tail boom design geometry is quite varied. As a result, the empennage geometry was varied and analyzed using a Computational Fluid Dynamics (CFD) approach to estimate the aerodynamic performance in various wind situations. This paper also discusses the optimization of the final empennage design for a VTOL-Plane.

2. Research Methods

This study aimed to determine the best empennage performance for a VTOL-Plane UAV, beginning with the creation of a VTOL-Plane with a specific DRO and variations in the empennage geometry. In this research, the VTOL-Plane was designed to have a different energy source to improve the cruise range. VTOL propulsion uses an electric source and gasoline for fixed-wing propulsion. Therefore, this research merely chose the appropriate brushless motor and battery source for the VTOL take-off and landing performance. CFD modeling was also performed to evaluate the empennage configuration in a variety of wind conditions. The best empennage configuration was chosen and evaluated for the weaknesses, and the tail design was optimized to improve the final design performance.

2.1. Design Requirements and Objective

The VTOL-Plane for surveillance is designed to fly at a low speed and with good stability. The Civil Aviation Safety Regulation (CASR) [26], which governs UAV operations, is also used to determine the requirements. The design requirements for the VTOL-Plane must be met in order for the VTOL-Plane to be certified. Table 1 shows the DRO, and Figure 1 shows the mission profile of the VTOL-Plane.

2.2. Conceptual Design

Several major elements were configured during this stage, including the wing, fuselage, empennage, and propulsion systems. The wing was designed to fulfill the mission’s requirements; hence, the high wing configuration was used to provide the most lift force. To make the manufacturing process easier, the wing was designed without dihedral angles.
The dimensions of the fuselage adapted the components carried and designed to minimize drag. The propulsion system chosen was a pusher because the empennage configuration used was a twin tail boom and used an engine propulsion system. It aims to balance the moment at the Center of Gravity (CoG) because the load is placed before the CoG.
ALTI Ascend [7], ALTI Transition [8], Great Shark 330 [11], and Sparrow VTOL [27], all of which are similar to the DRO, were chosen as comparison planes in this study. The comparison planes were needed to solve several equations. The empennage configuration was varied to determine the best performance. The following empennage configurations were used in the comparison:
  • U-shaped boom [9];
  • Inverted U-shaped boom [7,8];
  • Inverted V-tail boom [10];
  • Semi-inverted V-tail boom [11].

2.3. Preliminary Design

In the preliminary design stage, performance sizing such as take-off weight, empty weight, fuel weight, power loading, and wing loading were calculated to determine the requirements of the VTOL-Plane. The comparative plane data was used as a reference in this calculation using the equations given by [13]:
  • Fuel fraction, these equations are shown in Table 2:
where:
  • W a W e = Fuel fraction
  • R c r = Cruising range (miles)
  • E l t r = Loiter time (hours)
  • η p = Propeller efficiency
  • c p = Specific fuel consumption (lbs/hp/hr)
  • L D = Lift to drag ratio
  • V l t r = Loiter velocity (miles per hour)
2.
Mission fuel fraction (Mff):
M f f = ( M f f 1 ) ( M f f 2 ) ( M f f n )
where:
  • Mff = Mission fuel fraction
3.
Total fuel (WF):
W F = ( 1 M f f ) W T O + ( M f r e s ) W T O
where:
  • WF = Total fuel weight (kg)
  • WTO = Take-off weight (kg)
  • Mfres = The ratio of reserve fuel weight to total fuel weight
4.
Empty weight (WE) and take-off weight (WTO):
log 10 W T O = a + b log 10 W E
where:
  • WE = Empty weight (kg)
5.
Regression constant a and b:
Y = a + b X +
b = n ( X Y ) ( X ) ( Y ) n ( X 2 ) ( X ) 2
a = Y b ( X ) n
where:
  • Y = Predicted value
  • X = Independent variable
  • = Residual value
  • a = Regression constant a
  • b = Regression constant b
  • n = Number of comparison planes
6.
Stall speed performance:
( W S ) s = 1 2 × ρ × v s 2 × C L max S
where:
  • ( W S ) s = Stall speed wing loading (lb/ft2)
  • ρ = Air density (slug/ ft2)
  • v s = Stall speed (ft/s)
  • C L max S = Stall speed lift coefficient
7.
Take-off performance (VTOL to fixed-wing transition):
In this research, the the VTOL to fixed-wing transition performance was calculated using the conventional take-off performance equation. This calculation estimates the wing loading and power loading value.
( W P ) T O = T O P 23 × σ × C L max T O ( W S ) T O
where:
T O P = 273 + ( 7.45 × 10 4 ) + ( 67.11 × S T O )
where:
  • ( W P ) T O = Take-off power loading (lb/hp)
  • ( W S ) T O = Take-off wing loading (lb/ft2)
  • T O P 23 = Take-off parameter
  • σ = the ratio of the density of air at the take-off altitude to the density of air at sea level
  • C L max T O = Take-off lift coefficient
  • STO = Take-off distance (ft)
8.
Climb performance:
After a successful transition flight mode between the VTOL and fixed-wing, the aircraft continues the mission to climb until the cruise and loiter altitude. The equation below shows the fixed-wing climb performance calculation.
( W P ) C L = F c l i m b 19 × η p × [ 27 256 × c D 0 T O u p × ( 1 π × A R × e T O ) 3 ] 1 4 ( W S ) C L + [ 19 R C 33 , 000 × ( 27 256 × c D 0 T O u p × ( 1 π × A R × e T O ) 3 ) 1 4 ]
where:
  • ( W P ) C L = Climb power loading (lb/hp)
  • ( W S ) C L = Climb wing loading (lb/ft2)
  • Fclimb = Thrust used for climb (%)
  • RC = rate of climb (ft/min)
  • CD0TOup = zero lift drag coefficient of the airplane drag polar at take-off with fixed gear
  • AR = wing aspect ratio
  • e T O = Take-off Oswald’s efficiency factor
9.
Cruise performance:
A VTOL-Plane has the advantage of covering the weaknesses of a rotary-wing cruise range. A VTOL-Plane can cruise with fixed-wing configurations. Therefore, a VTOL-Plane has a long cruise range. In addition, the index power used in this research refers to a fixed-gear configuration.
( W P ) C R = ( W S ) C R F c r σ × I p o w e r 3
where:
  • ( W P ) C R = Cruise power loading (lb/hp)
  • ( W S ) C R = Cruise wing loading (lb/ft2)
  • Fcr = Thrust used for cruise (%)
  • Ipower3 = index power, power coefficient needed according to landing gear configurations
10.
Landing performance (fixed-wing to VTOL transition)
Even so, for the VTOL-transition, this study calculated the fixed-wing to VTOL transition performance using the conventional landing performance equation and the fixed-wing landing performance equation used to find the wing loading parameter.
( W S ) L = 1.689 2 × 1.15 × ρ × C L max L × V A 2 × W T O W L
where:
  • ( W S ) L = Landing wing loading (lb/ft2)
  • W L = Landing weight (lb)
  • C L max L = Landing lift coefficient
  • V A = Landing velocity (ft/s)
Calculations using the above equation yield a sizing performance curve that can determine wing loading (W/S) and power loading (W/P). The analysis using the above equations can also estimate the aircraft weight and the weight of the required fuel. The performance curve is depicted in Figure 2. The performance curve was the reference used to pick the design point resulting in the wing loading and power loading values. The grey color delineates the eliminated area used to pick the design point. The design point was picked by considering the optimum wing area and power needed. The estimated data during the preliminary design stage are summarized in Table 3.

2.4. Detailed Design

The next step was to design the wing, empennage, fuselage, and VTOL arm sizes based on the calculations that were obtained at the preliminary design stage. Furthermore, the 3D design was created solely for the CFD simulation. The technical drawings for manufacturing purposes are not discussed in this research.

2.4.1. Wing Detailed Design

The equations used to design the wing are quoted from [14].
s = W T O ( W S )
A R = b 2 s
C r = 2 1 + λ × s b
C t = λ × C r
where:
  • s = Wing area (m2)
  • b = Wing span (m)
  • Ct = Tip chord (m)
  • Cr = Root chord (m)
There are several essential parameters in wing design, such as aspect ratio (AR), taper ratio (λ), sweep angle ( Λ ), and wing incidence (iw). Giving a sweep angle on the wing is ineffective because the aircraft has a low speed. According to [16], giving a sweep angle to an aircraft with a speed below Mach 0.3 does not have a significant effect. The sweep angle does reduce drag, but the complexity of the manufacturing is not commensurate with the impact. In addition, this research predetermined the wingspan (3 m) in the DRO stage, so this mad the calculation easier. This study designed a wing with a smaller tip chord length than the root chord to improve lateral control and stability [16]. Several calculations were taken to consider the best value of the taper ratio and to provide a good wing planform. Table 4 shows the results of the wing design calculations using Equations (16)–(19).
Based on Table 3, the required coefficient of lift (CL) was 1.4. In this design, the selected airfoil was NACA 4412. From [28], NACA 4412 was used because it had a CL of 1.6 to prevent interference between the wing and the fuselage. In addition, the wing was designed to have no wing incidence because the NACA 4412 had a zero lift when the Angle of Attack (AoA) was −4°. In addition, the wing was given a twist angle of −4° to reduce the stall effect at the wingtip. Due to the relatively large size of the chord tip, the wings were additionally given basic winglets to lessen the vortex. Figure 3 shows the wing planform.

2.4.2. Detailed Design of the Empennage

Before calculating the empennage geometry design, the position of the VTOL motors must be defined. Moreover, the position of the VTOL motors against the CoG can affect the stability of the VTOL-Plane. The angle range should be between 30° and 60°. The VTOL motors are mounted on the VTOL arm. The position of the VTOL motor is depicted schematically in Figure 4.
The tail geometry can be developed after the VTOL arm/boom position is known. The equation used to design the empennage is given by [15].
V V = l V S V S × b
V h = l h S h S × c
S V - t a i l = S V + S h
where:
  • Vv = Vertical tail volume coefficient
  • Vh = Horizontal tail volume coefficient
  • Lv = Distance of 25% wing MAC to 25% vertical empennage MAC (m)
  • Lh = Distance of 25% wing MAC to 25% horizontal empennage MAC (m)
  • Sv = Vertical tail area (m2)
  • Sh = Horizontal tail area (m2)
  • SV-tail = V-tail area (m2)
NACA 0006 was used for the empennage airfoil. It has a zero CL at 0° AoA [28]. Table 5 displays the results of the tail geometry calculations, based on the calculations using the above equation.

2.4.3. Fuselage Detailed Design

The fuselage was 1.3 m in length to fulfill all payload dimensions. It had a cylindrical shape with a longitudinal axis that varied in diameter. Table 6 shows the payload placed on the fuselage, and Figure 5 shows the payload’s position on the fuselage.
After calculating all the sizes, the next step was to create a three-dimensional design. The three-dimensional design was created using the Autodesk Inventor 2021 software. The geometry was later used for the CFD simulation by ANSYS 20.1 software (ANSYS Inc., Canonsburg, PA, United States). Figure 6 shows the three-dimensional geometry of the VTOL-Plane.

2.5. CFD Simulation

The next step was to run a CFD simulation on all the VTOL-Plane design variations. The parameters sought from the CFD simulation were the coefficient of lift (CL), the coefficient of drag (CD), the coefficient of moment pitch (CP), the coefficient of moment roll (Cr), the coefficient of moment yaw (Cy), the lift-to-drag ratio (L/D), the stall speed, and the maneuverability. The following steps are used when performing CFD simulations.

2.5.1. Simulation Parameters

To determine the performance of a VTOL-Plane, it is necessary to create a simulation parameter before running a CFD simulation. In this study, the VTOL-Plane was simulated with variations in sideslip angles. The VTOL-Plane displays its characteristics when dealing with headwinds and crosswinds. The sideslip angle variations used were 0°, 15°, and 30°. The AoA also varied from 0° to 21°. The wind speed in the simulation was 23 m/s (cruise speed). The air density used refers to the air density at cruise altitude (300 m above sea level), 1.155 kg/m3 [29].

2.5.2. Simulation Setup

In some instances, the fluid domain used for aircraft CFD simulations only uses half of the plane [30]. It aims to reduce the computational processing time. This fluid domain is only applicable for headwind situations. Crosswind conditions cause the right and left sides of the airplane to be unequal when the wind direction changes to a crosswind; therefore a complete fluid domain is necessary.
The meshing process is completed by determining the global mesh size of 800 mm. For the simulation results to be accurate, additional mesh features were performed, such as body sizing of 160 mm, face sizing of 10 mm, and inflation of the first layer of 0.1 mm. Orthogonal quality and skewness statistics are important to validate the mesh result. The average value of the orthogonal quality in this mesh was 0.78, and the skewness statistic was 0.21. The mesh quality in this study was considered good and acceptable [31]. Figure 7 shows the results of the mesh in this study.
In this study, a turbulent SST k-Omega model was applied. The standard k-Omega model and the k-epsilon model were combined in this model. The standard k-Omega turbulent model has the advantage of stable and accurate calculations in the area near the wall, while the k-epsilon model has the benefits of free streamflow [32]. The simulation was performed under steady-state conditions, which is the general setup of a CFD simulation that uses incompressible fluid and steady-state simulation. The incompressible flow was selected because the simulation’s Mach number was less than 0.36. This study’s convergence criteria were 10−3, and the calculations were completed for 1000 iterations.

3. Results

3.1. Aerodynamic Parameters

As previously explained, several aerodynamic coefficients such as CL, CD, CP, Cr, Cy, L/D, stall speed, and maneuverability were analyzed. The data for several forces obtained, such as lift, drag, pitch moments, roll moments, and yaw moments on the plane, were acquired from the CFD simulation results. The following equations were used to obtain the aerodynamic coefficient value based on [20].
C L = F L 0.5 × ρ × V 2 × A
C D = F D 0.5 × ρ × V 2 × A
C P = M P 0.5 × ρ × V 2 × A × C
C r = M r 0.5 × ρ × V 2 × A × C
C y = M y 0.5 × ρ × V 2 × A × C
L / D = C L C D
where:
  • CL = Coefficient of lift
  • CD = Coefficient of drag
  • CP = Coefficient of pitch
  • Cr = Coefficient of roll
  • Cy = Coefficient of yaw
  • FL = Lift force (N)
  • FD = Drag force (N)
  • MP = Pitch moment (Nm)
  • Mr = Roll moment (Nm)
  • My = Yaw moment (Nm)
  • V = Aircraft velocity (m/s)
  • A = Cross-sectional area (m2)
  • C = Mean aerodynamic chord (m)
Reference [33] describes the resultant force which can be parsed to determine the maneuverability. Equations (29)–(31) were used to calculate the turning radius of the plane. Good maneuverability occurs when the aircraft can have a small turning radius without stalling. Figure 8 shows the free body diagram of the aircraft.
F = m × a
F L × sin θ = m × v 2 r
F L × cos θ m × g
where:
  • m = Mass (kg)
  • a = Acceleration (m/s2)
  • r = Turn radius (m)
  • g = Gravity (m/s2)

3.2. Lift, Drag, and Stall Phenomena

Before analyzing the aerodynamic coefficients further, several aerodynamic phenomena can be predicted from the CFD simulation results. The pressure contour and streamline can depict the lift, drag, and stall phenomena. According to the pressure contour, if the pressure at the bottom of the plane is greater than the pressure at the top, the aircraft has a lift. As is well known, the greater the angle of attack, the more the lift produced, but the greater the drag force developed. Because the propulsion system has to work harder against the drag force as the drag force increases, the VTOL-Plane becomes inefficient.
Furthermore, a larger AoA might produce flow separation on the wing, resulting in stalling. The stall phenomenon can be approximated when comparing the VTOL-Plane streamline between a low and high AoA. Figure 9 shows the pressure contour and streamline of the VTOL-Plane U-shaped boom from the CFD simulation results under headwind conditions. Figure 9a shows the lifting phenomenon, where the bottom of the VTOL-Plane has a bigger pressure than the top of the VTOL-Plane. The greater AoA makes the VTOL-Planes have a bigger drag. It is represented as the different pressure contour between AoA 0° and AoA 12°, which explains the drag phenomenon. Figure 9b shows the streamline comparison at AoA 0° and AoA 21°. The different airflow between AoA 0° (steady flow) and AoA 21° (separation flow) affects the performance of the aircraft. The flow separation on the VTOL-Plane causes a loss of lift. This phenomenon is also known as the stall phenomenon. Several data from the CFD simulation were calculated to find the stall phenomena more accurately presented as the critical angle.

3.3. Lift, Critical Angle, Efficiency, and Stall Performance

This study analyzed the performance of the lifting force, flight efficiency, and stall speed for each empennage configuration. The CL used Equation (23) to represent the lift performance. In addition, the critical angle of each variation of the VTOL-Plane design from the CL was also obtained. The critical angle shows the stall phenomena, which occurs when the lift coefficient reaches a peak value and drops off as the angle of attack increases [17]. Figure 10 shows a graph of the CL vs. AoA under headwind conditions.
Figure 10 depicts the crucial angle and CL parameters of each empennage design. A VTOL-Plane with an inverted V-tail boom empennage configuration had the lowest critical angle, which was 12°. In contrast, the VTOL-Plane with an inverted U-shaped boom empennage configuration had the highest critical angle at 18°. The critical angle for the other empennage design was 15°.
The average critical angle of the VTOL-Plane was at AoA 15° from the headwind condition. In this study, AoA 0° to AoA 15° were simulated under crosswind conditions. These conditions resulted in less lift generated than the headwind conditions at the same angle of attack. Furthermore, the AoA parameter limitation in this CFD simulation lessened the computational burden. Figure 11 shows the coefficient of lift under crosswind conditions.
Figure 11 demonstrates that the CL value did not differ significantly under crosswind conditions. However, in some situations, the VTOL-Plane with a U-shaped boom empennage configuration had a good CL compared to other states. Figure 11a shows a VTOL-Plane with a U-shaped boom empennage configuration with a higher CL at 0° AoA and 15° AoA, and in Figure 11b, the aircraft had a higher CL at AoA 10° than the other design variations. The Inverted V-tail boom empennage configuration had a good CL value at a 60° sideslip angle. Because there was no discernible difference in the CL values, a VTOL-Plane with a U-shaped boom empennage design can be considered to have a good lift performance during a crosswind.
An analysis of the drag force on the VTOL-Plane was required. The more drag an airplane generates, the less efficient it is. The lower efficiency affects the fuel consumption of the aircraft. The data obtained from the CFD simulation was calculated using Equation (24) to obtain the CD value. After that, the L/D value was calculated using Equation (28). The higher the L/D value, the more efficient the aircraft. Figure 12 shows the L/D ratio of the VTOL-Plane design variation.
From Figure 12a, the VTOL-Plane with a U-shaped boom tail configuration had a good efficiency in headwind conditions at every angle of attack. According to the previous section, the value of the CL does not differ significantly unless the critical angle is approached. The U-shaped boom configuration had a bigger L/D value than the other configurations due to the small CD value.
In the crosswind conditions depicted in Figure 12b,c the VTOL-Plane with an inverted U-shaped boom empennage configuration had a poor efficiency at a low AoA (0–5°) compared to the other configurations. When the AoA was above 5°, this empennage configuration had an L/D value close to the other tail configurations.
Meanwhile, the VTOL-Plane with an inverted V-tail boom and semi-inverted V-tail boom empennage configurations had a good efficiency when the AoA was below 5°. Still, its efficiency was not as good as the other empennage configurations when the AoA was more than 5°. Overall, the VTOL-Plane with a U-shaped boom configuration had a relatively good efficiency at a low and high angle of attack.
The next performance that needed to be analyzed was stall speed. The stall speed refers to the VTOL-Planes transitioning from the rotary-wing to fixed-wing mode. Additionally, the operator can utilize this data to adjust the stall speed of the flight controller during flight tests. Using Equation (23), where the value of the lift force in the equation is replaced by the value of the weight of the aircraft (137 N), the stall speed value was obtained. Figure 13 shows the stall speed vs. AoA graphs.
In the headwind conditions shown in Figure 13a, all variations of the VTOL-Plane design had a stall speed approaching DRO at an angle of attack of 12°. In addition, the stall speed in each design variation did not have a significant difference. As a result, all design variations for the stall speed parameter were deemed to have the same performance.
From the data presented in Figure 13b, when the sideslip angle was 15°, the VTOL-Plane stall speed was already at 13 m/s at 15° AoA. The increased sideslip angle caused the decrease in CL. However, the higher the sideslip angle, the higher the stall speed. Based on Equation (23), as the CL value drops, the stall speed rises. Figure 13c shows that every empennage geometry had the same trend from Figure 13b, but it had a different stall speed value according to the decrease in the CL value. Overall, the U-shaped boom tail design had a lower stall speed at a low angle of attack.

3.4. Stability Performance

There are three types of stability in an aircraft: longitudinal, lateral, and directional stability. The CP in this study represented longitudinal stability. Furthermore, this study also analyzed the lateral and directional stability caused by the crosswind. The Cr and Cy values were analyzed to find the lateral and directional stability. Unlike the headwind conditions, the right and left sides of the aircraft have different pressure contours in the crosswind condition. Because of these discrepancies, the plane tends to roll or yaw. Figure 14 shows the pressure contour against changes in the sideslip angle.
The CP value was analyzed to find the longitudinal stability of the aircraft. The moment aerodynamics value on the CoG was used to find out the CP value using Equation (25). Figure 15 shows a graph of the coefficient of moment vs. AoA during crosswind.
Figure 15a shows that the VTOL-Plane with an inverted U-shaped boom empennage configuration had a good longitudinal stability under headwind conditions. At 0° AoA, the aircraft had a CP value close to 0, so the VTOL-Plane will not tend to pitch up or down while cruising [17], then the aircraft can reach longitudinal stability. The worst longitudinal stability was found in the VTOL-Plane with inverted V-tail boom and semi-inverted V-tail boom configurations. The graph shows that a positive CP value between 0° and 9° AoA caused the airplane to pitch up, necessitating an elevator to maintain longitudinal stability.
Compared to other design modifications, the VTOL-Plane with an inverted U-shaped boom empennage arrangement offered good longitudinal stability in crosswind conditions, as shown in Figure 15b,c. According to the previous explanation, aircraft have a lower lift force under crosswind conditions than in headwind conditions. Aircraft will gain a higher AoA to produce more lift. An inverted U-shaped boom had a zero Cp value when the AoA was more than 0°. While the aircraft cruises in crosswind conditions, the aircraft will reach longitudinal stability. In contrast to other design variations, it had a negative coefficient of moment value, such as the VTOL-Plane with an inverted V-tail boom and U-shaped boom empennage configurations. This can cause the plane to pitch down, requiring the elevator to work hard to generate a counter-moment while cruising.
The aircraft’s stability is affected by the vortex generated by the crosswind. Figure 16 shows the vortex of the VTOL-Plane. Each plane had different vortex characteristics. The wind is deflected downward by trailing vortices, resulting in a downwash. An aircraft’s lift force is reduced as a result of this. From Figure 16, each VTOL-Plane generated a non-identical vortex between the right and left sides of the aircraft. It caused the aircraft to lose lift force, so the aircraft tended to roll and yaw during crosswind. The CFD simulation can calculate the moment related to the crosswind effect. Cr and Cy values were carried out to analyze the lateral and directional stability of the aircraft.
The Cr value influences lateral stability. Equation (26) can find out the Cr value. The smaller the Cr value, the more the aircraft can maintain its position in the crosswind conditions without the occurrence of the roll. Figure 17 presents a graph of Cr vs. AoA.
The graph of the coefficient of the roll moment presented in Figure 17 shows that the VTOL-Plane with an inverted V-tail boom empennage configuration had a minor Cr compared to the other design variations. This means the empennage design could reduce the roll moment caused by the crosswind. Therefore, its lateral stability was better than other design variations. The U-shaped boom empennage configuration had the worst lateral stability because it had a higher Cr value than the other designs.
The ability of an airplane to retain its position on the yaw axis is known as directional stability. This study analyzed the ability of the empennage to reduce the yaw moment caused by crosswind. The difference in pressure contour between the right and left sides of the aircraft during crosswind conditions causes a tendency to yaw. The smaller the Cy value, the better the directional stability in crosswind conditions. Directional stability, as opposed to longitudinal and lateral stability, is easier to control. Equation (27) was used to find the Cy value. Figure 18 shows Cy vs. AoA in crosswind conditions.
Figure 18 shows that the VTOL-Plane aircraft with an inverted V-tail boom empennage configuration had a good directional stability. The low Cy value indicates that the empennage eliminated an excessive yaw moment caused by the crosswind. As a result, the inverted V-tail boom was deemed to have the best directional stability compared to the other design variations. The worst directional stability among the four designs was the VTOL-Plane with a semi-inverted V-tail boom empennage configuration. The value of the Cy that was too large meant that the directional stability was not as good as the other design variations.

3.5. Maneuverability Performance

The ability of an airplane to maneuver is known as maneuverability. When the plane turns, the distribution of lift to the plane is different, adjusting the bank angle of the plane. A large bank angle results in a smaller turn radius and a decrease in the lift forces. In the surveillance mission, maneuverability is not the main priority in the design, so the maximum bank angle analyzed in this study was 40°. Equations (30) and (31) are used determine the turn radius. Figure 19 shows a graph of the turn radius vs. AoA under headwind conditions.
Figure 19 shows that the VTOL-Plane with a U-shaped boom tail configuration delivers excellent maneuverability. The aircraft can turn with a turning radius of 27.9 m at a bank angle of 40° and AoA 15°. In addition, this empennage configuration has a turning radius that tends to be stable against AoA, the same as the VTOL-Plane with an inverted U-shaped boom configuration. The VTOL-Plane with an inverted U-shaped boom configuration at a bank angle of 20° and AoA 3°, on the other hand, does not have a lift, although other design variations have.
This study also showed that the VTOL-Plane with inverted V-tail boom and semi-inverted V-tail boom configurations did not have a good maneuverability. The turning radius increases as the plane approaches the critical angle. When the AoA surpassed the critical angle, the VTOL-Plane with a U-shaped boom tail arrangement and an inverted U-shaped boom maintained the turning radius. As a result, in a headwind, U-shaped and inverted U-shaped boom empennage configurations offered good agility in headwind condition.
Based on the data obtained previously, the decrease in the coefficient of lift and the increase in the crosswind angle caused a reduction in the turning ability of the aircraft. The decline in the turning ability of the aircraft is caused by the aircraft not having lift when the aircraft turns. The CFD simulation results revealed that the aircraft needed a high angle of attack when turning to prevent losing lift in crosswind conditions. Figure 20 shows the maneuverability performance by the aircraft under crosswind conditions.
According to the CFD simulation results, the VTOL-Plane needed a greater than 5° angle of attack to complete the maneuver in crosswind conditions. Its purpose is to protect the plane from stalling. Figure 20 shows that each VTOL-Plane design variation had the smallest turning radius with a bank angle of 40° with AoA 15° in crosswind conditions. The largest radius occurred when the aircraft turned with a bank angle of 10° with an AoA of 10°. The greater the sideslip angle, the greater the turning radius. Overall, the VTOL-Plane with a U-shaped boom tail configuration had the smallest turning radius among other designs, which was 28.7 m.
A steady turn radius against the sideslip angle and maintained altitude are the main criteria to consider the maneuverability in crosswind conditions. Figure 20 shows that the inverted U-shaped boom configuration had a bad maneuverability due to the bigger turn radius in almost every condition and the lack of lift force at a 30° bank angle at 10° AoA. Meanwhile, the other configurations still generated lift in that condition.
Figure 20 indicates that the inverted U-shaped boom empennage configuration was able to maneuver with a smaller turn radius in several crosswind conditions. A higher sideslip angle caused a bigger turn radius for the inverted U-shaped boom than the other configurations. As previously mentioned, maneuverability is not the most crucial factor to consider. However, this information is required to configure the flight parameter in the flight controller.

3.6. Design Optimization

The study aimed to figure out which empennage designs performed best in headwind and crosswind conditions. In general, the inverted U-shaped boom outperformed the other designs in terms of aerodynamics, albeit it only offered advantages in particular situations. In longitudinal stability, this configuration had a zero CP in crosswind conditions at AoA 3°. Meanwhile, an increase in the sideslip angle caused a decrease in the CL value. When the CL value decreases, the aircraft will gain greater AoA to maximize the lift. So, these situations will help the stability of the VTOL-Plane in crosswind conditions while cruising.
The inverted U-shaped boom configuration maintained a short turning radius when it passed the stalling angle in headwind condition. Nevertheless, in crosswind conditions, this configuration had a poor maneuverability. In addition, maneuverability is not an important factor for a surveillance mission. The maneuverability performance data could be used to limit the banking angle of the aircraft into the flight controller.
A surveillance mission’s most crucial parameters are stability and efficiency. The inverted U-shaped boom was stable, but it was less efficient. This mission prioritizes stability over efficiency, according to the safety factor. The efficiency of an aircraft could be improved by reducing its weight. The lighter it is, the less power it takes. Briefly, manufacturing methods impact aircraft efficiency.
In short, an inverted U-shaped boom can be considered suitable for the surveillance mission. This empennage needs an optimization to utilize the aerodynamics performance. In fact, an inverted U-shaped boom is weak in lateral and directional stability according to crosswind conditions. To optimize the design, a ventral fin was added to increase the aerodynamics stability [16].
Figure 21 shows the ventral fin added at the bottom of the vertical stabilizer. The performance was evaluated using a CFD simulation, particularly for lateral and directional stability. According to the simulation results, adding a ventral fin improved lateral stability. On the other hand, directional stability decreased. Figure 22 shows the simulation result regarding lateral and directional stability in crosswind conditions.
Figure 22a depicts the effectiveness of the ventral fin in decreasing the roll coefficient value in relation to crosswind conditions. So, the ventral fin could increase the lateral stability of the aircraft. Unfortunately, adding the ventral fin on the twin tail boom configurations did not improve the directional stability. Figure 22b delineates an increased yaw coefficient value because of crosswind conditions. The directional stability decreased, but directional stability is easier to control than lateral stability.
To improve the lateral stability, the proper control surface and actuator providing counter moment toward aerodynamic moments can overcome this stability [34]. In addition, the aircraft requires a flight test to find a good tuning. It would take a risky flight test if the aircraft design did not meet the stability requirements. A CFD simulation can analyze the stability of the aircraft so that it can select the best design with the best stability. An analysis such as this can decrease the risk of a crash due to the aerodynamic performance during a flight test.

4. Discussion

This research obtained several data about the performance of a VTOL-Plane with different empennage configurations. The inverted U-shaped boom empennage configuration had the highest critical angle at 18°. Meanwhile, the other empennage configurations had an average critical angle of 15°. Moreover, the U-shaped boom configuration had the best flight efficiency, represented by the L/D value in headwind and crosswind conditions. In crosswind conditions, the U-shaped boom empennage configuration had an L/D value that tended to be stable compared to the other design variations with only a specific AoA advantage. Following [24], they also concluded that the U-shaped boom / H-tail configuration had the best efficiency compared to the other empennage configurations.
Stability is essential for every aircraft. In headwind conditions, the inverted U-shaped boom empennage configuration had a better longitudinal stability than the other designs. That empennage configuration has a CP close to 0 when AoA was 0°. When the condition changes to crosswind, the aircraft will gain more AoA due to lose lift force. The inverted U-shaped boom had a zero Cp value when the AoA was more than 0 in crosswind conditions. This means the aircraft tended to consistently maintain the longitudinal stability even when the wind direction changes.
Crosswind conditions generate a non-identical vortex on the aircraft between the right and left side. It has an effect on the lateral and directional stability of the aircraft [18,19,20,21]. The inverted V-tail boom had a good lateral and directional stability. Following [25], they also discovered that the V-tail had an advantage in lateral stability in crosswind conditions.
Unfortunately, maneuverability is not as crucial as efficiency and stability for a surveillance or monitoring mission. Nevertheless, the maneuverability analysis gives data on what flight parameters must be avoided. The U-shaped boom and inverted U-shaped boom configurations had relatively good maneuverability in headwind conditions. When the aircraft passes the critical angle, the aircraft can maintain a short turning radius. Meanwhile, the VTOL-Plane with inverted V-tail boom and semi-inverted V-tail boom configurations could not hold a short turning radius when passing the critical angle.
A VTOL-Plane needs more lift in crosswind conditions by increasing the AoA in several bank angles and slip angles. The greater the sideslip angle, the greater the risk of stalling. As well as the bank angle, the larger banking angle of the VTOL-Plane causes a loss of lift. The simulation results showed that the greater the sideslip angle, the greater the turning radius. The VTOL-Plane with a U-shaped boom empennage configuration had the smallest turning radius of 28.7 m.
In headwind conditions, there was no significant difference in the stall speed between the variations of the VTOL-Plane design. Different from the crosswind conditions, the VTOL-Plane with a U-shaped boom empennage configuration had a lower stall speed than the other configurations.
In short, an inverted U-shaped boom had a suitable aerodynamic performance for a surveillance mission. The inverted U-shaped boom had excellent longitudinal stability and a bigger critical angle than the other configurations. In addition, this empennage configuration also had good maneuverability. Stability is an essential factor for surveillance missions. In fact, this configuration had an infirmity in lateral and directional stability. The ventral fin was added to improve the stability [16]. The simulation results showed that the ventral fin improved the lateral stability but decreased the directional stability. Furthermore, directional stability is easier to control than lateral stability, which is why the aircraft needs proper controls to improve the lateral stability.
This variations in the VTOL-Plane design should be manufactured and tested for data validation in actual conditions. Several parameters such as maximum AoA, bank angle, and stall speed on this research can minimize the risk of a crash.

5. Conclusions

Overall, this study examined empennage configurations in relation to aerodynamic performance. Furthermore, CFD methods were used to simulate all empennage configurations in both headwind and crosswind circumstances. The simulation data were used to analyze the aerodynamic coefficients. In general, the inverted U-shaped boom is ideal for surveillance missions. This configuration has a strong longitudinal stability, a larger critical angle, and is easy to maneuver. A ventral fin was also added to improve lateral and directional stability. As a result, lateral stability improved while directional stability improved. Despite this, directional stability is more manageable than lateral stability. Every aspect of stability could be increased with proper control, such as a control surface and good tuning.

Author Contributions

Conceptualization, G.N., G.Z. and A.A.R.; methodology, G.Z.; software, G.Z.; validation, G.N., G.Z. and A.A.R.; formal analysis, G.Z.; investigation, G.Z.; data curation, G.Z. and A.A.R.; writing—original draft preparation, G.Z.; writing—review and editing, G.N., G.Z. and A.A.R.; visualization, G.Z.; funding acquisition, G.N. All authors have read and agreed to the published version of the manuscript.
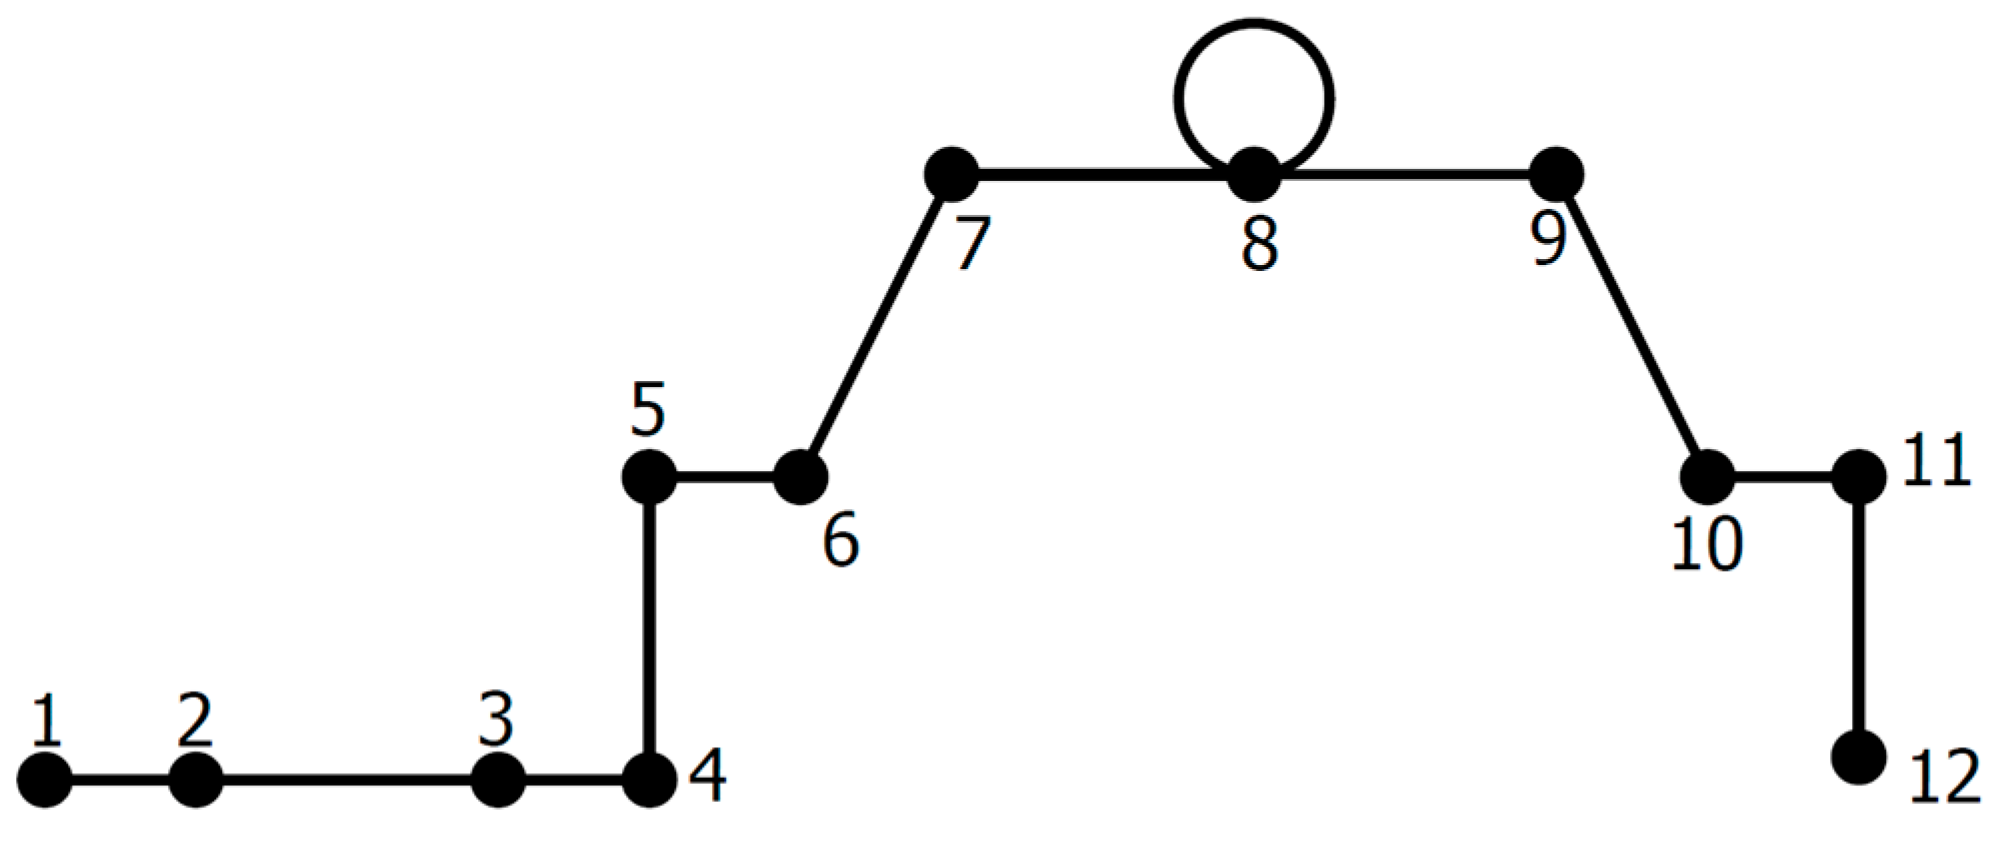
Funding

This research was funded by Lembaga Pengelola Dana Pendidikan (LPDP), grant number: PRJ-102/LPDP/2019.

Institutional Review Board Statement

Not applicable.

Informed Consent Statement

Not applicable.

Data Availability Statement

Not applicable.

Acknowledgments

The authors would like to thank the Department of Mechanical and Industrial Engineering, Faculty of Engineering, Universitas Gadjah Mada and Lembaga Pengelola Dana Pendidikan (LPDP).

Conflicts of Interest

The authors declare no conflict of interest.

References

  1. Banu, T.P.; Borlea, G.F.; Banu, C. The Use of Drone in Forestry. Environ. Sci. Eng. B 2016, 5, 557–562. [Google Scholar]
  2. Miller, C.R. Military Unmanned Aerial Vehicles and Diversification Opportunities; Mississippi Defense Diversification Initiative—Technical Report; United States Department of Defense Office of Economic Adjustment: Arlington, VA, USA, 2018; pp. 4–7. [Google Scholar] [CrossRef]
  3. Jo, D.; Kwon, T. Development of Autonomous VTOL UAV for Wide Area Surveillance. World J. Eng. Technol. 2019, 7, 227–239. [Google Scholar] [CrossRef] [Green Version]
  4. Atkins, E.M.; Mathur, A. Design, modelling and hybrid control of a quadplane. In Proceedings of the AIAA Scitech 2021 Forum, Virtual Event, 11–15 and 19–21 January 2021; p. 0374. [Google Scholar] [CrossRef]
  5. Aktas, Y.O.; Ozdemir, U.; Dereli, Y.; Tarhan, A.F.; Cetin, A.; Vuruskan, A.; Yuksek, B.; Cengiz, H.; Basdemir, S.; Ucar, M.; et al. Rapid Prototyping of a Fixed-Wing VTOL UAV for Design Testing. J. Intell. Robot. Syst. 2016, 84, 639–664. [Google Scholar] [CrossRef]
  6. Tyan, M.; Nguyen, N.V.; Kim, S.; Lee, J.W. Comprehensive Preliminary Sizing/Resizing Method for a Fixed Wing—VTOL Electric UAV. Aerosp. Sci. Technol. 2017, 71, 30–41. [Google Scholar] [CrossRef]
  7. ALTI Ascend. Available online: https://www.ssass.co.za/alti-ascend (accessed on 12 October 2021).
  8. ALTI Transition. Available online: https://www.ssass.co.za/alti-transition (accessed on 12 October 2021).
  9. Gu, H.; Lyu, X.; Li, Z.; Shen, S.; Zhang, F. Development and experimental verification of a hybrid vertical take-off and landing (VTOL) Unamnned Aerial Vehicle (UAV). In Proceedings of the 2017 International Conference on Unmanned Aircraft Systems (ICUAS), Miami, FL, USA, 13–16 June 2017; pp. 160–169. [Google Scholar] [CrossRef]
  10. Out of the Black: SLT VTOL UAV. Available online: https://diydrones.com/profiles/blogs/out-of-the-black-slt-vtol-uav (accessed on 17 March 2022).
  11. Foxtech Great Shark 330 VTOL. Available online: https://www.foxtechfpv.com/foxtech-great-shark-330-vtol.html (accessed on 13 October 2021).
  12. Austin, R. Unmanned Aircraft Systems: UAV Design, Development, and Deployment, 1st ed.; John Wiley & Sons Ltd.: Hoboken, NJ, USA, 2010; pp. 17–20. [Google Scholar]
  13. Roskam, J. Airplane Design Part 1: Preliminary Sizing of Airplanes, 1st ed.; Roskam Aviation and Engineering Corporation: Ottawa, KS, USA, 1985; pp. 89–190. [Google Scholar]
  14. Roskam, J.; Lan, C.T.E. Airplane Aerodynamics and Performance, 1st ed.; DARcorporation: Lawrence, KS, USA, 1997; pp. 95–107. [Google Scholar]
  15. Raymer, D.P. Aircraft Design: A Conceptual Approach, 6th ed.; American Institute of Aeronautics and Astronautics, Inc.: Reston, VA, USA, 2018; pp. 158–161. [Google Scholar]
  16. Sadraey, M.H. Aircraft Design: A Systems Engineering Approach, 1st ed.; John Wiley & Sons Ltd.: Hoboken, NJ, USA, 2013; pp. 203–325. [Google Scholar]
  17. Anderson, J.D. Aircraft Performance and Design, 1st ed.; WCB/McGraw-Hill: New York, NY, USA, 1999; pp. 46–60. [Google Scholar]
  18. Abbas, Y.K. Effect of Sideslip Angle on The Balance of Aircraft Moments Through Steady—State Spin. Int. J. Civ. Eng. Technol. 2017, 8, 627–633. [Google Scholar]
  19. Cho, H.; Han, C. Effect of Sideslip Angle on The Aerodynamic Characteristic of a Following Aircraft in Close Formation Flight. J. Mech. Sci. Technol. 2015, 29, 3691–3698. [Google Scholar] [CrossRef]
  20. Clancy, L.J. Aerodynamics, 1st ed.; Gulab Vazirani for Arnold-Heinemann Publishers: New Delhi, India, 1975; pp. 55–561. [Google Scholar]
  21. Hansen, J.L.; Cobleigh, B.R. Induced moment effect of formation flight using two F/A-18 aircraft. In Proceedings of the American Institute of Aeronautics AIAA Atmospheric Flight Mechanics Conference and Exhibit, Monterey, CA, USA, 5–8 August 2002; pp. 1–18. [Google Scholar]
  22. Gu, X.; Ciampa, P.D.; Nagel, B. An automated CFD analysis workflow in overall aircraft design applications. CEAS Aeronaut. J. 2018, 9, 3–13. [Google Scholar] [CrossRef] [Green Version]
  23. Phillips, D.A.; Soligo, M.J. Will CFD ever Replace Wind Tunnels for Building Wind Simulations. Int. J. High Rise Build. 2019, 8, 107–116. [Google Scholar] [CrossRef]
  24. Das, S.B.; Rajiv, R.; Menon, R.; Deodhar, R. Analysis and Simulation of Different Empennage Configurations for an Aircraft. Adv. Trends Mech. Aerosp. Eng. 2021, 2316, 6–8. [Google Scholar] [CrossRef]
  25. Musa, N.A.; Mansor, S.; Ali, A.; Omar, W.Z.W.; Latif, A.A.; Perumal, K. Effects of Aircraft Tail Configurations on Sensitivity to Yaw Disturbances. Appl. Mech. Mater. 2014, 629, 199–201. [Google Scholar]
  26. Civil Aviation Safety Regulation (CASR) Part 107. Available online: https://terra-drone.co.id/wp-content/uploads/2020/04/CASR-Part-107.pdf (accessed on 8 October 2021).
  27. UAV Sparrow VTOL. Available online: https://www.armour.gr/catalogues/pdf/UAV-SPARROW-VTOL.pdf (accessed on 14 October 2021).
  28. Gudmunsson, S. General Aviation Aircraft Design: Applied Methods and Procedures, 1st ed.; Elsevier Inc.: Waltham, MA, USA, 2014; p. 269. [Google Scholar]
  29. Air-Density and Specific Volume vs. Altitude. Available online: https://www.engineeringtoolbox.com/air-altitude-density-volume-d_195.html (accessed on 16 October 2021).
  30. Wibowo, S.B.; Sutrisno, I.; Rohmat, T.A. Study of Mesh Independence on The Computational Model of The Roll-up Vortex Phenomenon on Fighter and Delta Wing Models. Int. J. Fluid Mech. Res. 2019, 46, 427–439. [Google Scholar] [CrossRef]
  31. Mesh Quality & Advance Topics. Available online: https://featips.com/wp-content/uploads/2021/05/Mesh-Intro_16.0_L07_Mesh_Quality_and_Advanced_Topics.pdf (accessed on 20 October 2021).
  32. ANSYS Inc. ANSYS Fluent User’s Guide; Release 19.2.; ANSYS Inc.: Canonsburg, PA, USA, 2018; pp. 1179–1254. [Google Scholar]
  33. Hibbeler, R.C. Engineering Mechanics Dynamics, 12th ed.; Pearson Prentice Hall: Upper Saddle River, NJ, USA, 2010; pp. 298–302. [Google Scholar]
  34. Etkin, B. Dynamics of Flight Stability and Control, 3rd ed.; John Wiley & Sons Inc.: Hoboken, NJ, USA, 1995; pp. 33–37. [Google Scholar]
Figure 1. Mission Profile VTOL-Plane Surveillance. Note: 1—Ground test; 2—Engine start and warm-up; 3—VTOL take-off preparation; 4—VTOL take-off; 5—VTOL transition to Fixed-wing; 6—Climb; 7—Cruise; 8—Loiter and cruise back; 9—Descent; 10—Fixed-wing transition to VTOL; 11—VTOL landing; 12—Engine shutdown and ground test.
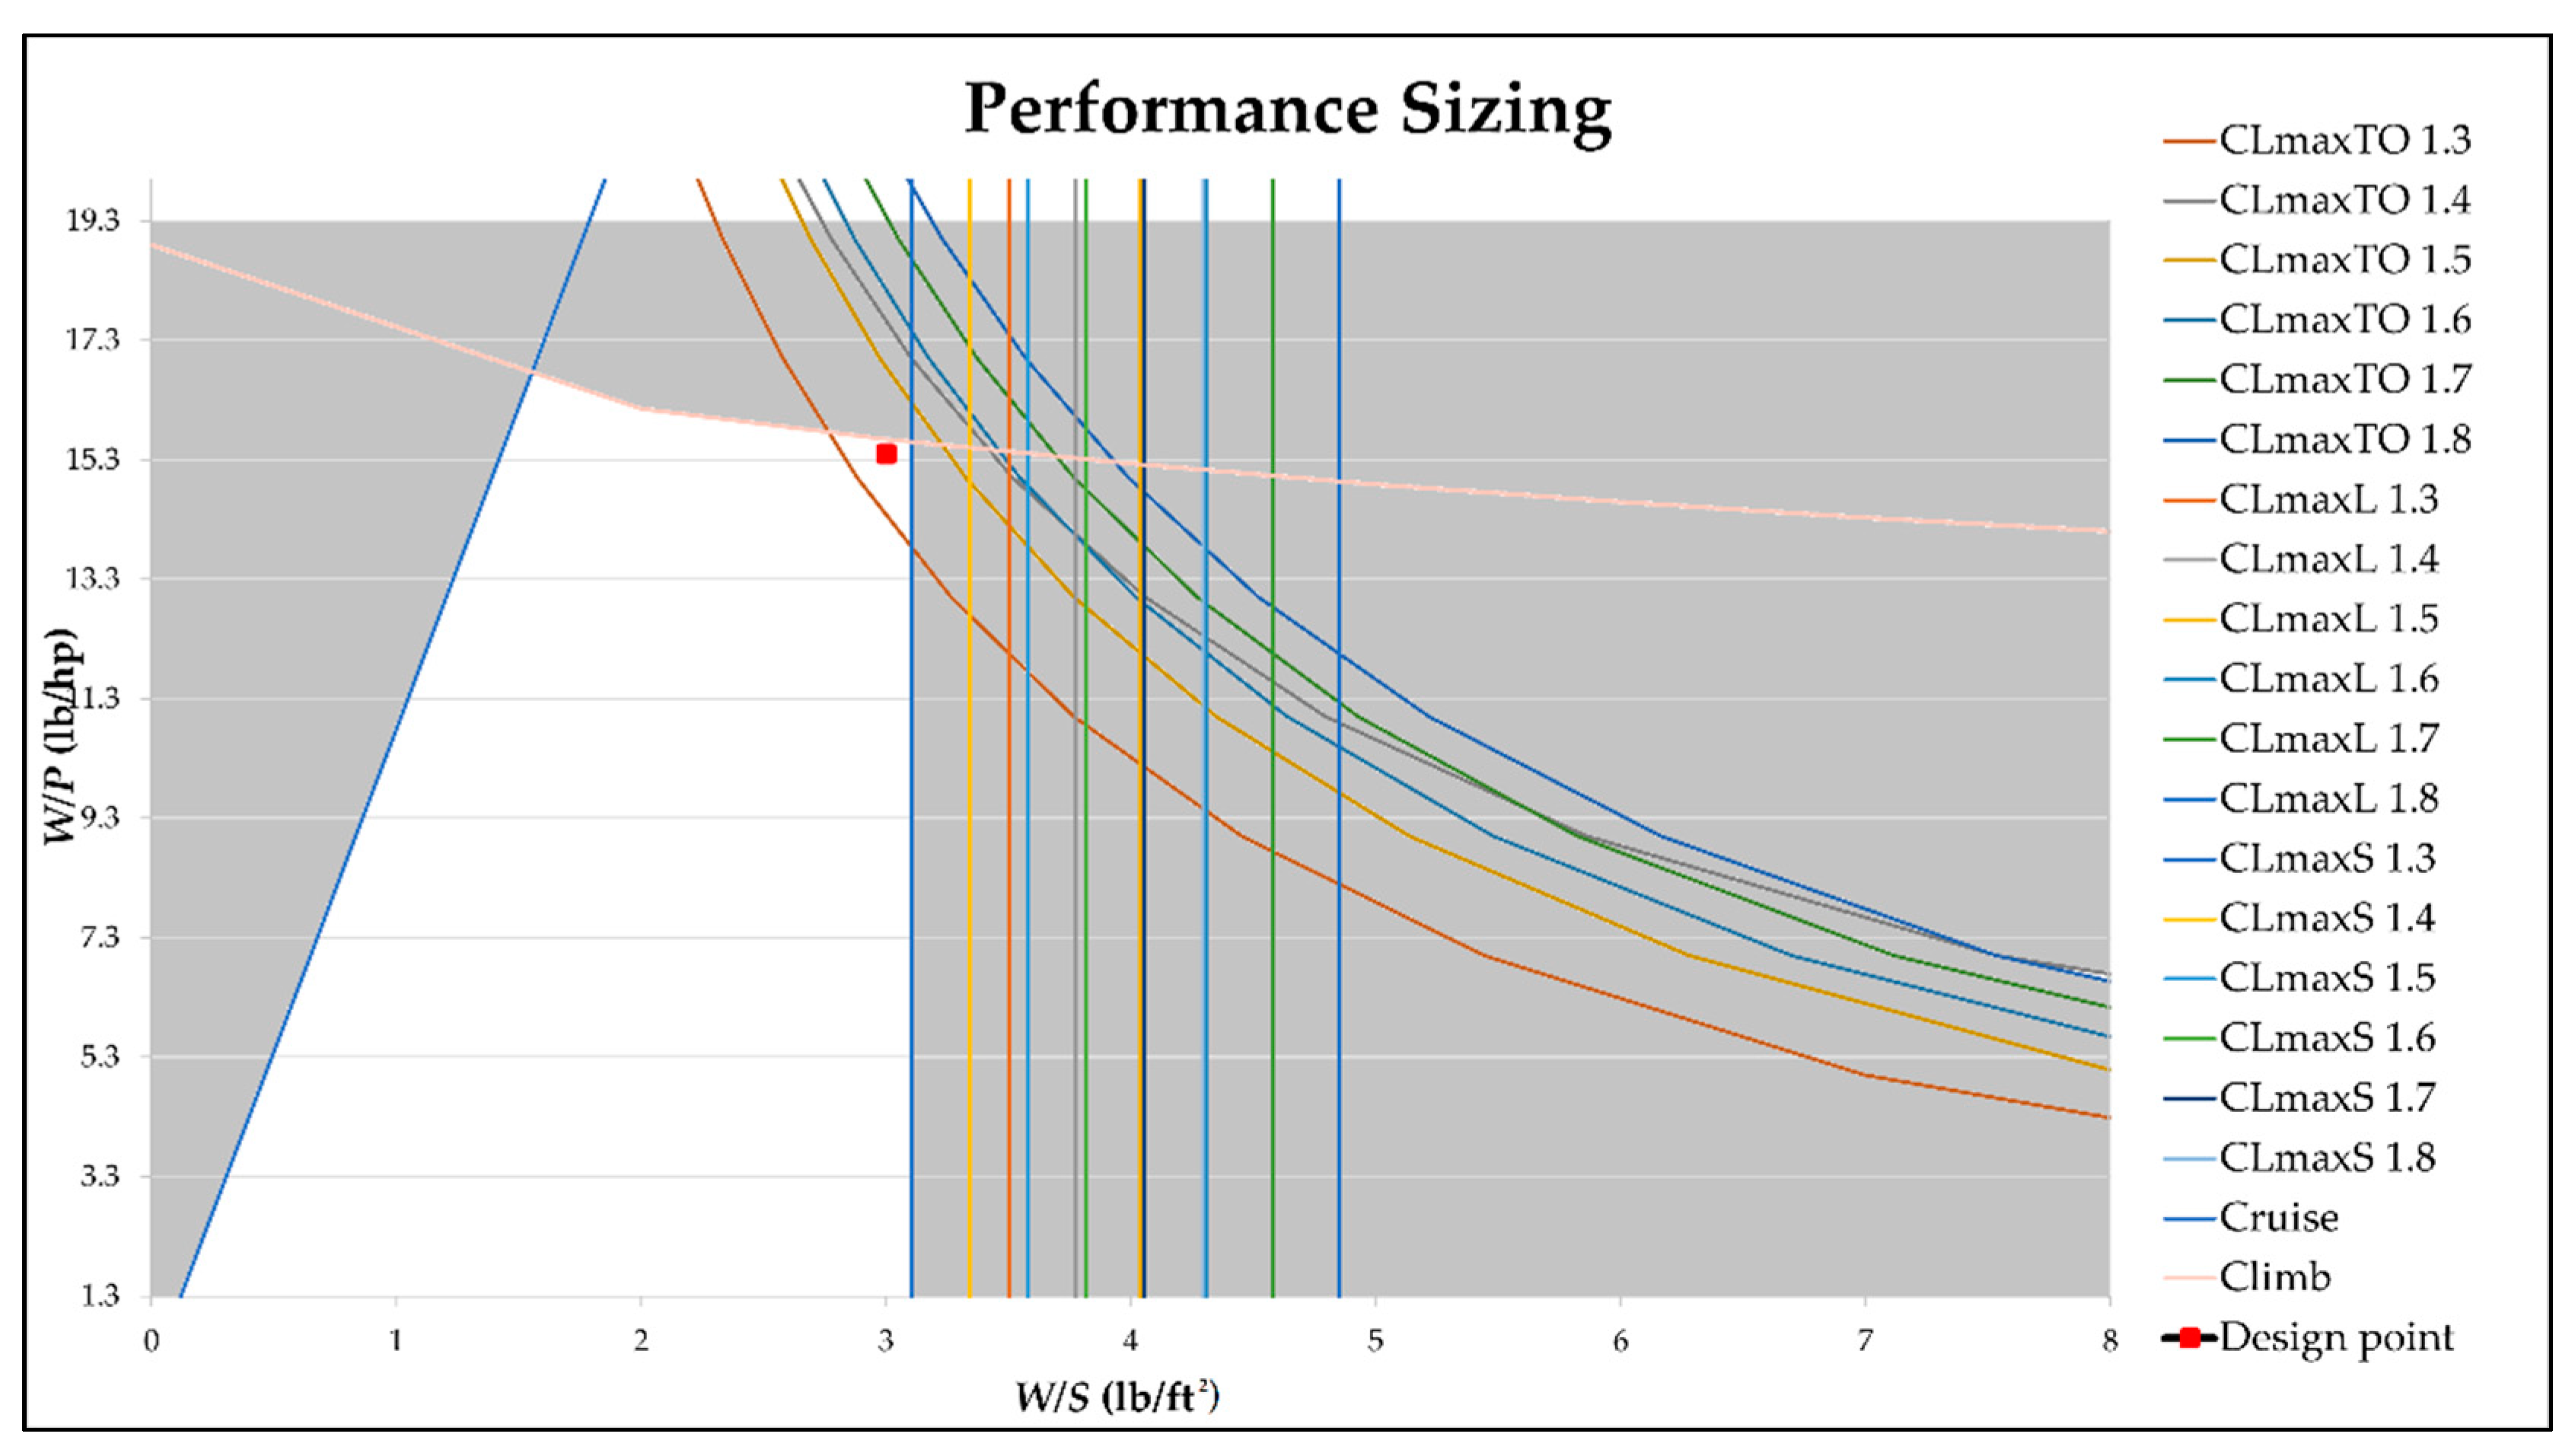
Aerospace 09 00208 g001
Figure 2. Performance sizing chart.
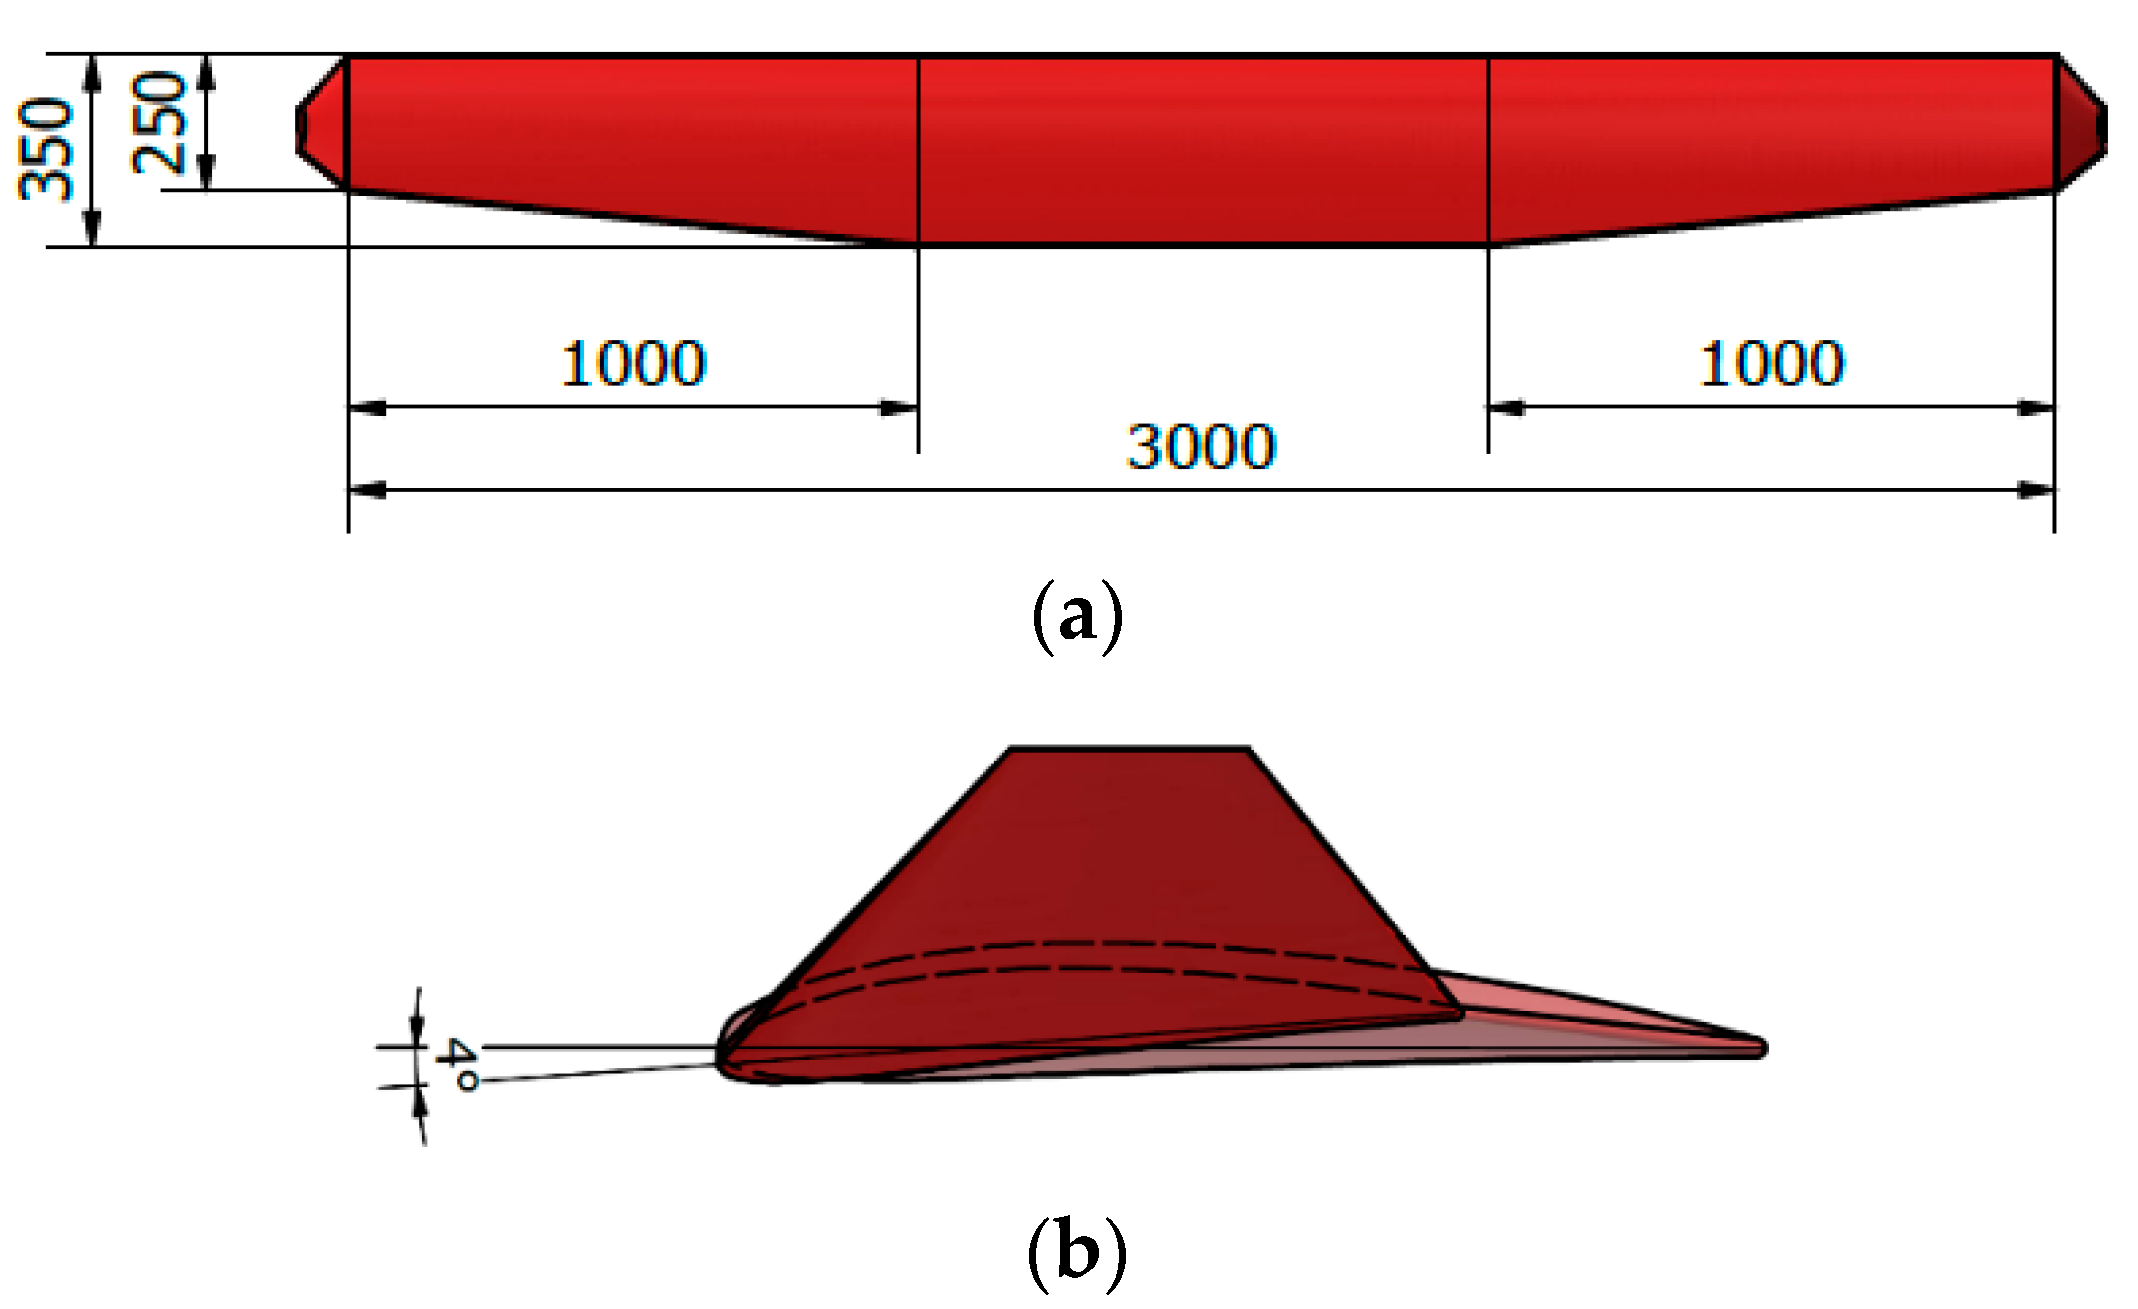
Aerospace 09 00208 g002
Figure 3. Wing design, (a) wing planform and (b) twist angle projection.
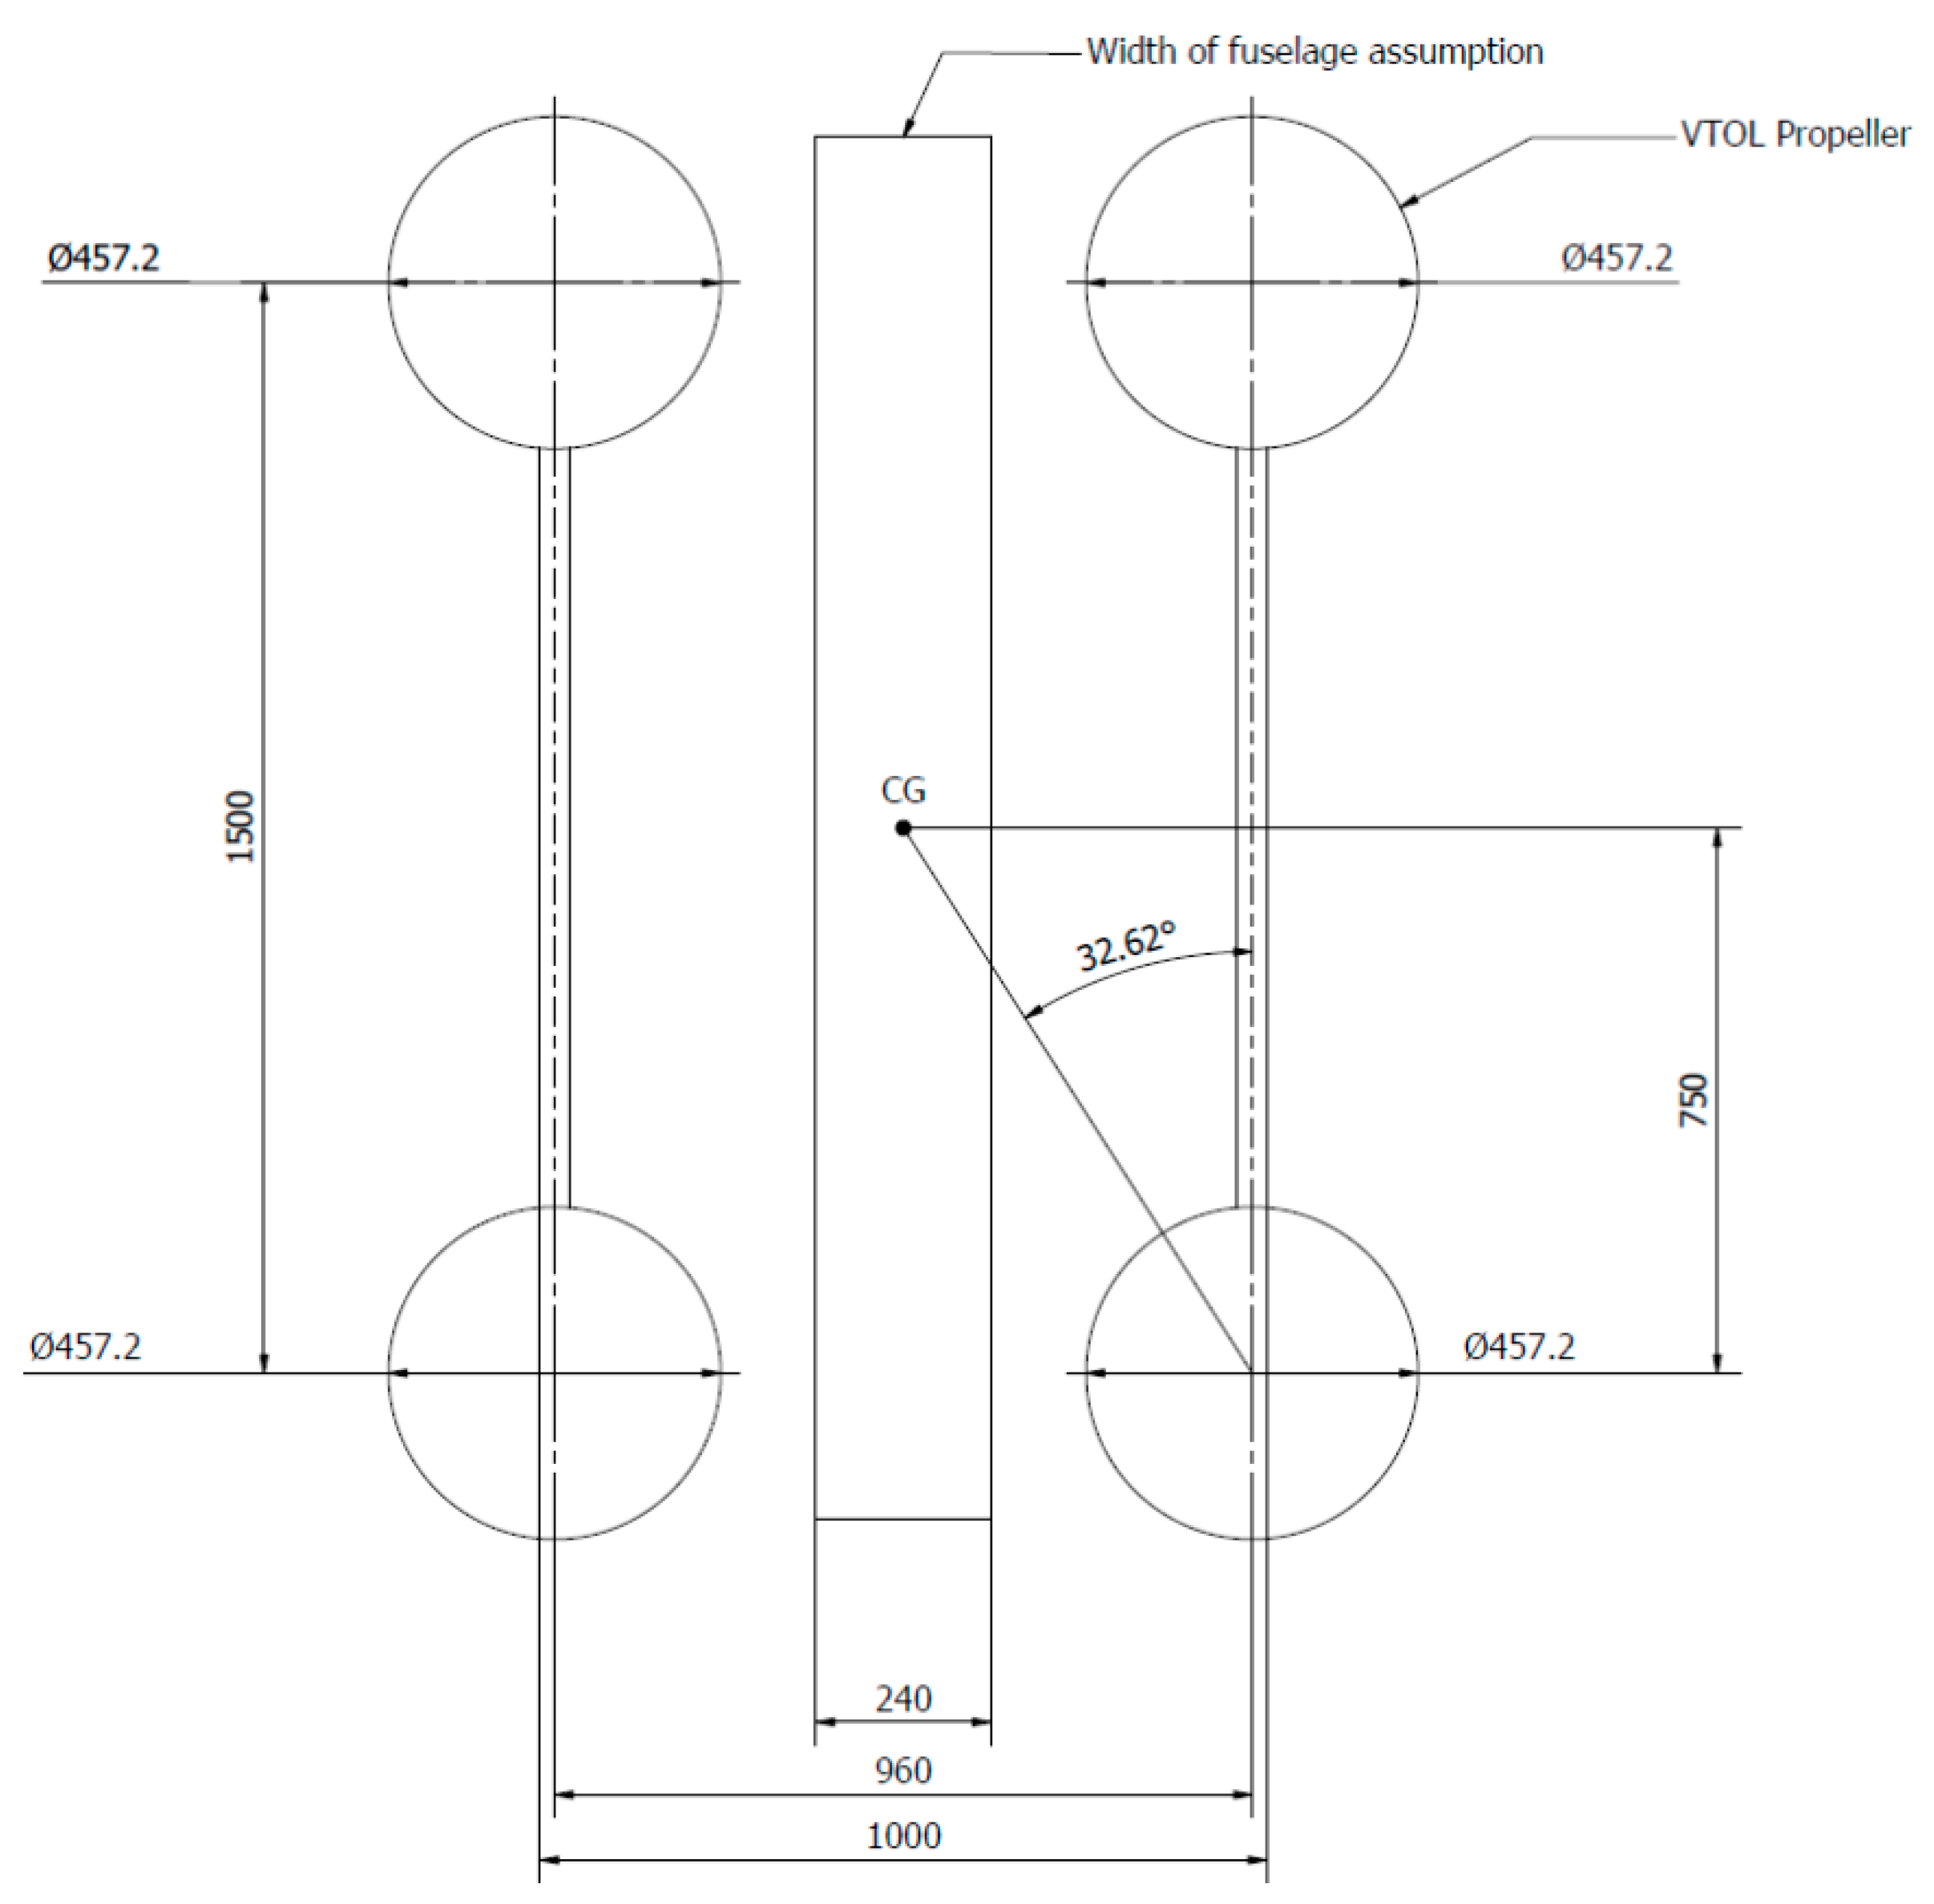
Aerospace 09 00208 g003
Figure 4. Position of the VTOL motors.
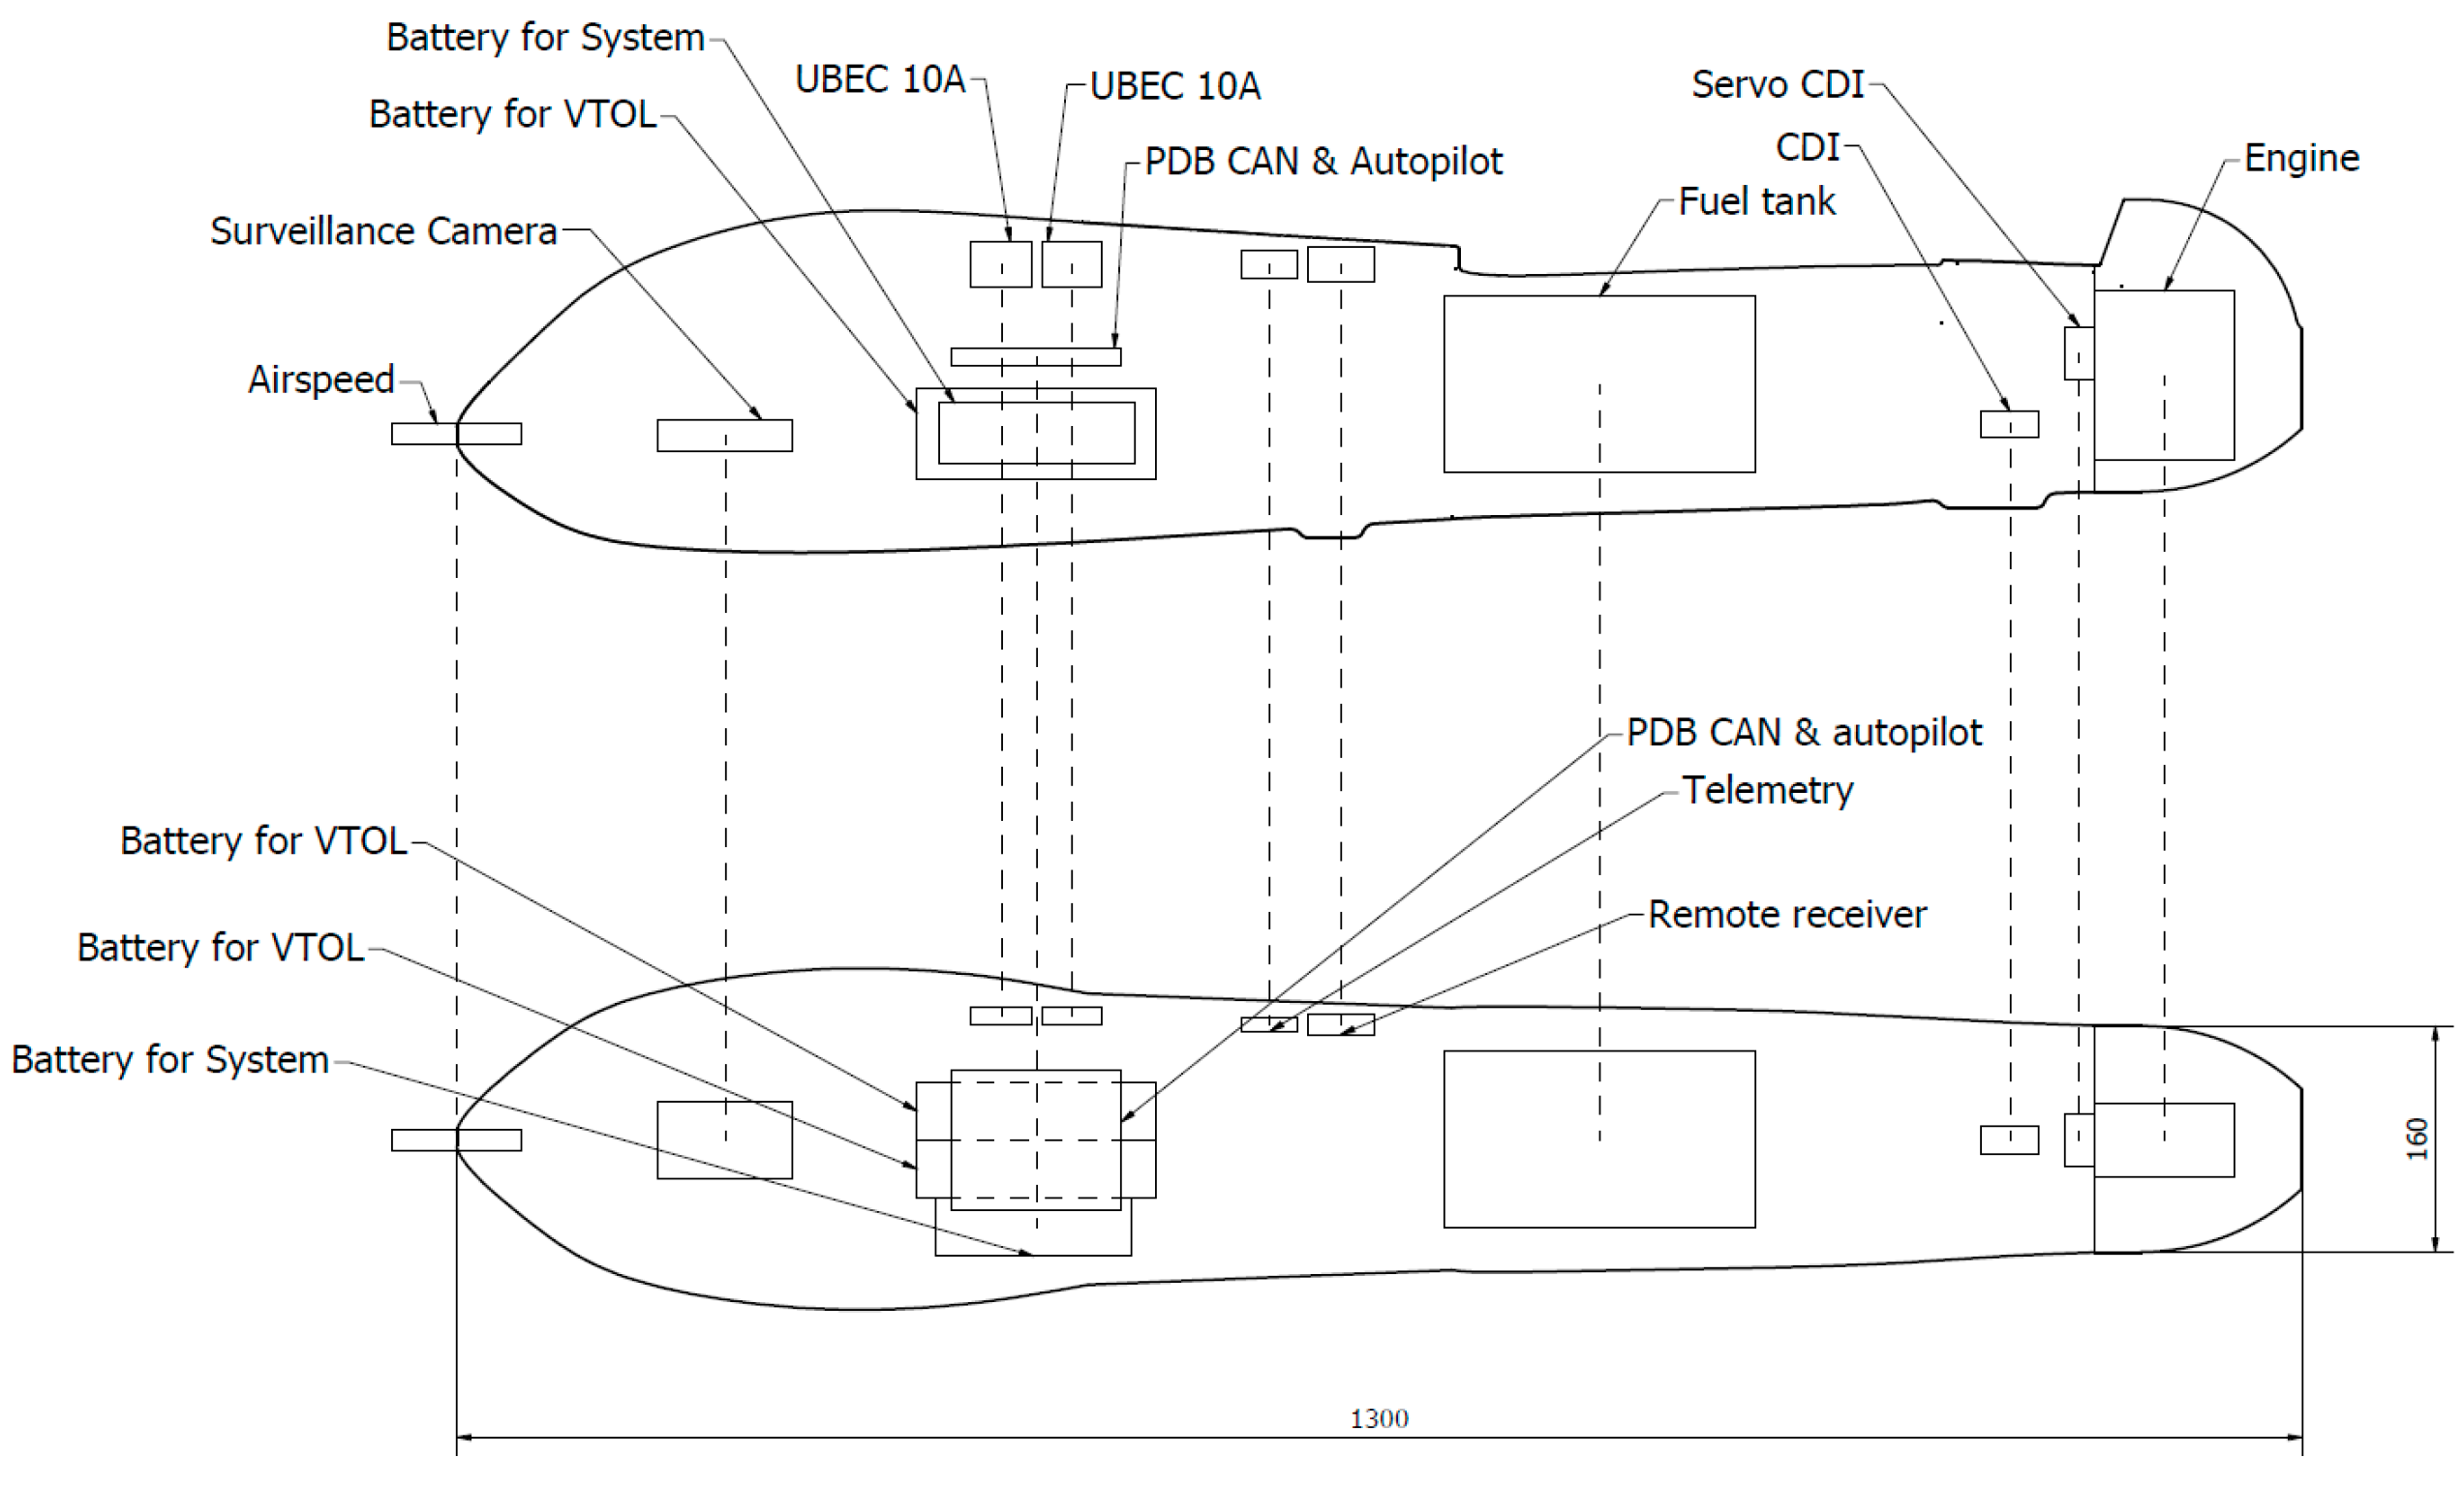
Aerospace 09 00208 g004
Figure 5. Payload position on the fuselage.
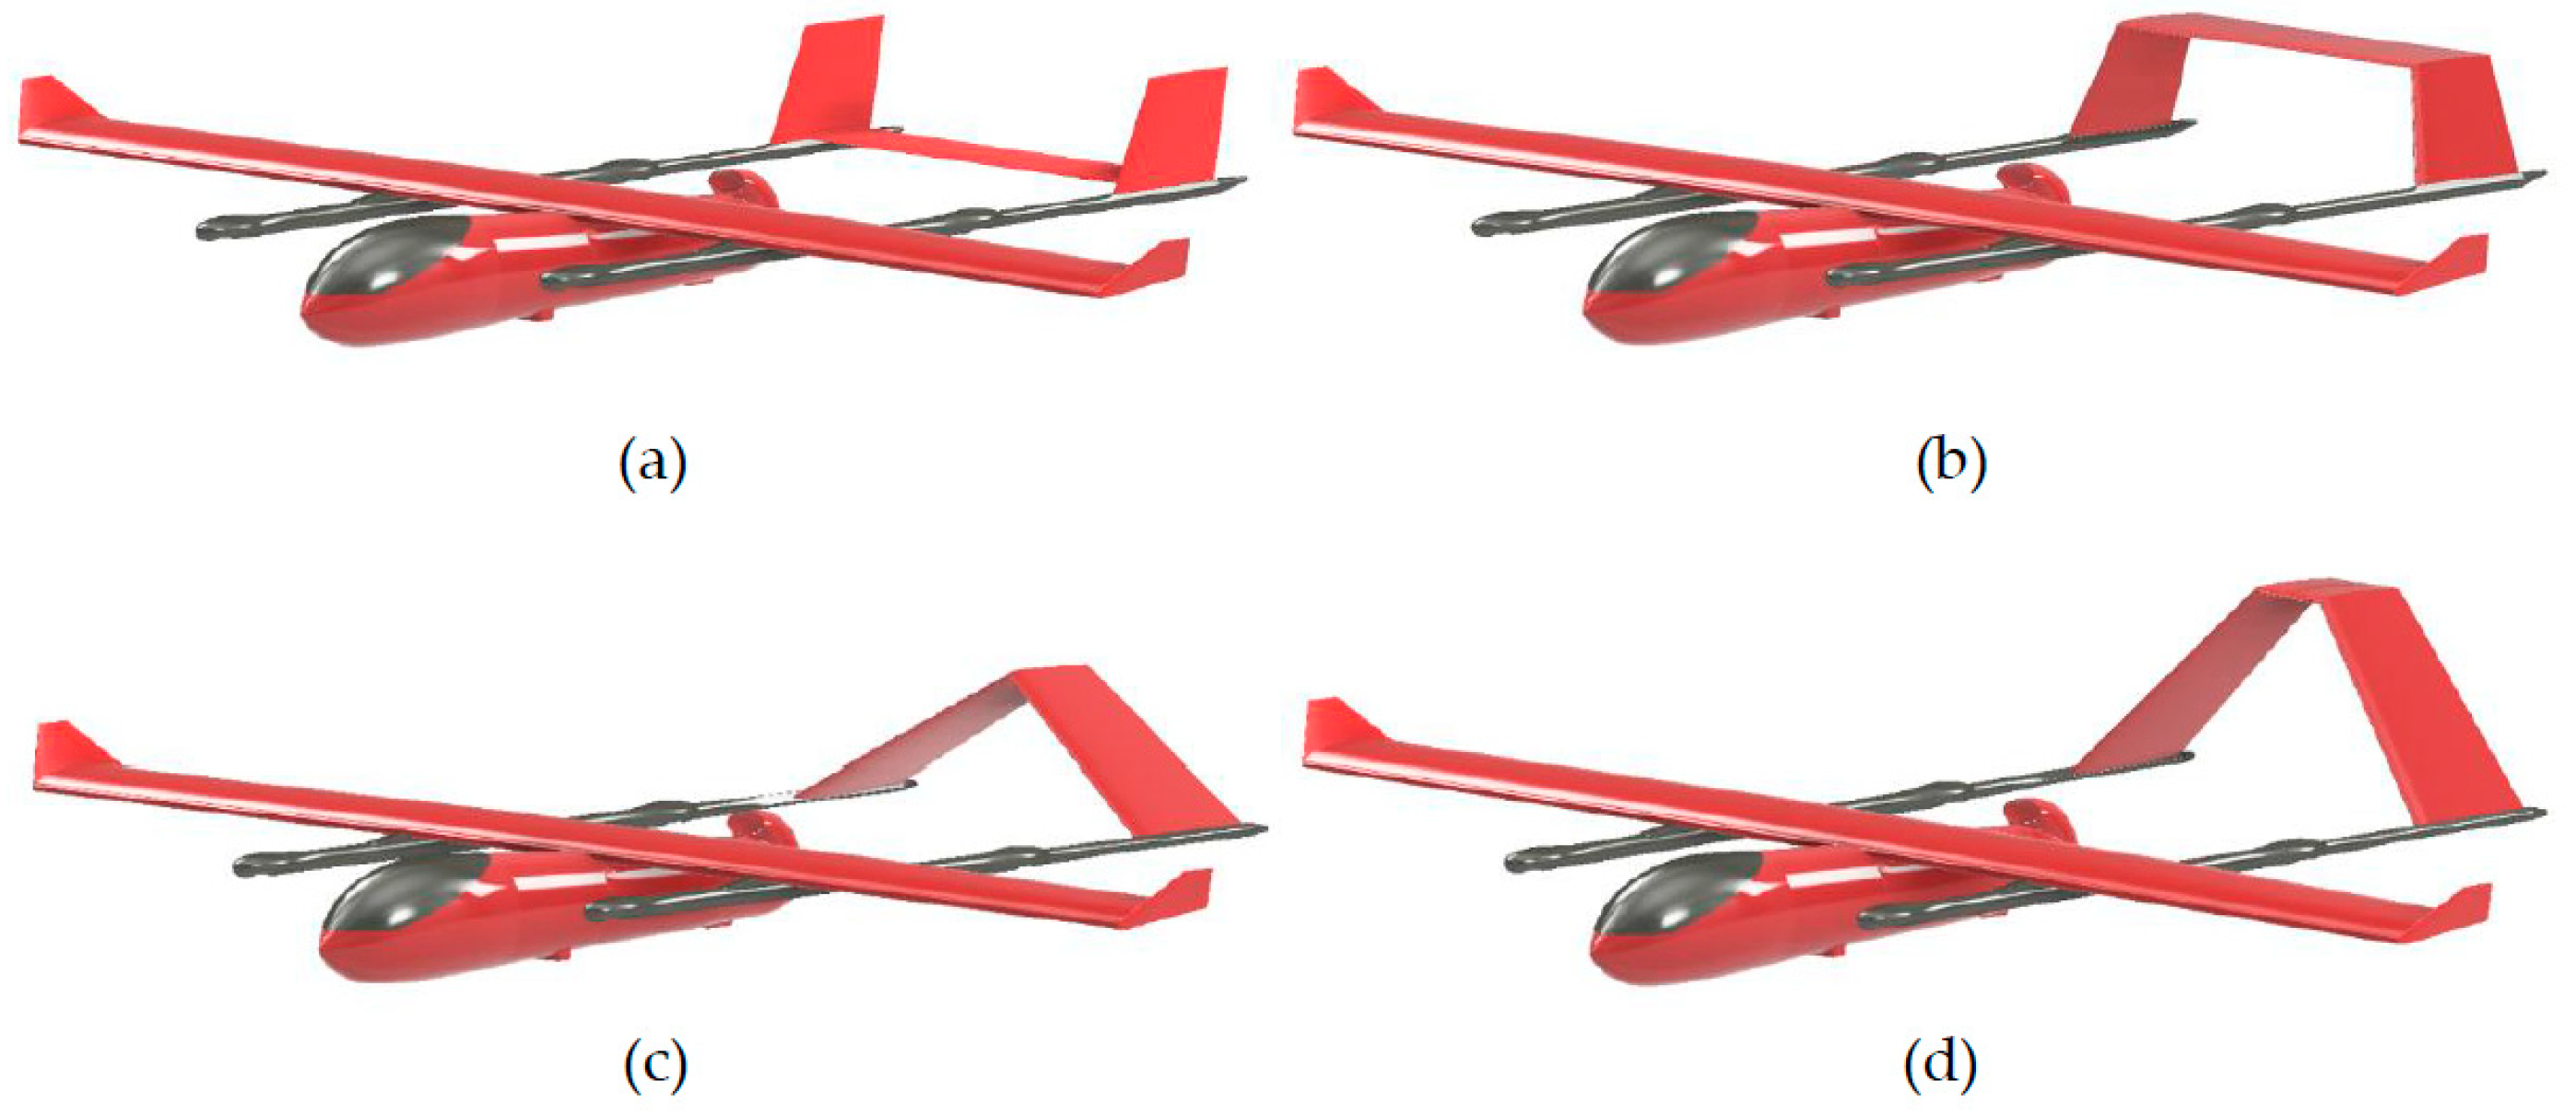
Aerospace 09 00208 g005
Figure 6. Three-dimensional geometry of the VTOL-Plane, with variations in empennage configurations: (a) U-shaped boom, (b) inverted U-shaped boom, (c) inverted V-tail boom, (d) semi-inverted V-tail boom.
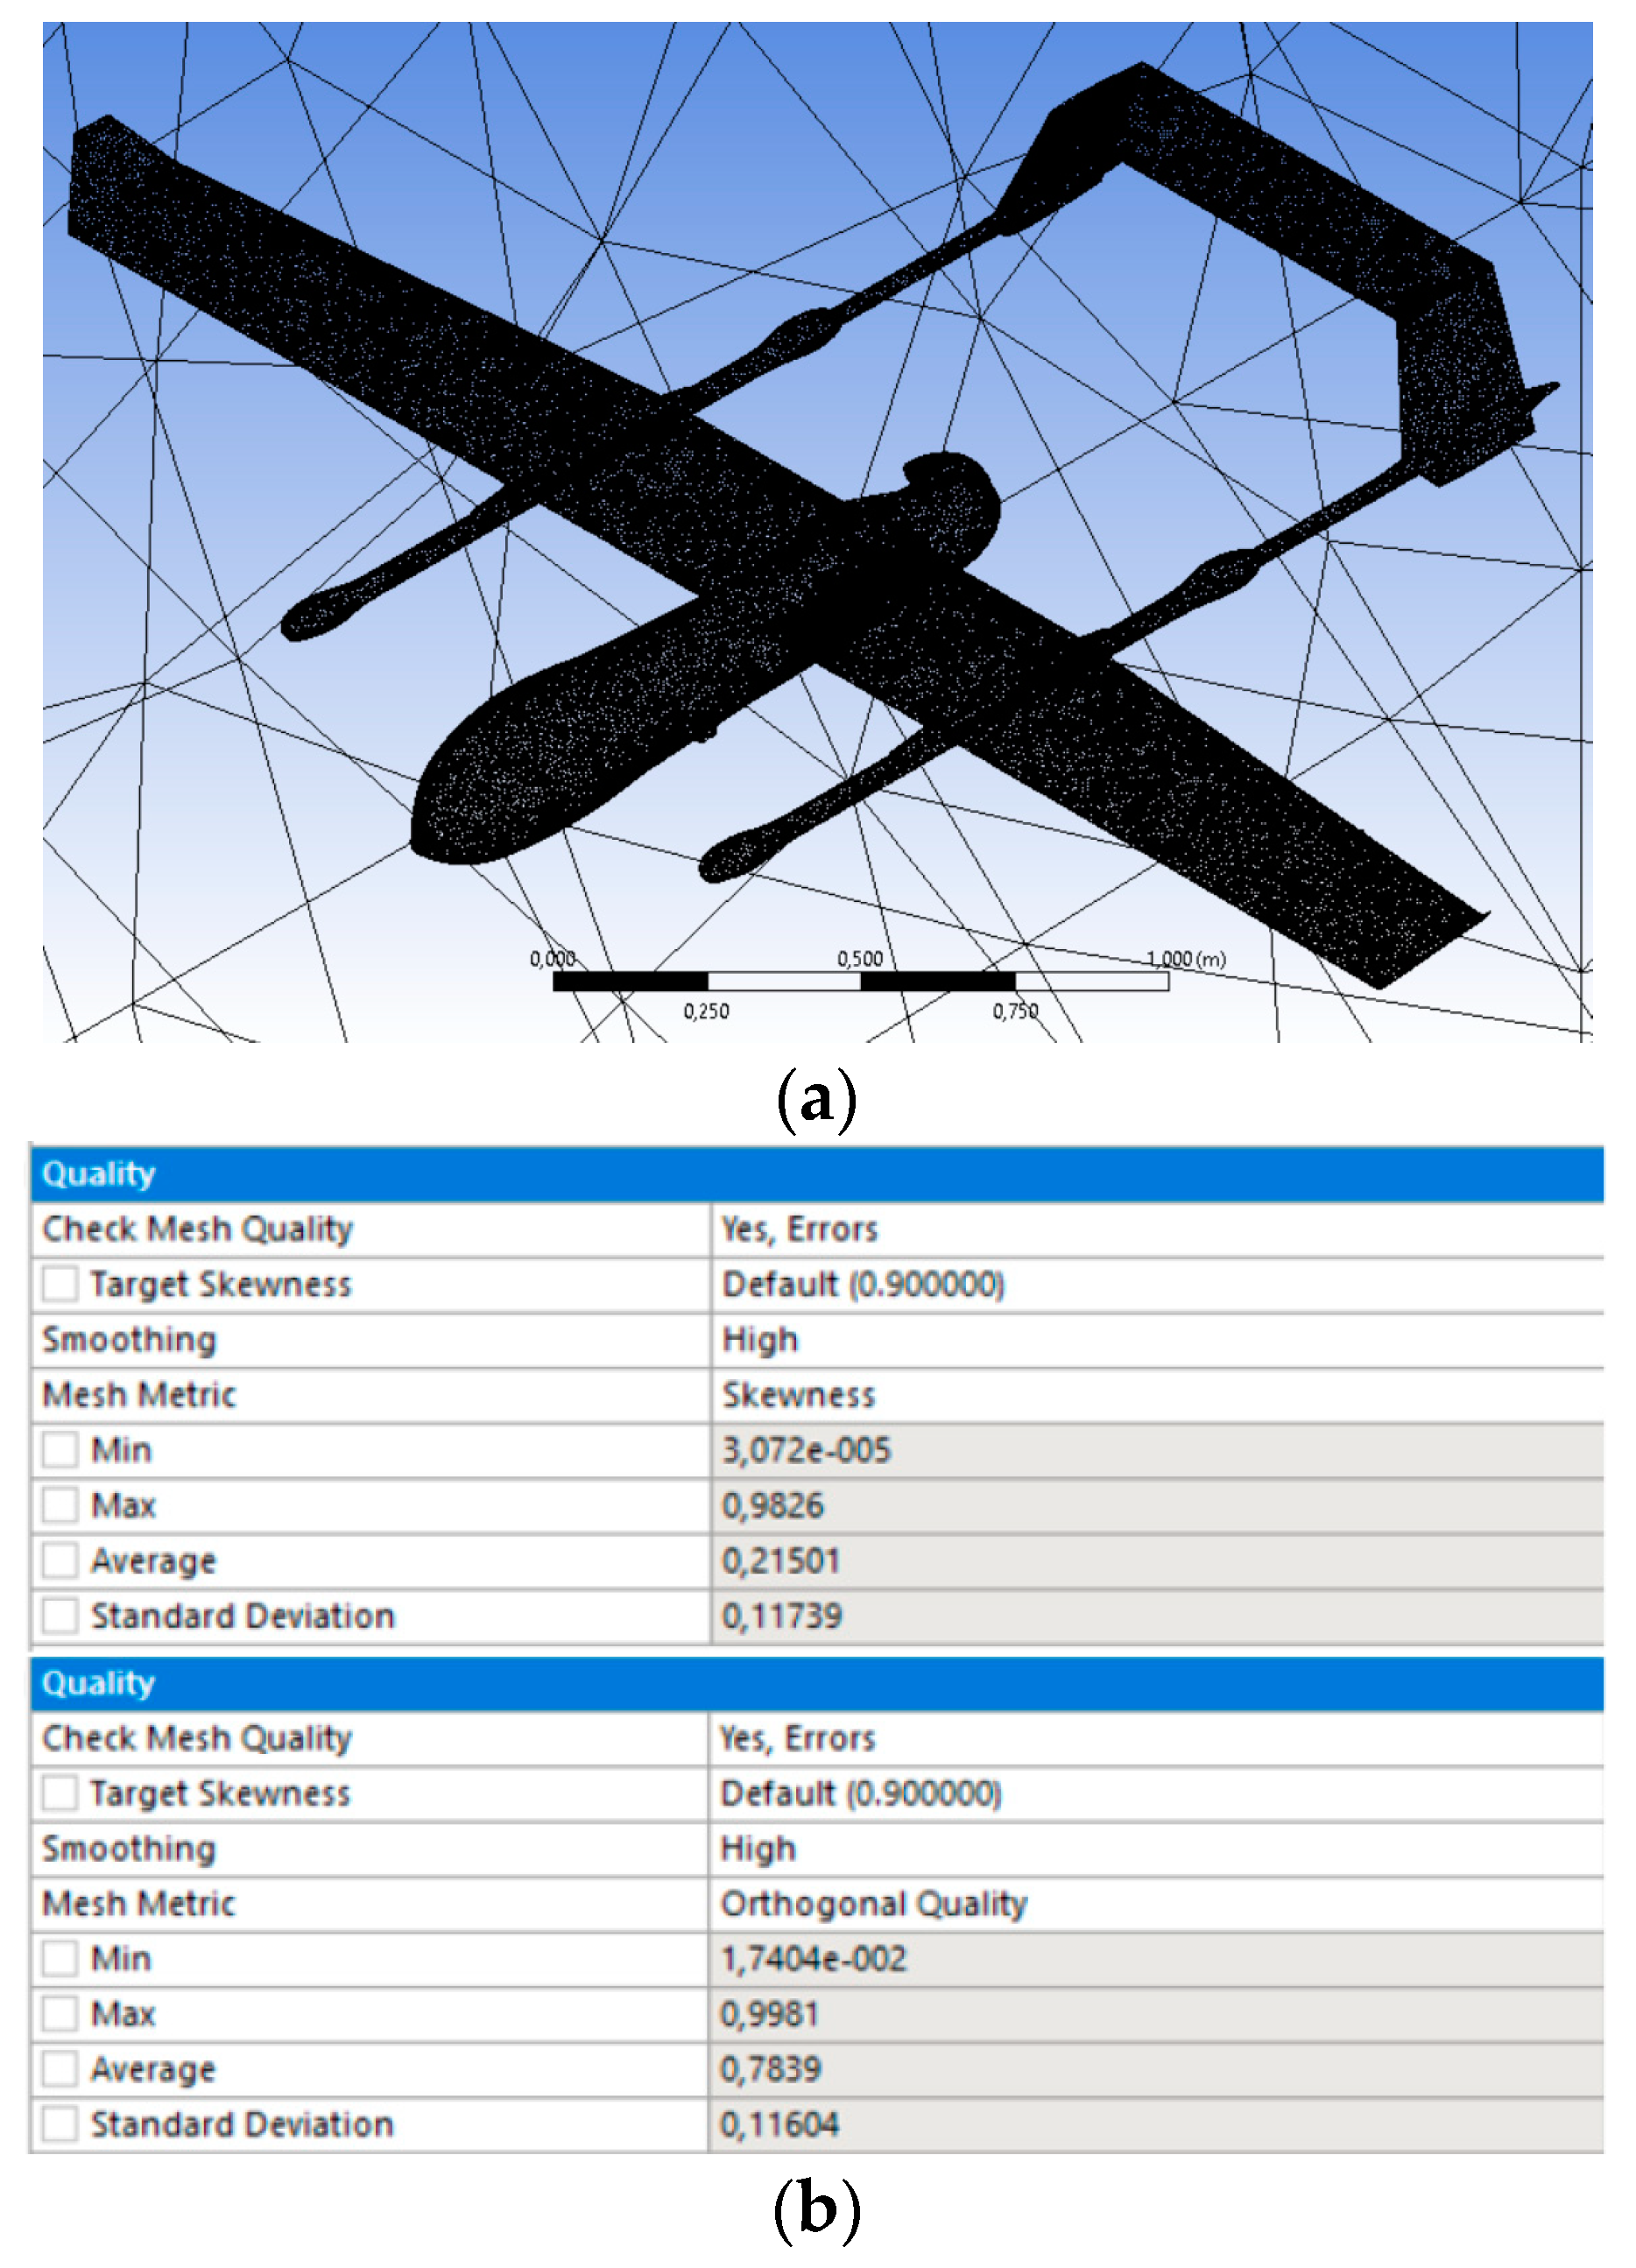
Aerospace 09 00208 g006
Figure 7. Mesh result: (a) VTOL-Plane mesh visualization and (b) mesh quality.
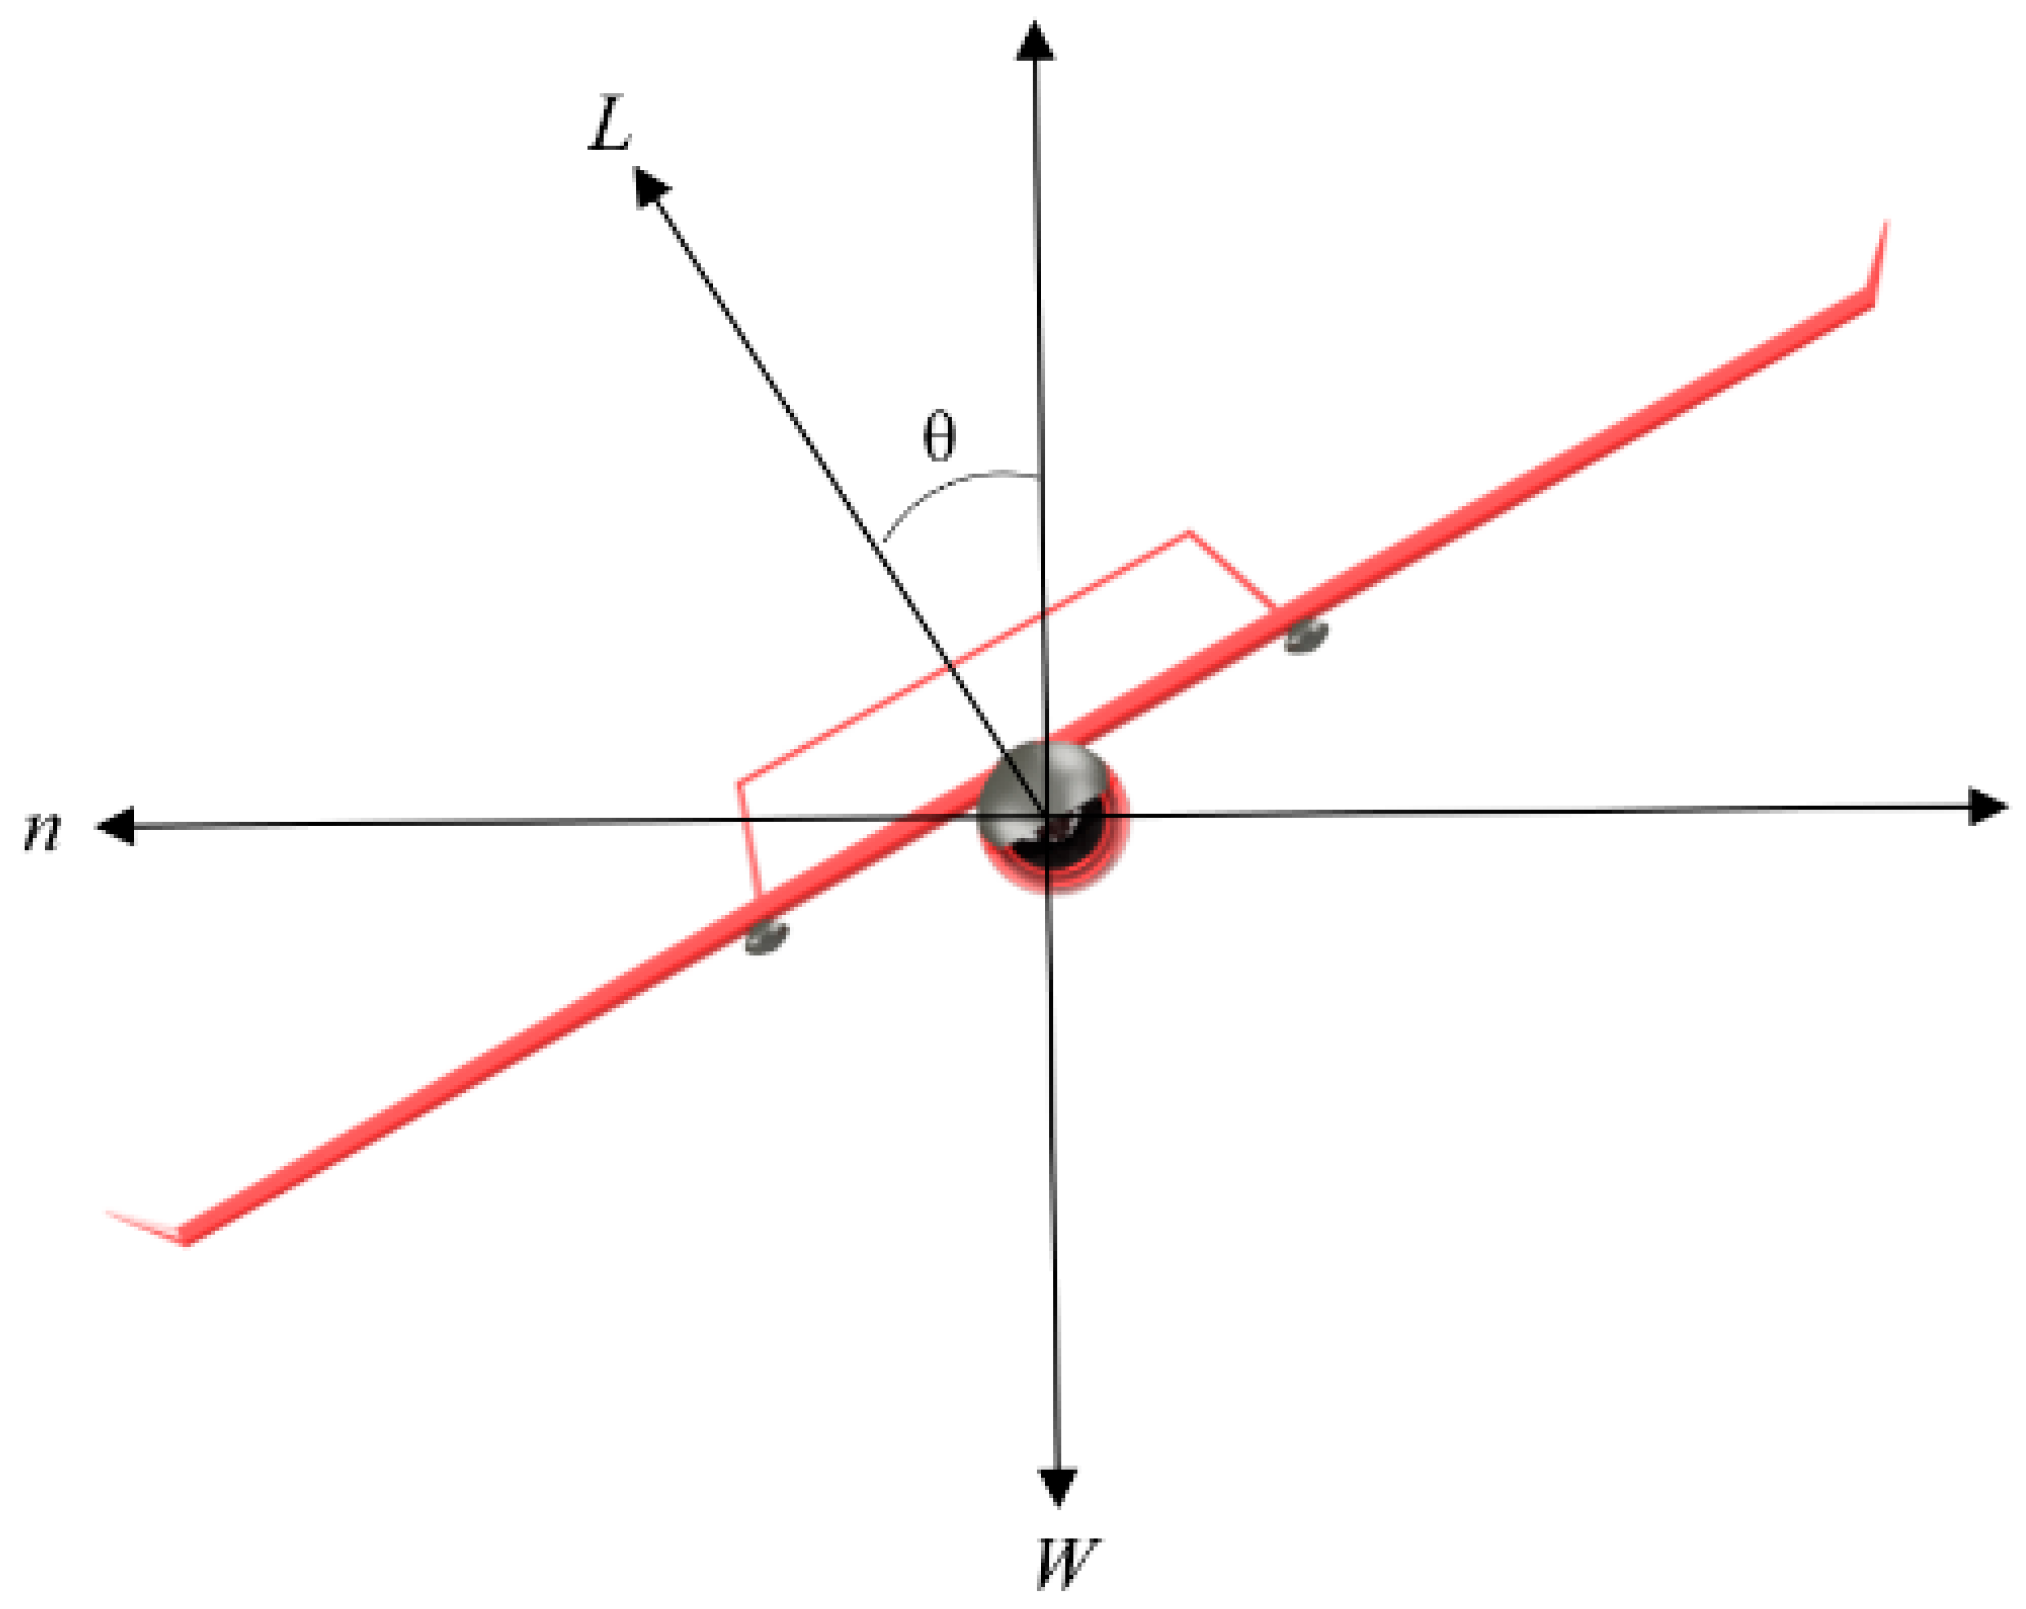
Aerospace 09 00208 g007
Figure 8. Free body diagram of the aircraft.
Aerospace 09 00208 g008
Figure 9. Lift, drag, and stall phenomena, (a) lifting and drag phenomena and (b) stall phenomenon.
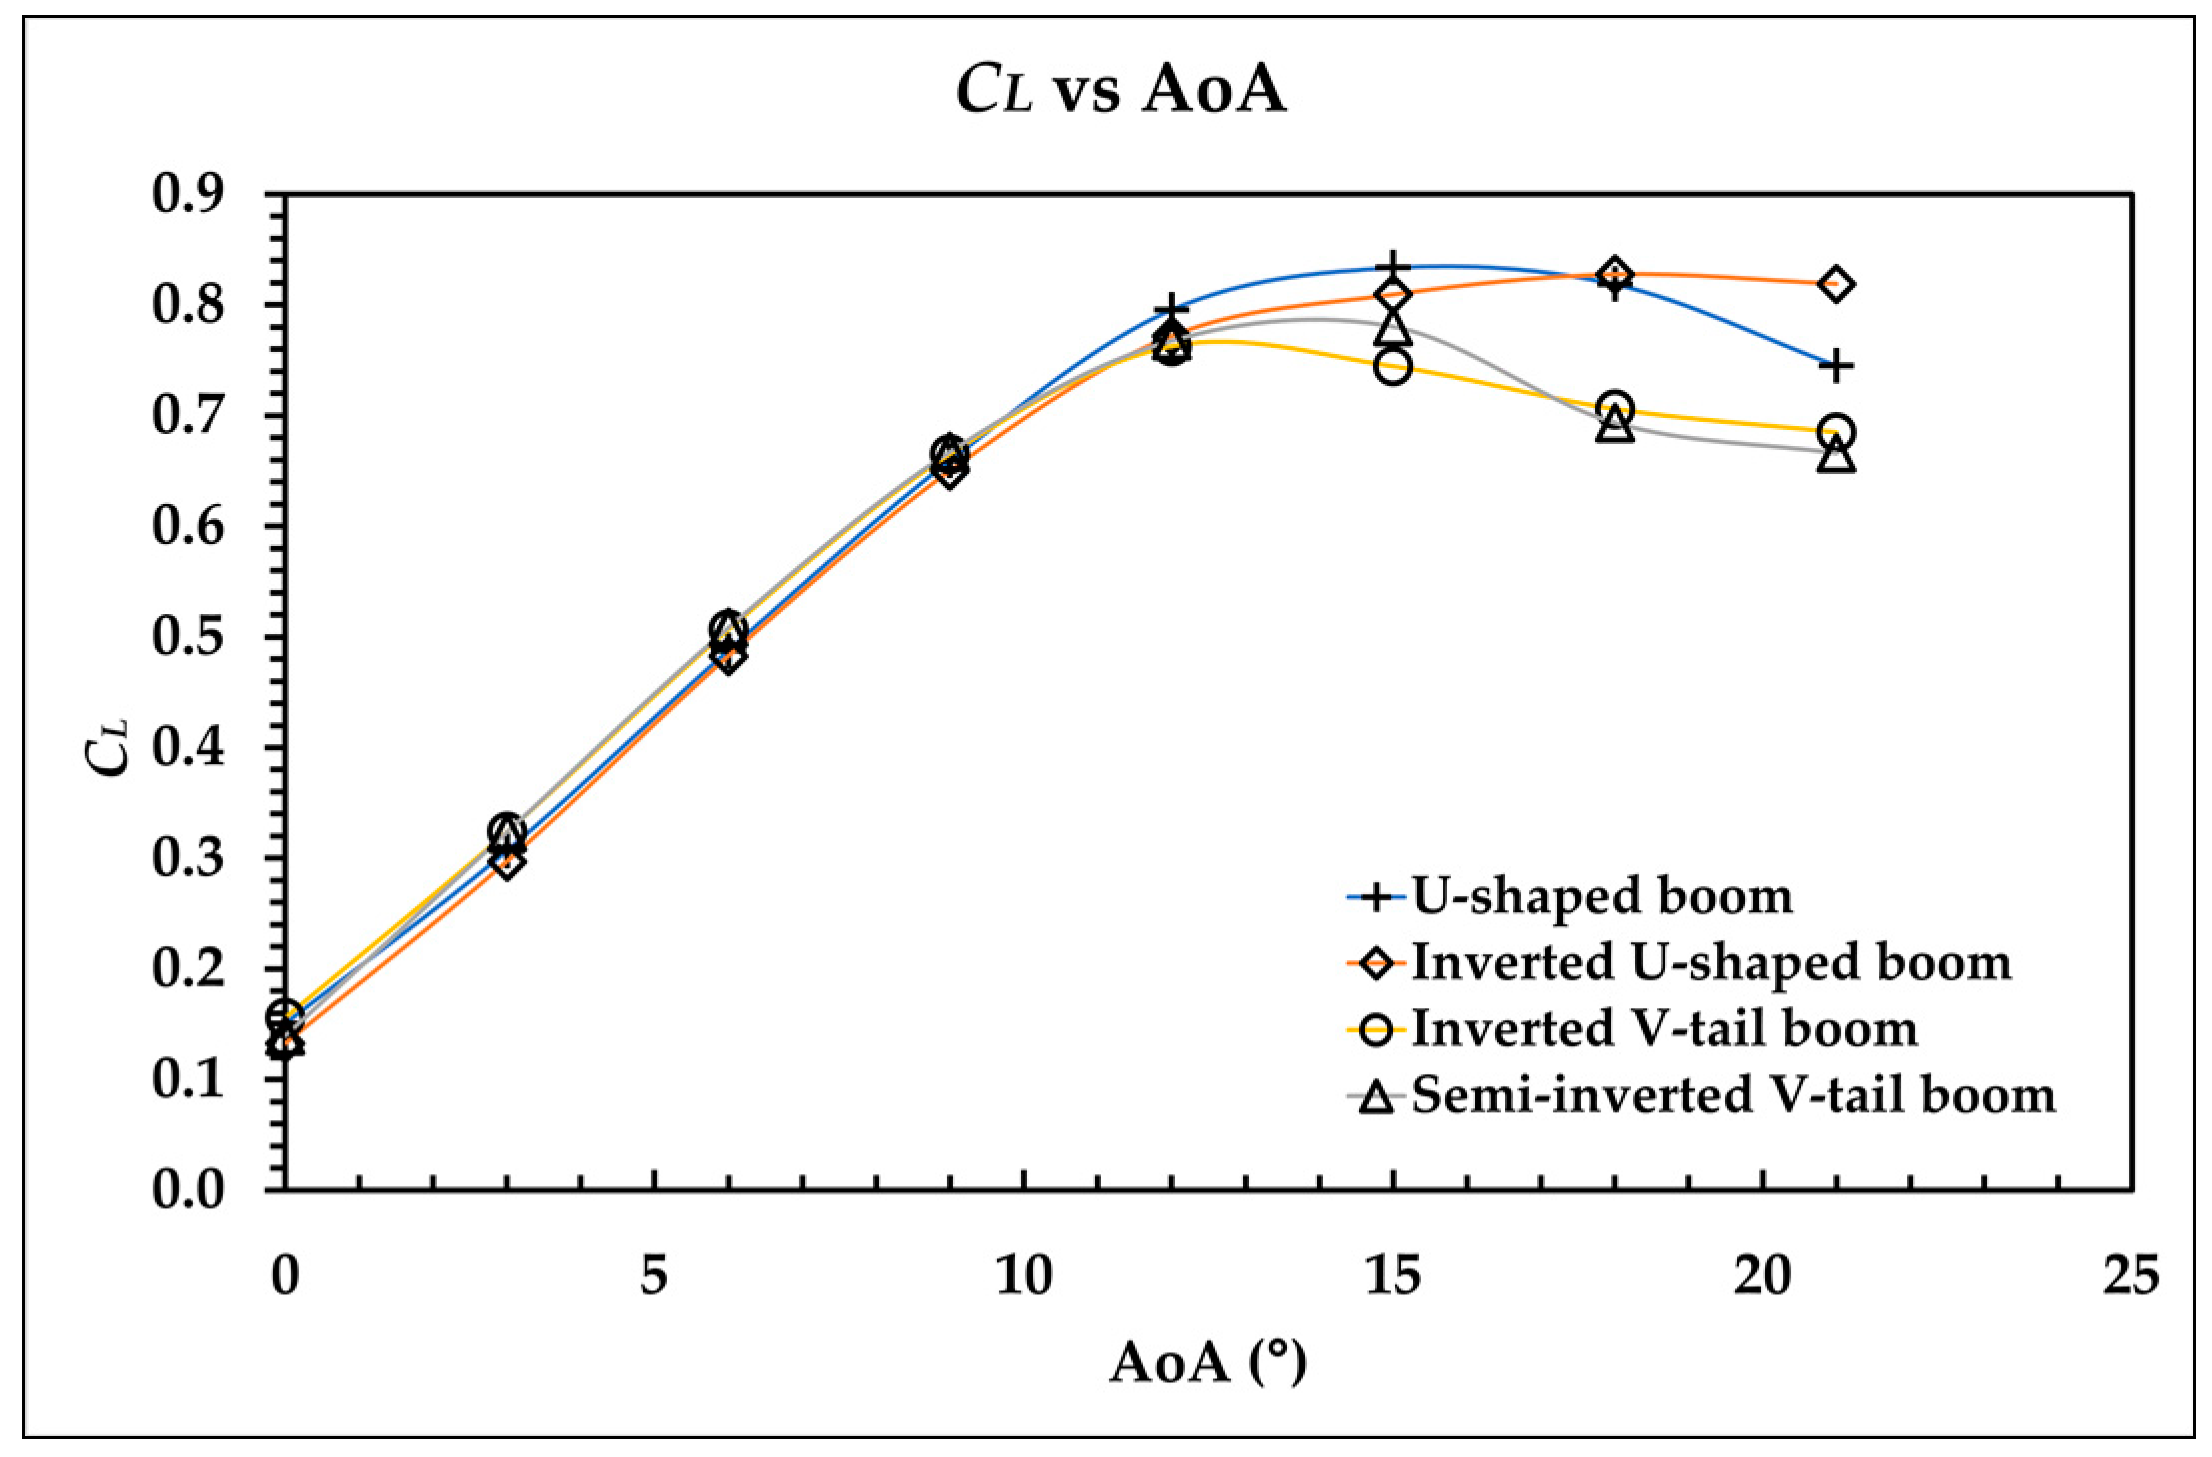
Aerospace 09 00208 g009
Figure 10. CL vs. AoA headwind conditions.
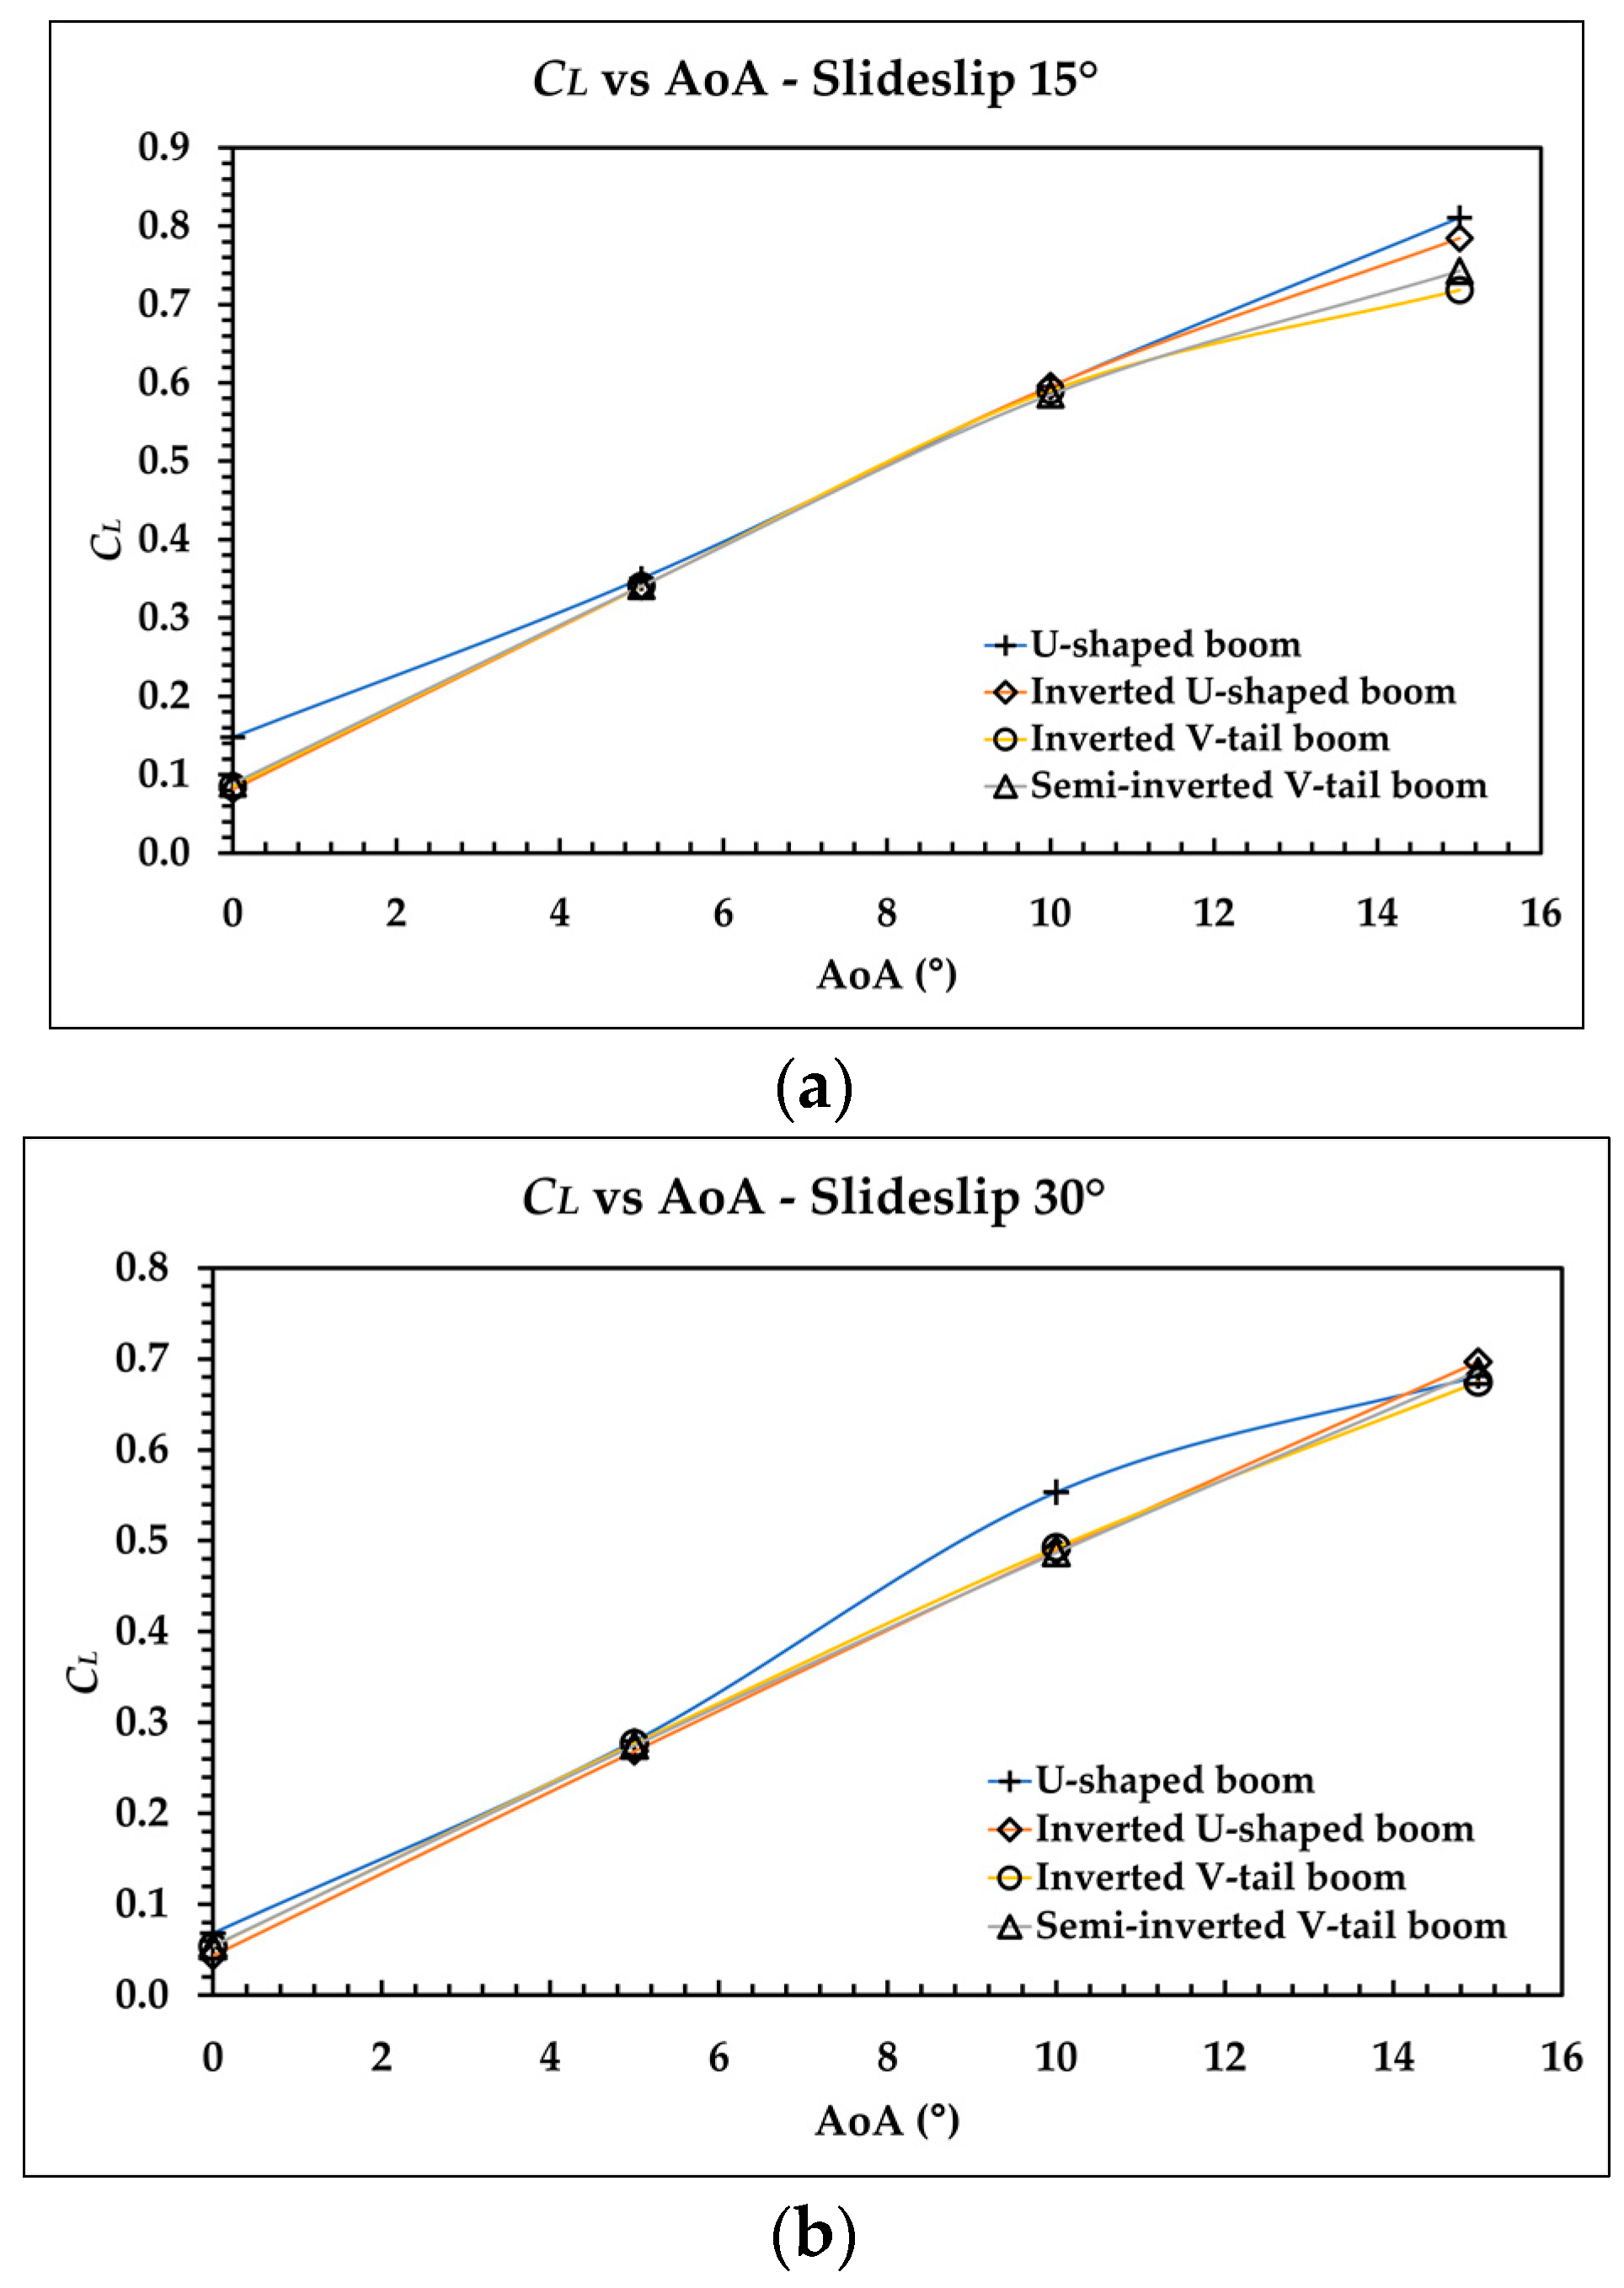
Aerospace 09 00208 g010
Figure 11. Coefficient of lift vs. AoA, sideslip angle: (a) 15° and (b) 30°.
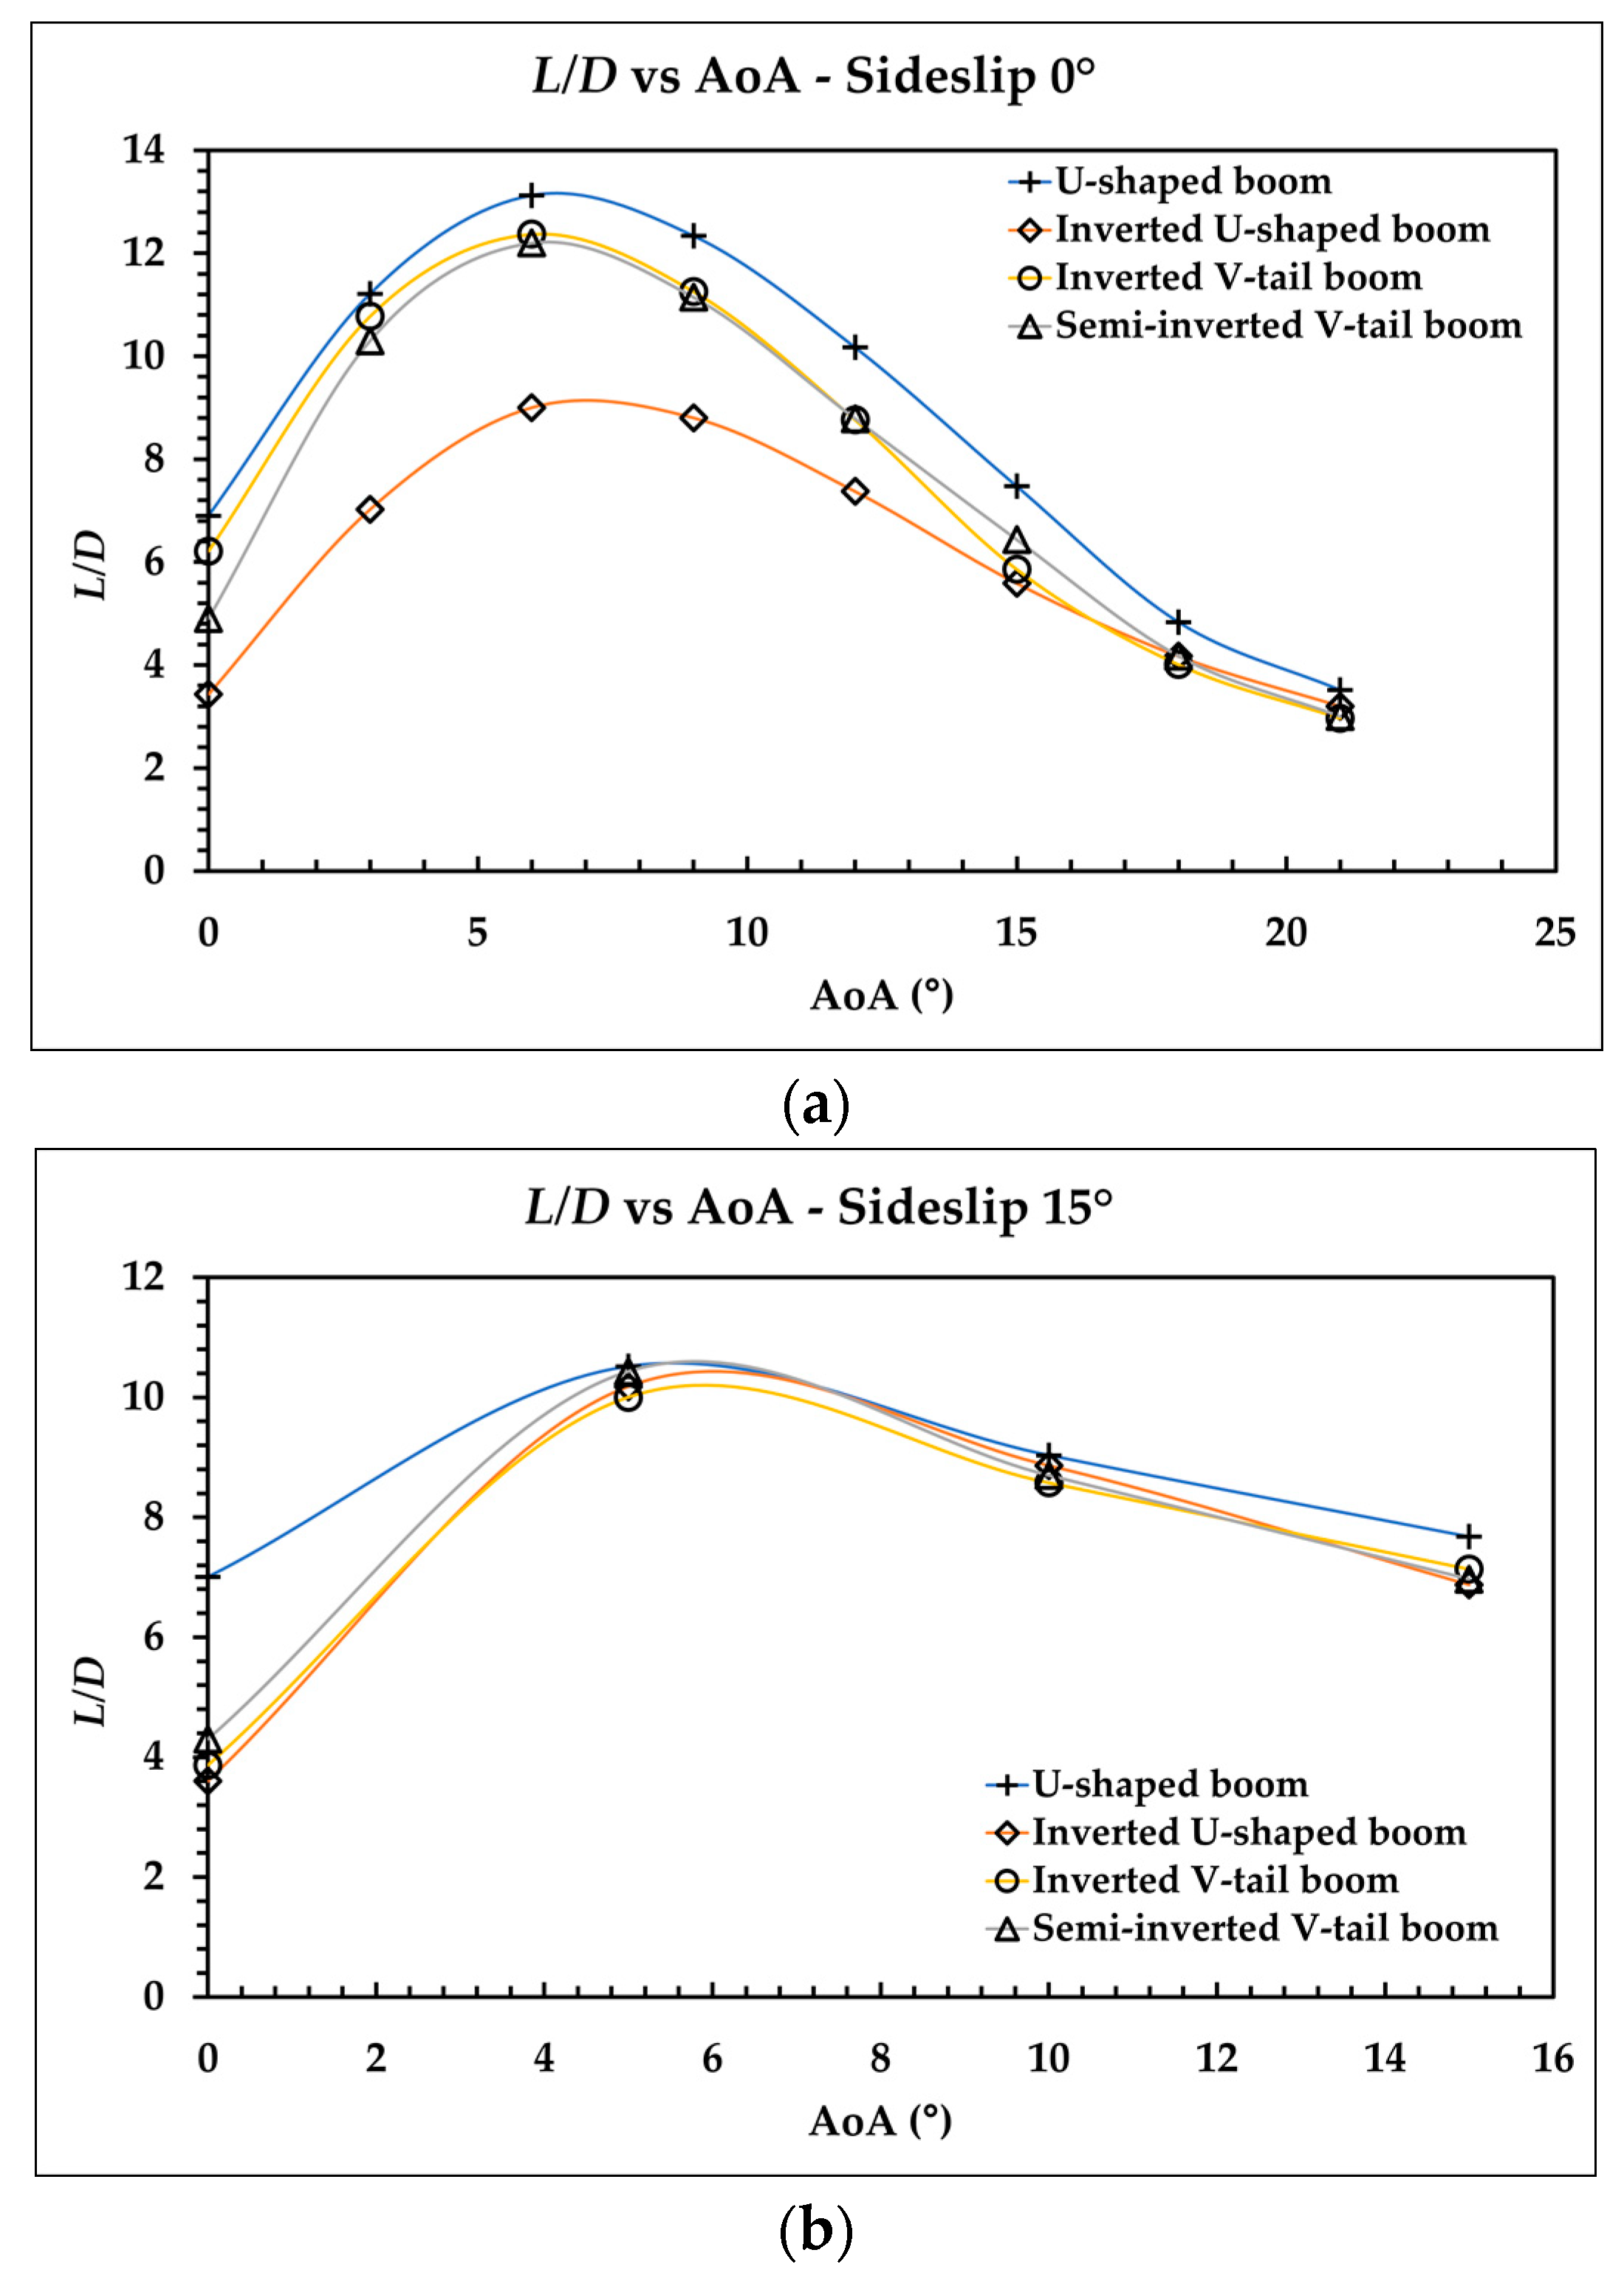
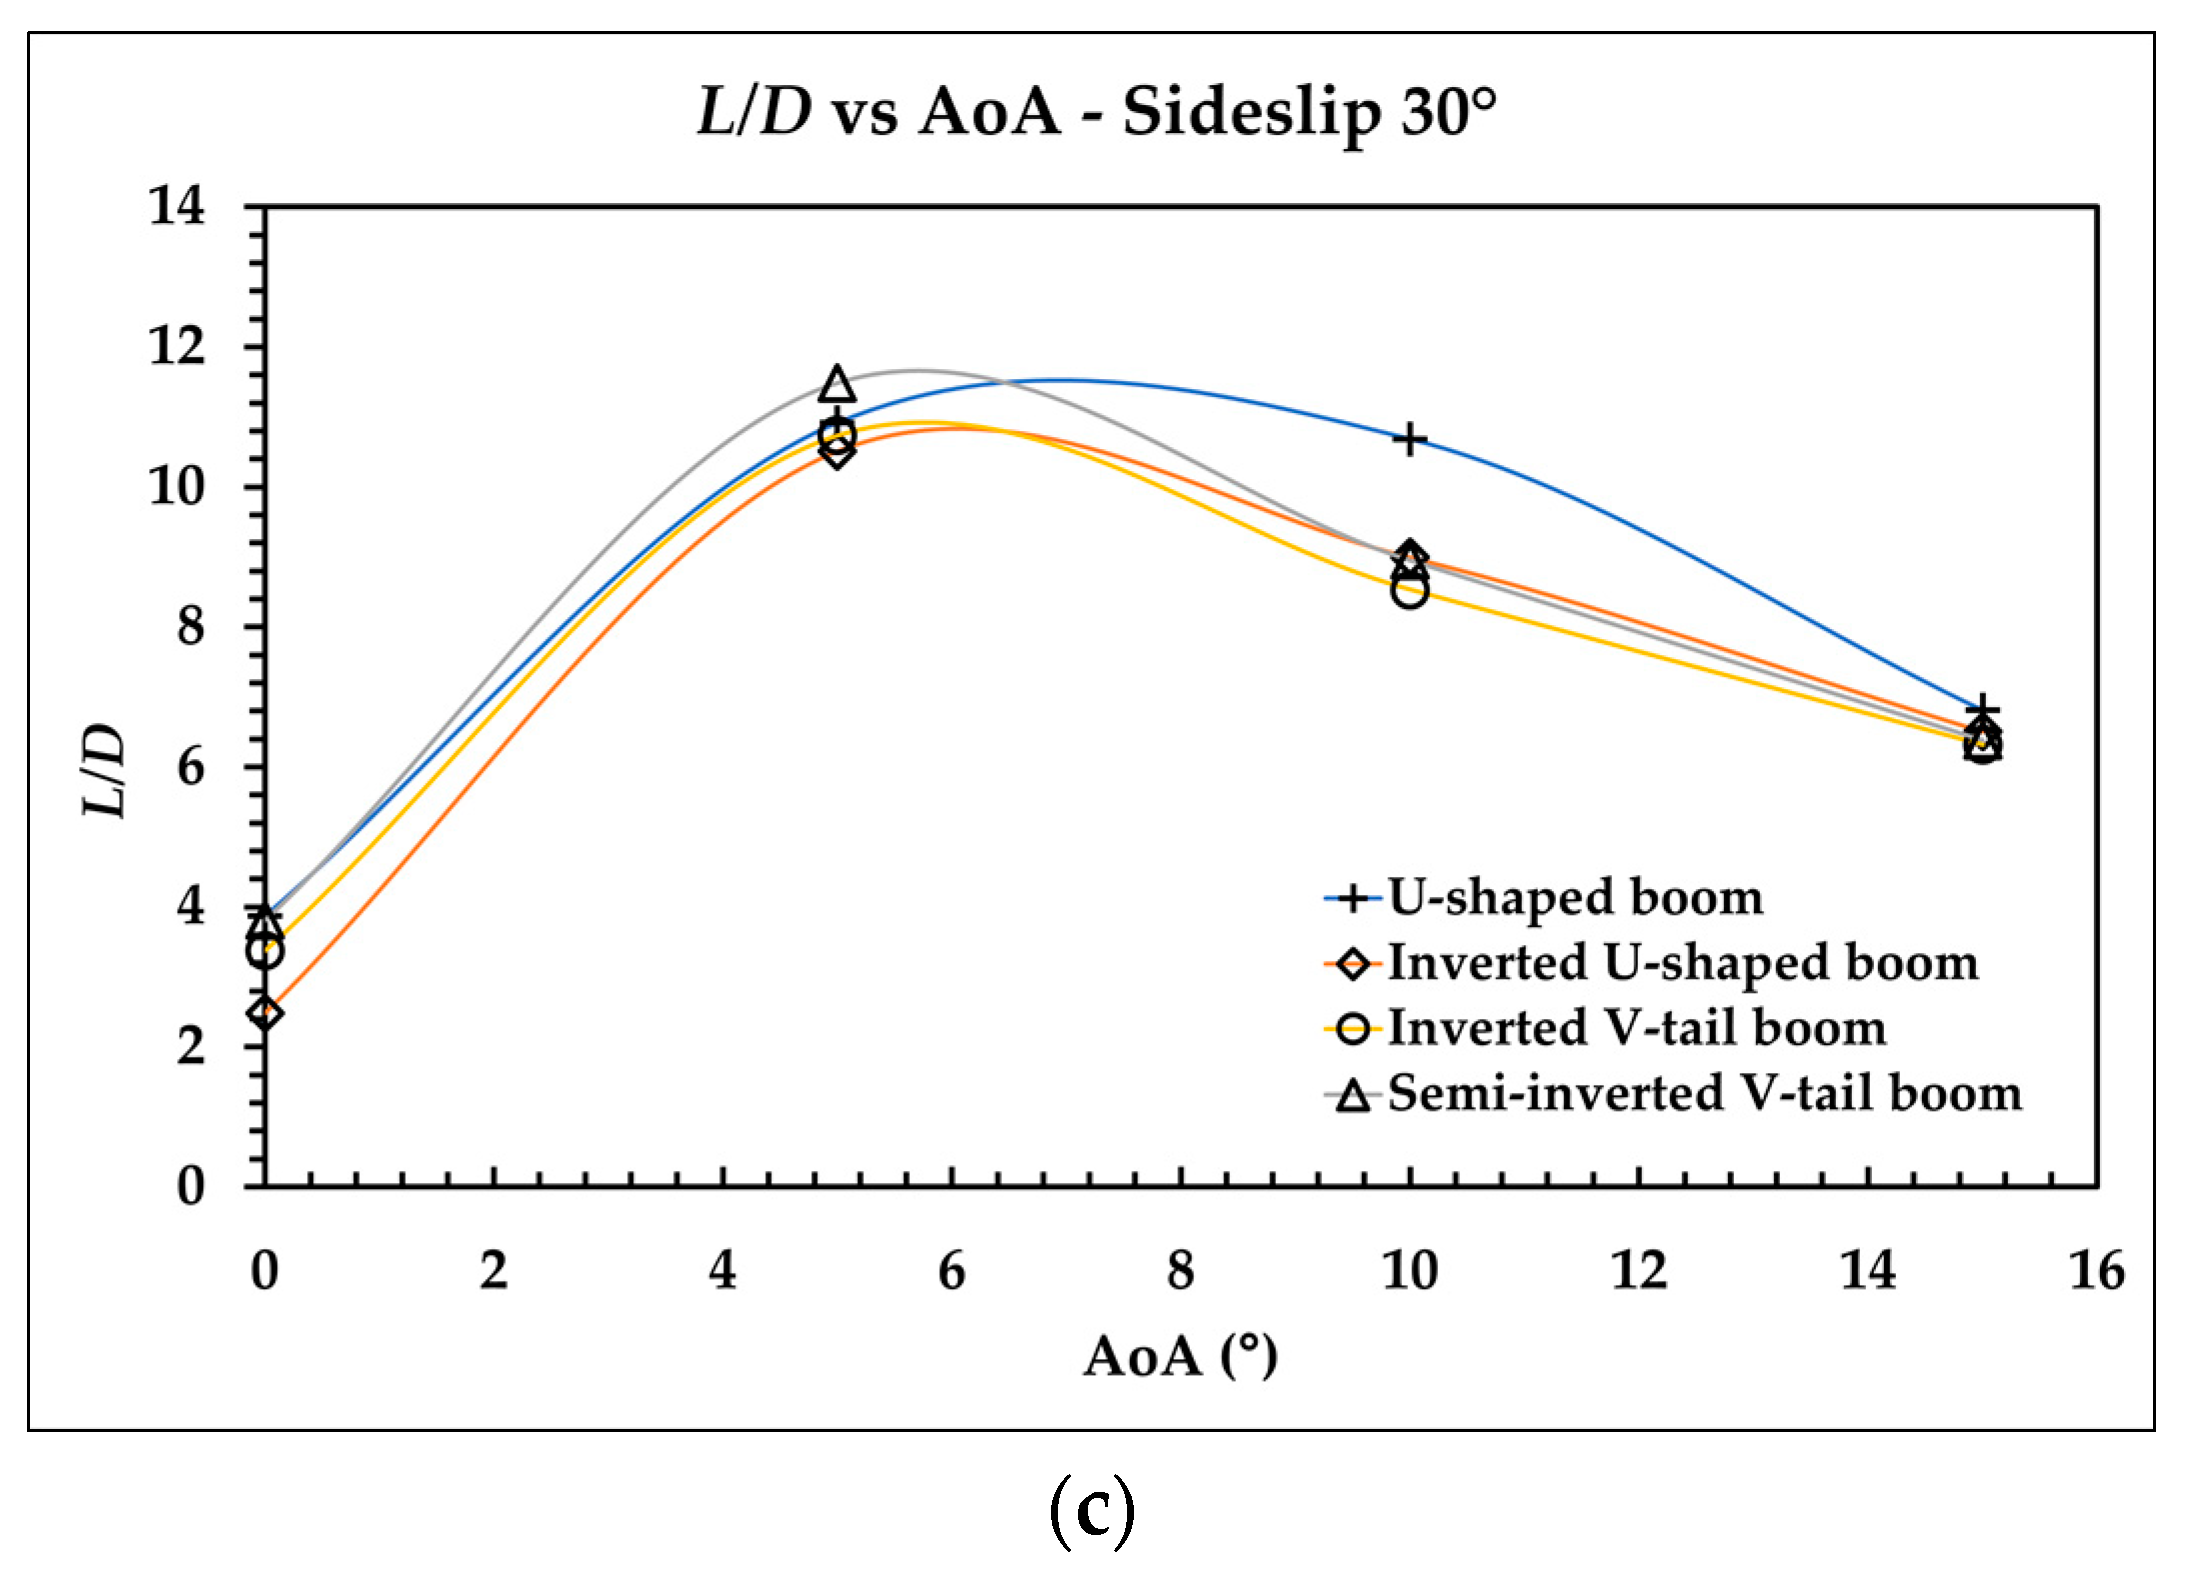
Aerospace 09 00208 g011
Figure 12. L/D vs. AoA, sideslip angle: (a) 0°, (b) 15°, and (c) 30°.
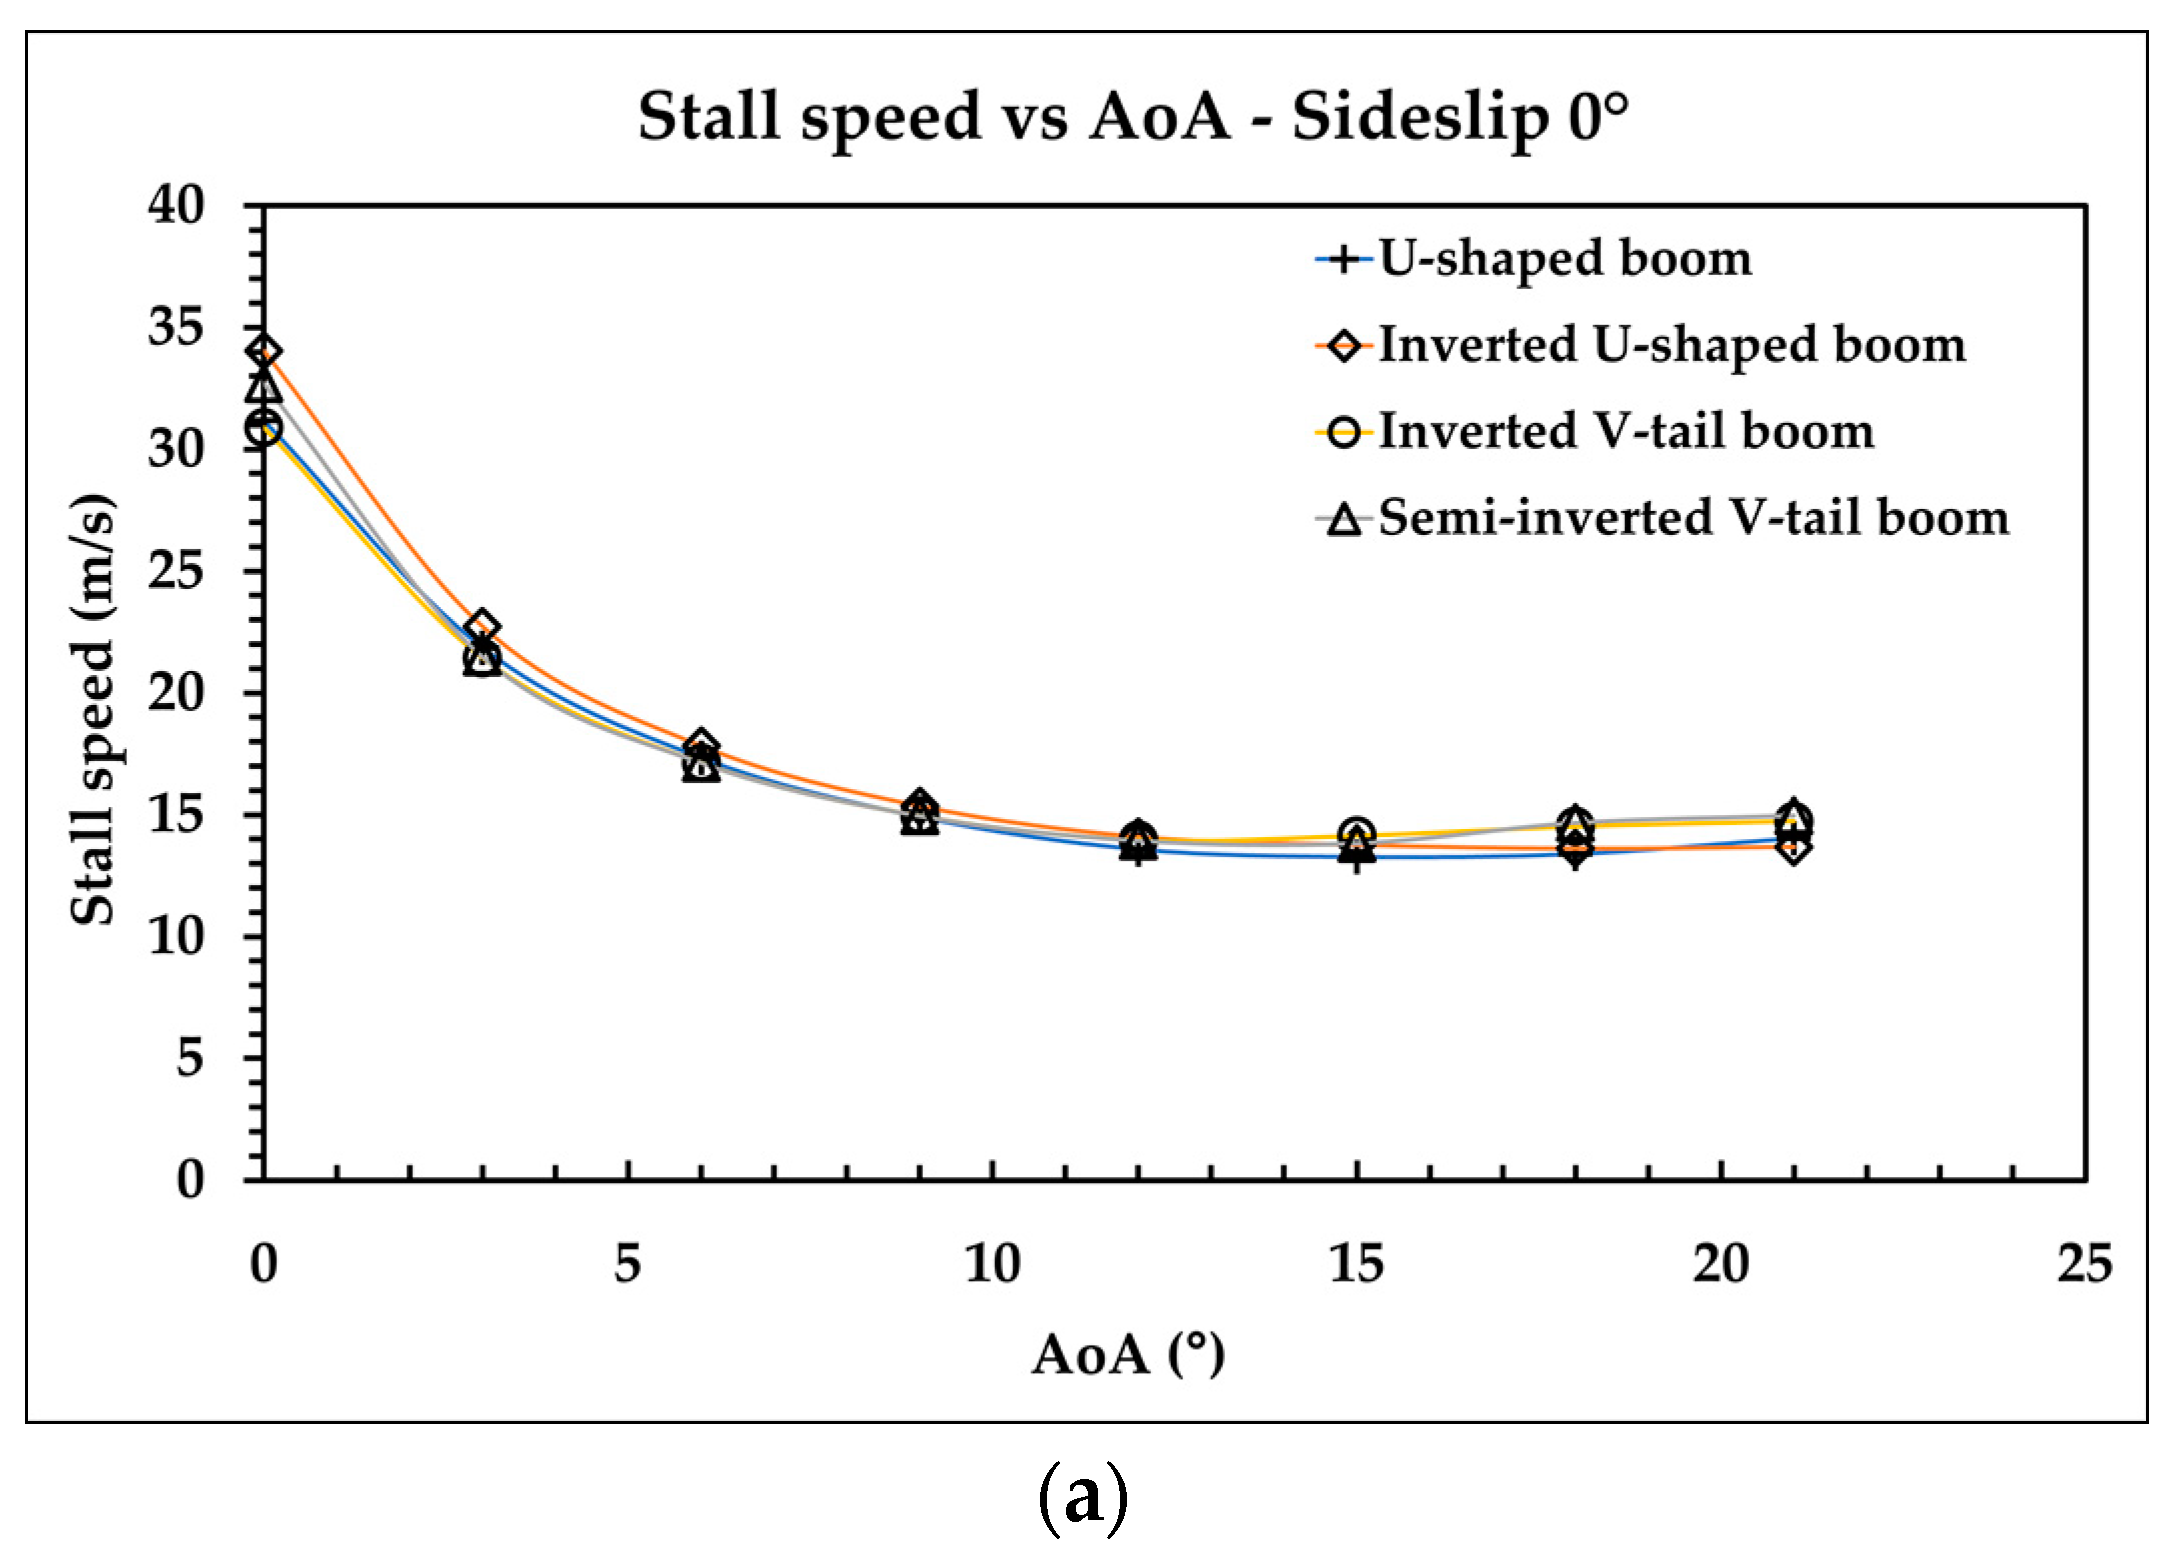
Aerospace 09 00208 g012aAerospace 09 00208 g012b
Figure 13. Stall speed vs. AoA, sideslip angle: (a) 0°, (b) 15°, and (c) 30°.
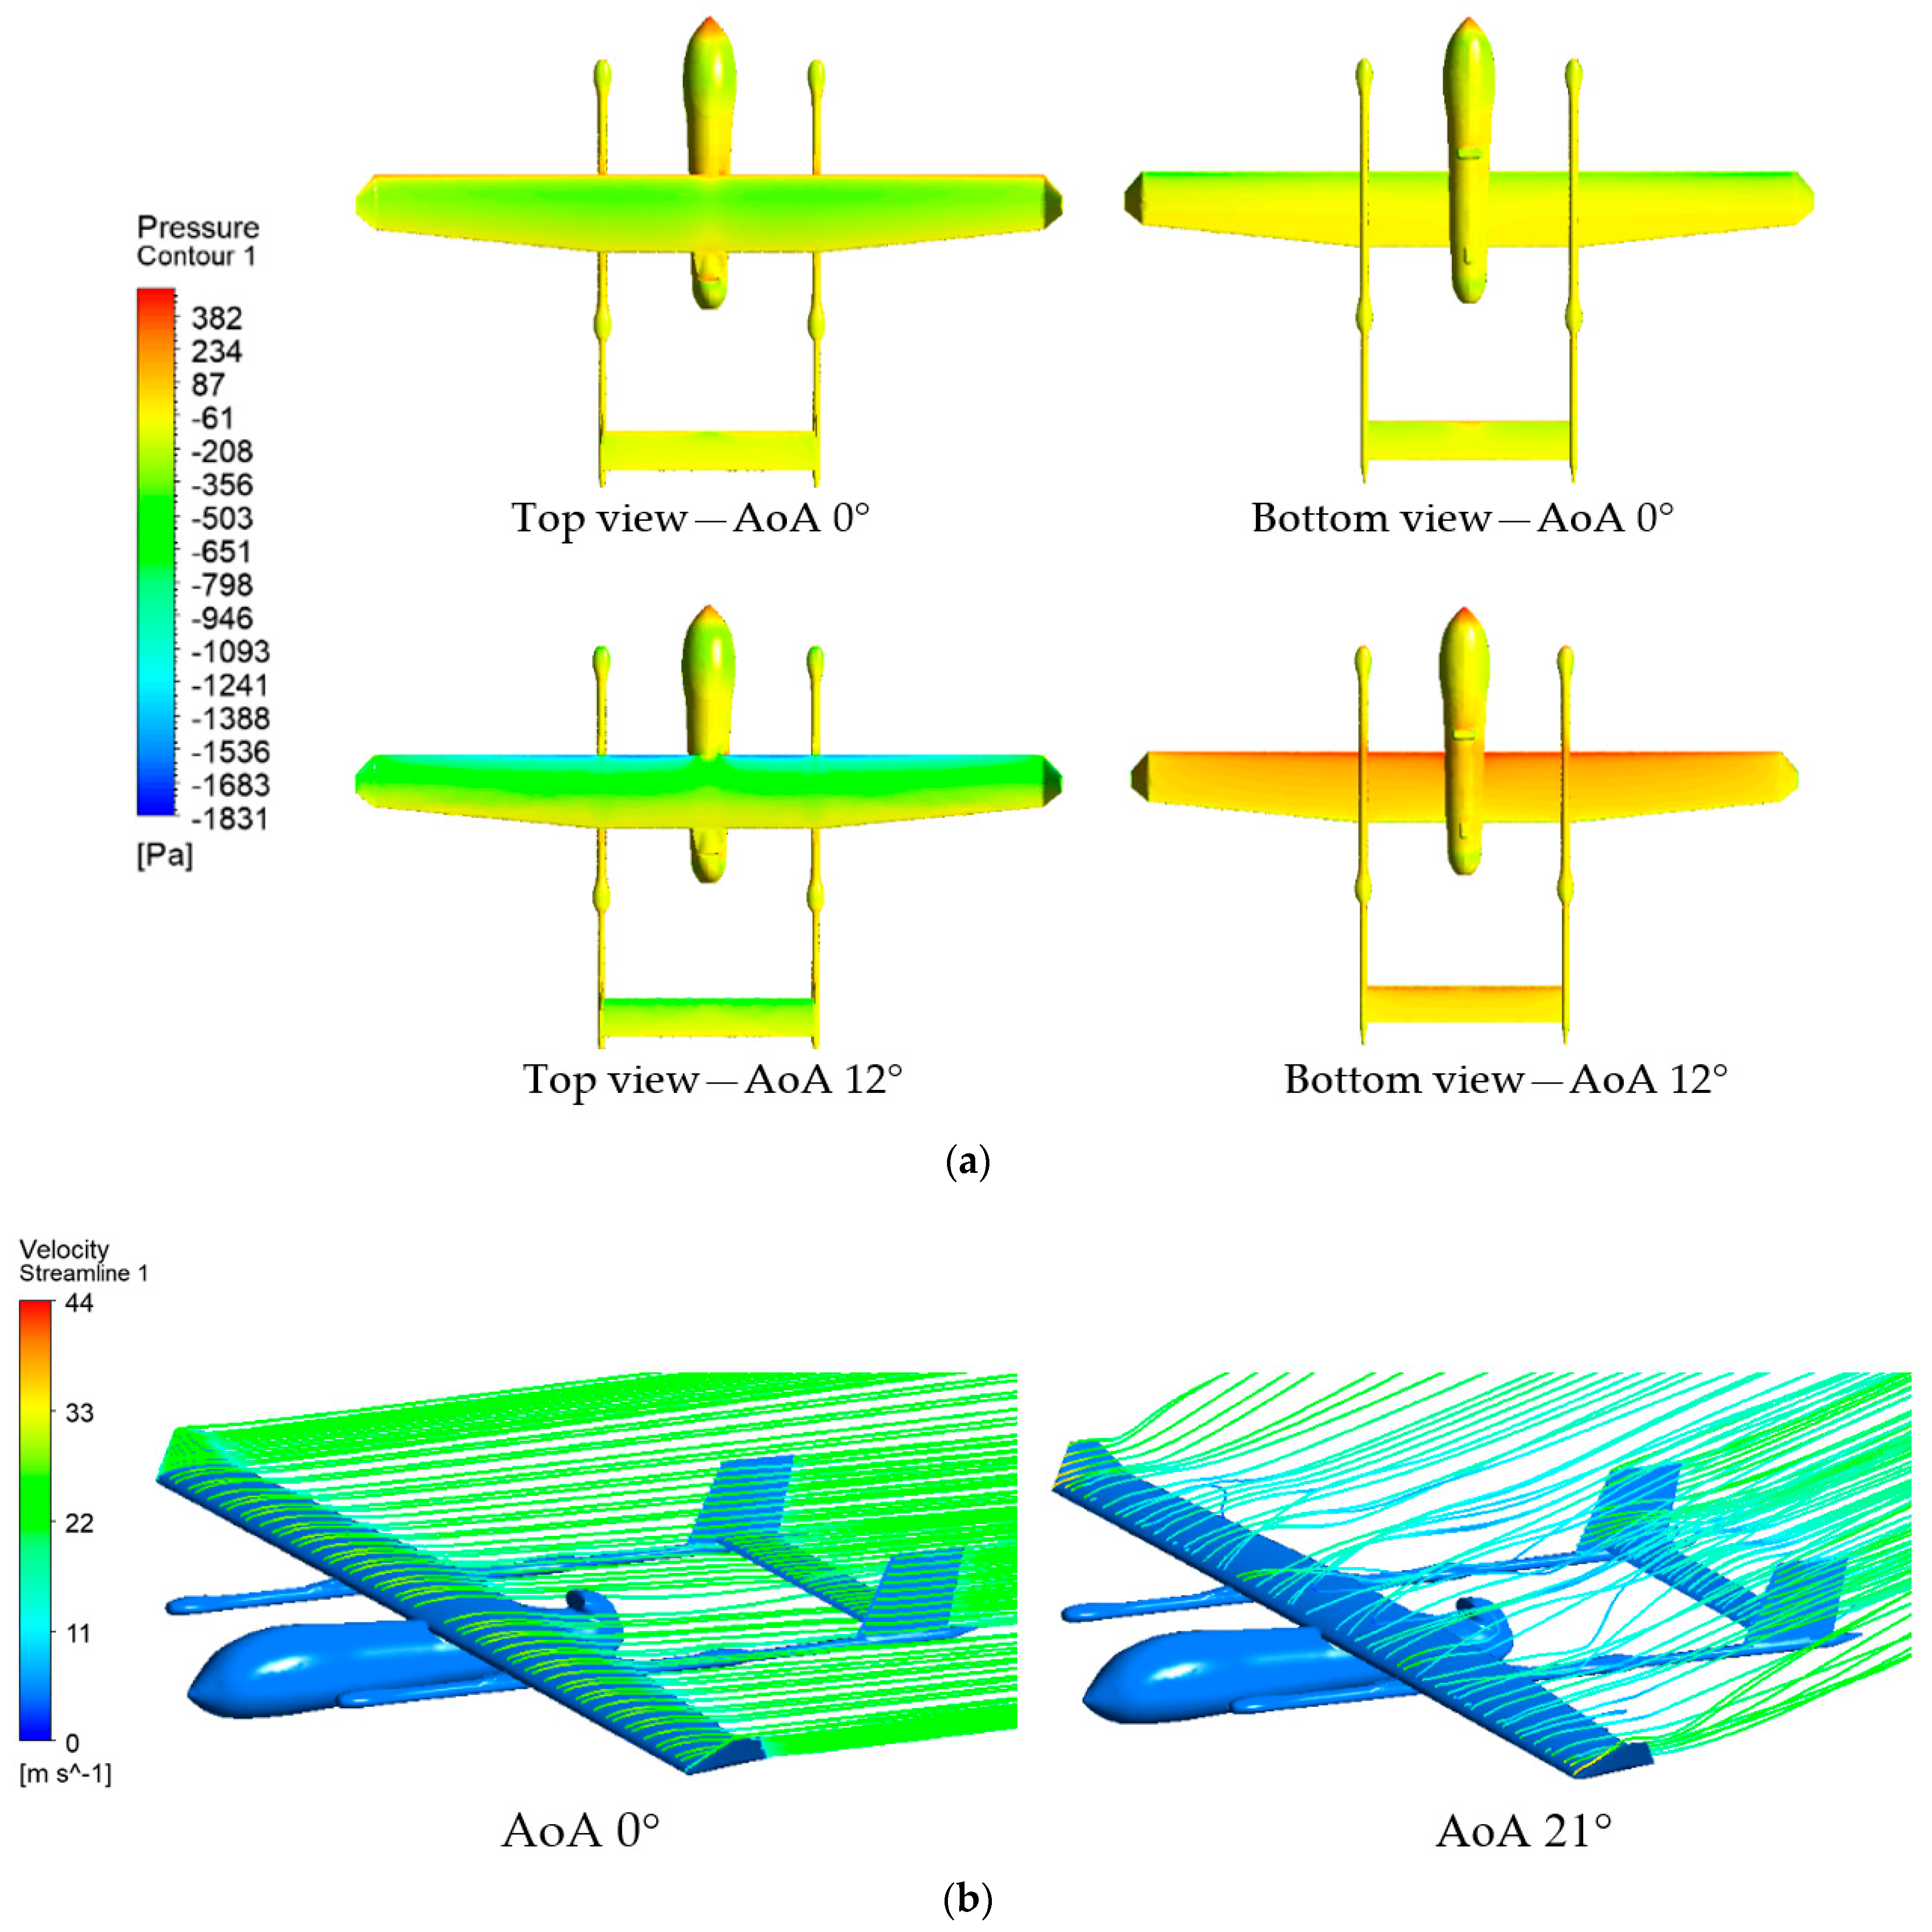
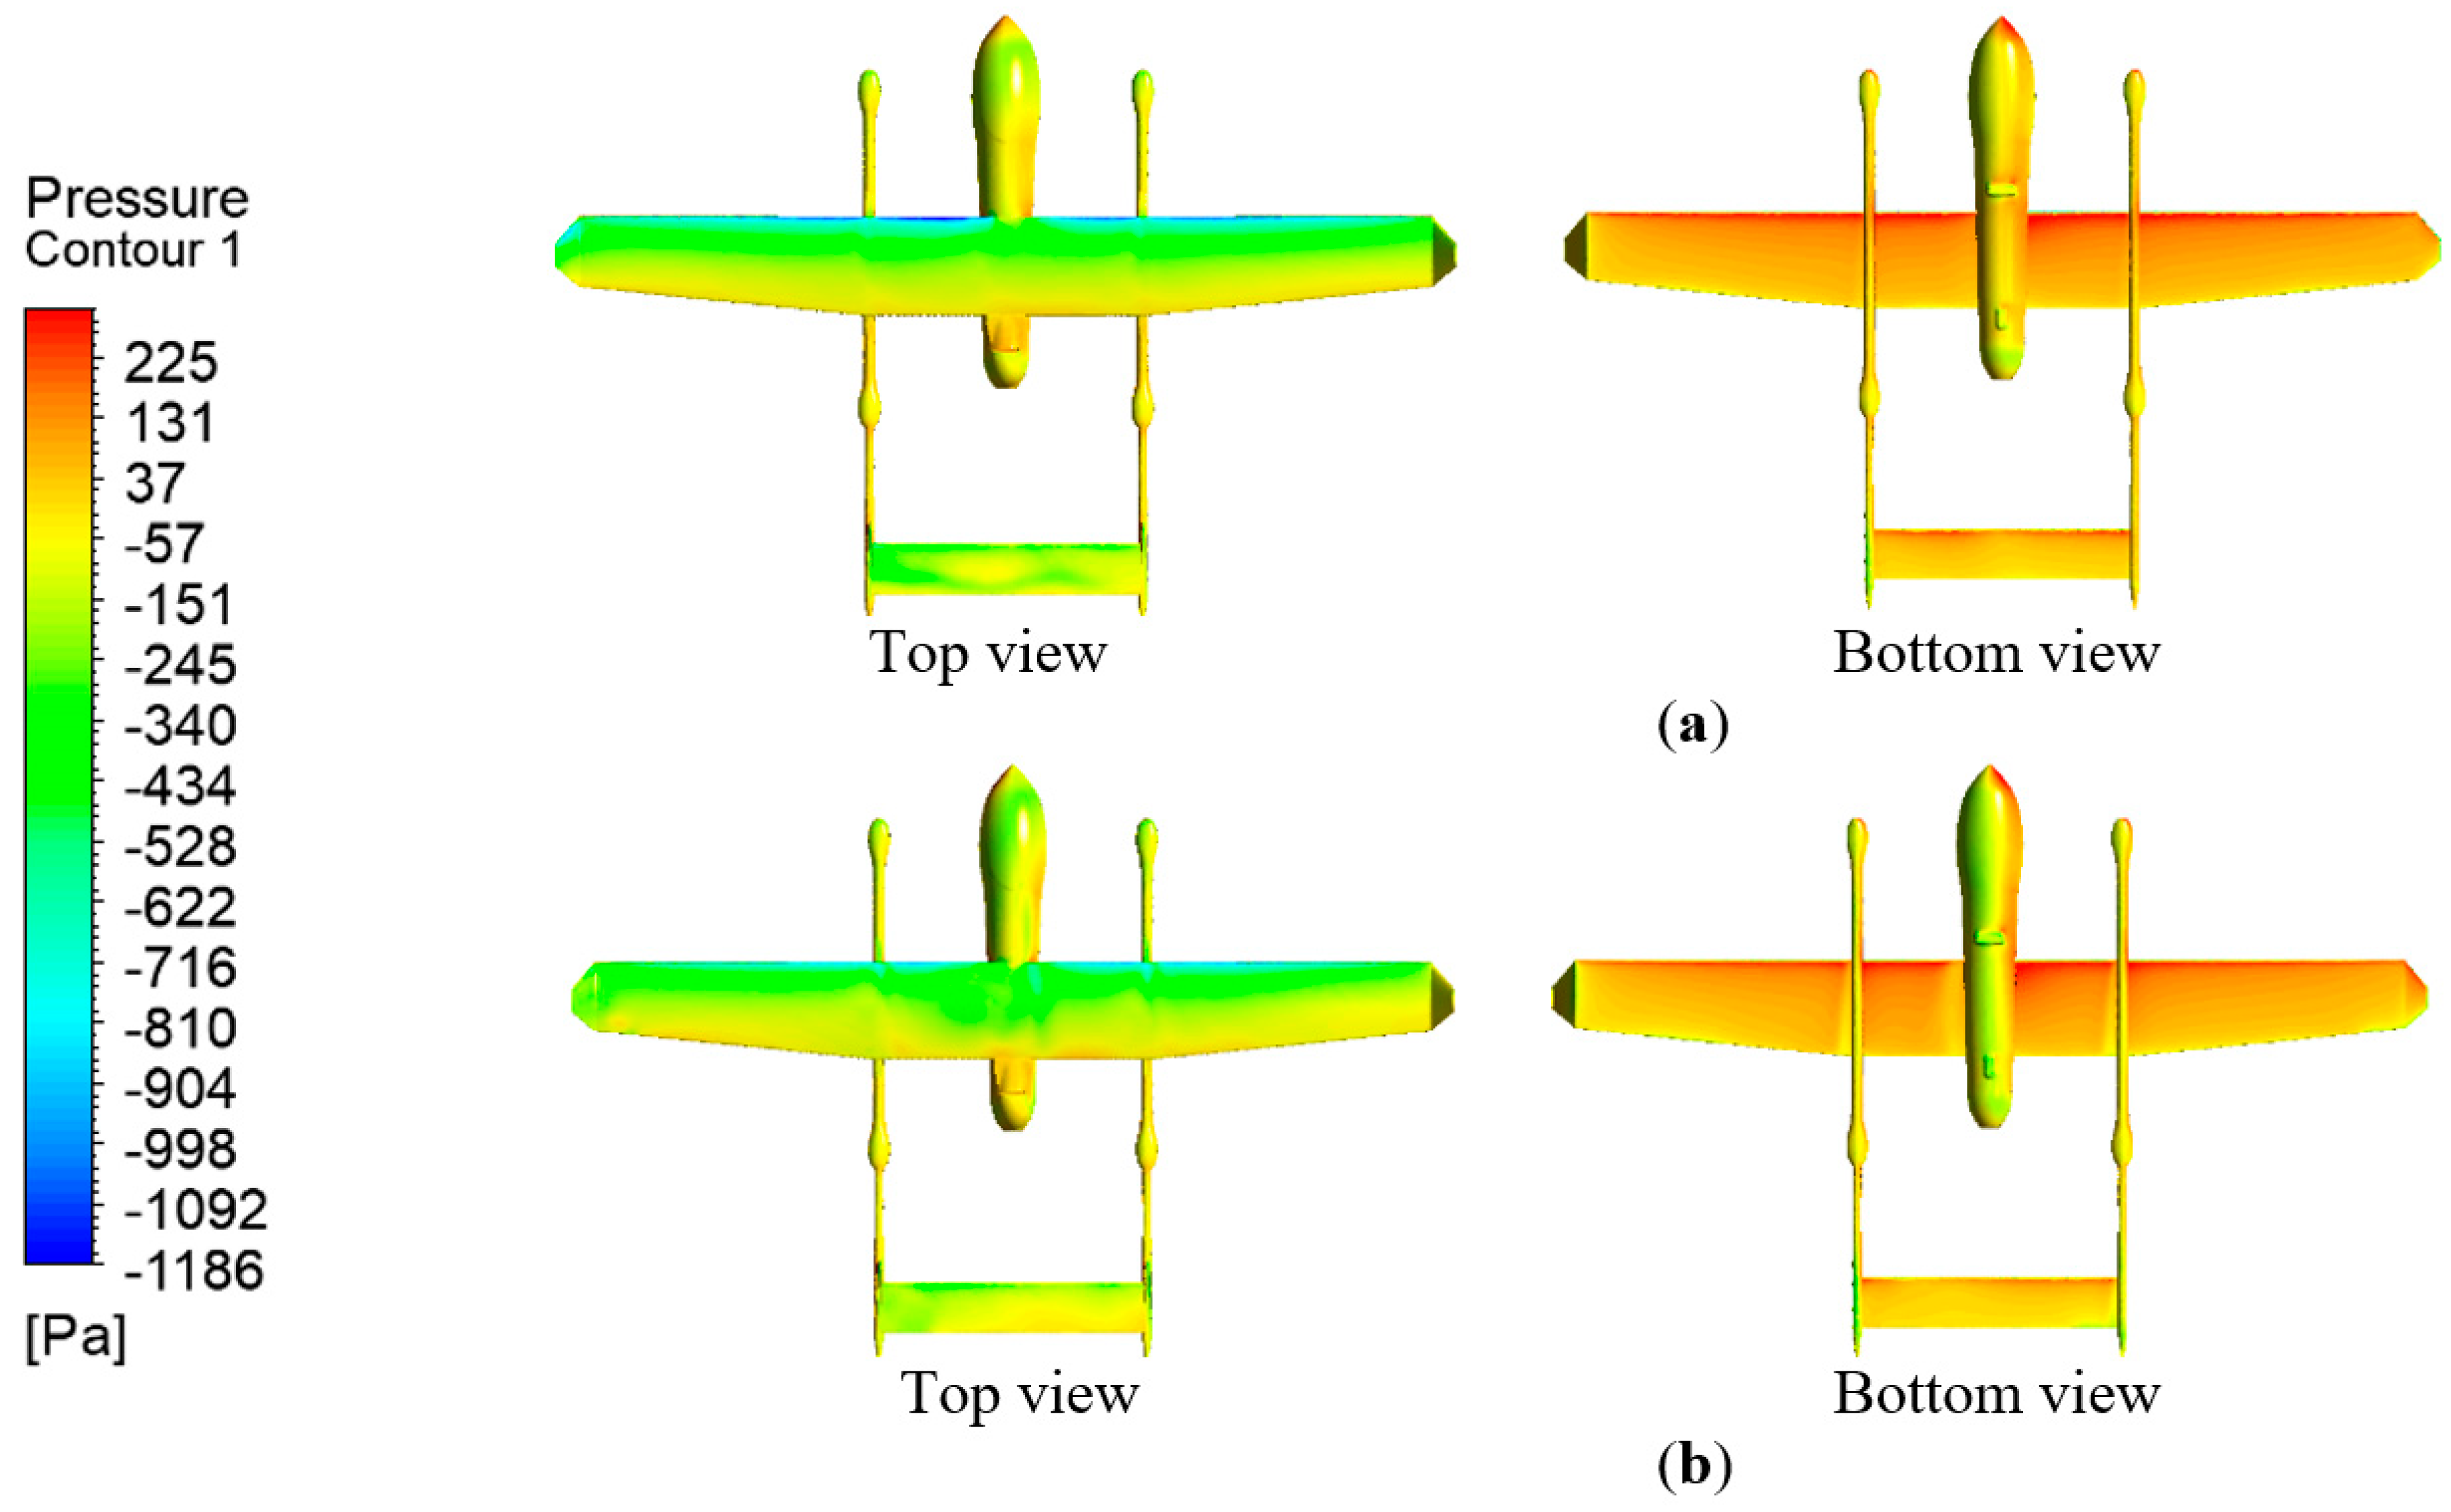
Aerospace 09 00208 g013aAerospace 09 00208 g013b
Figure 14. Pressure contour on 15° AoA, sideslip angle: (a) 15° and (b) 30°.
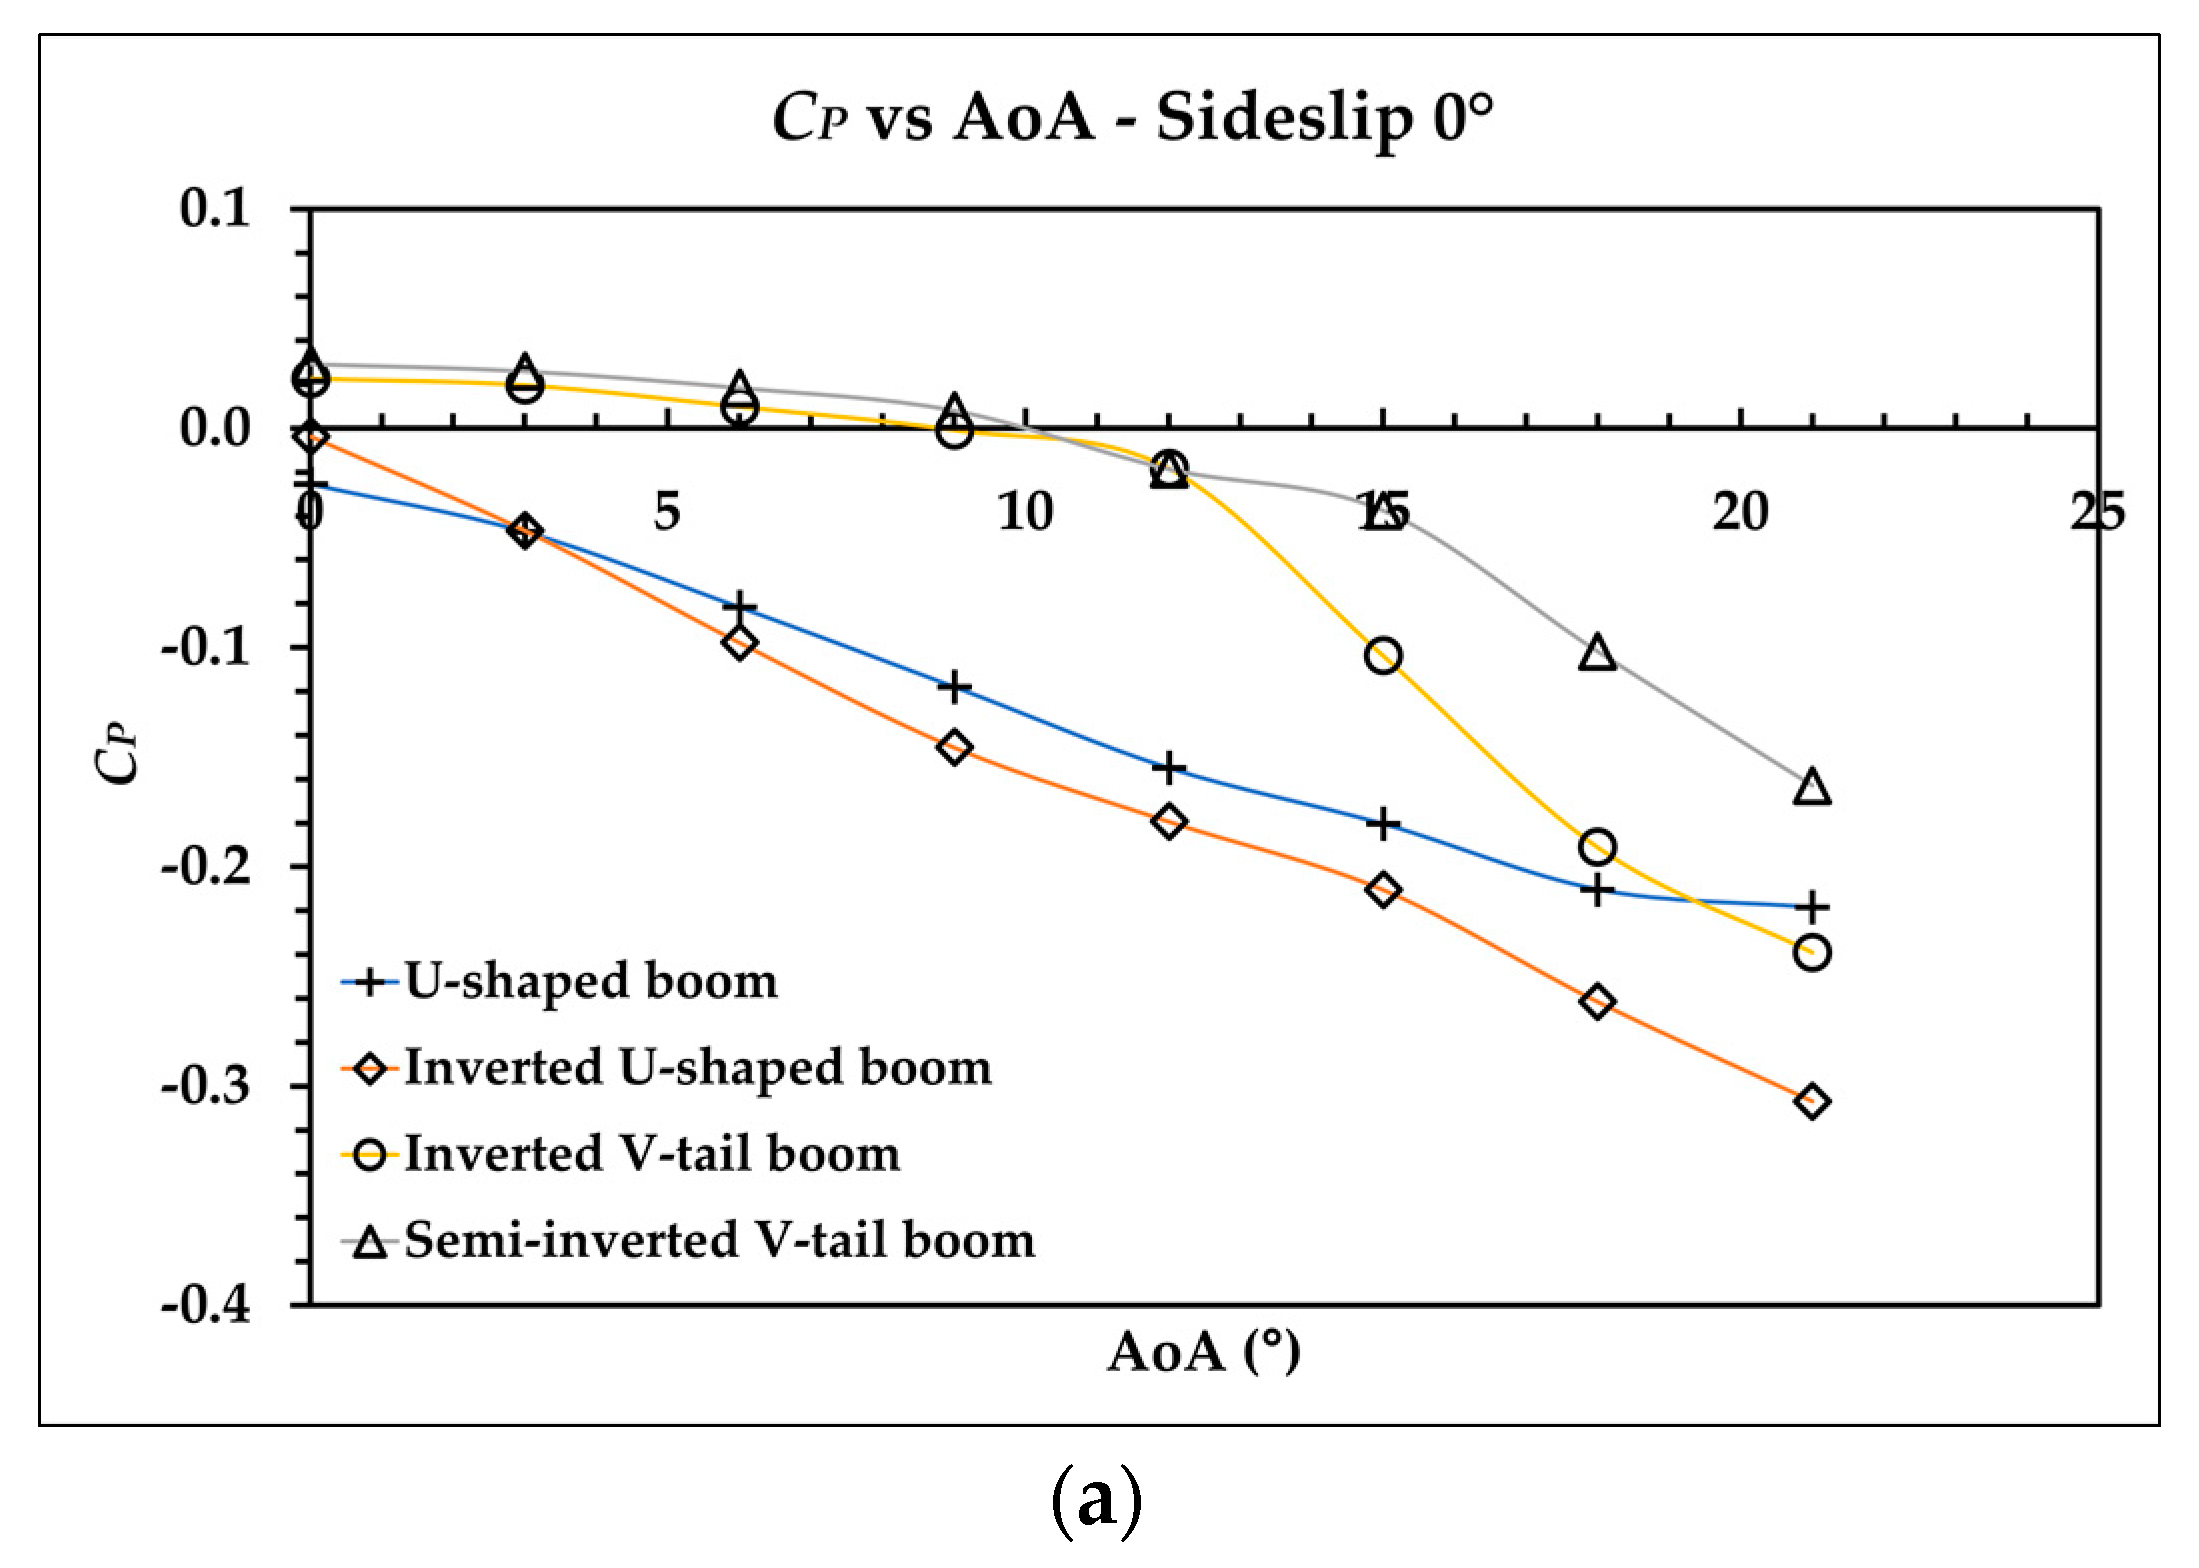
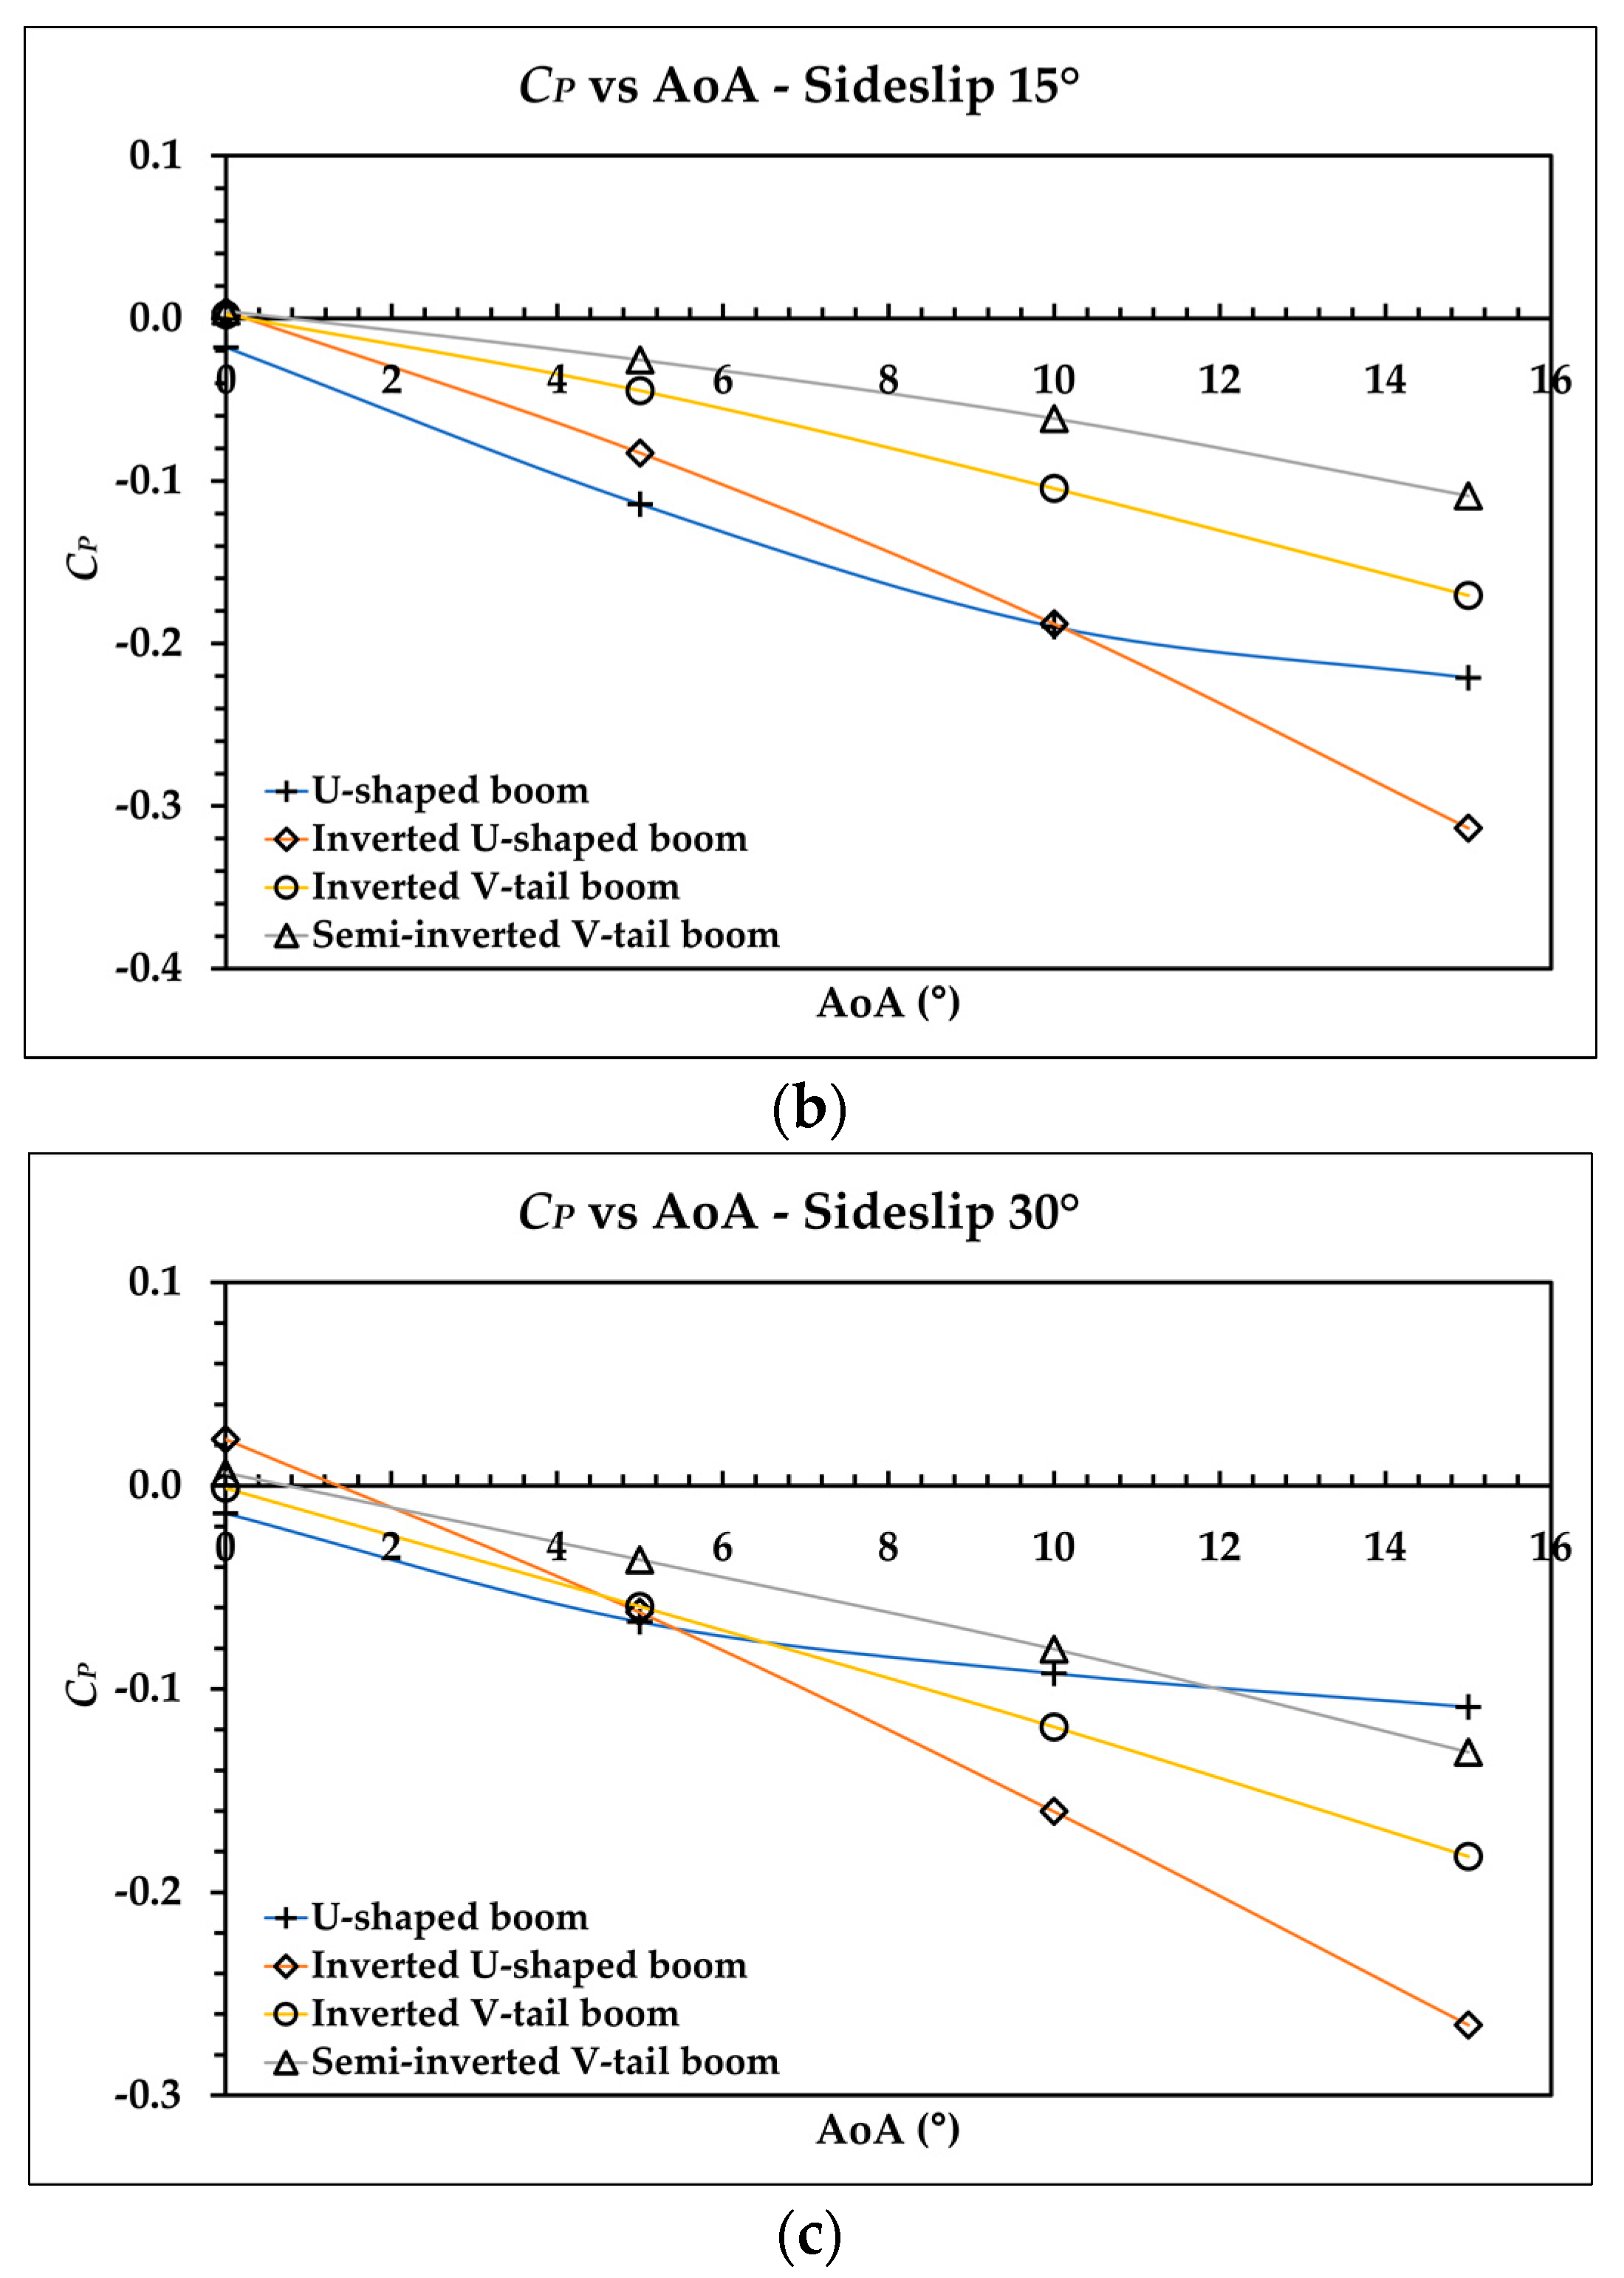
Aerospace 09 00208 g014
Figure 15. CP vs. AoA, sideslip angle: (a) 0°, (b) 15°, and (c) 30°.
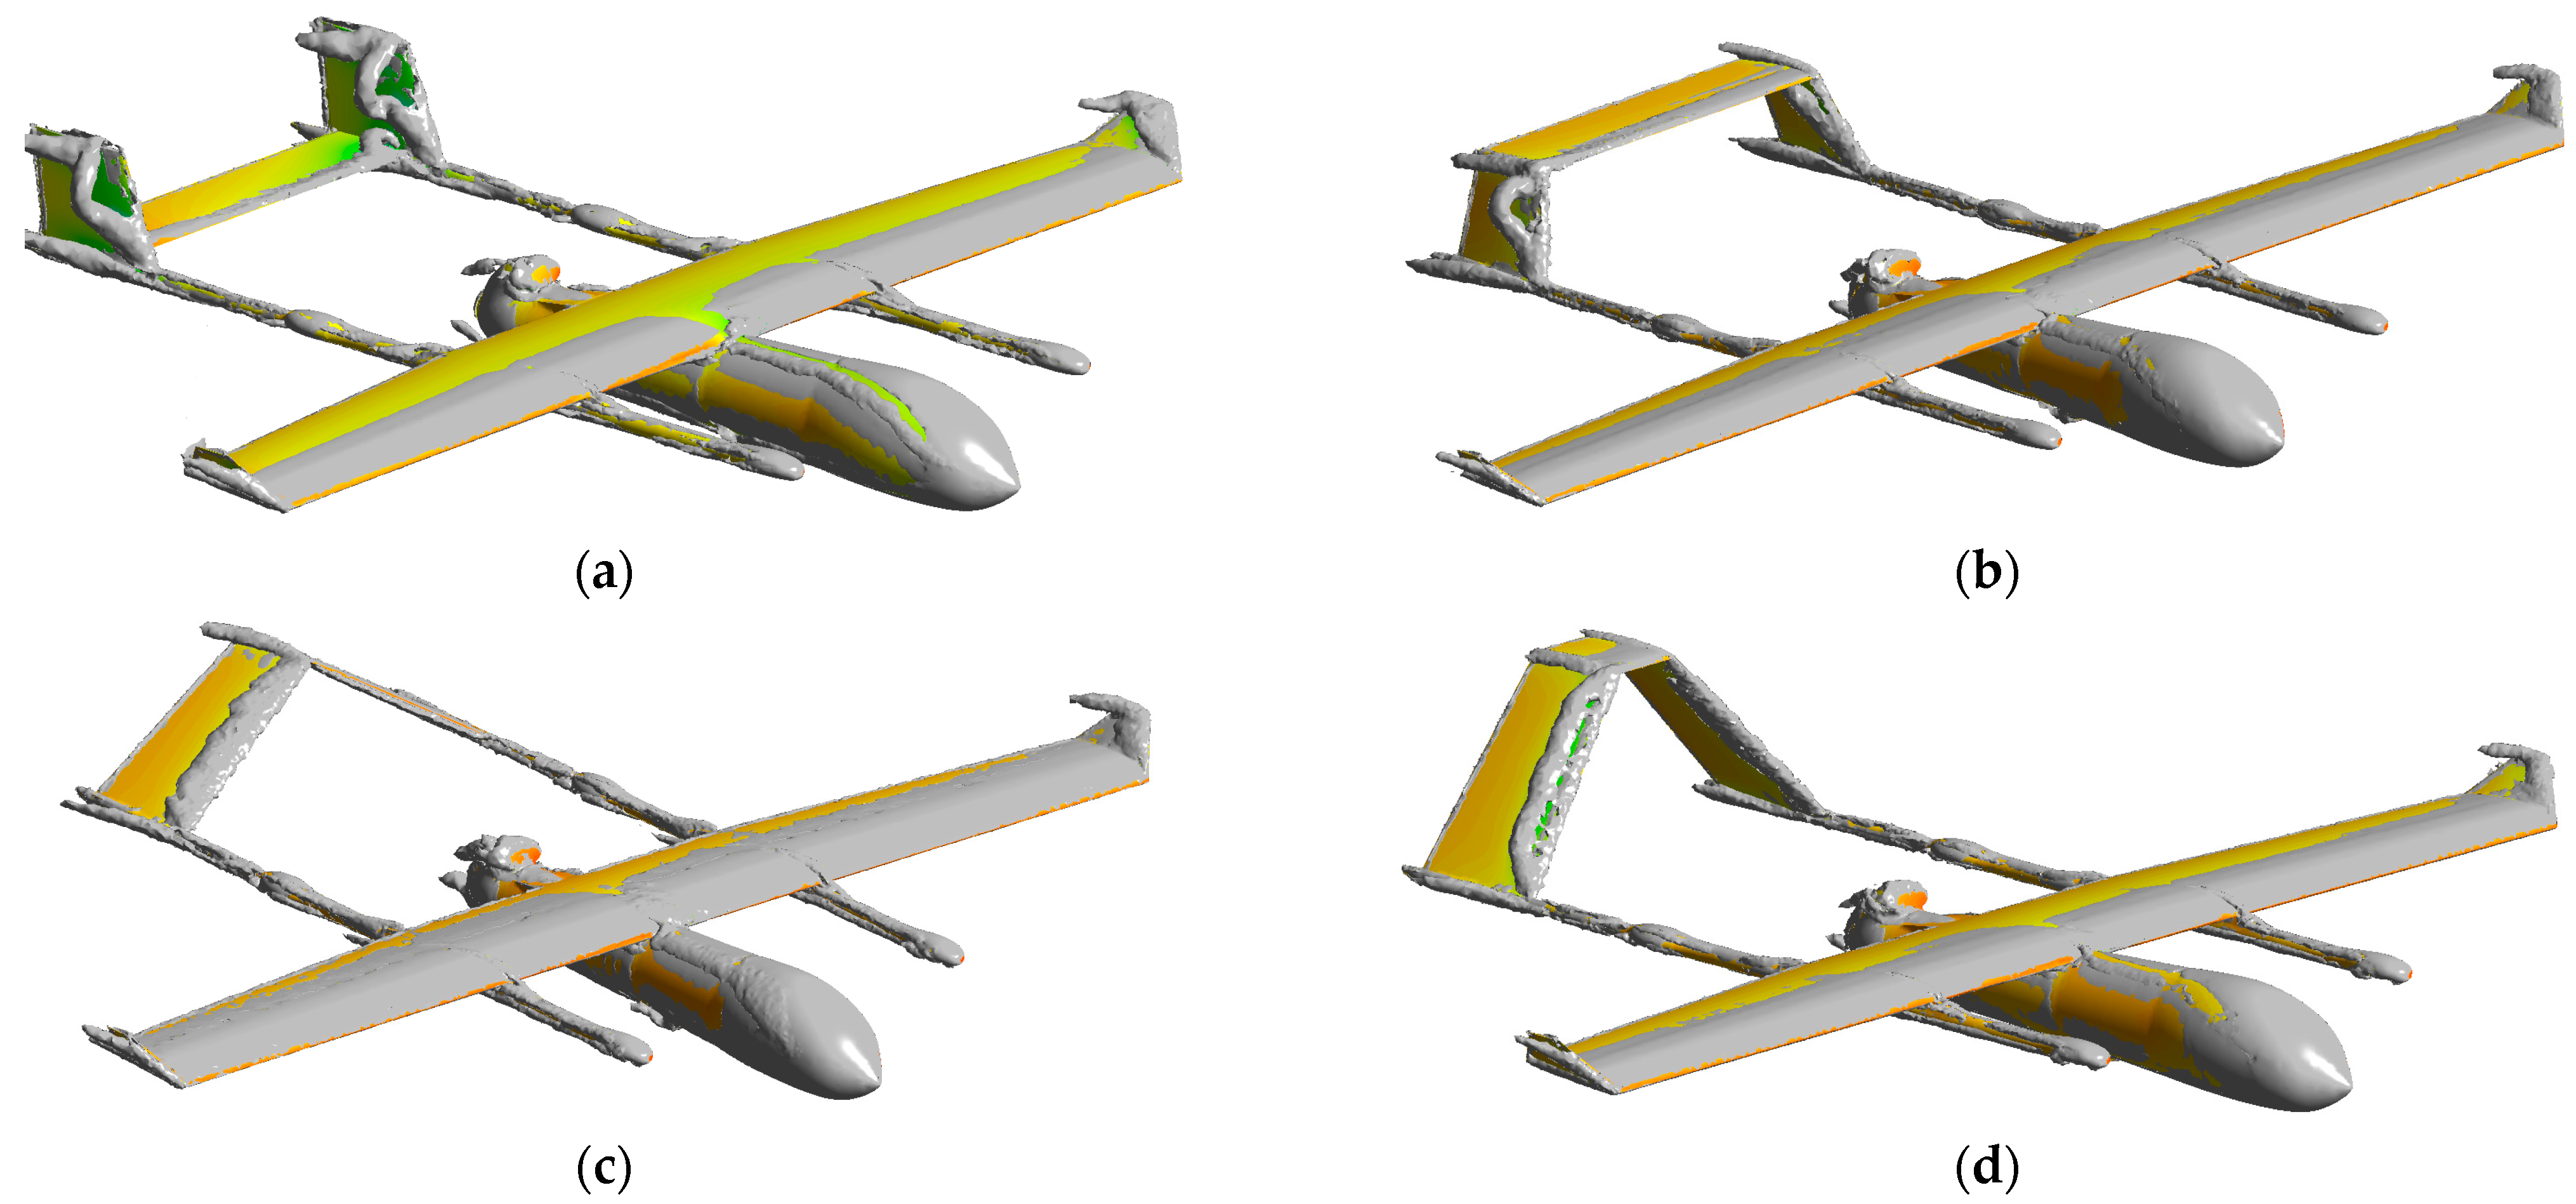
Aerospace 09 00208 g015aAerospace 09 00208 g015b
Figure 16. Vortex of the aircraft on a sideslip angle of 30° and AoA of 5°; (a) U-shaped boom, (b) Inverted U-shaped boom, (c) inverted V-tail boom, and (d) semi-inverted V-tail boom.
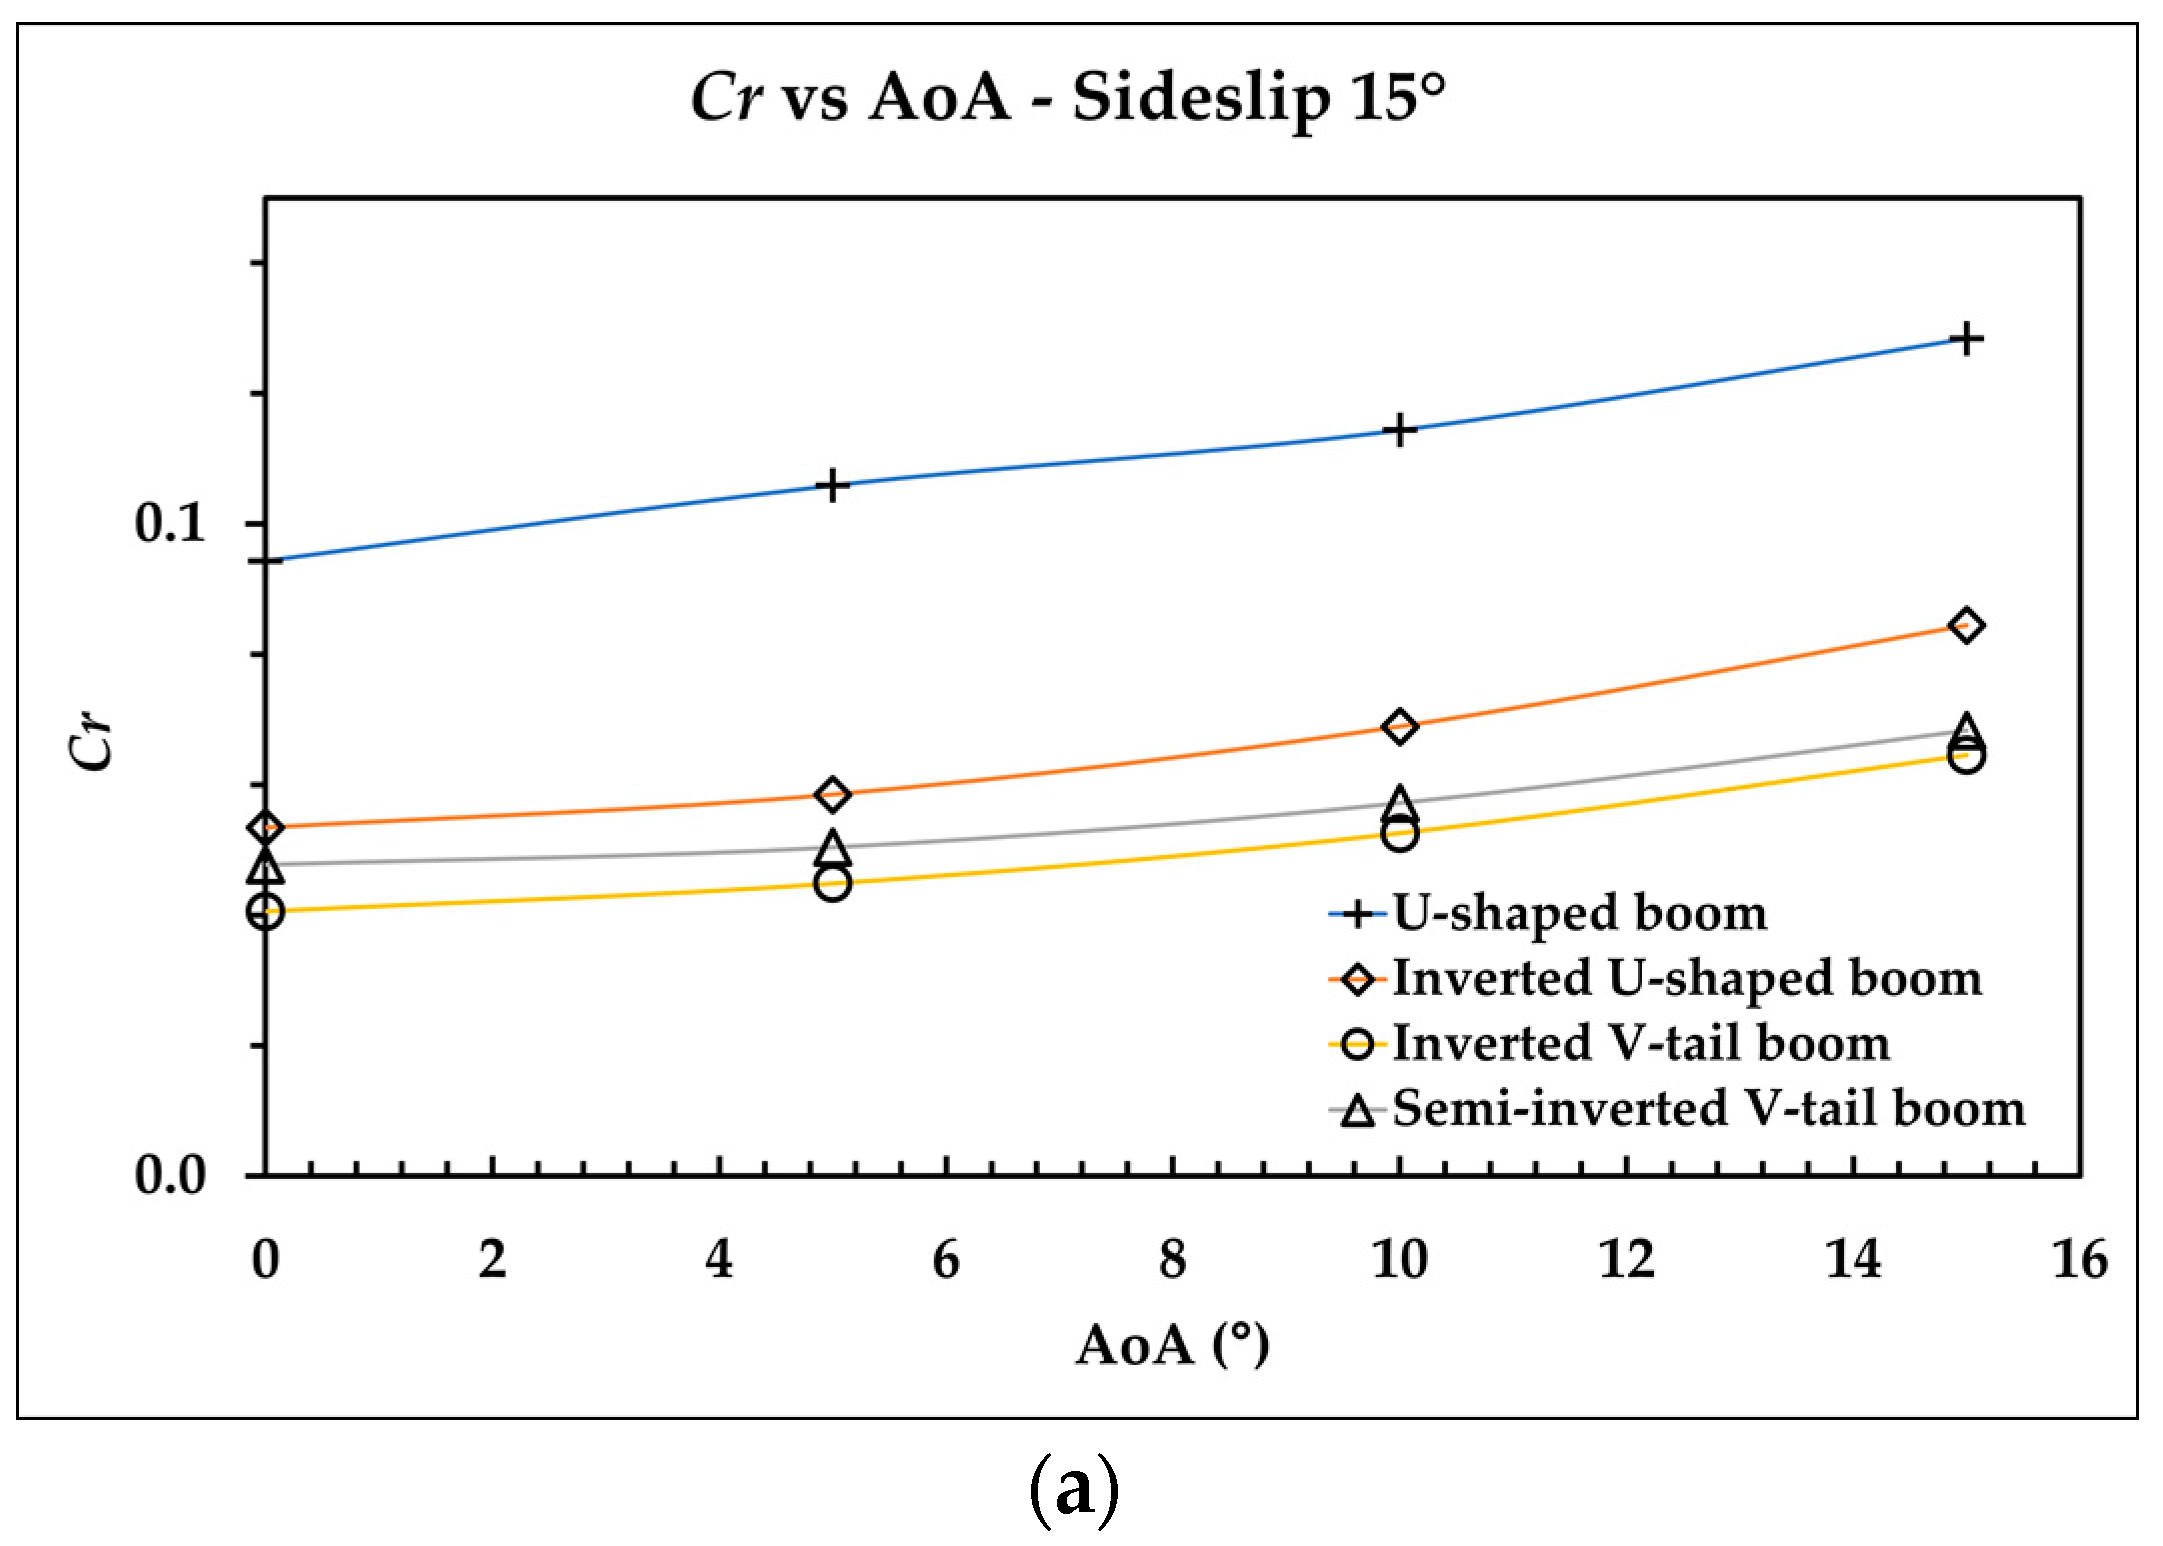
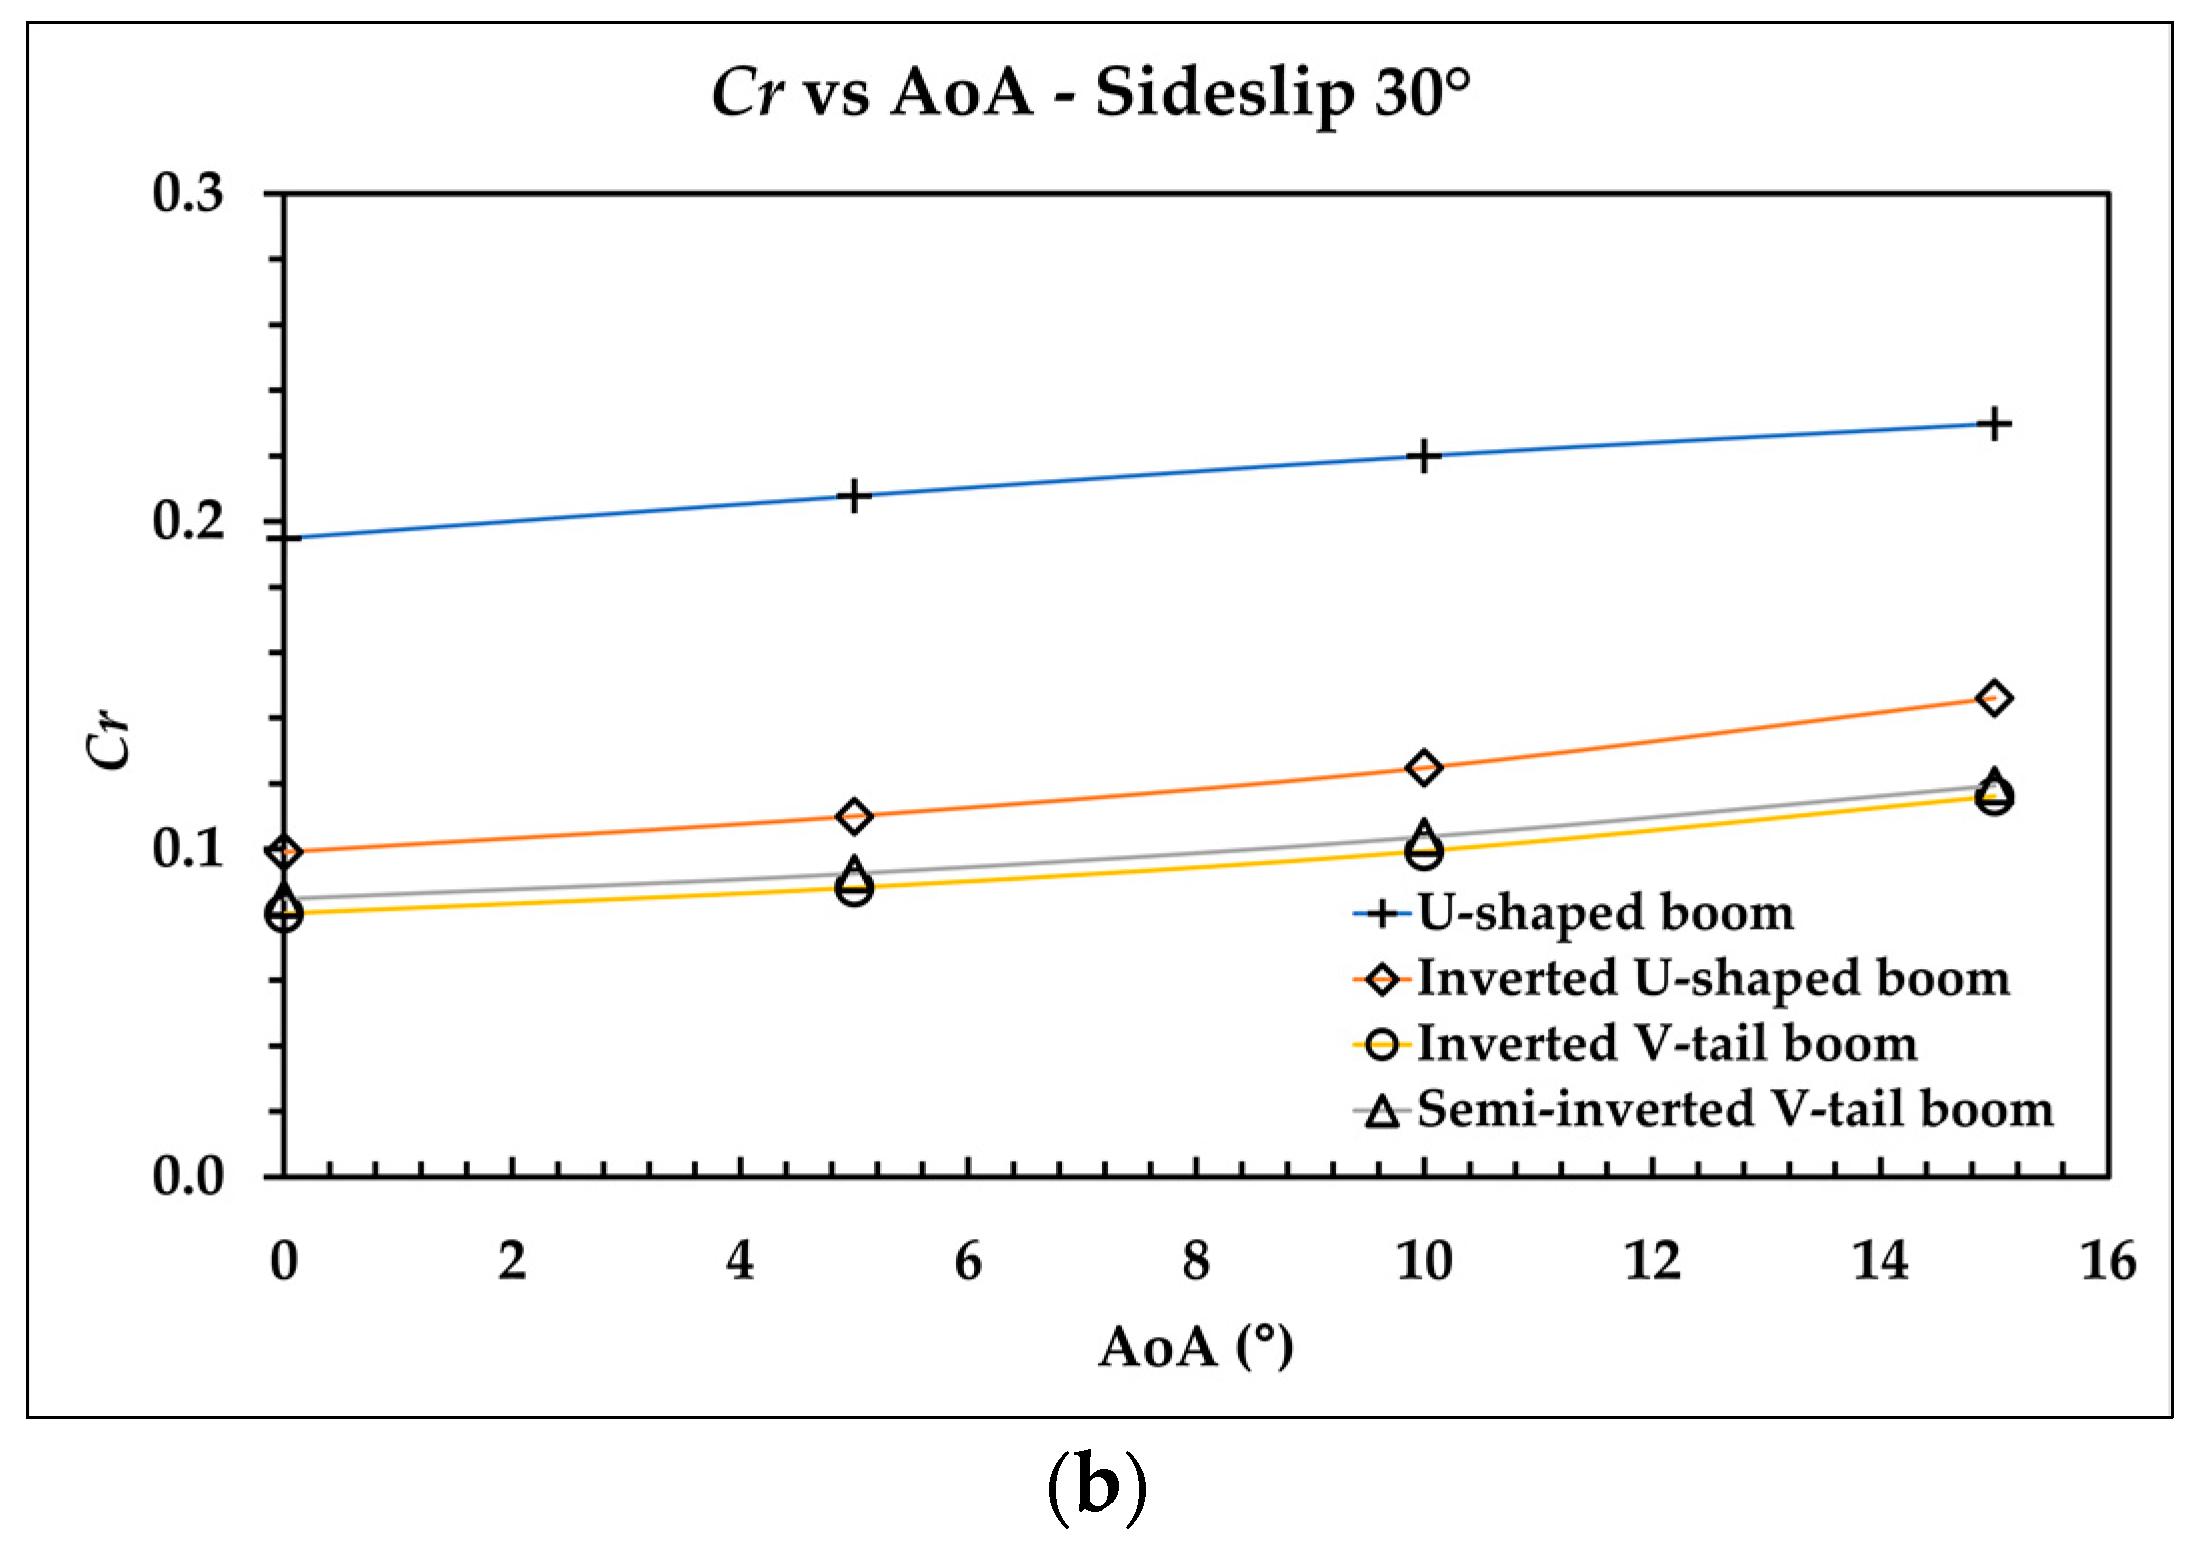
Aerospace 09 00208 g016
Figure 17. Cr vs. AoA, sideslip angle: (a) 15° and (b) 30°.
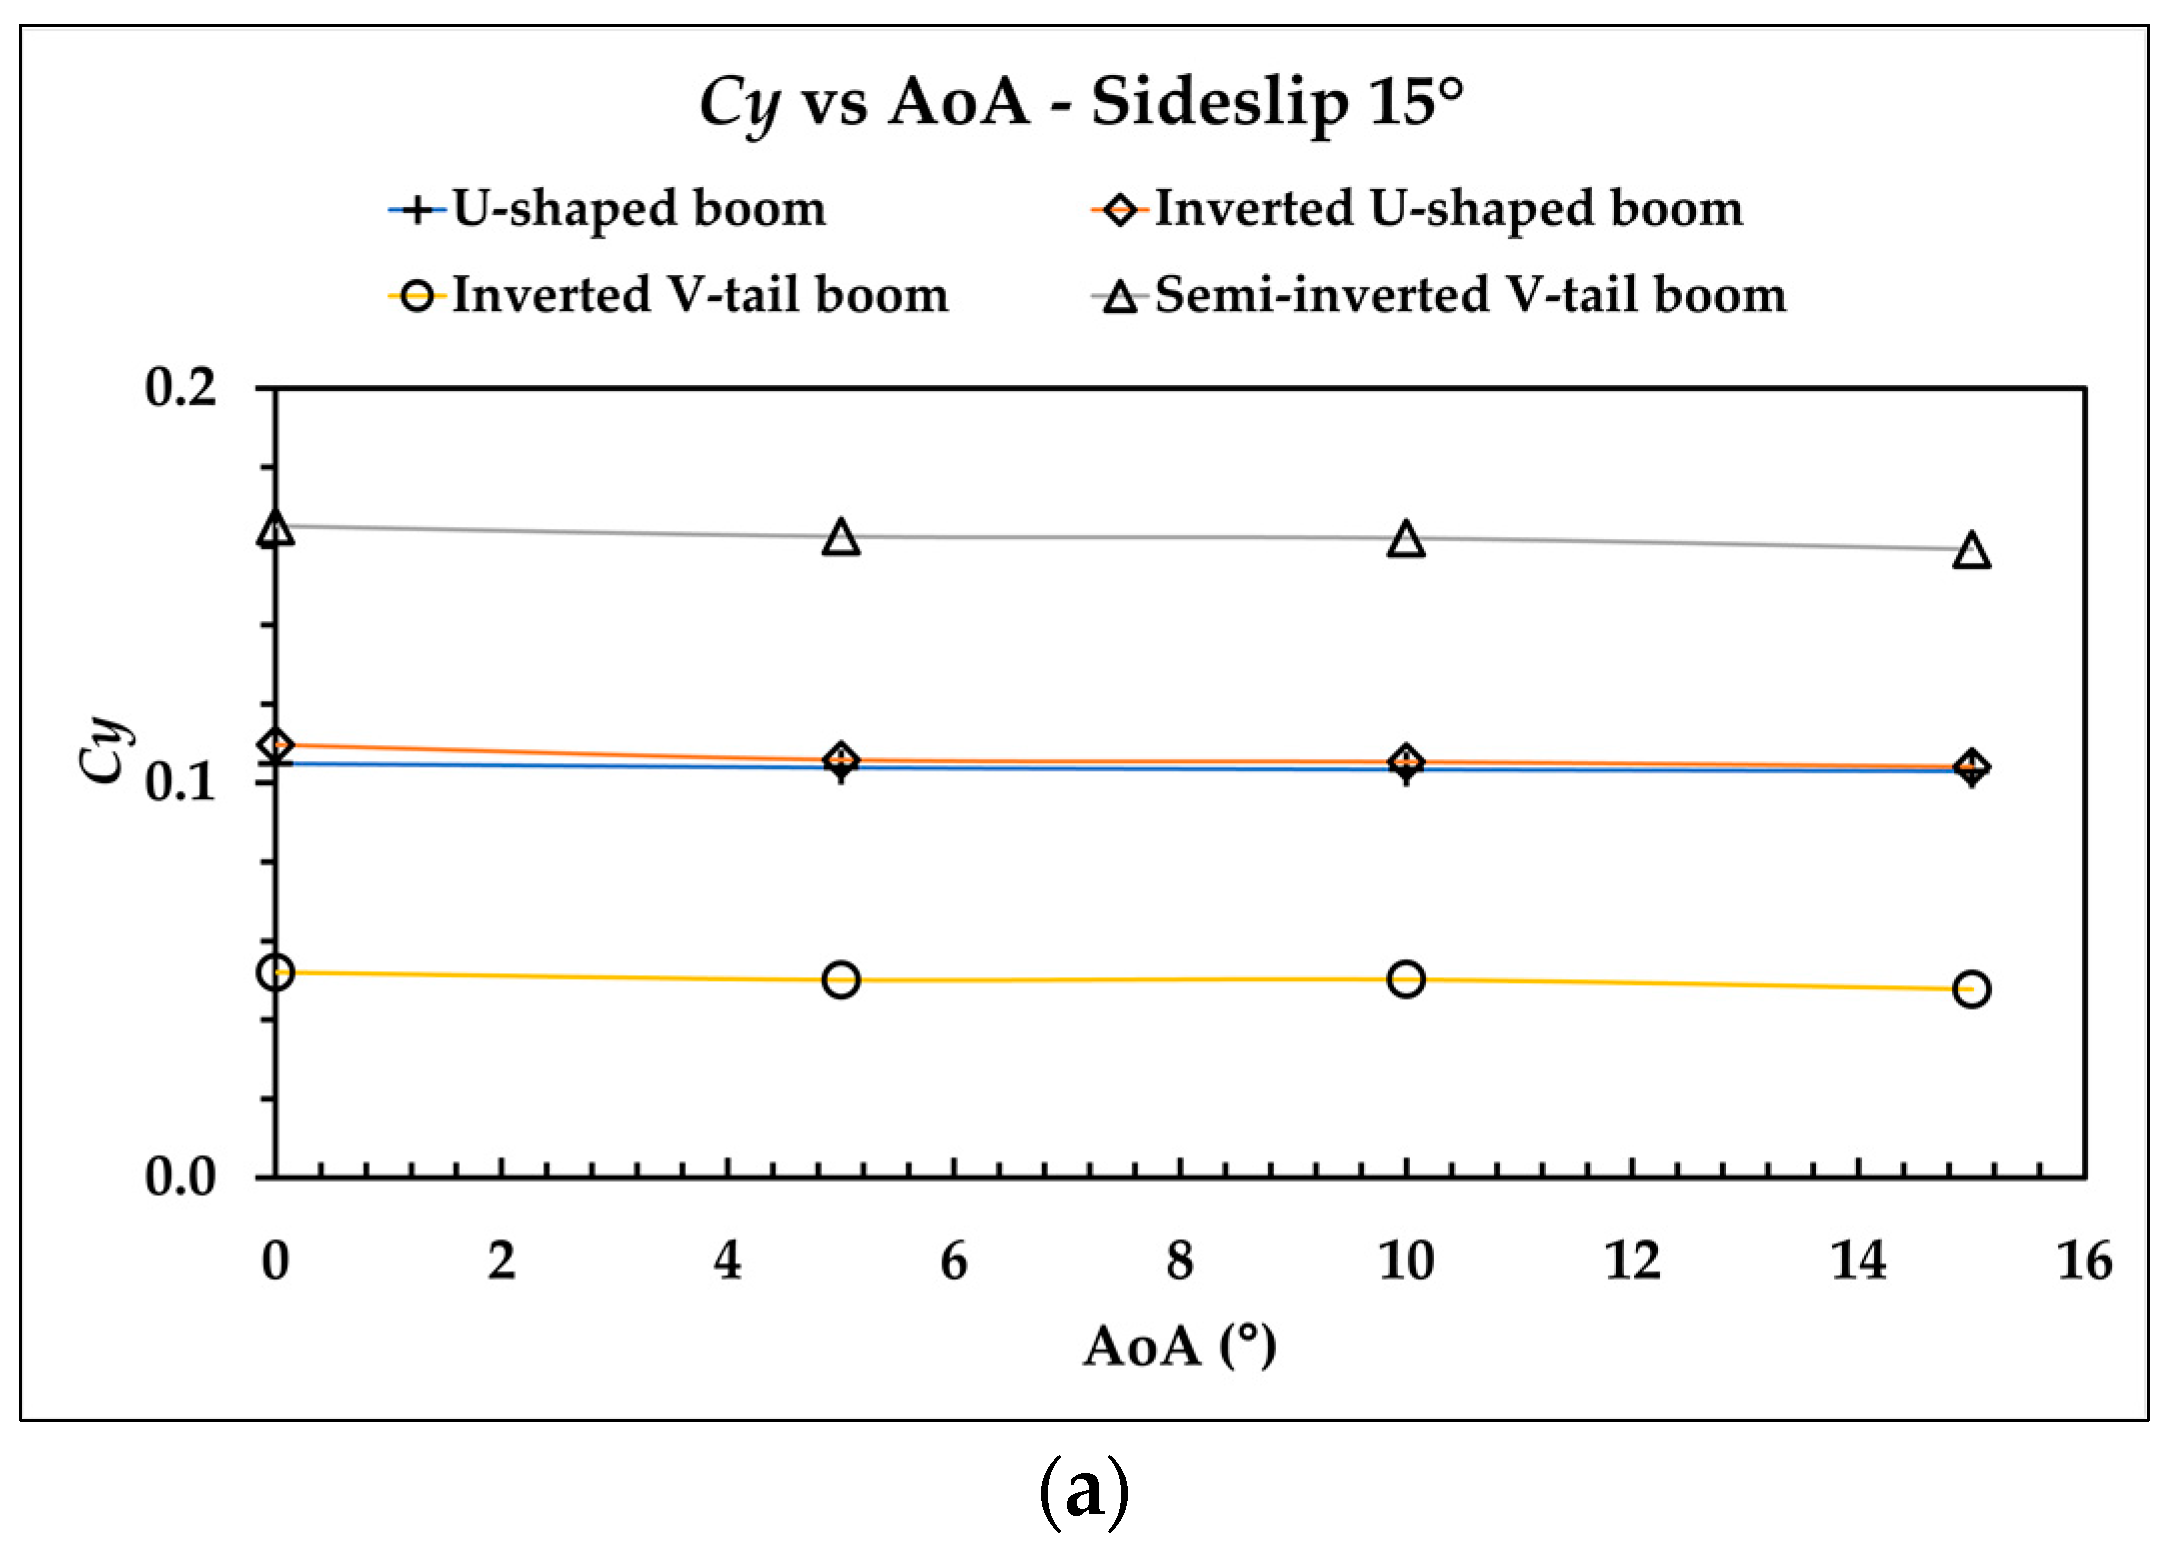
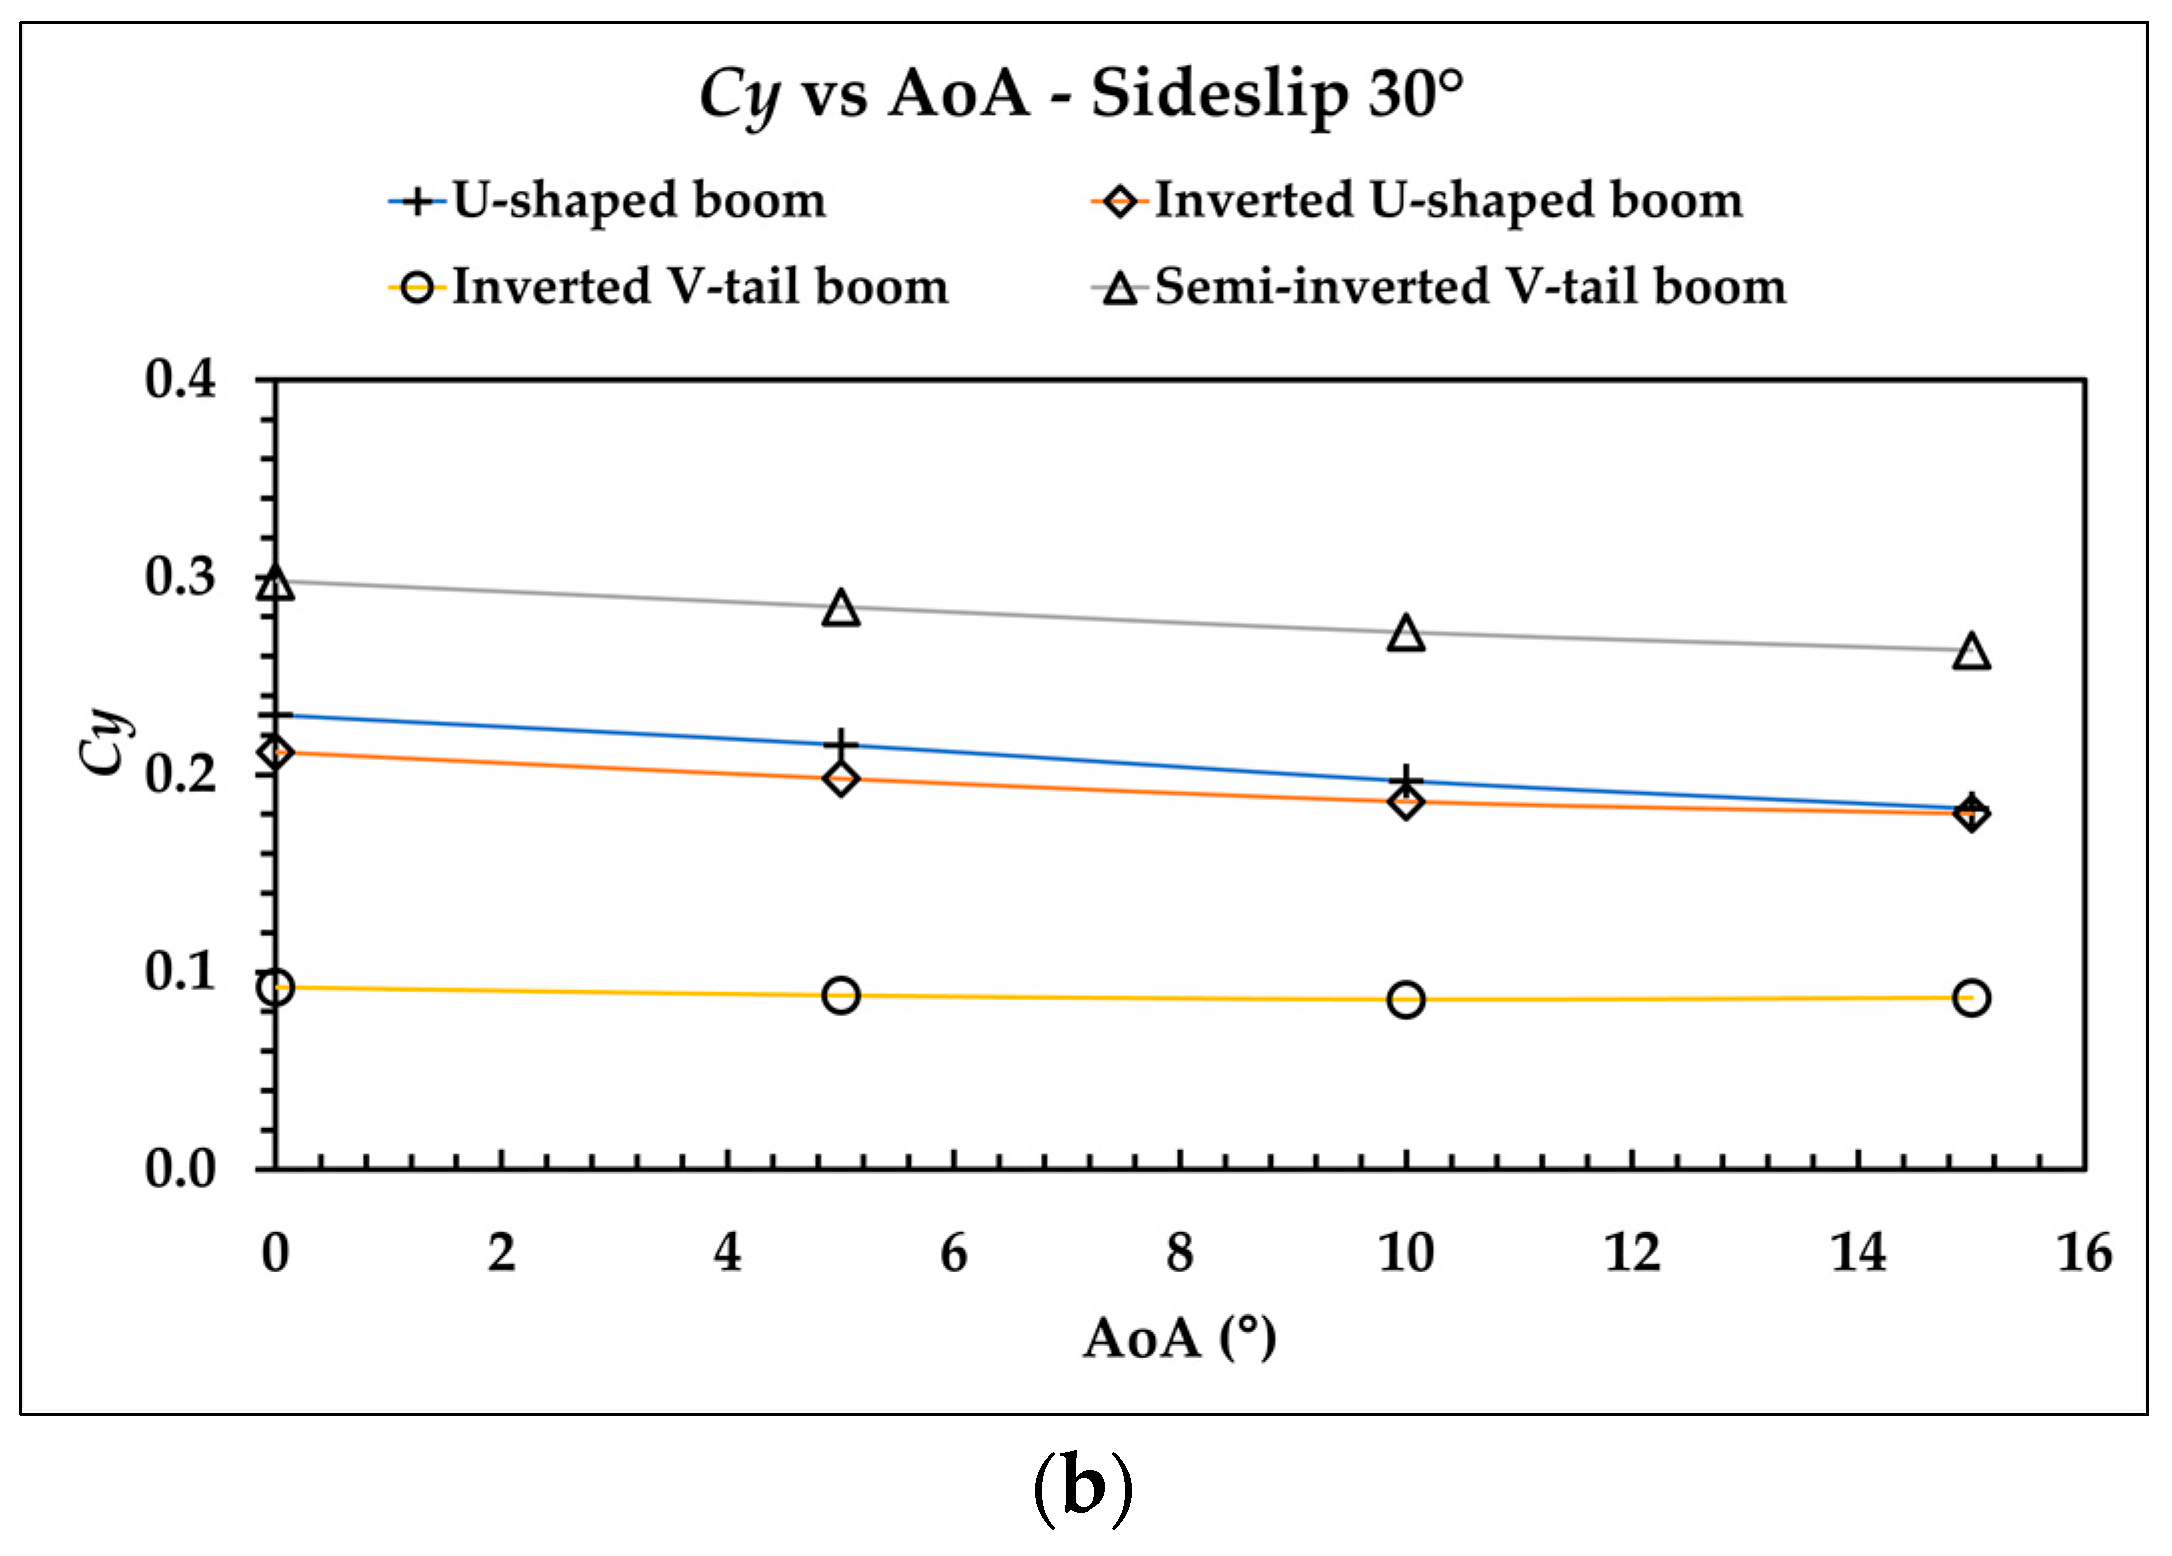
Aerospace 09 00208 g017aAerospace 09 00208 g017b
Figure 18. Cy vs. AoA, sideslip angle: (a) 15° and (b) 30°.
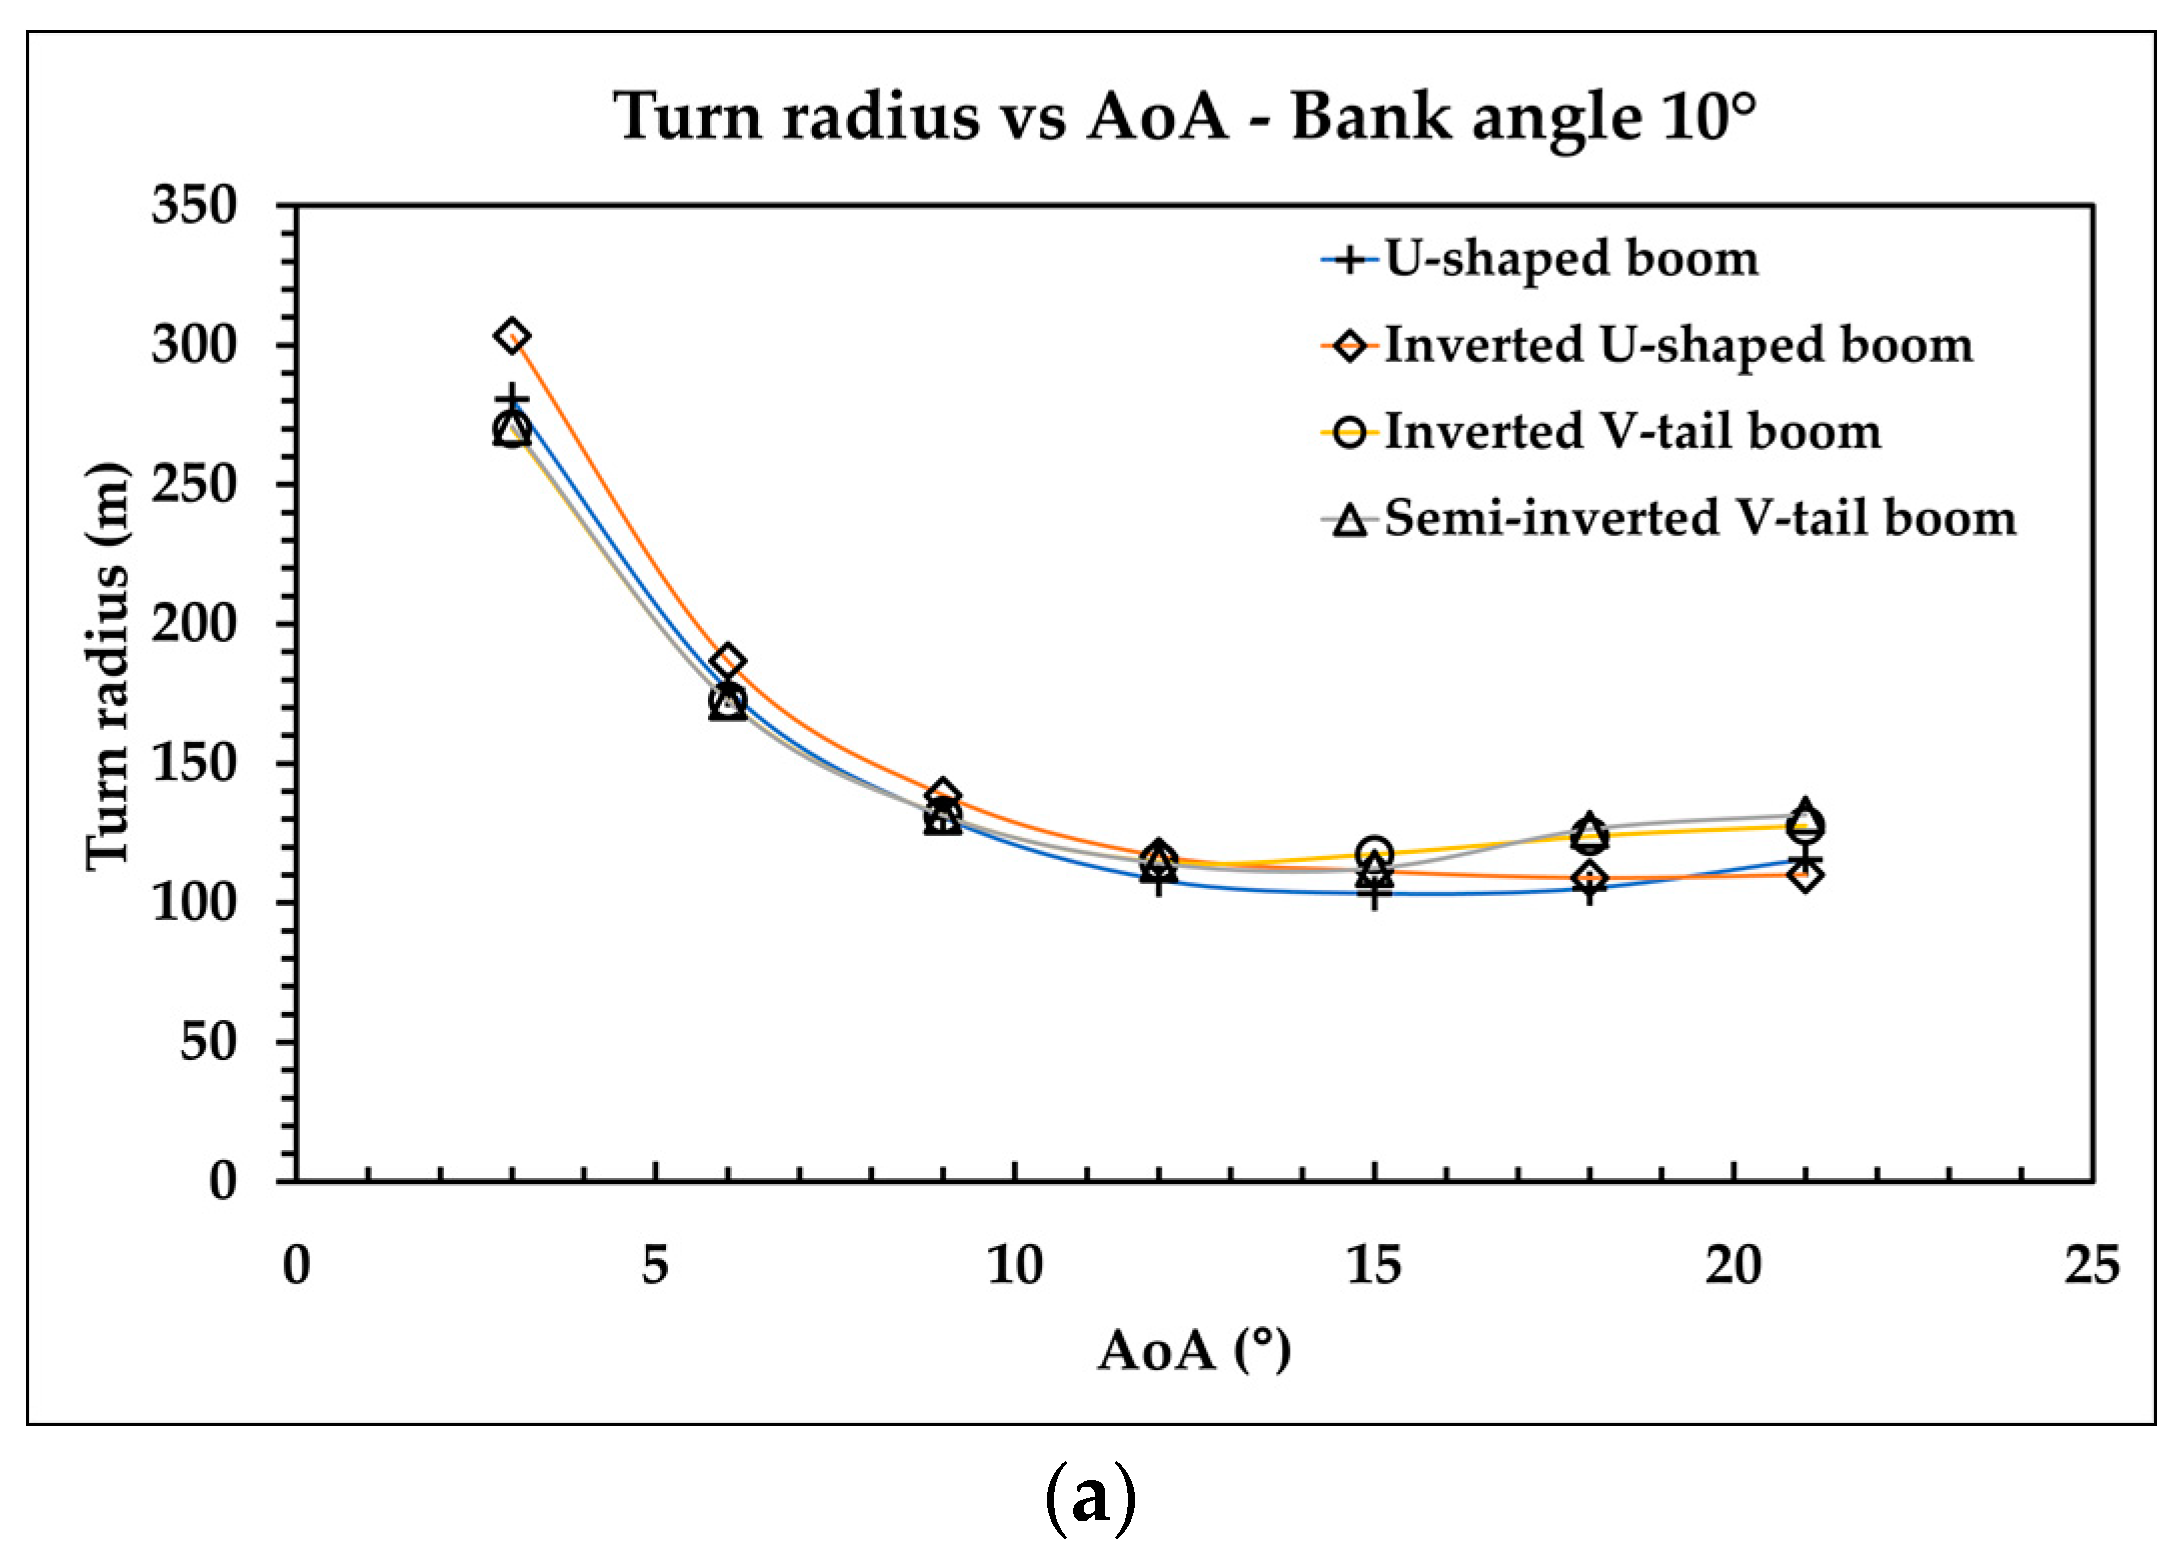
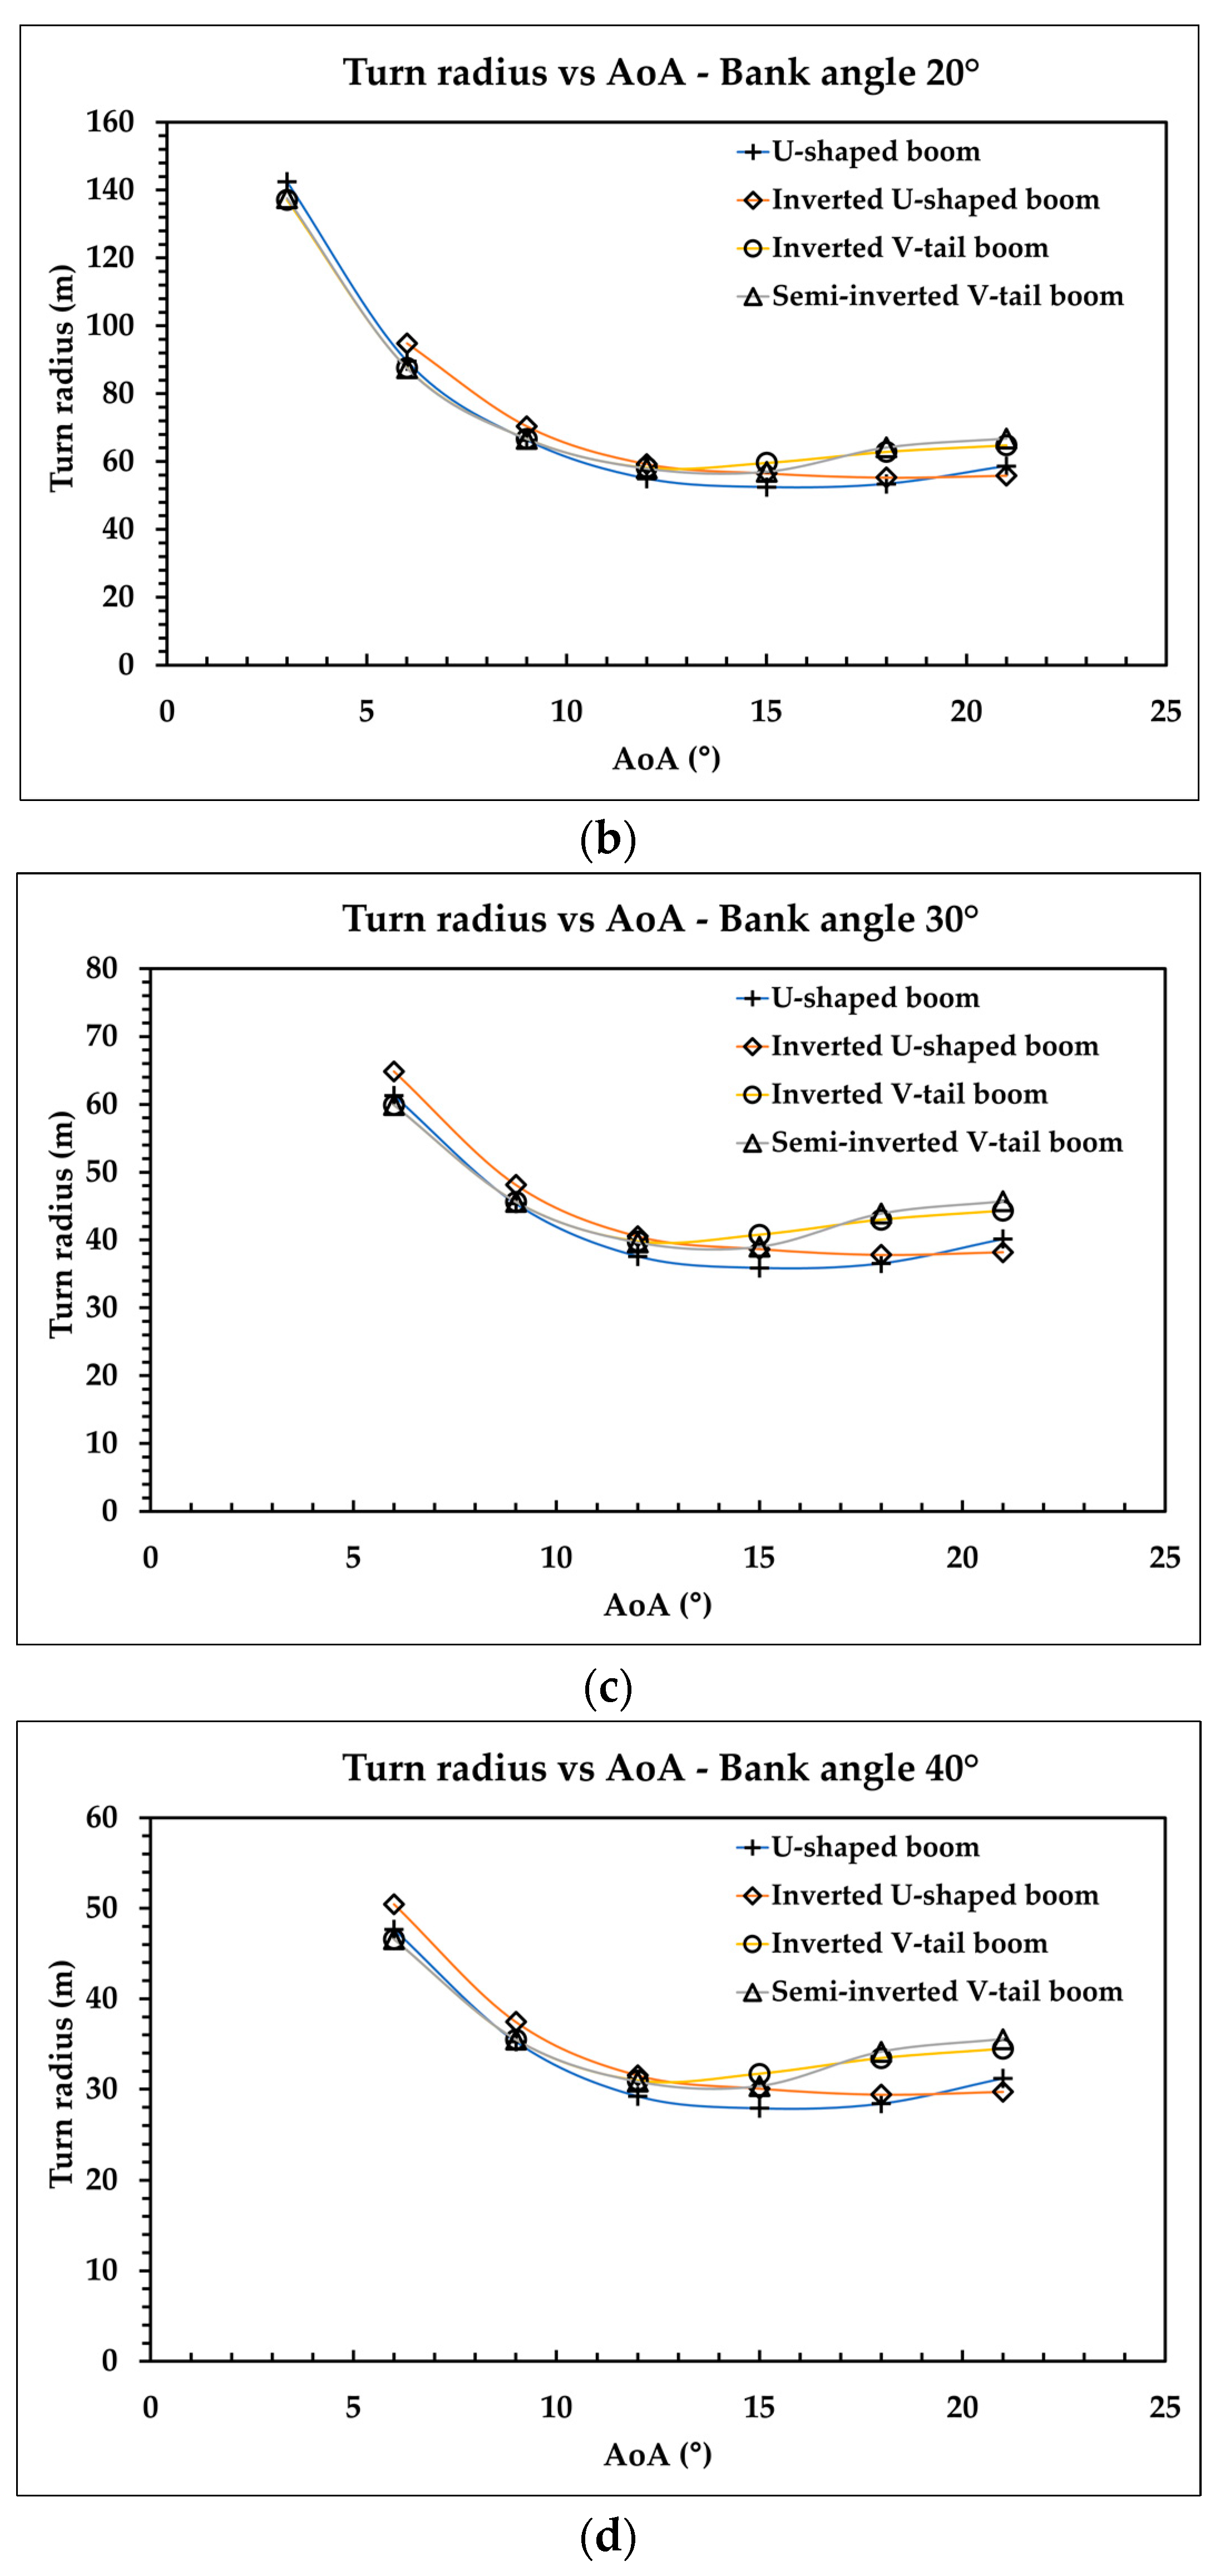
Aerospace 09 00208 g018aAerospace 09 00208 g018b
Figure 19. Maneuverability vs. AoA on headwind conditions, bank angle: (a) 10°, (b) 20°, (c) 30°, and (d) 40°.
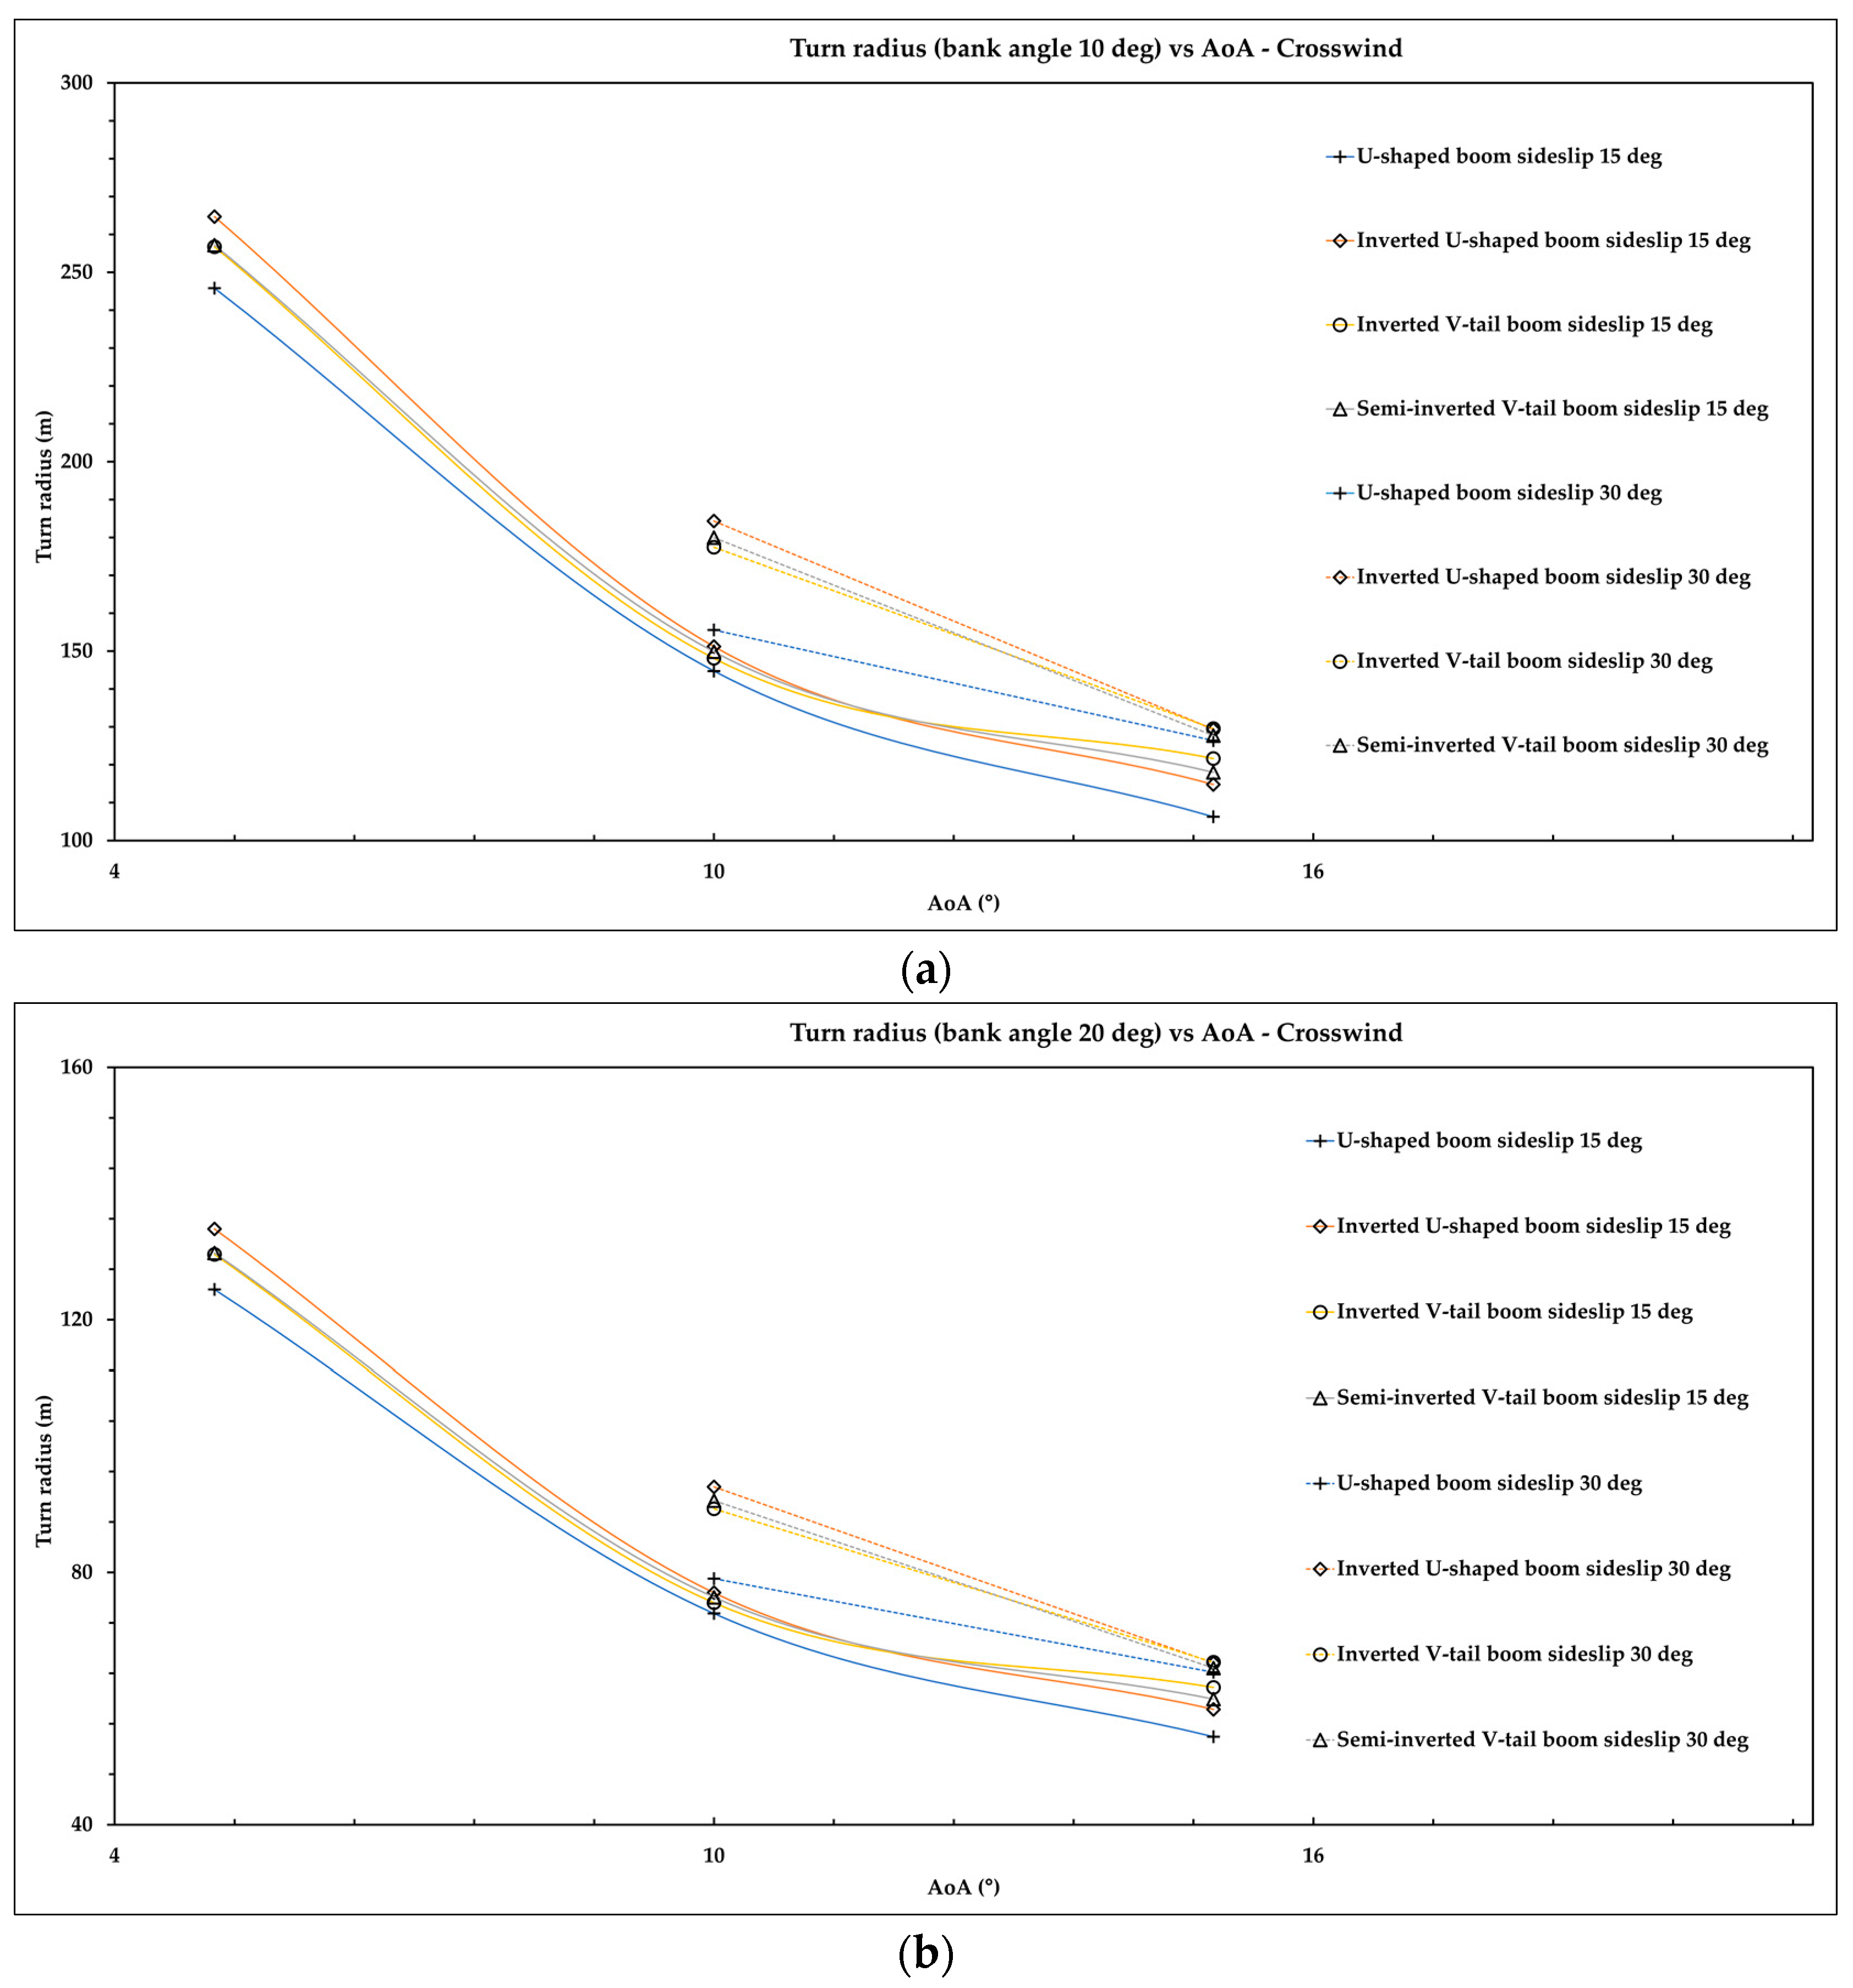
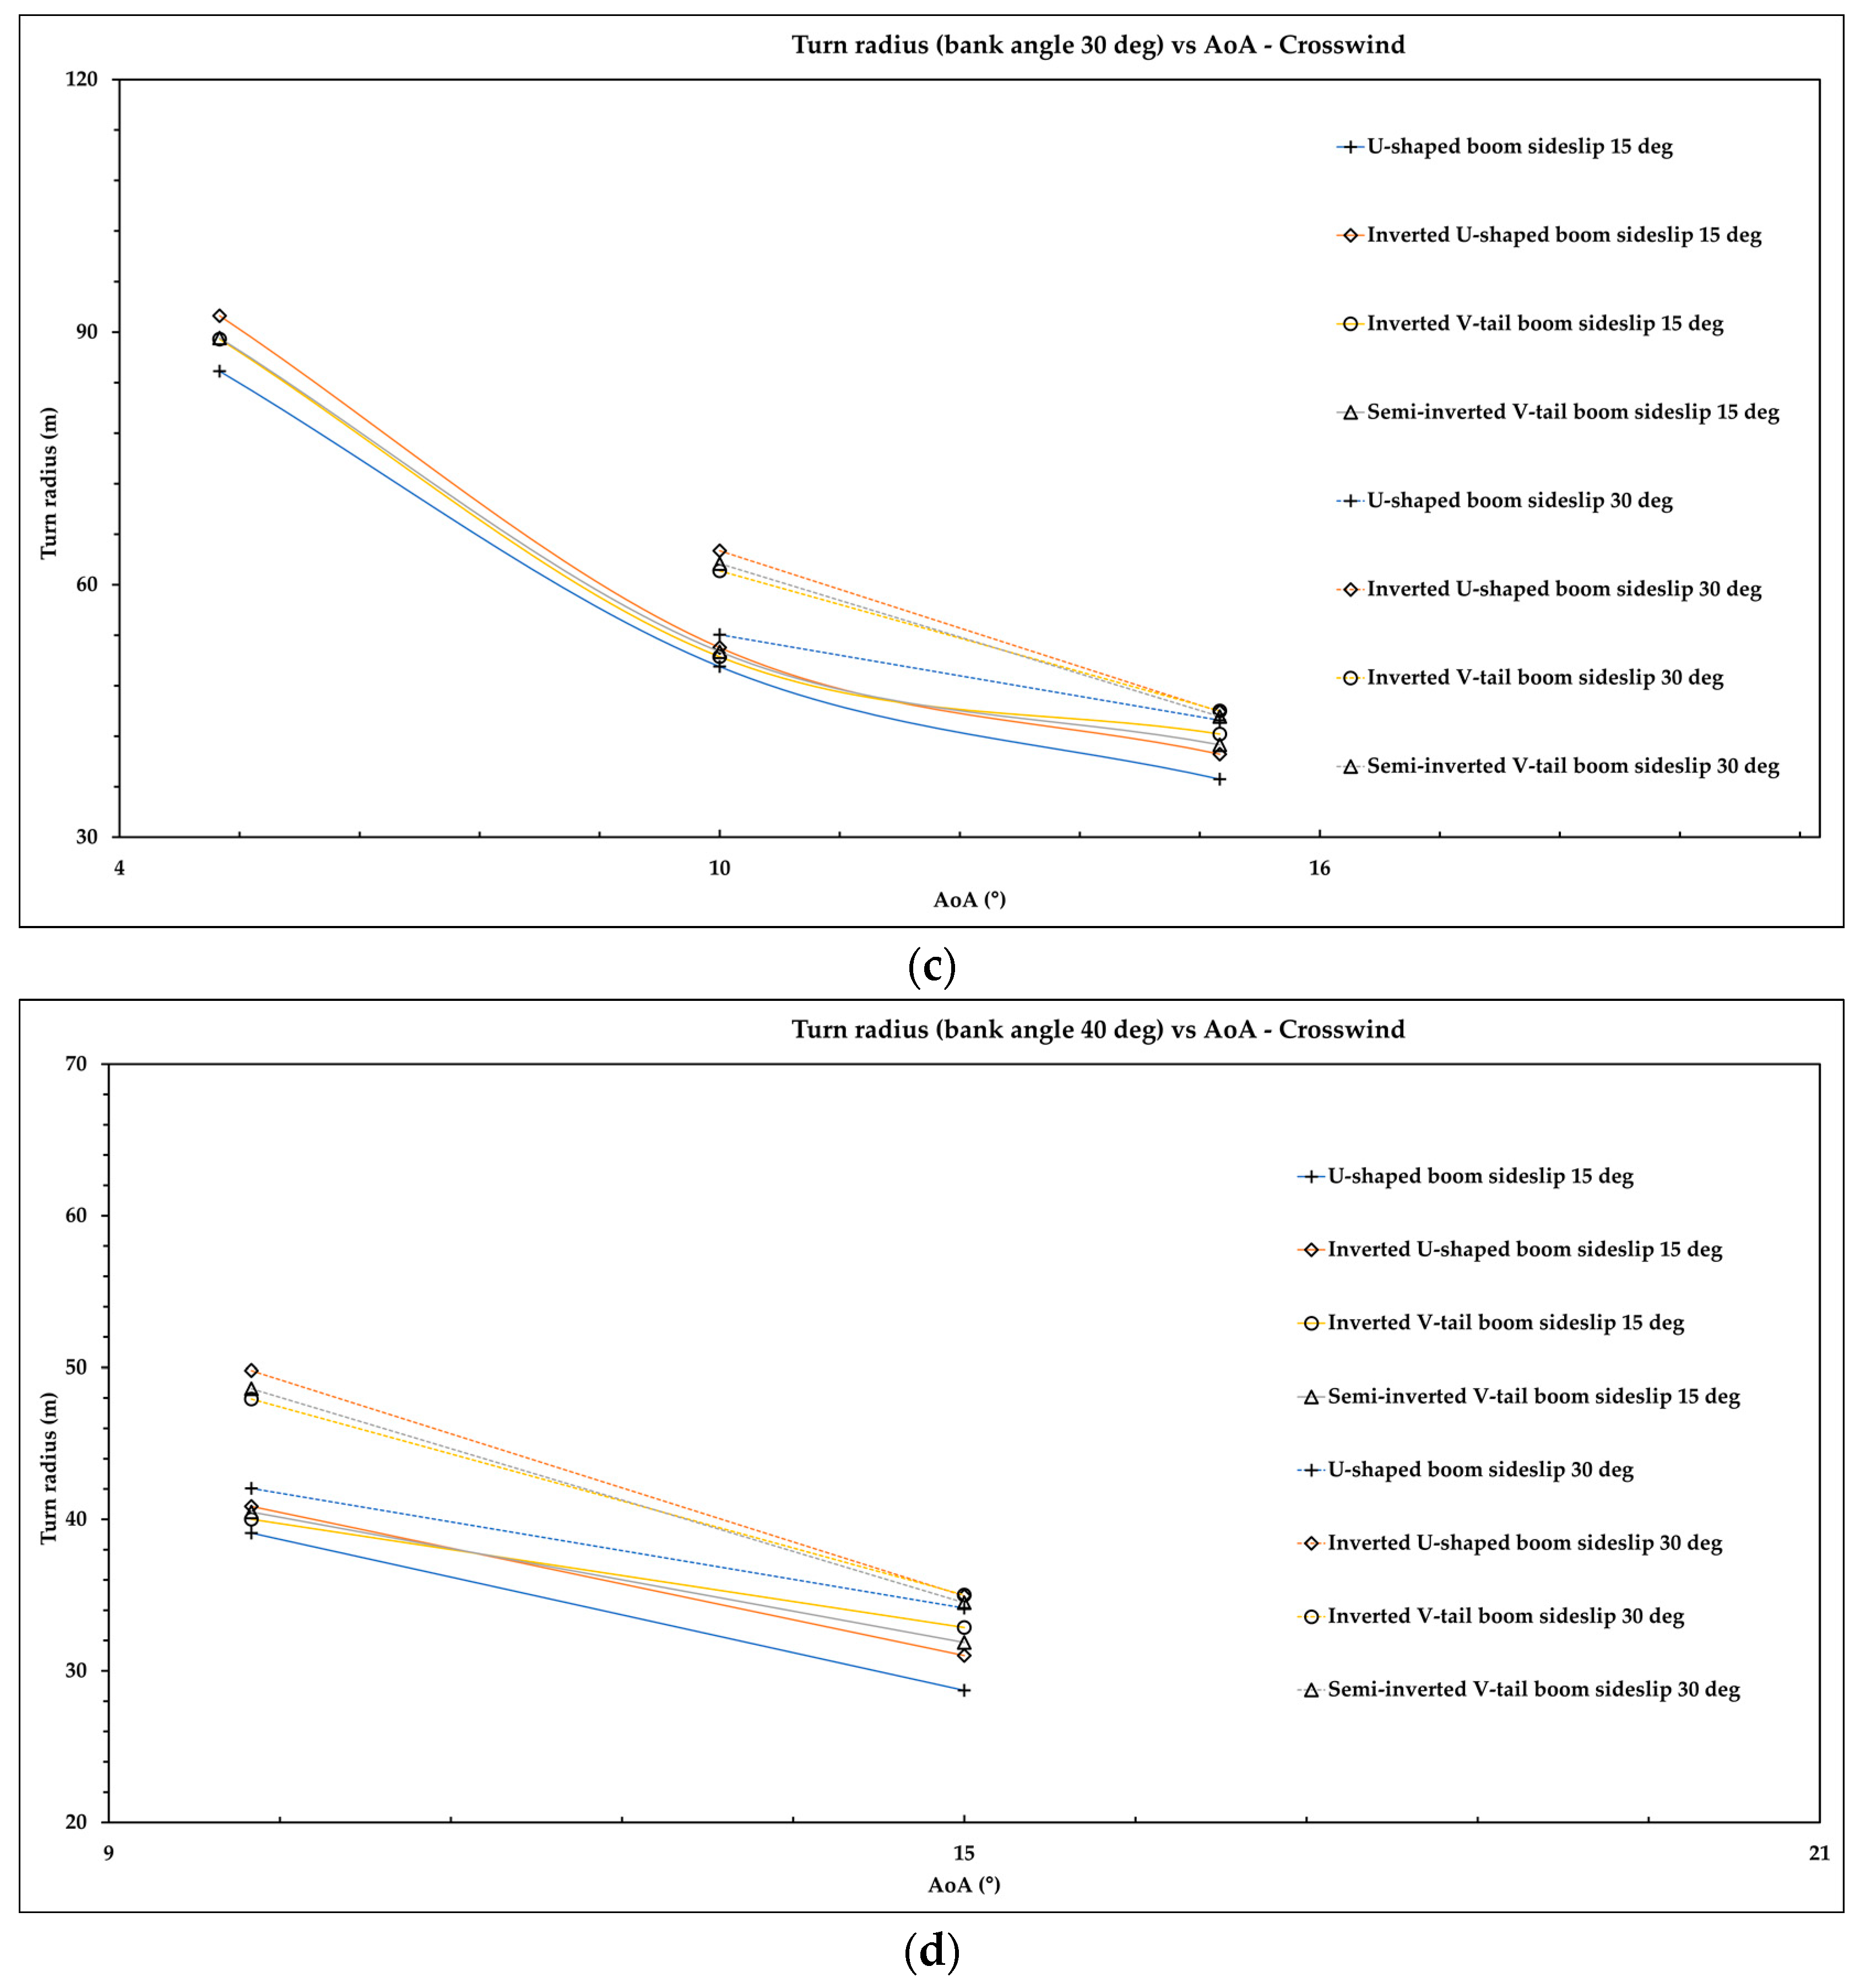
Aerospace 09 00208 g019aAerospace 09 00208 g019b
Figure 20. Maneuverability in crosswind conditions, bank angle: (a) 10°, (b) 20°, (c) 30°, and (d) 40°.
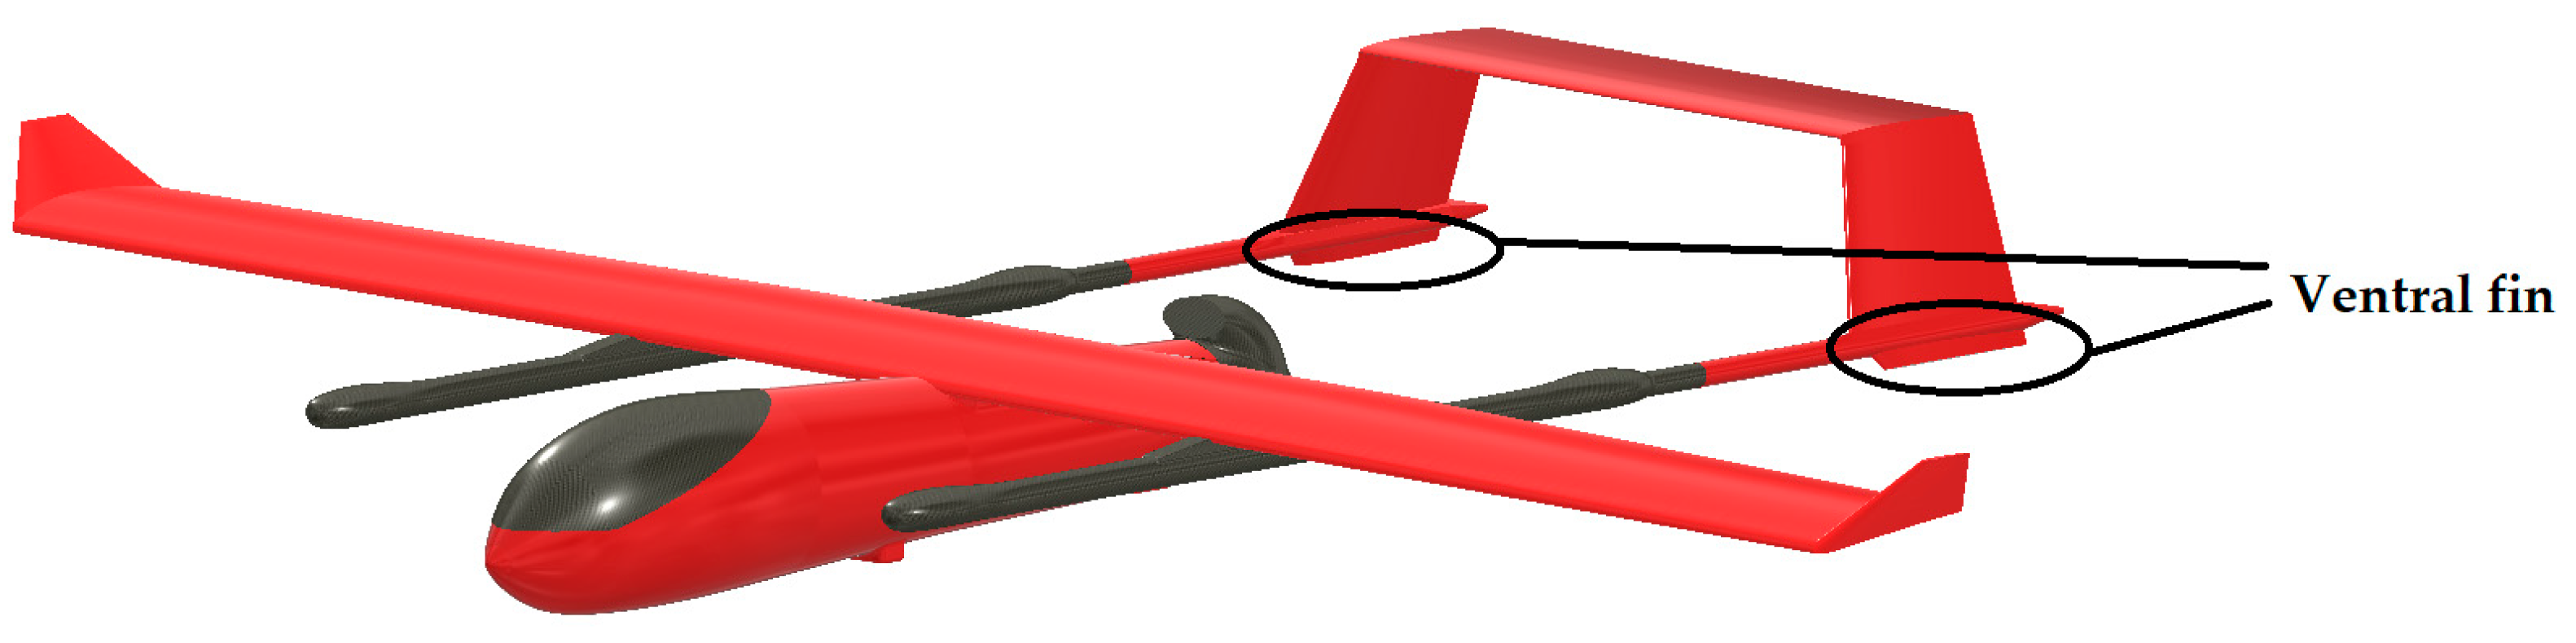
Aerospace 09 00208 g020aAerospace 09 00208 g020b
Figure 21. Ventral fin added to improve aerodynamics performance.
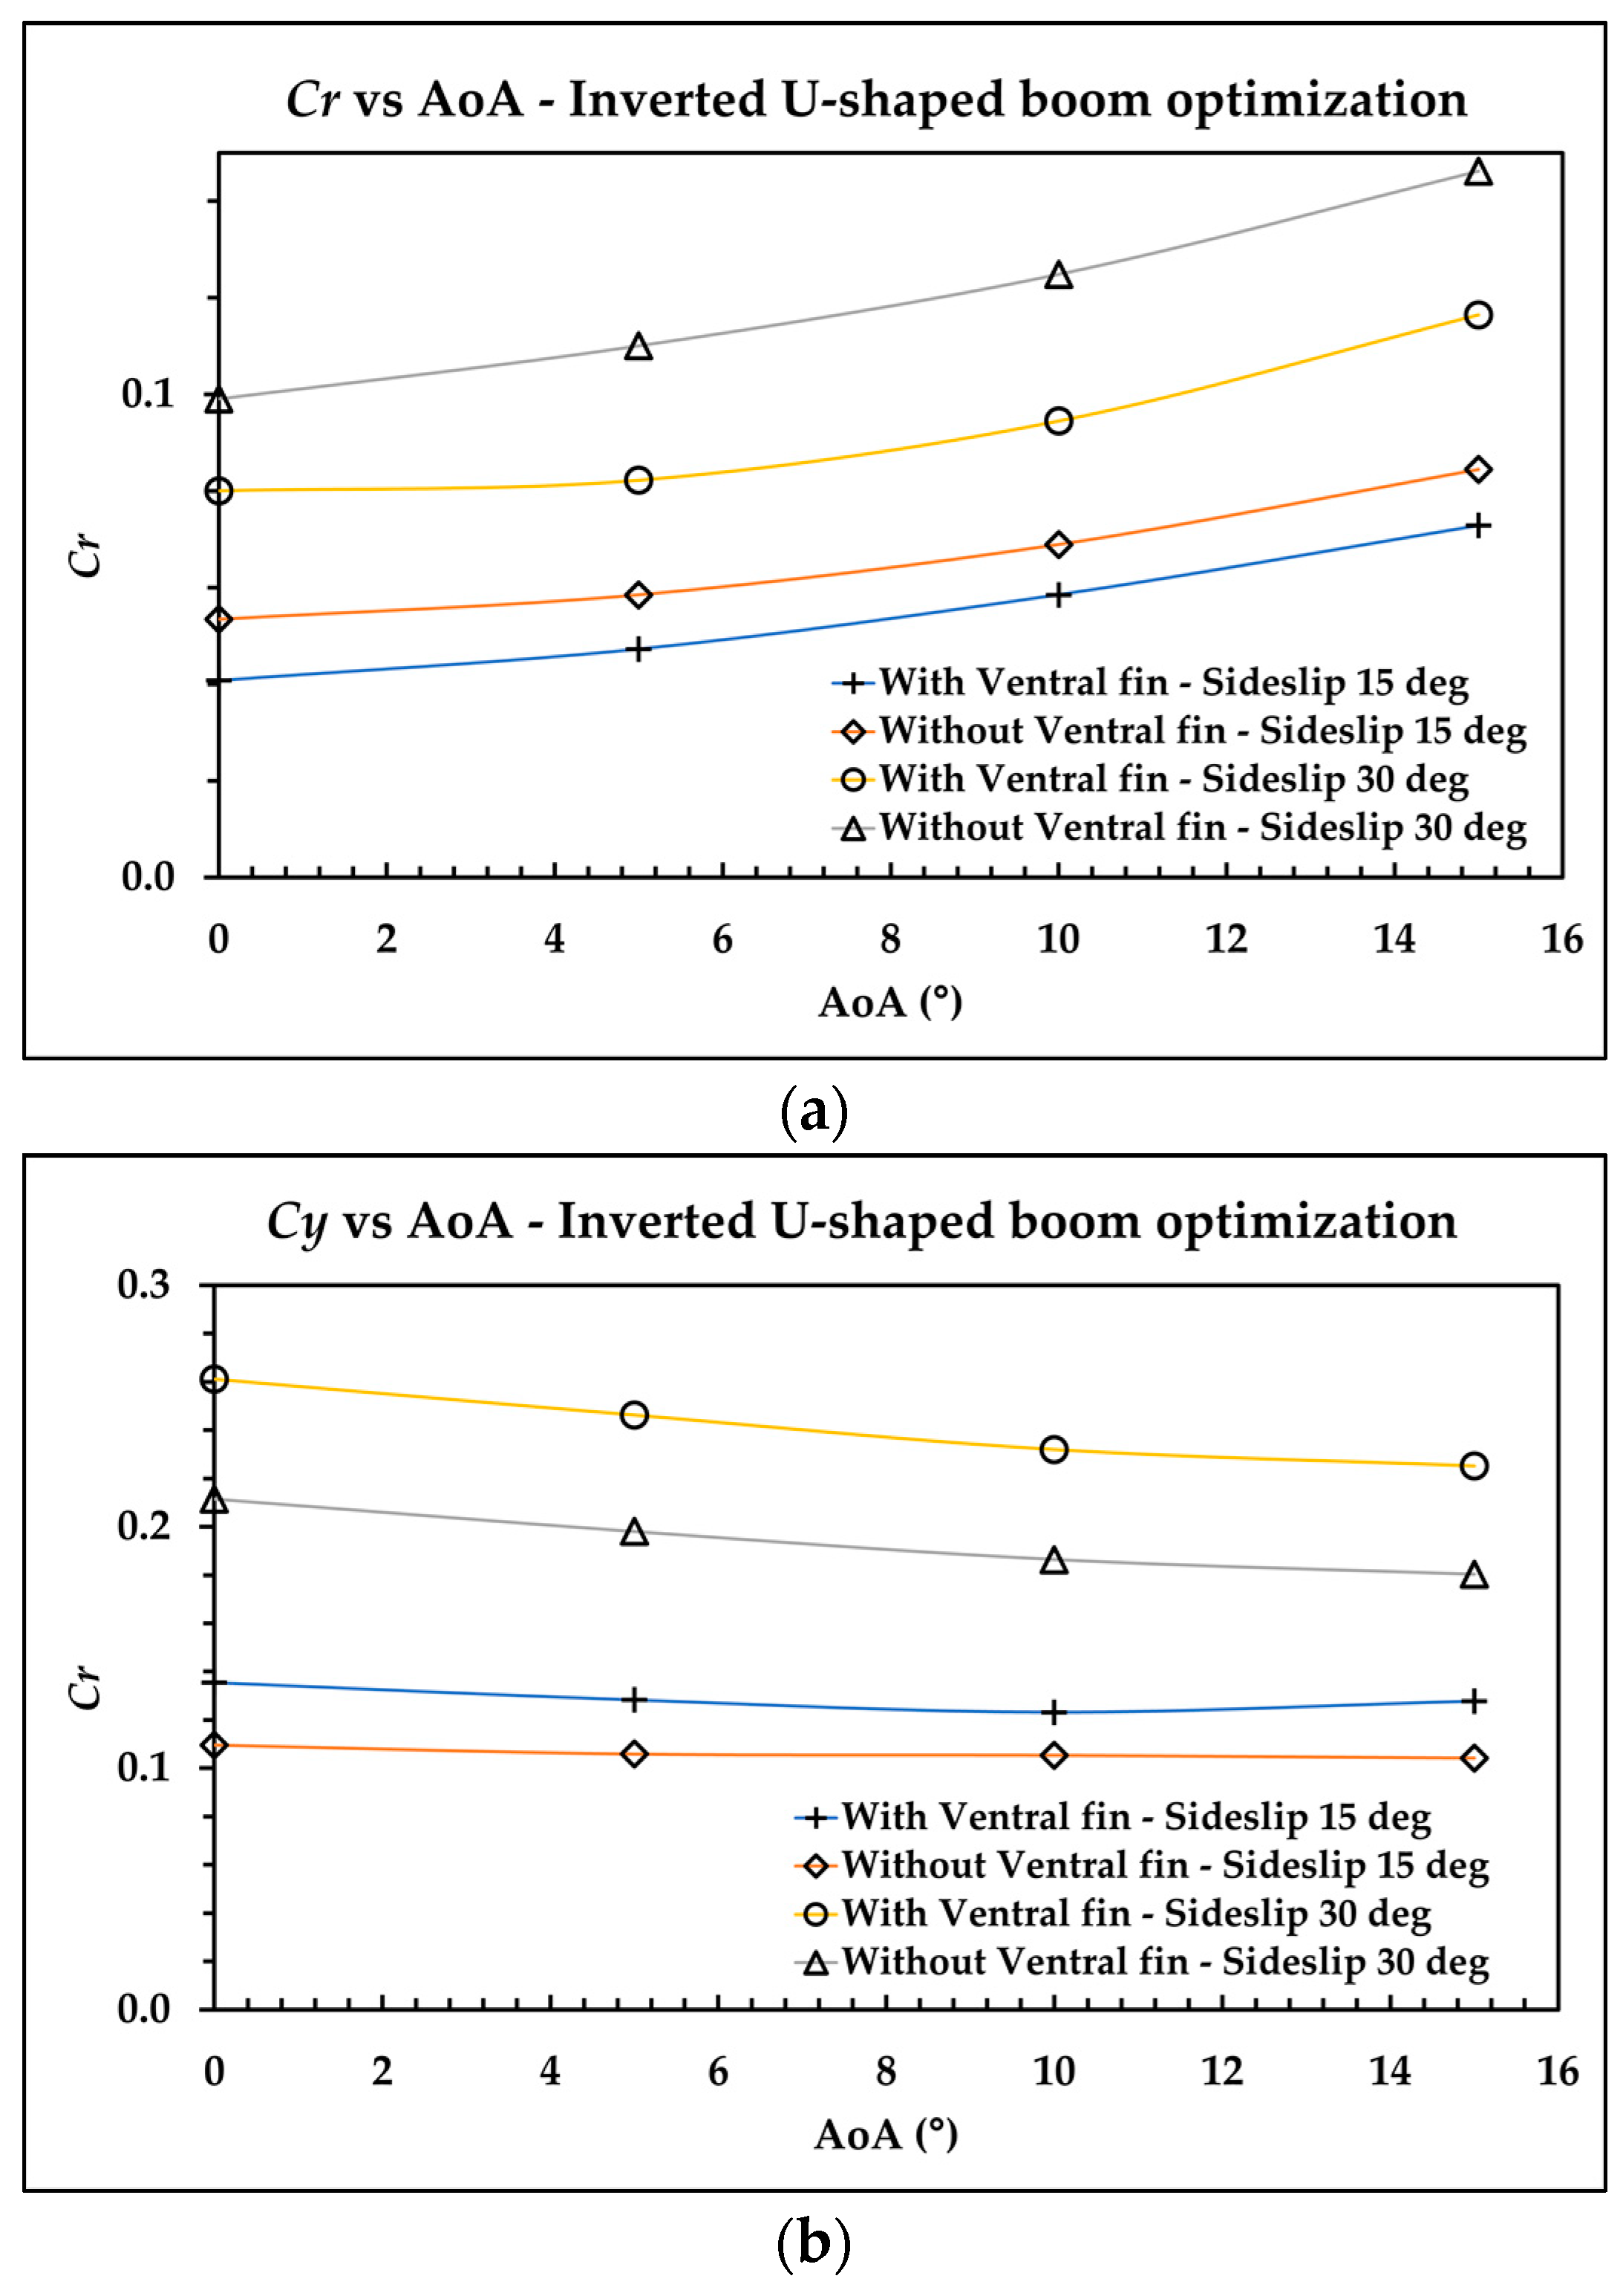
Aerospace 09 00208 g021
Figure 22. Stability optimization, (a) Lateral stability and (b) Directional stability.
Aerospace 09 00208 g022
Table 1. Design Requirements and Objective (DRO).
NoRequirementValue
1Take-off transition distance80 m
2Landing transition distance150 m
3Cruising altitude300 m
4Cruising velocity23 m/s
5Stall speed14 m/s
6Load weight5.5 kg
7Flight time6 h
8Rate of climb5.5 m/s
9Maximum Take-Off Weight (MTOW)14–15 kg
10Wingspan3 m
Table 2. Fuel fraction [13].
PhaseFuel Fraction
Engine Start and Warm-up0.998
VTOL take-off preparation0.998
VTOL transition to fixed-wing0.998
Climb0.995
Cruise R c r = 375 ( η p c p ) c r ( L D ) c r ln ( W a W e ) (1)
Loiter E l t r = 375 ( 1 V l t r ) l t r ( η p c p ) l t r ( L D ) l t r ln ( W a W e ) (2)
Cruise back R c r = 375 ( η p c p ) c r ( L D ) c r ln ( W a W e ) (3)
Descent0.995
Landing, taxi, dan shutdown0.995
Table 3. Performance sizing.
VTOL-Plane Surveillance Sizing
Wing loading (W/S)3 lb/ft2 = 14.7 kg/m2
Power loading (W/P)15.4 lb/hp = 7 kg/hp
CLmaxTO1.4
CLmaxL1.3
CLmaxS1.3
WTO14 kg
WE5.8 kg
WF2 kg
Table 4. Wing design calculation.
Wing Design
s0.95 m2
AR9.47
λ0.28
iw
Λ
b3 m
Cr0.35 m
Ct0.25 m
Table 5. Empennage design.
Empennage General Design
Vertical tail volume coefficient (Vv)0.04
Horizontal tail volume coefficient (Vh)0.6
Distance of 25% wing MAC to 25% vertical empennage MAC (Lv)1.1 m
Distance of 25% wing MAC to 25% vertical horizontal MAC (Lh)1.12 m
Tail incidence (α)
U-shaped boom configuration
Dihedral angle (Γ)
Vertical stabilizer root chord (Crvertical)0.28 m
Vertical stabilizer tip chord (Ctvertical)0.22 m
Vertical stabilizer span (bvertical)0.22 m
Horizontal stabilizer root chord (Crhorizontal)0.18 m
Horizontal stabilizer tip chord (Cthorizontal)0.18 m
Horizontal stabilizer span (bhorizontal)0.96 m
Inverted U-shaped boom configuration
Dihedral angle (Γ)70°
Vertical stabilizer root chord (Crvertical)0.28 m
Vertical stabilizer tip chord (Ctvertical)0.22 m
Vertical stabilizer span (bvertical)0.22 m
Horizontal stabilizer root chord (Crhorizontal)0.22 m
Horizontal stabilizer tip chord (Cthorizontal)0.22 m
Horizontal stabilizer span (bhorizontal)0.80 m
Inverted V-tail boom configuration
Dihedral angle (Γ)30°
V-tail stabilizer root chord (Crv-tail)0.30 m
V-tail stabilizer tip chord (Ctv-tail)0.22 m
V-tail stabilizer span (bv-tail)0.55 m
Semi-inverted V-tail boom configuration
Dihedral angle (Γ)45°
V-tail stabilizer root chord (Crv-tail)0.30 m
V-tail stabilizer tip chord (Ctv-tail)0.22 m
V-tail stabilizer span (bv-tail)0.55 m
Horizontal stabilizer root chord (Crhorizontal)0.22 m
Horizontal stabilizer tip chord (Cthorizontal)0.22 m
Horizontal stabilizer span (bhorizontal)0.18 m
Table 6. Payload dimension on the fuselage.
ComponentsQuantityDimension (mm)
LengthWidthHeight
Battery for VTOL21696539
Battery for System11384341
UBEC-10A243.132.312.5
PDB and Autopilot112010012
Telemetry1402010
Servo CDI140.520.338
Remote receiver147.324.914.3
Fuel tank1220125125
Engine112052.5110
Airspeed1921414
CDI1402018
Surveillance Camera1715533.6
Publisher’s Note: MDPI stays neutral with regard to jurisdictional claims in published maps and institutional affiliations.

