Article

Numerical Study of Coaxial Main Rotor Aerodynamics in Steep Descent

Moscow Aviation Institute, National Research University, 125993 Moscow, Russia
*
Author to whom correspondence should be addressed.
Aerospace 2022, 9(2), 61; https://doi.org/10.3390/aerospace9020061
Submission received: 22 November 2021 / Revised: 18 January 2022 / Accepted: 19 January 2022 / Published: 24 January 2022
(This article belongs to the Special Issue Helicopter Aerodynamics)

Abstract

:
Numerical studies of the aerodynamic characteristics of the coaxial main rotor of the Kamov Ka-32 helicopter in steep descent modes, including the area of the vortex ring state (VRS) modes, have been performed. Used in this paper is an original free vortex wake model of the rotor developed by the authors. The angles of attack of the rotor αR = 30–90° and the rate of descent in the range of Vy = 0–30 m/s are considered. The calculations have been carried out under the condition of a fixed time-average thrust of the rotor. The visualization of the rotor wake shapes the flow structures using streamlines, and the flow velocities have been received and analyzed. The VRS boundaries in “VxVy” coordinates have been constructed. The criteria used in this paper are: rotor thrust and torque pulsations, rise of rotor torque and induced velocity relative to the hovering mode. The results of the calculations are compared with the experimental and calculated data of other authors, and a satisfactory match has been obtained. The new results presented in this paper can supplement the existing experience of experimental and numerical research in this field.

1. Introduction

The steep descent modes belong to the most complex helicopter flight modes. This is due to the possible falling of the helicopter in the area of the VRS modes of the main rotor. The first flight experiments on steep descent modes were conducted from the late 1940s to the early 1950s. Among them are the works by Brotherhood (1949) [1], Reeder and Gustafson 1949) [2] and Stewart (1951) [3]. Flight tests have covered single-rotor helicopters: Sikorsky R-4B, R-6, S-51, Bell-47 and Bristol-171. In 1958, flight tests were carried out for a tandem scheme helicopter (a modification of the CH-21 helicopter), presented in the work by Yeates [4]. In 1964, Scheiman [5] conducted flight tests of the VRS modes on the H-34 single-rotor helicopter. The works [6,7] contain some results of flight studies of the VRS modes performed in the 1970s and 1980s at the Flight Research Center named after M.M. Gromov (Russia) for the Mi-8 single-rotor helicopter and Kamov coaxial helicopters. In the work by Jimenez et al. (2002) [8], the results of studies of the VRS modes on a single-rotor Dauphin helicopter have been presented. In various flight tests, when a helicopter enters the area of the VRS modes, the following features have been noted: a loss of altitude, an increase in the required power, a high level of vibrations, irregular flywheel movement of the blades and a temporary loss of control of the helicopter. These effects are related to the specifics of the main rotor aerodynamics in the VRS modes.
Not only the flight tests, but some experimental studies of the rotor aerodynamics in the VRS modes have been carried out. In the work by Drees and Hendal (1949) [9], a high-quality smoke visualization of the flow structure around the rotor in the VRS modes has been obtained for the first time. The visualization results observed in a certain range of descent speeds and angles of attack of the rotor have demonstrated an extremely complex picture of the flow around the rotor. In such modes, an “air body” with a powerful circulation flow inside has been formed around the rotor. The vortex wake coming off the rotor blades collapses into a structure similar to a “vortex ring”. In the work by Castles and Gray (1951) [10], studies of rotors with different blade geometries (with and without blade twist) in a wind tunnel (WT) have been performed. It has been demonstrated that the blade twist affects the boundaries of the VRS modes, shifting them by large values of the inflow velocities. The analysis of the aerodynamic characteristics of the rotor in the VRS modes during the experiments has also identified a number of features. In Yaggy and Mort (1963) [11], Washizu et al. (1966) [12], Xin and Gao (1993) [13] and Betzina (2001) [14], there have been specific unsteady pulsations of the rotor’s thrust and torque which were recorded. In the works provided in the 1970s–1990s in TsAGI (Russia), the boundaries of the VRS region have been constructed according to the drop in the thrust [7], and an increase in the rotor torque (power consumption) has been also noted in comparison with the hovering mode [15]. In the works by Empey and Ormiston [16] and Brinson and Ellenrieder [17], as well as in the works mentioned above, a significant increase (two–three times compared to the hover) in the induced velocity of the rotor in the VRS modes has been obtained.
The features of the main rotor aerodynamics discovered in experiments lead to phenomena observed in flight tests which make the VRS modes unsafe for the helicopter. In addition to this, the steep descent modes require special attention. As a result, a special area of steep descent modes in the flight coordinates “Vx–Vy” has been introduced into the helicopter flight operation manuals, where it is possible for the main rotor to fall into the VRS modes. Thus, the determination of the VRS boundaries in the coordinates “Vx–Vy” is an important task.
Studies of the VRS modes by various methods have maintained their relevance for more than 70 years. In addition to WT tests, many different approaches and special experimental stands have been proposed and used for experimental studies of the VRS modes: Stack et al. (2005) [18] used a water tank, Xin and Gao (1993) [13] worked with a whirling beam and Washizu et al. (1966) [12] and Antropov [15] used a moving track. Experimental studies are regularly supplemented with new results that have become available due to the development of new technologies. One of the most important roles in the process of experimental studies of rotor aerodynamics, including the VRS modes, is currently played by modern PIV (particle image velocimetry) visualization techniques. For example, the PIV-visualization performed in the works by Green et al. (2005) [19] and Surmacz et al. (2015) [20] have demonstrated a characteristic picture of the flow around the rotor in the VRS modes without using smoke visualization techniques, which are ineffective in such cases.
It should be noted that a comparative analysis of various results of studies of the rotor aerodynamics in the VRS modes shows a significant dependence on the test conditions and on the rotor’s geometry [21]. This indicates the need for individual studies of different rotors when determining the VRS modes’ boundaries.
The development of computer technology in recent decades has led to the possibility of numerical studies of the rotor aerodynamics in the VRS modes. To solve the presented problem, various mathematical models are used. In Leishman et al. (2002) [22], on the basis of the free-vortex model, steep descent modes for single-rotor, tandem rotor and tiltrotor models have been studied. The boundaries of the VRS modes have been obtained according to the criteria of rotor thrust, torque pulsations and the blade flapping fluctuations. In the work by Celi and Ribera (2007) [23], on the basis of the Leishman’s model, a helicopter descent with a passage through the VRS region has been simulated, taking into account the flight dynamics. Bailey (2010) [24] has also simulated a steep helicopter descent based on the computational models developed in ONERA (Office National d’Etudes et de Researches Aerospatiales). The numerical calculation has been based on the data of Dauphin helicopter flight tests. Research has been focused on the analysis of aerodynamic loads changes. The boundaries of the VRS modes have been determined and compared with the experiment. In the work by Shcheglova (2012) [25], on the basis of the free wake model developed at TsAGI, studies of a steep descent of a single main rotor with an angle of attack αR ≈ 85° have been performed. Such criteria of the VRS modes as thrust pulsations, growth of torque and induced velocity have been found. In the work by Mohd and Barakos (2017) [26] on the basis of the finite volume method (FVM), using the URANS (Unsteady Reynolds Averaged Navier Stokes Equations), the VRS modes for two model rotors have been studied. This work considers axial flow modes (αR = 90°). The drop and pulsations in thrust at fixed blade pitch angles have been obtained. In the work by Brown et al. (2002) [27], comparative studies of single-rotor aerodynamics in steep descent modes have been performed using Leishman’s free-vortex model and Brown’s vorticity transport model (VTM). The boundaries of the VRS modes have been found according to the criterion of thrust pulsations. Kinzel et al. (2019) [28] have performed a numerical simulation of the axial descent for the rotors of unmanned aerial vehicles based on the URANS method. The coaxial rotor and equivalent conventional rotor have been considered. In both cases, a decrease in thrust has been obtained, and this indicates the rotor’s falling into the VRS region. It has been shown that, in the case of coaxial rotors, the VRS mode occurs at higher descent speeds, and the thrust drop is less than in case of equivalent conventional rotors.
Thus, numerical modeling can significantly supplement the data of experimental studies and makes it possible to determine the boundaries of VRS modes for particular helicopters, taking into account their individual features. At the same time, computational studies of rotor aerodynamics in the VRS modes require large amounts time and computational resources. On the one hand, this is due to the need to perform a large number of parametric calculations to determine the VRS boundaries in the “Vx–Vy” coordinates. On the other hand, in the VRS modes, the aerodynamic characteristics of the rotor differ in their unsteadiness. Therefore, in order to deeply analyze the rotor aerodynamics in the VRS modes, it is necessary to simulate a large (sometimes up to a hundred or more) number of revolutions of the rotor.
From the above review, it can be seen that the majority of the existing experimental and calculated studies have been performed for conventional rotors (main or tail) and less often for tandem rotor or tiltrotor schemes. Coaxial rotors in steep descent modes, especially by numerical modeling, have been studied only partially.
The presented results continue the research published earlier by the authors [29] and which is dedicated to the numerical modeling of the VRS modes of the Kamov Ka-32 helicopter full-scale coaxial rotor in the hover and vertical descent modes (αR = 90°). In the proposed study, the simulation of steep descent modes with different angles of attack of the rotor αR = 70, 50 and 30° has been performed. Together with the results of [29], this made it possible to conduct a comprehensive analysis of the coaxial rotor aerodynamics in the VRS modes and receive their boundaries in the “Vx–Vy” coordinates using various criteria.

2. Method and Object of Study

The free wake model of the rotor developed at the Helicopter Design Department of Moscow Aviation Institute is based on the lifting line theory and the blade element theory. Each blade element is modeled by an attached vortex segment located on a quarter of the blade element chord c (see Figure 1) with the control point in the center of the segment. For each time step Δt a quadrangular contour consisting of vortex segments with a constant circulation Γ (equal to the attached vortex circulation) descends from the blade element. The circulation of the attached vortex changes along the blade radius and depends on the blade azimuthal position. Determining of the attached vortex circulation is implemented through an iterative method. The coefficients of the lift force CL and the drag force CD of the blade element are determined at the found angle of attack α and the total flow velocity W based on airfoil steady test data in WT. The system of vortex contours creates a free vortex wake in the form of a grid of longitudinal and transverse vortex segments (see Figure 1). The vortex wake grid is deformed at each calculated step under the influence of external and induced velocity fields.
A key part of the model is a calculation of induced velocities from the vortex segment which is an element of the free vortex wake grid. The authors have used an approach that allows for determining the vorticity field from the vortex segment and the induced velocity from this vorticity field on the basis of an exact solution of the vortex source diffusion.
The model, with its basic equations, is described in detail in works [29,30].
An object of the research is the coaxial main rotor of the Kamov Ka-32 helicopter, its characteristics are given in articles [29,31,32] and presented in Table 1.
The scheme of the computational model of the coaxial main rotor used in the study is shown in Figure 2. The upper and lower rotors rotate in different directions and consist of three blades each. The direction of rotation of the upper rotor is clockwise (when viewed from above) and the lower rotor is counterclockwise. The model takes into account the blade flapping motions relative to the horizontal hinges.
For the convenience of presenting the results, a special color system has been used in the presented graphs, figures and diagrams. The data on the upper rotor (UR) are blue. The data on the lower rotor (LR) are brown. The total characteristics of the upper and lower rotors (Σ = UR + LR) are green.
It is important to note that the pictures of the main rotor wake visualization given below in the article do not show all the elements of the vortex wake grid. For convenience, only the blade tip vortices are shown.
The calculated time step has been 12 degrees in azimuth. Calculations of all main rotor operational modes have been performed for the number of revolutions equal to n = 160. The time costs for such settings for the calculation of one mode have been about three days. A computer equipped with a central processor with eight computing cores (16 threads) has been used. To speed up the calculations, a network of several such computers has been used in parallel.
To analyze the VRS area in the “Vx–Vy” coordinates, it is necessary to calculate the aerodynamic characteristics of the rotor for a number of operating modes. These modes form a grid in the coordinates of the vertical descent speed Vy and the forward flight speed Vx. Such a grid is shown in Figure 3. The grid includes calculation points for the angles of attack of the rotor αR = 90, 70, 50 and 30°. Data for αR = 90° had been previously obtained in work [29]. Calculations for the angles of attack of the rotor αR = 70, 50 and 30° have been performed in the presented study. In total, more than 70 operating modes have been calculated in this way.
In the presented work, the aerodynamic characteristics of the coaxial main rotor have been studied under the condition of fixed time-averaged total thrust. The thrust coefficient has been corresponded to the hovering mode (CTΣ = 0.015). This approach requires a lot of time and computational resources compared to the fixed blade pitch angles approach. Meanwhile, it allows obtaining and analyzing a large number of VRS modes criteria including the important criterion of the increase in the required rotor’s power at fixed thrust.
To keep constant thrust at all operating modes (see Figure 3), the relevant blade pitch angles of the UR and LR have been precalculated using the same free wake model with the same setup parameters. The obtained required blade pitch angles are shown in Figure 4. The blade pitch angles of the lower and upper rotors have been selected differently to provide the balancing of the coaxial rotor by the torque: CQUR = CQLR. In [29], this approach has been used for vertical descent modeling (αR = 90°). Taking into account the blade pitch angles’ dependencies, presented in Figure 4, it became possible to ensure the balancing of the rotors in most operating modes, with the exception of high descent speed values close to the “autorotation” mode.

3. Results and Discussion

3.1. Wake and Flow Structures Analysis of Coaxial Rotor in Step Descent

One of the most specific features of the VRS modes is the structure of the flow around the rotor. First of all, this is the formation of an “air body” around the rotor with a powerful circulating flow inside. The first high quality results of smoke visualization of the rotor flow structure in the VRS modes were obtained in 1949 and presented in [9]. However, experimental visualization of the flow around the rotor in the VRS modes has been, for a long time an extremely difficult technical challenge. In recent years, great progress has been achieved in this area with the use of experimental methods of PIV visualization of flows [19,20]. Modern methods of numerical modeling also have wide opportunities to study the rotor flow structure, vortex wake shapes and velocity fields [22,23,24,25,26,27,28]. Such methods include the free wake model used in the presented study.
Figure 5, Figure 6 and Figure 7 show the results of visualization of the flow around the rotor obtained by the free wake model for the angles of attack of the rotor αR = 70, 50 and 30°. Each figure shows the three most characteristic operating modes of the rotor corresponding to different vertical descent speeds Vy. These operating modes have been identified by a comprehensive analysis of the rotor’s aerodynamic characteristics on the whole studied modes set. The first is the most intensive “peak” VRS mode. The second is one of the TWS modes, which follows the VRS modes with an increase in descent speed. The third is the “autorotation” mode, when the rotor rotates due to an external incoming flow without using the power of the power plant. In this case, the total torque of the coaxial rotor is zero CQURΣ = 0.
Visualization of the vortex wake shapes has been performed using blade tip vortices trajectories. Other elements of the vortex wake have been hidden. Thus, the picture becomes clearer for visual analysis. The structure of the flow around the rotor has been shown using streamlines. Streamlines have been built for a fixed time moment in the projection on the oXY plane (see Figure 2). In addition to the streamlines, velocity fields have also been presented.
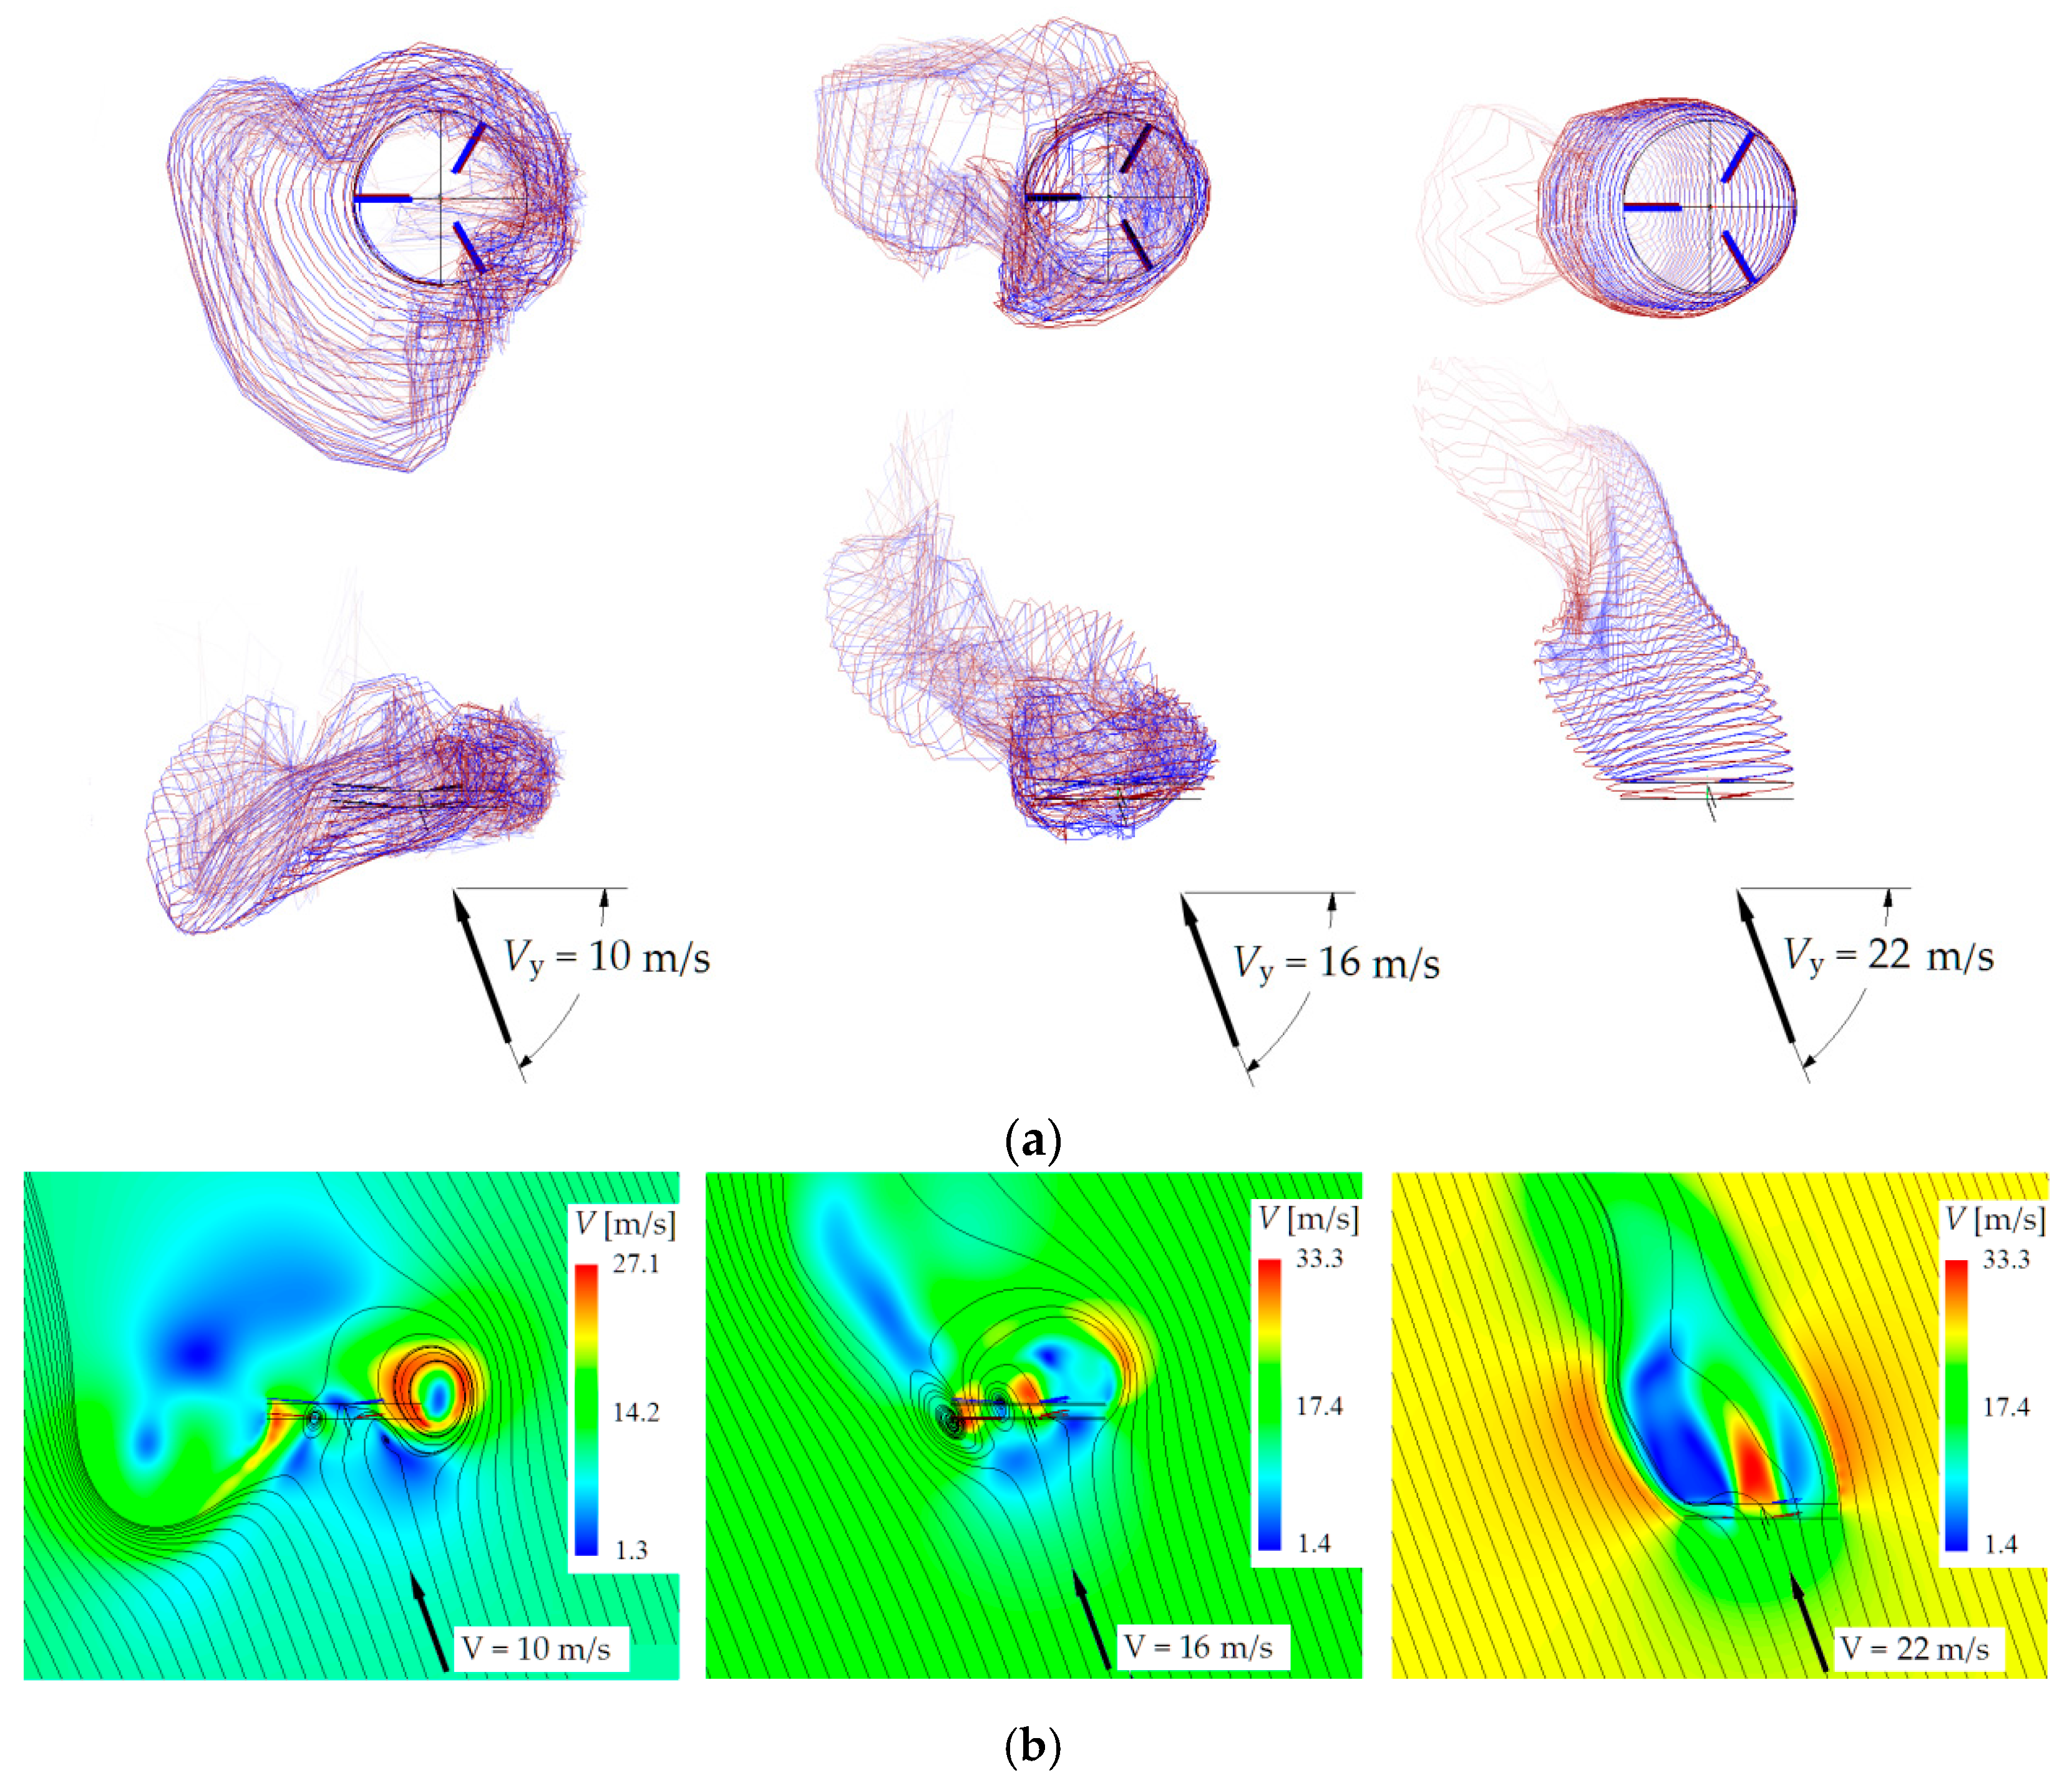
Figure 5 shows the vortex wake shapes and rotor flow structures for αR = 70°. The following characteristic operating modes are presented: Vy = 10 m/s (VRS mode), Vy = 16 m/s (TWS mode) and Vy = 22 m/s (“autorotation” mode). The characteristic vertical descent rates Vy have less values than for vertical descent (at αR = 90° characteristic vertical descent rates were Vy = 12, 18 and 23 m/s, respectively [29]). As with αR = 90°, an “air body” with a circulating flow inside is formed around the rotor in the VRS and TWS modes. However, the flow structure is complicated due to its asymmetry relative to the oY axis. In this case, the flow structure becomes asymmetric not only when viewed from the side, but also when viewed from the top. This asymmetry is especially clearly visible in the vortex wake shapes visualization for Vy = 10 m/s and Vy = 16 m/s (Figure 5a,b). In addition, the front side of the wake maintains a clear structure and the back side is blurred. This is clearly seen in the “vortex ring” mode (Figure 5a, Vy = 10 m/s). Thus, the wake structure in these modes is a “half-vortex-ring”. Another feature is related to the rotor flow structure. Figure 5a,b shows that vortex wake and “air body” are inclined relative to the rotor’s rotational plane and are perpendicular to the incoming flow. This feature is also observed at the other steep descent modes discussed below.
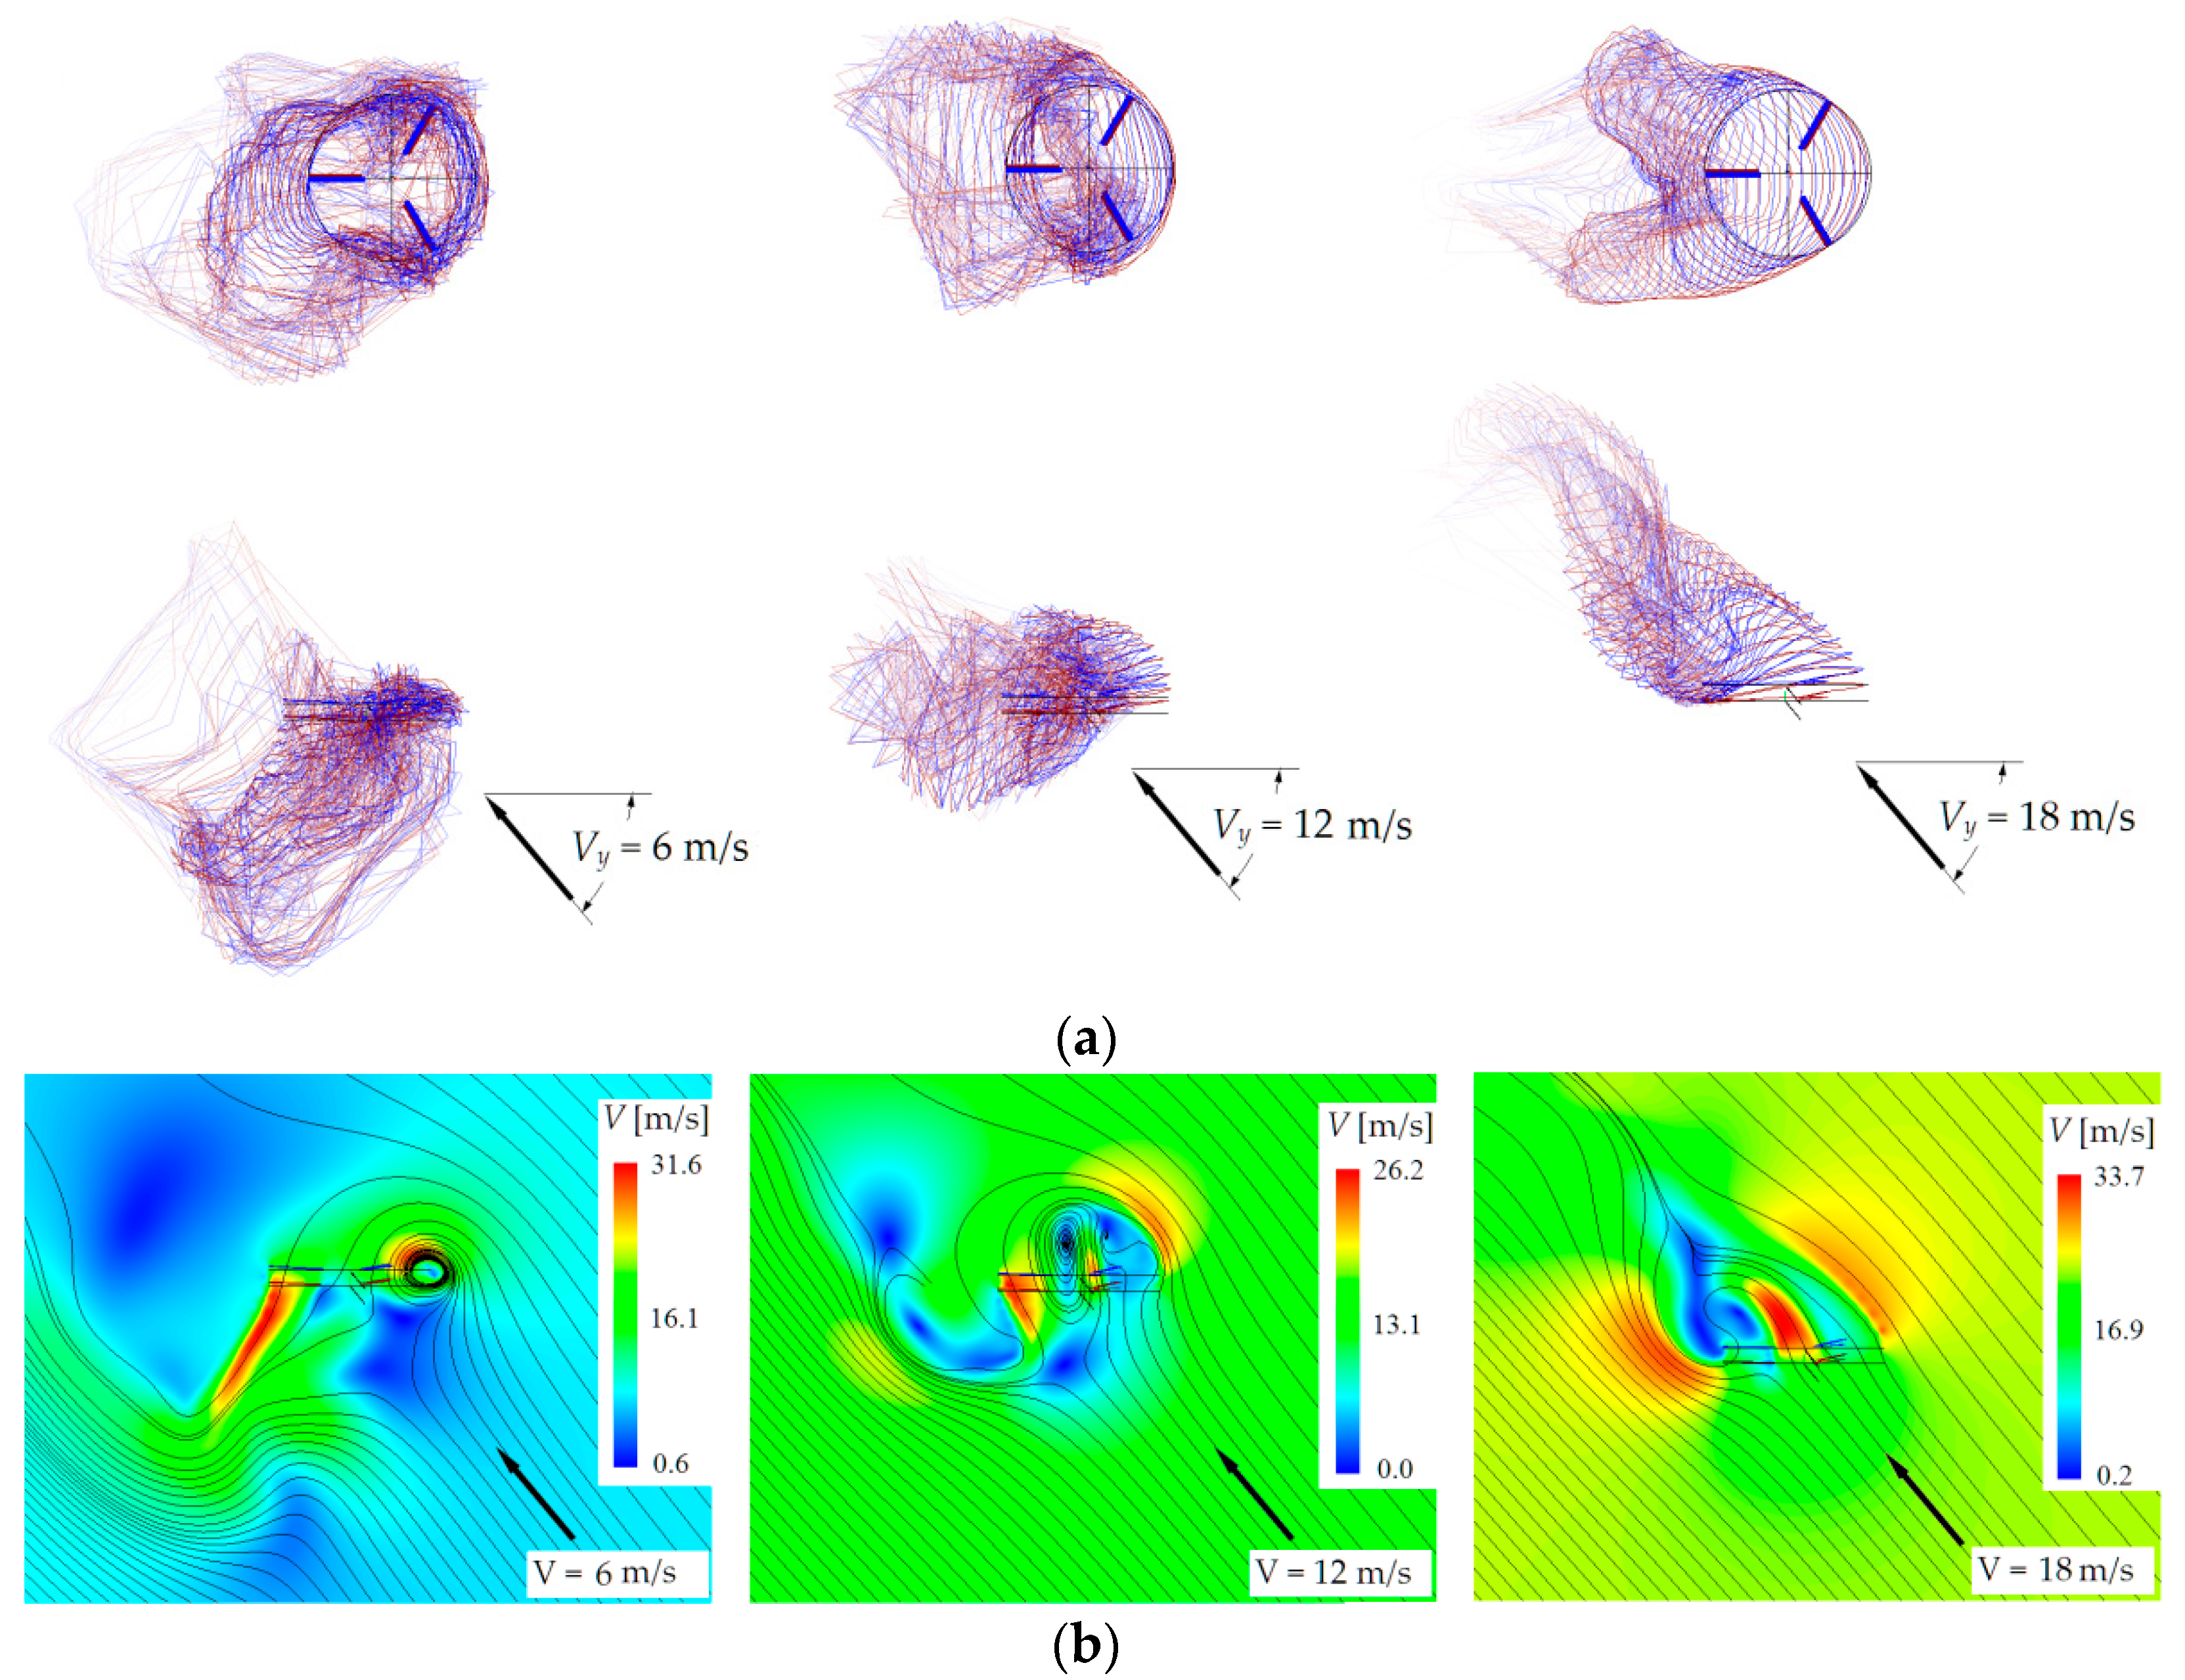
Figure 5. Free vortex wake shapes (a) and flow (b) around the rotor visualization at αR = 70°.
Aerospace 09 00061 g005
Figure 6 shows the vortex wake shapes and the flow structures for αR = 50°. The following vertical descent speeds are presented: Vy = 6 m/s (VRS mode), Vy = 12 m/s (TWS mode) and Vy = 18 m/s (“autorotation” mode). The presented “peak” mode of the VRS observed here at the Vy value is less than half of what it is at αR = 90° [29]. It can be seen that, at Vy = 6 m/s (Figure 6a), the structure of the vortex wake and the flow structure significantly differ from those observed at the αR = 90° [29] and αR = 70°. There is no clear “air body” around the rotor (Figure 6b, Vy = 6 m/s). In the front of the rotor, there is a concentration of the vortex wake in the “half-ring”, located directly in the rotor’s rotational plane (Figure 6a, Vy = 6 m/s, top view). This vortex structure causes a powerful circulating flow in the front side of the rotor (Figure 6b, Vy = 6 m/s). On the back side of the rotor, the vortex wake is blurred. There is no concentrated circulating flow, and the flow from the rotor is directed downward, almost as in the hovering mode [29]. Thus, the front and back sides of the rotor actually work in different flow conditions. At Vy = 12 m/s, even more complex flow structures are observed in the TWS mode (Figure 6a,b, Vy = 12 m/s). A few circulating zones are located near the plane of rotation of the rotors at once. In the “autorotation” mode (Vy = 18 m/s), the shape of the wake and the structure of the flow are significantly simplified. The vortex wake, going up, has a fairly regular helix shape. A flow braking zone appears behind the rotor. The flow around the rotor has a similar structure to the flow around a “flat plate” with a hole in the middle.
Figure 6. Free vortex wake shapes (a) and flow around the rotor (b), visualization for αR = 50°.
Aerospace 09 00061 g006
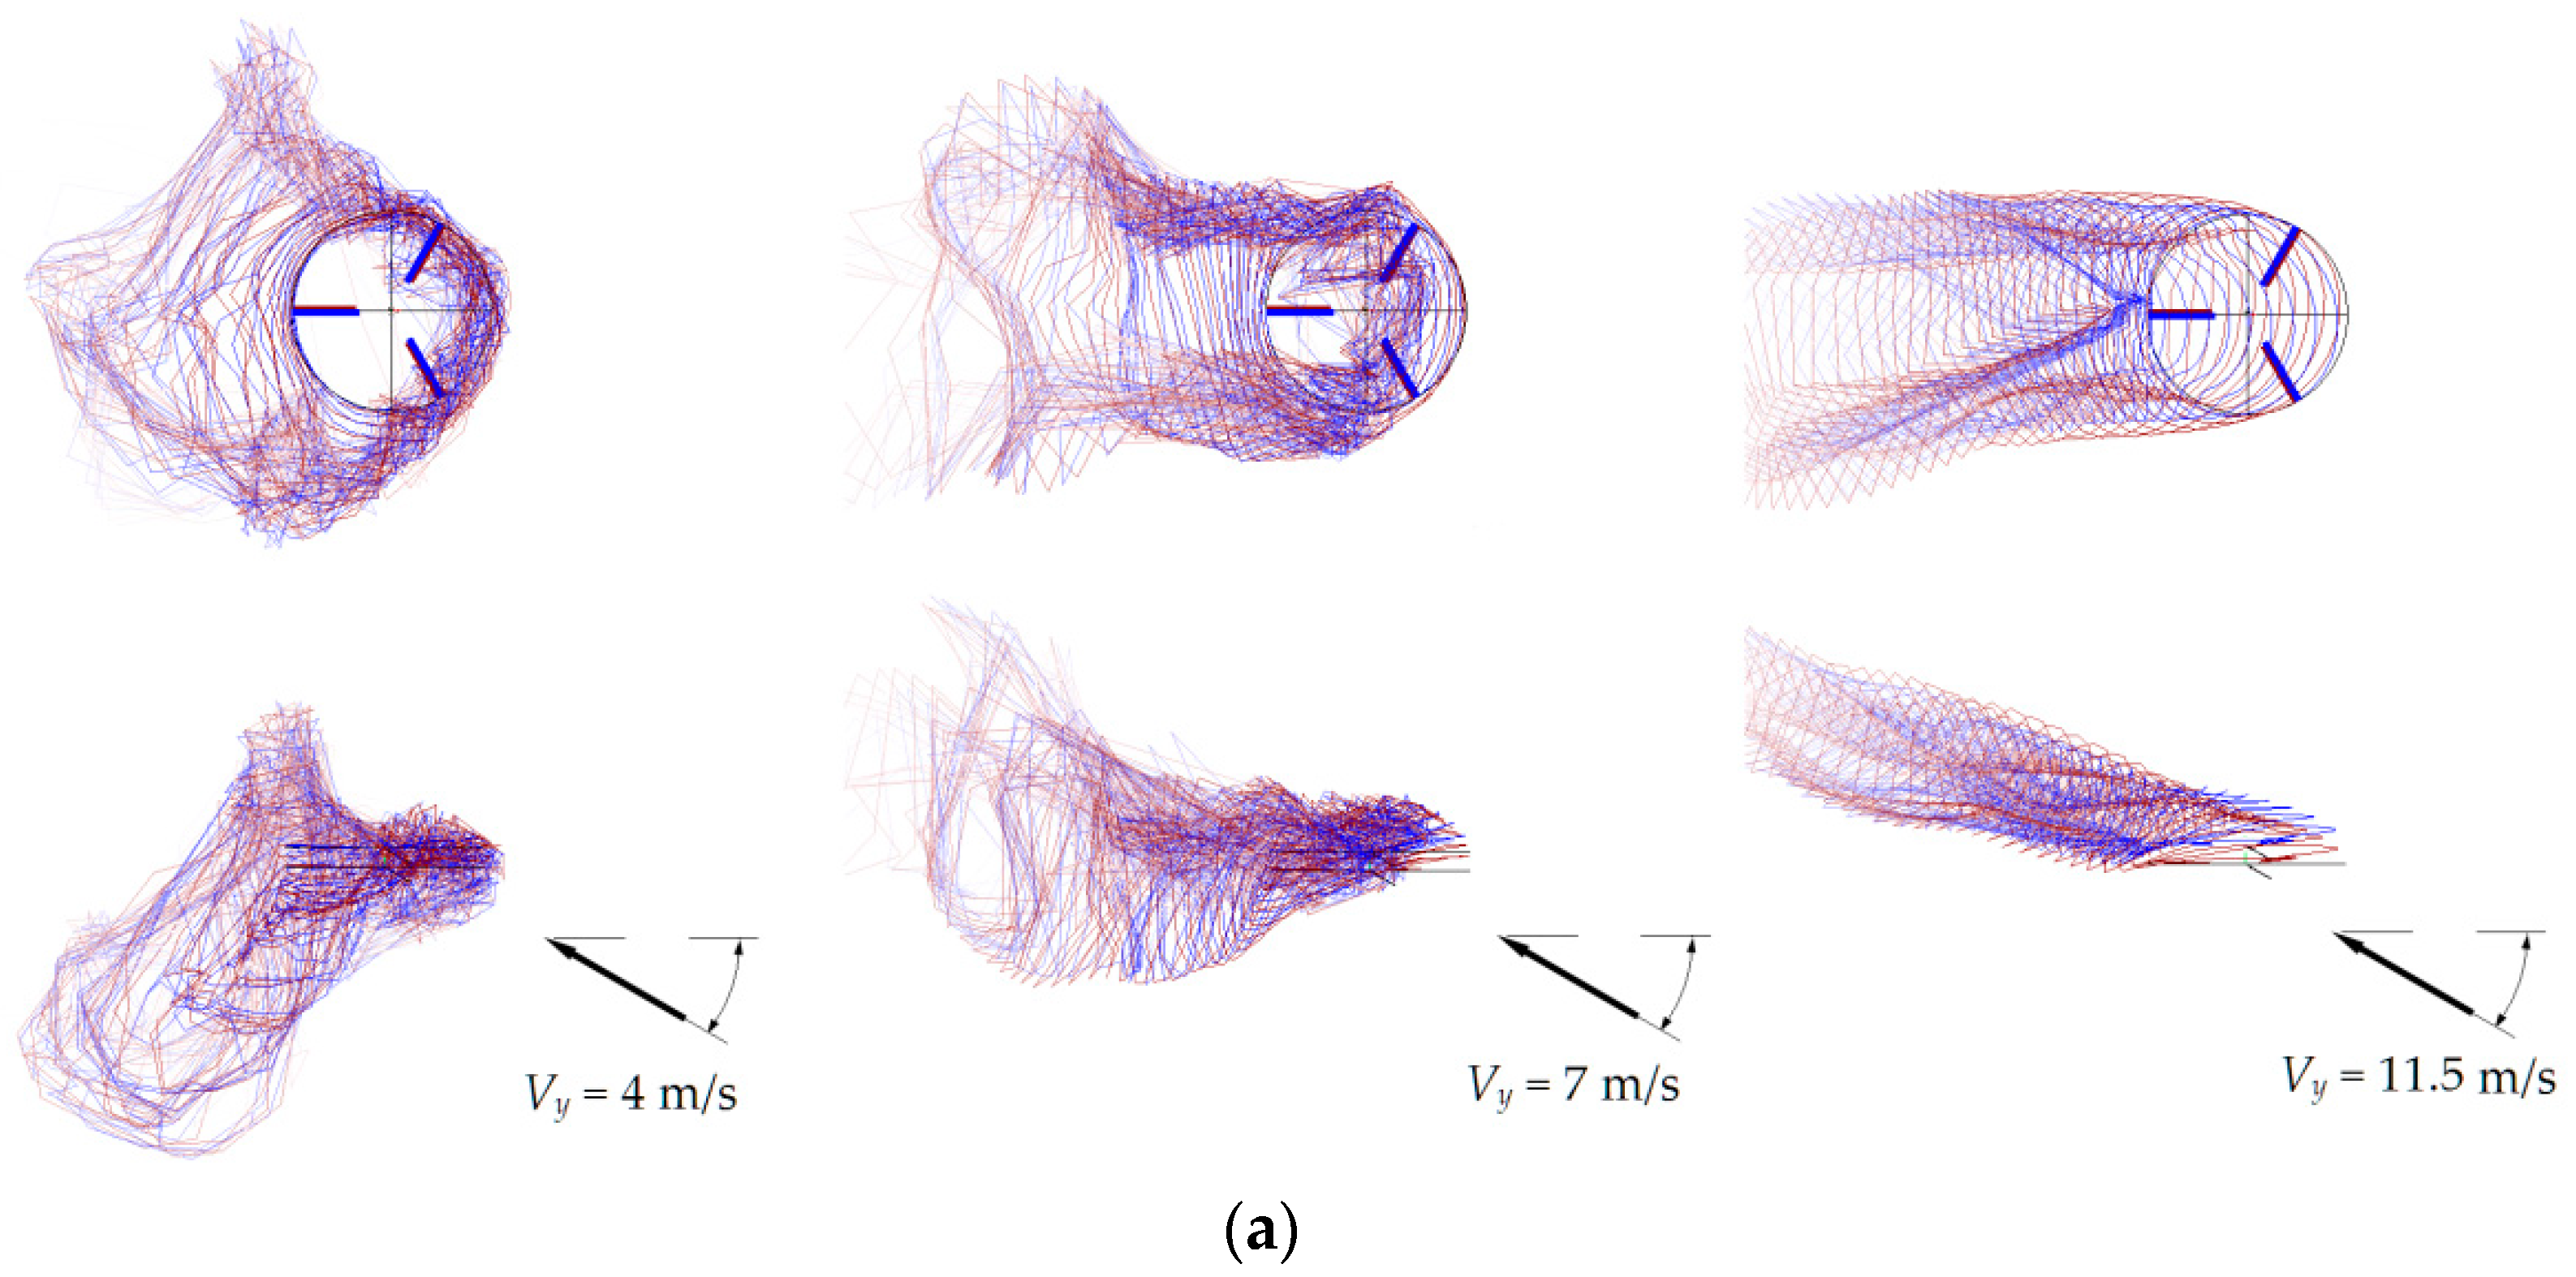
Figure 7 shows the vortex wake shapes and the flow structures for αR = 30°. Here, are presented the following velocities of descent: Vy = 4 m/s (VRS mode), Vy = 7 m/s (TWS mode) and Vy = 11.5 m/s (“autorotation” mode). It can be noted that the features of the flow and vortex wake structures in these modes mostly repeat the features received for αR = 50°. At the same time, these characteristic modes have been observed at lower vertical descent velocities. For example, the “peak” of the VRS mode has been registered here at the value of Vy = 4 m/s, which is three times less than at αR = 90° [29] and almost two times less than at αR = 70°.
Figure 7. Free vortex wake shapes (a) and flow (b) around the rotor, visualization for αR = 30°.
Aerospace 09 00061 g007aAerospace 09 00061 g007b
The vortex wake shapes and the flow structures at the VRS and TWS modes shown in Figure 5, Figure 6 and Figure 7 have been constructed for a fixed moment in time. However, the flow around the rotor and its vortex wake in these modes are significantly unsteady. The vortex wake structure changes over time in its shape, size and position relative to the rotor’s rotational plane. The unsteadiness of the flow around the rotor causes significant pulsations of aerodynamic loads (including total thrust and torque). These pulsations are observed both in experiments [11,12,13,14] and calculations [22,23,24,25,26,27] and are one of the main features of the VRS modes. The total aerodynamic characteristics of the rotor and their unsteady pulsations will be presented and discussed below.

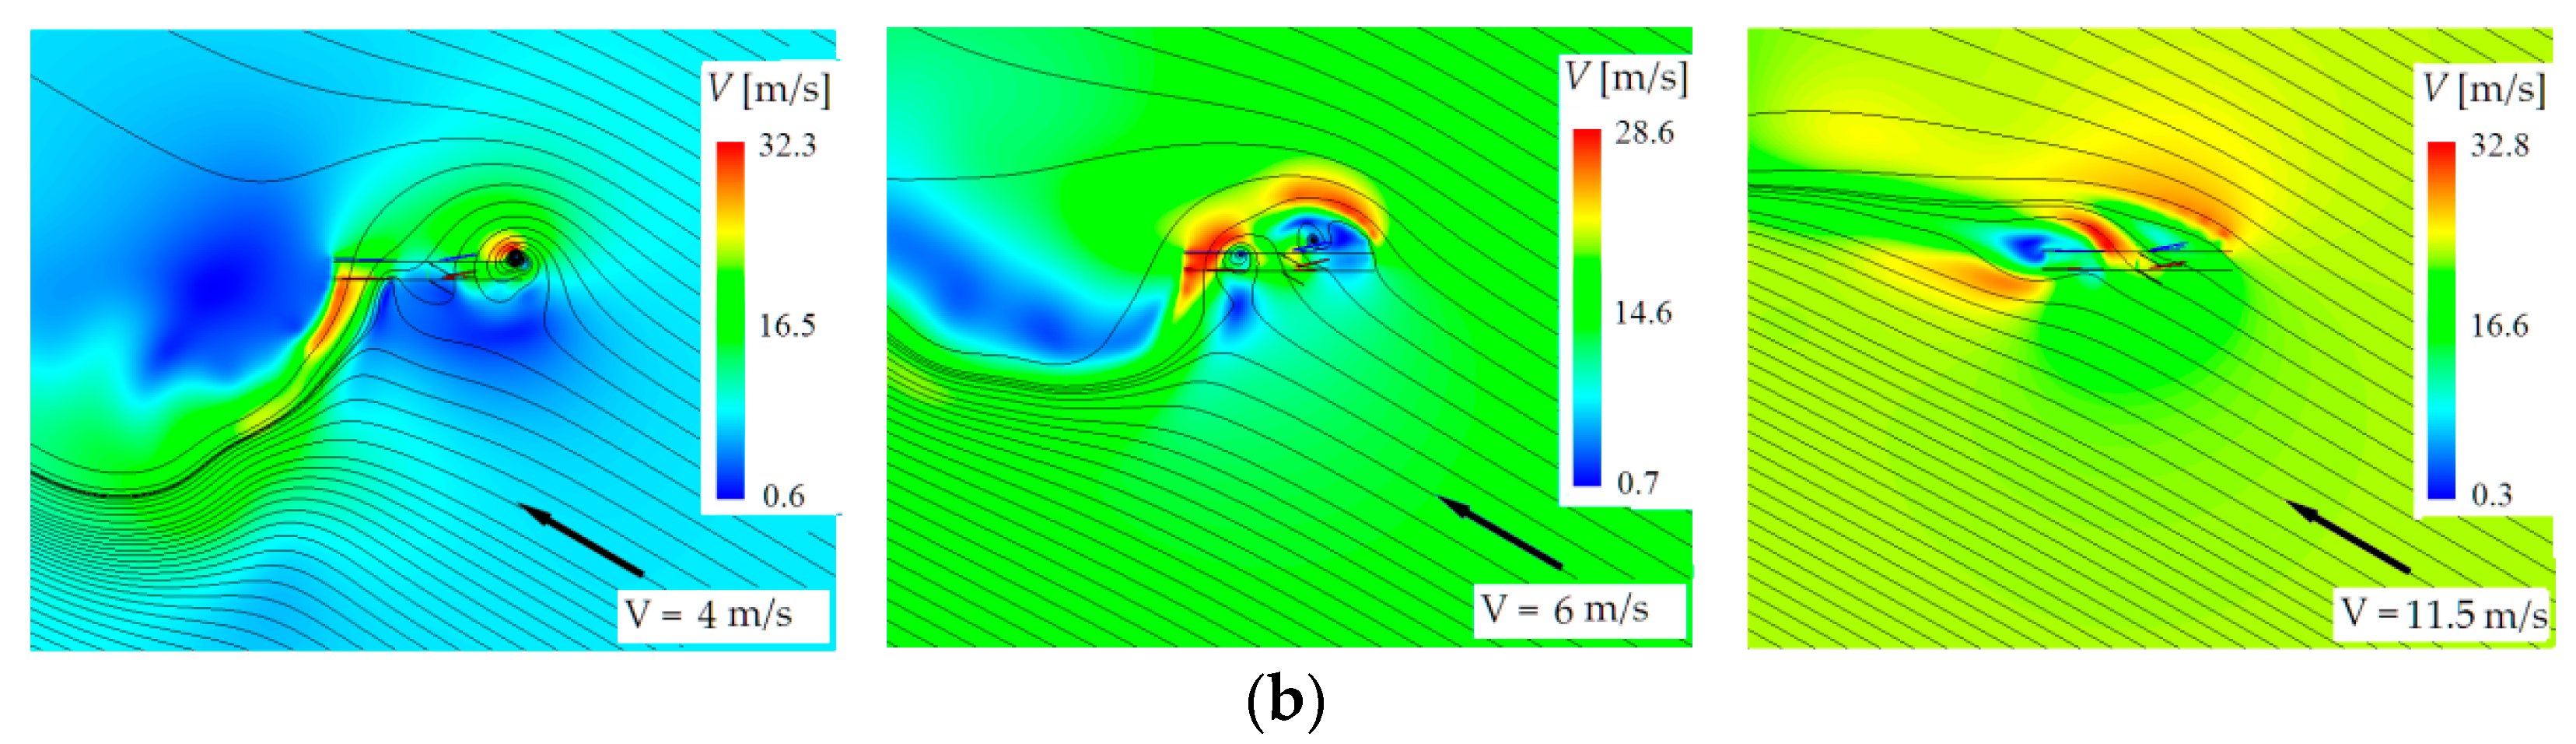
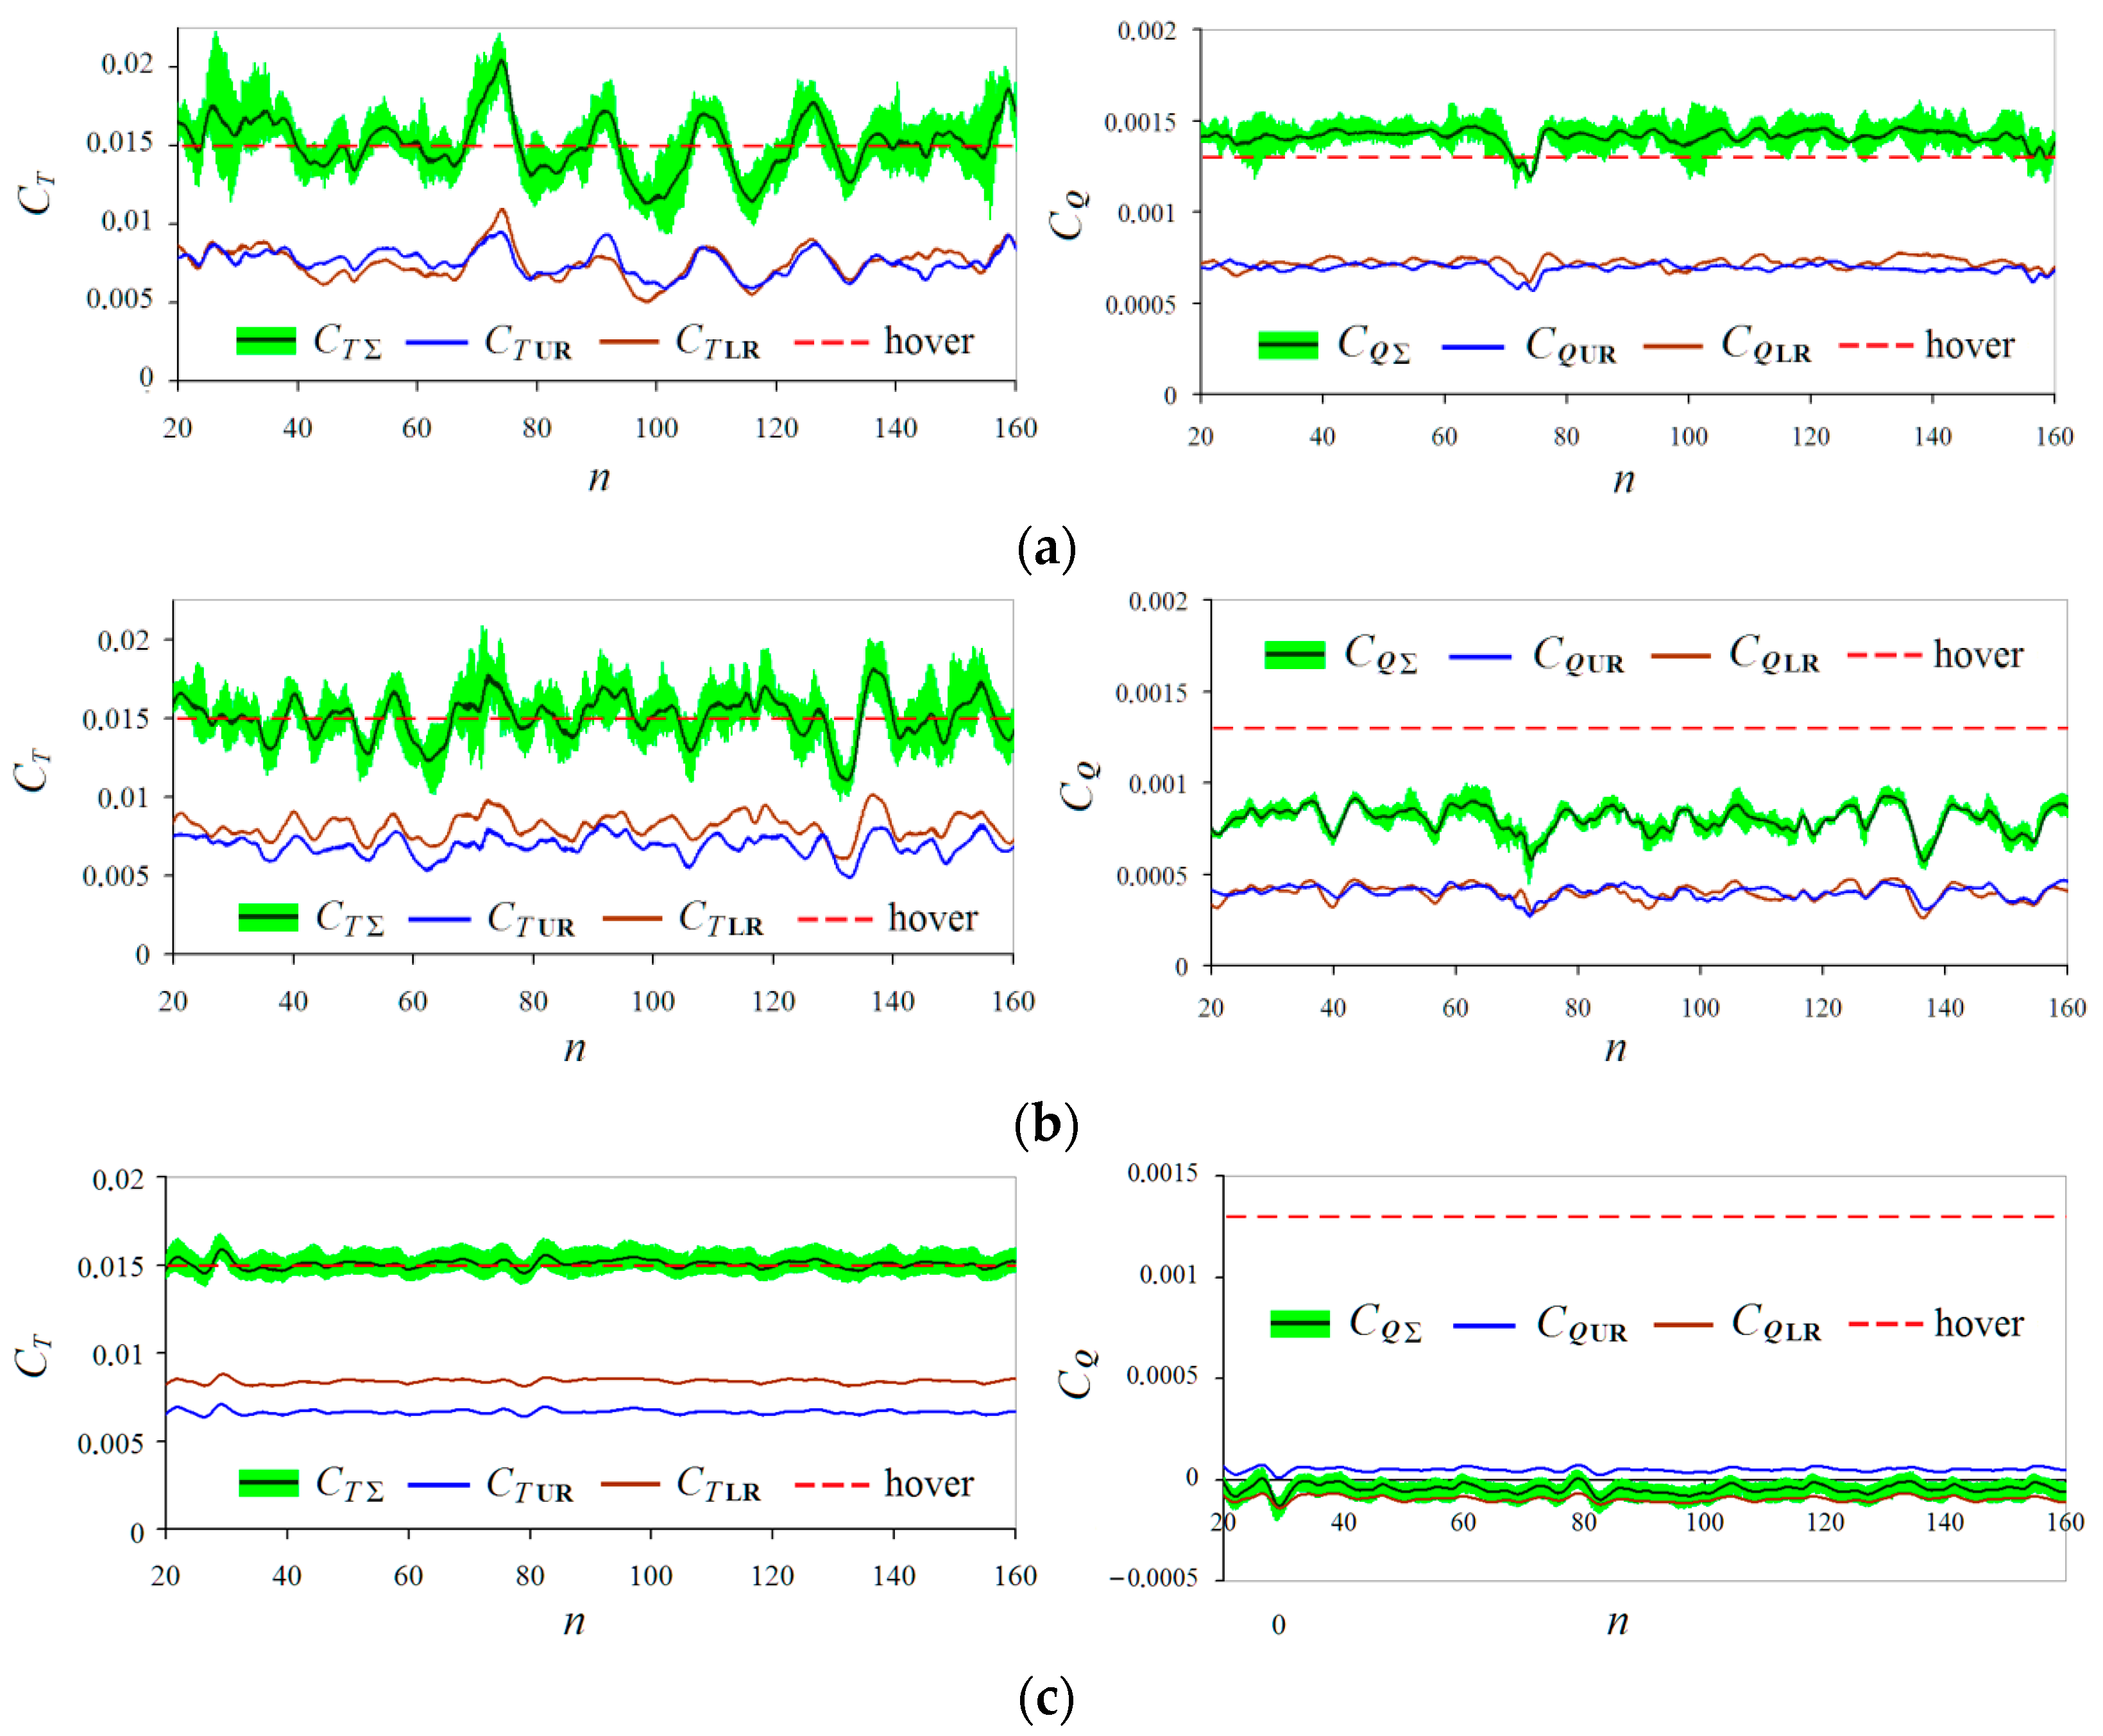
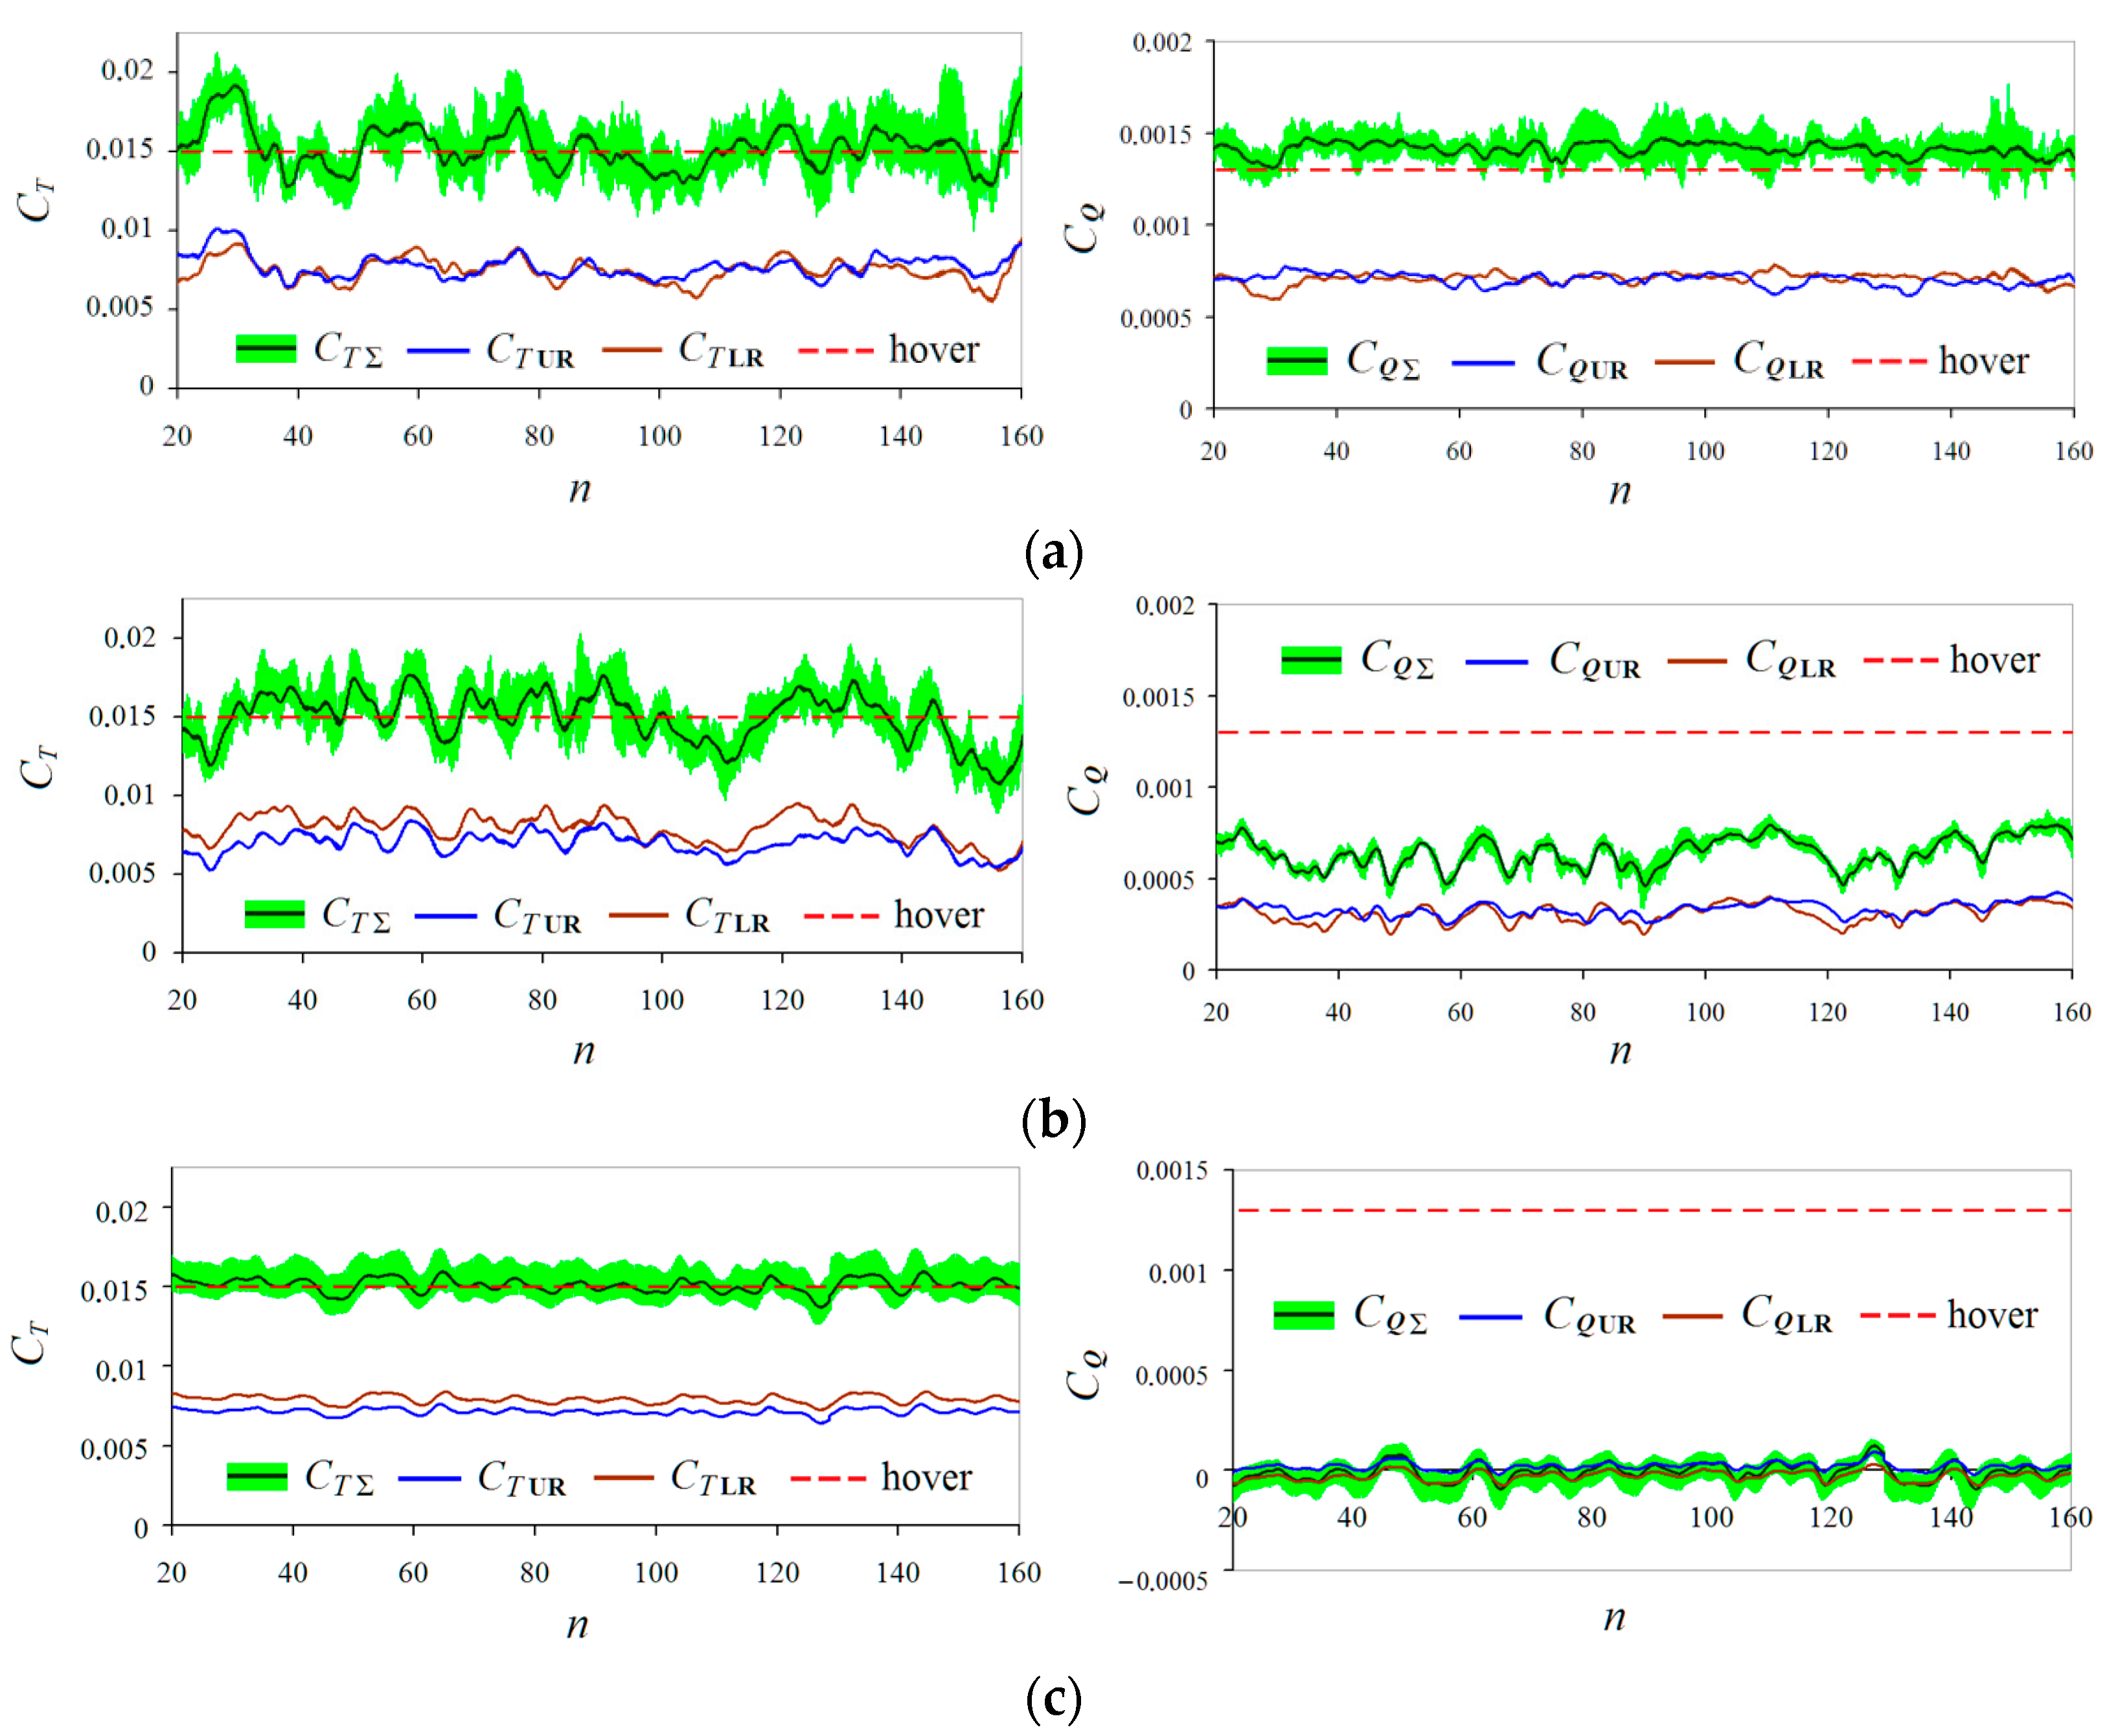
3.2. Coaxial Rotor’s Thrust and Torque Coefficients’ Time-Dependencies in Steep Descent

The analysis of the total aerodynamic characteristics of the rotor, such as thrust and torque coefficients, is one of the main sources for studying the VRS modes and determining their boundaries in the “Vx–Vy” coordinates.
Presented below, in Figure 8, Figure 9, Figure 10 and Figure 11, are the calculated dependencies of the thrust and torque coefficients on the number of the rotor’s revolutions n: CT = f(n) and CQ = f(n) for αR = 70, 50 and 30°. These dependencies are demonstrated for the modes discussed in Section 3.1. For comparison, diagrams in Figure 8, Figure 9, Figure 10 and Figure 11 also include the total thrust and torque coefficients in the hovering mode (red dotted lines). Since the coaxial rotor is considered, thrust and torque dependencies are given both for the UR and LR separately and their sum in total. For the UR and LR, the averaged dependencies of CT and CQ are given. For the total curves CT(UR+LR) and CQ(UR+LR), in addition, instantaneous pulsations are presented. The instantaneous thrust and torque pulsations at hover and high descent rate Vy (“autorotation” and WBS modes) have a frequency of ≈30 Hz. They are associated with interference between the UR and LR blades [29]. The instantaneous thrust and torque pulsations in the VRS and TWS modes have two–three times greater amplitude than in hovering. They have an irregular character due to the unsteady flow around the rotor and are mainly associated with the rotation of blades inside a complex asymmetric vortex wake structure [29]. Instantaneous thrust and torque pulsations in the VRS modes have a frequency of about ≈15 Hz and, therefore, form continuous regions on the given graphs. Due to the high frequency, instantaneous pulsations form solid areas in the diagrams, colored in light green.
Figure 8 shows the dependencies of CT = f(n) and CQ = f(n) obtained at αR = 70° for velocities Vy = 10 m/s (VRS mode), Vy = 16 m/s TWS mode) and Vy = 22 m/s (“autorotation” mode). Unsteady pulsations of averaged thrust and torque coefficients with a period of several rotor’s revolutions as well as high-frequency pulsations of their instantaneous values are observed. These pulsations are the most significant at the VRS (Figure 8a) and TWS (Figure 8b) modes. It can be noted that, in the VRS mode at αR = 70°, the amplitude of thrust pulsations increases and the pulsation period decreases compared to αR = 90° [29]. In the “autorotation” mode (Figure 8c), the thrust and torque pulsations are less significant than in the VRS and TWS modes, and the total torque of the coaxial rotor is zero. It can also be noted that, in the VRS (Figure 8a) and TWS (Figure 8b) modes, the torque of the upper and lower rotors are balanced. Moreover, it follows from the diagrams CT = f(n) in Figure 8 that the time-averaged (averaged over number of n) thrust coefficient values for each of the modes are constant and amount to CTΣ ≈ 0.015. As it has been mentioned above, this is achieved by selecting the appropriate blade pitch angles (see Figure 4). Figure 9 and Figure 10 demonstrate, similar to the diagrams in Figure 8, dependencies for the angles of attack αR = 50 and 30°. At αR = 50° (Figure 9a) and αR = 30° (Figure 10a), the amplitude of the pulsations continues decreasing and the pulsations become more complex and aperiodic. In the TWS modes, the amplitude of thrust pulsations decreases with a decrease in the angle of attack of the rotor αR (Figure 9b and Figure 10b). The torque pulsations in the TWS modes for all angles of attack of the rotor (Figure 8b, Figure 9b and Figure 10b) have greater amplitudes than in the VRS modes. At the “autorotation” modes, small pulsations of the rotor thrust and torque are observed at all considered angles of attack of the rotor, except at αR = 30° (Figure 10c). The increase in the rotor torque observed in the VRS modes (see Figure 8a, Figure 9a and Figure 10a) is relative to the hovering mode at a fixed thrust and has the following values: 111% at αR = 70°; 108%, at αR = 50°; 103% for αR = 30°.
Thus, from the analysis of the dependencies CT = f(n) and CQ = f(n) for αR = 30–70° in Figure 8, Figure 9 and Figure 10, it follows that, with a decrease in the angle of attack of the rotor αR, the characteristic indication (criteria) for the VRS modes weakens significantly: the amplitudes of the thrust and torque pulsations decrease; the rise in the rotor torque (required power) in comparison with the hovering mode becomes less.
The analysis of the rotor’s aerodynamic characteristics at all ranges of vertical descent velocities Vy and at all considered angles of attack of the rotor (including the data of work [29]) makes it possible to determine the boundaries of the VRS modes in the coordinates “Vx–Vy”.

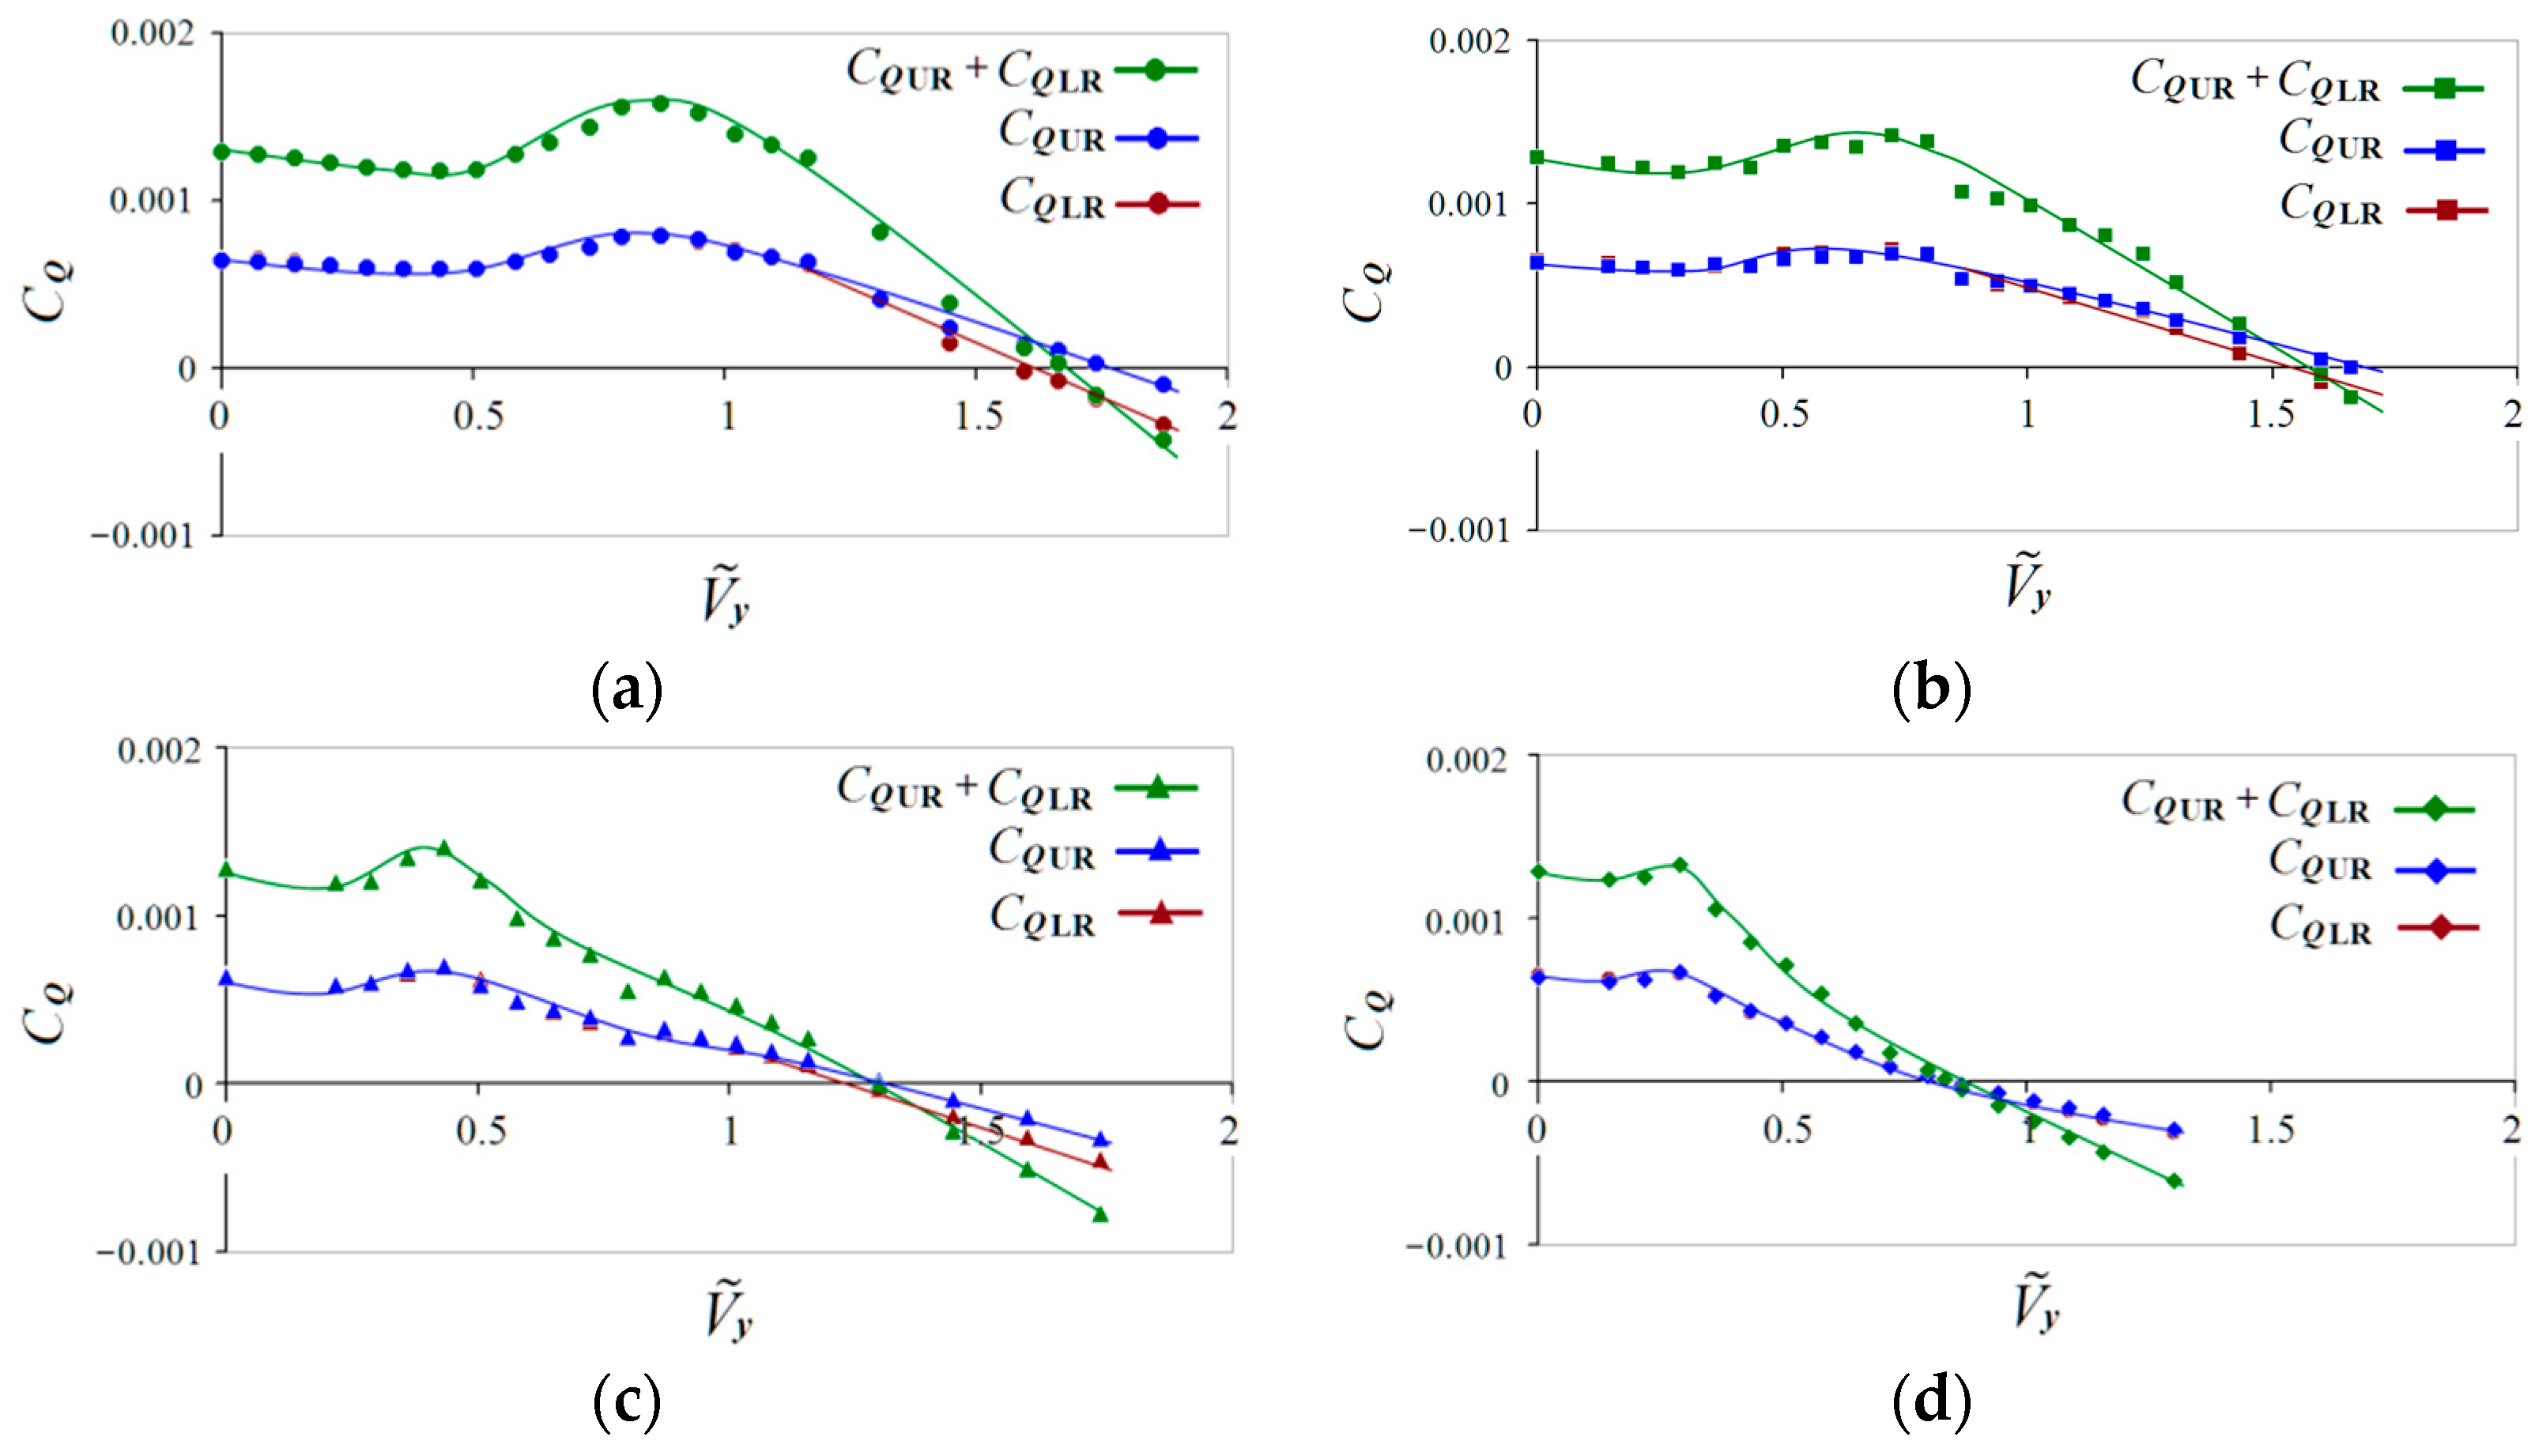
3.3. Total Aerodynamic Characteristics of the Rotor Analysis

It is known that the descent of a helicopter in the VRS area at a fixed rotor blade pitch angle can lead to a drop in the rotor thrust. This criterion is often used when analyzing the boundaries of the VRS area in experimental [7,12,15,20] and numerical [26,28] studies. Maintaining a constant thrust of the rotor by increasing the blade pitch angles leads to an increase in the rotor torque (power consumption). In this paper, studies of the steep descent modes of the coaxial main rotor have been performed under the condition of a fixed time-averaged total thrust value CTΣ ≈ 0.015 = constant. This made it possible to estimate the increase in the rotor torque compared to the hovering mode, which is very important and significant for practical results.
In Figure 11, for the angles of attack of the rotor CQΣ/CQΣh = 90, 70, 50 and 30°, the separate dependencies of the torque coefficients of upper CQUR and lower CQLR rotors and total torque CQΣ on the non-dimensional vertical descent speed V ˜ y are presented. Here, V ˜ y is the vertical descent speed Vy, related to the induced velocity in the hovering mode: V ˜ y = V y / v y. The data used for αR = 90° (Figure 11a) had been previously obtained in [29]. The data for αR = 70, 50 and 30° (Figure 11b–d) have been obtained in the presented study. In the VRS modes, a characteristic increase in the rotor’s torque is relative to the hovering mode. It can also be seen from the diagrams in Figure 11 that, with a decrease in the angle of attack of the rotor, the non-dimensional vertical rate of descent V ˜ y associated with the “autorotation” mode (CQΣ = 0) at first occurs slightly, and then sharply decreases. For αR = 90° and αR = 70°, these velocities are close and equal to V ˜ y   ≈ 1.66 and V ˜ y   ≈ 1.6, respectively. At αR = 50°, V ˜ y   ≈ 1.23 (22% less), and at αR = 30°, the speed of “autorotation” V ˜ y   ≈ 0.83, which is almost two times less than at αR = 70°. In addition, from Figure 11a–d, it follows that the use of obtained blade pitch angles laws (see Figure 3) made it possible to balance the coaxial rotor in torque (CQUR = CQLR) almost over the entire range of the Vy speeds except the “autorotation” modes. The analysis of the VRS boundaries according to the criterion of rotor torque (power) growth (CQΣ/CQΣh > 1) will be given below.
Figure 11. Dependencies of the UR, LR and total (UR + LR) torque coefficients CQ vs. non-dimensional vertical descent speed V ˜ y at αR = 30–90°. (a) αR = 90°; (b) αR = 70°; (c) αR = 50°; (d) αR = 30°.
Aerospace 09 00061 g011
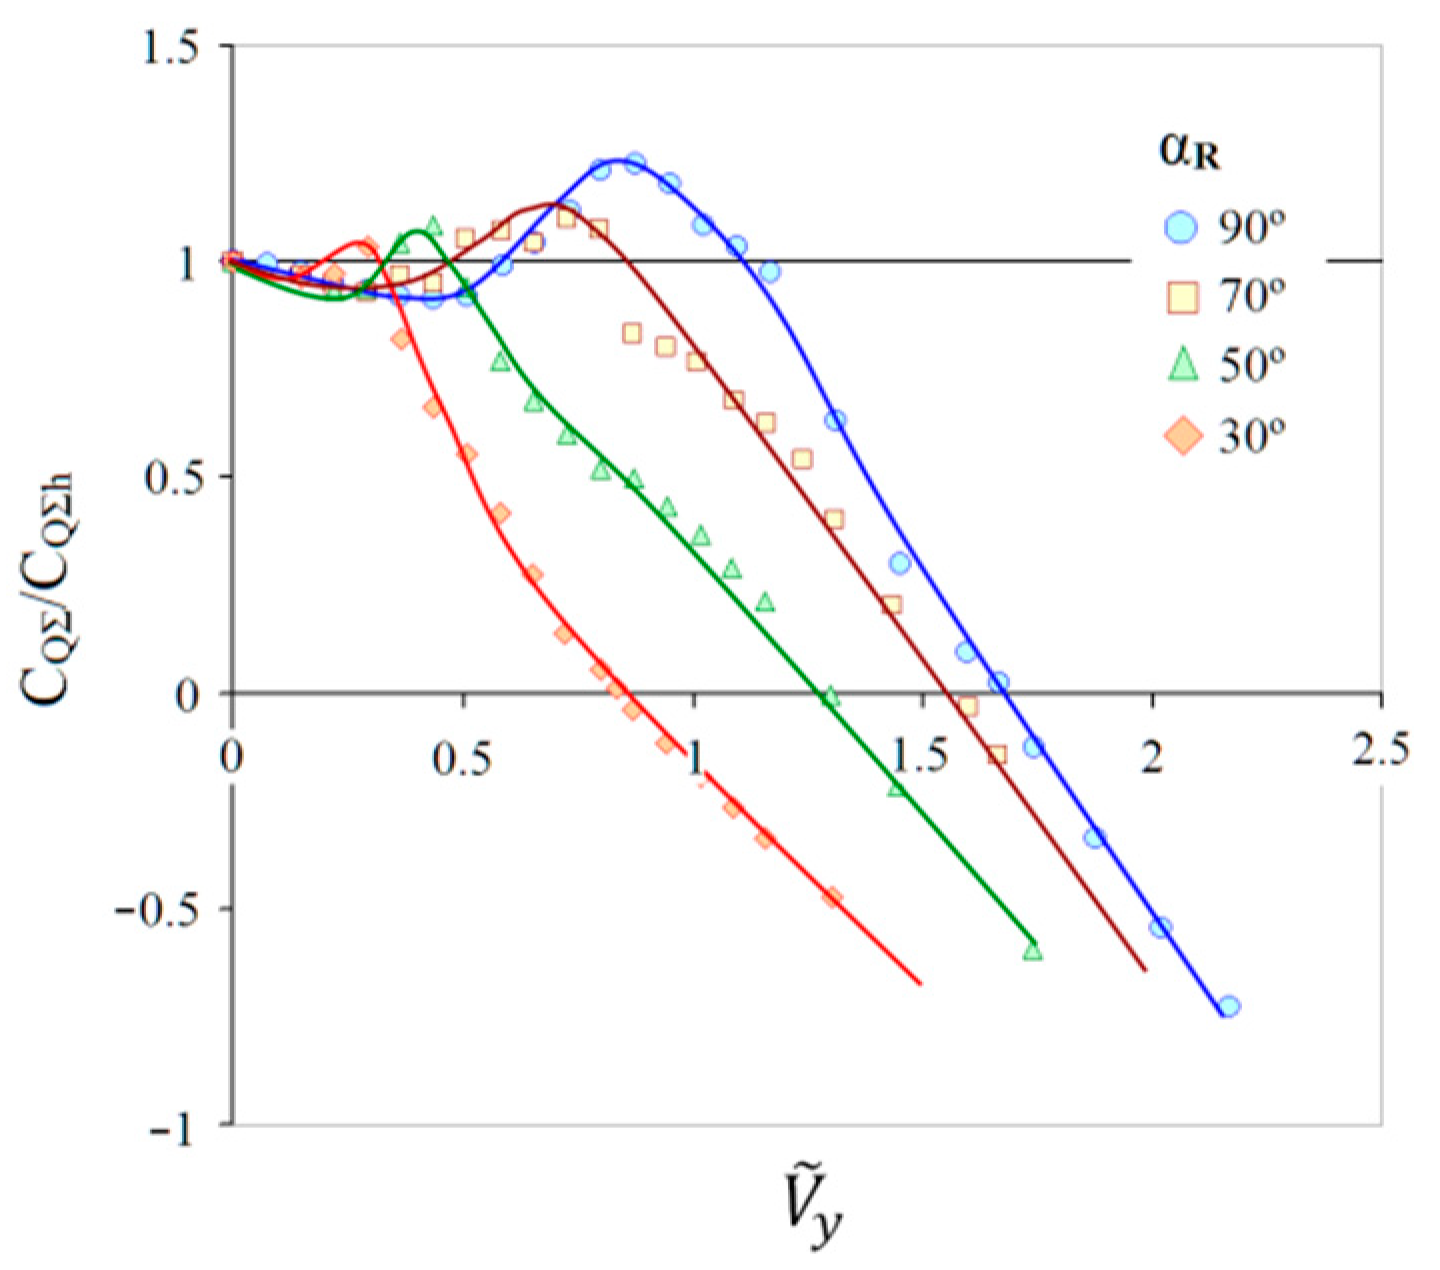
Figure 12 shows the dependencies of relative torque coefficient CQΣ/CQΣh on the non-dimensional vertical descent speed V ˜ y , obtained on the basis of data from Figure 11. From Figure 12, it can be seen that, at first, with an increase in the speed V ˜ y (for all αR values), a decrease in the relative torque coefficient is observed. This means that the power consumption of the rotor decreases, reaching values of ≈0.92 (at αR = 90° and V ˜ y ≈ 0.4) from the power in hovering mode. Further, there is an increase in relative torque coefficient CQΣ/CQΣh > 1 in a certain range of vertical descent speed V ˜ y . The region where CQΣ/CQΣh > 1 is the region of the VRS modes. With a further increase in vertical descent speed, the relative torque coefficient decreases again. At CQΣ/CQΣh = 0, the rotor enters the “autorotation” mode, and at CQΣ/CQΣh <0, the rotor enters to the WBS modes. It can be seen from the presented diagrams that the region of the VRS modes decreases significantly with a decrease in the angle of attack αR, and also shifts to lower values of the vertical descent speed V ˜ y . For αR = 90°, the boundaries of the VRS modes according to the CQΣ/CQΣh > 1 criterion observed within V ˜ y ≈ 0.6–1.1, for αR = 70° within V ˜ y ≈ 0.48–0.85, for αR = 50° within V ˜ y ≈ 0.34–0.48 and for αR = 30° within V ˜ y ≈ 0.26–0.3. The points of the curves CQΣ/CQΣh = f ( V ˜ y ) where the coefficients CQΣ/CQΣh reach maximum values correspond to the “peak” modes of the VRS. These modes have been analyzed in detail in Section 3.1 and Section 3.2 of the article. The maximum increase in the relative torque coefficient reaches 22% (CQΣ/CQΣh ≈ 1.22) at αR = 90° and V ˜ y ≈ 0.87. At αR = 70° and αR = 50°, the increase in torque is 11% (CQΣ/CQΣh ≈ 1.11) and 8% (CQΣ/CQΣh ≈ 1.08), respectively. At αR = 30°, the increase in torque is about 3% (CQΣ/CQΣh ≈ 1.03). Thus, in the descent modes with angles αR = 70–90°, the signs of the VRS modes and the associated negative outcomes such as an increase in the rotor power consumptions are manifested most strongly.
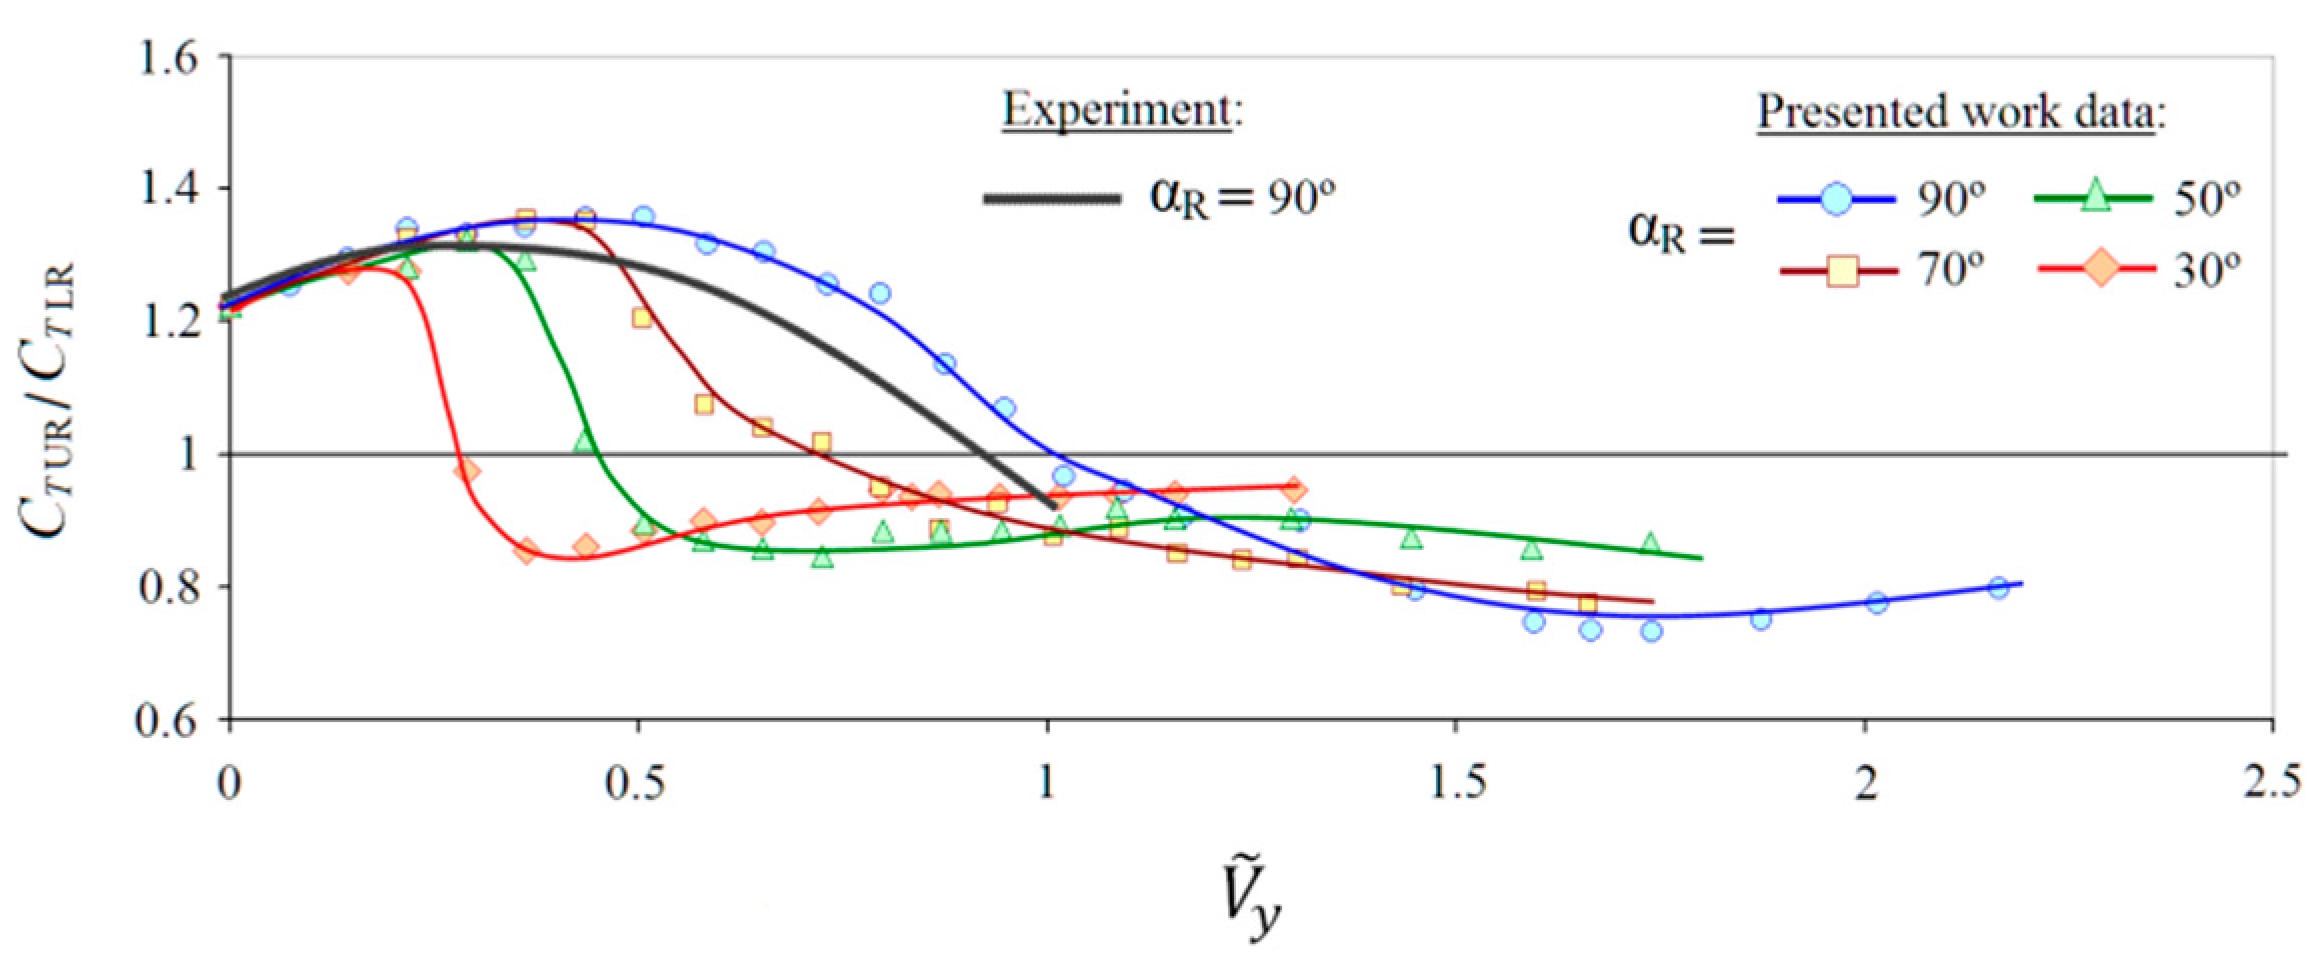
A characteristic feature of the coaxial rotor in the hovering mode is the unequal distribution of thrust between the LR and UR due to aerodynamic interference. If the UR and LR are torque-balanced, the thrust of the UR is usually 20–25% higher than the thrust of the LR [7,31,32]. In this regard, the distribution of thrust between the rotors in vertical and steep descents is of high interest. Figure 13 shows the dependencies of the ratio between UR and LR thrust CTUR/CTLR = f( V ˜ y ) for αR = 30–90°. In the hovering mode, the CTUR/CTLR ≈ 1.22 [29]. Further, in a certain range of vertical descent speeds V ˜ y , the value of the CTUR/CTLR gradually increases to values of 1.3–1.4. With an increase in the speed of V ˜ y , when the rotor falls into the VRS modes area, the value of the CTUR/CTLR sharply decreases and reaches the value of the CTUR/CTLR ≈ 1 in the “peak” modes of the VRS. After that, with a further increase in the speed V ˜ y , the ratio of the thrust of the UR and LR changes—the thrust of the lower rotor becomes higher than the thrust of the UR. In addition, Figure 13 shows the CTUR/CTLR curve obtained for αR = 90° in [7] for CTΣ/σ = 0.16. There is a satisfactory agreement with the obtained calculation results.
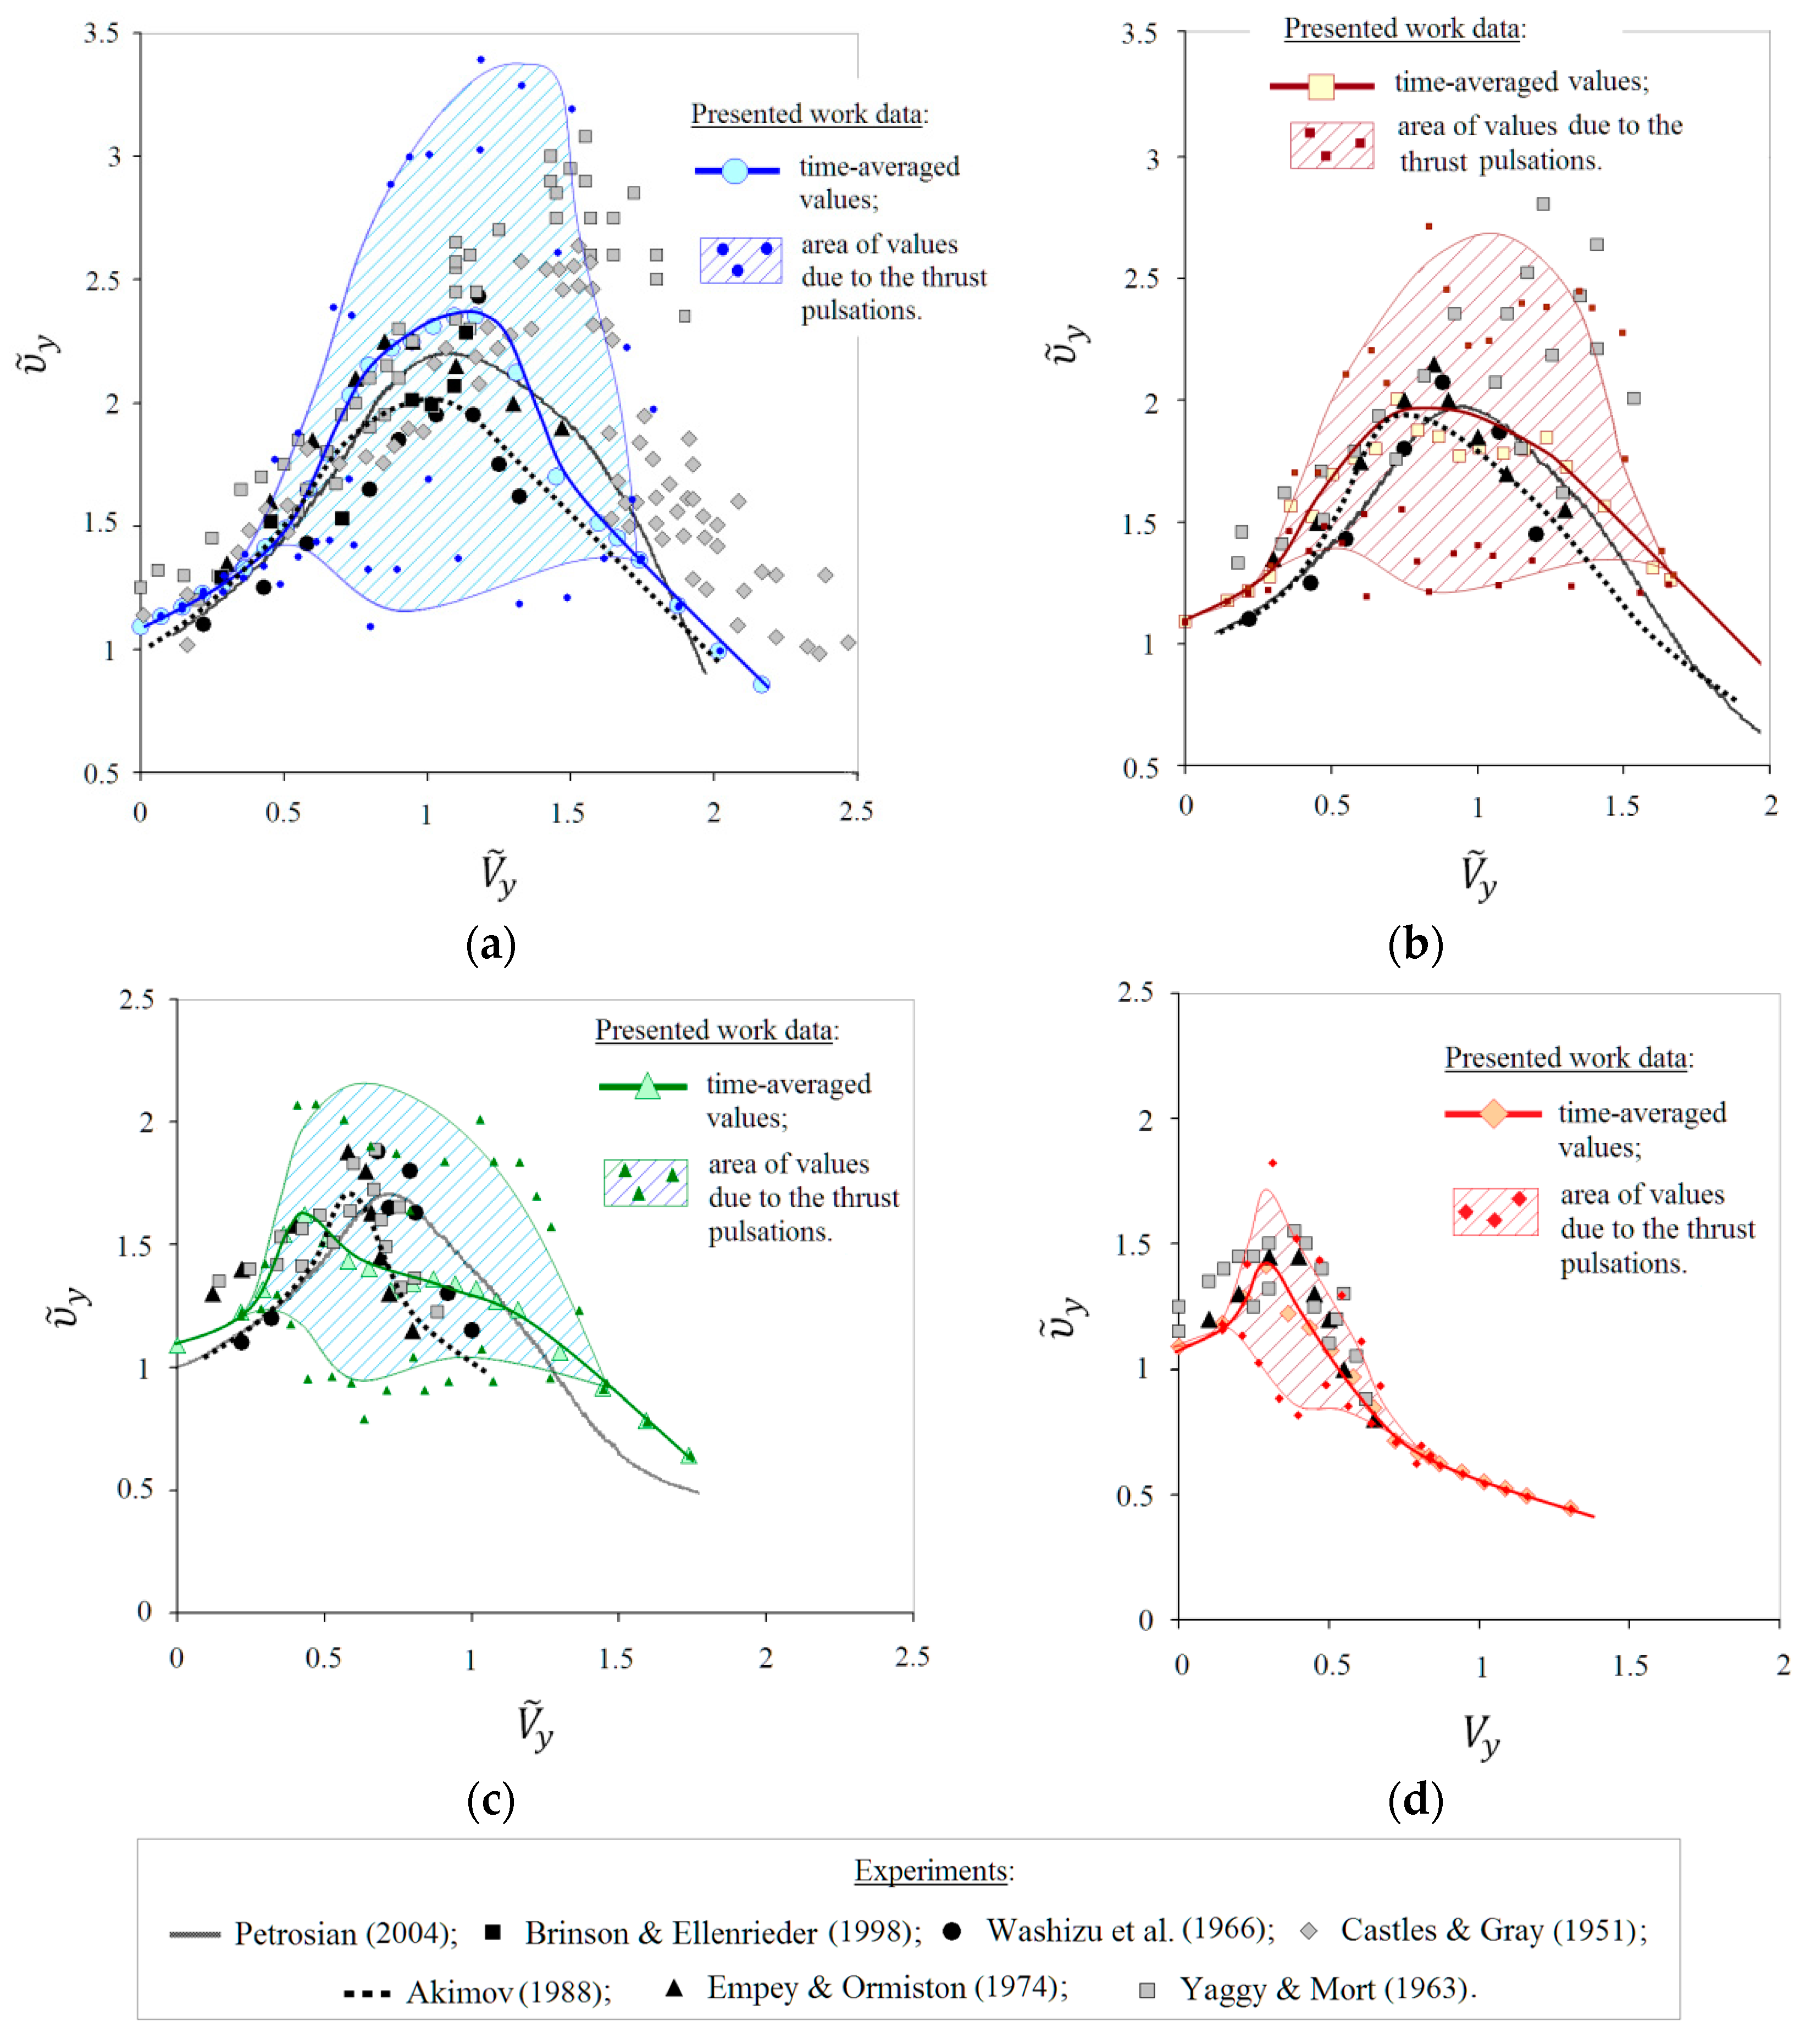
With the increase in the required power in the VRS modes, a significant increase in the induced velocity of the rotor is observed; it reaches two–three times that of the hovering mode. Usually, the results of experimental and numerical studies of the VRS modes include the dependencies of the non-dimensional induced velocity υ ˜ y of the rotor on the non-dimensional vertical descent speed V ˜ y . Such dependencies for the considered modes are shown in Figure 14. The dependence of υ ˜ y = f( V ˜ y ) for αR = 90° (see Figure 14a) had been previously obtained in [29], and the dependencies for αR = 70, 50 and 30° (see Figure 14b–d) have been obtained in the presented study. Taking into account the thrust pulsations, this diagram can be represented as an area, as shown in Figure 14. An increase in the induced velocity υ ˜ y above a threshold value can also serve as one of the criteria for the VRS modes boundary. In addition to the calculated curves υ ˜ y = f( V ˜ y ), Figure 14 also shows a number of experimental dependencies obtained by various authors [6,7,10,11,12,16,17]. These are experiments performed for different conditions, different types and sizes of rotors and various experimental rigs. In [7], a model of a coaxial rotor in the WT has been studied, in [6,12], a model of a single rotor has been installed on a moving track and, in [11], rotors with a large blade twist (not typical for helicopter rotors) have been tested. For this reason, the experimental data have significant differences. Nevertheless, for all the angles of attack of the rotor, there is a good qualitative agreement between the calculation and the experimental data. Based on the analysis of the calculated data (Figure 14), we note that, with a decrease in the angle αR, the maximum time-averaged value υ ˜ y decreases and shifts to the left. Thus, at αR = 90°, the non-dimensional induced velocity reaches the value of υ ˜ y ≈ 2.3 at V ˜ y ≈ 1 (Figure 14a), at αR = 70° of the value of υ ˜ y ≈ 2 at V ˜ y ≈ 0.7 (Figure 14b), at αR = 50° of the value of υ ˜ y ≈ 1.6 at V ˜ y ≈ 0.45 (Figure 14c), and at αR = 30° of the value of υ ˜ y ≈ 1.4 at V ˜ y ≈ 0.3 (Figure 14d). The boundaries of the VRS modes for the criterion υ ˜ y > 1.5 observed within the limits are: V ˜ y ≈ 0.7–1.0 at αR = 90°, V ˜ y ≈ 0.7–1.0 at αR = 70° and V ˜ y ≈ 0.7–1.0 at αR = 50°. At αR = 30°, there is no VRS mode within the selected criterion (Figure 14d).
One more criterion used to identify the VRS modes and determine their boundaries is the pulsation of aerodynamic loads on the rotor associated with unsteadiness of these modes. This is expressed in unsteady pulsations of the total aerodynamic characteristics of the rotor such as rotor thrust and torque. The relationship of thrust and torque pulsations with unsteady flow around the rotor has been considered above in Section 3.1 and Section 3.2 on the example of the most characteristic modes from the VRS area. The dependences of the thrust coefficients CT = f(n) and the torque coefficients CQ = f(n), taking into account the pulsations, have been presented in Figure 8, Figure 9 and Figure 10. The analysis of such dependencies allows for estimating the changes in the thrust and torque pulsations for all considered operating modes (Figure 3). The amplitude of the thrust coefficient pulsations is defined as ΔCTΣ/2 = (CTΣmaxCTΣmin)/2. It is easy to express this as a percentage of the time-averaged thrust, which is equal for all calculated modes CTΣ ≈ 0.015 = constant. The amplitude of the torque coefficient pulsations is defined as ΔCQΣ/2 = (CQΣmaxCQΣmin)/2. Here, it is expressed as a percentage of the total torque of the rotor in hovering mode.
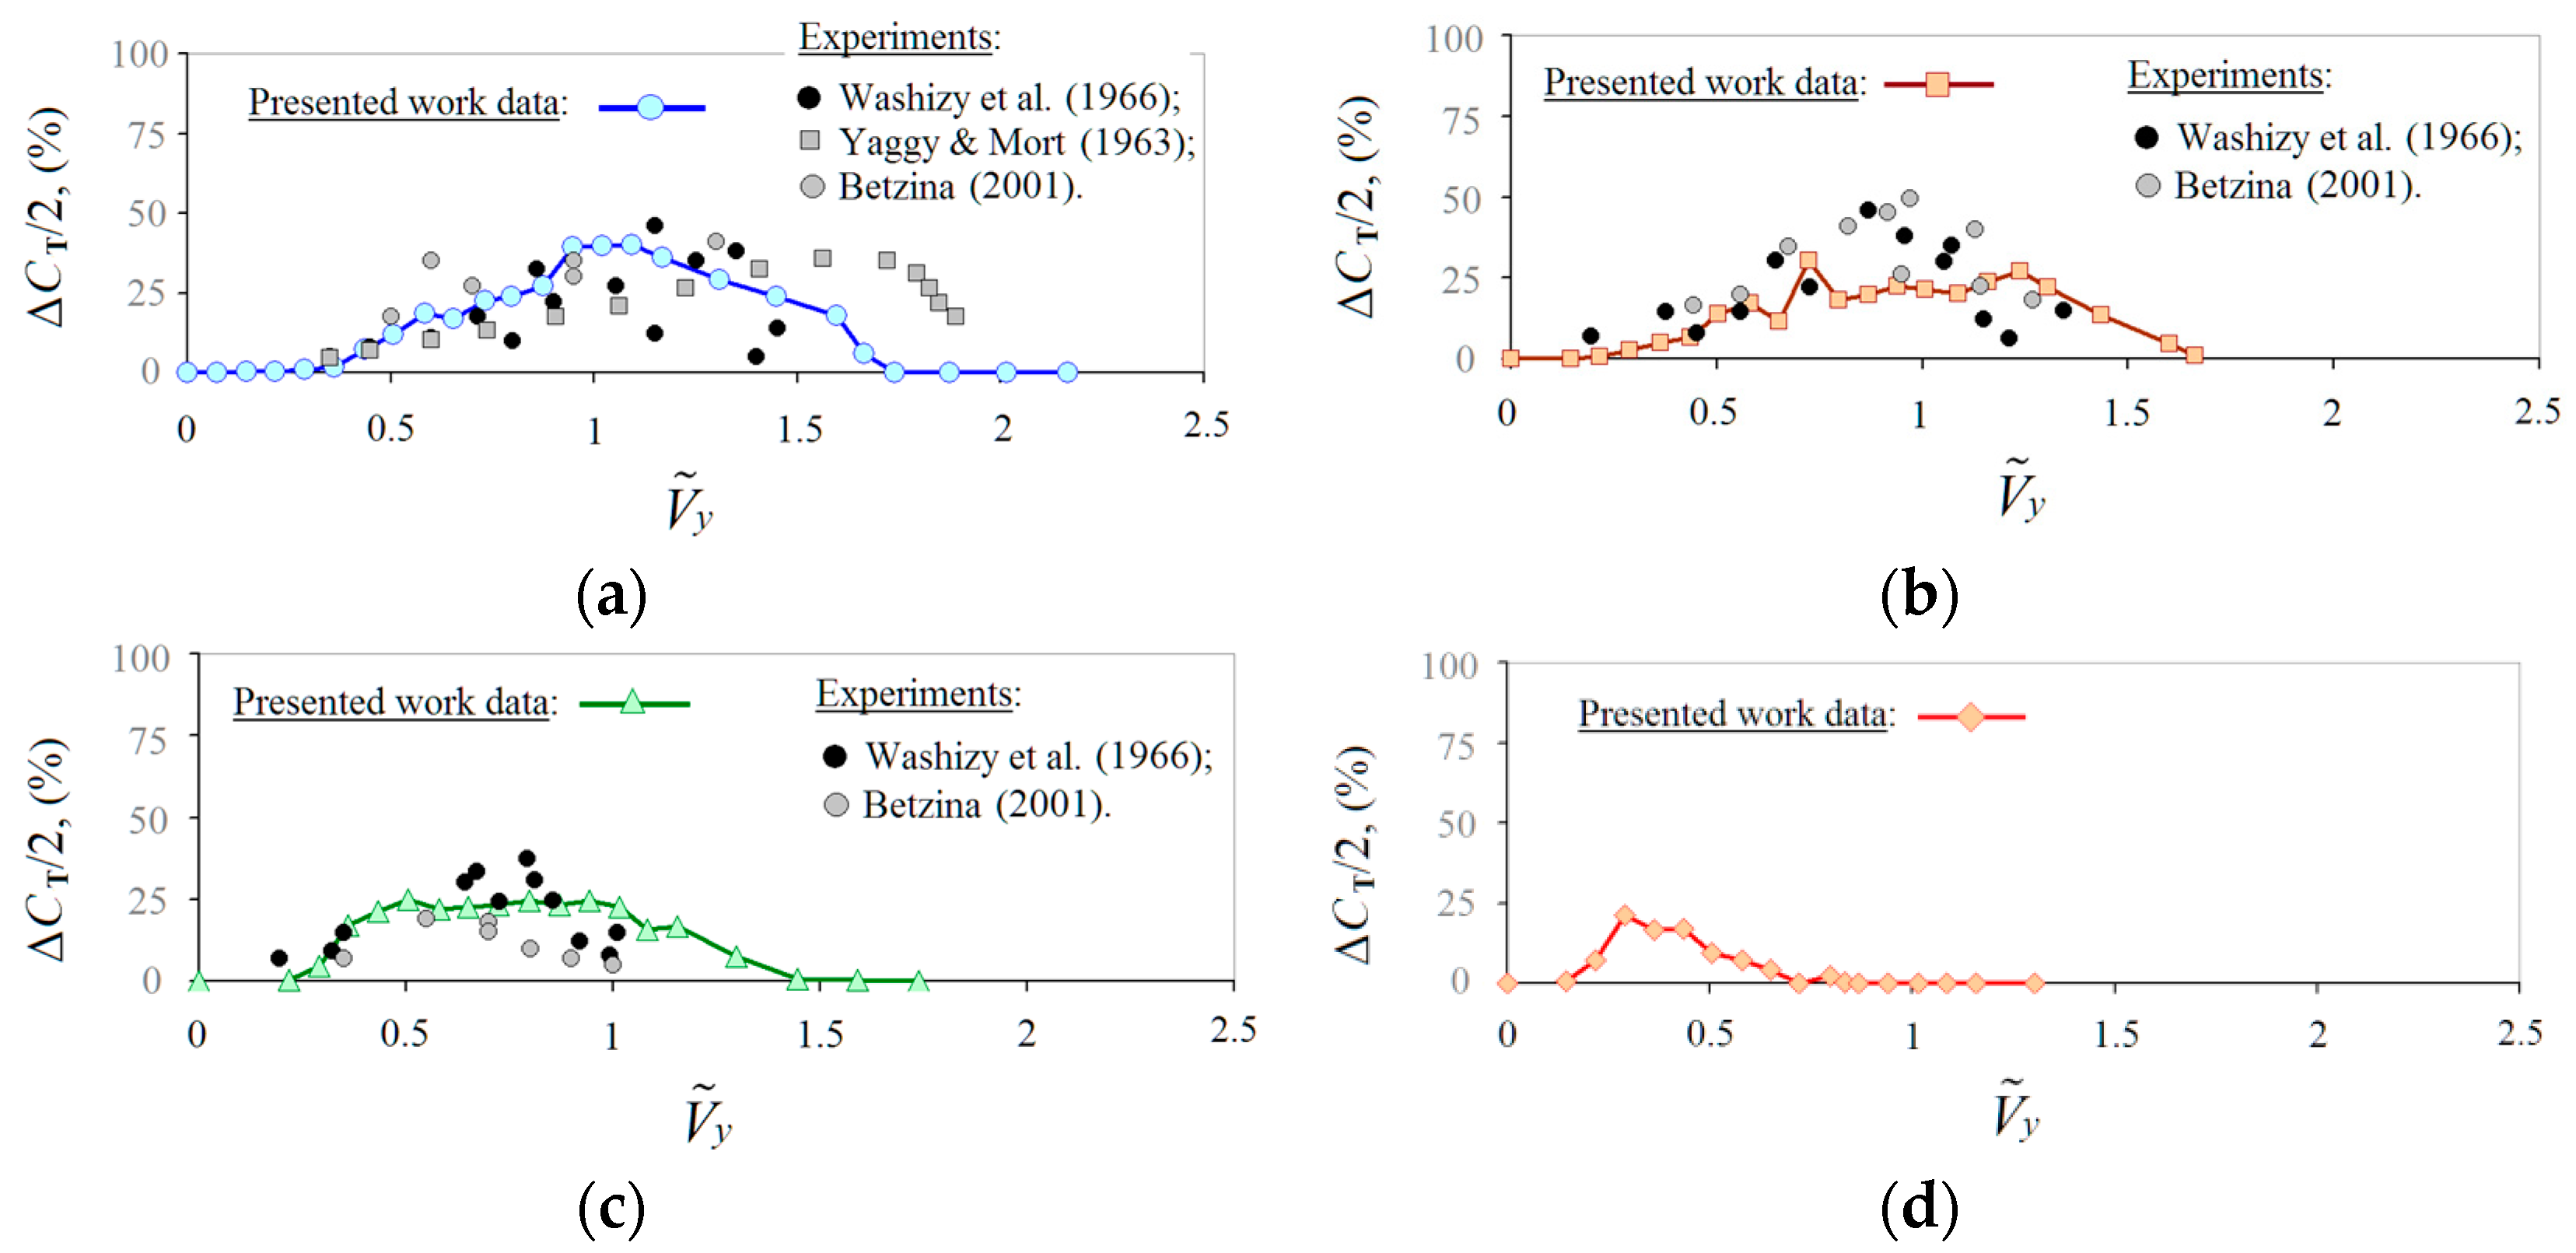
Figure 15 shows the diagram of rotor thrust coefficient pulsations amplitude ΔCTΣ/2 = ( V ˜ y ) for αR = 30–90°. Here, in addition to the calculation results, some experimental data [11,12,14] are also given. These data have been obtained for various experimental conditions and various model-scale single rotors. In the introduction section, it has been shown that, nowadays, there is no such published experimental or calculated data for full-scale coaxial rotors. However, there is a satisfactory qualitative agreement between the results of calculations and the experimental data presented. The greatest thrust pulsations are observed at αR = 90° (Figure 15a), and they reach an amplitude of ΔCTΣ/2 = 40% at V ˜ y ≈ 1–1.1. With a decrease in the angle αR, the amplitude of thrust pulsations decreases significantly and shifts to lower values of V ˜ y . At αR = 70° (Figure 15b), the maximum amplitude of thrust pulsations reaches the value ΔCTΣ/2 ≈ 30% at V ˜ y ≈ 0.73, at αR = 50° (Figure 15c) ΔCTΣ/2 ≈ 24% at V ˜ y ≈ 0.5 and V ˜ y ≈ 0.95 and at αR = 30° (Figure 15d) ΔCTΣ/2 ≈ 20% at V ˜ y ≈ 0.3. Further, the criterion ΔCTΣ/2 > 20% has been taken to determine the boundaries of the VRS modes.
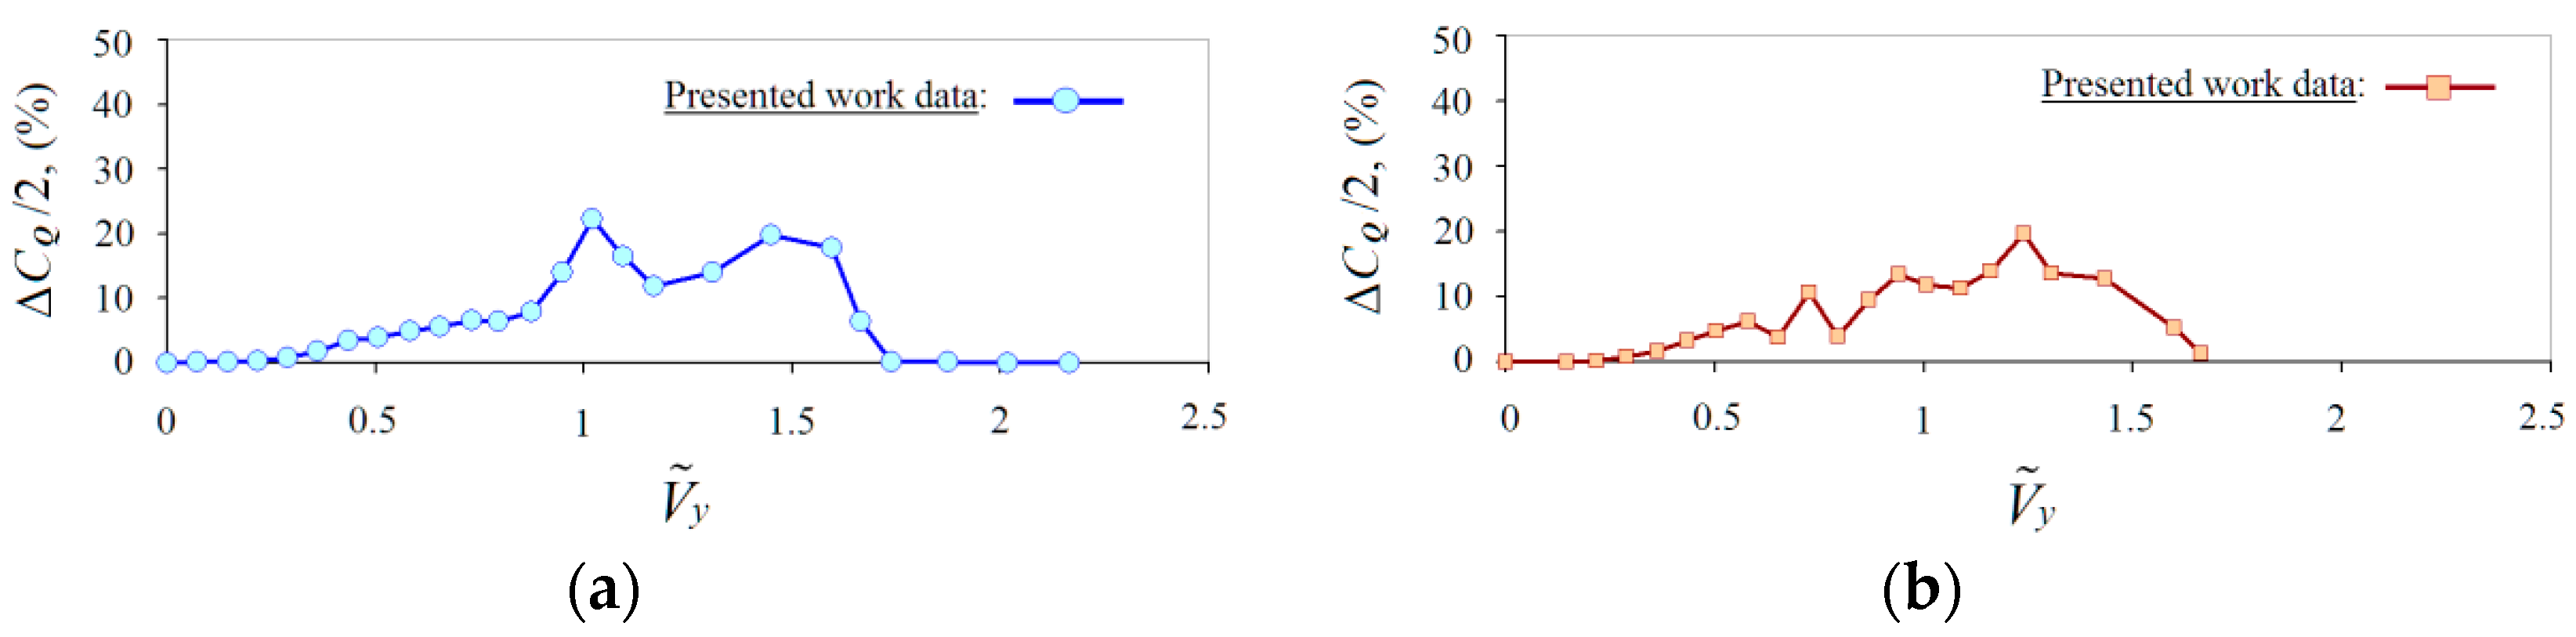
Figure 16 shows the diagram of the rotor torque coefficient pulsations amplitude ΔCQΣ/2 = ( V ˜ y ) for αR = 30–90°. The largest torque pulsations are observed at αR = 90° (Figure 16a) and reach an amplitude of ΔCQΣ/2 ≈ 22% at V ˜ y ≈ 1. At αR = 70° (Figure 16b), the point of the maximum amplitude of the torque pulsations is shifted to the right by the value of vertical descent speed V ˜ y ≈ 1.24, and reaches a value of ΔCQΣ/2 ≈ 19%. At αR = 50° (Figure 16c), the pulsations reach ΔCQΣ/2 ≈ 18% in the range of V ˜ y ≈ 0.7–1. At αR = 30° (Figure 16d), the torque pulsations decrease by almost two times their original value and reach ΔCQΣ/2 ≈ 10% at V ˜ y ≈ 0.44. Further, the criterion ΔCQΣ/2 > 10% has been taken to determine the boundaries of the VRS modes.
From the comparison of the diagrams in Figure 15 and Figure 16, it can also be concluded that the regions with large pulsations of the rotor torque are significantly shifted to the right at high speeds V ˜ y relative to the regions with large thrust pulsations.

3.4. Total Aerodynamic Characteristics of the Rotor Analysis

In the final part of the study, the boundaries of the VRS modes area have been obtained on the basis of the criteria formulated and analyzed above in Section 3.3.
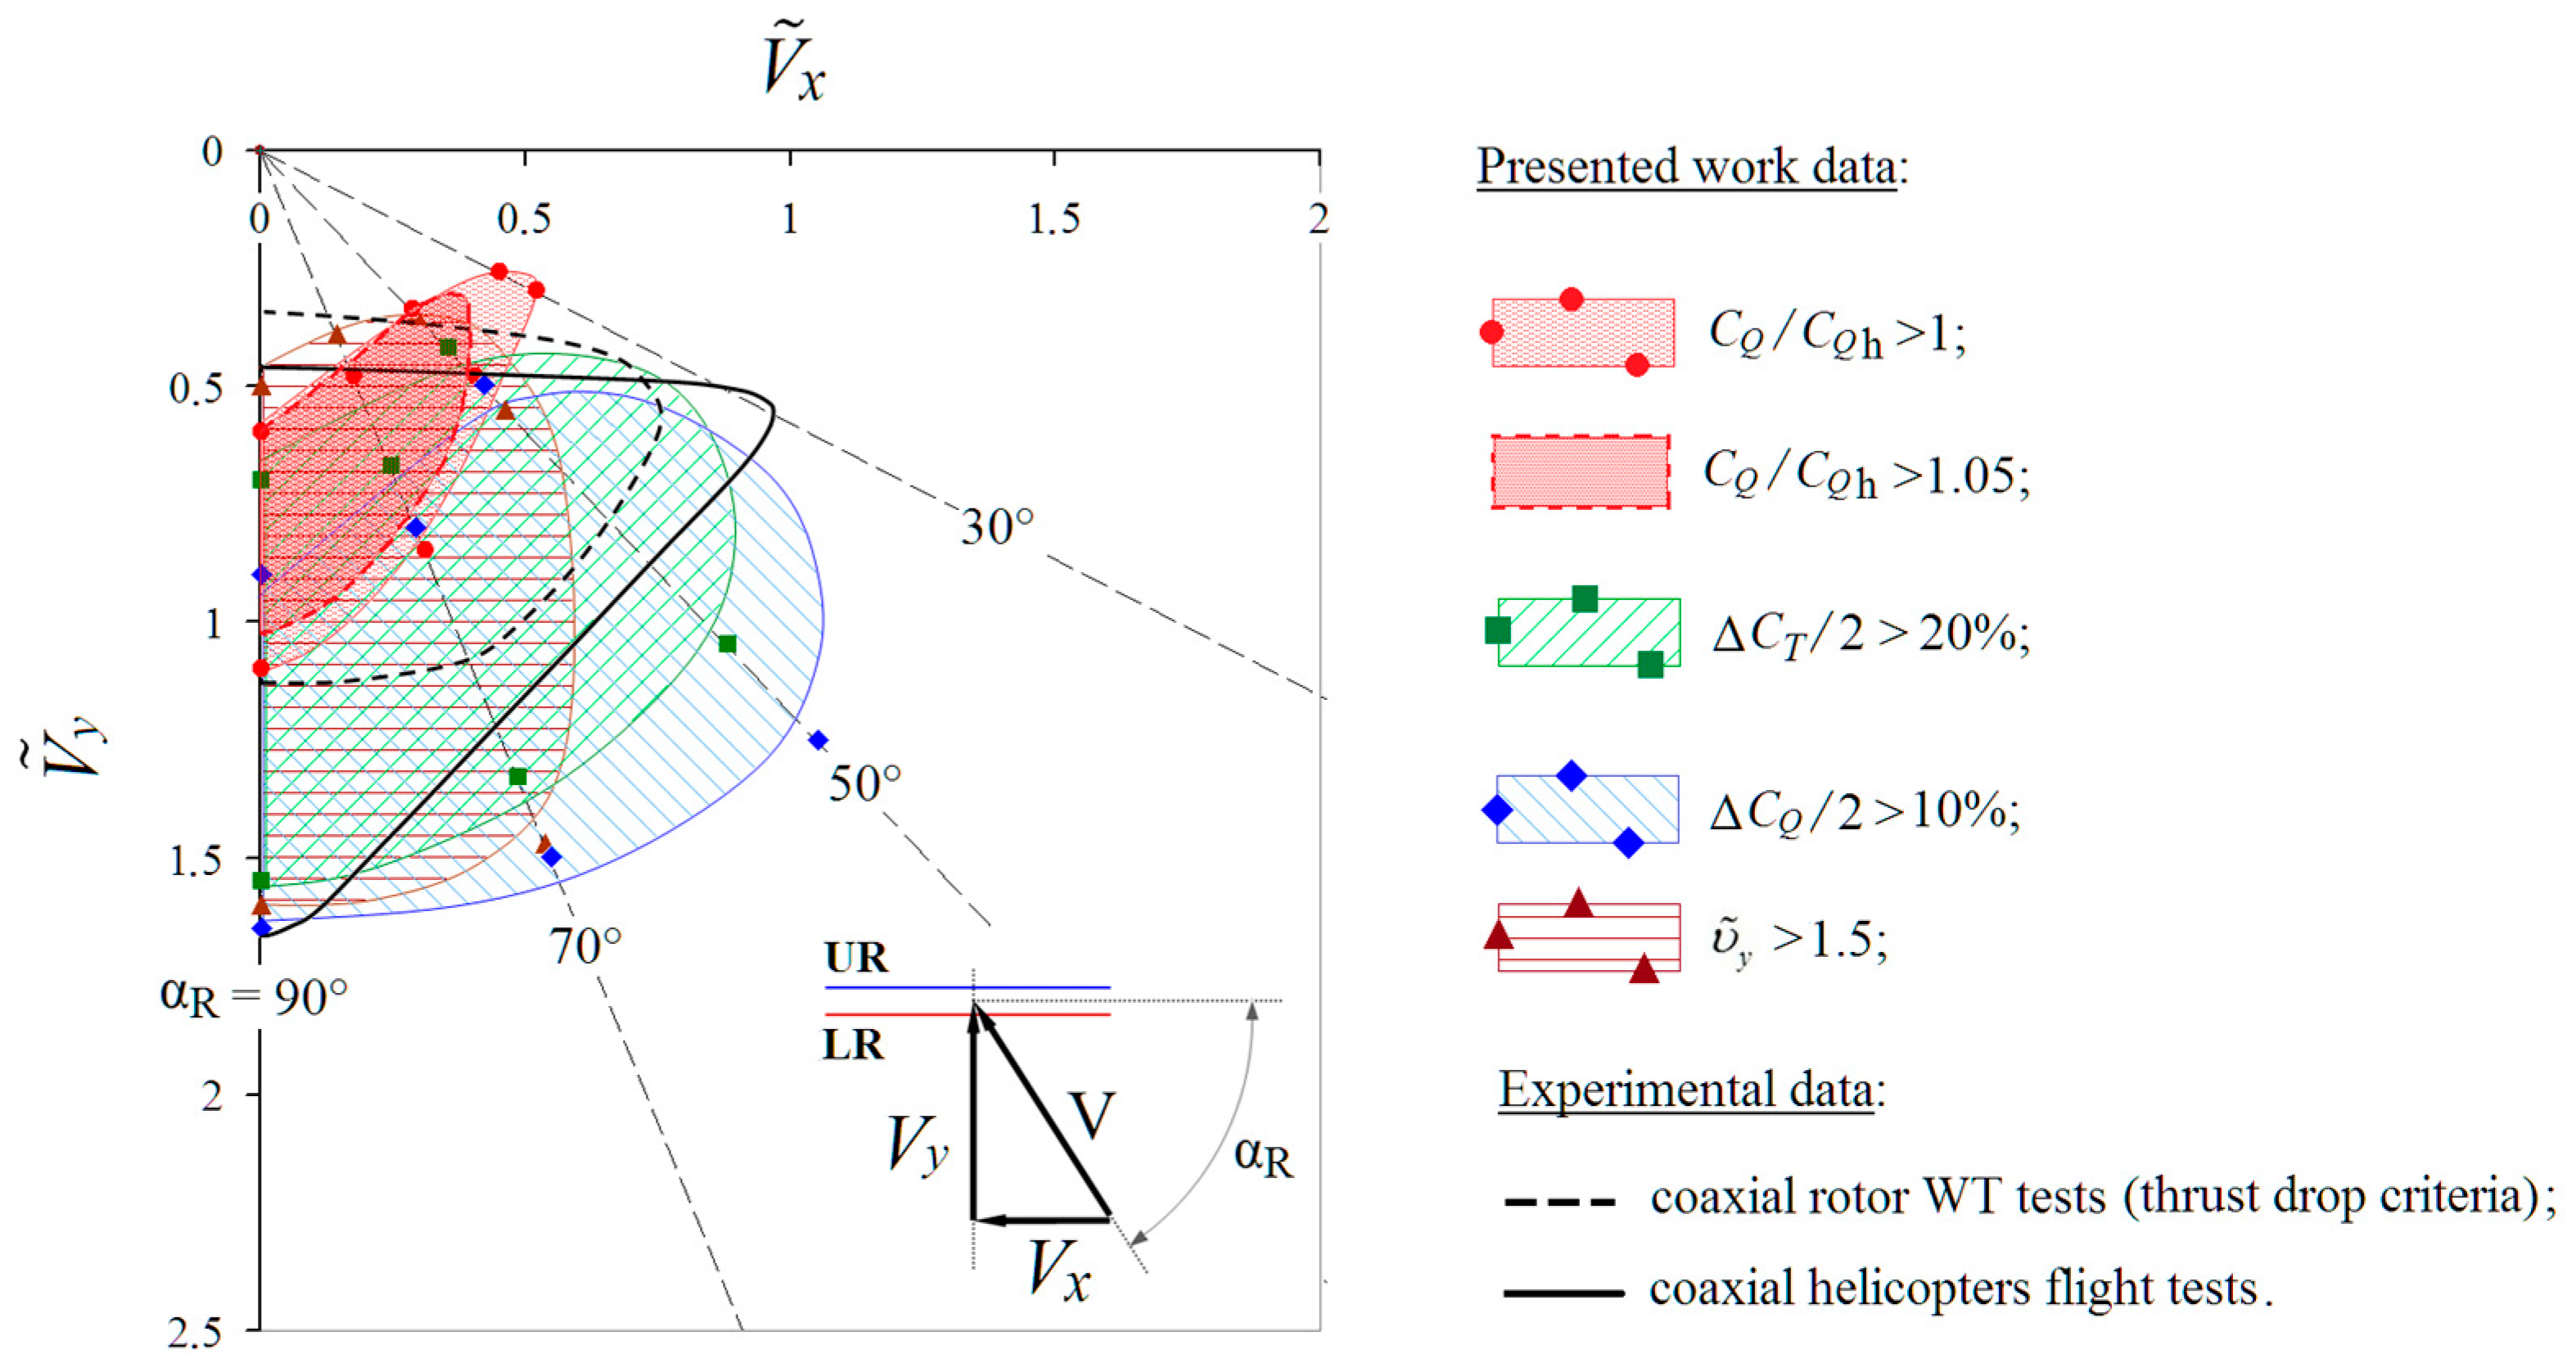
The final diagram with the areas of the VRS modes in non-dimensional flight speed coordinates “ V ˜ x V ˜ y ” is shown in Figure 17. The following criteria have been used: an increase in the relative torque coefficient of the rotor (required power) CQΣ/CQΣh > 1 and CQΣ/CQΣh > 1.05; an increase in the non-dimensional induced velocity υ ˜ y > 1.5; the amplitude of pulsations of the total thrust coefficient ΔCTΣ/2 > 20% (compared with the average value of CTΣ ≈ 0.015 = constant); the amplitude of the pulsations of the total torque coefficient ΔCQΣ/2 > 10% (compared to the total hovering torque). The diagram in Figure 17 shows that approximate areas with different fills are plotted around the calculated points corresponding to the boundaries of the VRS mode region according to various criteria for various angles αR = 30–90°.
It should be noted that, when choosing other values for the VRS criteria, the corresponding areas may change. In addition to the calculated areas, Figure 17 shows two experimental dependencies for a coaxial rotor obtained on the basis of model and flight tests published in [7]. The first is an experimental curve obtained for a model of a coaxial rotor in WT according to the criterion of thrust drop at a fixed blade pitch angle. The second is the curve obtained on the basis of flight tests of coaxial scheme helicopters. Here, the entry into the area of the VRS modes has been evaluated by the appearance of vibrations, and with a further increase in the rate of descent by shaking and deterioration of the helicopter’s controllability. It can be seen that the calculated upper border of the VRS mode area, obtained by the criterion of thrust and torque pulsation, is close to the experimental boundary, constructed by the criterion of vibrations and shaking of the helicopter. Since the vibrations and shaking of the helicopter are primarily associated with the pulsations of aerodynamic loads on the rotor, we can conclude that there is a satisfactory agreement between the experimental and calculated data. For the lower border, there is a good coincidence of calculations and experiments with a vertical descent (αR = 90°). For the steep descent modes (αR = 50–70°), the calculated boundary of the VRS modes according to the criterion of thrust and torque pulsations is significantly lower than the experimental one, and the calculated boundary of the VRS modes according to the criterion of torque growth is satisfactorily consistent with the experimental curve obtained according to the criterion of the thrust drop. At αR = 30°, the calculated VRS boundary is located at lower rates of descent.
Thus, the boundaries of the VRS modes shown in Figure 17, according to various criteria, make it possible to assess the areas of occurrence of specific features in the aerodynamic characteristics of the rotor. This fact is extremely important when analyzing the aerodynamics of the rotor in steep descent modes.
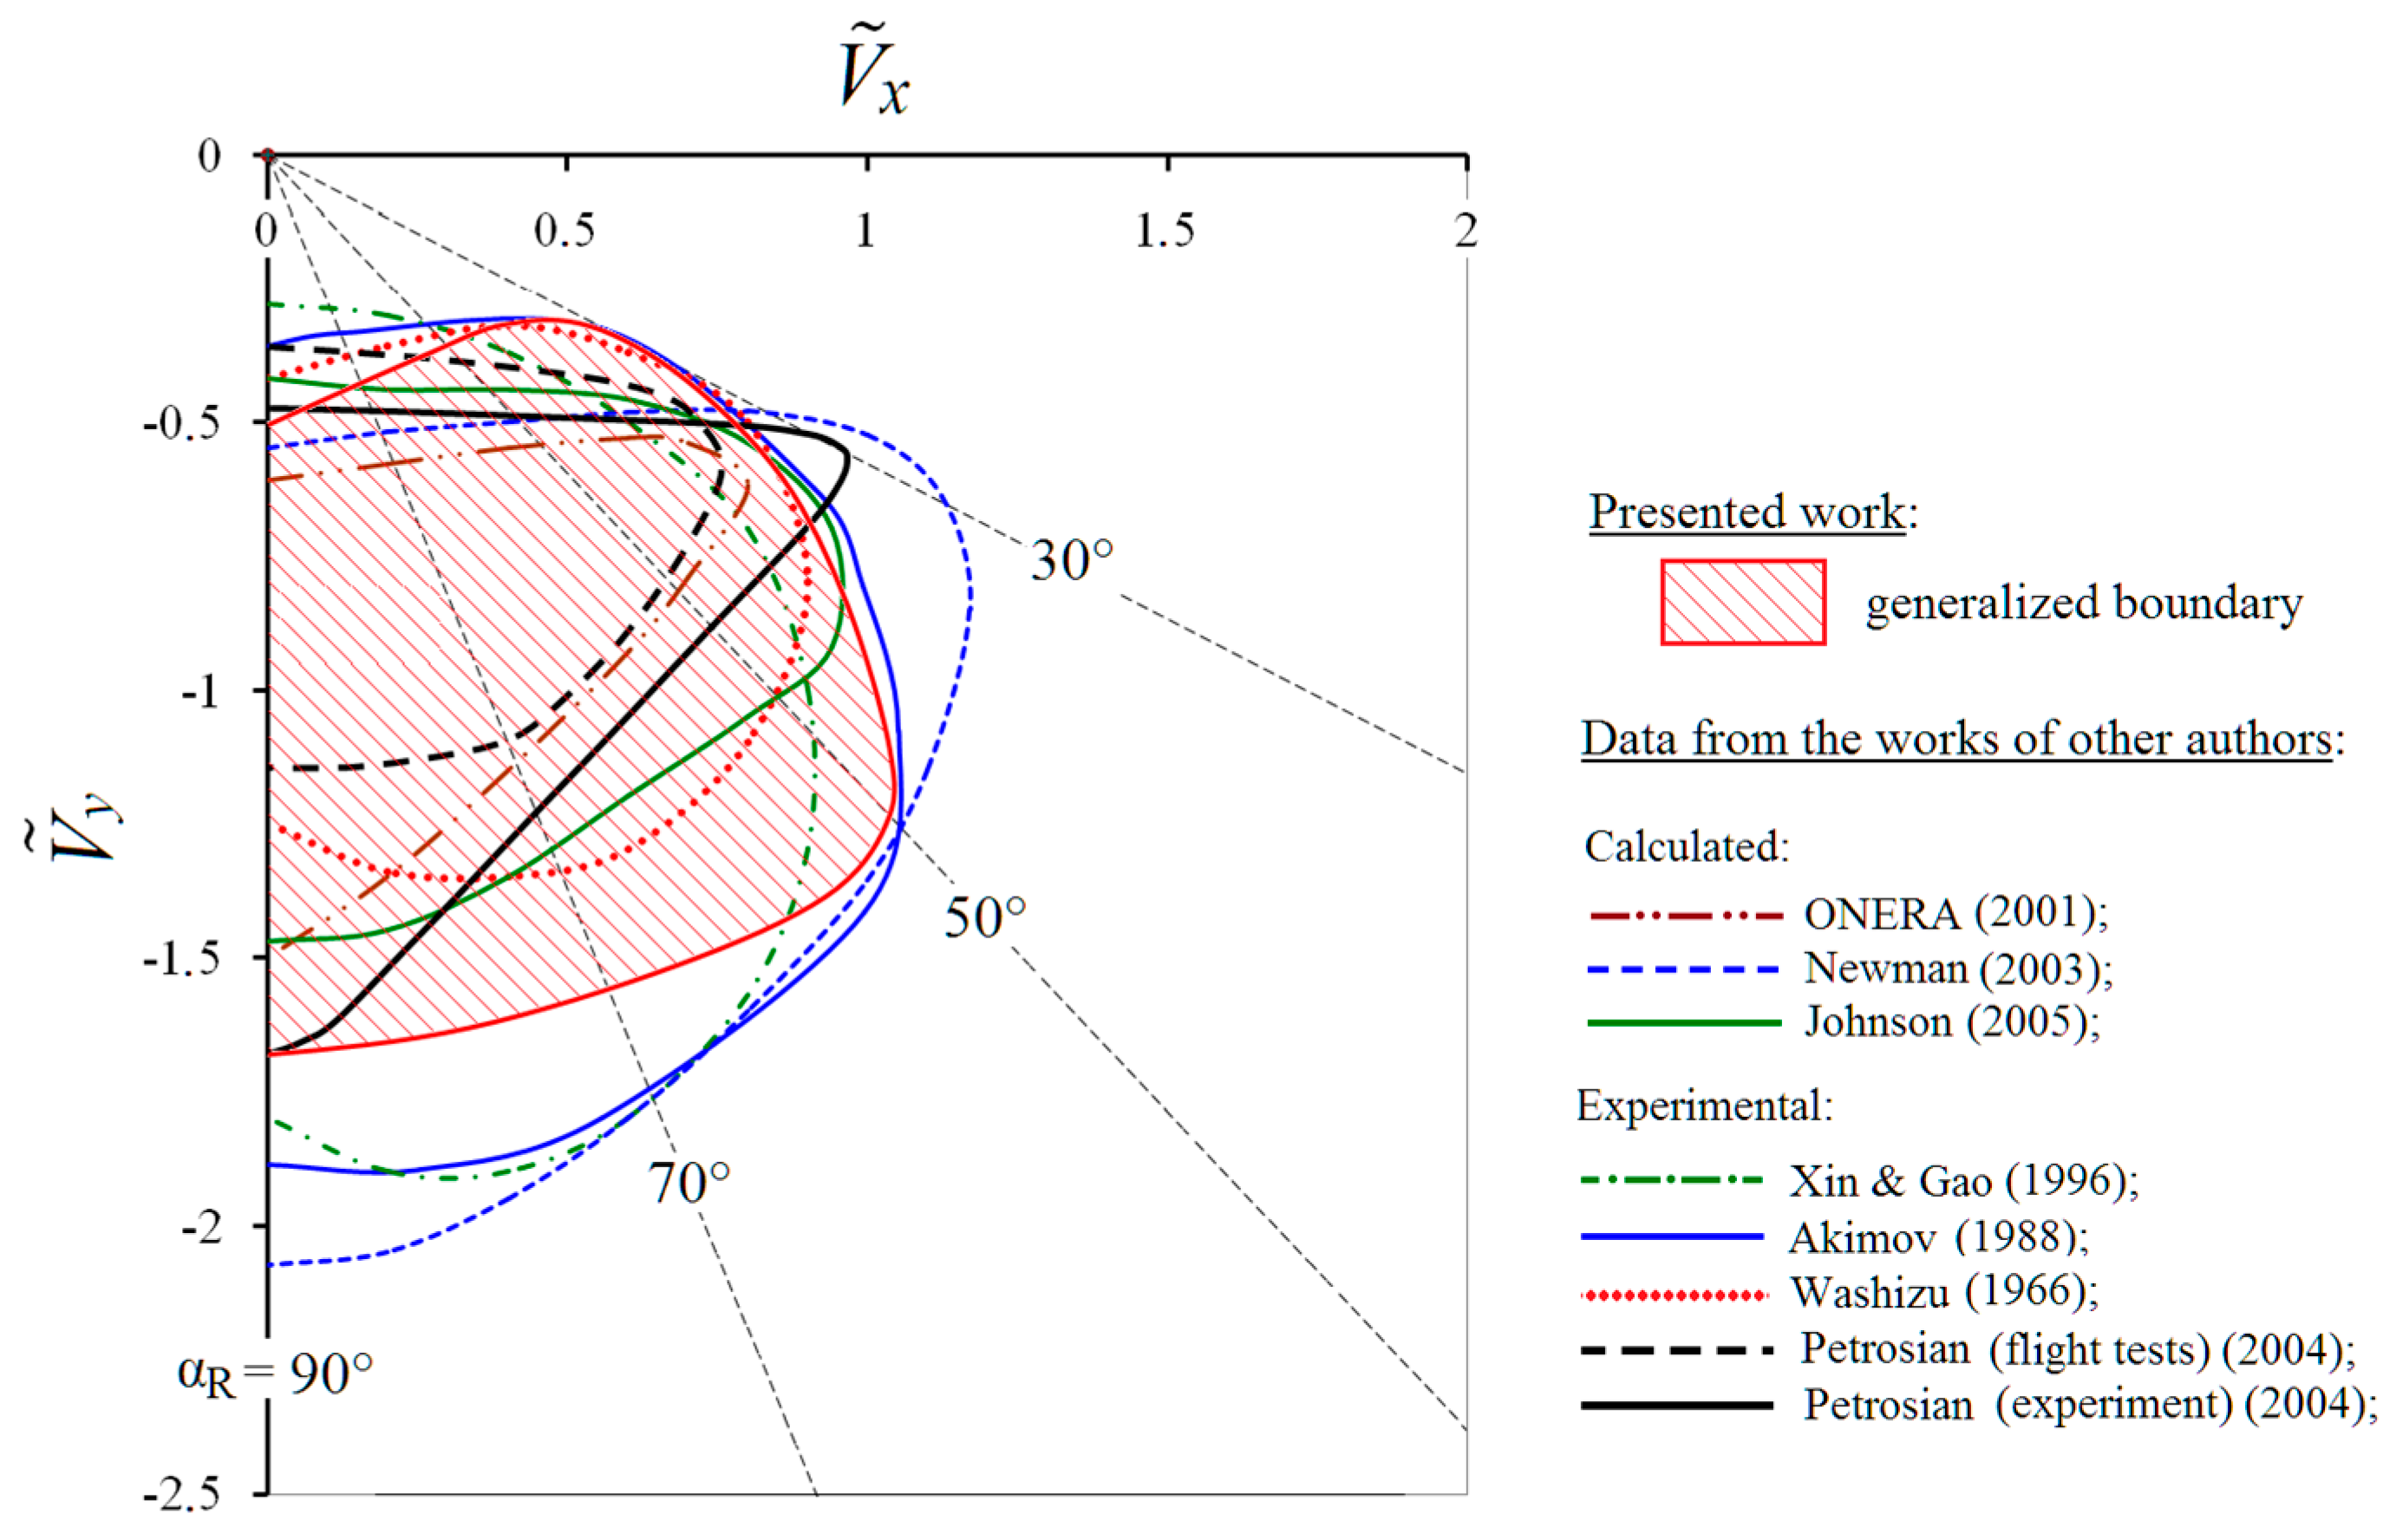
Figure 18 shows a generalized calculated boundary obtained on the basis of a set of VRS boundaries presented in Figure 17. For comparison, the calculated and experimental VRS boundaries obtained by other authors are also given. It should be noted that the boundaries obtained by different authors are based on various criteria and approaches. The boundaries obtained in the works by Akimov [6] (flight tests of a single-rotor Mi-8 helicopter) and Petrosian [7] (flight tests of coaxial helicopters) are built on the basis of flight tests by interpreting the experience of pilots, such as: increased vibrations, shaking and difficulties in controlling the helicopter. The boundary presented in [7] (experimental) is obtained on the basis of experiments of a coaxial rotor in WT. The boundaries obtained in the works by Washizu et al. [12] and Xin and Gao [13] have been obtained on the basis of the analysis of the pulsations of the rotor thrust during experimental studies. The boundary obtained in the work by Newman et al., presented in [21], is obtained on the basis of the analysis of the vortex wake. The boundary obtained by Johnson [21] is based on the developed dynamic model. The boundary presented in [8] is based on numerically simulating a flight experiment for a single-rotor Dauphin helicopter.
In general, it can be noted that there is a good qualitative coincidence of the generalized boundary obtained in the presented research.

4. Conclusions

The paper presents the results of comprehensive studies of the aerodynamics of the Kamov Ka-32 helicopter full-scale coaxial main rotor in steep descent modes, including the VRS modes area. The modes of steep descent for the angles of attack αR = 70°, 50° and 30° in the range of vertical descent speeds Vy = 0–30 m/s have been considered. The aerodynamic characteristics of the rotor at the fixed time-averaged thrust (CTΣ = 0.015 = constant) have been calculated. This approach makes it possible to analyze the growth of the required power of the rotor in the VRS modes area in comparison with the hovering mode. The presented work is a continuation of the studies performed earlier for hovering and vertical descent modes (αR = 90°). This paper is the main and final part of a comprehensive series of studies.
The used free wake model is characterized by low resource consumption and high speed, and allows for solving problems of numerical modeling of the aerodynamic characteristics of the rotor using available personal computers. In the presented paper, a computational grid of 55 rotor’s operating modes is considered. The authors have managed to make a detailed analysis of steep descent modes around the VRS modes area. Each calculated mode is modeled for a period of time corresponding to the number of revolutions of the rotor n = 160. Due to this fact, it has become possible to conduct a qualitative analysis of the time-dependent aerodynamic characteristics of the rotor in the VRS modes.
Significant attention is paid to the analysis of the flow around the rotor in the VRS modes at different descent speeds Vy and the angles of attack of the rotor αR. The shapes of the vortex wake and the structure of the rotor flow have been presented and analyzed in a number of the most characteristic modes: the “peak” of VRS, TWS and “autorotation”. A number of features in the forming of the vortex wake and the structure of the flow around the rotor associated with different descent speeds and angles of descent have been revealed. For these modes, the dependencies of the thrust and torque coefficients of the upper and lower rotors, as well as their total values of time (the number of revolutions of the rotor n), taking into account their unsteady pulsations, have been obtained and analyzed.
Based on the analysis of the obtained aerodynamic characteristics of the rotor, the boundaries of the VRS mode area in the flight speed coordinates “ V ˜ x V ˜ y ” have been found. The set of criteria used for this purpose is directly related to the behavior of the helicopter in the VRS modes observed in flight experiments. It includes the following criteria: an increase in the required power of the rotor (the torque of the rotor) compared to the hovering mode CQΣ/CQΣh > 1 and CQΣ/CQΣh > 1.05; an increase in the induced velocity in the plane of the rotor disk υ ˜ y > 1.5; an amplitude of the pulsation of the rotor thrust coefficient ΔCTΣ/2 > 20%; an amplitude of the pulsation of the rotor torque coefficient ΔCQΣ/2 > 10%. If necessary, the boundaries of the VRS area can be refined further by changing the selected criteria values.
The results of calculations of the aerodynamic characteristics of a coaxial rotor in the VRS modes have been compared with the available experimental data for rotors of different geometries. A satisfactory qualitative and quantitative agreement of the results of the presented study, including the VRS modes area boundaries, with the available experimental data is shown.
The presented work demonstrates the possibilities and prospects of the free wake model developed by the authors for studying the aerodynamic characteristics and analyzing the boundaries of the VRS modes of coaxial rotors.
The performed numerical studies of the aerodynamic characteristics of a full-scale coaxial rotor in steep descent modes in a wide range of descent speeds and angles of attack of the rotor can significantly supplement the existing experience of experimental and numerical studies in this field.

Author Contributions

Conceptualization, P.M. and Y.I.; methodology, P.M.; software, A.S.; validation, P.M., Y.I. and A.S.; formal analysis, P.M.; investigation, P.M.; resources, A.S.; data curation, P.M.; writing—original draft preparation, P.M.; writing—review and editing, P.M.; visualization, A.S.; supervision, Y.I.; project administration, P.M.; funding acquisition, Y.I. All authors have read and agreed to the published version of the manuscript.

Funding

This research received no external funding.

Institutional Review Board Statement

Not applicable.

Informed Consent Statement

Not applicable.

Data Availability Statement

The data that support the findings of this study are available from the corresponding author upon reasonable request.

Conflicts of Interest

The authors declare no conflict of interest.

Nomenclature

The following nomenclature are used in this manuscript:
ρAir density, kg/m3
tTime, s
RRotor radius, m
NbNumber of blades
cBlade chord, m
ωRRotational speed of the blade tips, m/s
nNumber of rotor revolutions
σRotor solidity, Nb·c/πR
θtwBlade twist, degree
θBlade pitch angle, degree
αRAngle of rotor attack, degree
VFree stream velocity, m/s
VyVertical descent speed, m/s
TRotor thrust, N
QRotor torque, N·m
CTRotor thrust coefficient, (2·T)/(ρ·(ωR)2·πR2)
CQRotor torque coefficient, (2·Q)/(ρ·(ωR)2·πR3)
CQhRotor torque coefficient in hover
v yVertical component of the averaged induced velocity in the rotor disc plane, m/s
v yhInduced velocity in the hover, 0.5 ω R C T
v ˜ yNon-dimensional induced velocity v y / v yh
V ˜ y Non-dimensional vertical descent velocity, V y / v yh
URUpper rotor
LRLower rotor
VRSVortex ring state mode
TWSTurbulent wake state mode
WBSWindmill brake state mode

References

  1. Reeder, J.P.; Gustafson, F.B. On the Flying Qualities of Helicopters; NACA Technical Note 1799; NACA: Washington, DC, USA, 1949. [Google Scholar]
  2. Brotherhood, P. Flow Through a Helicopter Rotor in Vertical Descent; A.R.C. Technical Report 2735; A.R.C.: London, UK, 1949. [Google Scholar]
  3. Stewart, W. Helicopter Behaviour in the Vortex-Ring Conditions; A.R.C. Technical Report 3117; A.R.C.: London, UK, 1951. [Google Scholar]
  4. Yeates, J.E. Flight Measurements of the Vibration Experienced by a Tandem Helicopter in Transition, Vortex-Ring State, Landing Approach, and Yawed Flight; NACA Technical Note 4409; NACA: Washington, DC, USA, 1958. [Google Scholar]
  5. Scheiman, J. A Tabulation of Helicopter Rotor-Blade Differential Pressures, Stresses, and Motions as Measured in Flight; NASA Technical Memorandum X-952; NASA: Washington, DC, USA, 1964. [Google Scholar]
  6. Akimov, A.I. Aerodynamics and Performance of Helicopters; Mashinostroyeniye: Moscow, Russia, 1988; 144p. (In Russian) [Google Scholar]
  7. Petrosian, E.A. Aerodynamics of Coaxial Helicopter; Poligon Press: Moscow, Russia, 2004; 820p. (In Russian) [Google Scholar]
  8. Jimenez, J.; Desopper, A.; Taghizad, A.; Binet, L. Induced Velocity Model in Steep Descent and Vortex-Ring State Prediction. In Proceedings of the 27th European Rotorcraft Forum, Moscow, Russia, 15–17 September 2001. [Google Scholar]
  9. Drees, J.; Hendal, W.P. Airflow Patterns in the Neighbourhood of Helicopter Rotors: A Description of Some Smoke Tests Carried out in a Wind-Tunnel at Amsterdam. Aircr. Eng. Aerosp. Technol. 1951, 23, 107–111. [Google Scholar] [CrossRef]
  10. Castles, J.; Gray, R.B. Empirical Relation between Induced Velocity, Trust, and Rate of Descent of a Helicopter Rotors as Determined by Wind-Tunnel Tests on Four Model Rotors; NACA Technical Note 2474; NACA: Washington, DC, USA, 1951. [Google Scholar]
  11. Yaggy, P.F.; Mort, K.W. Wind-Tunnel Tests of Two VTOL Propellers in Descent; NASA Technical Notes D-1766; NASA: Washington, DC, USA, 1963. [Google Scholar]
  12. Azuma, A.; Koo, J.; Oka, T.; Washizu, K. Experiments on a Model Helicopter Rotor Operating in the Vortex Ring State. J. Aircr. 1966, 3, 225–230. [Google Scholar]
  13. Xin, H.; Gao, Z. A Prediction of the Helicopter Vortex-ring State Boundary. J. Exp. Fluid Mech. 1996, 1, 14–19. [Google Scholar]
  14. Betzina, M.D. Tiltrotor Descent Aerodynamics: A Small-Scale Experimental Investigation of Vortex Ring State. In Proceeding of the 57th annual forum of the American Helicopter Society, Washington, DC, USA, 9–11 May 2001. [Google Scholar]
  15. Vozhdaev, E.S. Helicopter Aerodynamics. In Machine Building, Encyclopedia in 40 Volumes; Mashinostroenie: Moscow, Russia, 2002; Volumes 4–21. (In Russian) [Google Scholar]
  16. Empey, R.W.; Ormiston, R.A. Tail-Rotor Thrust on a 5.5-Foot Helicopter Model in Ground Effect. In Proceedings of the American Helicopter Society 30th Annual National V/STOL Forum, Washington, DC, USA, 7–9 May 1974. [Google Scholar]
  17. Brinson, P.; Ellenrieder, T. Experimental Investigation of the Vortex Ring Condition. In Proceedings of the 24th European Rotorcraft Forum, Marseille, France, 15–17 September 1998. [Google Scholar]
  18. Stack, J.; Caradonna, F.X.; Savaş, Ö. Flow Visualizations and Extended Thrust Time Histories of Rotor Vortex Wakes in Descent. J. Am. Helicopter Soc. 2005, 50, 279–288. [Google Scholar] [CrossRef]
  19. Green, R.; Gillies, E.; Brown, R. The flow field around a rotor in axial descent. J. Fluid Mech. 2005, 543, 237–261. [Google Scholar] [CrossRef] [Green Version]
  20. Surmacz, K.; Ruchała, P.; Stryczniewicz, W. Wind tunnel tests of the development and demise of vortex ring state of the rotor. In Proceeding of the 21st International Conference on Computational Methods in Mechanics (CMM), Gdańsk, Poland, 8–11 September 2015; pp. 8–11. [Google Scholar] [CrossRef]
  21. Johnson, W. Model for Vortex Ring State Influence on Rotorcraft Flight Dynamics; NASA Technical Paper 2005-213477; NASA: Washington, DC, USA, 2005. [Google Scholar]
  22. Leishman, J.G.; Bhagwat, M.J.; Ananthan, S. Free-Vortex Wake Predictions of the Vortex Ring State for Single Rotor and Multi-Rotor Configurations. In Proceedings of the 58th annual forum of the American Helicopter Society, Montreal, QC, Canada, 11–13 June 2002. [Google Scholar]
  23. Celi, R.; Ribera, M. Time Marching Simulation Modeling in Axial Descending through the Vortex Ring State. In Proceedings of the 63rd annual forum of the American Helicopter Society, Virginia Beach, VA, USA, 1–3 May 2007. [Google Scholar]
  24. Bailly, J. A Qualitative Analysis of Vortex Ring State Entry Using a Fully Time Marching Unsteady Wake Model. In Proceedings of the 36th European Rotorcraft Forum, Paris, France, 7–9 September 2010. [Google Scholar]
  25. Shcheglova, V.M. Non-Stationary Rotor Flow in the Steep Descent State and the VRS. Uchenye Zap. TsAGI 2012, 43, 51–58. (In Russian) [Google Scholar]
  26. Mohd, N.A.R.N.; Barakos, G. Performance and Wake Analysis of Rotors in Axial Flight Using Computational Fluid Dynamics. J. Aerosp. Technol. Manag. 2017, 9, 193–202. [Google Scholar] [CrossRef] [Green Version]
  27. Brown, R.; Leishman, J.; Newman, S.; Perry, F. Blade Twist Effects on Rotor Behaviour in the Vortex Ring State. In Proceedings of the 28th European Rotorcraft Forum, Bristol, UK, 17–20 September 2002. [Google Scholar]
  28. Kinzel, M.P.; Cornelius, J.K.; Schmitz, S.; Palacios, J.; Langelaan, J.W.; Adams, D.S.; Lorenz, R.D. An investigation of the behavior of a coaxial rotor in descent and ground effect. In Proceedings of the AIAA Scitech 2019 Forum, San Diego, CA, USA, 7–11 January 2019. [Google Scholar]
  29. Makeev, P.V.; Ignatkin, Y.M.; Shomov, A.I. Numerical investigation of full scale coaxial main rotor aerodynamics in hover and vertical descent. Chin. J. Aeronaut. 2021, 34, 666–683. [Google Scholar] [CrossRef]
  30. Ignatkin, Y.M.; Makeev, P.V.; Grevtsov, B.S.; Shomov, A.I. A Nonlinear Blade Vortex Propeller Theory and Its Applications to Estimate Aerodynamic Characteristics for Helicopter Main Rotor and Anti-Torque Rotor. Vestnik MAI 2009, 16, 24–31. (In Russian) [Google Scholar]
  31. Bourtsev, B.N.; Ryabov, V.L.; Selemenev, S.V.; Butov, V.P. Helicopter Wake Form Visualization Results and Their Application to Coaxial Rotor Analysis at Hover. In Proceedings of the 27th European Rotorcraft Forum, Moscow, Russia, 11–14 September 2001. [Google Scholar]
  32. Akimov, A.I.; Butov, V.P.; Bourtsev, B.N.; Selemenev, S.V. Flight Investigation of Coaxial Rotor Tip Vortex Structure. In Proceedings of the 50th annual forum of the American Helicopter Society, Washington, DC, USA, 11–13 May 1994. [Google Scholar]
Figure 1. Free wake model.
Aerospace 09 00061 g001
Figure 2. Calculation model of the coaxial rotor under study.
Aerospace 09 00061 g002
Figure 3. Grid of computational modes.
Aerospace 09 00061 g003
Figure 4. Calculated dependencies of UR and LR blade pitch angles (CTΣ = 0.015 = const).
Aerospace 09 00061 g004
Figure 8. Diagrams of the dependence of the thrust CT = f(n) and torque CQ = f(n) coefficients vs. the number of revolutions of the rotor at αR = 70° for different vertical descent speeds: Vy = 10 m/s (a); Vy = 16 m/s (b); Vy = 22 m/s (c).
Aerospace 09 00061 g008
Figure 9. Diagrams of the dependence of the thrust CT = f(n) and torque CQ = f(n) coefficients vs. the number of revolutions of the rotor at αR = 50° for different vertical descent speeds: Vy = 6 m/s (a); Vy = 12 m/s (b); Vy = 18 m/s (c).
Aerospace 09 00061 g009
Figure 10. Diagrams of the dependence of the thrust CT = f(n) and torque CQ = f(n) coefficients vs. the number of revolutions of the rotor at αR = 30° for different vertical descent speeds: Vy = 4 m/s (a); Vy = 7 m/s (b); Vy = 11.5 m/s (c).
Aerospace 09 00061 g010
Figure 12. Dependencies of the relative torque coefficient CQΣ/CQΣh vs. the non-dimensional vertical descent speed V ˜ y at αR = 30–90°.
Aerospace 09 00061 g012
Figure 13. Calculated and experimental [7] dependencies of CTUR/CTLR = f( V ˜ y ) at αR = 30–90°.
Aerospace 09 00061 g013
Figure 14. Dependencies of the UR, LR and total (UR+LR) torque coefficients CQ vs. non-dimensional vertical descent speed V ˜ y at αR = 30–90°. (a) αR = 90°; (b) αR = 70°; (c) αR = 50°; (d) αR = 30°.
Aerospace 09 00061 g014
Figure 15. Calculated and experimental [11,12,14] dependencies of thrust pulsation amplitude ΔCTΣ/2 = f( V ˜ y ) at αR = 30–90°. (a) αR = 90°; (b) αR = 70°; (c) αR = 50°; (d) αR = 30°.
Aerospace 09 00061 g015
Figure 16. Calculated dependencies of torque pulsation amplitude ΔCQΣ/2 = f( V ˜ y ) at αR = 30–90°. (a) αR = 90°; (b) αR = 70°; (c) αR = 50°; (d) αR = 30°.
Aerospace 09 00061 g016aAerospace 09 00061 g016b
Figure 17. Calculated and experimental [7] VRS boundaries based on various criteria.
Aerospace 09 00061 g017
Figure 18. Comparison of the calculated generalized boundary of the VRS modes (see Figure 17) with the experimental [6,7,12,13] and calculated [8,21] boundaries of other authors.
Aerospace 09 00061 g018
Table 1. Characteristics of the coaxial rotor under study [29,31,32].
NameValueMeasure Unit
Rotor radius, R7.95m
Blade tip speed, ωR226m/s
UR/LR plane distance1.495m
Number of blades, Nb2 × 3
Rotor solidity, σ0.115
Blade chord, c0.48m
Blade twist, θtw−5.8degree
Blade airfoilNACA 230-12
Publisher’s Note: MDPI stays neutral with regard to jurisdictional claims in published maps and institutional affiliations.

