Article

Experimental and Numerical Study on the Influence of Rubbing Force on Radial Crack Initiation in Labyrinth Seal Fins

College of Energy and Power Engineering, Nanjing University of Aeronautics and Astronautics, Nanjing 210016, China
*
Author to whom correspondence should be addressed.
Aerospace 2022, 9(12), 831; https://doi.org/10.3390/aerospace9120831
Submission received: 27 October 2022 / Revised: 30 November 2022 / Accepted: 10 December 2022 / Published: 15 December 2022

Abstract

:
Radial cracks appear in the labyrinth seal fins of the shrouded turbine blade of an aero-engine during service. To clarify the influence rule of rubbing force on crack initiation, a high-speed rubbing test bench and a numerical calculation model are established, and the research is carried out through experiment and numerical calculation. It is found that cracks can be initiated when the rubbing force is greater than 20 N with a high rubbing temperature at high speed. It is verified by numerical calculation and shows that pure mechanical load will not cause crack initiation, while the thermal load is the main reason for the radial crack initiation of fins. With the increase of rubbing force, the time of crack initiation increases, and the number and length of cracks decrease. At high rubbing temperatures, rubbing force will lead to radial crack initiation, which mainly affects the position of crack initiation.

Graphical Abstract

1. Introduction

Reducing airflow leakage is an effective measure to improve the sealing effect, and it is also one of the hotspots in the development of aero−engines in recent decades [1]. A common sealing system used in aero−engines to control airflow leakage is the labyrinth seal, which consists of several fins on the rotating part and a bushing on the stationary part. The abradable bushings rub against the fins without causing damage to rotating parts while maintaining an effective sealing interface [2]. A bushing commonly used is the honeycomb seal which is brazed to the surface of the stationary part [3]. Reducing the gap between the fins and the honeycomb is the most cost-effective way to improve sealing efficiency [4], however, it also increases the risk of fins rubbing against the honeycomb. During operation, due to mechanical expansion, vibration, thermal stress, and misalignment of sealing components during startup, shutdown, and hot restart transients, the blade crown grate rub against the honeycomb, resulting in wear or cracks on the grate [5, 6, 7]. During the maintenance and inspection of the engine, it was found that the turbine blade crown fins had circumferential wear and radial micro-cracks. The cracks initiate on the contact surface between the fins and the honeycomb and expand to the root of the fins, which is called the radial crack in this paper. Rapid propagation of radial cracks can lead to blade failure, compromising the safe operation of the engine.
At present, it is generally believed that radial cracks of fins are thermal fatigue cracks [8], and the generation of cracks is mainly affected by thermal load [9,10,11]. It is manifested as small cracks generated on the surface, with approximately equal spacing, and the direction is perpendicular to the sliding direction [12]. One possible reason for the formation of thermal cracks is the thermal load during high−speed rubbing, local overheating of the contact surface will first form thermoelastic instability [13], and thermal expansion in the local high-temperature region will generate very high compressive stress, which will be very high. It is easy to cause plastic flow, upon contact movement and thermal load release, residual tensile stress is generated on the contact surface, which can cause fracture of surface brittle inclusions, leading to cracks [14,15,16,17,18]. To this end, Tim Pychynski [14], Na Zhang [15], Ulrich Rathmann [16], Corentin Delebarre [17], and Maël Thévenot [18] designed their own high-speed rubbing test benches, and studied the rubbing of fins and honeycombs. Except for Zhang, the non−segmented fins are studied, that is, the fin with one or more whole rings on the shaft, such as the drum seal fin and the turbine disc seal fin. They all use 3D force sensors to measure rubbing force and thermal imaging cameras to measure rubbing temperature. Through experiments, it is found that the contact forces are mainly affected by the incursion rate [14,15] and the rubbing velocity [14]. There is a strong interaction between rubbing force, rubbing temperature, and the wear behavior of the rubbing system, in which thermal effects play an important role in the rubbing behavior [8].
The extended finite element (XFEM) is particularly effective in simulating discontinuous problems such as crack growth, and can be used for crack initiation and propagation calculations without re-meshing and specifying crack propagation paths [19]. P. Zhang et al. [20] predicted the short crack growth of single crystal nickel-based alloys with XFEM based on Abaqus software. Zhang L et al. [21] simulated crack growth behavior under low cycle fatigue with XFEM based on Abaqus software. Tim Fischer and Oliver Munz established a one-dimensional model of the fin and honeycomb rubbing process based on experiments [22] and analyzed the rubbing process of the fin honeycomb in the full flight mission [23]. A simplified fin-honeycomb rubbing model was established in the commercial finite element analysis software Abaqus/Explicit by adding the contact subroutine VINTERACTION, considering thermal and mechanical interface behavior, and the elastic-plastic constitutive model can capture extreme temperature conditions and alloy failure behavior [24]. Tim Pychynsk [11] verify that the initiation of radial cracks is mainly affected by the thermal load with Abaqus, the thermal and mechanical effects can be studied separately.
The residual tensile stress of the segmented sealing fins under the rubbing condition is expected to be much lower than that of the non−segmented type [10], while the turbine blade crown fin is segmented, and the reason for the formation of the segmented sin crack is unknown. Although the generation of radial cracks is mainly affected by thermal load, there is a strong interaction between the rubbing force and rubbing temperature, and the effect of rubbing force on the formation of radial cracks is unknown. To find out the cause of the radial crack and the effect of the rubbing force on the radial crack of the turbine crown fin, the experiment and numerical calculation are used in this paper.

2. Experimental Study

2.1. Experimental System and Test Pieces

The test is carried out on the high−speed rotary rubbing test bench of Nanjing University of Aeronautics and Astronautics, manufactured by Nanjing Hansen High Speed Gearbox Manufacturing Co., Ltd, Nanjing, Jiangsu Province, China. The test system is shown in Figure 1, which mainly includes high−speed rotation, feeding, and measurement. The rotating part mainly includes a high−speed motor, speed increase box, flywheel, bearing seat, and disc. The heavyweight flywheel on the high−speed shaft can ensure that the rotation speed of the disc does not decrease during rubbing, reducing the vibration and beating of the disc. In the actual work of the engine, the honeycomb is installed on the casing, which is stationary, while the turbine blades are rotating. Since it is impossible to measure the temperature and force of the fin in the rotating state, the effect of centrifugal force in the rubbing process can be ignored compared with the thermal effect [11], so the honeycomb is installed on the disc. The disc is connected to the high-speed motor through the speed increase box. The power of the high−speed motor is 75 kW and the maximum speed is 3000 r/min, and the speed of the disc in the experiment is 10,000 r/min.
As shown in Figure 2, the feeding part mainly includes a radial feeding platform and an axial feeding platform. Both of them are linear motor platforms customized by Nanjing University of Aeronautics and Astronautics, manufactured by ShenZhen Linear Motor Co., Ltd., Shenzhen, China, with a running accuracy of 2 μm. The rubbing temperature and rubbing force are mainly affected by the incursion depth and incursion rate. In the experiment, the incursion depth and incursion rate are controlled by the radial platform, while the axial platform remains stationary. Before the experiment, the fins and the honeycomb were adjusted to contact exactly by the feeding platform, and the position of the feeding platform at this time shall be zero. Then, move the feeding platform back to the specified distance, to guarantee the real gap under operating conditions.
The measurement of rubbing force is shown in Figure 2. A three-dimensional force sensor (Type T505, Right, Changzhou, Jiangsu Province, China) is installed under the blade, with a measuring range of 1000 N and an error of ±2%. USB8710 (ART, Beijing, China) high-speed data acquisition card is used to collect the signal of the force sensor, and the acquisition frequency is 100 kHz. The rubbing temperature was measured with the infrared thermal imager FAST M200 (TELOPS, Quebec City, QC, Canada), and the measurement frequency was 600 Hz. In this paper, the direction along the blade body is defined as radial, the axis direction of the disc is axial, and the rotation direction of the disc is circumferential, as shown in Figure 2.
The test sample of fin and honeycomb are shown in Figure 3. The height, thickness, and angle of the stepped fins of the turbine blade are the same. The honeycomb structure is commonly used in aero−engine, as shown in Figure 3b, made of a periodic hexagonal structure (welded at the position of double foil). The size of each honeycomb cell is 0.8 mm, and the direction of rubbing between comb teeth and honeycomb is parallel to the side of the double foil. Fluorescent penetration, X−ray, and metallographic inspection were carried out before the test, and all fins were free of surface cracks and internal defects. All blades are subject to only one rubbing test.
The material of the fin is Rene’80, the composition is shown in Table 1, and the material properties are shown in Table 2 [25]. The honeycomb material is Hastelloy X.

2.2. Experimental Parameters

Different rubbing forces can be obtained by controlling the feeding speed (Vr) and feeding depth (Sr) of the fin. The schematic diagrams of Vr and Sr are shown in Figure 4. The specific dimensions in the figure are H/l = 8, h/l = 1.5, L/l = 7, and R/l = 2. A total of 4 groups of experiments shown in Table 3 were carried out, in which C−1 and C−2 were used to compare the influence of the time of the rubbing force, and C−2, C−3, and C−4 were to compare the influence of the amount of the rubbing force. According to the measured value of the force sensor, the rubbing forces of C−1, C−2, C−3, and C−4 are 35 N, 20 N, 25 N, and 60 N, respectively. Because the feeding speed is greater than 50μm/s, the scraps will roll up and adhere to the fin, which will affect the initiation of cracks, so the experiment is no longer carried out for more than 80 μm/s. In this paper, the surface corresponding to the honeycomb of the fin is called the fin tip, the two adjacent surfaces of the fin tip are called the side, and the surfaces at both ends of the grate are called the fin root, as shown in Figure 3a. According to Coulomb’s law, the circumferential rubbing force is positively correlated with the radial rubbing force. According to the experimental results, there is a correlation between the rubbing temperature and the radial rubbing force. Therefore, the radial rubbing force is used to characterize the rubbing force in this paper.

2.3. Experimental Results

2.3.1. Morphology and Cracks after Rubbing

The morphology and cracks of the tip of the lower fin after rubbing are shown in Figure 5. There are obvious circumferential scratches on the surfaces of the four test samples. The rubbing direction in the figure is from top to bottom, and the left and right sides are axial. The fin tip of C−1 is the smoothest, with bright rubbing marks and a few circumferential scratches only in the middle position, because the feed depth is the least and the rubbing time is also the least, with only the middle area rubbing against the honeycomb. Due to the low rubbing temperature, no cracks were produced. The fin tip of C−2 and C-3 have obvious circumferential scratches, but C−2 is relatively smoother than that of C−3, indicating that with the increase of rubbing force, the plowing effect is stronger. Both C−2 and C−3 initiated cracks at the junction of the fin tip and the side, and both the crack directions on the tip were axial and radial on the side. The crack of C−2 is relatively curved, and the crack of C−3 is relatively straight. It may be that the stress of C−3 is larger and the crack initiation is faster. C-4 forms a layer of accumulated chips on the fin tip, and the surface of the accumulated chips has obvious circumferential scratches. There are cracks in the parts, and it cannot be ruled out that they are generated on the accumulated chips.

2.3.2. Influence of Rubbing Force on Rubbing Temperature

The changes in temperature and rubbing force with time are shown in Figure 6, the force signals are filtered with 0.625 Hz low-pass FFT filtering. The rubbing temperature of the four experiments all increased rapidly during rubbing and decreased slowly after rubbing. The reason is that a lot of heat is generated during the process of the fin rubbing against the honeycomb, and the heat flux density on the tip increases rapidly, and the temperature also increases rapidly. Due to the radial feeding, the fin will be embedded in the honeycomb. After rubbing, the fin and the honeycomb are not completely out of contact immediately, and the disc is still rotating at this time. The rotation of the disc will form an airflow, and the rubbing area will slowly cool down under the action of the airflow. C−2, C−3, and C−4 have a sudden increase in temperature and force during the cooling process. The reason is that the honeycomb generates debris during rubbing. This debris does not separate from the honeycomb and generates high-speed rubbing against the fin.
The maximum rubbing force of C−1 is 35 N, and the maximum rubbing temperature is 338.45 °C. The maximum rubbing force of C−2 is 20 N, and the maximum rubbing temperature is 611.78 °C. The maximum rubbing force of C−3 is 25 N, and the maximum rubbing temperature is 611.95 °C. The maximum rubbing force of C−4 is 60 N, and the maximum rubbing temperature is 610.85 °C.
Comparing Figure 5 and Figure 6, it can be seen from the two experiments C−1 and C−2 that the size of the rubbing force has no obvious rule on the initiation of cracks, while the rubbing temperature increases with the increase of the radial rubbing force. At the same time, the increase in rubbing time will also lead to an increase in rubbing temperature. Comparing C−1, C−2, and C−3, the temperature of C−1 is about half of that of C−2 and C−3. Although the rubbing force of C−1 is larger than that of C−2, it does not initiate. C−2 and C−3 both have cracks, so the rubbing temperature is the main factor affecting crack initiation. The effect of rubbing force on cracks needs to be further clarified by numerical analysis.

3. Numerical Study

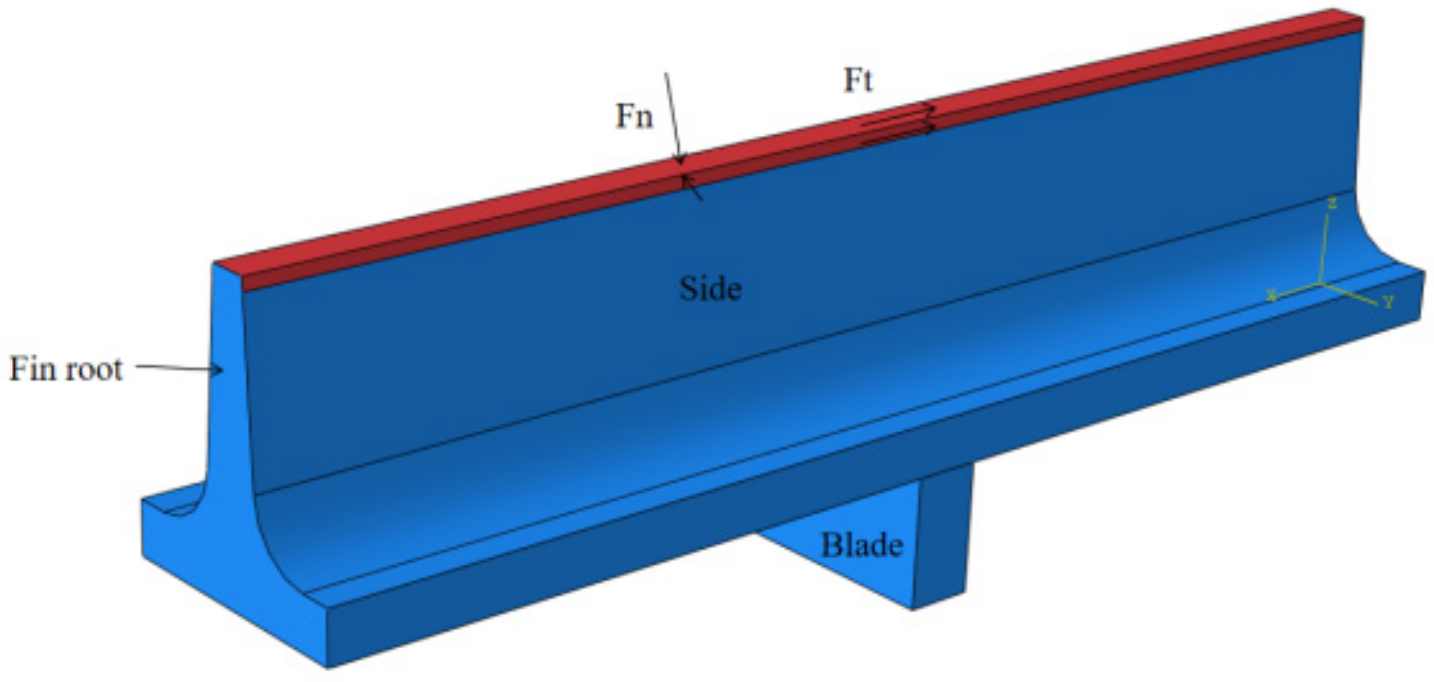
3.1. Numerical Calculation Model

The XFEM of the commercial software Abaqus (Dassault Systemes, Paris, France) is used to calculate the effect of the rubbing force on the cracks of the fin. Since the material of the fin is homogeneous, the radial cracks propagate along the dendrites, so the stress intensity factor is selected. The general expression for the stress intensity factor of a crack is K = F σ π a . In the formula, F is the coefficient depending on the shape of the crack body, the shape of the crack, the position of the crack, and the loading method; σ is the applied uniform tensile stress, and a is the half-length of the crack. That is, when the stress intensity is greater than the ultimate strength of the fin, cracks will initiate.
A single fin is selected for calculation, the fin is simplified as a straight stretched body, and the blade is replaced by a cube, as shown in Figure 7. The x direction is the axial direction, the y direction is the circumferential direction, and the z direction is the radial direction. Since the fins in the actual engine are rubbed on the tip and side surfaces, the area divided by the tip and both sides are used as the rubbing area (red), and the height on the side is equal to l. The force in the normal direction of the rubbing area is Fn, and the force in the tangential direction is Ft. According to the circumferential force and radial force measured by the experiment, the rubbing coefficient is 0.6, so Ft = 0.6 Fn. The effect of Fn on crack initiation in the range of 0 N to 80 N was calculated, and values were taken every 10 N for calculation. The Fn on the top and the two sides are set, respectively, and the types are surface traction with general traction. Since cannot be calculated with the surface traction of Ft, this paper characterizes rubbing force with Fn. The heat flux density in the rubbing area is 2600 W/m2, the convective heat transfer coefficient is 500 W/(m2·°C), and a fixed constraint is added to the bottom of the blade at the same time. The rubbing temperature with time is shown in Figure 8.
Since Abaqus cannot calculate the crack initiation and propagation using the temperature element with the XFEM method, the Coupled temp-displacement step, and the Static, General step are used for the calculation. The temperature−displacement analysis step obtains the temperature field of the fin under the condition of rubbing, and the mesh is C3D8T. In the general static analysis step, the temperature field of the temperature displacement analysis step is taken as a predefined field, and the C3D8R mesh is used to calculate the initiation of cracks without inserting the initial crack. After mesh independence verification, when the grid size of the scraping area is l/10, the calculation accuracy requirements can be met. The maxps damage model is used for material properties, and the yield strength is used as the maximum principal stress required for damage. The damage evolution uses the mixed mode behavior of energy type and linear softening power law, with the power of 1. The damage stable viscosity is 5E−5.
The experimental result with a rubbing force of 20 N is shown in Figure 5b, and the numerical calculation result with a rubbing force of 20 N is shown in Figure 9c. In the experiment, only one crack was initiated on the fin, and two cracks were produced in the numerical simulation. The reason is that the zone of the fin that first contacted the honeycomb in the rubbing experiment had a high rubbing temperature. This part cuts off the honeycomb, resulting in reduced friction and temperature on other areas of the fin, so no cracks could be generated. By comparing the experimental results with the numerical results, the cracks are initiated at the junction of the top and side surfaces, and the location and morphology of crack initiation are similar.

3.2. Results of Numerical Calculation

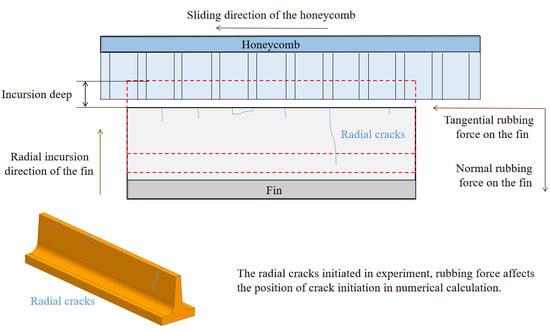
3.2.1. Influence of Rubbing Force on Crack Initiation

The crack distributions obtained by numerical calculation are shown in Figure 9. Similar to the cracks initiated in the test. The cracks are all initiated at the junction of the fin tip and the side surface, and expand axially on the tip and radially on the side surface. It can be seen from the figure that the size of the rubbing force has a great influence on the position of crack initiation, and the rubbing force has an inhibitory effect on the initiation of cracks.
Figure 9a is the crack distribution of 0 N, and it can be seen that the distribution of cracks is not completely symmetrical. Some cracks penetrate the tip and cracks that form blocks at the edge of the tip and fell off in the follow-up, similar to the test results. Figure 9b shows the crack distribution of 10 N, and the cracks are distributed symmetrically. The cracks are initiated on both sides of the fin tip, but none of them penetrate. Compared with that at 0 N, the number of crack initiation is reduced, and the length of the crack is also shortened. The crack distribution of 20 N to 50 N is the same as that of 20 N, As shown in Figure 9c. The cracks are distributed symmetrically, and all only initiate at the junction of the fin tip and the side surface, without further expansion. The crack distribution of 60 N to 80 N is the same as that of 60 N, as shown in Figure 9d, with no cracks initiated.
The effect of rubbing force on the crack initiation time is shown in Figure 10. The cracks are all initiated during the temperature drop after rubbing. With the increase of scraping force, the time of crack initiation increased, and the time increases linearly with the rubbing force in the two ranges of 0 N to 20 N and above 20 N, respectively.

3.2.2. Influence of Rubbing Force on Stress

The stress distribution of the fin under mechanical load and thermal load is shown in Figure 11. Figure 11a is the stress distribution of the thermal load at the time of crack initiation, with only the temperature changes, and no rubbing force. The stress reaches the maximum at the junction of the tip and the side surface of the fin, the maximum stress value is 632.952 MPa. The stress value in the middle of the tip is smaller, with an average of 485.159 MPa. Figure 11b shows the stress distribution of the thermo−mechanical load at the time of crack initiation when the rubbing force is 50 N, and the rubbing force is added while the temperature changes. The stress reaches the maximum at the junction of the tip and side surfaces of the fin teeth, the maximum stress value is 644.63 MPa. The stress value in the middle of the tip is smaller, with an average of 537.668 MPa. Figure 11c shows the stress distribution of the mechanical load during rubbing when the rubbing force is 50 N, and the temperature is constant at 15 °C. The stress reaches the maximum at the center of the tip, the maximum stress value is 426.62 MPa, and the maximum stress is 0.7 MPa after removing the rubbing force.
Comparing Figure 11a,b, the stress caused by thermal load accounts for the main part, accounting for about 98%, in the process of temperature reduction after rubbing.
Comparing and analyzing Figure 9, Figure 10 and Figure 11, it can be seen that the rubbing force has an inhibitory effect on the initiation of cracks. The reason is that the rubbing force exerts pressure on the rubbing area, and the residual compressive stress is formed after the rubbing. In the process of temperature reduction after rubbing, the unit where the crack is located is subjected to tensile stress [11], while the compressive stress caused by rubbing force offsets the tensile stress.

4. Conclusions

The effect of the rubbing force on the crack initiation of the fin was studied experimentally, and the numerical analysis was carried out using the XFEM method in Abaqus, and the following conclusions were obtained.
(1) Experiments show that in the rubbing process under high-speed rotation, the rubbing force is not the main factor leading to the initiation of radial cracks on the fins. When the rubbing force is greater than 20 N and the rubbing temperature is high, cracks can be initiated. When the rubbing temperature is low, even if the rubbing force reaches 30 N, cracks cannot be initiated.
(2) Through numerical calculation, it is found that the pure rubbing force will not lead to the initiation of cracks, while the pure rubbing temperature can lead to the initiation of cracks. The radial cracks of the fins are initiated during the temperature reduction process after the rubbing. With the increase of the rubbing force, the crack initiation time increases.
(3) The rubbing force has an inhibitory effect on the initiation of cracks, and the number and length of the cracks decrease with the increase of the rubbing force. Under the action of pure rubbing temperature, there are many cracks on the top surface; there are only two symmetrical cracks when the rubbing force is 20 N to 50 N; no cracks are generated when the rubbing force is greater than 60 N. The rubbing force mainly affects the crack initiation position.

Author Contributions

Conceptualization, W.Y. and Y.Y.; methodology, Y.Y.; software, J.C.; validation, Y.Y., Z.M., and J.C.; formal analysis, Y.Y.; investigation, Y.Y. and J.C.; resources, Y.Y. and Z.M.; data curation, Y.Y. and J.C.; writing—original draft preparation, Y.Y.; writing—review and editing, Y.Y.; visualization, J.C.; supervision, W.Y.; project administration, W.Y.; funding acquisition, W.Y. All authors have read and agreed to the published version of the manuscript.

Funding

This research received no external funding.

Institutional Review Board Statement

Not applicable.

Informed Consent Statement

Not applicable.

Data Availability Statement

Not applicable.

Conflicts of Interest

The authors declare no conflict of interest.

References

  1. DeMasi-Marcin, J.T.; Gupta, D.K. Protective coatings in the gas turbine engine. Surf. Coat. Technol. 1994, 68–69, 1–9. [Google Scholar] [CrossRef]
  2. Chupp, R.E.; Hendricks, R.C.; Lattime, S.B.; Steinetz, B.M. Sealing in Turbomachinery. J. Propuls. Power 2006, 22, 313–349. [Google Scholar] [CrossRef]
  3. Draskovich, B.S.; Frani, N.E.; Joseph, S.S.; Narasimhan, D. Abrasive Tip/Abradable Shroud System and Method for Gas Turbine Compressor Clearance Control. U.S. Patent 5,704,759, 6 January 1998. [Google Scholar]
  4. Aslan-zada, F.E.; Mammadov, V.A.; Dohnal, F. Brush seals and labyrinth seals in gas turbine applications. Proc. Inst. Mech. Eng. Part A J. Power Energy 2013, 227, 216–230. [Google Scholar] [CrossRef]
  5. Schmid, R.K.; Ghasripoor, F.; Dorfman, M.; Wei, X. An Overview of Compressor Abradables. In Proceedings of the ITSC 2000, Dearborn, MI, 1–3 October 2000. [Google Scholar]
  6. Dai, X.; Yan, X. Effects of Labyrinth Fin Wear on Aerodynamic Performance of Turbine Stages: Part II—Mushrooming Damages. In Proceedings of the ASME Turbo Expo 2019: Turbomachinery Technical Conference and Exposition, Phoenix, AZ, USA, 17–21 June 2019. [Google Scholar]
  7. Delebarre, C.; Wagner, V.; Paris, J.Y.; Dessein, G.; Denape, J.; Gurt-Santanach, J. An experimental study of the high speed interaction between a labyrinth seal and an abradable coating in a turbo-engine application. Wear 2014, 316, 109–118. [Google Scholar] [CrossRef] [Green Version]
  8. Bogdanovich, P.N.; Tkachuk, D.V. Thermal and thermomechanical phenomena in sliding contact. J. Frict. Wear 2009, 30, 153–163. [Google Scholar] [CrossRef]
  9. Rossmann, A. Die Sicherheit von Turbo-Flugtriebwerken, Band 2; Turbo Consult: Karlsfeld, Germany, 2000. [Google Scholar]
  10. Fischer, T.; Welzenbach, S.; Meier, F.; Werner, E.; kyzy, S.U.; Munz, O. Modeling the rubbing contact in honeycomb seals. Contin. Mech. Thermodyn. 2018, 30, 381–395. [Google Scholar] [CrossRef]
  11. Pychynski, T.; Dullenkopf, K.; Bauer, H.-J. Theoretical Study on the Origin of Radial Cracks in Labyrinth Seal Fins due to Rubbing. In Proceedings of the ASME Turbo Expo 2013: Turbine Technical Conference and Exposition, San Antonio, TX, USA, 3–7 June 2013. [Google Scholar]
  12. Kennedy, F.E. Thermal and thermomechanical effects in dry sliding. Wear 1984, 100, 453–476. [Google Scholar] [CrossRef]
  13. Kennedy, F.E.; Karpe, S.A. Thermocracking of a mechanical face seal. Wear 1982, 79, 21–36. [Google Scholar] [CrossRef]
  14. Pychynski, T.; Höfler, C.; Bauer, H.-J. Experimental Study on the rubbing Contact Between a Labyrinth Seal Fin and a Honeycomb Stator. J. Eng. Gas Turbines Power 2015, 138, 062501. [Google Scholar] [CrossRef]
  15. Zhang, N.; Xuan, H.-J.; Guo, X.-J.; Guan, C.-P.; Hong, W.-R. Investigation of high-speed rubbing behavior of labyrinth-honeycomb seal for turbine engine application. J. Zhejiang Univ.-Sci. A 2016, 17, 947–960. [Google Scholar] [CrossRef]
  16. Rathmann, U.; Olmes, S.; Simeon, A. Sealing Technology: Rub Test Rig for Abrasive/Abradable Systems. In Proceedings of the ASME Turbo Expo 2007: Power for Land, Sea, and Air, Montreal, QC, Canada, 14–17 May 2007; pp. 223–228. [Google Scholar]
  17. Delebarre, C.; Wagner, V.; Paris, J.Y.; Dessein, G.; Denape, J.; Gurt-Santanach, J. Tribological characterization of a labyrinth-abradable interaction in a turbo engine application. Wear 2017, 370–371, 29–38. [Google Scholar] [CrossRef] [Green Version]
  18. Thévenot, M.; Wagner, V.; Paris, J.Y.; Dessein, G.; Denape, J.; Harzallah, M.; Brunet, A.; Chantrait, T. Thermomechanical phenomena and wear flow mechanisms during high speed contact of abradable materials. Wear 2019, 426–427, 1102–1109. [Google Scholar] [CrossRef]
  19. Soler, D.; Saez De Buruaga, M.; Arrazola, P.J. Experimental investigation of contact forces and temperatures in rubbing interactions of honeycomb interstate seals. IOP Conf. Ser. Mater. Sci. Eng. 2021, 1193, 012070. [Google Scholar] [CrossRef]
  20. Abaqus, SIMULIA User Assistance 2019. About Fracture Mechanics. Dassault Group. France. 2019. Available online: https://help.3ds.com/2019/english/DSSIMULIA_Established/SIMACAECAERefMap/simacae-m-EngXfem-sb.htm?ContextScope=all&id=0e4f47ecd3c44244afb58a118f76475f#Pg0 (accessed on 9 December 2020).
  21. Zhang, P.; Zhang, L.; Baxevanakis, K.P.; Zhao, L.G.; Bullough, C. Modelling short crack propagation in a single crystal nickel-based superalloy using crystal plasticity and XFEM. Int. J. Fatigue 2020, 136, 105594. [Google Scholar] [CrossRef]
  22. Zhang, L.; Zhao, L.; Jiang, R.; Bullough, C. Crystal plasticity finite-element modelling of cyclic deformation and crack initiation in a nickel-based single-crystal superalloy under low-cycle fatigue. Fatigue Fract. Eng. Mater. Struct. 2020, 43, 1769–1783. [Google Scholar] [CrossRef]
  23. Munz, O.; Schwitzke, C.; Bauer, H.J.; Welzenbach, S.; Kyzy, S.U. Modelling the Rubbing Process in Labyrinth Seals. In Proceedings of the Global Power & Propulsion Forum 2018, Zurich, Switzerland, 10–12 January 2018. [Google Scholar]
  24. Hühn, L.; Rieger, F.C.; Bleier, F.; Schwitzke, C.; Bauer, H.-J.; Behnisch, T. Extensive Investigations on Radial Crack Formation in Labyrinth Seals of Aircraft Engines. In Proceedings of the Deutscher Luft- und Raumfahrtkongress, Friedrichshafen, Germany, 4–6 September 2018; p. 8S. [Google Scholar]
  25. China Aeronautical Materials Handbook Committee. China Aeronautical Materials Handbook, Band 2; Standards Press of China: Beijing, China, 2002. (In Chinese) [Google Scholar]
Figure 1. High-speed rotary rubbing test system.
Aerospace 09 00831 g001
Figure 2. Feeding system.
Aerospace 09 00831 g002
Figure 3. Dimensions of the test sample. (a) the fin; (b) the honeycomb.
Aerospace 09 00831 g003
Figure 4. Schematic diagram of Vr, Sr.
Aerospace 09 00831 g004
Figure 5. Morphology and cracks on the fin tip. (a) c−1. (b) c−2. (c) c−3. (d) c−4. The red frames indicate the location of the radial crack.
Aerospace 09 00831 g005
Figure 6. The changes in temperature and rubbing force during the rubbing. (a) c−1. (b) c−2. (c) c−3. (d) c−4.
Aerospace 09 00831 g006
Figure 7. Geometric model.
Aerospace 09 00831 g007
Figure 8. The temperature in the rubbing area.
Aerospace 09 00831 g008
Figure 9. Crack distribution under different rubbing forces. (a) 0 N; (b) 10 N; (c) 20 N; (d) 60 N.
Aerospace 09 00831 g009
Figure 10. Effect of scraping force on crack initiation time.
Aerospace 09 00831 g010
Figure 11. Effect of scraping force on crack initiation time. (a) 10 N; (b) 20 N; (c) 60 N.
Aerospace 09 00831 g011
Table 1. Composition of Rene’80 (wt.%).
CompositionCCrNiCoWMoAlTiFe
Content/%0.1613.8balance94.03.83.14.80.32
Table 2. The mechanical properties of Rene′80.
ρ/kg·m−3E/GPaυα/10−6·°C−1cp/J·Kg−1·°C−1λ/W·m−1·°C−1σb/MPaσp0.2/MPaT/°C
8160199.00.312.5640212.121090815200
175.217.1659913.45985630600
171.018.761113.56975660650
168.818.4263614.251000610700
165.820.1064314.171060685750
161.720.5166114.36855670800
160.621.7767414.89775540850
158.022.6168714.89660430900
155.423.4573215.73485355950
152.823.5875315.823402101000
150.224.2777516.682131381050
Table 3. Test conditions.
Test No.Sr (mm)Vr (μm/s)Rubbing Force (N)
C−10.12035
C−20.52020
C−35025
C−48060
Publisher’s Note: MDPI stays neutral with regard to jurisdictional claims in published maps and institutional affiliations.

