Article

Geometric Optimization of Blunt Bodies with Aerodisk and Opposing Jet for Wave Drag and Heat Reduction

School of Interdisciplinary Engineering & Sciences, National University of Sciences & Technology, Islamabad 44000, Pakistan
*
Author to whom correspondence should be addressed.
Aerospace 2022, 9(12), 800; https://doi.org/10.3390/aerospace9120800
Submission received: 5 October 2022 / Revised: 2 November 2022 / Accepted: 6 November 2022 / Published: 6 December 2022
(This article belongs to the Special Issue Emerging Space Missions and Technologies)

Abstract

:
The use of passive, active, or hybrid flow control techniques is often investigated to reduce the acoustic signature, wave drag, and aerodynamic heating associated with the supersonic flow regime. This research explores passive and hybrid flow control techniques to achieve an optimal reduction in wave drag and aerodynamic heating on a blunt body using an aerodisk. While passive techniques use one or two aerospikes, hybrid techniques employ opposing jets and aerospikes. Numerical analysis is performed using Reynolds-Averaged Navier–Stokes (RANS) equations to analyze the bodies’ flow field. The statistical technique, Design of Experiments (DOE), is combined with Response Surface Method (RSM) to find the optimal configuration for four cases by generating design space. Two cases were considered for the optimization: single aerospike with and without opposing jet and double aerospike with and without opposing jet. Variables used for the design of the aerodisks were spike length and diameter, while the response variables were wave drag and normalized heat flux. The current study has established an optimum relationship between spike length and aerospike diameter located in front of the main blunt body for both single and double aerospikes. The study’s results suggest that a double aerodisk configuration is more beneficial for reducing drag and heat flux at supersonic speed than a single aerodisk. By incorporating an opposing jet at a pressure ratio of 0.8 from the frontal aerodisk to the spiked blunt body, it can reduce drag and heat flux by 86% and 95%, respectively. Finally, numerical verification is performed for statistically optimized designs.

1. Introduction

With the growing need for fast-moving intercontinental transportation systems and space tourism, the global research community has renewed its interest in developing safe, reliable, and economical supersonic flight systems. Despite this, the primary challenges faced in developing these vehicles are wave drag, and aerodynamic heating [1]. It may be possible to make supersonic and hypersonic space exploration missions viable by modifying flow behavior and geometrically optimizing blunt bodies [2,3]. Implementing active, passive, and hybrid flow control techniques are actively pursued to reduce air resistance, and heat generation on blunt bodies [4,5]. Active flow control techniques involve introducing energy or power to the flow. This involves energy deposition upstream of the body and using an opposing jet. The opposing jet has gained popularity among the active flow control techniques owing to its re-usability and profitability. This effective method comprises the ejection of a jet from the stagnation point of a blunt body in the upstream direction. The free-stream fluid then transforms this jet to flow in the rearward direction forming a shear layer over the body surface, thus protecting it from the external high-pressure and high-temperature environment.
The experiments by Hayashi et al. [6,7] and associated numerical studies disclosed the flow field around the blunt-shaped profile at several pressure ratios (PR). Many researchers used this study as a verification criterion for the numerical approach. Venukumar et al. [8] also proved the productiveness of opposing jets through experimentation. Rong [9] proposed a new assessment framework incorporating the jet pressure ratio and its area to analyze the impact of opposing jets. Numerical methods have also studied the impact of jet temperature [10,11], medium [12,13], and nozzle geometric parameters [2,14] in reducing the wave drag and heat flux. Similarly, Gerdroodbary et al. [13] suggested a method that converts one opposing jet into a series of forward-facing micro-jets of the same area resulting in a heat-load reduction of 40%.
Moreover, Shen and Liu [15] proposed a small, lightweight gas device for opposing jet thermal protection in fast-moving flows, which utilizes the fuel gas generated with solid fuel as cooling gas. Another numerical study on shock reduction through a counter-flow plasma jet also showed pragmatic impacts on drag reduction in the supersonic flow regime [16]. Finally, as a more efficient method in heat reduction than the steady jet, the opposing pulsed-jet has also attracted some attention [17,18].
The flow physics of opposing jets is of significant interest to researchers. The core feature of opposing jets, when installed on blunt bodies, is the formation of long and short penetration modes. The long penetration mode is oscillatory and deemed inappropriate due to unsteady behavior. However, the short penetration mode contributes to a significant reduction in drag and wall-heat flux. Bibi et al. [2] proposed shape changes in the ejection of opposing jet nozzle to control short and long penetration modes. Similarly, Li et al. [14,19] examined the effects of jet nozzle configuration and free-stream flow conditions on drag and heat reduction through a counter-flowing system [20].
Passive flow control methods involve techniques that do not introduce any energy or power to the flow. Flow is usually manipulated by using different geometric shapes as per application requirements. Various methods are used to separate flow for drag and heat reduction, including grooves, ribs, spikes, and their combinations [21,22]. Among these passive techniques, the mechanical spike has gained the most importance. As part of the seminal study by Alexander [23], he suggested the use of aerospike to reduce wave drag at high-speed flows. Several studies were subsequently proposed to explore the flow physics of fast-moving flows over a blunt profile with an elongated nose tip. Findings from the literature show that the spike modifies the forebody flow field in two ways [24]. First, it breaks the single strong shock wave into a series of weak oblique shock waves. Second, it causes flow separation and creates a shear layer that re-attaches downstream of the forebody region [24]. A comprehensive review of spike technology conducted by Ahmed [25] suggests that the aerospike can reduce drag as it protrudes from the nose tip of the blunt body.
The hybrid flow control technique is an amalgamation of active and passive devices that can significantly reduce aerodynamic drag and heat flux. There are several combinations of active and passive devices available in the literature, such as the combined impact of counter-flowing jets and forward-facing cavities. The forward-facing cavity located at the tip of the blunt body is accepted for wave drag, and aero-heating reduction [26,27]. Huang et al. [28,29] conducted parametric research concerning the influence of cavity location, length-to-depth ratio, and aft angle of the cavity. Based on the conventional cylindrical configuration, a novel cavity of parabolic geometry was suggested by Sun et al. [30], which showed greater efficiency in reducing heat and pressure. Moreover, the amalgamated jet and cavity concept was suggested to be better for drag and aero-heating reduction [26,27,28,29,30,31]. Similarly, Gerdroodbary et al. [12] analyzed the combined effect of an aerospike and an opposing jet at a Mach number of 5.75 by ejecting cooling gas from the top of the blunt body. The analysis outcomes showed the tremendous advantages of a combined thermal protection system for thermal relaxation and drag reduction of blunt bodies. Eghlima et al. [32,33] presented numerical simulations of drag variation and heat flow around a spherical head cylinder when an amalgamated thermal protection system was installed, and with air as the jet gas. At a Mach number of 3.98 and using liquid nitrogen, Huang et al. [28] modeled a combined aerospike and opposing jet system in a hypersonic flow. Jiang et al. [34] performed a wind tunnel experiment on a hemispherical blunt-shaped body to analyze the impacts of a combined aerospike and transverse jet thermal protection system on thermal protection and drag reduction for a blunt body in high-speed flows.
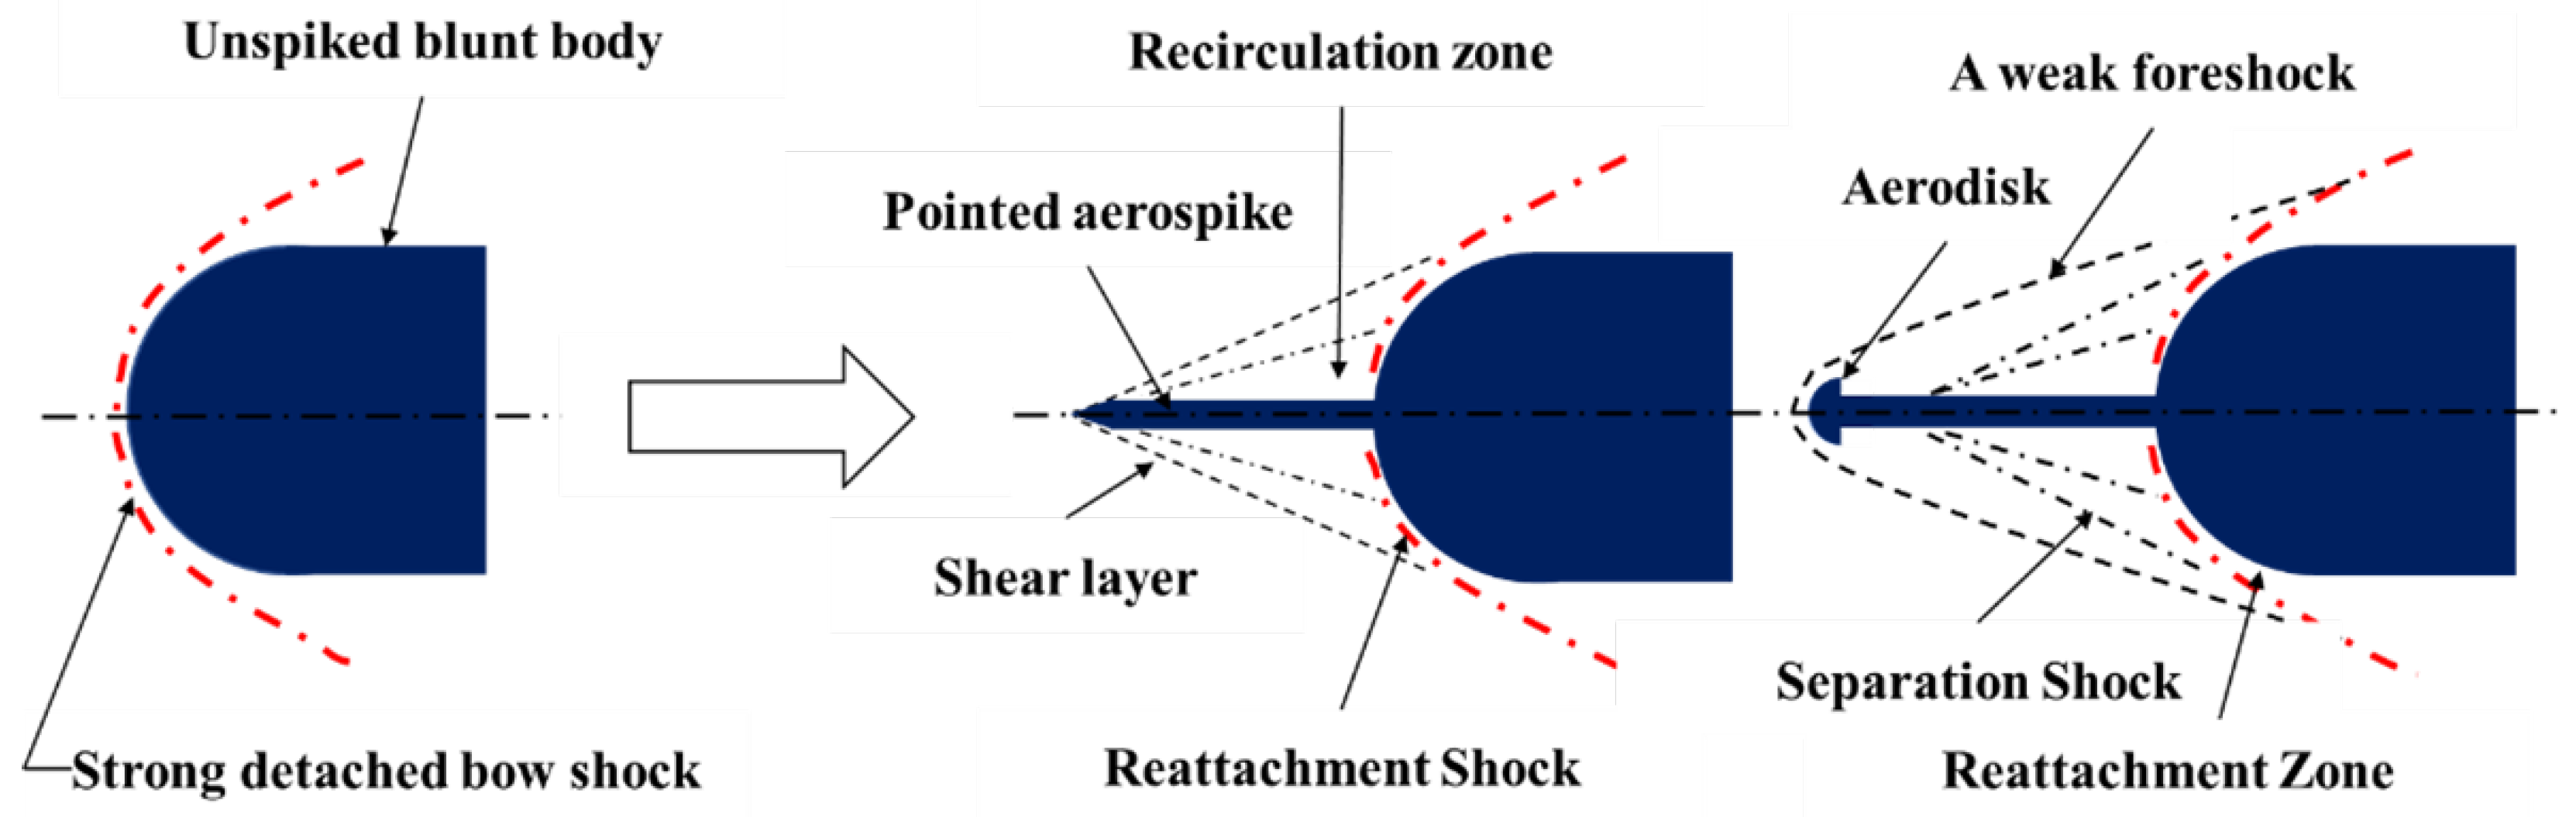
This allows the aerospike to effectively push the strong bow shock away from the blunt-body wall, generating a weak conical shock wave from the spike tip, and reducing the high pressure and temperature of the flow field after the shock wave pattern. As a result, the additional spike separates the upstream flow field of the blunt body, where the separation flow then attaches to the vehicle’s surface, creating a re-circulation zone adjacent to the vehicle’s head. Despite the well-established idea that elongated aerospikes can reduce extreme pressure drag on blunt bodies, they also increase the heat transfer rate. Since the mechanical spike endures high temperatures during flight, it must be replaced frequently or cooled continuously. The aerospike can be made effective by using a hemispherical blunt tip shield known as an “aerodisk”, further enhancing the efficiency of the elongated aerospike. The size, shape, and length of the aerodisk and the spike have raised concerns about the flow field around bluntly shaped profiles, as depicted in Figure 1. A comprehensive summary of the experimental research shows that the aerospike length-to-diameter ratio (L/D) presents a significant geometric parameter of the thermal protection system.
In the present study, a Design of Experiment (DOE) based optimization process was used to improve the passive and hybrid flow control techniques by introducing a greater understanding of the flow field around a blunt body. The goal was to alter the flow field for aerodynamic drag and heat reduction using hybrid techniques. For this purpose, we investigated wave drag and heat reduction employing numerical and statistical approaches. This paper begins with a brief review of different flow control techniques (Section 1), followed by a description of the research problem through the development of a numerical model used for validation cases and setup for aerodisk design space (Section 2). Section 3 presents the optimized design results using a single and double aerodisk. These results include flow physics of optimized geometries. Finally, the main results of this work are summarized in Section 4.

2. Problem Formulation

Computational Fluid Dynamics (CFD) is used as one of the tools for the numerical analysis of complex flow fields. The modeling and simulation setup was created using Reynolds-Averaged Navier–Stokes (RANS) solver and best-fit turbulence model. These represent the appropriate models for use in CFD simulations.
An axis-symmetrical blunt body was generated with and without an opposing jet at the nose of the blunt body to validate the flow field. Furthermore, the passive and hybrid designs for single and multiple aerodisks on the spiked blunt body were geometrically constructed. The two central equations involved in the analysis are continuity and momentum equations. Furthermore, as the flow is analyzed at high Mach numbers, the energy equation was also incorporated. The continuity equation is expressed in Equation (1) where ρ is density and u, v, and w are velocity components in x-, y-, and z-directions, respectively. The first term is the rate of change in density, while the second term describes the net flow of mass out of the elements across its boundaries and is denoted as the convective term.
ρ t + ρ u x + ρ v x + ρ w x = 0 .
The three equations are the momentum equation in x-, y-, and z-directions, respectively; where “P” is the pressure, “ R e ” is Reynolds number, and τ is the stress.
( ρ u ) t + ( ρ u 2 ) x + ( ρ u v ) y + ( ρ u w ) z = p x + 1 R e τ x x x + τ x y y + τ x z z
( ρ v ) t + ( ρ u v ) x + ( ρ v 2 ) y + ( ρ v w ) z = p y + 1 R e τ x y x + τ y y y + τ y z z
( ρ w ) t + ( ρ u w ) x + ( ρ v w ) y + ( ρ w 2 ) z = p z + 1 R e τ x z x + τ y z y + τ z z z .
Since the flow is compressible, the energy equation is also utilized and is given as follows:
E T t + u E T x + v E T y + w E T z = u p x v p y w p z 1 R e P r q x x + q y y + q z z + 1 R e [ x u τ x x + v τ x y + w τ x z + y u τ x y + v τ y y + w τ y z + z u τ x z + v τ y z + w τ z z ] .

2.1. Computational Setup

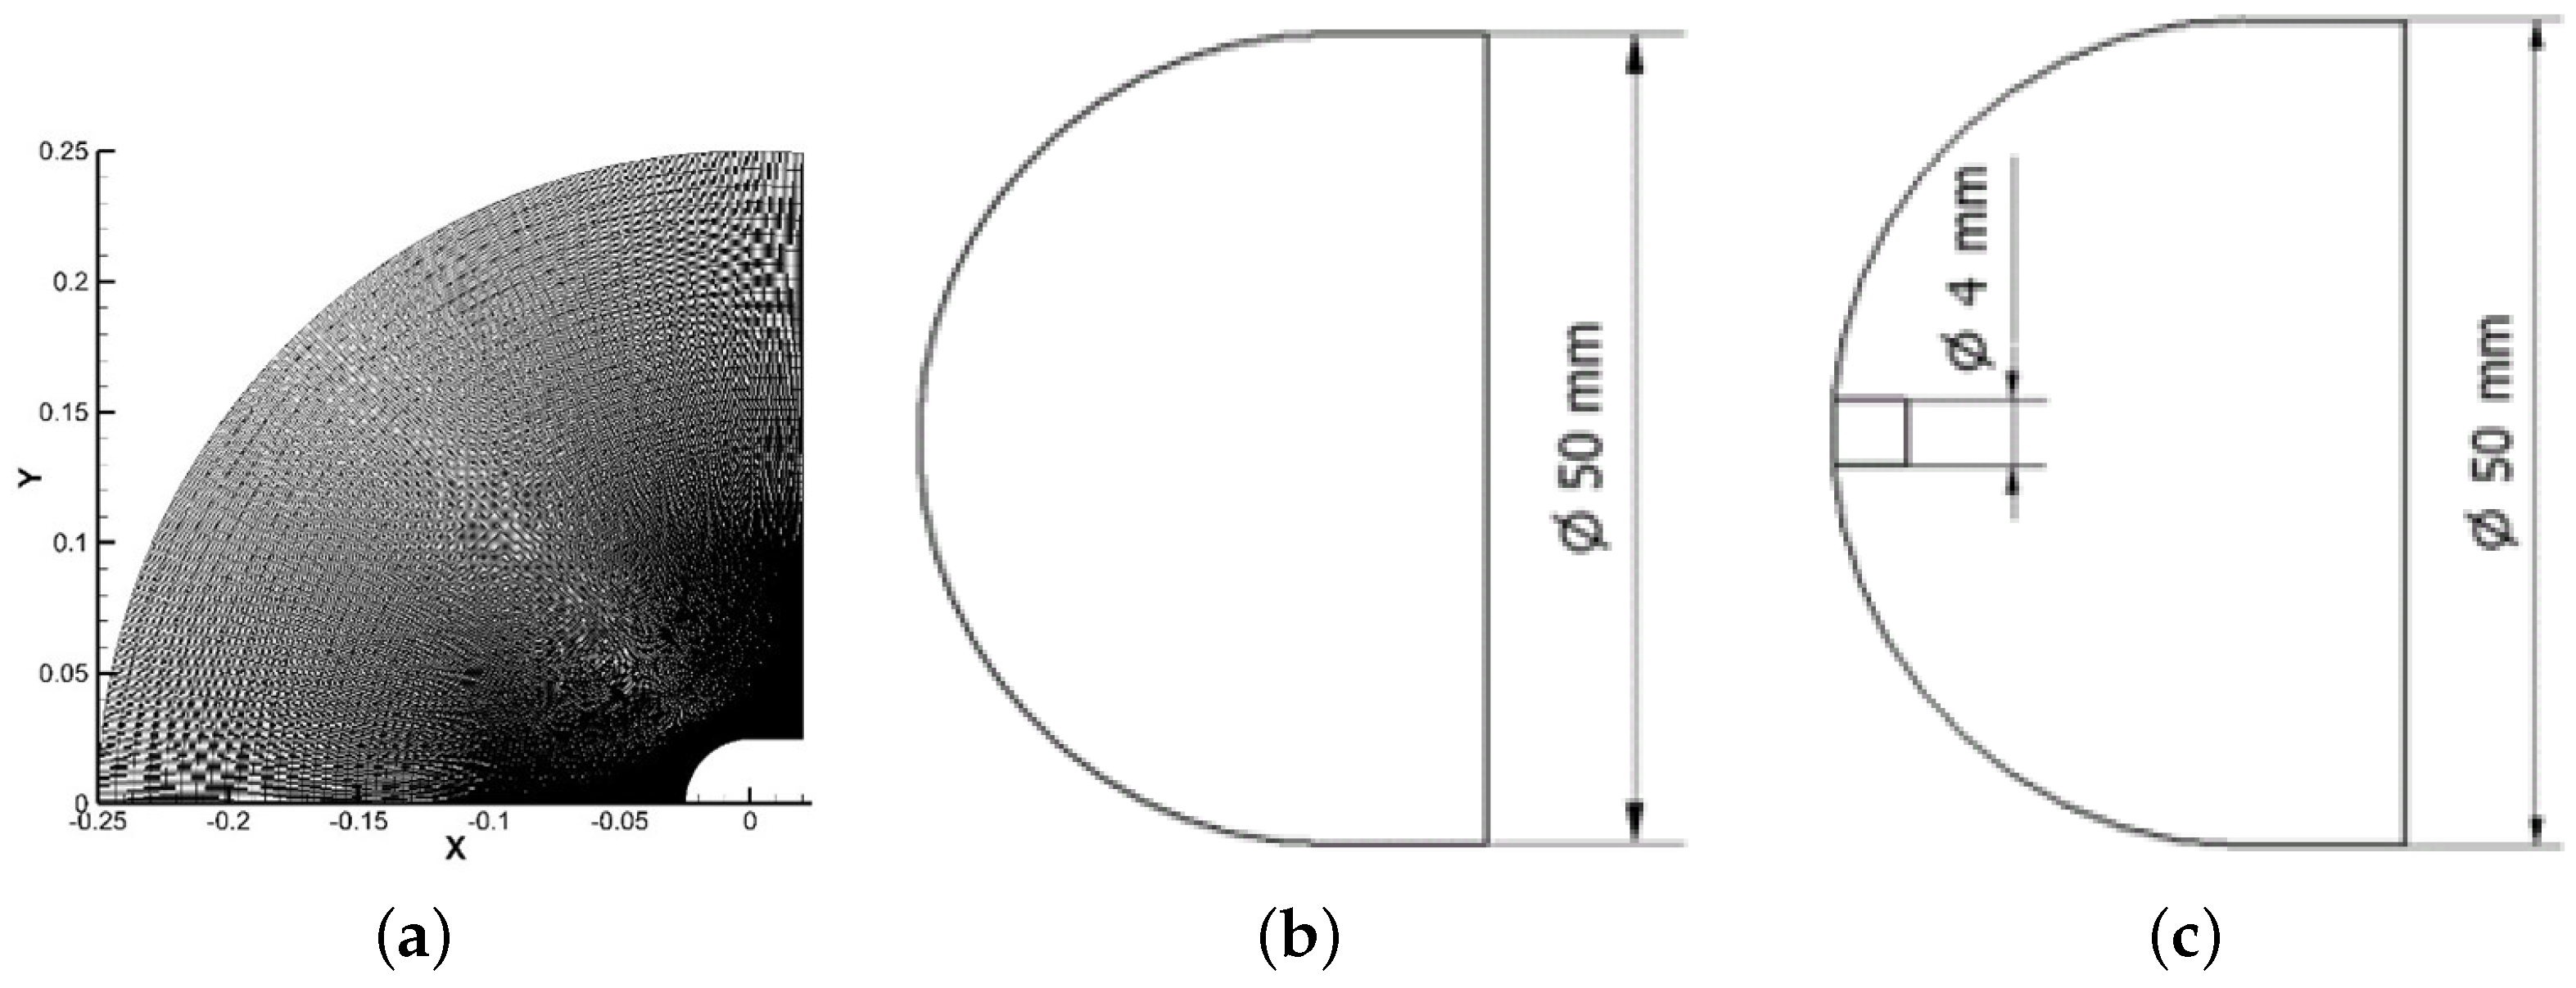
A fully structured 2D axis-symmetrical computational grid was generated in ANSYS® Mesher. Due to the symmetry of the problem, only one-half of the geometry was modeled. The grid was highly clustered near the body surface and jet orifice (for the hybrid flow method) to accurately resolve complex flow features in these regions, as shown in 
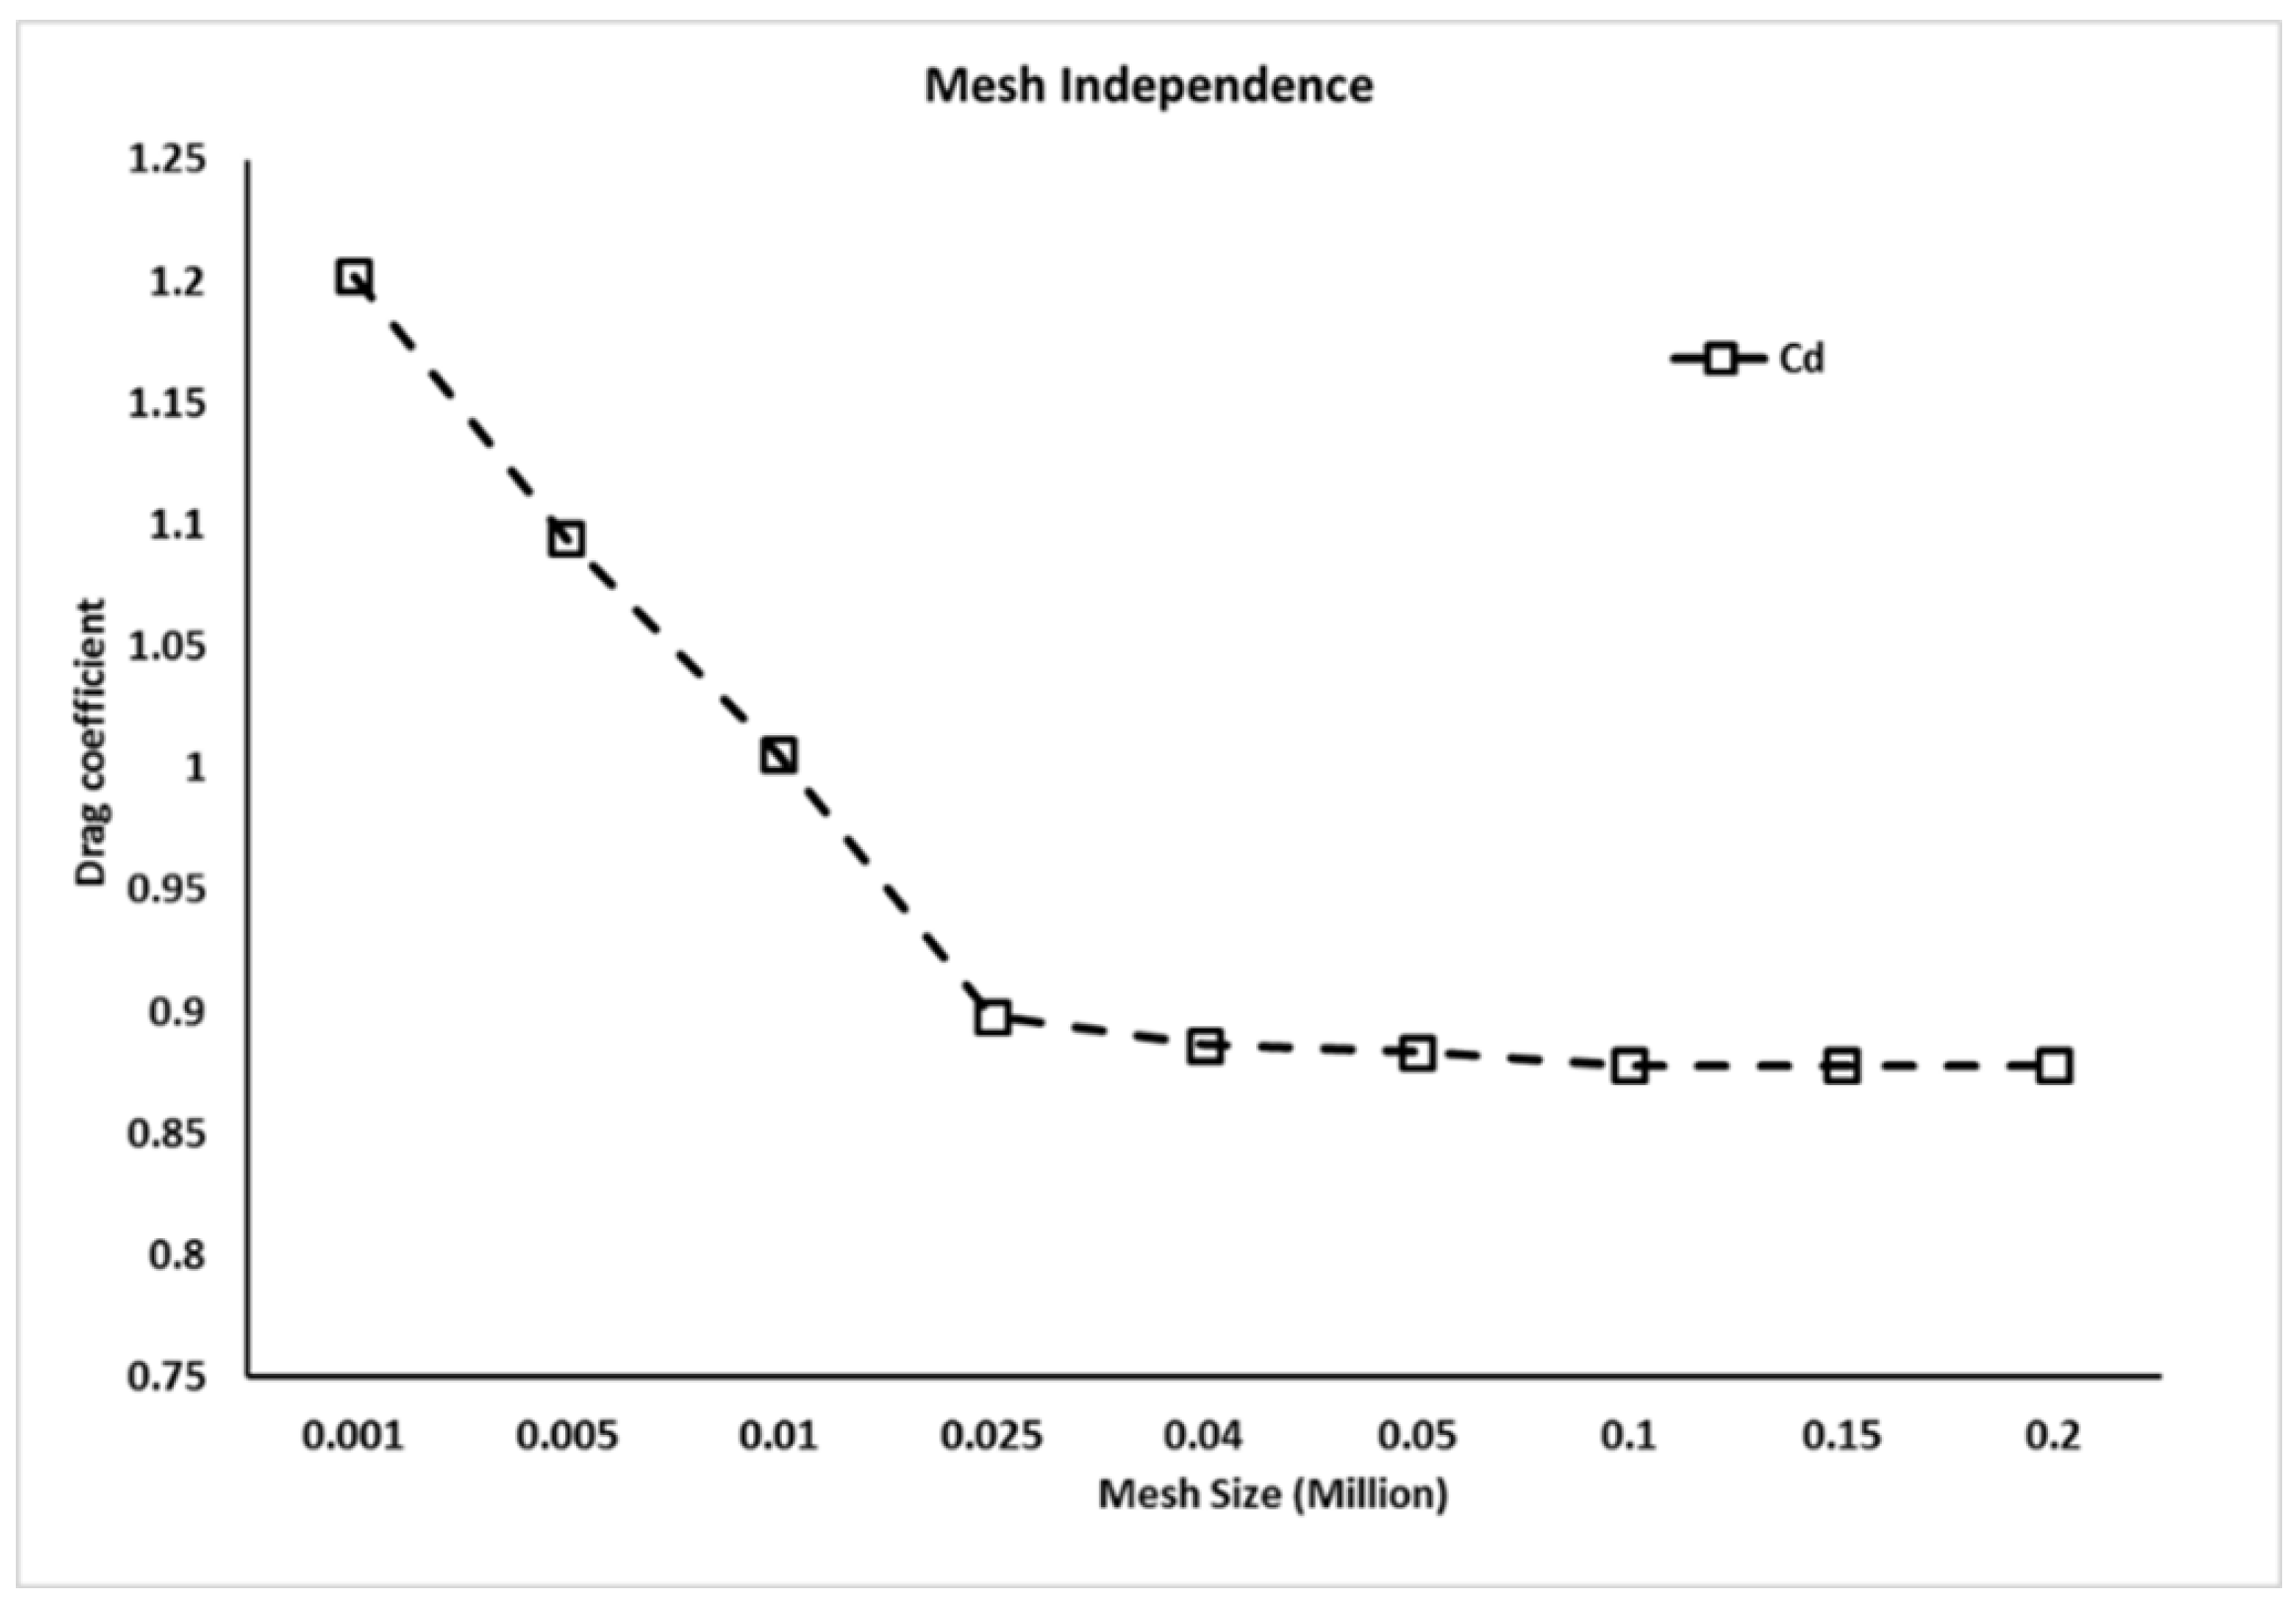
Figure 2. A grid independence study was also performed for the no jet case, as shown in Figure 3. A total of three grids; coarse (40,000), medium (100,000), and refined (150,000) were used. The refined grid results matched very closely with the experimental surface pressure plots. Therefore, the refined grid was selected for further analysis.
Ansys
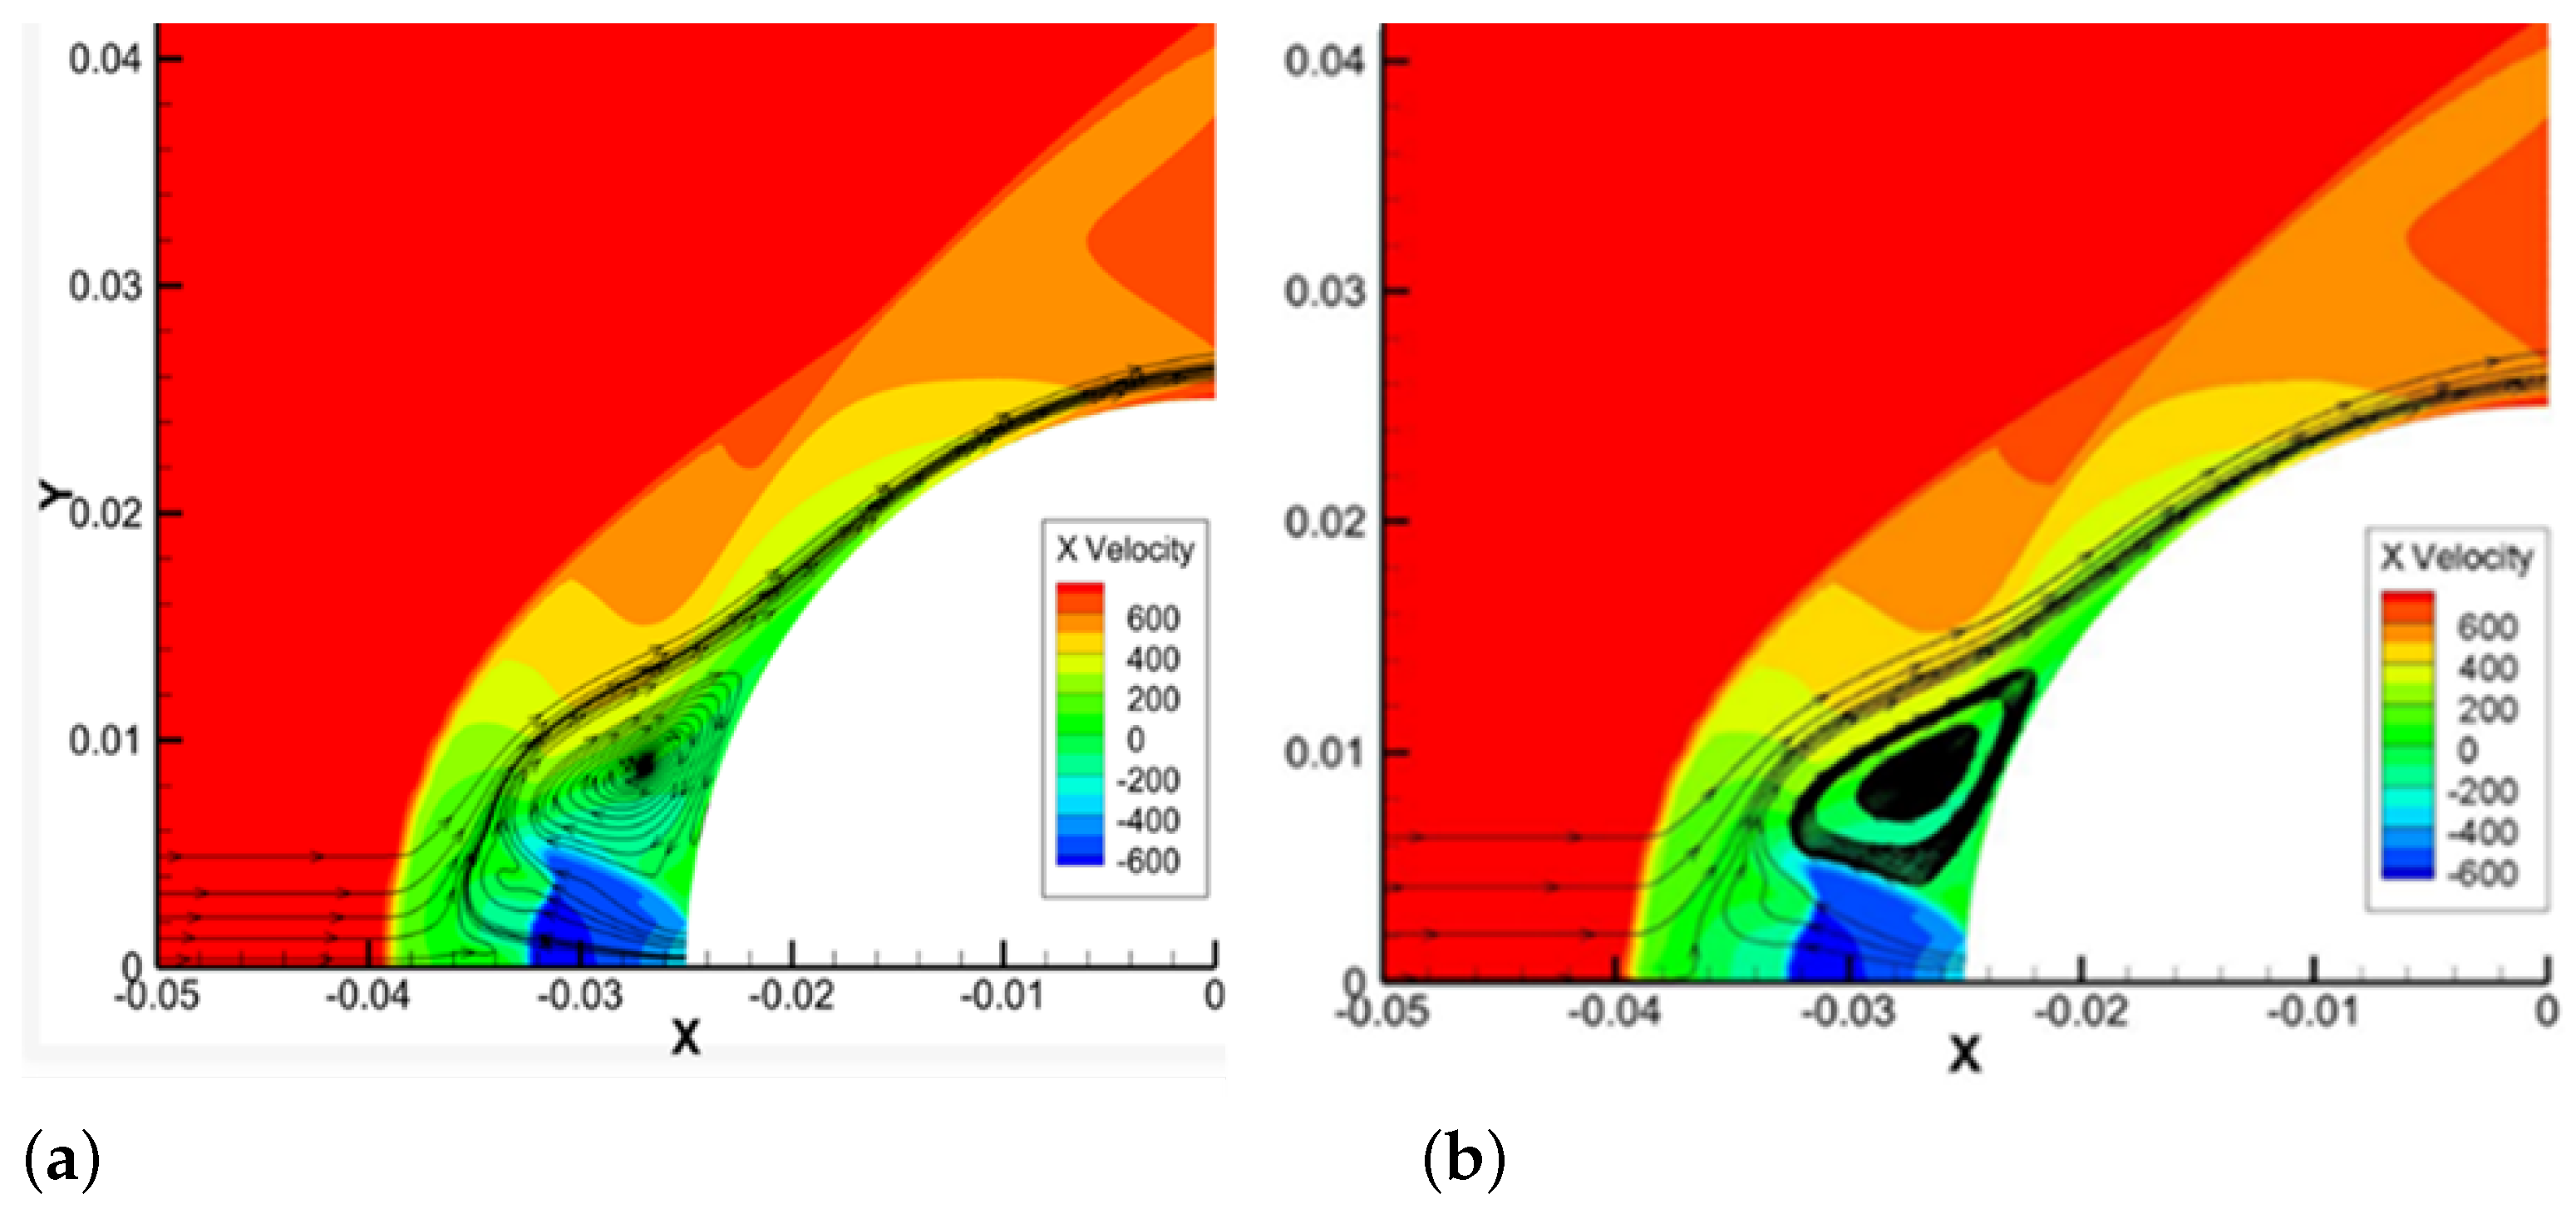
® Fluent was used as the numerical solver for performing simulations. Axis-symmetrical steady-state Reynolds-Averaged Navier–Stokes (RANS) equations were solved using a density-based implicit solver. This solver is found to work efficiently for supersonic and hypersonic flows. Since aero-thermal chemical considerations were neglected, the air was therefore modeled as an ideal gas in current operating conditions. Air viscosity was defined by Sutherland’s viscosity law. A turbulence model was introduced to capture complex flow features such as shock waves, separation, and re-circulation regions. The K− ω SST turbulence model densely captures the flow field in the inner region of the boundary layer. The flow contours and re-circulation region located in front of the blunt body were more concentrated in the K− ω SST model than the Spalart Allmaras model and can be viewed in Figure 4. Moreover, the results of the K− ω turbulence model mapped best with the experimental data [6]. Therefore, the K− ω turbulence model was used in this study.
The baseline configuration with available experimental data was adopted from Hayashi et al. [6]. The flow conditions in Table 1 are similar to those used in the experimental work of Hayashi et al. [6]. The jet flow boundary was set to pressure inlet. The numerical domain was modeled as far-field, with the outlet modeled as a pressure outlet. The selection of these boundary conditions allowed us to successfully compute the overall mass-flow rate of the system and to assess its conservation. A no-slip isothermal condition was applied to the wall. Details of the boundary conditions used are given in Table 1.

2.2. Validation of Test Case

Validation results were compared against the numerical and experimental work of Hayashi et al. [6,
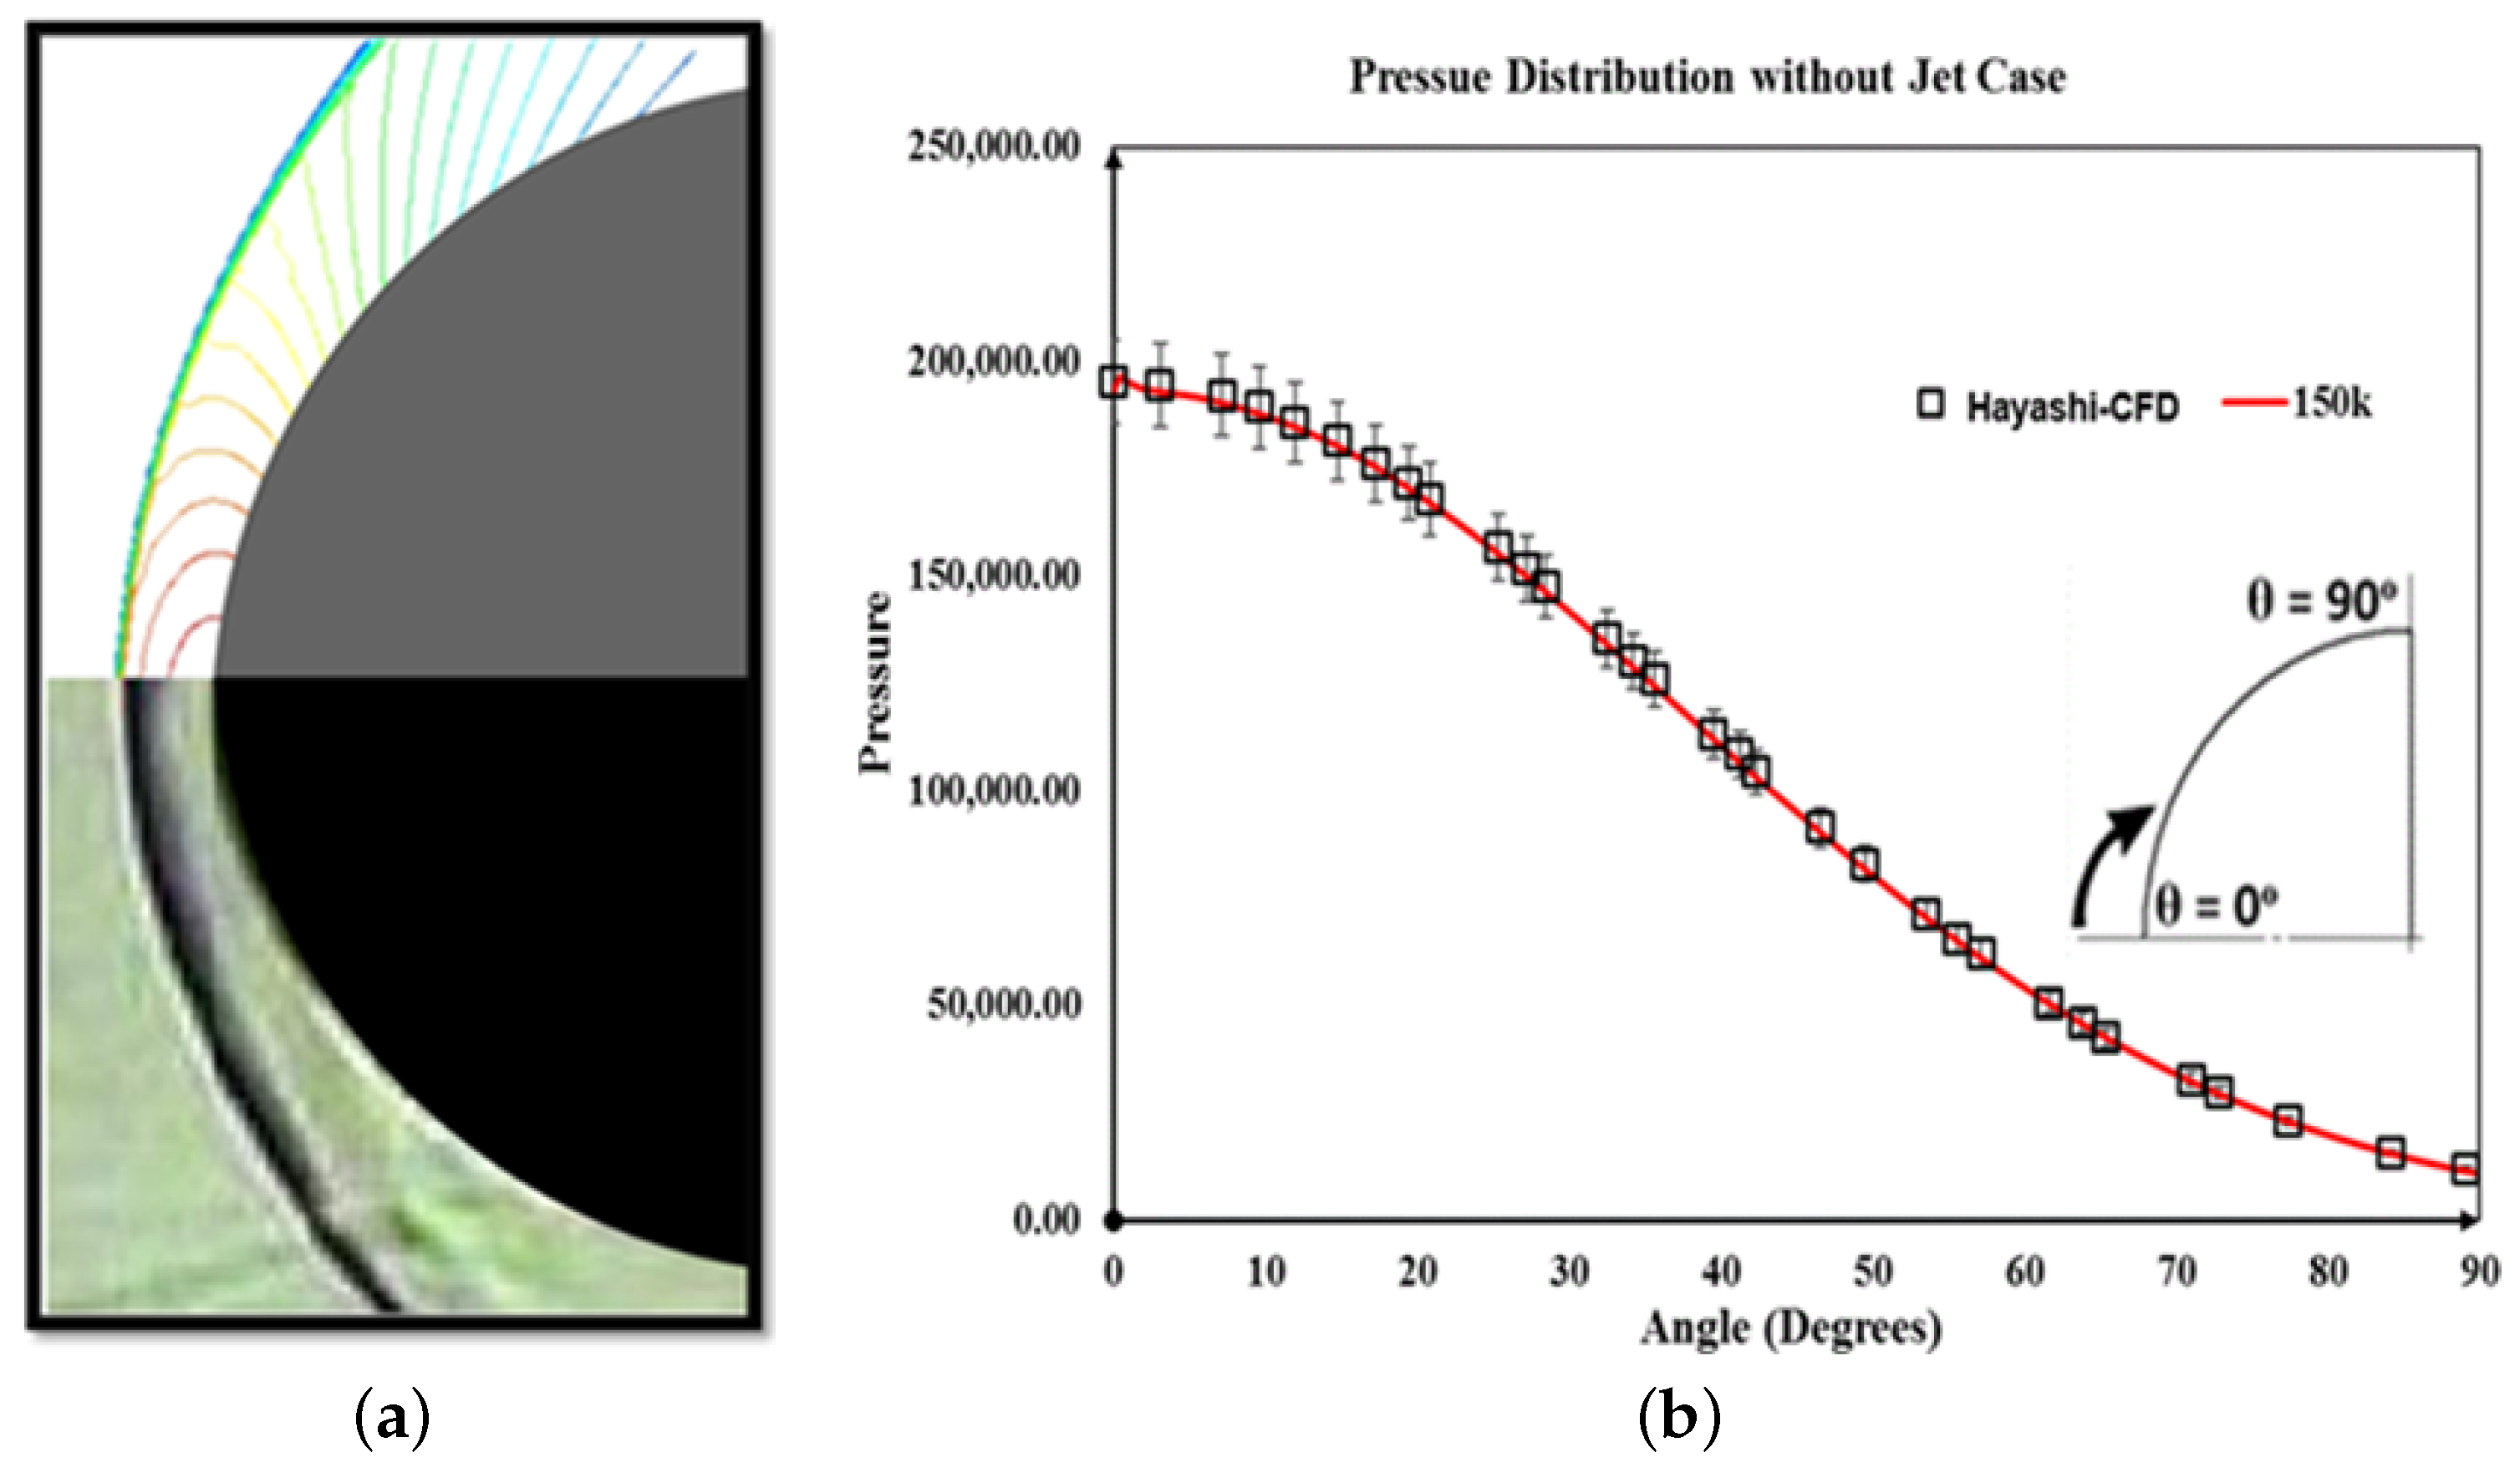
7]. The total surface pressure and wall-heat flux distribution, Stanton number, are compared in the cases with and without jet. The analysis showed the formation of a very thin bow shock visible just ahead of the blunt body in Figure 5 for the no jet case. The density contour showed that the computed shock stand-off distance is in good agreement with experimental imagery obtained from the work of Hayashi et al. [6]. Similarly, the pressure distribution comparison demonstrates close agreement with experimental data [7].
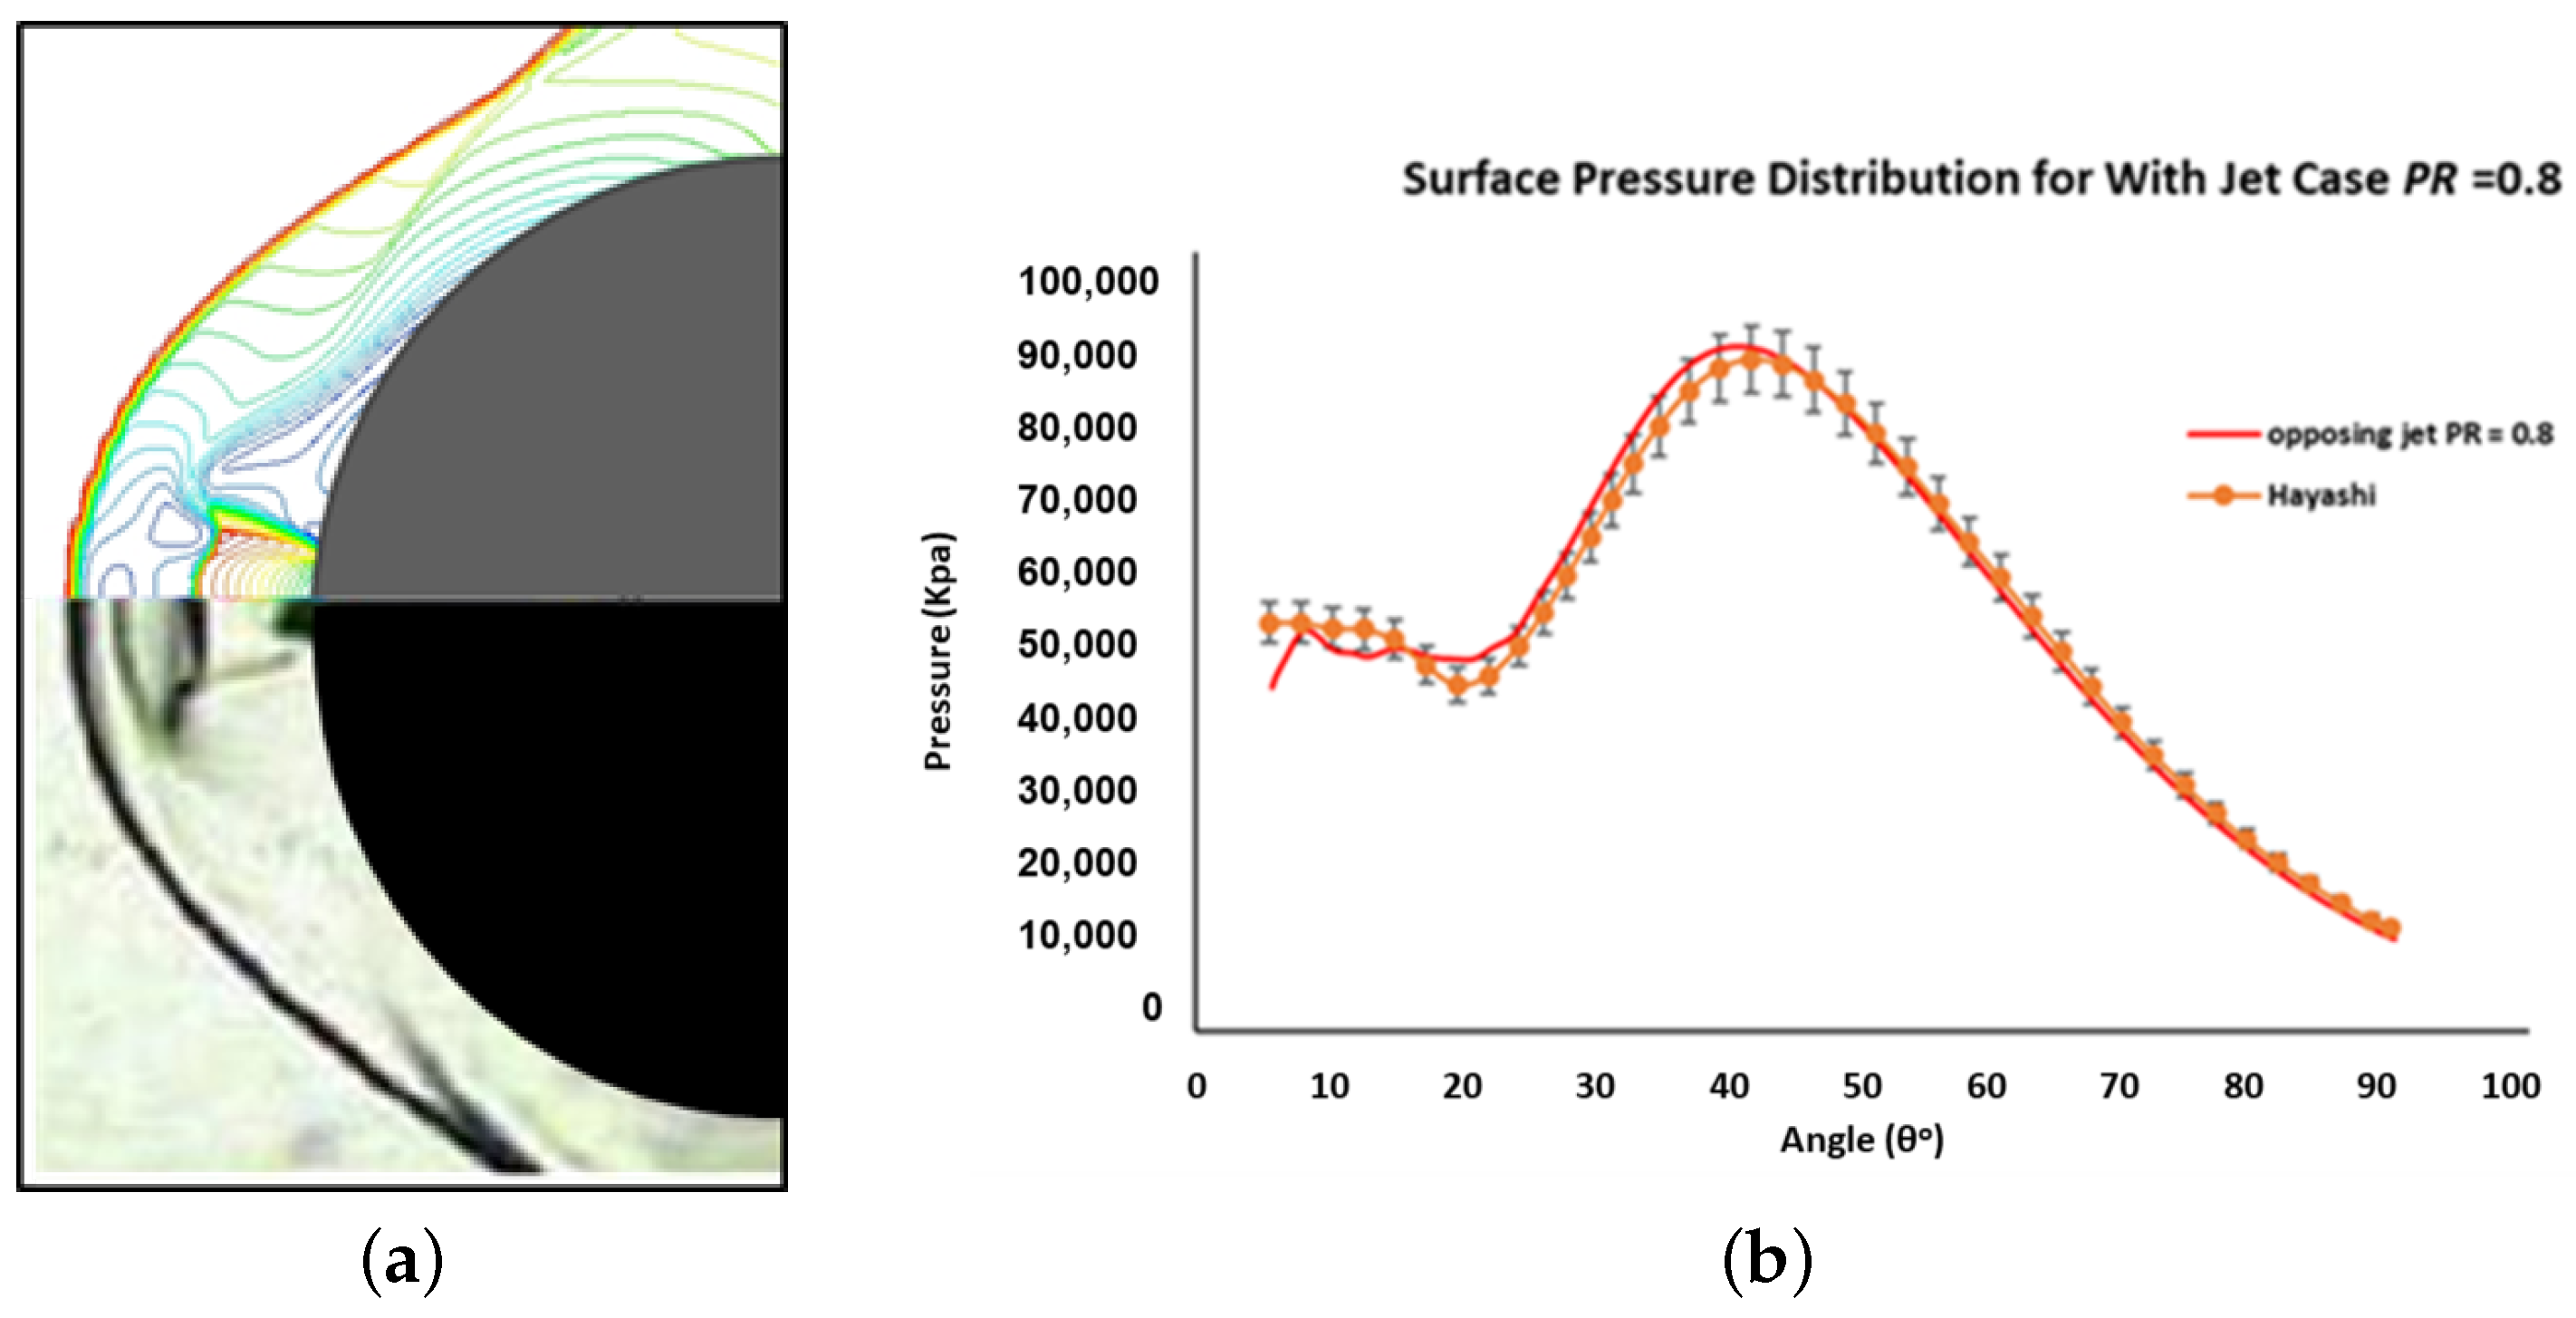
The jet emitted from the nose of the blunt body is specified in terms of total pressure ratio (PR). It describes the ratio of jet stagnation pressure P o j to free-stream stagnation pressure P o . In the present work, the jet ejection diameter is kept constant at 4 mm. Numerical simulations of PR = 0.8 are conducted and duly validated with experimental surface pressure data. Figure 6 shows both numerically validated surface pressure plots and shock stand-off locations with experimental data [6].
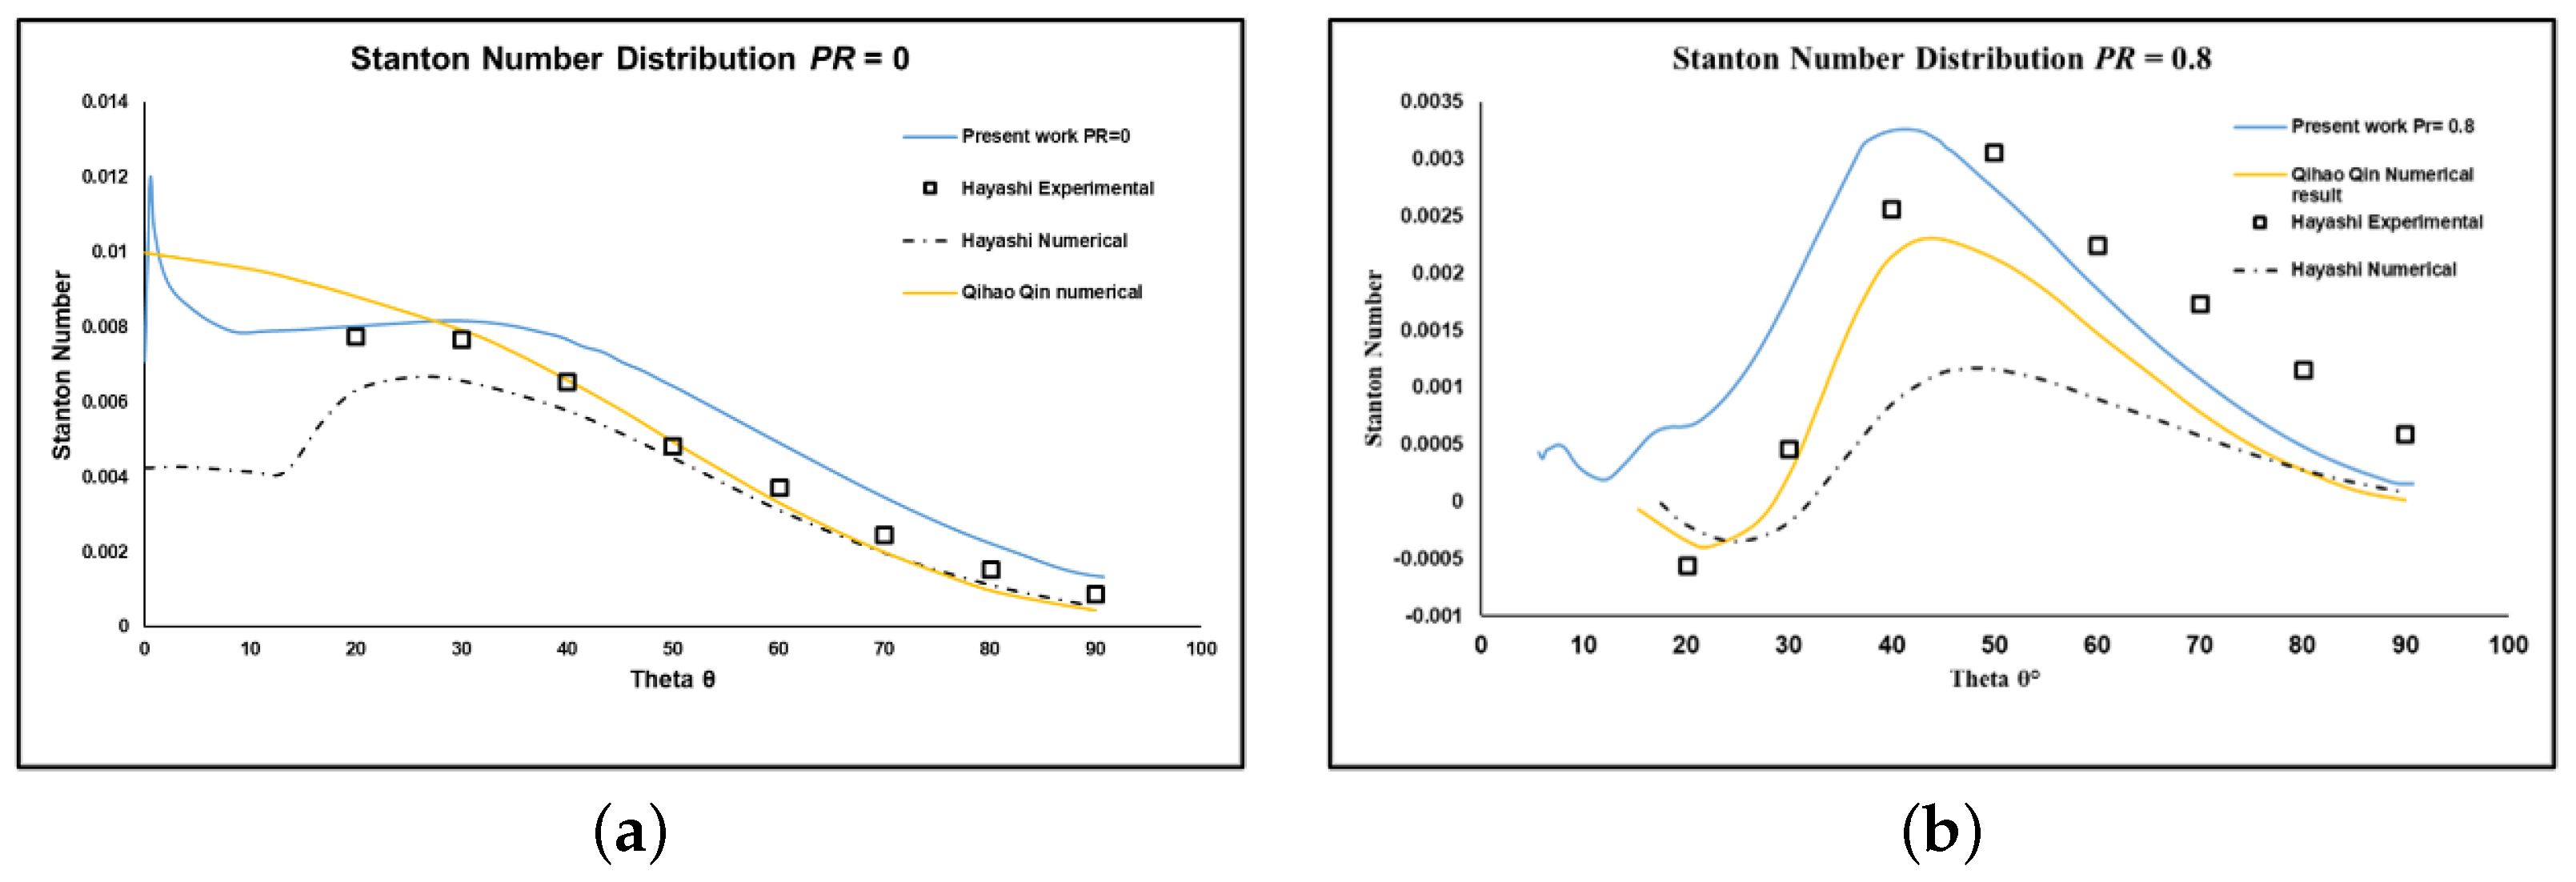
The Stanton number (St) is a dimensionless number that measures the ratio of heat transferred into a fluid to the thermal capacity of the fluid and is expressed as:
S t = q w ρ c p U T a w T w
where q w is the surface heat flux, cp is the specific heat at constant pressure, and T a w is the adiabatic wall temperature and computed as:
T a w = T 1 + γ 1 2 Ma 2 P r w 1 3
where Pr w denotes the wall Prandtl number. For the validation case, M = 3.98, T = 95.25 K, T w = 295 K, C p = 1006.43, γ = 1.4, and U = 778.375 m/s were used. The computed results are compared with those of Hayashi [6] for the with and without jet cases, as shown in Figure 7. It can be seen that the Stanton number distributions obtained via numerical methods struggle to cover the experimental results completely. The experimental thermal measurement represents a challenging task from the authors’ point of view. This is mainly due to the rapid thermal response of the blunt body in high-speed flights, whereas starting the wind tunnel and establishing a flow field before the aero-heating measurement occurs is a lengthy process.

2.3. Selection of Design Variables and Their Ranges

Design of Experiments (DOE) is a systematic approach to understand the effect of process and product input parameters on response variables such as product performance, efficiency, processability or optimization of physical properties. It is a mathematical tool used to optimize system performance and interpret the impact of each input parameter on the output responses. In order to predict the product properties and performance within the range selected for the experimental design, DOE employs statistical methodology to understand how a particular input variable affects product performance, and the possible interactions between input variables. In addition, DOE generates the required information using the minimum number of experiments necessary, and applies mathematical analysis to predict the response within experimental limits and under specific experimental conditions. DOE creates a clear division between significant and insignificant input factors. Further, it can be used to determine which factors and interactions are critical and have a major impact on the output response, and which variables and interactions contribute insignificantly to the output. In addition, DOE is computationally extensive and economically cheap in providing a usable understanding of product properties and efficiency. The best use of DOE is during new product development, existing product optimization, and solving technical problems where more than one variable is present. It is also used to help understand the response of multiple variables that can be altered or controlled during experimentation. Another advantage of DOE is that systematic data are generated, summarized, and evaluated to definitively determine whether a project should be continued or the project cannot be resolved and should thus be discontinued. Regardless of whether the DOE results are positive (the experiment shows the desired response) or negative (the experiment shows an undesired response), it is still important to complete the project and document the results so that the project will not be needlessly repeated. In short, the major steps of DOE provide an understanding of the processes and their interactions over the experimental space studied [
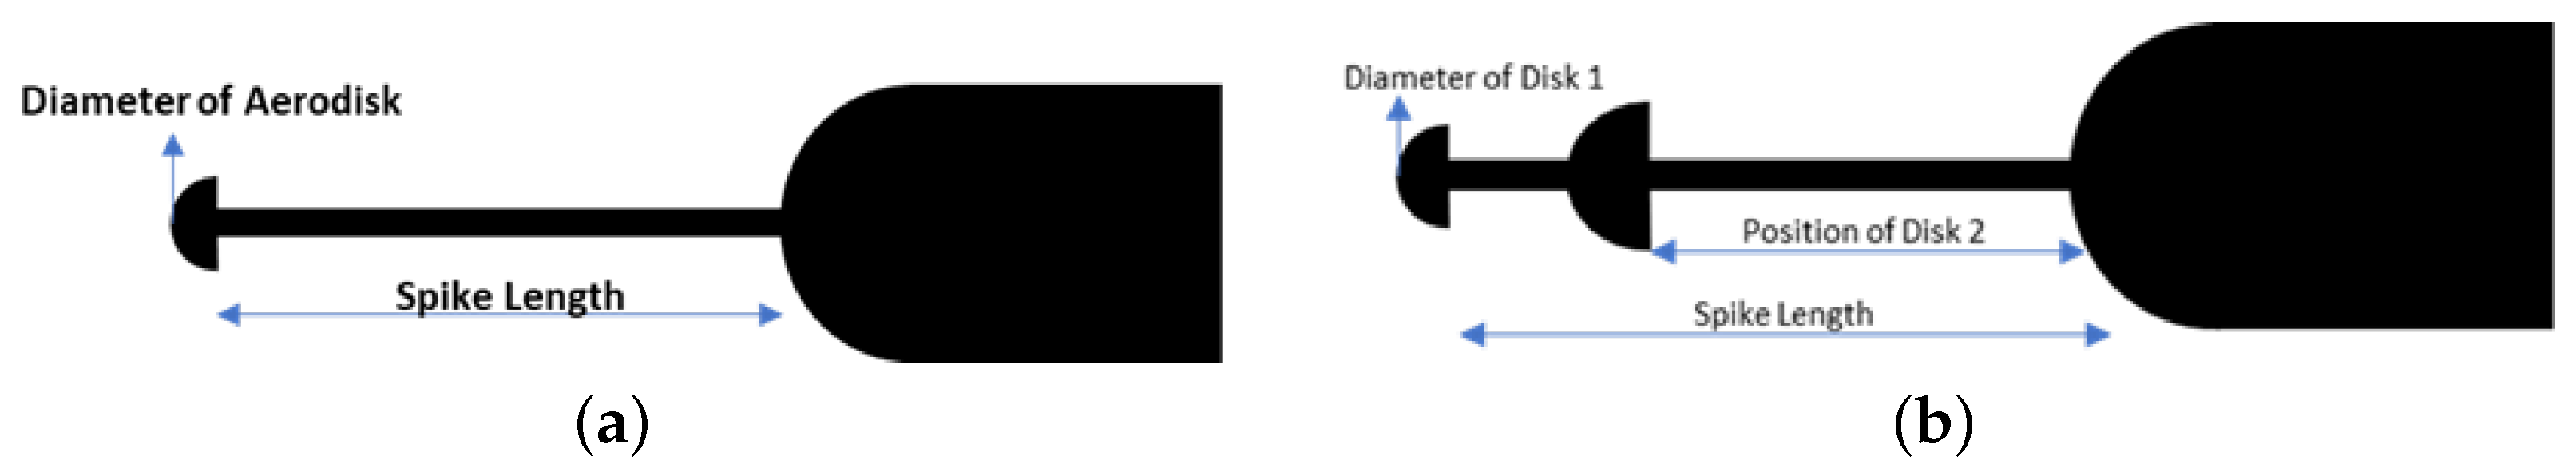
35]. A critical step in the DOE process is the selection of input variables and the maximum and minimum range for each input variable. The input factors and ranges directly impact output responses. In the present research, two control variables were selected for the optimization process. A schematic view of the single and double aerodisk configurations with aerospike is shown in Figure 8.
For passive and hybrid design optimization using a single aerodisk, the two significant factors, spike length, and disk diameter are selected along with their maximum and minimum limits as described in Table 2.
For an aerospike with a double aerodisk, the two input factors were kept the same as that selected for the single aerodisk; however, the position of the intermediate aerodisk (Disk 2) varied at 25%, 50% and 75% of the overall spike length, as shown in Figure 8. Therefore, in this case, the three input factors and their maximum and minimum limits are shown in Table 3.
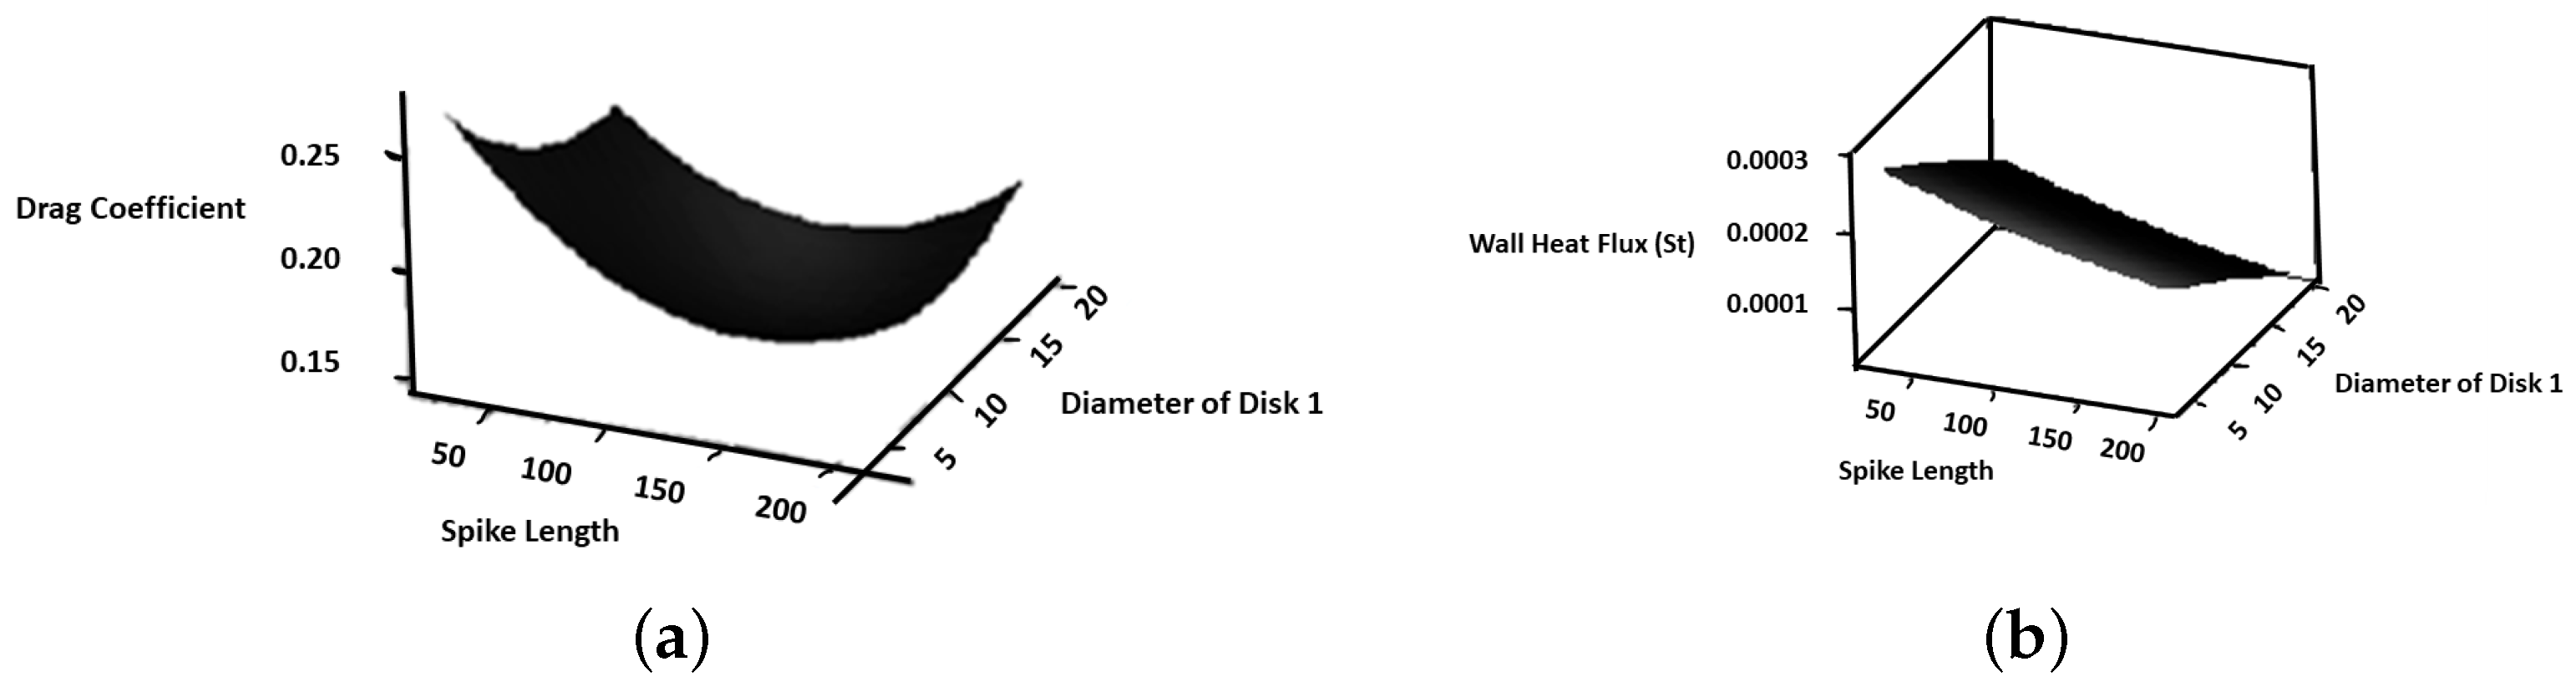
The two significant output responses are the drag coefficient (C d ) and the Stanton number (St). ||St|| 2 is considered the main output response, and is therefore utilized in analyzing the results for a single aerodisk in the with and without the jet cases. Conceptually, the second norm of values calculates the distance of vector coordinate from the origin of vector space. The result is a positive distance value. The second norm of Stanton number ||St|| 2 is calculated by taking the square root of the sum of squared values of Stanton numbers of each spatial location over the body surface within 2D vector space.
| | S t | | 2 = ( | | S t | | 1 ) 2 + ( | | S t | | 2 ) 2 + ( | | S t | | 3 ) 2 + ( | | S t | | n ) 2 n .
As the wall-heat flux distribution over the body surface area varies from point to point in vector space; therefore, the second norm of Stanton number, ||St|| 2 , is selected as the output response as shown in Equation (8).

2.4. Single and Double Aerodisk Design Space

The central composite design is useful in response surface methodology for building a second-order (quadratic) model for the response variable, without requiring the performance of a complete three-level factorial experiment. Occasionally, iterative linear regression is used after the designed experiment is performed to obtain results. Coded variables are often used when constructing this design. The advantage of using either the Central Composite or Box Behnken designs to generate response surfaces is that fewer experiments are required. Using either the Central Composite or Box Behnken design to fit a cubic model requires further experimentation so that there is at least one experiment for each term in the model. Since quadratic models fit 95% of all experimental designs, it is reasonable to start with a quadratic model. Additional experiments can be added later if a higher-order model is required to predict the responses [36].
The design space is generated through the Central Composite Design (CCD) method for both the passive (without jet) and hybrid (with jet) single aerodisk, as shown in Table 4. The table shows critical information obtained from the CCD process. Std Order (Standard order) displays the non-randomized order of the runs used to display the design in standard order. Run Order presents the order in which the experiment is to be performed for potential bias reduction in random order. Pt Type shows the type of point in the designed experiment where 1, 0, −1, 2 represent a corner point, center point, axial point, and edge point, respectively. Blocks represent the categorical variable that identifies groups of experimental runs conducted under relatively homogeneous conditions. Using blocks in experimental design and analysis minimizes bias and error variance due to uncontrolled factors.
Similarly, for the double-aerodisk study, twenty experiments were generated to analyze three input factors against two output responses. Table 5 summarizes the designs generated for double-aerodisk-spiked blunt body.

3. Results and Discussion

3.1. Design Optimization Using Single Aerodisk

Numerical axis-symmetrical steady-state RANS-based simulations using ANSYS FLUENT software were performed for varying lengths of elongated spike and aerodisk diameters. The computational model grid formation and case setup for all 13 cases was based on the strategy adopted for the validation case. A pressure ratio of 0.8 was kept constant for the opposing jet. The design space results (Table 4) for the with and without jet cases are recorded in Table 6.
To understand the generic trend of the drag coefficient and wall-heat flux contour plot for the optimal design range for drag coefficient and average wall-heat flux without jet is shown in Figure 9. The general trend suggests that the optimal drag values lie within the optimal search space. The wall-heat flux plot suggests that an increase in spike length and disk diameter, in general, reduces aerodynamic heating. This interpretation bears limited implementation as the structural loads also require considerations that are beyond the scope of this study. Similarly, the surface plot for the optimal design range of drag coefficient and average wall-heat flux with opposing jet is shown in Figure 10.
Drag and heat flux responses are assigned equal significance to find optimal configurations. The predicted optimum design is sorted out for minimum drag and surface heat flux through a response optimizer based on numerical simulations for each experimental design. The composite desirability factor for cases with and without jets using a single aerodisk is 0.81389 and 0.90408, respectively. This lies within a highly acceptable range, as shown in Figure 11. For the optimal design without an opposing jet, the disk’s optimum spike length and diameter are found to be 122.22 mm and 9.33 mm, respectively. Similarly, for the optimum design with an opposing jet, the disk’s spike length and diameter are 93.94 mm and 19.19 mm, respectively. This suggests that the opposing jet helps reduce the spike length and increase the aerodisk diameter.
The optimal designs for a single aerodisk sorted through the Response Surface Method (RSM) require numerical verification to confirm the authenticity of the statistically generated optimal configuration. The verification process suggests that the drag coefficient and total-surface heat flux are closely related to statistical values. It also provides strong evidence for the effectiveness of DOE and RSM techniques in the geometric optimization of such cases. The numerically validated results and statistical data are shown in Table 7.

3.2. Design Optimization Using Double Aerodisk

This section extends the double-aerodisk design optimization as shown in Figure 8b. The diameter of the intermediate aerodisk is a constant parameter for every design and is 2 mm greater than the rearmost aerodisk. The objective of adding the second aerodisk on the spiked blunt body is to assess how the intermediate aerodisk can alter the flow field; around the blunt body at different positions on spike length and what the optimal design is using a double aerodisk on the spiked blunt body. Numerical simulations were performed to analyze the varying lengths of the spike, the diameter of the first aerodisk, and the position of the second aerodisk against drag coefficient and total surface heat flux for 20 different designs. Axis-symmetrical steady-state RANS-based simulations using ANSYS Fluent were performed, where the grid and case setup for all these configurations were based on the strategy adopted for validation process as explained in Section 2. The result of the numerical simulations are presented in Table 8. A pressure ratio of 0.8 was kept constant for the opposing jet. The design space results (Table 5) for the cases with and without jet are recorded in Table 8.
A contour plot for the optimal design range of drag coefficient and average wall-heat flux without jet is shown in Figure 12. It gives a general idea about the minimized area for the output response variable. The general trends suggest that the optimal drag values lie within the optimal search space. The wall-heat flux plot suggests a saddle behavior. Similarly, the surface plot for the optimized design range of drag coefficient and average wall-heat flux with opposing jet is shown in Figure 13.
The optimum design is sorted out for minimum drag and average surface heat flux through a response optimizer based on the constructed design space for a double aerodisk on the spiked blunt body. Drag and heat flux responses are assigned equal significance to find optimal configurations. The composite desirability factors for cases with and without jets using double aerodisk are 0.85842 and 0.9323, respectively. These rest within a highly acceptable range, as shown in Figure 14. For optimal design without opposing jet, optimum spike length, the diameter of the first disk, and position of the second disk are found to be 104.5455 mm, 8.6869 mm, and 75%, respectively. Similarly, for optimum design with an opposing jet, spike length, the diameter of the first disk, and position of the second disk are found to be 136.3636 mm, 17.0909 mm, and 75%, respectively.
The optimal designs for single and double aerodisk generated through RSM require numerical verification. The verification process suggests that the drag coefficient and total-surface heat flux are closely related to statistical values. The numerically validated results and statistical data are shown in Table 9 and schematically shown in Figure 15.

3.3. Flow Physics of Optimized Geometries

The altering flow field in front of the blunt body for wave drag and heat reduction highly depends upon the pressure distribution and peak pressure. In Figure 16, it can be observed that the peak pressure is reduced for all cases relative to a simple blunt body. The use of opposing jets alone presents the least efficient technique. In contrast, double aerodisk with jet not only alleviates the peak pressure formed on the nose of the blunt body but significantly reduces the pressure distribution over the rest of the surface.
Adding aerodisks at optimum spike lengths deflects high-enthalpy flow apart from the blunt profile and contributes to drag and heat-flux reduction. For passive designs, in the case of a single aerodisk over the optimum spike length only one re-circulation region is formed in front of the main blunt body as shown in Figure 17. A total of two different re-circulation regions are created in the case of passive design for double aerodisk. Vortices are formed ahead of the main blunt body, and an intermediate aerodisk that creates extra suction force in the forward direction is observed. Due to the formation of extra space in front of the rear aerodisk suction, force is generated in the re-circulation region, so the rear aerodisk further contributes to pushing the bow shock wave away from the blunt body as shown in Figure 17b. With the addition of the re-circulation region over aerospike length, the fluid flow within re-circulation regions becomes relatively cooler. Despite this, a small vortex is formed behind each disk, but the sizes of these vortices are extremely small, and the overall effect of the aerodisks’ spike configuration is reduced drag and heat flux. The flow field in-between aerodisks bears akin to a flow field over the cavity. When the rear aerodisk is positioned at 25% of the total spike length, a single dominating vortex is seen between the frontal aerodisk and the main blunt body. As the rearward aerodisk moves in a forward direction, the area of the vertical flow increases and remains better lined-up longitudinally. The size of the vortex in front of the rearward aerodisk also increases along with its movement in the forward direction. This results in a greater suction force in the forward direction, leading to drag reduction in the blunt profile. The suction phenomenon is expanded for larger diameter disks, as the region of vertical flow ahead of the rearward aerodisk is strengthened with increasing disk diameter. When the rearward disk is moved to 75% of the total spike length, the single vortex in front of the main body fissures into two smaller vortices. The optimized passive design for multiple aerodisks on the spiked blunt body without the inclusion of an opposing jet can reduce the total drag up to 67% on a simple blunt body and the total-surface heat flux by 78%. In passive designs, the results of multiple disks are slightly better than those using a single aerodisk on a spiked blunt body. It gives more space to the re-circulation region located in front of the blunt body.
Optimizing the blunt body through passive flow control for single and multiple aerodisk leads to design optimization through hybrid flow control, in which the opposing jet is ejected at a constant pressure ratio of 0.8 from the nose of the aerodisk. In the comparison of baseline simple blunt body, by ejecting the opposing jet at a pressure ratio of 0.8 from the nose of the hemispherical blunt body without introducing aerodisk and aerospike to the system, the drag and total-surface heat flux over the body surface are reduced by approximately 46% and 45%, respectively. Only one re-circulation region is formed in front of the main blunt body due to the inclusion of an opposing jet.
The optimized hybrid design using a single aerodisk on a spiked blunt body is shown in Figure 18; giving an 80% reduction in the total drag and 95% in the total heat flux over the blunt-body surface. The creation of a separation bubble ahead of the blunt body and aerodisk due to the inclusion of an opposing jet pushes the high-enthalpy shock wave away from the blunt body with high capacity as compared to a single aerodisk without a jet. The phenomena drastically reduces the wave drag and heat flux compared to passive methods. Double aerodisks installed over the spiked blunt body, along with the inclusion of an opposing jet provide higher drag and heat reduction capability. However, they perform slightly better than the hybrid method using a single aerodisk. They approximately reduce the total drag by 86% and heat flux by 97% over the surface of blunt bodies. The double-aerodisk-spiked configuration provides more space for the re-circulation regions. A separation bubble is present in front of the main blunt body, in front of the intermediate aerodisk, and in front of the frontal aerodisk, as shown in Figure 18b.
After a detailed analysis of the passive and hybrid design optimization, it is clear that the multiple-disk aerospike configuration excels over the single-aerodisk configuration in terms of wave drag and heat reduction. Therefore, the notion details that the multiple-disk aerospikes are effective in drag and heat reduction by creating more space for re-circulation regions over the elongated-spiked location. Similarly, the use of an opposing jet further enhances the drag- and heat-reduction efficiency. As discussed, the overall reduction is plotted in Figure 19.

4. Conclusions

The current numerical efforts were aimed at understanding the flow field around a blunt body and ultimately introducing a DOE process via the Response Surface Method (RSM). In addition, better application of passive and hybrid flow control techniques to alter the flow field was sought for aerodynamic drag and heat reduction. After numerical validation of the flow field with experimental cases, a response surface was created through the DOE process in which single and multiple aerodisks were introduced on a spiked blunt body, both with and without the inclusion of an opposing jet at a constant pressure ratio of 0.8. Two-dimensional steady-state simulations were performed by altering the frontal aerodisk diameter, length of the elongated aerospike, and the rear aerodisk over the total length of the spike. From the analysis, it was found that multiple-aerodisk spike configurations were advantageous for reducing wave drag and heating at supersonic speeds compared to a single aerodisk configuration. Mainly through the inclusion of an opposing jet at PR=0.8 from the frontal aerodisk on the spiked blunt body, reductions in drag and heat flux of approximately 86% and 95% were achieved, respectively. In summary, multiple-aerodisk spikes are highly efficient for reducing wave drag and heat by creating extra space for re-circulation zones in the elongated-spiked region. In addition, the use of an opposing jet further enhances drag- and heat-reduction efficiency. Moreover, numerical validation of statistical results generated via the RSM approach clearly indicated the effectiveness of the parametric optimization technique experimental design, demonstrating utility for future optimization studies.

Author Contributions

Conceptualization, M.H. and A.M.; methodology, M.H. and A.M.; validation, M.H.; formal analysis, M.H.; writing—original draft preparation, M.H.; writing—review and editing, S.B.K.; supervision, A.M. All authors have read and agreed to the published version of the manuscript.

Funding

This research received no external funding.

Acknowledgments

As part of this study, the authors used computing resources and equipment provided by the National University of Sciences & Technology (NUST) School of Interdisciplinary Engineering and Sciences (SINES). The authors would like to express their gratitude to the institute for making it possible to carry out this study.

Conflicts of Interest

The authors declare no conflict of interest.

Abbreviations

The following abbreviations are used in this manuscript:
DOEDesign of Experiments
RSMResponse Surface Method
RANSReynolds-Averaged Navier–Stokes
PRPressure Ratio
CCDCentral Composite Design
CFDComputational Fluid Dynamics

References

  1. Tauber, M.E.; Menees, G.P.; Adelman, H.G. Aerothermodynamics of transatmospheric vehicles. J. Aircr. 1987, 24, 594–602. [Google Scholar] [CrossRef]
  2. Bibi, A.; Maqsood, A.; Sherbaz, S.; Dala, L. Drag Reduction of Supersonic Blunt Bodies Using Opposing Jet and Nozzle Geometric Variations. Aerosp. Sci. Technol. 2017, 69, 244–256. [Google Scholar] [CrossRef] [Green Version]
  3. Khan, S.; Maqsood, A.; Akhtar, S.; Xie, D.; Riaz, R. Causation of Supersonic Limit Cycle Oscillations in Atmospheric Entry Vehicles. J. Spacecr. Rocket. 2022, 59, 960–974. [Google Scholar] [CrossRef]
  4. Rashid, S.; Nawaz, F.; Maqsood, A.; Salamat, S.; Riaz, R. Review of wave drag reduction techniques: Advances in active, passive, and hybrid flow control. Proc. Inst. Mech. Eng. Part G J. Aerosp. Eng. 2022, 236, 2851–2884. [Google Scholar] [CrossRef]
  5. Rashid, S.; Nawaz, F.; Maqsood, A.; Riaz, R.; Salamat, S. Shock Reduction through Opposing Jets—Aerodynamic Performance and Flight Stability Perspectives. Appl. Sci. 2019, 10, 180. [Google Scholar] [CrossRef] [Green Version]
  6. Hayashi, K.; Aso, S.; Tani, Y. Experimental Study on Thermal Protection System by Opposing Jet in Supersonic Flow. J. Spacecr. Rocket. 2006, 43, 233–235. [Google Scholar] [CrossRef]
  7. Hayashi, K.; Aso, S.; Tani, Y. Numerical Study of Thermal Protection System by Opposing Jet. In Proceedings of the 43rd AIAA Aerospace Sciences Meeting and Exhibit, Reno, NV, USA, 10–13 January 2005. [Google Scholar] [CrossRef]
  8. Venukumar, B.; Gopalan, J.; Reddy, K.P. Counterflow drag reduction by supersonic jet for a blunt body in hypersonic flow. Phys. Fluids 2006, 18, 118104. [Google Scholar] [CrossRef]
  9. Rong, Y. Drag reduction research in supersonic flow with opposing jet. Acta Astronaut. 2013, 91, 1–7. [Google Scholar] [CrossRef]
  10. Shen, B.; Liu, W.; Yin, L. Drag and heat reduction efficiency research on opposing jet in supersonic flows. Aerosp. Sci. Technol. 2018, 77, 696–703. [Google Scholar] [CrossRef]
  11. Shen, B.; Liu, W. Thermal protection performance of opposing jet generating with solid fuel. Acta Astronaut. 2017, 144, 90–96. [Google Scholar] [CrossRef]
  12. Gerdroodbary, M.; Bishehsari, S.; Hosseinalipour, S.; Sedighi, K. Transient Analysis of counterflowing jet over highly blunt cone in hypersonic flow. Acta Astronaut. 2012, 73, 38–48. [Google Scholar] [CrossRef]
  13. Gerdroodbary, M.; Imani, M.; Ganji, D.D. Investigation of film cooling on nose cone by a forward facing array of micro-jets in Hypersonic flow. Int. Commun. Heat Mass Transf. 2015, 64, 42–49. [Google Scholar] [CrossRef]
  14. Li, S.b.; Wang, Z.g.; Huang, W.; Liu, J. Effect of the injector configuration for opposing jet on the drag and heat reduction. Aerosp. Sci. Technol. 2016, 51, 78–86. [Google Scholar] [CrossRef]
  15. Shen, B.; Yin, L.; Liu, H.; Liu, W. Thermal protection characteristics for a combinational opposing jet and platelet transpiration cooling nose-tip. Acta Astronaut. 2018, 155, 143–152. [Google Scholar] [CrossRef]
  16. Rashid, S.; Nawaz, F.; Maqsood, A.; Salamat, S.; Riaz, R.; Dala, L.; Riaz, A. Modeling and Analysis of Shock Reduction through Counterflow Plasma Jets. Math. Probl. Eng. 2021, 2021, 5592855. [Google Scholar] [CrossRef]
  17. Zhang, R.R.; Huang, W.; Yan, L.; Quan, L.; Li, S.B.; Moradi, R. Numerical investigation of drag and heat flux reduction mechanism of the pulsed counterflowing jet on a blunt body in supersonic flows. Acta Astronaut. 2018, 146, 123–133. [Google Scholar] [CrossRef]
  18. Zhang, R.R.; Huang, W.; Quan, L.; Yan, L.; Moradi, R. Drag and heat flux reduction induced by the pulsed counterflowing jet with different periods on a blunt body in supersonic flows. Int. J. Heat Mass Transf. 2018, 127, 503–512. [Google Scholar] [CrossRef]
  19. Li, S.b.; Wang, Z.g.; Huang, W.; Liu, J. Drag and Heat Reduction Performance for an Equal Polygon Opposing Jet. J. Aerosp. Eng. 2016, 30, 04016065. [Google Scholar] [CrossRef]
  20. Li, S.b.; Wang, Z.g.; Huang, W.; Yan, L. Analysis of Flowfield Characteristics for Equal Polygon Opposing Jet on different Freeflow Conditions. Acta Astronaut. 2017, 133, 50–62. [Google Scholar] [CrossRef]
  21. Kral, L. Active Flow Control Technology ASME Fluids Engineering Division Technical Brief; Washington University in St. Louis: St. Louis, MO, USA, 1998. [Google Scholar]
  22. Sebastian, J.; Suryan, A.; Kim, H. Numerical Analysis of Hypersonic Flow Past Blunt Bodies with Aerospikes. J. Spacecr. Rocket. 2016, 53, 669–677. [Google Scholar] [CrossRef]
  23. Alexander, S. Results of Tests to Determine the Effect of a Conical Windshield on the Drag of a Bluff Body at Supersonic Speeds; National Aeronautics and Space Administration Hampton Va Langley Research Center: Hampton, VA, USA, 1947.
  24. Muthu, R.; Lakshmi, S.; Babu, S. Aerothermodynamic design and performance analysis of modified nose cones for space reentry vehicles. Int. J. Ambient Energy 2022, 43, 3282–3293. [Google Scholar] [CrossRef]
  25. Ahmed, M.; Qin, N. Recent advances in the aerothermodynamics of spiked hypersonic vehicles. Prog. Aerosp. Sci. 2011, 47, 425–449. [Google Scholar] [CrossRef]
  26. Huang, W.; Zhao, Z.T.; Yan, L.; Zhou, Y.; Zhang, R.R. Parametric study on the drag and heat flux reduction mechanism of forward-facing cavity on a blunt body in supersonic flows. Aerosp. Sci. Technol. 2017, 71, 619–626. [Google Scholar] [CrossRef]
  27. Badiger, S.; Saravanan, S. Heat Flux Characteristics Within and Outside a Forward Facing Cavity in a Hypersonic Flow. Exp. Therm. Fluid Sci. 2018, 97, 59–69. [Google Scholar] [CrossRef]
  28. Huang, W.; Yan, L.; Liu, J.; Jin, L.; Tan, J.G. Drag and heat reduction mechanism in the combinational opposing jet and acoustic cavity concept for hypersonic vehicles. Aerosp. Sci. Technol. 2015, 42, 407–414. [Google Scholar] [CrossRef]
  29. Huang, W.; Jiang, Y.P.; Yan, L.; Liu, J. Heat flux reduction mechanism induced by a combinational opposing jet and cavity concept in supersonic flows. Acta Astronaut. 2016, 121, 164–171. [Google Scholar] [CrossRef]
  30. Sun, X.; Guo, Z.Y.; Huang, W.; Li, S.B.; Yan, L. Drag and heat reduction mechanism induced by a combinational novel cavity and counterflowing jet concept in hypersonic flows. Acta Astronaut. 2016, 126, 109–119. [Google Scholar] [CrossRef]
  31. Huang, W.; Chen, Z.; Yan, L.; Yan, B.B.; Du, Z.B. Drag and heat flux reduction mechanism induced by the spike and its combinations in supersonic flows: A review. Prog. Aerosp. Sci. 2018, 105, 31–39. [Google Scholar] [CrossRef]
  32. Eghlima, Z.; Mansour, K. Drag reduction for the combination of spike and counterflow jet on blunt body at high Mach number flow. Acta Astronaut. 2017, 133, 103–110. [Google Scholar] [CrossRef]
  33. Eghlima, Z.; Mansour, K.; Fardipour, K. Heat transfer reduction using combination of spike and counterflow jet on blunt body at high Mach number flow. Acta Astronaut. 2017, 143, 92–104. [Google Scholar] [CrossRef]
  34. Jiang, Z.; Liu, Y.; Han, G.; Zhao, W. Experimental demonstration of a new concept of drag reduction and thermal protection for hypersonic vehicles. Acta Mech. Sin. 2009, 25, 417–419. [Google Scholar] [CrossRef]
  35. Montgomery, D.C. Design and Analysis of Experiments; John Wiley & Sons Inc.: York, NY, USA, 2001; pp. 200–201. [Google Scholar]
  36. Box, G.E.; Hunter, W.H.; Hunter, S. Statistics for Experimenters; John Wiley and Sons: New York, NY, USA, 1978; Volume 664. [Google Scholar]
Figure 1. Types of aerospike (pointed and hemispherical) along with schematic flow patterns.
Aerospace 09 00800 g001
Figure 2. (a) Axis-symmetrical computational grid. (b) Simple blunt body. (c) Blunt body with opposing jet.
Aerospace 09 00800 g002
Figure 3. Grid independence study results.
Aerospace 09 00800 g003
Figure 4. (a) Spalart Allmaras model. (b) K− ω SST model comparison of flow field contours.
Aerospace 09 00800 g004
Figure 5. (a) Comparison of numerical and experimental shock stand-off distance (b) Pressure distribution for the no jet case.
Aerospace 09 00800 g005
Figure 6. (a) Shock wave stand-off location. (b) Pressure distribution with opposing jet.
Aerospace 09 00800 g006
Figure 7. Stanton number distributions (To = 397 K) (a) at PR = 0, (b) PR = 0.8.
Aerospace 09 00800 g007
Figure 8. Schematic view for (a) Single-disk aerospike (b) Double-disk aerospike.
Aerospace 09 00800 g008
Figure 9. (a) Contour plot for drag coefficient (b) Wall-heat flux for single aerodisk without jet.
Aerospace 09 00800 g009
Figure 10. (a) Surface plot of drag coefficient (b) Average heat flux for single aerodisk with opposing jet.
Aerospace 09 00800 g010
Figure 11. Optimized design for single-aerodisk-spiked blunt body (a) without opposing jet (b) with opposing jet.
Aerospace 09 00800 g011
Figure 12. (a) Contour plot for drag coefficient (b) Wall-heat flux for double aerodisk without jet.
Aerospace 09 00800 g012
Figure 13. (a) Surface plot of drag coefficient (b) Average heat flux for double aerodisk with opposing jet.
Aerospace 09 00800 g013
Figure 14. Optimized design for double-aerodisk-spiked blunt body (a) without opposing jet (b) with opposing jet.
Aerospace 09 00800 g014
Figure 15. Schematic of optimized blunt bodies.
Aerospace 09 00800 g015
Figure 16. Comparison of peak reattachment pressure.
Aerospace 09 00800 g016
Figure 17. Flow field around optimized passive designs using (a) Single aerodisk (b) Double aerodisk.
Aerospace 09 00800 g017
Figure 18. Flow field around the optimized hybrid design using (a) Single aerodisk (b) double-aerodisk.
Aerospace 09 00800 g018
Figure 19. Comparison of (a) total drag reduction (b) heat flux reduction for optimized designs.
Aerospace 09 00800 g019
Table 1. Boundary conditions used for free-stream and opposing jet.
GasAir
Free-Stream conditionsMach Number3.98
Stagnation pressure (MPa)1.37
Temperature (K)397
GasAir
Opposing JetMach Number1
Stagnation pressure (MPa)0.4, 0.6, 0.8
Temperature (K)300
WallTemperature (K)295
Table 2. Input variables for aerospike with a single aerodisk.
No.Control VariablesMinimum ValueMaximum Value
1Spike Length—SL (mm)25200
2Diameter of Disk—DoD (mm)420
Table 3. Input variables for aerospike with double aerodisk.
No.Control VariablesMinimum ValueMaximum Value
1Spike Length—SL (mm)25200
2Diameter of Disk1—R1 (mm)210
3Position of Disk 2—P2 (% of spike length—SL)2575
Table 4. Response surface design for single-aerodisk-spiked blunt body.
Std OrderRun OrderPt TypeBlocksSpike LengthDiameter of Disk
111150.6286.3431
2211174.3726.3431
331150.62817.6569
4411174.37217.6569
55−112512.00
66−1120012.00
77−11112.54.00
88−11112.520.00
9901112.512.00
101001112.512.00
111101112.512.00
121201112.512.00
131301112.512.00
Table 5. Response surface design for double-aerodisk-spiked blunt body (passive).
Std OrderRun OrderPt TypeBlocksSpike LengthDiameter of Disk 1Position of Disk 2 (%SL)
111160.4727.24335.135
2211164.5277.24335.135
331160.47216.75635.135
4411164.52716.75635.135
551160.4727.24364.865
6611164.5277.24364.865
771160.47216.75664.865
8811164.52716.75664.865
99−1125.012.050.0
1010−11200.012.050.0
1111−11112.54.050.0
1212−11112.520.050.0
1313−11112.512.025.0
1414−11112.512.075.0
151501112.512.050.0
161601112.512.050.0
171701112.512.050.0
181801112.512.050.0
191901112.512.050.0
202001112.512.050.0
Table 6. Numerical simulation results for coefficient of drag and heat flux for single aerodisk with and without jet.
No.Spike Length (mm)Diameter of Disk (mm)Single Aerodisk without JetSingle Aerodisk without Jet
C d ||St|| 2 C d ||St|| 2
1174.3726.3430.2211820.00001580.3528870.0000390
2112.512.00.2055850.00001850.3419960.0000472
3112.520.00.2187810.00021600.4375310.0000010
4112.512.00.2055850.00001850.3419960.0000472
525.012.00.3787860.00010070.3858950.000221
6112.54.00.3307060.00003810.3624840.000039
7112.512.00.2055850.00001850.3419960.0000472
8174.37217.6560.2128180.00001090.3911280.0000538
950.62817.6560.165220.00001870.3461580.0001852
10200.012.00.2112660.00001200.3483180.0000347
11112.512.00.2055850.00001850.3419960.0000472
1250.6286.3430.3673350.00007750.3337420.0002446
13112.512.00.2055850.00001850.3419960.0000472
Table 7. Numerical and statistical verification of the single-aerodisk predicted optimized design.
Design ParametersStatistical and Numerical Comparison of Output Responses
Optimal ConfigurationSpike Length (mm)Diameter of Aerodisk (mm)Drag Coefficient (Cd)Average Stanton No. (‖St2)
DOENumerical VerificationDOENumerical Verification
Without opposing jet122.9899.3330.33750.32140.0000410.000059
With opposing jet93.93919.1920.18260.16190.00010.000128
Table 8. Numerical simulation results for coefficient of drag and heat flux for double aerodisk with and without jet.
No.SL (mm)DoD1 (mm)PD2%Double Aerodisk without JetDouble Aerodisk without Jet
C d ||St|| 2 C d ||St|| 2
160.4727.2430.3510.3621970.0017670.2098490.000594
2164.5287.2430.3510.3183960.0014340.1784130.000454
360.47216.7560.3510.3241830.001660.1454240.000258
4164.52816.7560.3510.3327410.0100240.1688030.000424
560.4727.2430.6480.2957790.0017640.1894710.000638
6164.5287.2430.6480.321410.001480.1735680.000504
760.47216.7560.6480.3081450.0017970.1453030.000391
8164.52816.7560.6480.3625460.0014980.1225870.0000336
925.012.00.50.3961770.001960.2426720.000434
10200.012.00.50.3122210.0012740.1760320.000461
11112.54.00.50.2964870.0016430.192360.000611
12112.520.00.50.3512790.0015250.1516010.000378
13112.512.00.250.3129790.0015280.1855650.000372
14112.512.00.750.260520.0015820.1602250.000523
15112.512.00.50.2815690.0016450.1569580.000463
16112.512.00.50.2815690.0016450.1569580.000463
17112.512.00.50.2815690.0016450.1569580.000463
18112.512.00.50.2815690.0016450.1569580.000463
19112.512.00.50.2815690.0016450.1569580.000463
20112.512.00.50.2815690.0016450.1569580.000463
Table 9. Numerical verification of double-aerodisk-predicted optimized design.
Design ParametersStatistical and Numerical
Comparison of Output Responses
Optimal ConfigurationSpike LengthDiameter ofPosition ofDrag CoefficientHeat Flux (‖St 2 )
Aerodisk 1Aerodisk 2StatisticalNumericalStatisticalNumerical
(mm)(mm)(mm)ResultsResultsResultsResults
Without opposing jet104.5458.68778.4090.26130.26300.000040.0000443
With opposing jet136.363617.0909102.27270.13070.10590.0000100.0000095
Publisher’s Note: MDPI stays neutral with regard to jurisdictional claims in published maps and institutional affiliations.

