Article

Sensor for Determining Single Droplet Acidities in the Venusian Atmosphere

1
Tartu Observatory, University of Tartu, 1 Observatooriumi, 61602 Tõravere, Estonia
2
Tallinn Secondary School of Science, 6 Estonia Puiestee, 10148 Tallinn, Estonia
3
Tartu Tamme Gümnaasium, 9 Nooruse, 50411 Tartu, Estonia
*
Author to whom correspondence should be addressed.
Aerospace 2022, 9(10), 560; https://doi.org/10.3390/aerospace9100560
Submission received: 31 August 2022 / Revised: 22 September 2022 / Accepted: 23 September 2022 / Published: 28 September 2022

Abstract

:
The cloud layers of Venus are known to have pressures and temperatures comparable to those on Earth, but, at the same time, many details about the environment inside them are unknown. The early consensus was that Venusian clouds are composed of droplets of near concentrated sulfuric acid with very limited water availability; newer models, however, suggest a pH range between −1 and 1, and these imply some form of a neutralizing agent and potentially complex chemical cycles. It is also possible that different populations of cloud particles have different acidities. To answer these questions, we propose an in situ acidity sensor that can statistically determine the acidities of individual cloud droplets from concentrated sulfuric acid (18 M) to deionized water, based on the fluorescence of a pigment that is immobilized in a film and read out using a set of excited LEDs and a camera. Here, we present the preliminary research and prototyping results and suggest a possible design for this sensor.

1. Introduction

Venus, with its surface temperature of 735 K and clouds composed primarily of sulfuric acid droplets has not been the most likely candidate for habitability research. While the surface of Venus may once have been habitable and have contained water before an amplified greenhouse effect forced temperatures to rise to uninhabitable levels [1], it is now inhospitable to life. While currently no life as we know it can exist on the surface of the planet, the temperature and pressure range across the clouds contains regions well within the living conditions of some terrestrial organisms, with temperatures ranging from 100 °C (373.15 K) at 47 km, to −20 °C (253 K) at 62 km [2,3].
The biggest arguments against the habitability of the clouds of Venus are the high acidity of the cloud droplets and the lack of available water [4,5]. However, the atmosphere of Venus displays a number of abnormalities and different models have been proposed for the composition of the atmosphere to explain the anomalous gas concentrations found. Earlier consensus models assumed droplets of near-concentrated sulfuric acid, but some more recent models imply neutralization of sulfuric acid droplets and, consequently, a rise in pH to a potentially habitable level in some droplets, with predicted pH values between −1 and 1 [6]. For comparison, on Earth microorganisms have been found to live and thrive in pH levels as low as close to pH 0 [7]. NH 3 has been suggested as a candidate for the neutralizing agent [8].
In the 1960s and 1970s, Venus was the destination of the first successful interplanetary voyage and landing. Subsequently, final in situ measurements on Venus were conducted in the 1980s. Now there are plans for multiple missions to Venus, including the Venus Life Finder Mission series [9].
The Venus Life Finder missions include three missions. First, in 2023, a mission led by Rocket Lab will fly through the atmosphere of Venus and collect information on cloud droplet shape and composition [10]. For 2026, a mission is planned to deploy a balloon- or parachute-equipped probe into the Venusian cloud layer and to conduct more intricate measurements [11,12]. One of the instruments intended to be carried on this probe is an acidity sensor for determining the acidity distribution of the Venusian cloud droplets using a fluorescent film that reacts to acidity. This film would be observed using a camera and excited using light sources. This would provide answers to questions about how acidic Venusian clouds are, and if life as we know it could survive there.
Nowadays, fluorescence spectroscopy is widely used for acidity measurements due to its non-invasiveness, high selectivity and sensitivity, short response time, and relatively easy procedure, allowing parallel monitoring of multiple samples. These methods are based on the design of a fluorophore, the emission response of which depends on the association or dissociation of protons [13,14,15,16]. The majority of the methods developed thus far, however, are only applicable in a very narrow, near-neutral pH region [13,14,15,16,17]. Sulfuric acid is also a strong acid and its concentrated solutions are highly oxidative. Therefore, a key element for developing the pH sensor for Venusian atmospheric conditions is finding a suitable pigment molecule (or a mixture of pigment molecules), which would be stable enough not to be degraded and that would give an easily measurable emission response at a very low pH (i.e., very high sulfuric acid concentration). In addition to its stability, it must be possible to immobilize the pigment on the surface of glass (e.g., in the form of a thin film).
One of the most frequently used fluorescent pigments is fluorescein, because of its high fluorescence intensity [17]. It was previously known from the literature that this pigment can retain its fluorescent properties in 10 M sulfuric acid [18,19]. The mechanism behind fluorescein’s pH dependence is represented in Figure 1. In alkaline solutions, the pigment occurs in its dianionic form, but, when shifting towards acidic conditions, first the monoanionic and later the neutral form become dominant. Under strongly acidic conditions, fluorescein occurs in its cationic form. Since the emission responses of these forms differ from each other, fluorescein is a good candidate as a fluorescence dye for the application under investigation [17,19].
In this paper, we propose an acidity sensor design and describe experiments conducted to identify a suitable acidity-sensitive pigment and for developing a method of embedding it in a matrix. Although the chemistry of the Venusian cloud droplets is expected to be more complex [6], we use sulfuric acid solutions in water as simplified representations of Venusian cloud droplets.

2. Materials and Methods
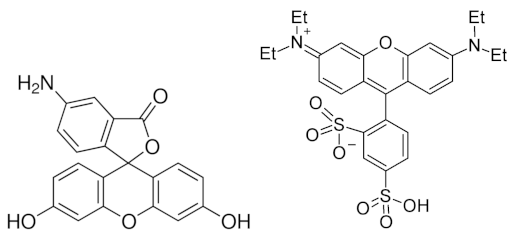
2.1. Pigments

In the original experiments, we used pure fluorescein, fluoresceinamine and sulforhodamine B samples obtained from various laboratories in the Institute of Chemistry, University of Tartu, but for film production we used uranin (a sodium salt of fluorescein, obtained from Hansepro GmbH, Bremen, Germany), because it is more easily soluble and, thus, easier to use in experiments.

2.2. Film Preparation

Sensor plates were made by depositing a sensor film on glass microscope slides. Different matrices and deposition methods were used for this. See more details in the results section.
For PVA, we ordered solid pellets from Alquera Ciencia SL (Cádiz, Spain). For coating, we used various bar coaters and applicators (Ascott Analytical Equipment Ltd, Tamworth, UK). All sulfuric acid solutions were diluted from puriss p.a. grade concentrated sulfuric acid (Honeywell Specialty Chemicals Seelze GmbH, Seelze, Germany). Deionized water that was used for solutions was obtained from the Institute of Chemistry, University of Tartu. Reagent grade boric acid for film stabilization was obtained from Nord Labochim (Tallinn, Estonia). Nafion was obtained as LQ-1115–1100 EW at 15% weight −25 mL solution from Ion Power GmbH (München, Germany).
Initially, PVA was dissolved in water over 2–3 h on a hotplate at 90 °C. Later solutions were prepared without initial heating, but by allowing the mixture to dissolve slowly at low temperature (2 °C), or at room temperature, for a day to facilitate easier mixing and avoid clumping, followed by brief heating to approximately 60 degrees Celsius. More details about the sensor film manufacturing process are provided in the results section.

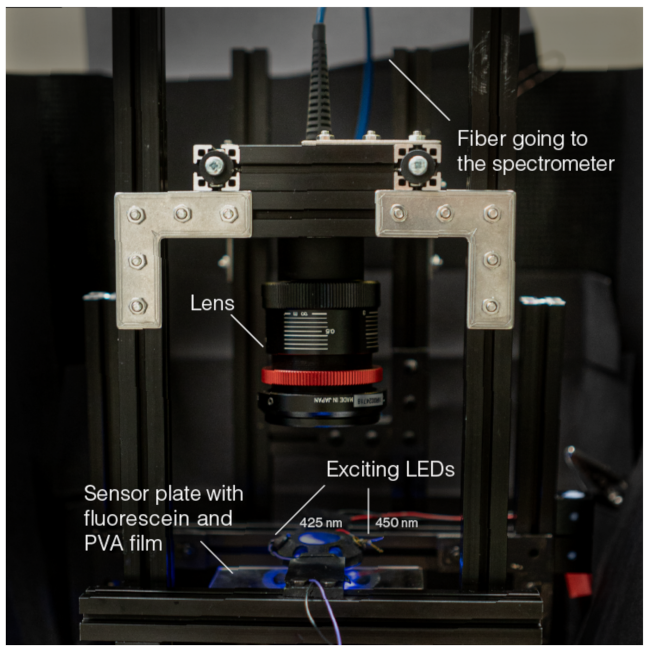
2.3. Spectral Measurements

Fluorescence emission and fluorescence excitation spectra of pigment solutions were measured using a Synergy NEO (Biotek Instruments Inc., Winooski, VT, USA) multimode plate reader using 2 nm steps. Excitation and emission monochromators with a 16 nm spectral bandwidth were used and a xenon flash lamp was used as a light source. Measurements were carried out using 96-well half-area, flat-bottom polystyrene NBS microtiter plates (product no. 3686) (Corning, Glendale, CA, USA) rated as resistant to concentrated sulfuric acid, to which the liquid samples were placed. The plates were covered with a plastic lid, and the plate-lid system was closed using parafilm to avoid evaporation or absorption of water and damage to the equipment during the experiment.
To measure droplet emission spectra on the sensor films, we built a custom setup (see Figure 2) based on a C-mount lens (LM35HC-V 1″ Ruggedized 35 mm 5MP C-Mount Lens from Kowa Optimed Deutschland GmbH, Düsseldorf, Germany), lens holders (Edmund Optics, Barrington, NJ, UK), optical fiber and an LR2 200–1000 nm fiber spectrometer (Lasertack GmbH, Kassel, Germany). The system contained a 3D-printed slide holder that had six slots for inserting LEDs. For excitation experiments, we used L1C1-VLT1000000000 (Lumileds Holding B.V., San Jose, CA, USA) for exciting near 425 nm, and MTE4600N (Marktech Optoelectronics, Latham, NY, USA) for exciting near 450 nm. The LEDs were selected after an exhaustive search of all easily commercially available LEDs in the wavelength range of interest and by measuring them with the fiber spectrometer. The system was held together using a Makerbeam XL kit (MakerBeam B.V., Utrecht, The Netherlands).

2.4. Image Capture

To capture images and videos of the films, we used an AmScope SM-4TZ-144A 3.5X–90X Trinocular Stereo Microscope with 4-Zone 144-LED Ring Light (AmScope, Irvine, CA, USA) onto which we mounted either a Sony α 7S II or a webcam. A high-pass optical filter was used in some experiments (Edmund Optics 14489 Filter LP Col SCHOTT GG475 50sq x3mm, from Edmund Optics, York, UK).

3. Results and Discussion

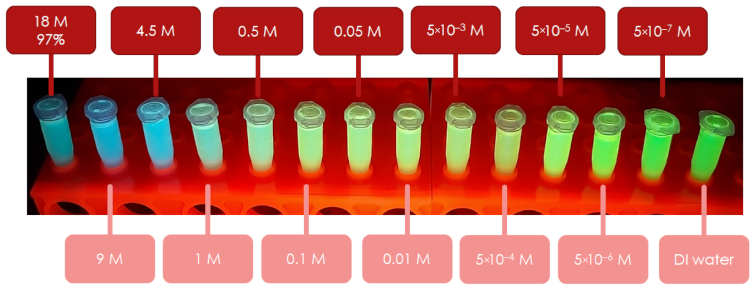
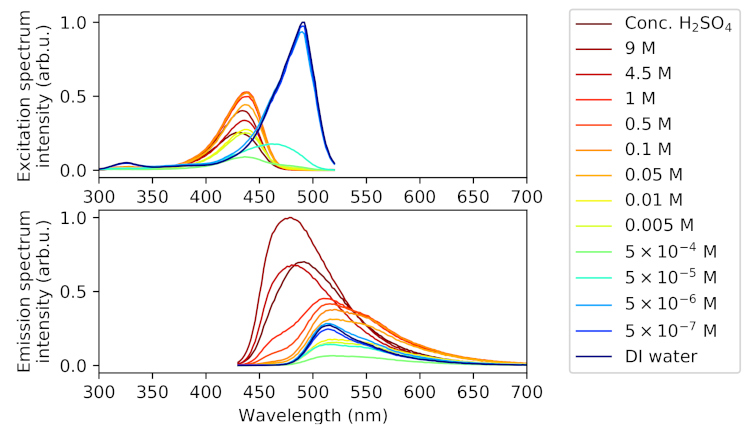
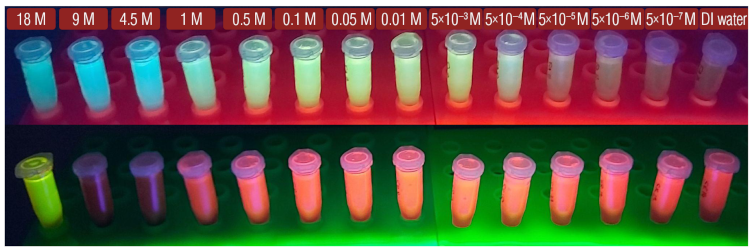
3.1. Measuring Candidate Pigment Characteristics in Aqueous Solutions

Our first task was to identify a pigment that we could use for the research. For this, we started with fluorescein due to earlier literature reports [19] that showed its usability in high-acidity conditions. To evaluate the possibility of using fluorescein, its fluorescence spectra (excitation and emission) in various H 2 SO 4 solutions were recorded. In these experiments, the concentration of acid varied, as shown in Figure 3. The emission and excitation spectra are shown in Figure 4. The concentration of fluorescein during these measurements was 10 μ M. An unexpected peak shift was observed at 9 M concentration during the measurements and currently there are no hypotheses to explain this.
As the sensor characterizes pH by measuring the excitation response of the sensor plate when illuminated with light sources of various wavelengths, we measured the excitation spectra of the solutions above and looked for two excitation wavelengths which could be used for measuring relative fluorescence and to produce a fault-tolerant signal.
It can be seen from the excitation spectrum (Figure 5) that the acidification of the solution led to a shift in the peak towards shorter wavelengths. The inset shows the relative emission intensity between 425 and 450 nm ( I 425 / I 450 ), which shows monotonic behavior based on sulfuric acid concentration. The pH range corresponding to the hypothesis about the partially neutralized droplets (pH in the range between −1 and 1) lies on the plateau at around 1.1 and concentrated sulfuric acid is expected to give a signal around 1.6, allowing for clear distinction between the two signals. In the experiment, we used concentrated sulfuric acid as the most acidic case, although the non-neutralized droplet case is expected to be around 80%. However, as can be seen from the Figure 5 inset, the behavior of slightly diluted solutions is expected to be similar to that of the concentrated case.
In addition to fluorescein, fluoresceinamine and sulforhodamine B (Figure 6 and Figure 7) were analyzed as potential fluorophores. First, it was shown that both molecules were stable under experimental conditions (high sulfuric acid concentration) and that their fluorescence properties depended on sulfuric acid concentration. The corresponding excitation spectra are shown in Figure 8.
Fluoresceinamine and sulforhodamine B showed excitation spectrum acidity dependence, but the spectra mainly varied only in strength, not shape as occurred for fluorescein. This means that these pigments were less useful for identifying acidities based on excitation at two different wavelengths and, thus, were not studied further.

3.2. Film Formulation

To be able to use the pigment for droplet acidity detection, the pigment must be immobilized in a matrix. During the project, we tested PVA films (with and without cross-linking with boric acid) and Nafion. An important aspect was determining a coating procedure which could be used to produce repeatable and consistent films. Examples of various films can be seen on Figure 9.
Polyvinyl alcohol (PVA) is a water-soluble polymer with the formula of [CH 2 CH(OH)] n . PVA is produced via hydrolysis of polyvinyl acetate (PVAc). The structural properties of PVOH depend on the molecular mass of the polymer and the degree of hydrolysis (i.e., the vinyl alcohol percentage in the polymer) [20,21].
Boric acid was tested as a cross-inking agent to stabilize the matrix. Addition of boric acid has been shown in the literature to increase the stability and strength of the film [20,22]. Nevertheless, our experiments showed that boric acid addition was not required to produce stable films and that boric acid addition made the film too viscous to produce thin films using a bar coater.
We also tested Nafion as a matrix, obtained as LIQUION™, which is a commercially available Nafion-containing solution. Nafion™ is a sulfonated-tetrafluoroethylene-based fluoropolymer-copolymer. LIQUION™ solution with 15% wt Nafion™ resins in a mixture of water and alcohols was tested to produce the matrix [23].
To form the various matrices into sensing films, we tested several options, including silicone-based molds and gravity-based coating, but these were found to be unreliable. The most reliable method found was bar-coating. The most extensive testing of film-forming methods was undertaken with pure PVA films (i.e., films containing only PVA and the pigment).
Both 20 and 75 μ m bar coaters were used to spread PVA and fluorescein mixture on the slides. First, 1% to 18% PVA solutions were tested. PVA solution concentrations of 6–10% behaved the best; more concentrated solutions dried too fast and were difficult to handle, less concentrated solutions were not sufficiently viscous to spread evenly. Fluorescein sodium salt (uranin) was used that was more soluble and enabled more fluorescein to be used, even with a thin coat. The bar coater method produced slides with a mostly even coating and, due to the high concentration of fluorescein, these slides did not emit fluorescence when dry. Subsequently, a 12 μ m spiral bar coater was used with 7% PVA.
The thinnest films that could be produced with these methods were below 20 or even 12 μ m thick before drying (depending on the bar-coater used) and, considering the concentration of PVA in the solution, the thickness of dried films was expected to be of an order of magnitude of 1 μ m. This means that the thickness of the films was of the same order of magnitude as the diameter of the droplets of interest in the clouds of Venus, allowing a single droplet to saturate the area of the film it impacted.
Dust particles on the sensing films was still an issue that needed to be resolved. When applying the film onto the slides, later during the drying process, and after drying, small dust particles land on the slides even when using a fume hood. Dried slides will catch dust and cannot be wiped clean. Therefore, care needs to be taken to remove sources of dust. A method such as using a bunsen burner for generating updraft and an enclosing clean box for drying the films is a possible next step to reduce the amount of dust particles ending up on and in the film.
Another matrix that was tested was Nafion™, because this polymer is used to produce semi-permeable membranes for carrying protons and is highly tolerant of sulfuric acid. However, these films tended to crack on the glass slides and would be very difficult to manufacture and maintain repeatably. In our test conditions, the films created with Nafion would not adsorb enough deionized water or sulfuric acid aqueous solution to work as a pH indicator. Nafion membranes are sometimes also pretreated, as in the case of semi-permeable membranes, but this pretreatment was not deemed feasible in the current use case.

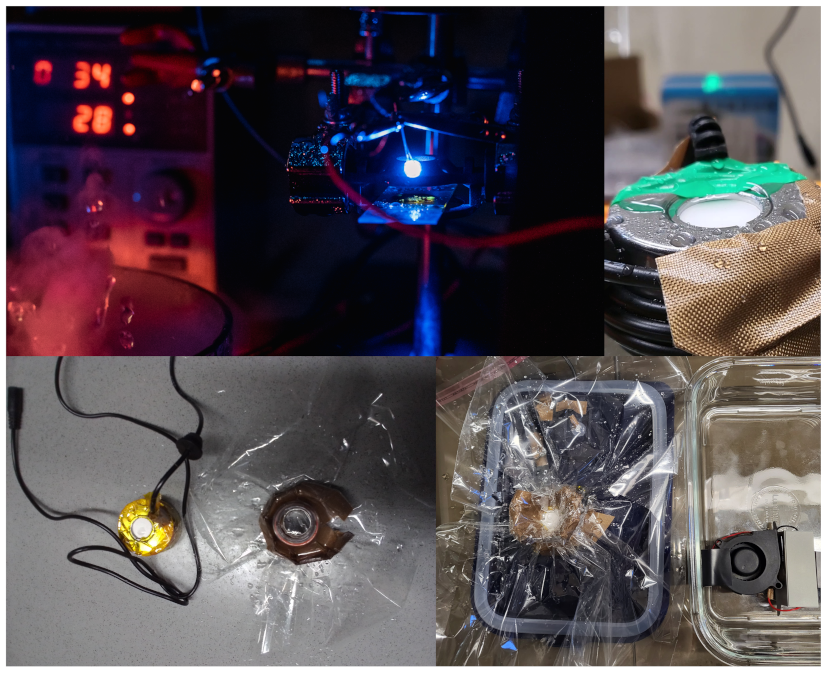
3.2.1. Mist Generation Using an Ultrasonic Atomizer

In early tests, a spray atomizer was used to create droplets from deionized water and various sulfuric acid concentrations. Spray atomiser was suitable for the early tests, but it produced large droplets, was difficult to automate, and, therefore, was unsuitable for sulfuric acid cloud simulations in a closed chamber.
With deionized water and varying concentrations of sulfuric acid, an ultrasonic atomizer (also called an ultrasonic nebulizer) was utilized to simulate cloud particles in the laboratory (see Figure 10). The experiments were performed in ambient conditions. Ultrasonic atomizers sold for use with water are not acid-resistant; therefore, it was necessary to create an acid-resistant barrier and to test whether an ultrasonic atomizer can be used to create sulfuric acid droplets. Thin polypropylene (PP) film (and also polyimide tape with silicone adhesive) successfully acted as a barrier and allowed us to generate sulfuric acid mist. The atomizer created droplets of various sizes, the smallest that were measurable with our setup were approximately 10 μ m in size. Larger droplets can be prevented from reaching test slides using splash guards and placing the atomizer further away from the slide. Alternative ways of generating smaller droplets will be studied in the future.
To visually inspect the effects of droplets, we viewed the film under exciting illumination with a trinocular microscope. This also allowed us to take photographs of acid droplets on the film. We observed that the droplet acidity clearly affected the observed emission color (see Figure 11), which was expected based on previous measurements. The optical signal produced by a droplet deposited on the film did not visibly change with the size of the individual droplets, but it was observed that the signal from very small droplets quickly faded during the experiment (it is assumed that the droplets were absorbed into the PVA matrix and diluted to a level where they did not have an effect on the emission). An example of droplets of two different acidities is shown on Figure 12. To measure the droplet sizes, we used a microscope slide with a graduated pattern (Figure 12).

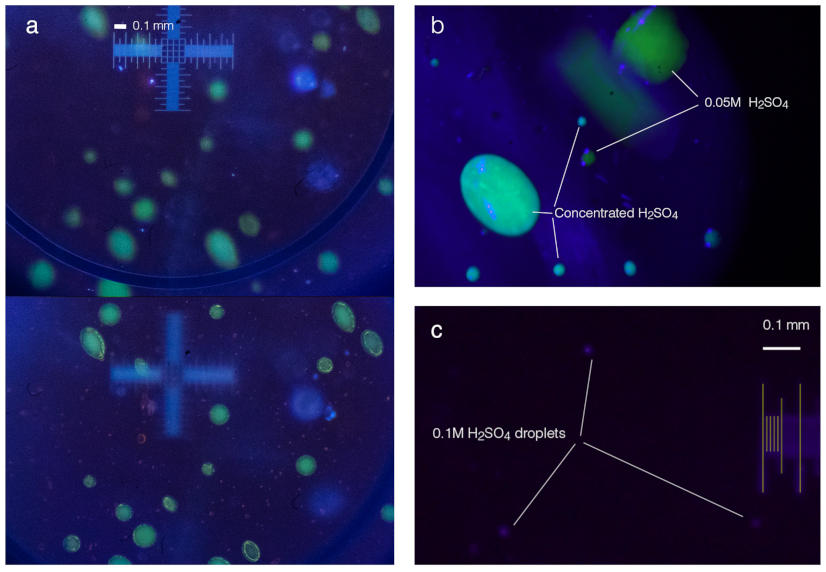
3.2.2. Spectral Analysis of Droplet-Film Interaction

To quantify the spectra of the droplets on the film, we used the setup shown on Figure 2. We placed droplets of various acidities on a sensing film, illuminated it with two LEDs, and observed the spectra and intensities of the spectra.
The measurements (see Figure 13) demonstrated that the emission spectrum of droplets on a film behaved in a similar fashion compared to the solution experiments and that there were differences between the spectra obtained using two excitation wavelengths: the emission produced by 425 nm excitation became stronger in relation to the signal obtained by 450 nm as the acidity increased and the shapes of the spectra also differed.
We also attempted to use the same setup to measure the relative emission intensity between 425 and 450 nm ( I 425 / I 450 as described above), see Figure 2. However, our setup was not stable enough to produce a repeatable signal and, thus, the acidity signal was hidden within the noise caused by imperfections in the setup. This remains to be improved in the future. For example, for lower concentrations, the signal faded quickly, which produced extreme noise in the measurement process. In follow-up activities, we are planning to produce a setup that would be able to resolve this fading in time. In addition, this fading is not expected to be a problem for measurements in the Venusian atmosphere, because we anticipate gathering images at around six frames per second, and fading happens over several seconds.

4. Proposed Device Design

The proposed measurement device is a camera system that monitors a sensing plate with a camera. Two different designs are currently under study: a simpler system using a camera and a macro-lens to read out the plate, and a more complex-to-produce system that would aim to conduct the emitted light straight to the sensor without a lens assembly.
For both designs, the sensor film must be protected during the transfer to Venus and would be exposed only during the measurement period. The droplets hitting the sensor film would chemically modify the point of impact, so the system can only reliably measure non-overlapping droplets. When the sensor plate has been hit with enough droplets, the whole sensor becomes unusable and would be powered off.
The exact usability time and number of particles that a single sensor can detect is still being investigated.
Both designs would capture images over time with the two exciting LEDs. It is expected that the data rate in the mission will be low, so the images cannot be sent back to the Earth for processing, but will need to be characterized on-site. This means that either the instrument or the probe itself would have to contain sufficient computational capacity to process the images in real time. The exact imaging algorithm is yet to be developed but, in general, the algorithm is expected to detect an increase in emitted light intensity on a spot on the sensor film—then the area of this change can be measured and the change can be characterized over the two excitations (425 and 450 nm). This information would then be fed into a calibration model that would calculate droplet parameters (i.e., size and acidity). The droplet parameters can then be saved for transmission. The temperature of the film also has to be logged (temperature dependence is an aspect of the sensor films yet to be characterized, but it is expected to affect the signal). The total data volume for this approach is expected to be a few tens of kB, before the sensor starts to saturate. Using image processing, it is possible to process the data into histograms already onboard the probe (for example a low bin count 2D-histogram of acidities of the droplets and areas of the fluorescing spots generated on droplet impact), making it possible to conduct the experiment with less than 1 kB of data.
The high-speed data processing will most likely also require an FPGA to be possible in a space environment, but, currently, we are unable to estimate the processing resources needed.

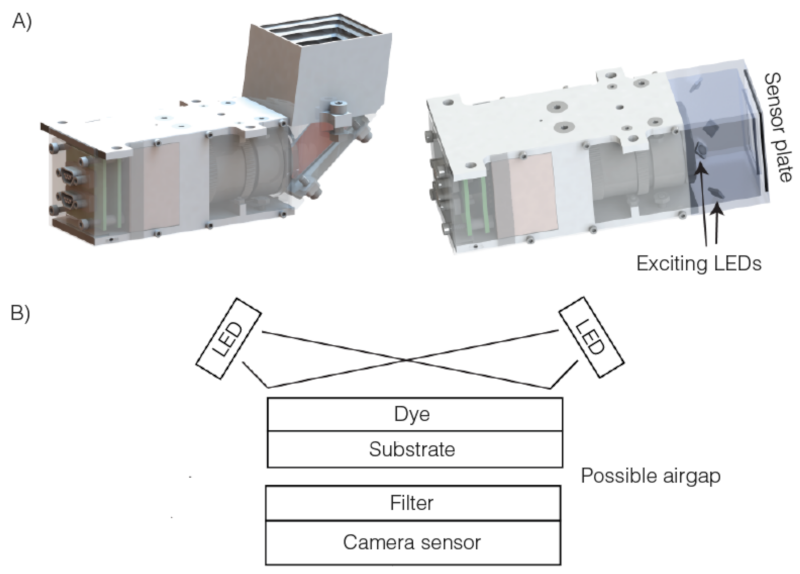
4.1. Design Based on Modification of OPIC

The first design is based on the OPIC instrument [24], currently being developed for the Comet Interceptor ESA F-class mission. The design is shown in Figure 14, part A. The original OPIC instrument contains a camera head with internal signal processing capabilities, a lens assembly and a periscope. For use as an acidity sensor, the periscope component can be replaced with a module that holds the exciting LEDs, an optical filter, and a plate covered with the sensor film. The film part would be exposed to the Venusian clouds and it would be both observed and illuminated through the glass plate. The camera head would be operated around its maximum frequency (around 6 Hz) and, for each frame, either a 425 nm LED array or a 450 nm LED array would be on. It is possible that background frames, with both LEDs off, could be taken. To protect the film through transfer to Venus, a deployable cover mechanism needs to be implemented.
The camera module houses an FPGA that would then detect droplets as they hit the sensor film and identify the characteristics of each droplet by observing excitations with both LEDs and images coming from the embedded CMV4000 sensor. With calibration, this is expected to give acidity estimates for each droplet. Droplet statistics would then be gathered and transmitted to Earth. A temperature sensor can be attached near the sensor film to measure its temperature.
The OPIC instrument is currently in the engineering model stage and its mass is 370 g. It is expected that the mass of the acidity sensor in this configuration would be similar. The acidity sensor is expected to fit into a 130 × 53 × 41 mm bounding box. The average power consumption of the device is expected to be around 2.5 W and the device will be able to communicate with the spacecraft bus using various communication standards (SpaceWire or SPI, for example).
While this design is larger and heavier, it is based on a design that is already being developed for space, and some parts of the system (e.g., the camera module) already have flight heritage.

4.2. Optimized Design

The system could potentially be significantly optimized by removing the optics and either coating the sensor film straight onto a camera sensor or placing a fiber-optic or a microlens plate between the camera sensor and the sensor film. This would allow for a significant reduction in the size and mass of the sensor, but requires more complex manufacturing steps. In this case, the camera sensor board would also have to be custom-made and space-qualified. In this configuration, LEDs would have to be placed on the opposite side of the sensing plate.

4.3. Plans for Reaching the Flight Model

The prototype tests showed that different acid concentrations are expected to be distinguishable, but to increase the flight-readiness of the device, many developments are needed. For example, a representative optical and camera setup of correct volume would need to be produced. This would need to be used in an environmental chamber that would reproduce the Venusian cloud environment as closely as possible, including gas compositions, temperatures, and pressures. Moreover, the cloud droplet composition is expected to be more complex than just sulfuric acid in water [6], so droplets with various amounts of other compounds, such as salts and organic compounds [25], would have to be used in follow-up experiments. This specific method is also potentially susceptible to background light. In addition, experiments need to be carried out to assess dye aging during the mission and the radiation tolerance of the dye (it is expected to be sensitive to total ionizing dose).
Another aspect is that a reliable cover has to be designed for the sensor plate to hermetically seal it before it reaches the correct zone in the Venusian atmosphere.
To be able to relate the measured droplet statistics to the actual droplet distribution at the location of the probe, it is necessary to simulate the flow of aerosols around the probe and especially to assess how this affects the distribution of droplets that hit the sensor film. This was beyond the scope of the present study, but these effects could produce biases in measurements and, thus, must be characterized before the mission.
The development activities are currently ongoing. We expect to reach a preliminary breadboard version of the sensor in early 2023 and then we will continue experimentation with various environmental conditions. For the high-TRL approach (utilizing OPIC design), it is expected that a flight model stage could be reached in time to get ready for a 2026 launch.
Depending on funding level, alternative designs would also be explored. Utilizing an optimized design could potentially allow several more acidity sensors on board, allowing for redundancies and more statistically significant sampling.

5. Conclusions

Preliminary experiments undertaken showed that the use of a polymer film with an embedded fluorescing pigment enables determination of the acidities of liquid droplets. A reliable methodology for reading out the droplet acidities is still under study. If the original idea of using two (sets of) exciting LEDs turns out to be unreliable, a color sensor could be used that would allow sensing at three wavelengths.
For future experiments, it is also necessary to test the effects of ambient gasses, pressure, and temperature on the sensing film, for example, sulfur dioxide and carbon dioxide, in conjunction with droplets. This requires a more elaborate sensing setup that would allow changing the gas composition, droplet mist composition, temperature and pressure at the same time. Smaller tests toward this setup have been made using a commercial small stainless steel vacuum chamber. For flight qualification, regular thermal vacuum, vibration and radiation tests need to be conducted.
In summary, we expect the acidity sensor to be producible and we also expect it to be able to distinguish whether the Venusian cloud particles are near concentrated sulfuric acid or if they have been neutralized to a potentially habitable level. Producing a flight model, of course, requires significant development and investment.

Author Contributions

Conceptualization, M.P., I.R. and L.K.; methodology, M.P., I.R. and L.K.; software, M.P. and I.R.; investigation, M.P., I.R., L.K., E.M.R., R.S. and A.R.; writing—original draft preparation, M.P., I.R. and L.K.; writing—review and editing, M.P., I.R. and L.K.; visualization, M.P., I.R. and L.K.; supervision, M.P. and L.K.; project administration, M.P.; funding acquisition, M.P. All authors have read and agreed to the published version of the manuscript.

Funding

This research was supported by Breakthrough Initiatives. The funding to the University of Tartu team was distributed through the Massachusetts Institute of Technology, USA. as a subaward project “VLF Concept Study” through its Department of Earth, Atmospheric, and Planetary Sciences.

Data Availability Statement

Not applicable.

Acknowledgments

We would like to thank Ago Rinken for providing the equipment and Tõnis Laasfeld for assistance with the fluorescence spectra measurements.

Conflicts of Interest

The authors declare no conflict of interest. The funders had no role in the design of the study; in the collection, analyses, or interpretation of data; in the writing of the manuscript; or in the decision to publish the results.

Abbreviations

The following abbreviations are used in this manuscript:
DIDeionized
LEDLight emitting diode
PVAPolyvinyl alcohol
FPGAField-programmable gate array
OPICOptical Periscopic Imager for Comets

References

  1. Way, M.J.; Del Genio, A.D.; Kiang, N.Y.; Sohl, L.E.; Grinspoon, D.H.; Aleinov, I.; Kelley, M.; Clune, T. Was Venus the First Habitable World of Our Solar System? Geophys. Res. Lett. 2016, 43, 8376–8383. [Google Scholar] [CrossRef] [PubMed]
  2. Cockell, C.S. Life on Venus. Planet. Space Sci. 1999, 47, 1487–1501. [Google Scholar] [CrossRef]
  3. Seager, S.; Petkowski, J.J.; Gao, P.; Bains, W.; Bryan, N.C.; Ranjan, S.; Greaves, J. The Venusian Lower Atmosphere Haze as a Depot for Desiccated Microbial Life: A Proposed Life Cycle for Persistence of the Venusian Aerial Biosphere. Astrobiology 2021, 21, 1206–1223. [Google Scholar] [CrossRef] [PubMed]
  4. Gentry, D.; Dahlgren, R. Venus Aerosol Sampling Considerations for In Situ Biological Analysis; NASA Ames Research Center: Mountain View, CA, USA, 2019. [Google Scholar]
  5. Hallsworth, J.E.; Koop, T.; Dallas, T.D.; Zorzano, M.-P.; Burkhardt, J.; Golyshina, O.V.; Martín-Torres, J.; Dymond, M.K.; Ball, P.; McKay, C.P. Water Activity in Venus’s Uninhabitable Clouds and Other Planetary Atmospheres. Nat. Astron. 2021, 5, 665–675. [Google Scholar] [CrossRef]
  6. Rimmer, P.B.; Jordan, S.; Constantinou, T.; Woitke, P.; Shorttle, O.; Hobbs, R.; Paschodimas, A. Hydroxide Salts in the Clouds of Venus: Their Effect on the Sulfur Cycle and Cloud Droplet pH. Planet. Sci. J. 2021, 2, 133. [Google Scholar] [CrossRef]
  7. Schleper, C.; Pühler, G.; Klenk, H.-P.; Zillig, W. Picrophilus oshimae and Picrophilus torridus Fam. Nov., Gen. Nov., Sp. Nov., Two Species of Hyperacidophilic, Thermophilic, Heterotrophic, Aerobic Archaea. Int. J. Syst. Bacteriol. 1996, 46, 814–816. [Google Scholar] [CrossRef]
  8. Bains, W.; Petkowski, J.J.; Rimmer, P.B.; Seager, S. Production of Ammonia Makes Venusian Clouds Habitable and Explains Observed Cloud-Level Chemical Anomalies. Proc. Natl. Acad. Sci. USA 2021, 118, e2110889118. [Google Scholar] [CrossRef] [PubMed]
  9. Seager, S.; Petkowski, J.J.; Carr, C.E.; Grinspoon, D.; Ehlmann, B.; Saikia, S.J.; Agrawal, R.; Buchanan, W.; Weber, M.U.; French, R.; et al. Venus Life Finder Mission Study. arXiv 2021, arXiv:2112.05153. [Google Scholar]
  10. French, R.; Mandy, C.; Hunter, R.; Mosleh, E.; Sinclair, D.; Beck, P.; Seager, S.; Petkowski, J.J.; Carr, C.E.; Grinspoon, D.H.; et al. Rocket Lab Mission to Venus. Aerospace 2022, 9, 445. [Google Scholar] [CrossRef]
  11. Agrawal, R.; Buchanan, W.P.; Arora, A.; Girija, A.P.; De Jong, M.; Seager, S.; Petkowski, J.J.; Saikia, S.J.; Carr, C.E.; Grinspoon, D.H.; et al. Mission architecture to characterize habitability of Venus cloud layers via an aerial platform. Aerospace 2022, 9, 359. [Google Scholar] [CrossRef]
  12. Buchanan, W.P.; de Jong, M.; Agrawal, R.; Petkowski, J.J.; Arora, A.; Saikia, S.J.; Seager, S.; Longuski, J.; Venus Life Finder Mission Team. Aerial platform design options for a life-finding mission at Venus. Aerospace 2022, 9, 363. [Google Scholar] [CrossRef]
  13. Chen, J.-W.; Chen, C.-M.; Chang, C.-C. A Fluorescent pH Probe for Acidic Organelles in Living Cells. Org. Biomol. Chem. 2017, 15, 7936–7943. [Google Scholar] [CrossRef] [PubMed]
  14. Sharma, M.; Graham, J.Y.; Walczak, P.A.; Nguyen, R.M.; Lee, L.K.; Carson, M.D.; Nelson, L.Y.; Patel, S.N.; Xu, Z.; Seibel, E.J. Optical pH Measurement System Using a Single Fluorescent Dye for Assessing Susceptibility to Dental Caries. J. Biomed. Opt. 2019, 24, 017001. [Google Scholar] [CrossRef] [PubMed]
  15. Yuan, X.; Zhang, T.; Yan, J.; Chen, X.; Wang, L.; Liu, X.; Zheng, K.; Zhang, N. A Simple Acidic ‘Turn-on’ Fluorescent PH Probe Based on BOPYIN and Its Visual Detection and Cellular Imaging. Dyes Pigments 2020, 177, 108318. [Google Scholar] [CrossRef]
  16. Zhang, X.; Song, G.-J.; Cao, X.-J.; Liu, J.-T.; Chen, M.-Y.; Cao, X.-Q.; Zhao, B.-X. A New Fluorescent pH Probe for Acidic Conditions. RSC Adv. 2015, 5, 89827–89832. [Google Scholar] [CrossRef]
  17. Le Guern, F.; Mussard, V.; Gaucher, A.; Rottman, M.; Prim, D. Fluorescein Derivatives as Fluorescent Probes for pH Monitoring along Recent Biological Applications. Int. J. Mol. Sci. 2020, 21, 9217. [Google Scholar] [CrossRef] [PubMed]
  18. Lindqvist, L. The Triplet State of Fluorescein in Sulfuric Acid. J. Phys. Chem. 1963, 67, 1701–1704. [Google Scholar] [CrossRef]
  19. Martin, M.M.; Lindqvist, L. The pH Dependence of Fluorescein Fluorescence. J. Lumin. 2008, 10, 381–390. [Google Scholar] [CrossRef]
  20. Hallensleben, M.L.; Fuss, R.; Mummy, F. Ullmann’s Encyclopedia of Industrial Chemistry; Wiley-VCH Verlag GmbH & Co. KGaA: Weinheim, Germany, 2015; pp. 1–23. [Google Scholar]
  21. Finch, C.A. Polyvinyl Alcohol–Developments; Wiley: Weinheim, Germany, 1992. [Google Scholar]
  22. Gadhave, R.V.; Mahanwar, P.A.; Gadekar, P.T. Study of Cross-Linking between Boric Acid and Different Types of Polyvinyl Alcohol Adhesive. OJPChem 2019, 9, 16–26. [Google Scholar] [CrossRef] [Green Version]
  23. Ion Power, Inc. LIQUION Solutions Safety Data Sheet. Available online: https://www.ion-power.com/wp-content/uploads/2020/05/Liquion-SDS-Solutions-English-1.pdf (accessed on 31 August 2022).
  24. Pajusalu, M.; Kivastik, J.; Iakubivskyi, I.; Slavinskis, A. Developing autonomous image capturing systems for maximum science yield for high fly-by velocity small solar system body exploration. In Proceedings of the International Astronautical Congress, IAC-2020, Online, 12–14 October 2020. [Google Scholar]
  25. Spacek, J.; Benner, S.A. The Organic Carbon Cycle in the Atmosphere of Venus and Evolving Red Oil. In Proceedings of the Venera-D Venus Cloud Habitability Syst. Workshop, Virtual, 29 November–3 December 2021. LPI Contribution No. 2629, 4052. [Google Scholar]
Figure 1. Forms of fluorescein in different acidity regions [17].
Aerospace 09 00560 g001
Figure 2. The assembled droplet spectrum measurement device. For photography, the lens and fiber setup was exchanged with a trinocular microscope.
Aerospace 09 00560 g002
Figure 3. Fluorescein in H 2 SO 4 solutions under an UV-A mercury vapor lamp with the main spectral line at 365 nm.
Aerospace 09 00560 g003
Figure 4. (Top) Fluorescein excitation spectra in H 2 SO 4 solutions (emission was integrated at 550 nm). (Bottom) Fluorescein emission spectra in H 2 SO 4 solutions (exciting wavelength was 400 nm).
Aerospace 09 00560 g004
Figure 5. Excitation spectrum of fluorescein at different acid concentrations. Spectra are normalized at the wavelength of 450 nm. Inset: Relative intensities at 425 nm, showing a clear dependence on sulfuric acid concentration. Approximate regions for both acidity hypotheses: pH between −1 and 1 and near concentrated sulfuric acid have been marked.
Aerospace 09 00560 g005
Figure 6. Structures of fluoresceinamine (left) and sulforhodamine B (right).
Aerospace 09 00560 g006
Figure 7. Fluoresceinamine (above) and sulforhodamine B in H 2 SO 4 solutions (18 M to 5 × 10 7 M) and in DI water under UV-light.
Aerospace 09 00560 g007
Figure 8. Fluoresceinamine and sulforhodamine B excitation spectra in H 2 SO 4 solutions.
Aerospace 09 00560 g008
Figure 9. (a). Films with PVA matrix created using 20 μ m bar coater. (b). Films with Nafion matrix. (c). Droplets of 4.5 M sulfuric acid (left), 0.1 M sulfuric acid and deionized water on coated microscope slides. The droplets were sprayed from a distance of approx 20 cm. While the droplets of concentrated sulfuric acid remain visible on the surface for longer, the fluorescence signal disappears in a couple of seconds. (d). Bar coater method slide with deionised water; 0.1 M, 4.5 M and concentrated sulfuric acid test droplets (left to right). Plates visible in subfigures (bd) are illuminated with a 385–400 nm UV-A LED light source, plate a is shown in regular room light (fluorescent light bulb).
Aerospace 09 00560 g009
Figure 10. Ultrasonic atomizer and barriers used to protect it from acid.
Aerospace 09 00560 g010
Figure 11. Images of the same slide (7% PVA, 6% uranin, made using 12 μ m bar coater) covered in droplets created with sequential spraying of mist of different concentrations on the slide.
Aerospace 09 00560 g011
Figure 12. Droplets generated with ultrasonic atomizer under a microscope. (a). Concentrated sulfuric acid droplets. (b). It is possible to visually distinguish between concentrated (earlier Venusian atmosphere models) and 0.05 M sulfuric acid (roughly corresponding to the neutralized cloud droplet model). (c). The smallest droplets generated with an ultrasonic atomizer are around or below 10 μ m.
Aerospace 09 00560 g012
Figure 13. Measured spectra of droplets of various concentration on the sensing film. (Left): fluorescence spectra obtained when illuminating droplets on the sensor film with a 425 and 450 nm LED. (Right): Relative intensities of fluorescence excitation at 425 nm compared to 450 nm. The expected values were obtained from liquid-phase measurements. The actual values are results of measurements performed on droplets on films.
Aerospace 09 00560 g013
Figure 14. Two concepts of the device: (A) a larger device based on the OPIC instrument and having parts that are already space-qualified, and (B) a more space-efficient device, which requires more research to be applied in practice.
Aerospace 09 00560 g014
Publisher’s Note: MDPI stays neutral with regard to jurisdictional claims in published maps and institutional affiliations.

