Article

Fuzzy Logic-Based Energy Management Strategy of Hybrid Electric Propulsion System for Fixed-Wing VTOL Aircraft

College of Aerospace Science and Engineering, National University of Defense Technology, Changsha 410073, China
*
Author to whom correspondence should be addressed.
Aerospace 2022, 9(10), 547; https://doi.org/10.3390/aerospace9100547
Submission received: 9 August 2022 / Revised: 23 September 2022 / Accepted: 23 September 2022 / Published: 25 September 2022
(This article belongs to the Special Issue Energy Efficiency of Small-Scale UAVs)

Abstract

:
An energy management strategy for a series hybrid electric propulsion system designed for a fixed-wing vertical take-off and landing (VTOL) aircraft is presented in this paper. The proposed method combines an ideal operating line (IOL) and fuzzy logic. Fuzzy logic is used to dynamically and optimally allocate the output power of the generator and the battery pack according to the power requirement of the aircraft and the SOC of the battery pack. The IOL controller is used to optimize the internal combustion engine (ICE) operating point to improve the fuel economy of the system. The detailed aircraft model and energy system model are established. The flight process of a 100 kg scale VTOL aircraft under a typical mission profile is simulated. The simulation results show that running the ICE based on IOL can greatly improve its efficiency The introduction of fuzzy logic to optimize the power allocation of the generator and battery pack improves the overall efficiency of the system. The feasibility and effectiveness of the energy management strategy proposed in this paper are verified, and the design ideas and analysis methods are provided for the energy management of a hybrid electric aircraft.

1. Introduction

Limited by the current level of the energy density of a battery, for aircraft of the same weight, a traditional fuel power system is significantly better than an electric power system in voyage and duration. A hybrid electric system is a composite power system that combines fuel power and electric power, which can improve the efficiency of the power system of the aircraft under wide working conditions, and then meet the needs of a long flight time in actual work [1,2].
Based on the existing technical conditions, compared with the electric power system, the hybrid electric propulsion system has obvious advantages in terms of energy density. Under the premise of the system design including the ICE, generator and battery pack, its energy density is about three times that of the electric power system. Moreover, when the hybrid electric propulsion system is working, and when the fuel is continuously consumed, the weight of the aircraft is reduced, resulting in a reduction in the power demand, which further improves the comprehensive energy density of the hybrid electric propulsion system, while the weight of the electric power system does not decrease with the consumption of electricity [3]. The mechanical efficiency of the ICE is generally around 80~90%, and there is little room for upward improvement, while the thermal efficiency is generally around 20~40% and has huge potential. If the thermal efficiency of the ICE can be increased to more than 50%, the advantages of the hybrid electric system will be greater.
Due to the different dynamic response characteristics of the generator and battery pack, it is necessary to use the EMS to control the output power of the hybrid powertrain. On the premise of meeting the power demand of the aircraft, the optimal scheduling of the energy management strategy (EMS) is used to improve the stability and efficiency of the system. Therefore, energy management is a key factor in the development of the hybrid electric propulsion system.
Researchers have conducted some exploratory work about the design of a hybrid electric propulsion system for aircraft. Friedrich et al. [4] carried out the overall design of a 20 kg scale hybrid electric UAV based on the ideal fuel consumption curve of the ICE. A similar study was also carried out by Riboldi et al. [5] using optimization methods for the initial design of a small hybrid electric UAV.
For the EMS of a hybrid electric system, researchers have conducted a lot of research work and have also achieved good research results. Li et al. [6] designed a novel propulsion system topology and power distribution algorithm for a light manned electric aircraft using an energy system, which combined a fuel cell and a lithium battery Their method can protect fuel cells from rapid power changes, realize the protection of the fuel cell and effectively improve the efficiency. The concept of hybridization for power was introduced by Ji et al. [7], who dynamically adjusted the Hp of the hybrid electric system combined with the power demand of the aircraft under different operating conditions to improve the energy utilization efficiency. Hung et al. [8] verified this conclusion by a simulation based on the flight conditions of a fixed-wing UAV. Xie et al. [9] proposed an EMS that combines the minimum equivalent consumption strategy and fuzzy logic control (FLC) for a fixed-wing light aircraft, which can not only achieve online energy management but also reduce fuel consumption.
From the analysis of the results of the above researchers, the main purpose was to improve fuel economy and system efficiency. Due to the complexity of the hybrid electric propulsion system, the traditional design method using an accurate mathematical model has difficulty obtaining the expected effect. FLC is an intelligent control based on fuzzy logic, imitating human control experience and knowledge, which is very active in the current industrial field. It is feasible and advantageous to use the FLC method to design an EMS for a hybrid electric propulsion system [10].
Based on such research ideas, this paper takes a 100 kg scale VTOL aircraft as a prototype to study the EMS optimization of the hybrid electric propulsion system. The concept of IOL is introduced, and an EMS based on FLC is established. This strategy can combine the power requirement and the SOC of a battery pack online to dynamically and optimally allocate the output power of the generator and the battery pack. The simulation results verify that this strategy can improve the overall efficiency of the hybrid electric system under typical mission profiles.

2. System Modeling

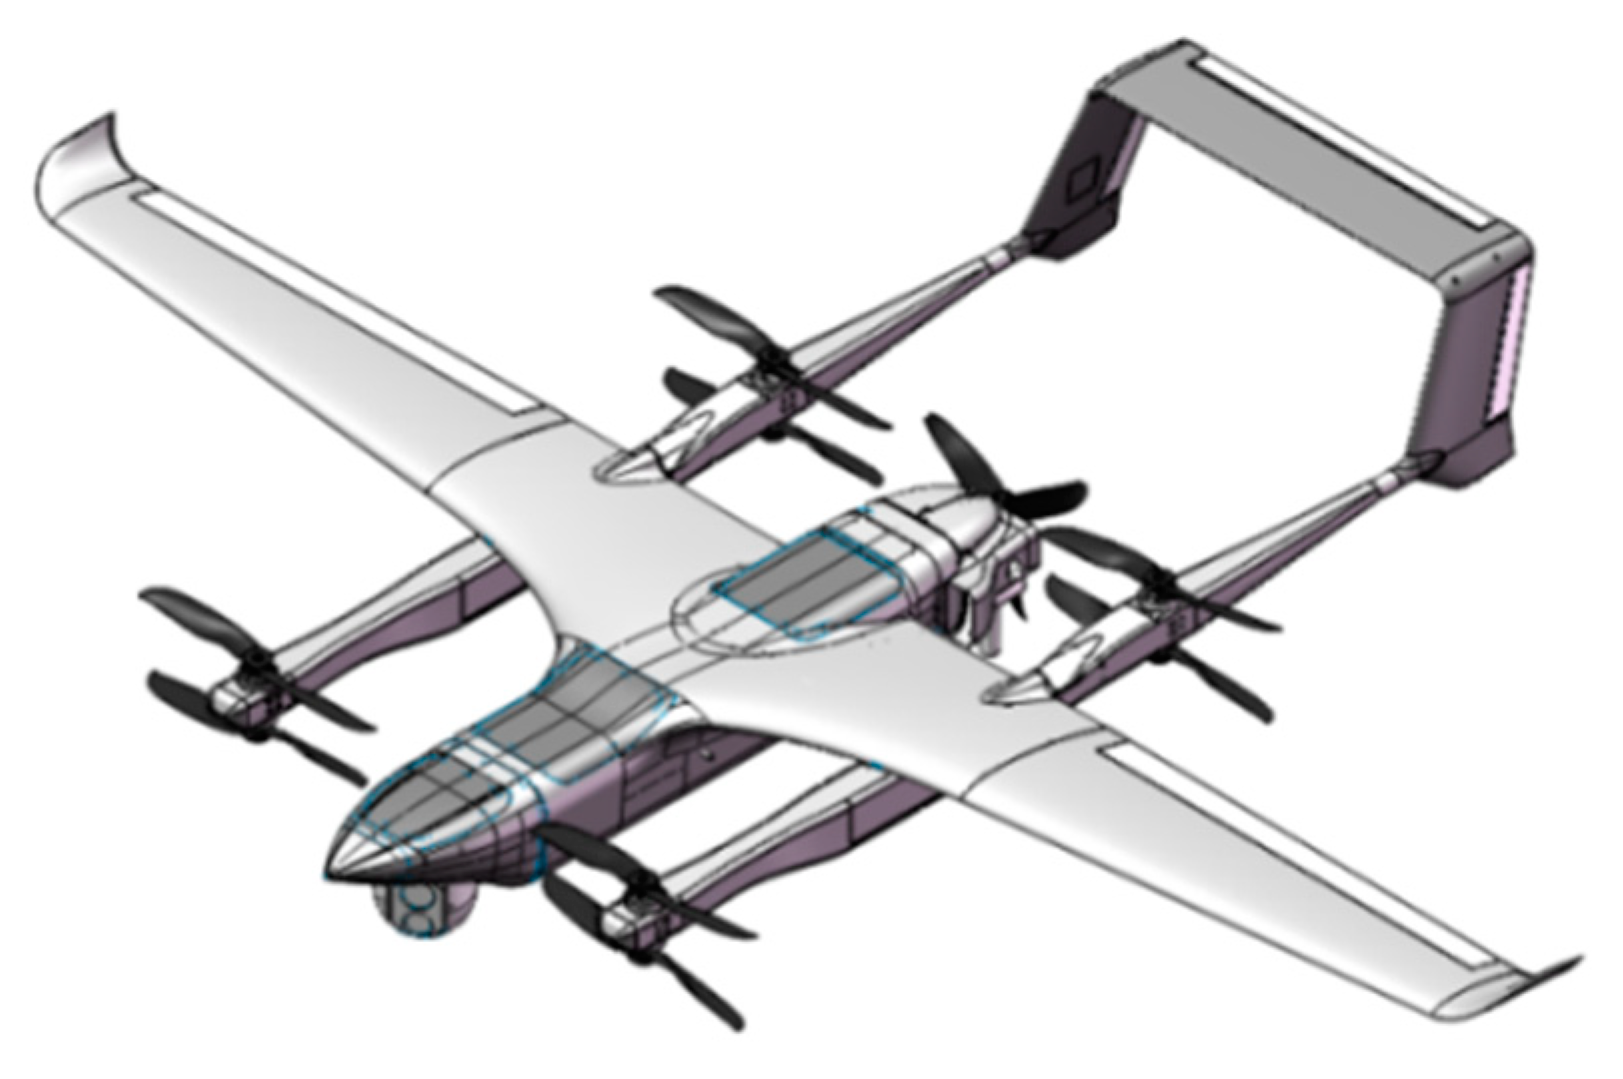
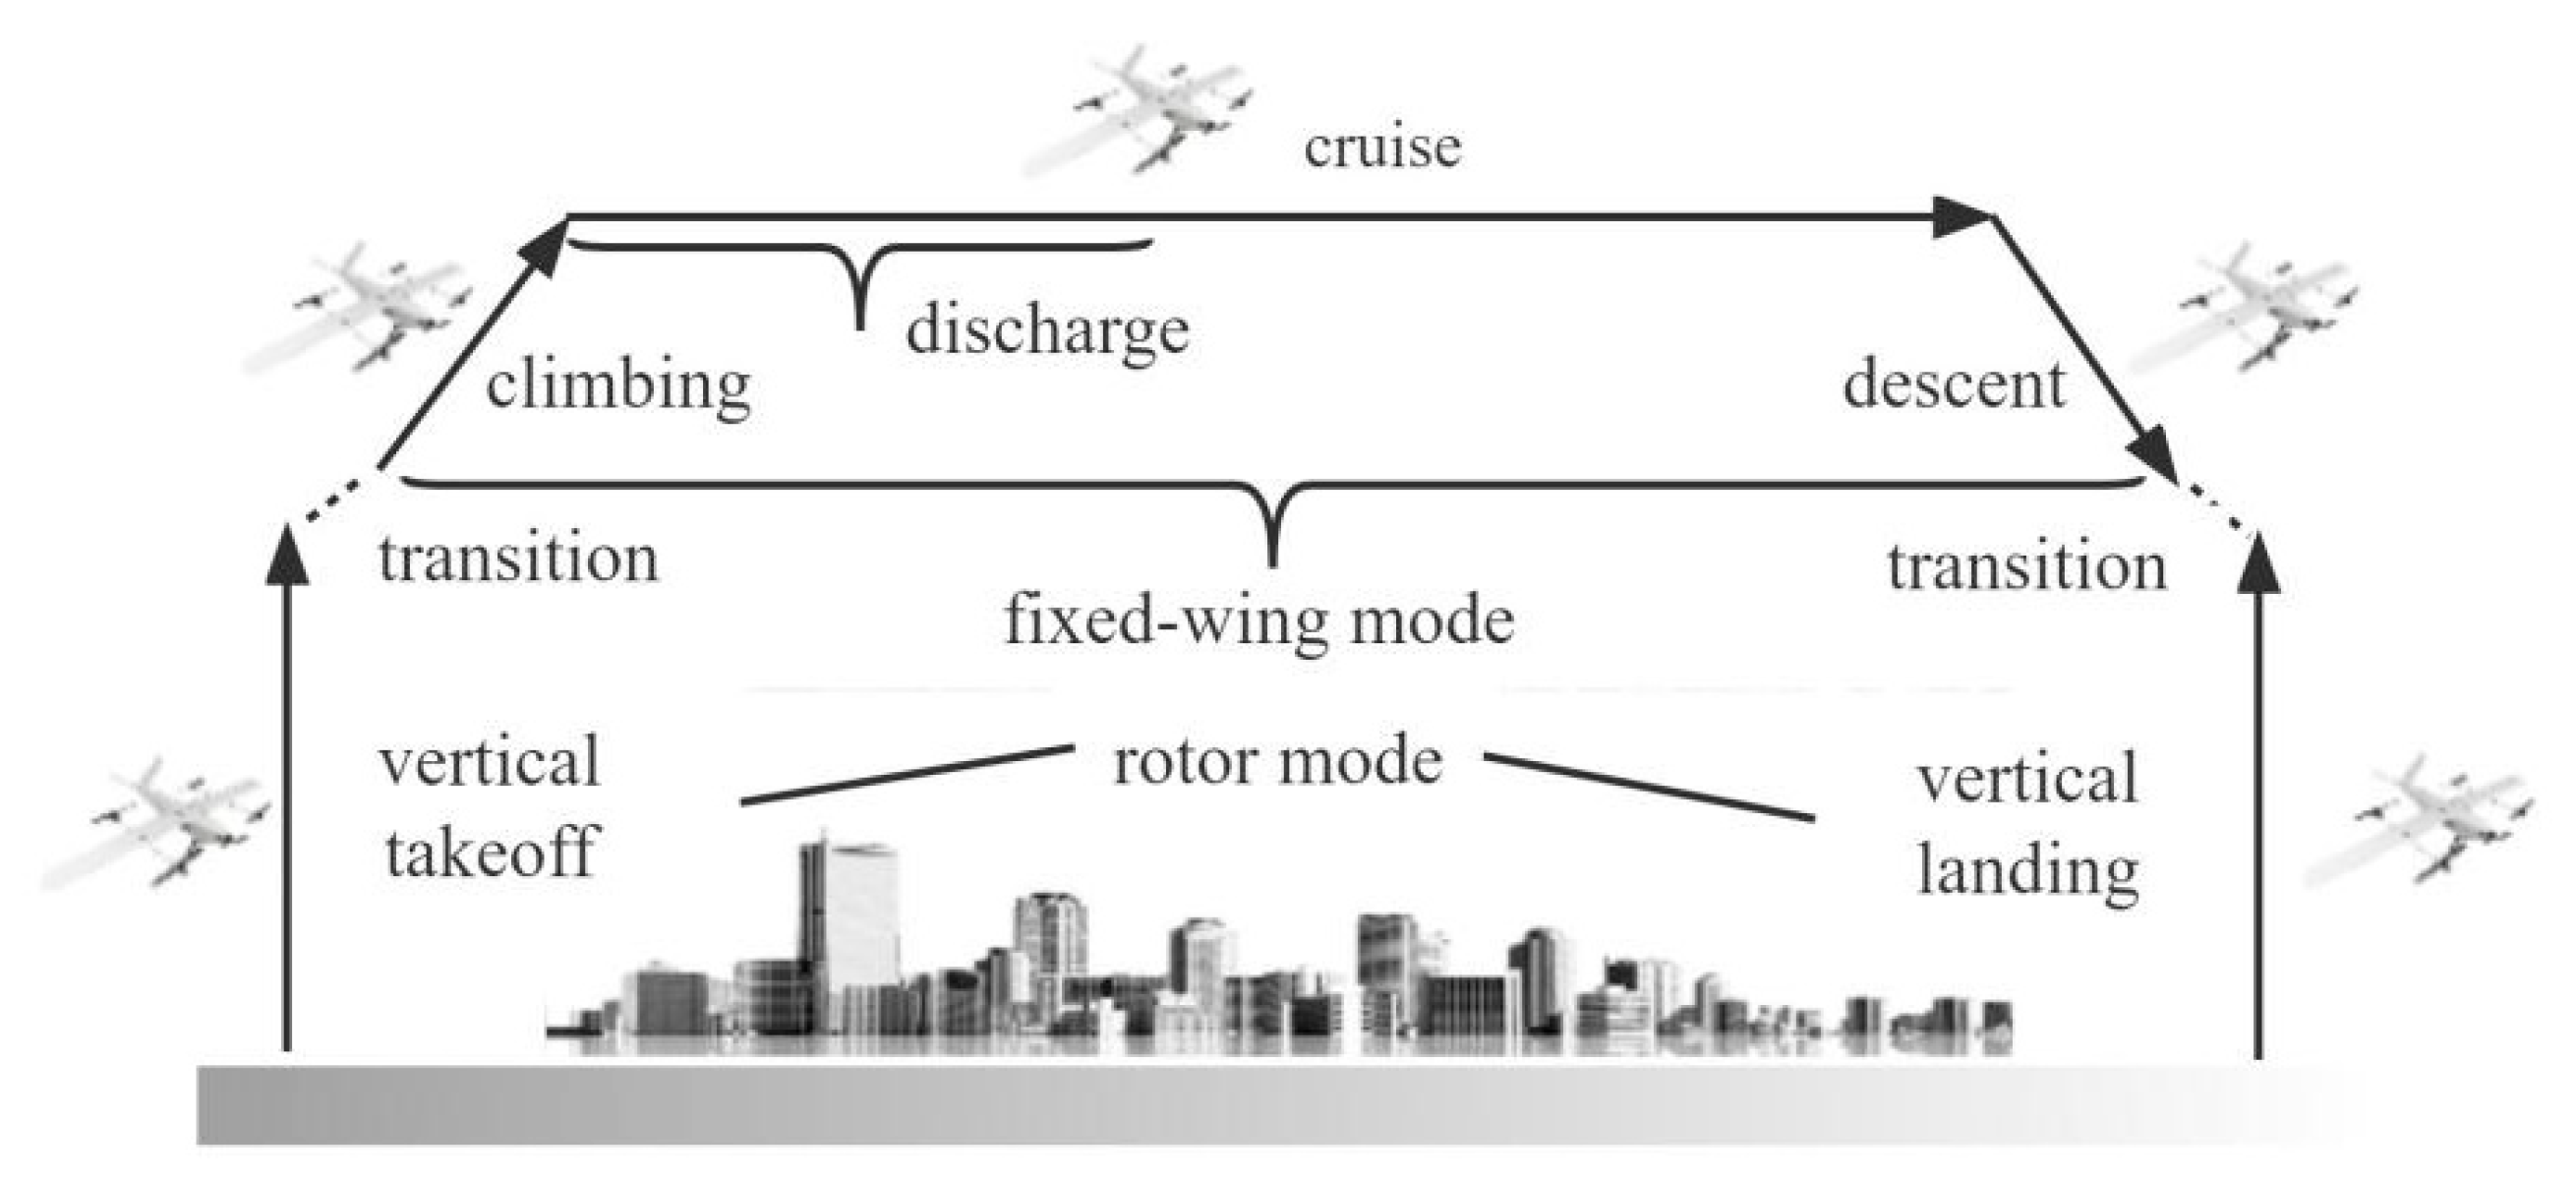
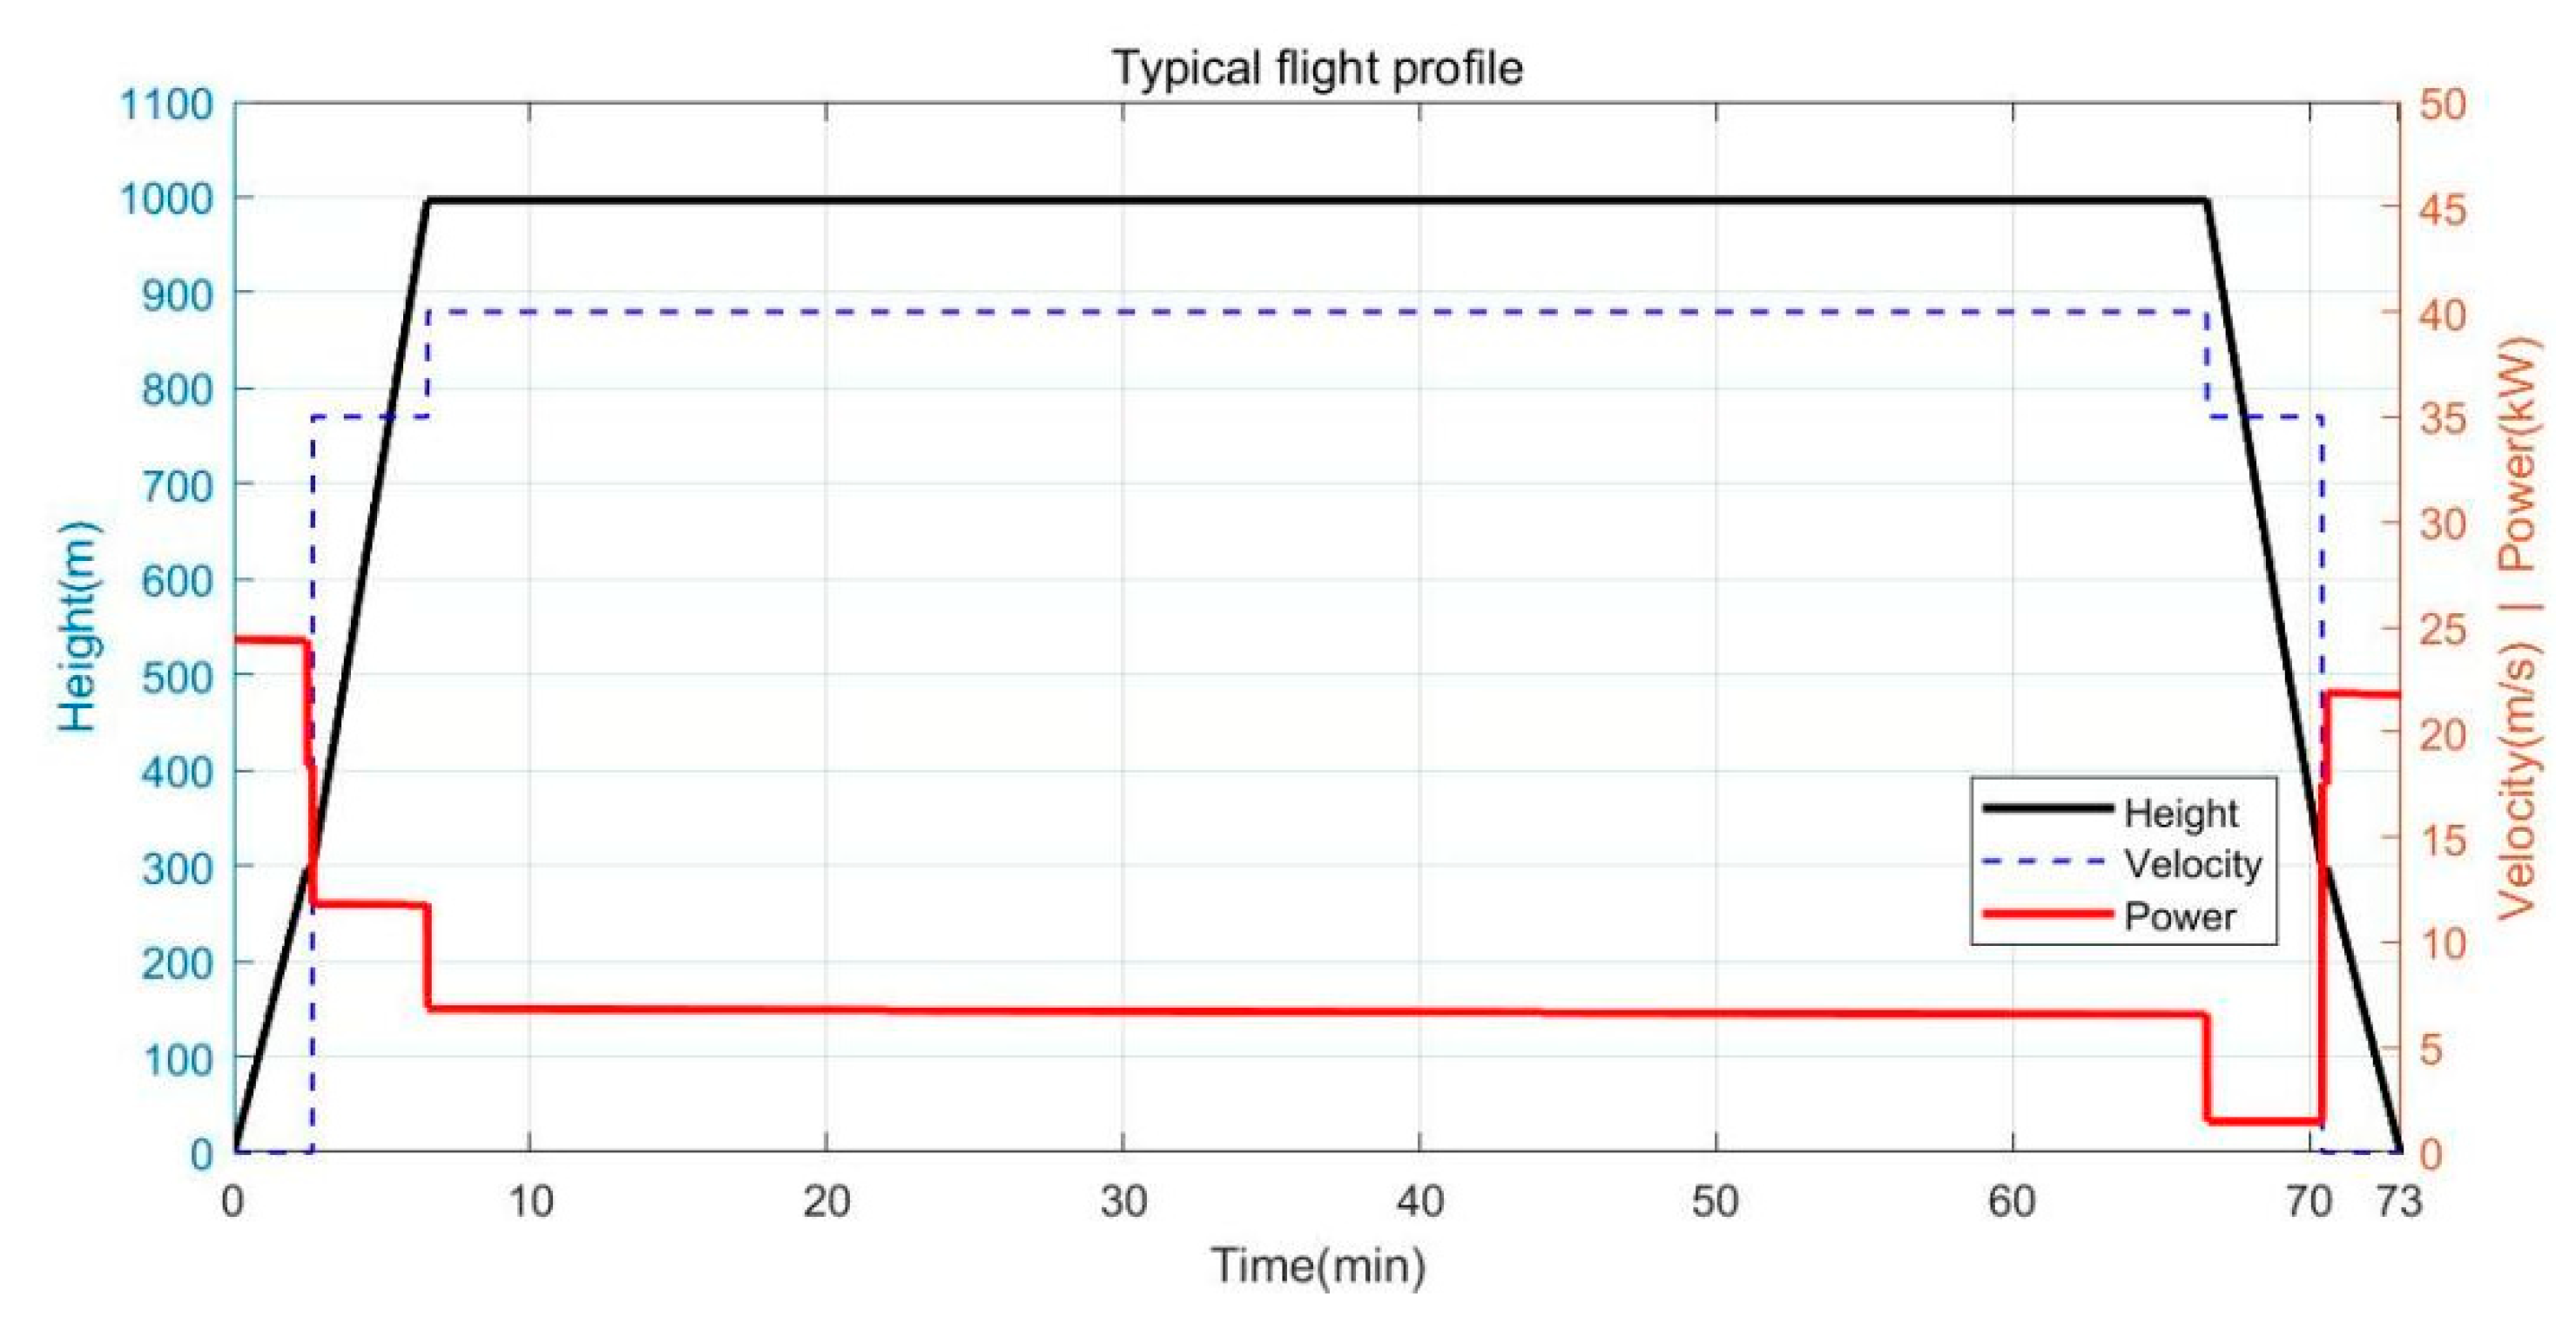
2.1. Mission Profile

The research object of this paper is a 100 kg scale VTOL aircraft designed by our team, as shown in Figure 1. The VTOL system and the horizontal flight propulsion system are separated. In the take-off and landing stage, the rotor system provides vertical pulling force, and in the horizontal flight stage, the fixed-wing system provides lift and thrust [11].
The typical mission profile of fixed-wing VTOL aircraft is shown in Figure 2, which is mainly divided into six stages: vertical take-off, mode conversion, climb, cruise, descent and vertical landing.

2.2. Dynamic Model

Fixed-wing VTOL aircraft can be regarded as a multi-rotor aircraft during VTOL stages; it can also be used as a fixed-wing aircraft during climb, cruise and descent stages. In this paper, two modes of rotor flight and fixed-wing flight are defined for fixed-wing VTOL aircraft, and the dynamic modeling is carried out, respectively.

2.2.1. Rotor Mode

In the VTOL stage, the total weight WTO and the drag Dv of the aircraft are both overcome by the thrust Tv generated by the rotors [12]
T v = 1.15 · ( W T O ± D v )
The coefficient 1.15 indicates that an additional 15% thrust is considered to overcome the wind. Dv is positive in the vertical take-off stage and negative in the vertical landing stage. Its value can be calculated by Equation (2)
D v = 1 2 · C D , v · ρ · v v 2 · S p
where ρ is the air density due to the low flight height in the VTOL stage, the influence of the altitude change on the air density is not considered, and it is set as 1.293 kg/m3. CD,v is the vertical drag coefficient, vv is the vertical rising rate in the take-off stage, Sp is the projected area of the whole aircraft. In the process of VTOL, the aircraft projection plane is perpendicular to the climb velocity vector, which is suitable for the assumption of plate resistance, the drag coefficient of the flat plate can be described as Equation (3)
C D , v = 2 sin 3 α
During VTOL process, α = 90°, so CD,v = 2. Combining Equations (1)–(3), the thrust required for the VTOL process can be calculated. Equation (4) is derived from propeller momentum theory to calculate the power requirement to generate the required thrust [13]
P R = T v v i F M / ( η T · η M )
vi is the axial induced speed of the rotor, ηT is the transmission efficiency (considering the efficiency of energy management system and circuit loss), ηM is the motor efficiency, FM is the rotor utility factor, also known as the rotor utility factor. Tyan et al. [14] processed the experimental data of 85 ICE–propeller combinations, and established a statistical model of FM changing with the TR as shown in Equation (5)
F M = 0.4742 T R 0.0793
TR represents the thrust generated by a single rotor in a given flight state. According to the momentum theory, the axial velocity of rotor can be depicted by Equation (6) [15]
v i = v v 2 + v v 2 4 + T R 2 ρ S R
SR represents the area of a single rotor disk, which can be determined by Equations (7) and (8), respectively.
T R = T v n R
S R = W T O R D L n R
nR represents the number of rotors and RDL represents the rotor disc load. Tyan established a database of 11 multi-rotor aircraft models, and derived a formula for calculating RDL and take-off total mass (MTO) by constructing a statistical regression model [14]
R D L = 3.2261 M T O + 74.991
The power demand of a single rotor in the VTOL stage can be calculated from Equations (1)~(9), and the total required power of the rotor system (Preq,R) can be calculated by Equation (10):
P r e q , R = n R P R

2.2.2. Fixed-Wing Mode

During the climb, cruise and descent stages, the aircraft adopts the fixed-wing flight mode, the propeller provides forward thrust, and the wings provide lift. Establish the dynamic equation in fixed-wing flight mode using the center of mass motion model [16].
T cos α D m g sin γ = m d V d t
T sin α + L m g cos γ = m V γ ˙
T sin α + L m g cos γ = 0
H ˙ = V sin γ
where V is the speed, T is the thrust produced by the propeller, α is the attack angle, m is the mass of the aircraft, γ is the pitch angle and H is the height of the aircraft. L and D are lift and drag, respectively, which can be expressed as Equations (15) and (16).
L = C L S w ( 1 2 ρ V 2 )
D = C D S w ( 1 2 ρ V 2 )
where CL and CD are lift coefficient and drag coefficient, respectively, and Sw is wing area. The stable cruise speed and climb/descent speed of the minimum power can be calculated by Equation (17) and Equation (18), respectively.
V C = 2 W T O ρ S W C L
V 2 W T O ρ S W k 3 C D 0 P m i n
where CD0 is zero-lift drag coefficient, k is lift-induced drag coefficient, which can be depicted as Equation (19) [17]
k = 1 / ( π e A R )
where e is Oswald factor and AR is aspect ratio. Power requirement of the aircraft in fixed-wing mode can be calculated by Equation (20)
P r e q = ( V T cos α ) / η T η M η P
where ηP is the propeller efficiency. Combined with the relevant design parameters of the aircraft, as shown in Table 1, the power requirement under the typical mission profile can be calculated (the cruise time is set to 1 h), as shown in Figure 3.
It can be seen that the power requirement varies greatly in different flight stages, with the VTOL stage being the largest, more than three times that of the cruise stage. However, the power requirement of the descent stage is only 1/5 of that of the cruise phase due to the release of gravity potential energy. The jump in power requirement of VTOL aircraft brings challenges to the energy system

2.3. Hybrid Electric Propulsion System Model

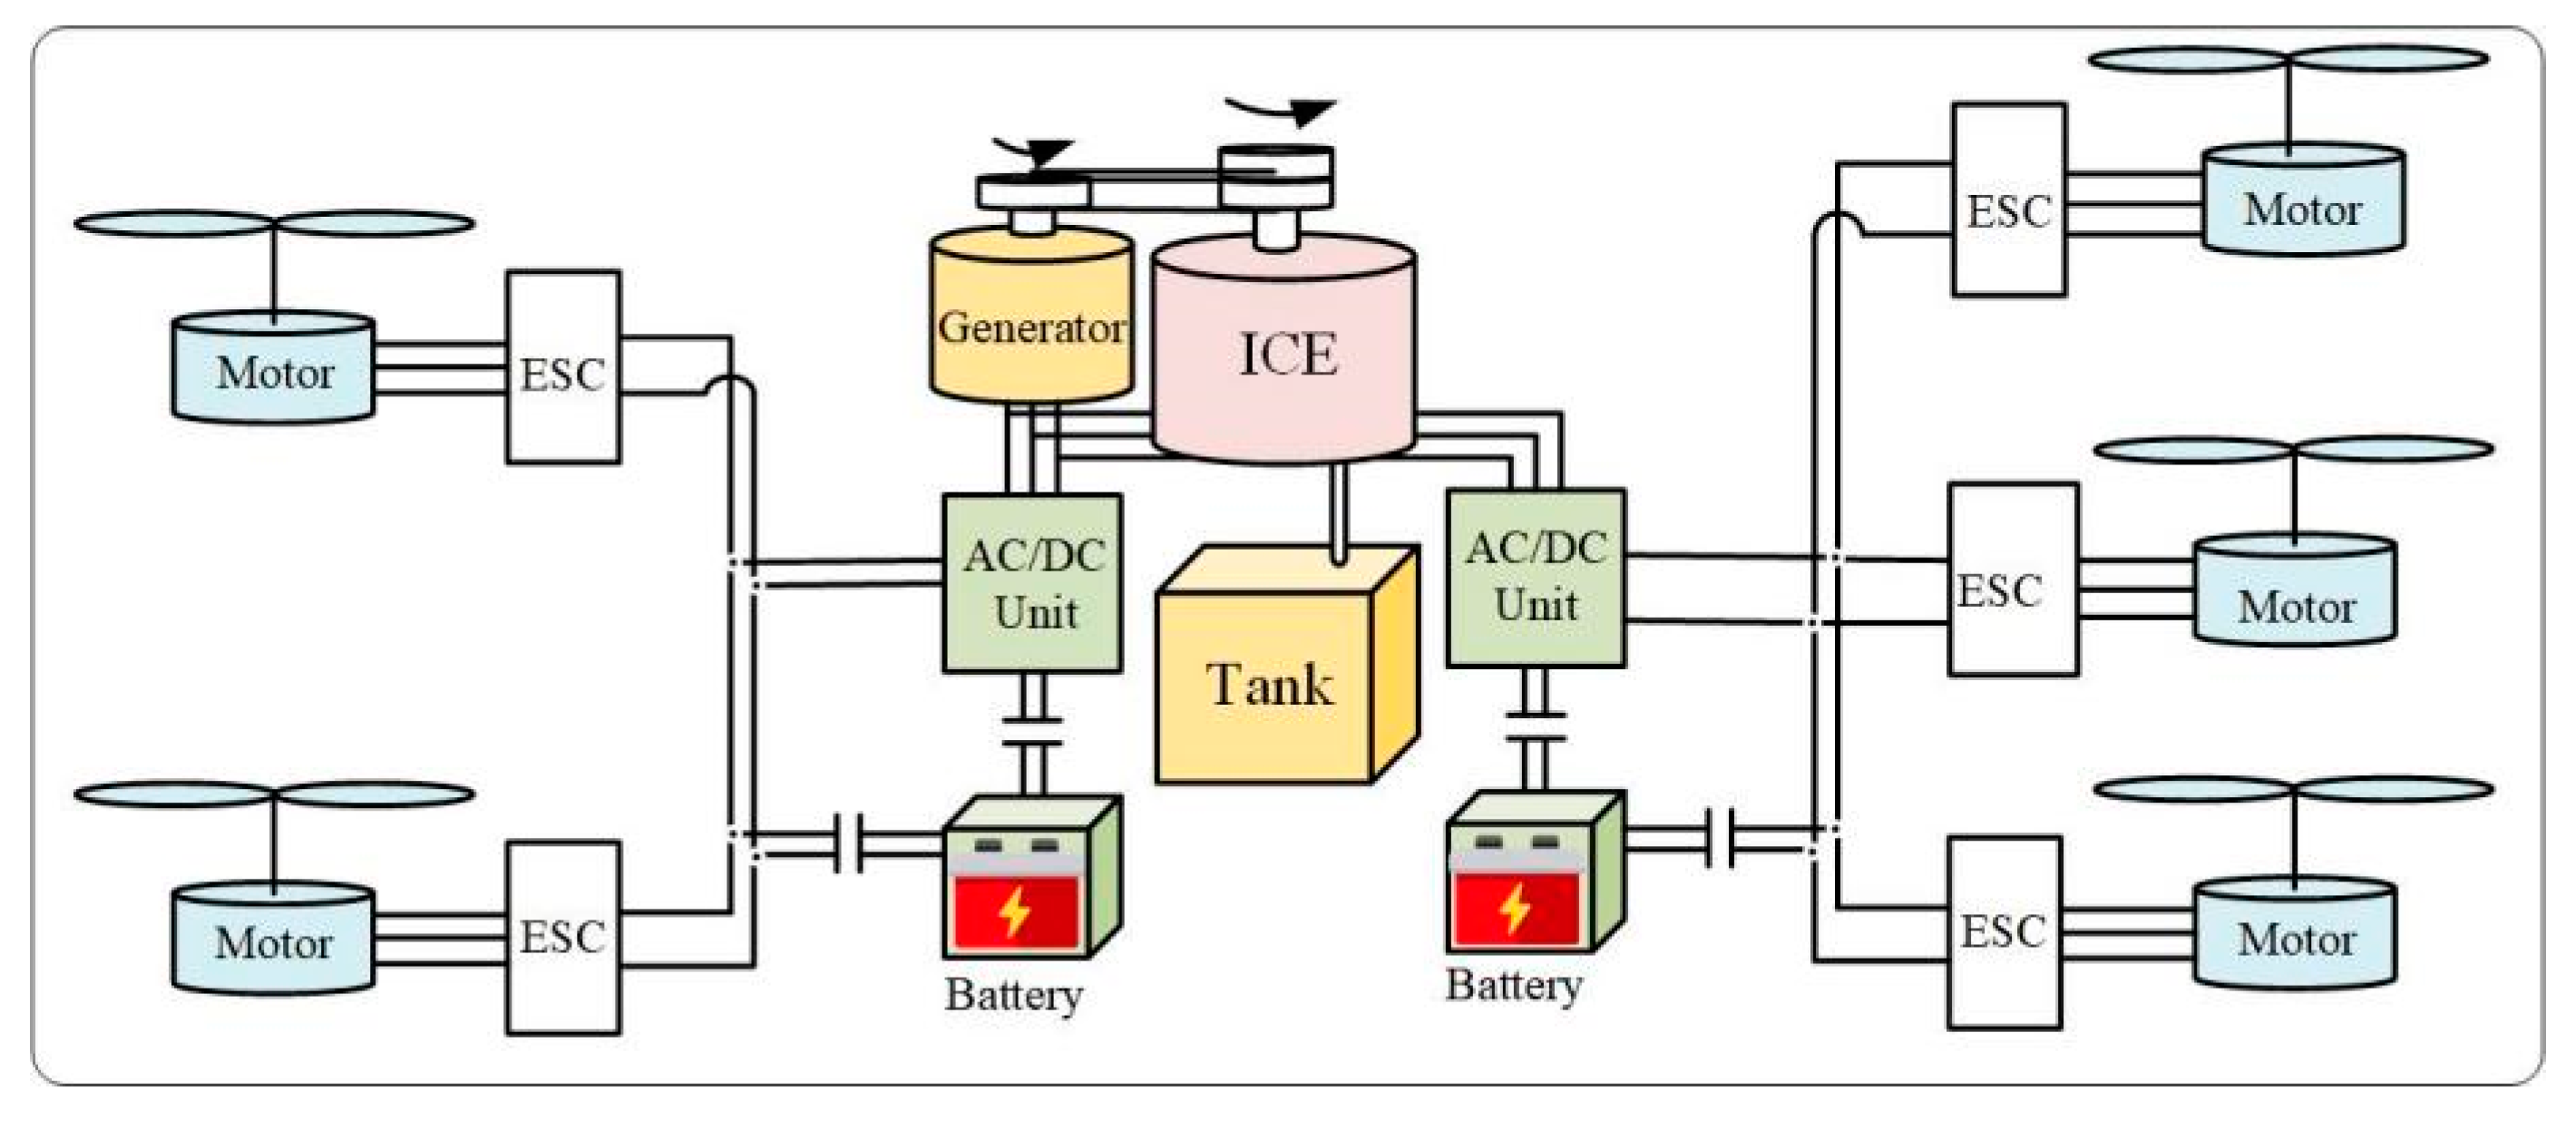
2.3.1. Hybrid Electric Propulsion System Structure
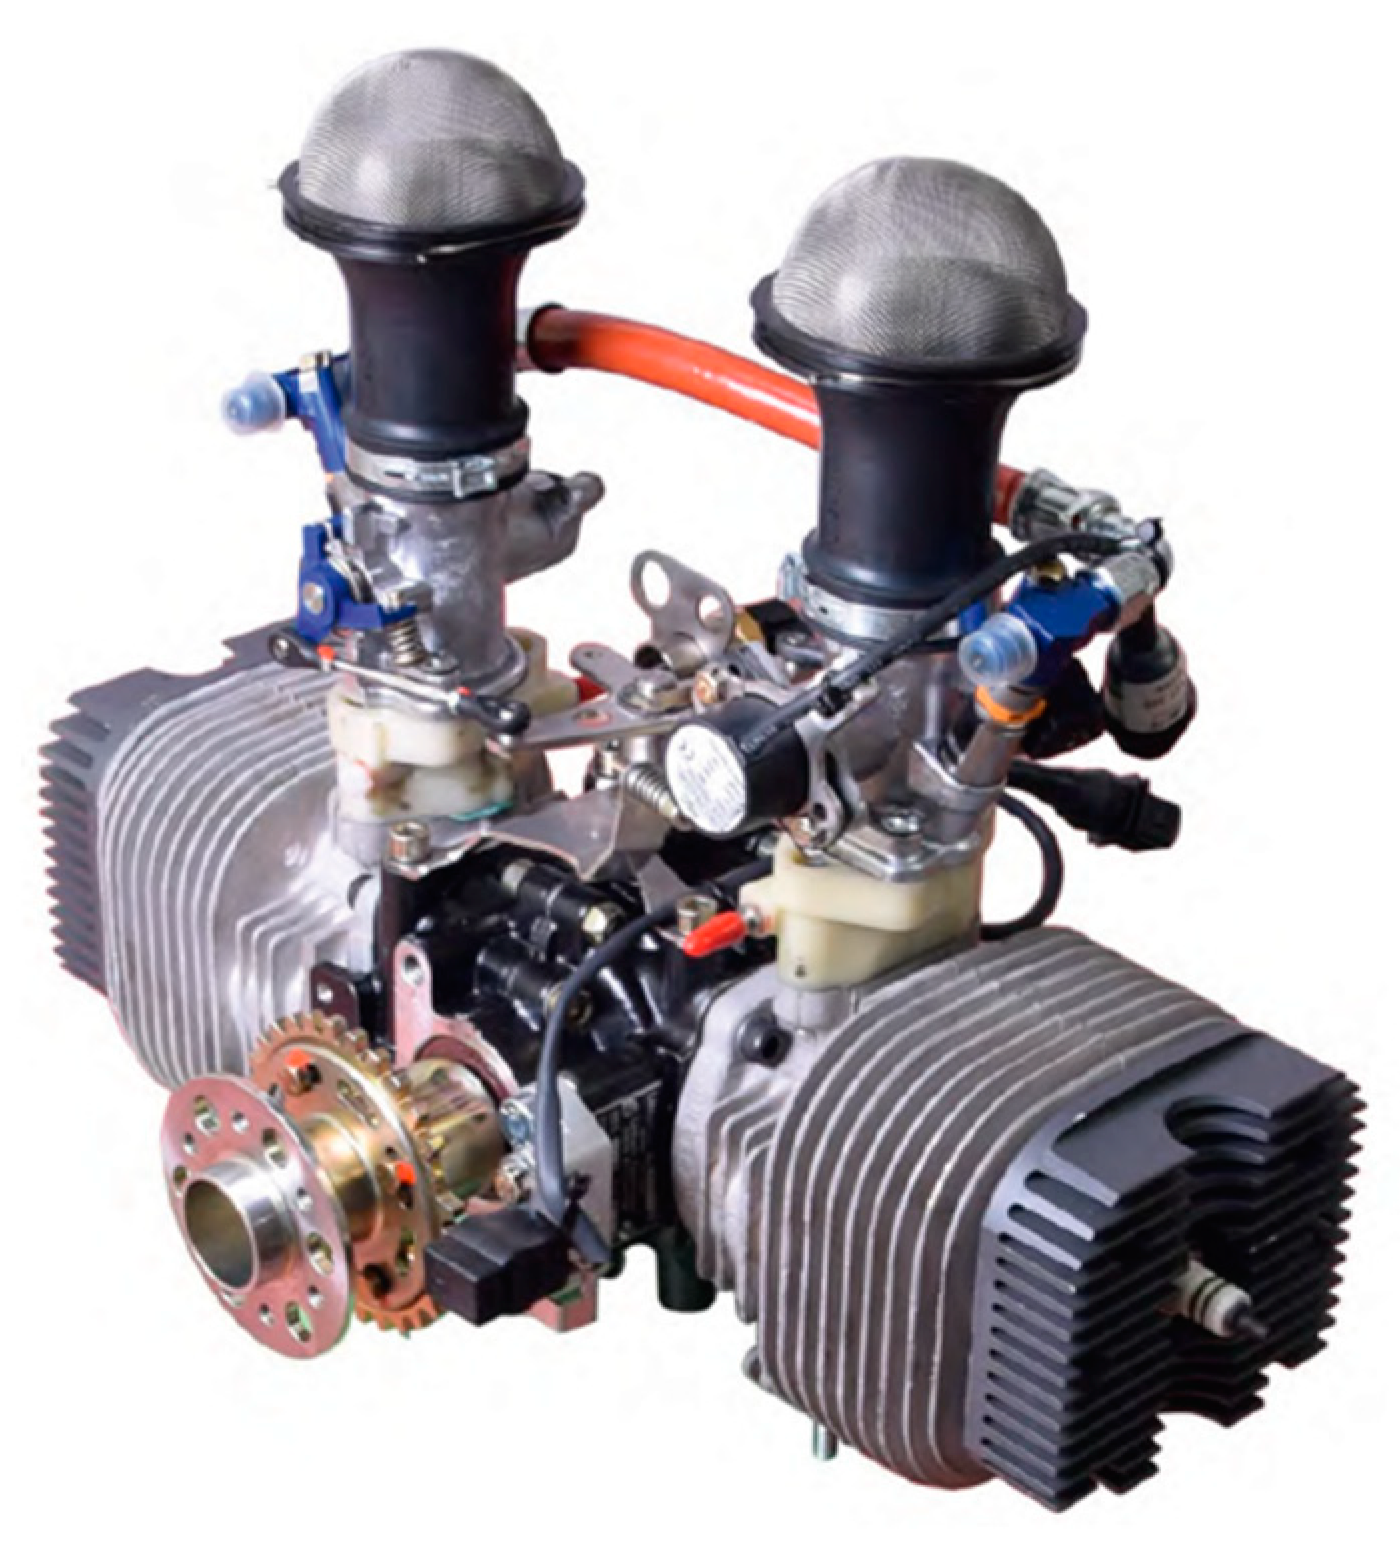
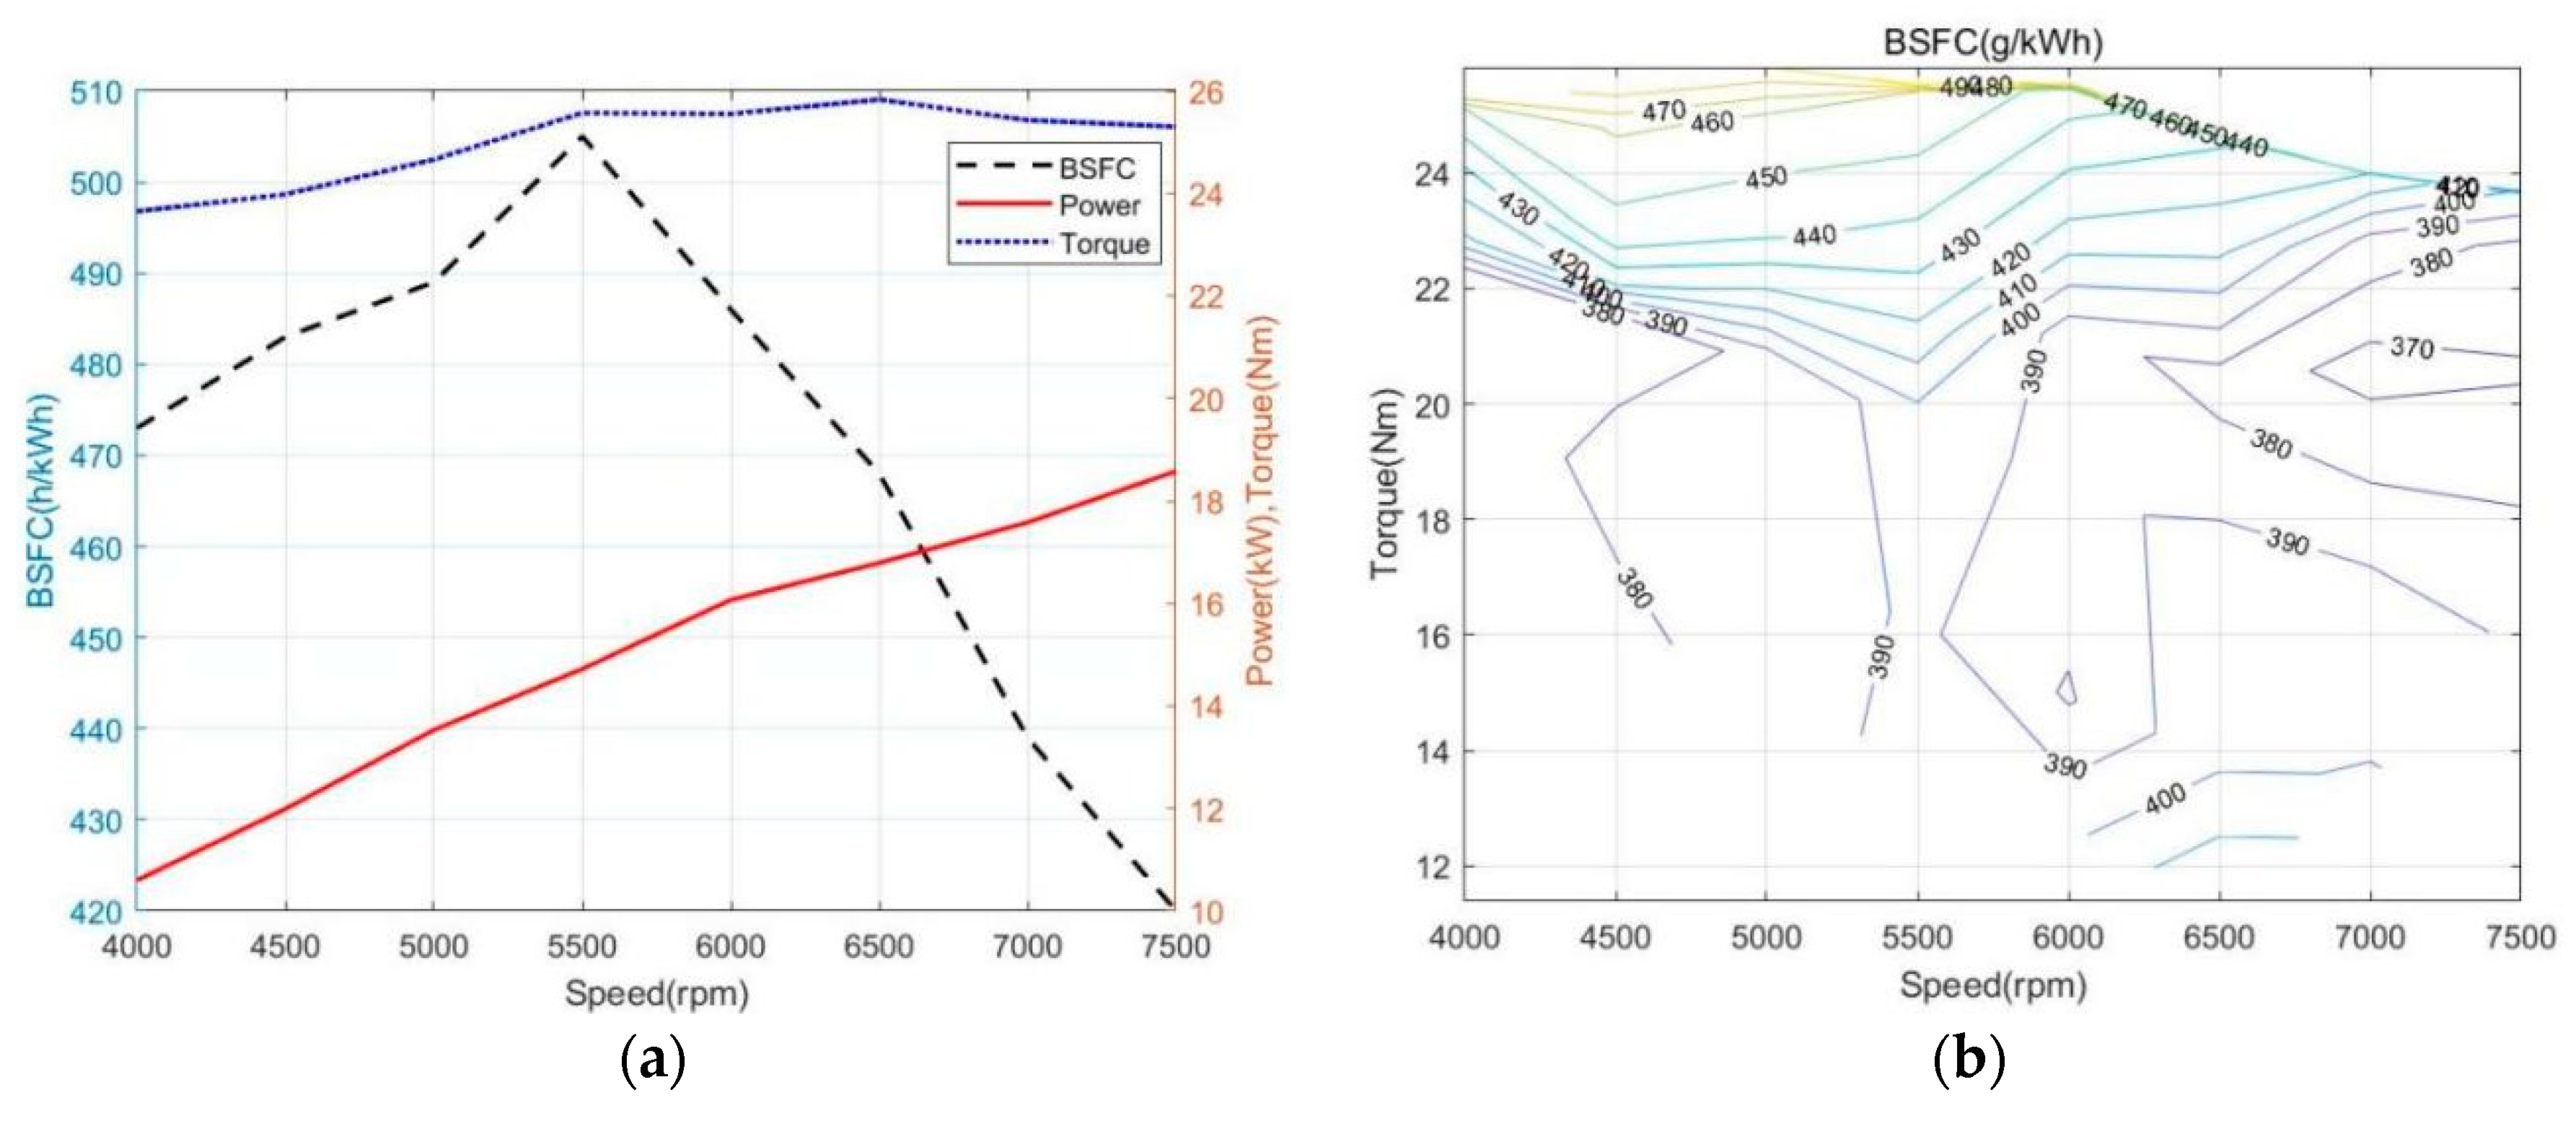
In a hybrid electric propulsion system, two or more power sources are combined to improve the efficiency of the aircraft. At present, there are various configurations of hybrid electric systems in use, the most common being the following three configurations: series, parallel and series–parallel. This paper adopts a series structure, which consists of ICE, generator, battery pack and motor. The structural layout is shown in Figure 4.
In the series structure, the ICE shaft is not directly connected to the propeller, but drives the generator to generate electricity, converts the mechanical energy output by the ICE into electrical energy and transmits the electricity to the motor, which drives the propeller to generate thrust. The excess power can be supplied to the battery pack by charging. At the same time, the battery pack can be used as a power supplement to provide high-power output for a short period of time. Therefore, the power variation can be smoothed by adjusting the output power of the battery pack so that the ICE can operate efficiently within its rated operating range, and in a series configuration, the ICE is not limited to a certain torque or rotational speed setting, which also makes power distribution easier.

2.3.2. ICE Model

In this study, only the power distribution is optimized to make the ICE work in the high-efficiency area to reduce the fuel consumption during flight, and the dynamic response mechanism of the ICE does not need to be considered. The rotational speed and torque are used as the model input, and the brake specific fuel consumption (BSFC) and the instantaneous fuel consumption rate are used as the output. The model is based on the Limbach L275EF two-stroke ICE shown in Figure 5 [18].
The ICE external characteristic curve and universal characteristic map diagram can be drawn from the experimental data, as shown in Figure 6.
The blue dotted line in Figure 6a represents the maximum torque (Nm) at current speed (rpm), which means the throttle valve opening is 90°. The red solid line and the black dashed line represent the power (kW) and BSFC (kg/kWh) under the current operating condition (speed, maximum torque), respectively. The numbers on the contour lines in Figure 6b represent the BSFC under the current operating condition (speed, torque). A two-dimensional look-up table function is established based on the test data, which can calculate the BSFC corresponding to any operating condition.

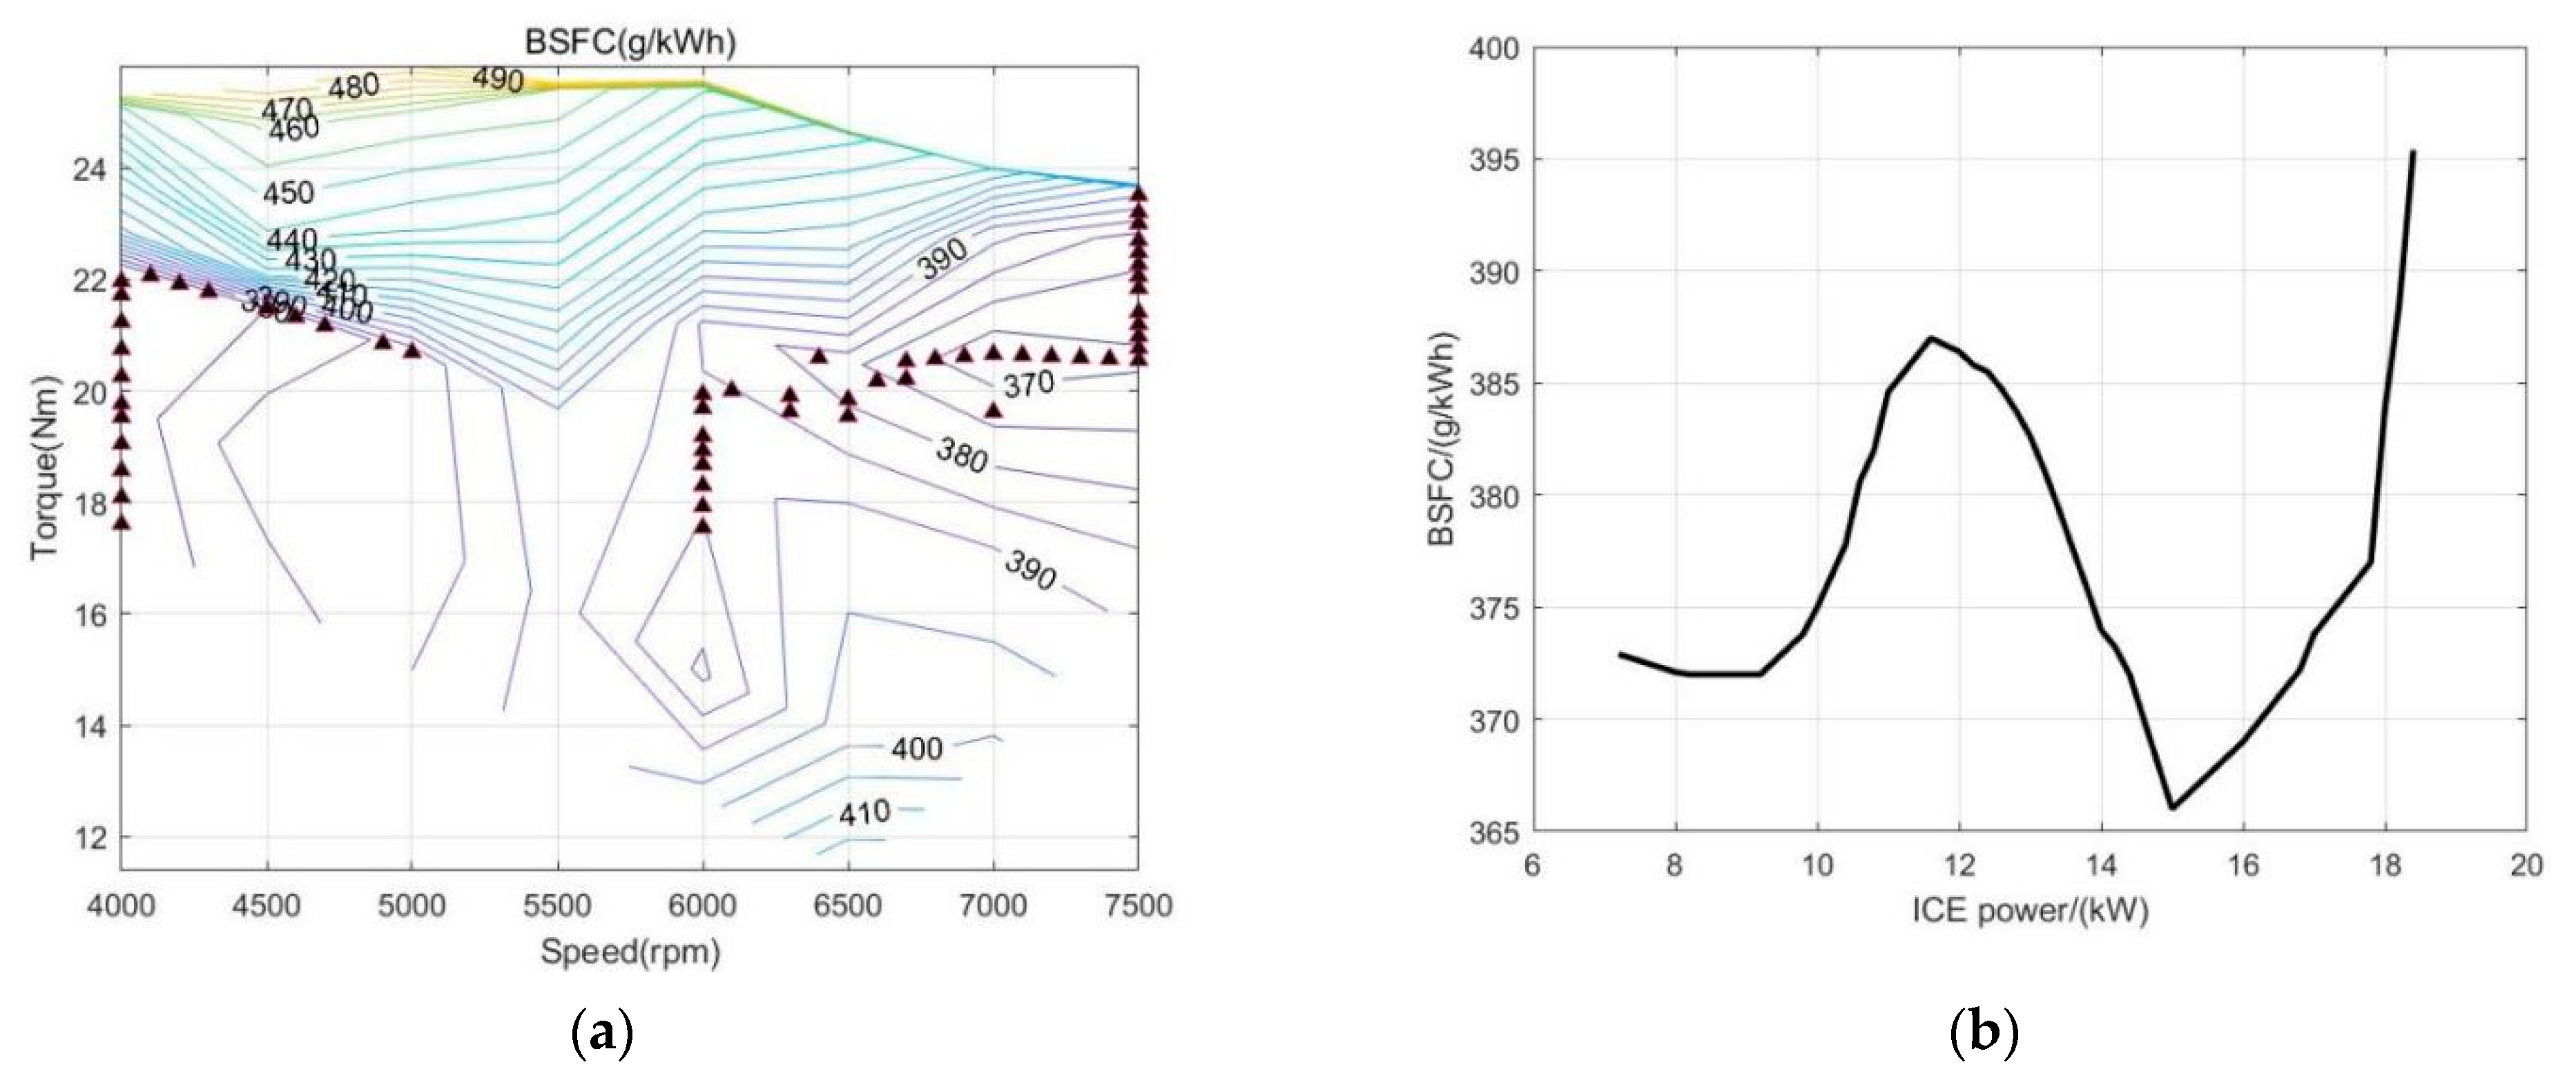
2.3.3. IOL Controller Model

It can be seen from Figure 5, that when the ICE outputs the same power at different speeds and torque, the BSFC is quite different. In the universal characteristic map, it can be seen that different torque points at the same speed or different speed points under the same torque have great differences in BSFC. It means that under the same output power, different operating points (speed, torque) correspond to different BSFC.
A major advantage of the series hybrid electric system is that the engine and the propeller are not mechanically connected, so the engine can run at different operating points at a certain output power. In order to make the engine work efficiently, the concept of ideal operating line (IOL), also known as e-line, is introduced, which is a line composed of optimal operating points corresponding to different output power values. These points represent the torque and speed combination corresponding to the minimum BSFC under steady state [19]. An optimization algorithm is used to search for the operating point (corresponding to torque and speed) that minimizes BSFC under different powers, as shown in Figure 7a. The optimal operating points under different powers are extracted, and the IOL of the engine can be drawn as shown in Figure 7b.
The black triangle in Figure 7a represents the optimal operating point obtained by the optimization algorithm, which corresponds to the determined power value. Figure 7b is the connection of the optimal operating point. It can be seen that when the output power of ICE is around 15 kW, the BSFC is the lowest and the efficiency is the highest, and the efficiency is also very high when it is between 7 and 10 kW, which provides a basis for subsequent energy management.
The controller model based on IOL is established, the input of the model is the output power allocated to the ICE by the EMS and the output corresponds to the speed and torque at the optimal operating point under this power. Therefore, through the IOL controller, the target output power can be converted into the optimal speed and torque, which can be used as the input of the ICE model, which not only makes the ICE more efficient but also simplifies the model.

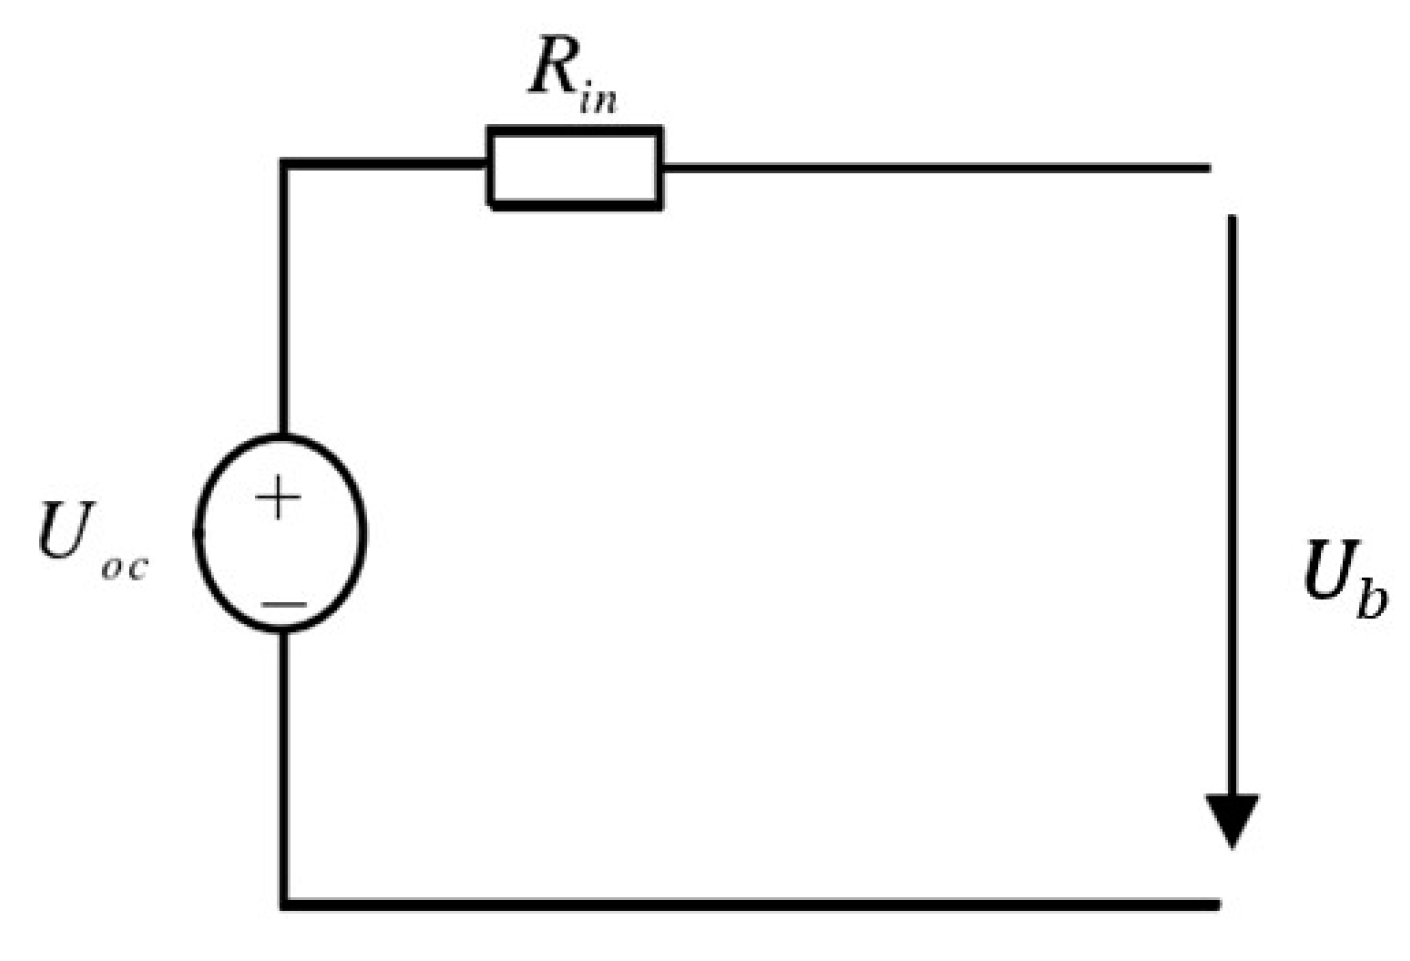
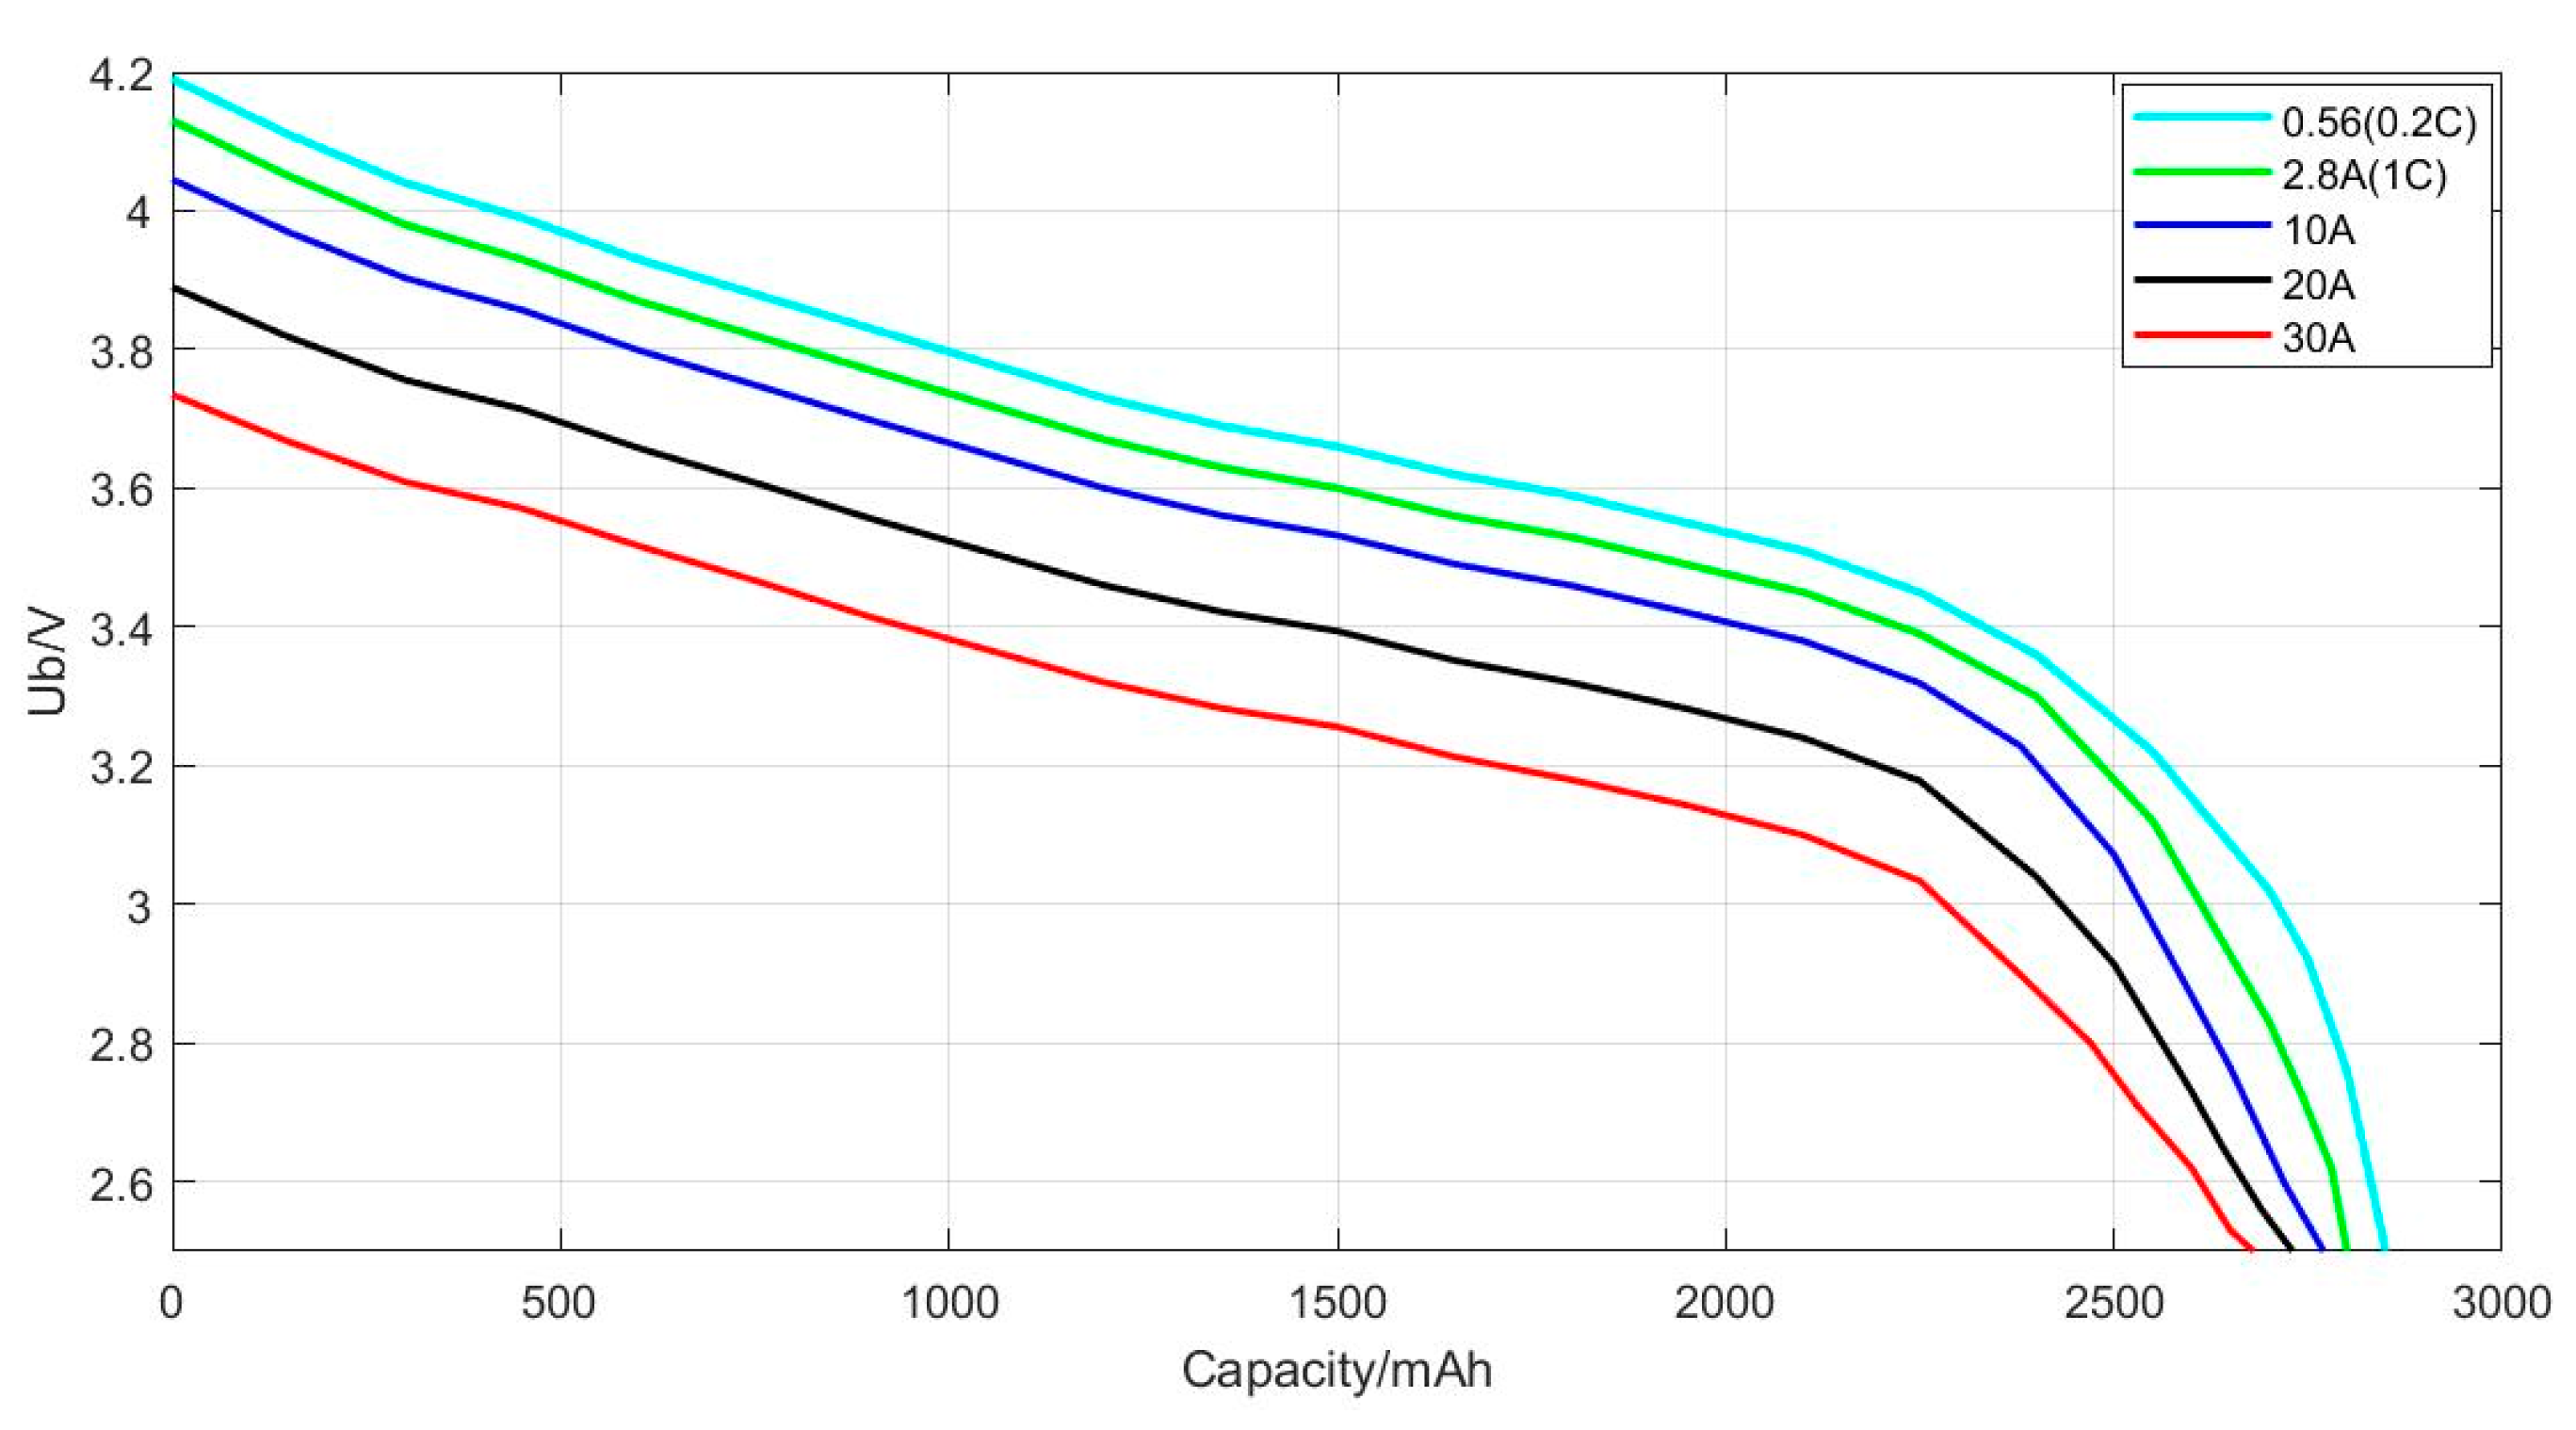
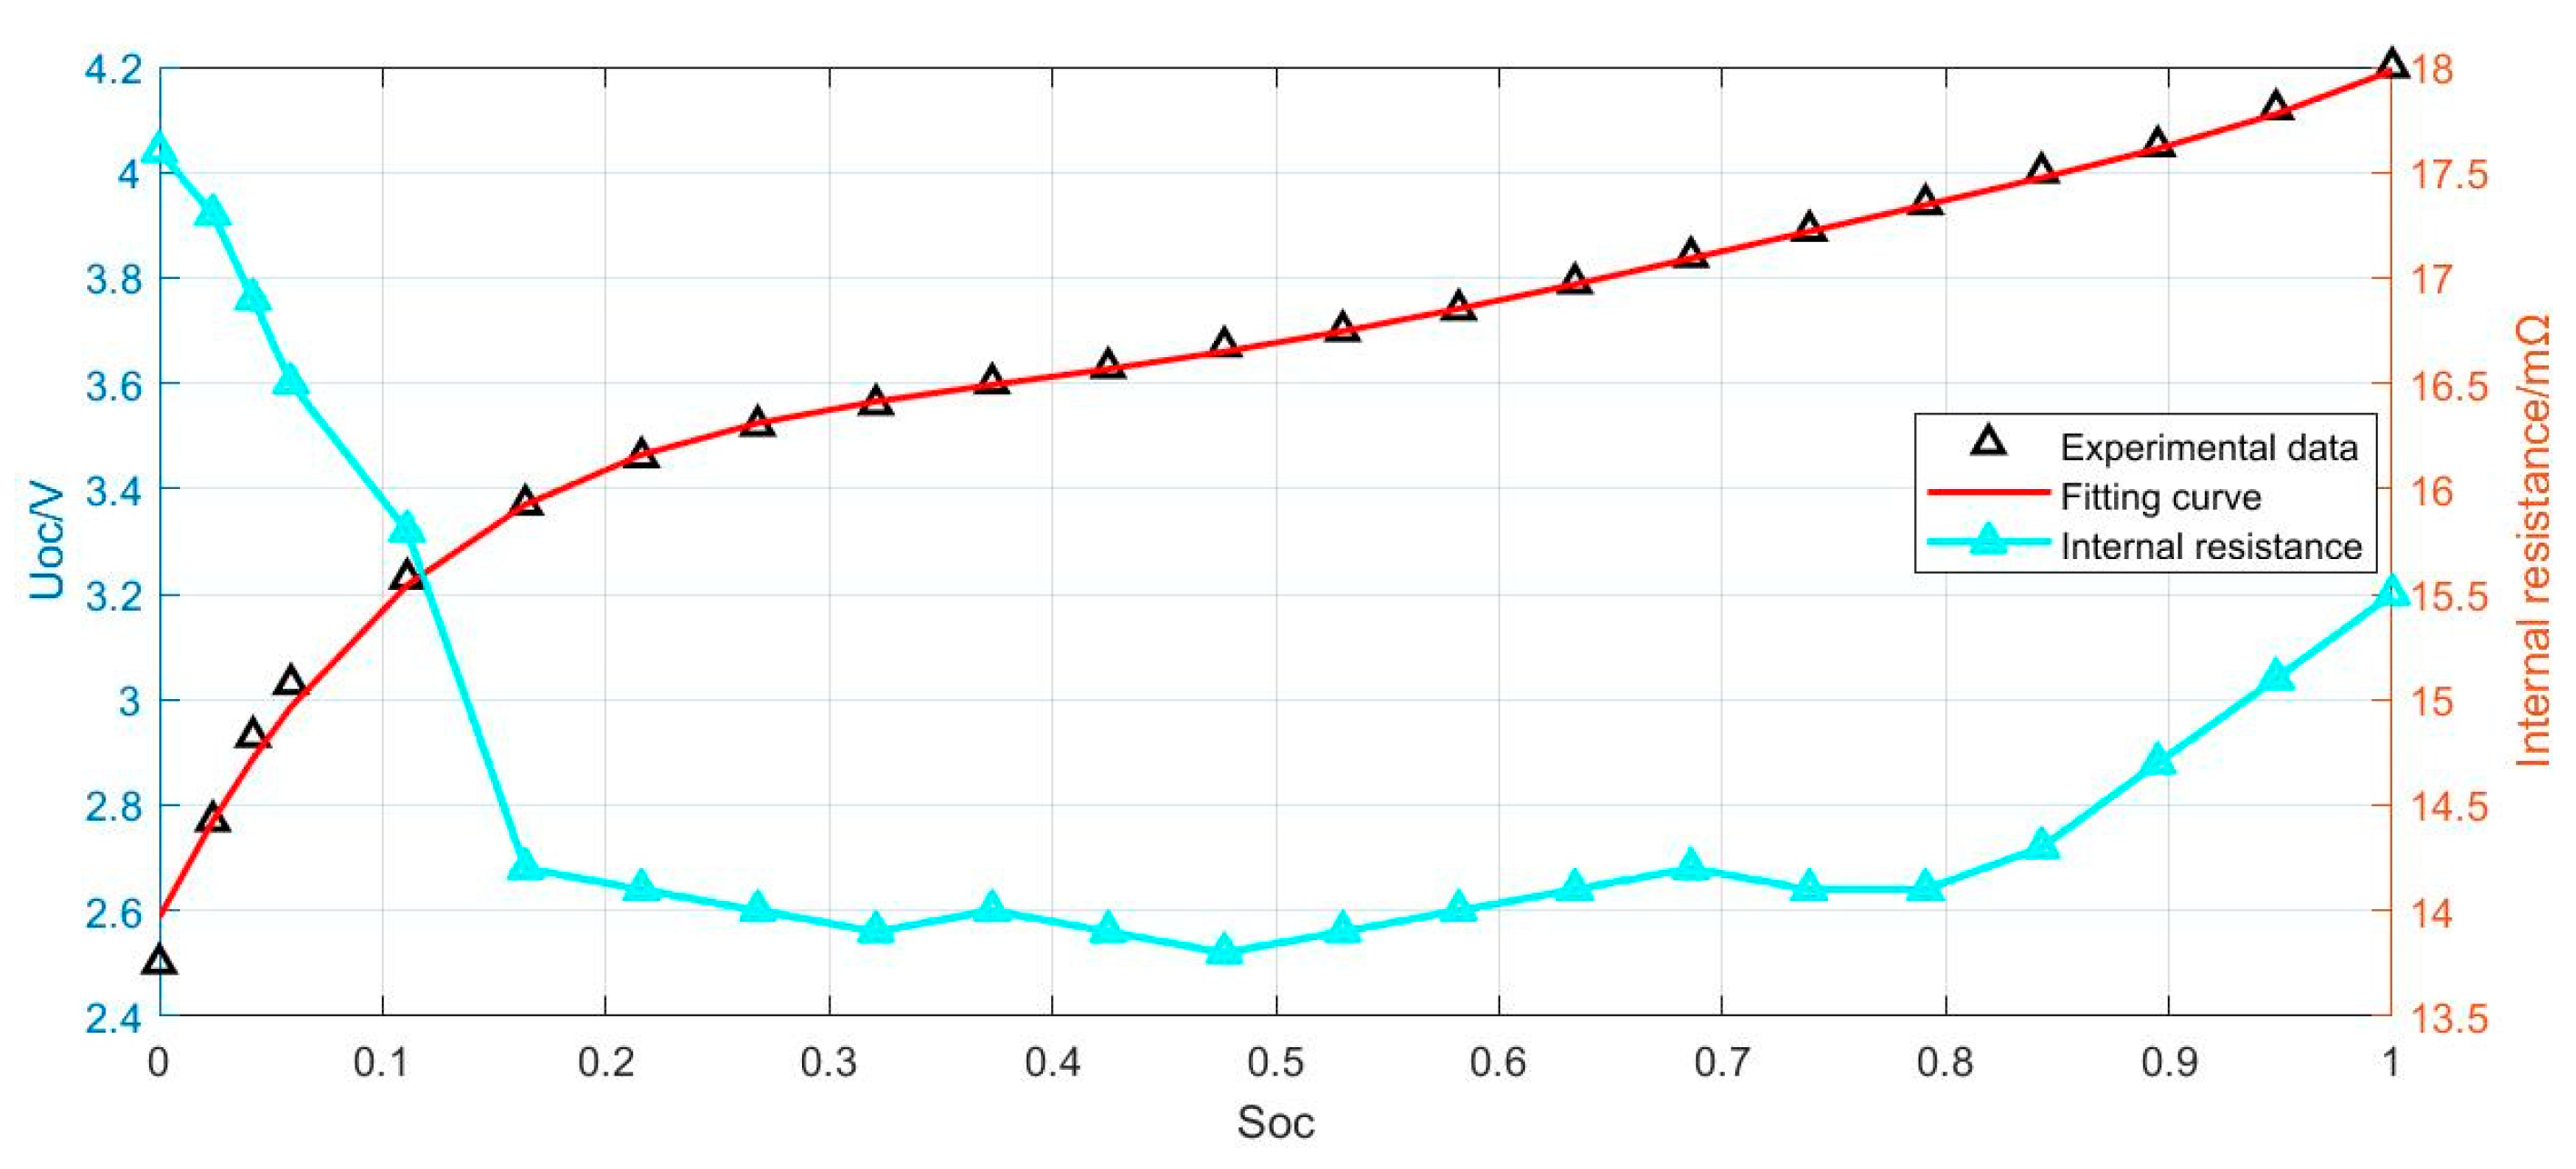
2.3.4. Battery Model

In this study, battery pack is used to store energy and quickly respond to demand power in the hybrid power system. The rechargeable characteristic enhances the utilization efficiency of ICE by storing the surplus energy when the power demand is low, which plays an important role affecting the performance and fuel economy of system. At present, the mainstream battery models include electrochemical model, empirical formula model, machine learning model, neural network model and equivalent circuit model. In this paper, the equivalent circuit model commonly used in engineering is adopted. The battery is equivalent to an ideal voltage source and an internal resistance in series [20], as shown in Figure 8. The circuit equation is seen as Equation (20)
{ U b = U o c I b R i n P b = U b I b
Uoc is the open circuit voltage of the battery, Ub is the terminal voltage of the battery, that is, the output voltage, and Rin is the internal resistance of battery. The most important parameter of the battery is the state of charge (SOC), which represents the battery state limited within [0, 1], where 1 indicates full charge and 0 means empty. There are various methods to estimate SOC, commonly used methods include open circuit voltage method, charge integration method, adaptive filtering method, machine learning method, etc. This paper focuses on the EMS, so the estimation of the SOC does not require high accuracy. Considering the feasibility of the method, the charge integration method is selected to estimate the SOC of the battery pack. The calculation formula is written as Equation (21)
S O C ( t ) = S O C 0 Δ Q Q b
SOC(t) is the SOC of the battery pack at the current moment, SOC0 is the SOC of the battery pack at the initial moment, Qb is the maximum charge capacity of the battery, namely, rated capacity (Ah), ΔQ represents the charge change, which can be depicted as Equation (22)
Δ Q = { 0 t I b η b d t , ( I b > 0 ) 0 t ( η b I b ) d t ( I b < 0 )
Ib is the output current of the battery, which is positive for discharging and negative for charging. ηb represents the charging and discharging efficiency of the battery, which can be measured experimentally. The battery open circuit voltage Uoc is a function of SOC and temperature. The effect of temperature is not considered in this paper, so the open circuit voltage can be expressed as Equation (23)
U o c = f ( S O C )
Molicel P28A 18650 lithium battery is adopted for the battery pack, which has a discharge rate of 12 C. The specific power and specific energy of the battery are very high, thus it is very suitable as a battery for a series hybrid system. The parameters of the single battery cell are shown in Table 2.
The discharge tests were carried out under different discharge currents (0.56 A (0.2 C), 2.8 A (1 C), 10 A, 20 A, 30 A). The cutoff voltage was 2.5 V, and the data of terminal voltage and discharge capacity of single cell were obtained, as shown in Figure 9.
It was found that the bigger the current, the bigger the voltage drop, which is caused by the battery internal resistance. Thus, the internal resistance can be calculated by the voltage drop and current increment. It was also found that with the increase in discharge current, the effective capacity of the battery will decrease, which is called Peukert effect [21].
The Peukert effect must be considered under high discharge rate [22]. In order to simulate the influence of Peukert effect and facilitate calculation, the concept of equivalent discharge current is introduced. It is considered that under different discharge currents, the battery capacity is constant (rated capacity), but the current is different. This method is beneficial to the use of charge integration method to calculate SOC. The calculation formula of equivalent current is as follows
I e f f = I ( I / I r ) p c 1
where Ieff represents the equivalent current, I is the actual discharge current, Ir is the rated current (the battery chosen in this paper is 0.56 A) and pc is the Peukert coefficient. After calculation, the Peukert coefficient of battery used in this paper is 1.015.
We tested the open circuit voltages corresponding to different SOC values, and performed polynomial fitting processing on the experimental data to obtain the function of the Uoc with SOC. Then we calculated the current Uoc according to the current SOC. The experimental data and the fitting curve are shown in Figure 10, the fitting function is addressed by Equation (24).
U o c = f ( S O C ) = 13.46 S O C 5 42.01 S O C 4 + 50.55 S O C 3 28.69 S O C 2 + 8.296 S O C + 2.587
In Figure 10, the black hollow triangles represent the experimental data, the red line represents the fitting curve and the blue solid triangles represent the internal resistance of the battery.
It can be seen that when the SOC of the battery is lower than 0.2, the open circuit voltage drops sharply, which makes the power system unable to operate stably, and it is not safe when the SOC is too low. However, when the SOC is higher than 0.8, the internal resistance is larger, which leads to a decrease in the charging and discharging efficiency. Therefore, the SOC value range of the battery is set to [0.2, 0.8]. According to the voltage requirements of the load equipment (motor) and the current constraints under high power, the battery pack adopts a design of 28 series and 4 parallel.
Combining Equations (21)–(26) can calculate the discharge current according to the output power allocated to the battery pack, and calculate the SOC of battery pack in real time through the charge integration method.

3. Energy Management Strategy

The purpose of the fuzzy logic control strategy developed in this paper is to make the ICE run efficiently by reasonably allocating the power output of the two energy sources in the series hybrid electric system based on the power requirement of the aircraft, so as to improve the fuel economy of the system and the range of the aircraft [23].
The energy management control logic of the hybrid electric system is shown in Figure 9. The power requirement of the aircraft, Preq, and the state of charge of the battery pack, SOC, are taken as the input variables of the fuzzy controller, and the output variable is the output power of the generator, Pgen. Preq is calculated by the current flight state of the aircraft, and the SOC is calculated by the charge integration method. After obtaining the value of the input variable, the fuzzy inference is carried out by the designed fuzzy controller, and the value of the output variable, Pgen, can be determined. The output power of the battery pack, Pbat, can be represented by the difference between Preq and Pgen.

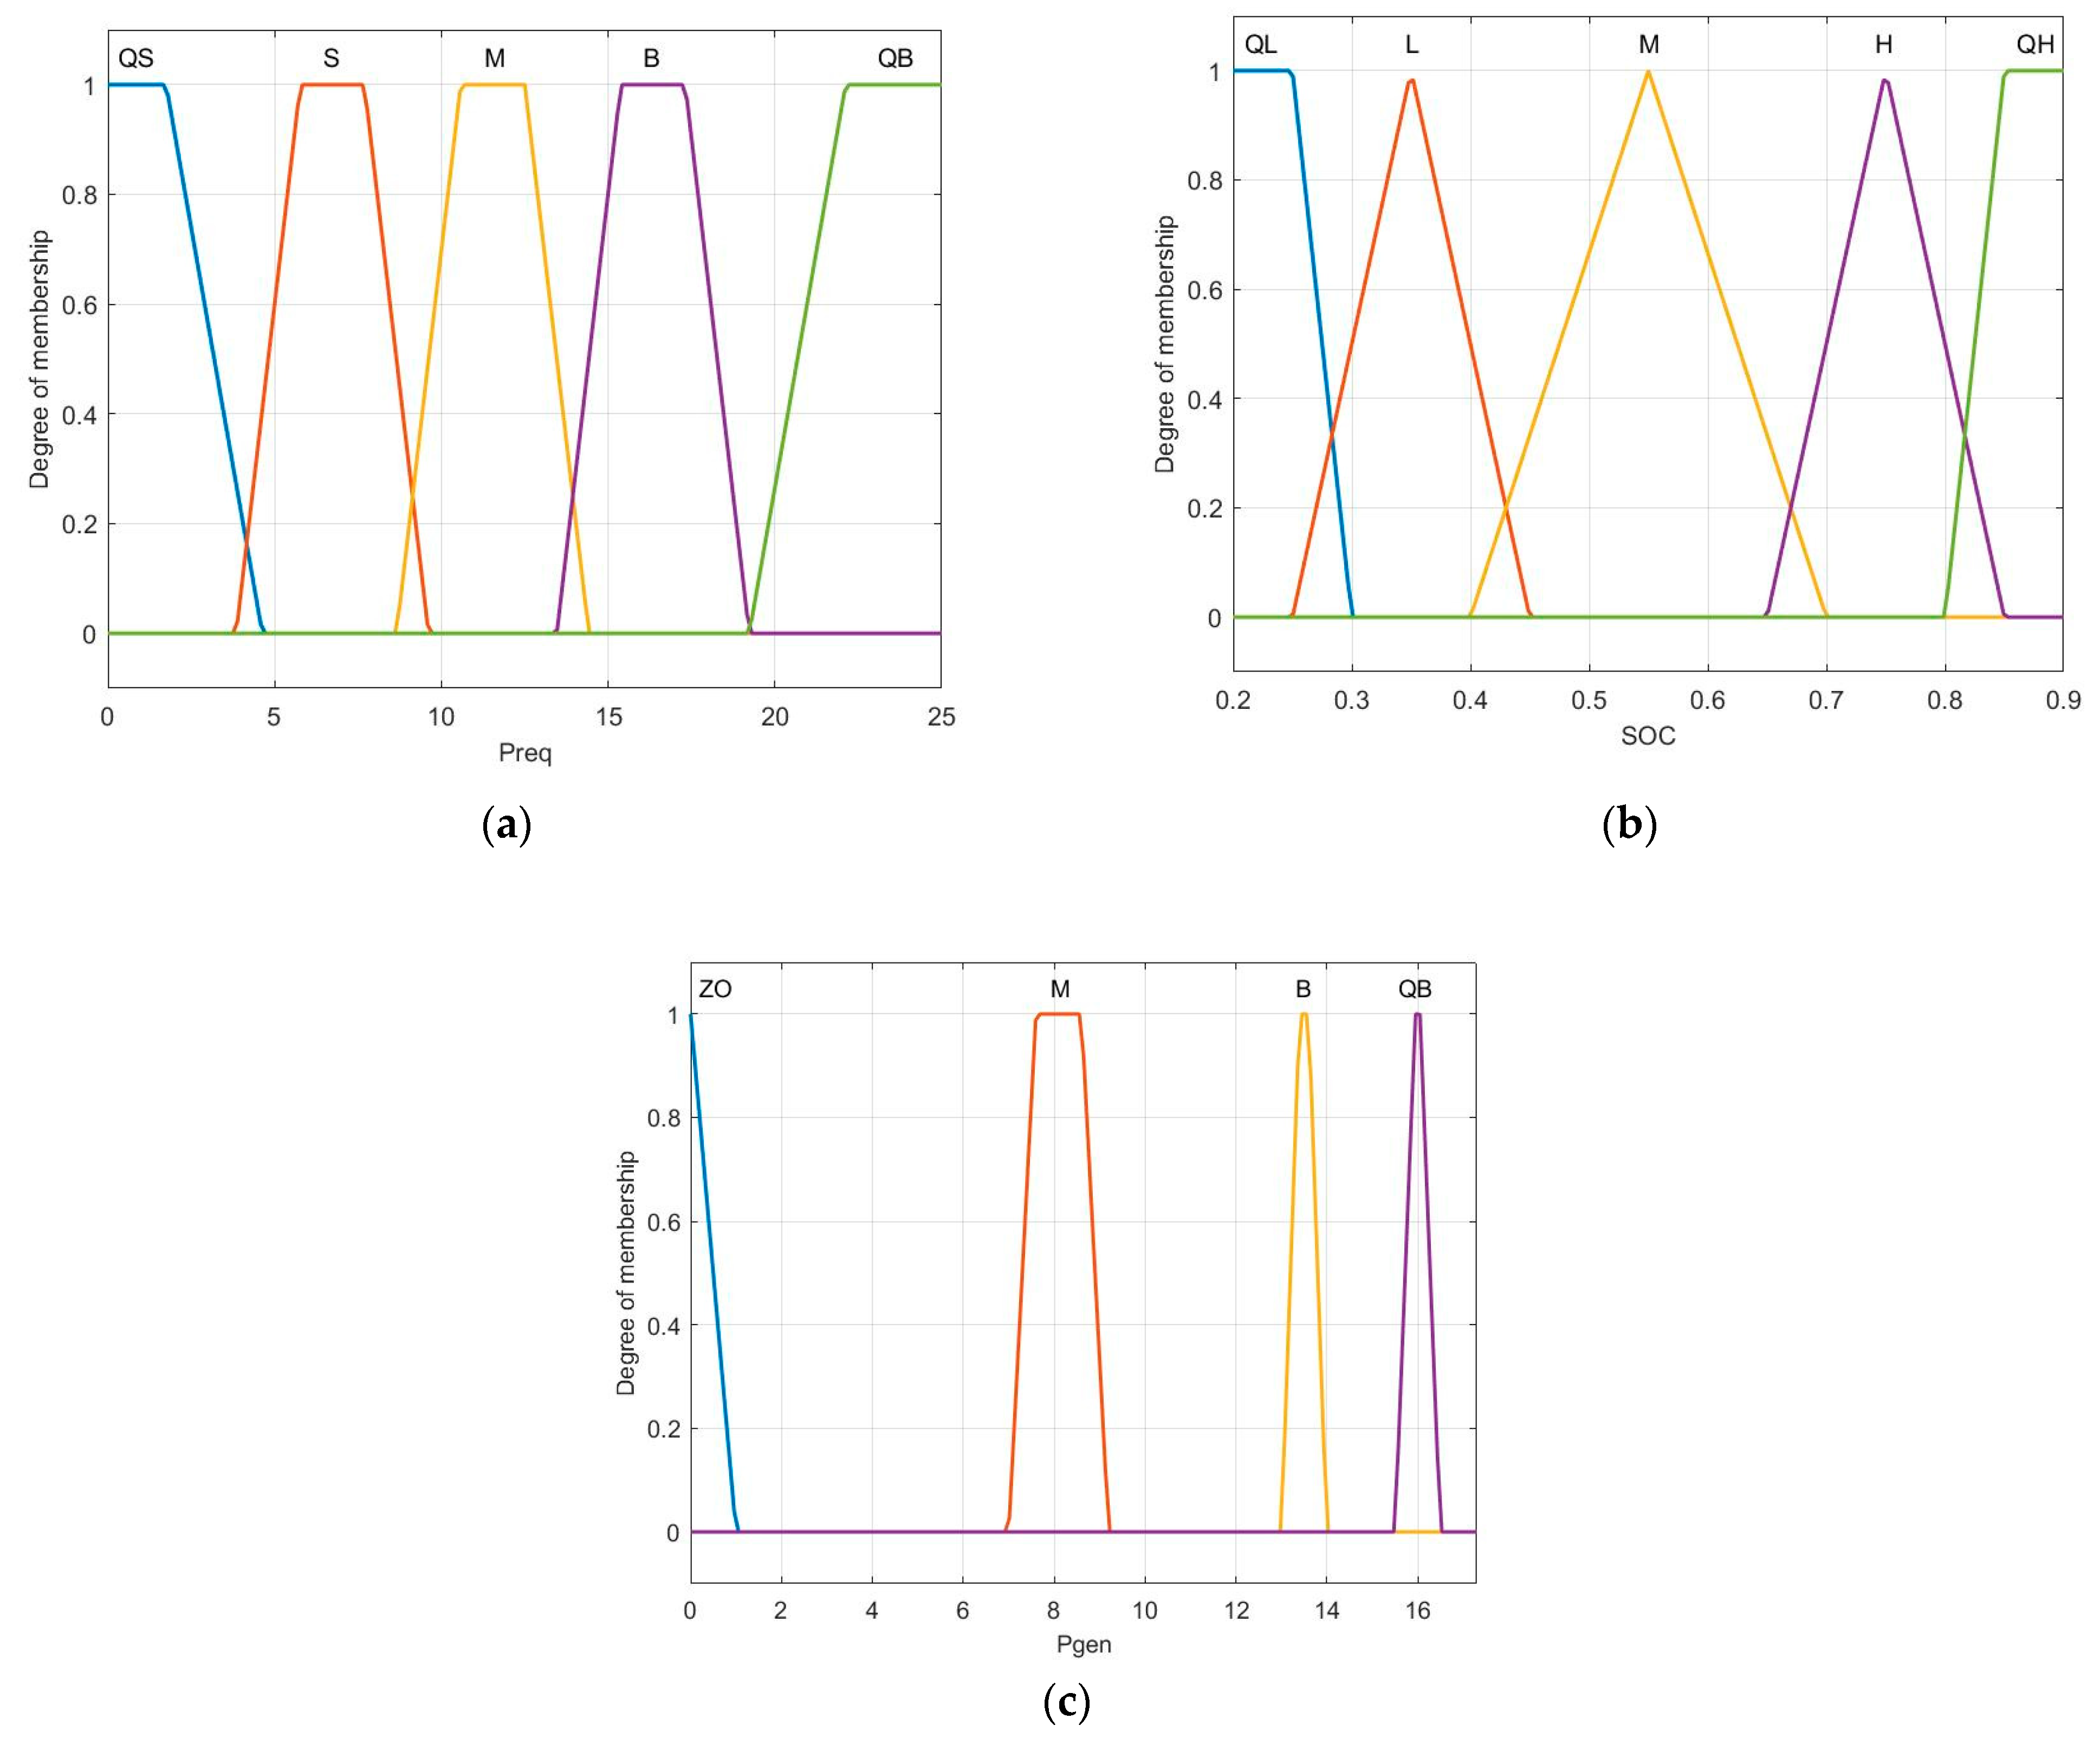
3.1. Membership Function Setting

According to the actual value range of the input and output variables of FLC and the control precision requirement of the fuzzy controller, the fuzzy subset and domain corresponding to each variable can be determined. In Section 2.2, the power requirement under the entire mission profile is preliminarily calculated: the minimum power is 1.5 kW, and the maximum power is 24.4 kW, so the range of Preq is set as [0, 25].
Since the flight process can be divided into five stages according to the required power: take-off and landing, transition, climbing, cruise and descent, the Preq is divided into five fuzzy subsets, quite small (QS), small (S), medium (M), large (B) and quite large (QB), namely {QS, S, M, B, QB}. Since the initial value of the SOC is 1 (it is fully charged before take-off), and the lower limit of the SOC is set to 0.2 in Section 2.3.4, the range of the input variable SOC is set to [0.2, 0.9]. It is also divided into five fuzzy subsets within its range, namely {QL, L, M, H, QH}.
For the output variable of the fuzzy controller, generator power, Pgen, its upper limit is determined by the maximum output power of the ICE and the generator efficiency. The maximum output power of the ICE and generator combination in this paper is 16.56 kW, and since the battery pack can be powered by itself, the ICE can be turned off, so its range is determined as [0, 17]. In order to improve the stability and dynamic performance of the aircraft power control system, four fuzzy subsets are set for the output variables, which are zero (ZO), medium (M), large (B) and end quite large (QB), i.e., {ZO, M, B, QB}. The fuzzy subsets and membership functions of each variable are shown in Figure 11.

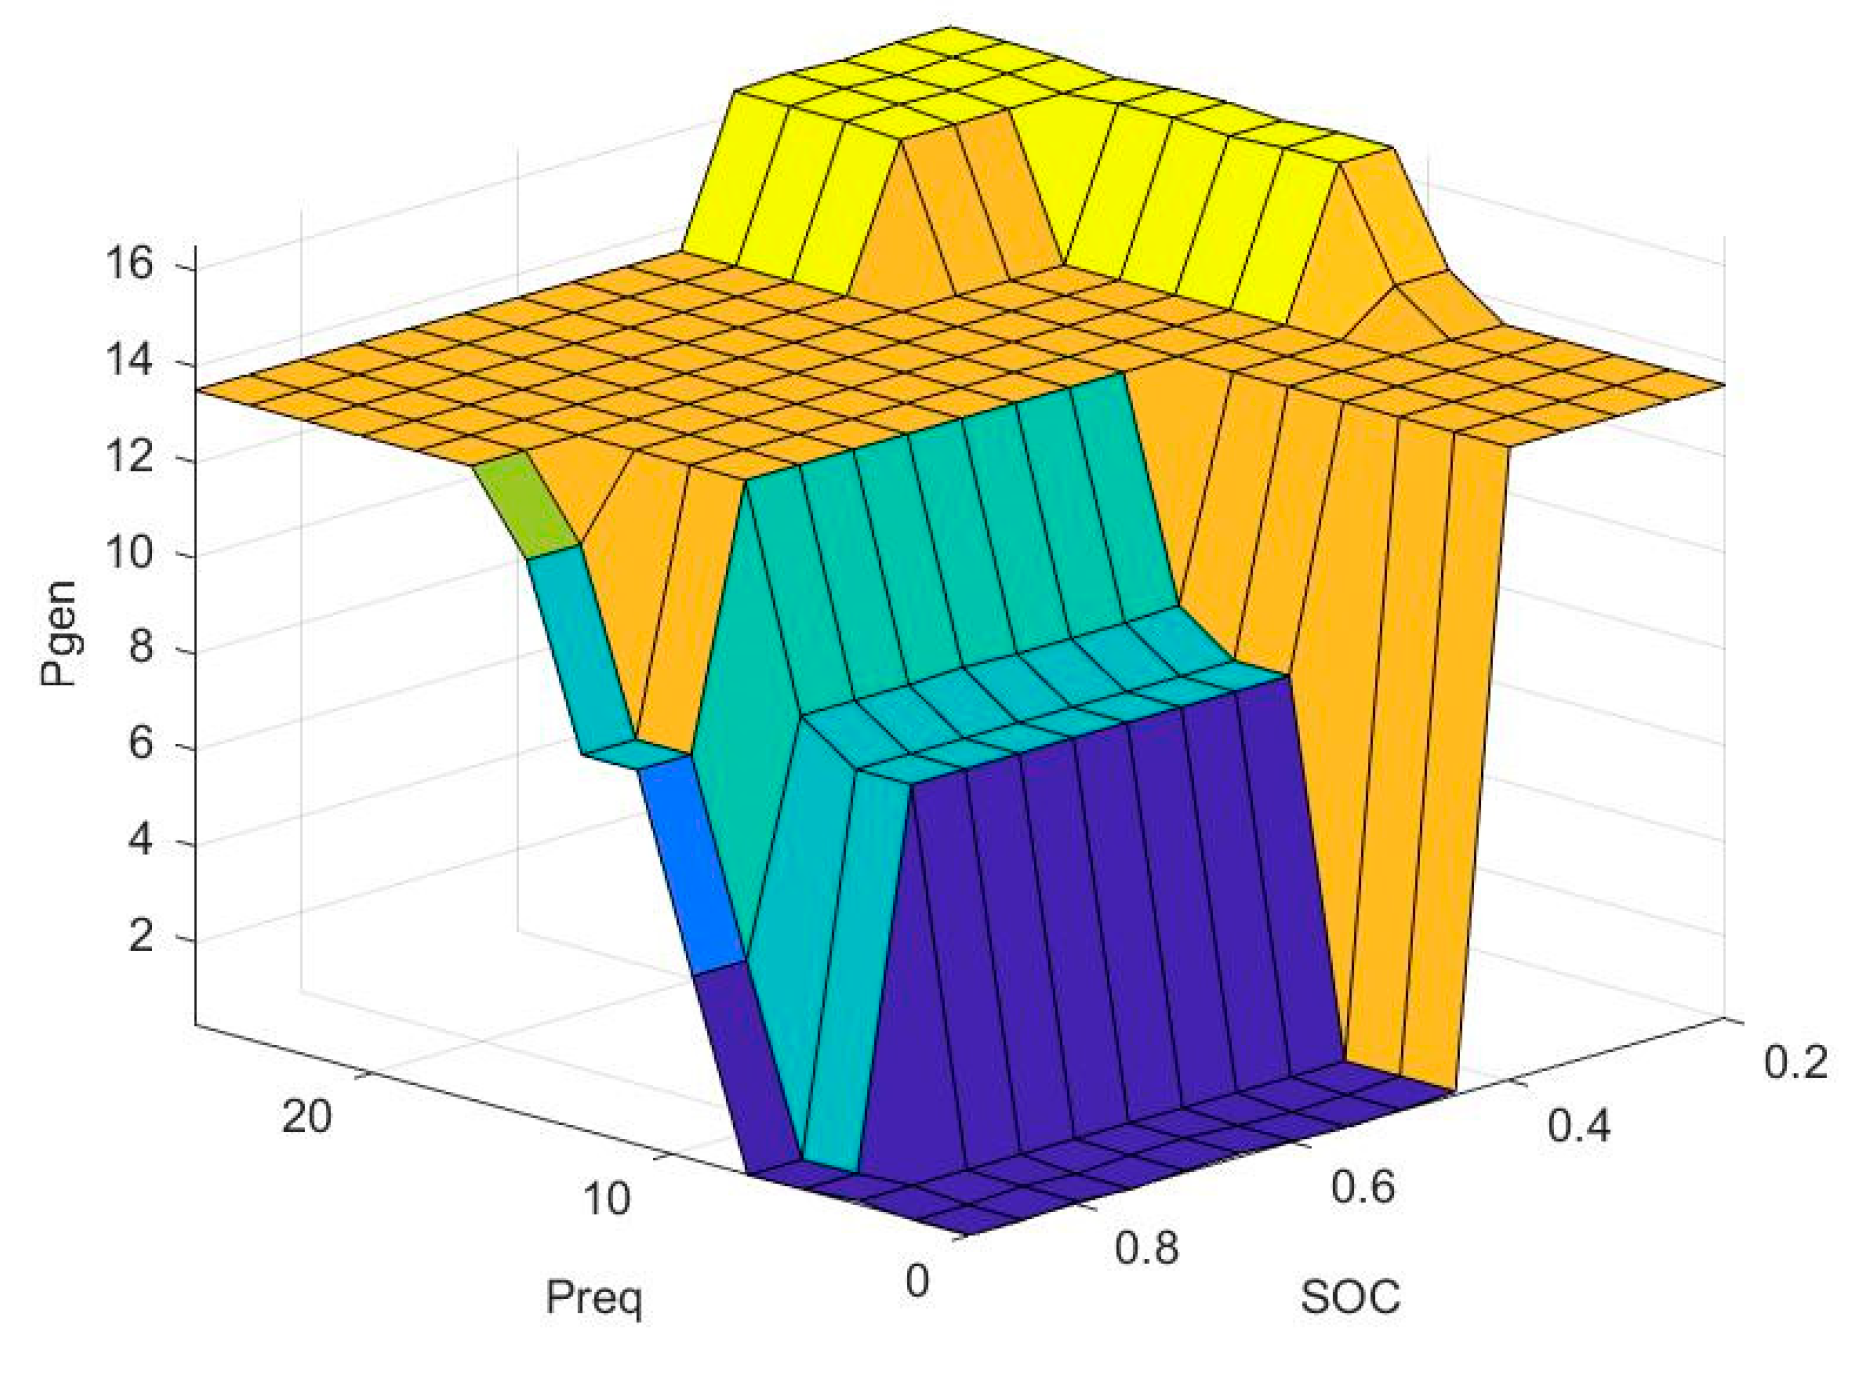
3.2. Fuzzy Logic Rule Setting

According to the mission profile and power requirements of the fixed-wing VTOL aircraft, the characteristics analysis of the hybrid electric system and reference from the existing research, and Combined with the fuzzy set and membership function, 25 fuzzy rules are formulated, the fuzzy control rule table is shown in Table 3, and the fuzzy inference surface is shown in Figure 12.

4. Simulation and Analysis
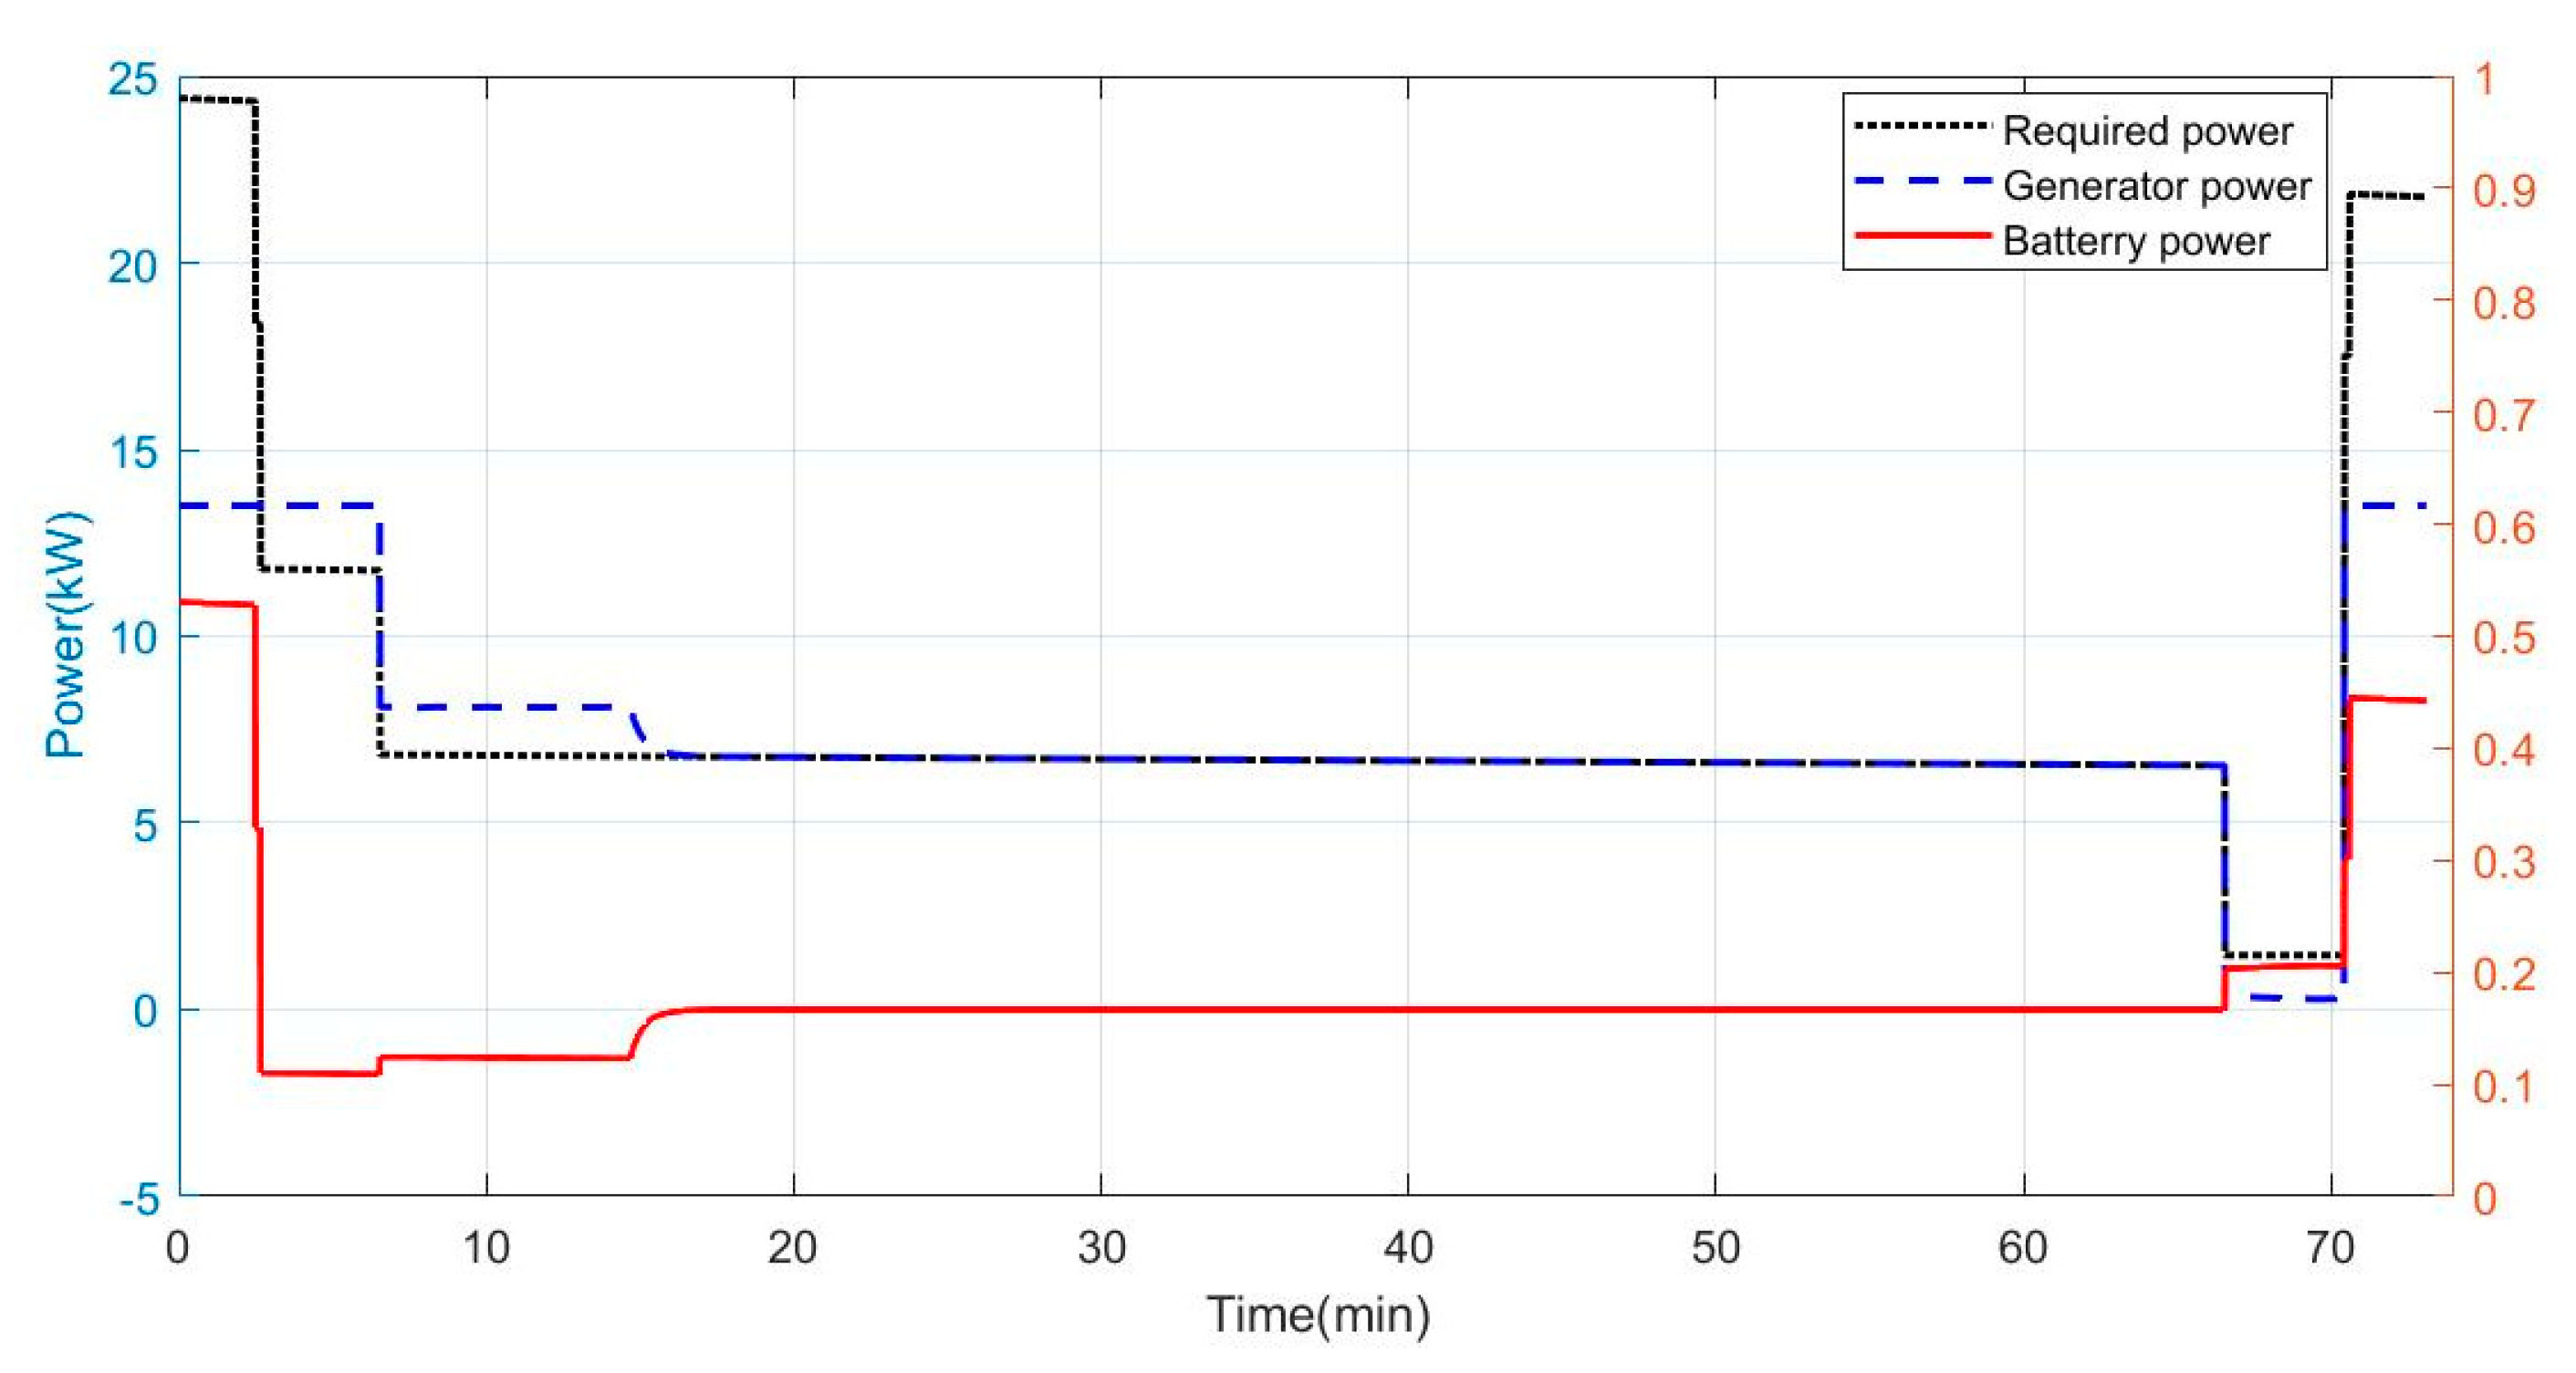
Based on the 100 kg scale VTOL aircraft mentioned in this paper, a series hybrid electric propulsion system was built. The parameters of each component are shown in Table 4.
Based on the model established in Section 2, the simulation modules were built in the environment of MATLAB/Simulink, and the EMS designed in this paper was used to optimize the energy management under the typical mission profile.
As a comparison, a rule-based EMS [24] that is commonly used in series hybrid electric aircraft was designed and simulated, which follows the following principles:
(1)
When the power requirement is greater than the maximum output power of the generator, the ICE outputs the maximum power, and the remaining power is supplemented by the battery pack.
(2)
When the power requirement is less than the maximum output power of the generator, the output power of the generator is equal to the power requirement of the aircraft.
(3)
After entering the cruise stage, the battery pack is charged, and the output power of the generator is equal to the sum of the power requirement of the aircraft and the charging power
The logic block diagram is shown in Figure 11. In this paper, a rule-based strategy (named RBS) and a rule-based strategy with IOL controller (named IOL-RBS) were designed for comparative analysis.
The IOL-based fuzzy logic control strategy (named IOL-FLCS) designed in this paper performed an online optimal allocation of the output power of the generator and the battery pack under the typical mission profile. The results are shown in Figure 13.
In the take-off stage, the power requirement is large, so the generator and the battery pack supply power together. At the beginning, due to the sufficient charge of the battery pack (SOC is 100% before take-off), the output power of the battery pack is about 11 kW, which enables the ICE to provide output at the rated power. As the battery continues to discharge, the SOC decreases. In order to avoid excessive discharge of the battery pack, the generator increases the output power to 15.2 kW, which is close to the maximum power. After entering the climbing stage, the power requirement of the aircraft drops to 11.8 kW. At the same time, the SOC of the battery pack drops to below 0.8 and needs to be charged. At this time, the power of the generator returns to the rated power (13.5 kW), and the battery pack is charged with a charging power of 1.7 kW while matching the power requirements of the aircraft.
After entering the cruise stage, the power requirement is further reduced, the output power of the generator is reduced to 8.1 kW and the battery pack is slowly charged with a charging power of 1.3 kW until the SOC reaches the preset upper limit value (0.8) and then stops charging; then the output power of the generator is reduced to the same as the power requirements of the aircraft. In the descent stage, due to the release of the gravitational potential energy of the aircraft, the power requirement is very small. It mainly relies on the battery pack to meet the power requirements. At this time, the ICE is in an idle state, and the output power of the generator is about 0.1 kW. During the landing stage, the generator output power is 15.2 kW, and the battery pack is used as a power supplement. After the mission is completed, the SOC of the battery pack is 0.37, which is higher than the preset lower limit value (0.2).
Figure 14 shows the output power of the ICE and SOC of the battery pack under the three energy management strategies, and Figure 15 shows the BSFC and fuel consumption of the ICE. Table 5 shows the results of IOL-RBS and IOL-FLCS and the comparison with the benchmark RBS in terms of fuel consumption. Since the final SOC of the three strategies is not exactly the same, a direct comparison of fuel consumption does not reflect which one is better in terms of fuel economy. Research [25] shows that the fuel consumption in HEPS should be considered to evaluate the equilibrium energy content of its energy storage devices. In this paper, the fuel consumption is corrected and the SOC is corrected to 50%, and the calculation formula is as follows:
Δ m f = ( 0.5 S O C f i n a l ) Q b U b η b η g e n 3600 B S F C ¯
where Δmf represents the fuel consumption increment corresponding to the corrected SOC, SOCfinal represents the SOC of the battery pack at the end of the flight and B S F C ¯ represents the average BSFC, taking the value of the cruise stage, 373 g/kWh.
Based on the given mission profile of a one-hour cruise flight, the total fuel consumption under IOL-RBS is 3.82 kg, while the total fuel consumption under the IOL-FLCS is 3.69 kg, and the fuel consumption saved is 2.8% and 5.85%, respectively, comparing with RBS (3.93 kg). The results show that the EMS based on IOL can significantly reduce fuel consumption. The introduction of fuzzy logic makes the ICE work at the high-efficiency operating point more by rationally allocating the power output of the generator and the battery pack, which further improves the fuel economy. Since the power change in the cruise stage is small, the fuel consumption under the two strategies is almost the same. If only the stages with obvious power changes such as take-off, landing and climb are considered, the fuel consumption under the two strategies is shown in Figure 16, and the comparison results are shown in Table 6.
The vertical line indicates that the battery pack is fully charged and the SOC reaches 0.8. Before the vertical line is the process of take-off, climb, and cruise charging, and after the vertical line is the landing stage. The fuel consumption of IOL-RBS is 1.534 kg, and the fuel consumption of IOL-FLCS is 1.453 kg, saving about 5.28%.
Xie et al. [9] conducted similar work: they studied the energy management strategy on a hybrid electric fixed-wing UAV and designed a fuzzy logic control strategy based on equivalent fuel consumption (F-ECMS). The results show that this strategy can achieve fuel saving, but the improvement is not significant compared with the optimization results of the equivalent fuel consumption strategy (ECMS). However, in this paper, fuzzy logic control is adopted to significantly reduce fuel consumption compared with the ordinary energy management strategy. The results show that the fuzzy logic control strategy designed in this paper can distribute the power output of the two energy sources more reasonably, thus improving the efficiency of the system.

5. Conclusions

In this paper, aimed at the power requirements of a 100 kg scale fixed-wing VTOL aircraft under a typical mission profile, the energy management optimization is carried out based on the series hybrid electric system, and an EMS combining an IOL controller and fuzzy logic control is proposed. Through numerical simulation, the following conclusions are drawn:
(1)
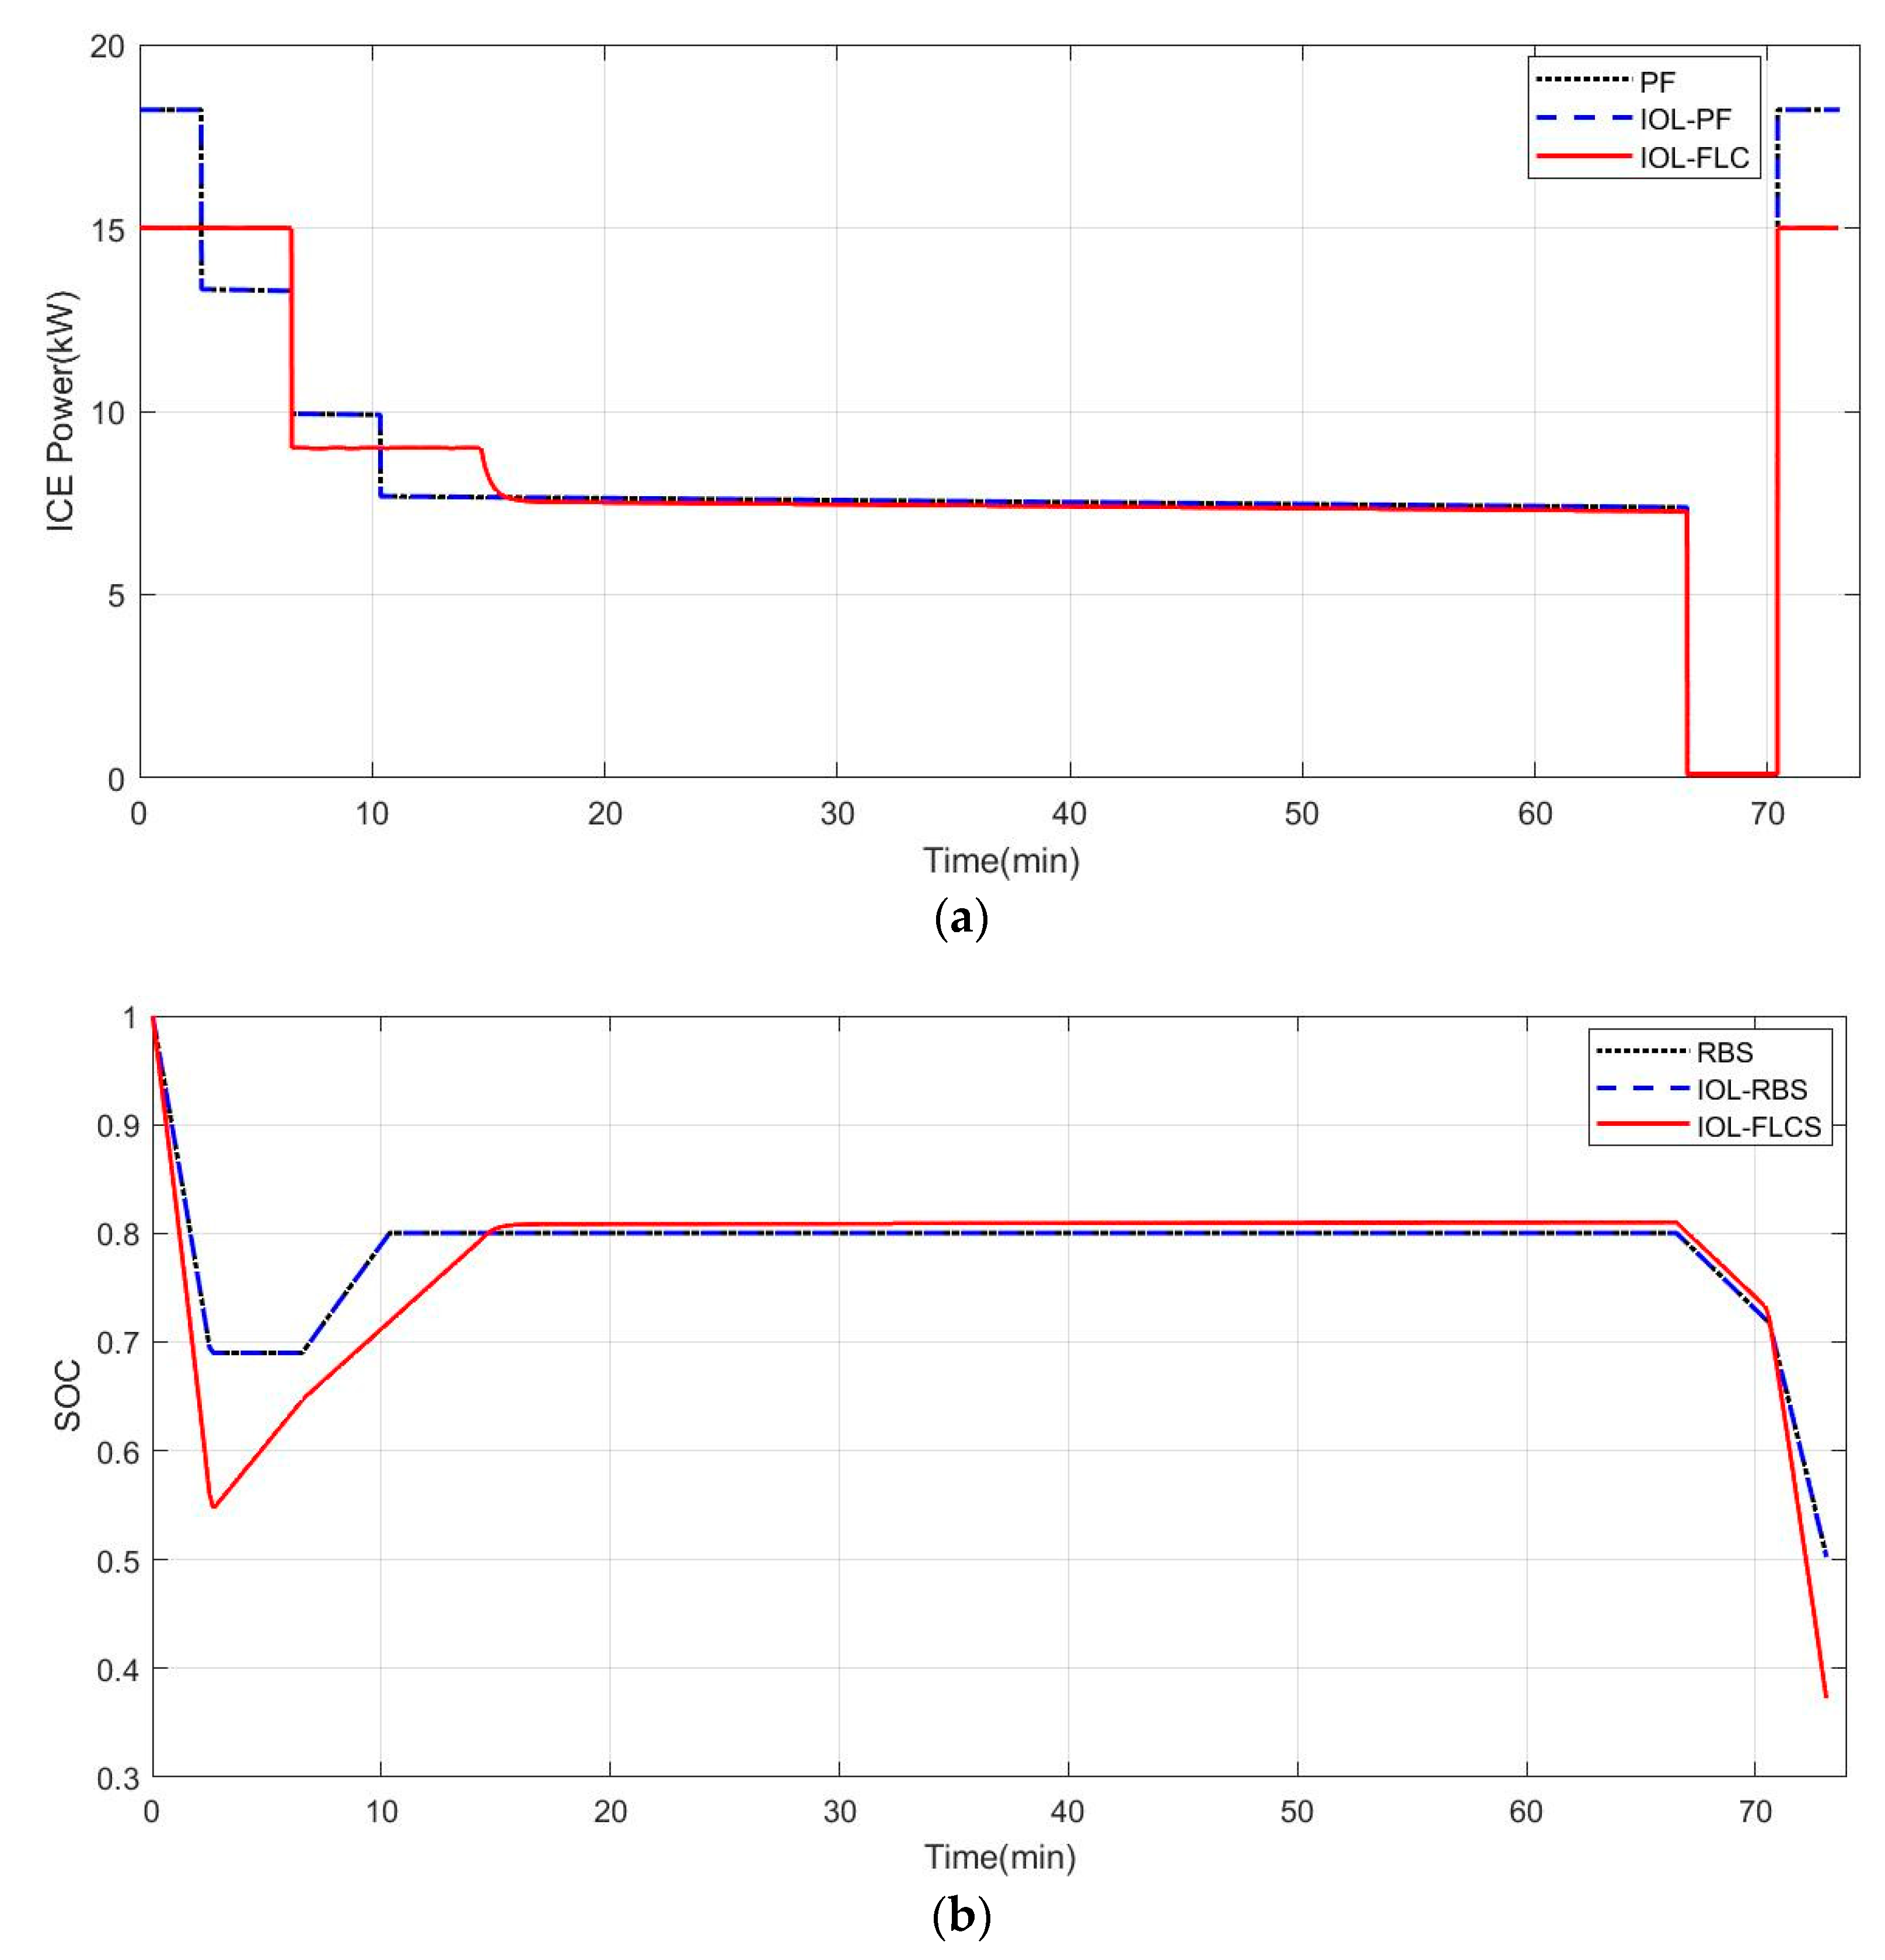
The fixed-wing VTOL aircraft has different working modes in different flight stages, resulting in a large jump in power requirements. The power of the VTOL stage is more than three times that of the cruise stage, while the power of the descent stage is only about a quarter of that in the cruise stage. The hybrid electric propulsion system combines the high specific energy and specific power of the battery, which can not only reduce the size of the ICE, but also improve the overall efficiency of the system by rationally allocating the output power of the two energy sources.
(2)
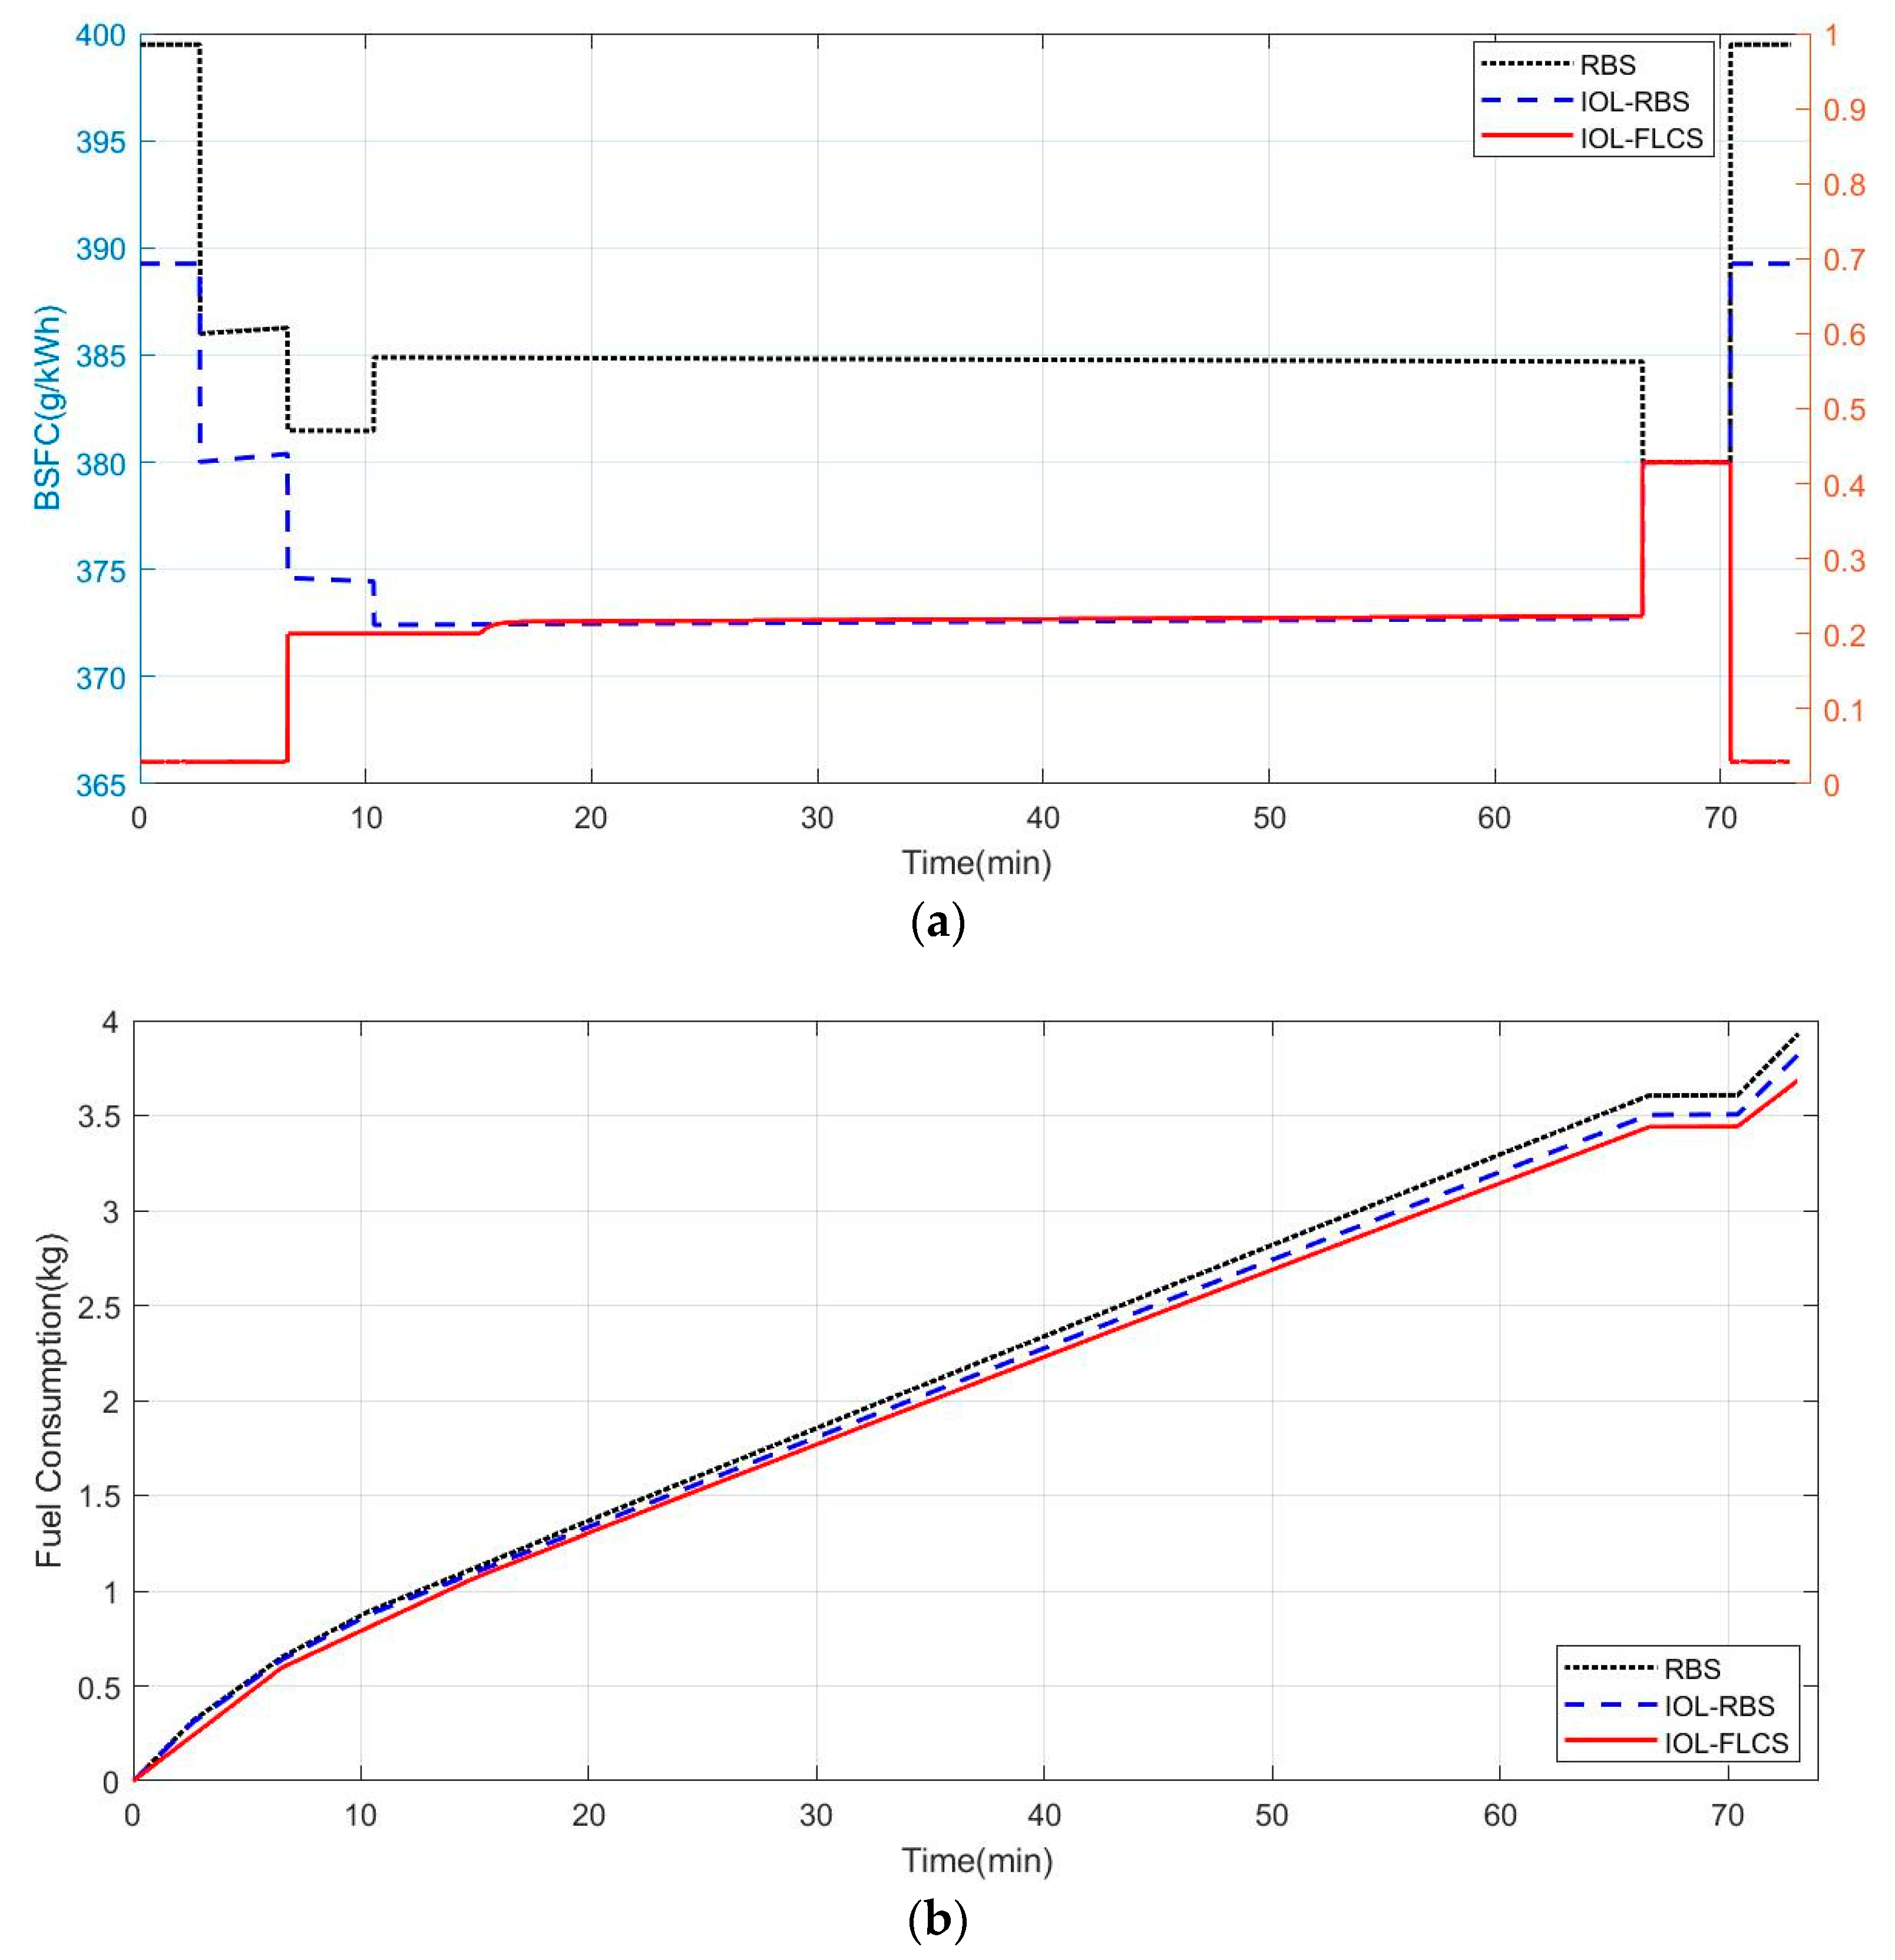
Combining the universal characteristic map of the ICE to find the ideal operating line, running the ICE based on the IOL can make the ICE work at the optimal operating point under the given output power, thereby improving the efficiency. Under the simulation conditions of this paper, the fuel consumption saved was 2.8%. After the introduction of the IOL, the flexible transformation between the output power and the operating point (torque, speed) of the ICE is realized, which is beneficial to the optimization of the energy management.
(3)
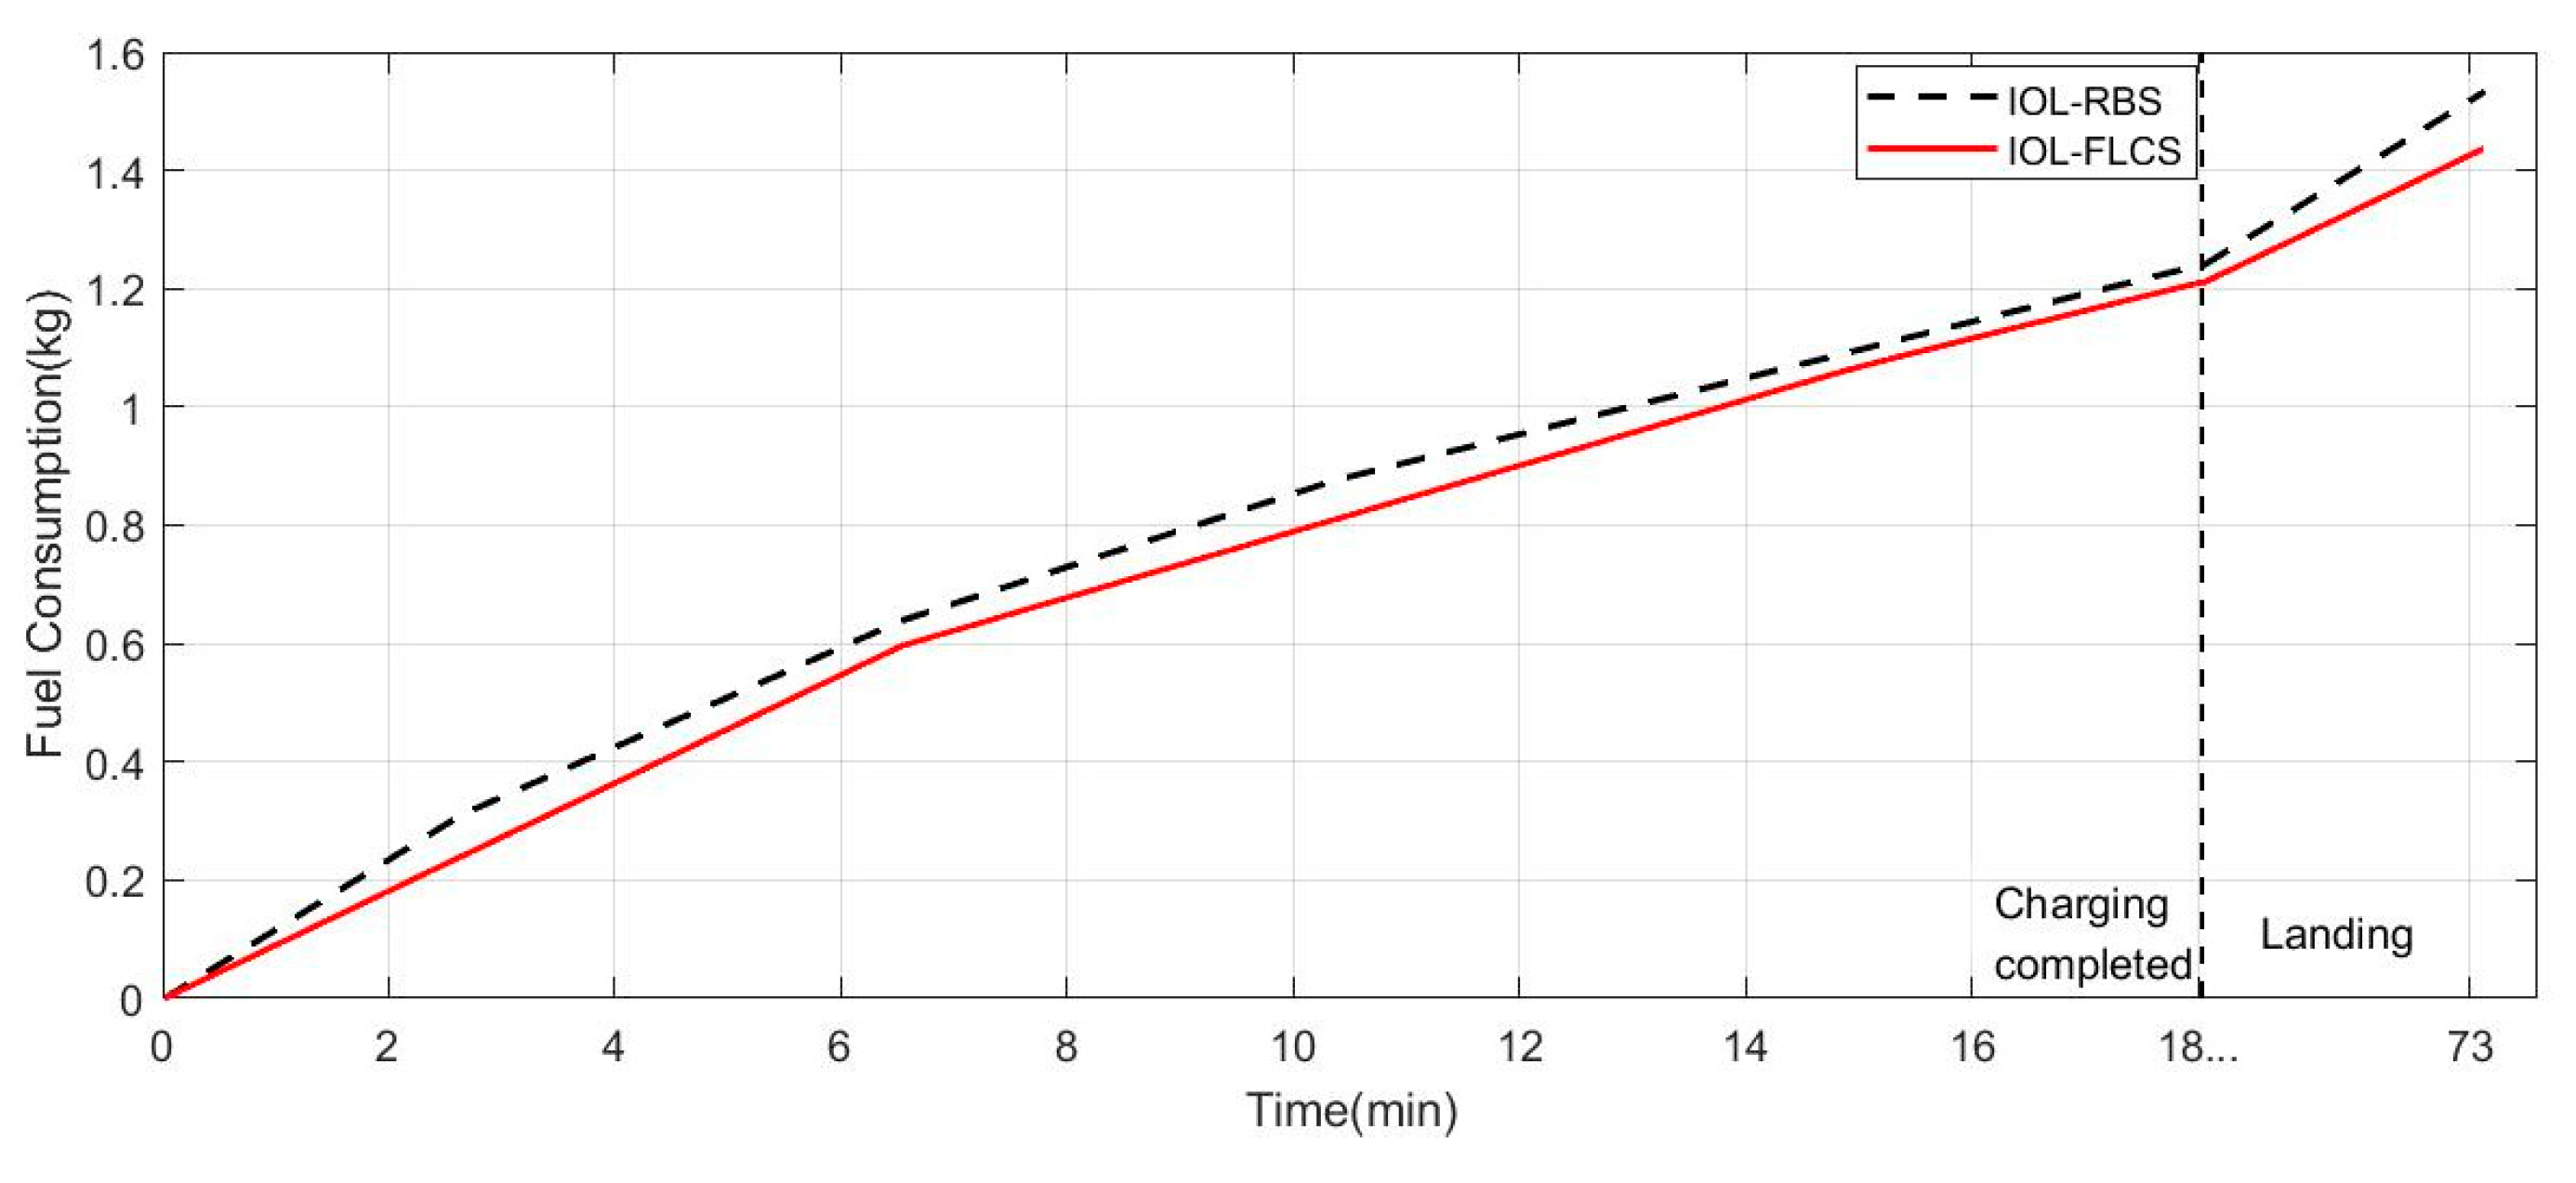
The EMS based on fuzzy logic is adopted, and the output power of the generator and the battery pack is dynamically and optimally allocated according to the power requirement of the aircraft and the SOC of the battery pack, so that the ICE works in the efficient operating area most of the time, thereby improving the fuel economy of the system and the range of the aircraft. Additionally, it is different from the dynamic programming strategy that needs to know the working conditions in advance; the EMS based on fuzzy logic can perform online optimal control under the condition of unknown working conditions.
In this paper, the design and simulation verification of an online energy optimization IOL-FLCS for a hybrid electric propulsion system of a fixed-wing VTOL aircraft are completed. Suggestions for future work are as follows:
(1)
The IOL-FLCS should be verified in the hardware system, combined with theoretical simulation data and experimental data to improve the practicability of the EMS.
(2)
An EMS can be established that comprehensively considers fuel consumption and emissions. This further study needs to be carried out based on the emission characteristic map of the ICE.

Author Contributions

Conceptualization, B.Z.; Data curation, Y.Z. and J.Z.; Formal analysis, Y.Z. and J.Z.; Funding acquisition, B.Z., X.Y. and Z.H.; Investigation, Y.Z.; Methodology, Y.Z., X.Y. and Z.H.; Software, Y.Z.; Supervision, B.Z.; Validation, Y.Z. and J.Z.; Visualization, B.Z.; Writing – original draft, Y.Z.; Writing – review & editing, B.Z., X.Y. and Z.H. All authors have read and agreed to the published version of the manuscript.

Funding

This work is supported by National Natural Science Foundation of China (52172410).

Acknowledgments

The authors wish to express their appreciation to the editors for their rigorous and efficient work and the reviewers for their helpful suggestions, which greatly improved the presentation of this paper.

Conflicts of Interest

The authors declare that they have no conflict of interest to report regarding the present study.

References

  1. Atluri, S.N. A Four-Node Hybrid Assumed-Strain Finite Element for Laminated Composite Plates. Tech Science Press: Henderson, NV, USA, 2004. [Google Scholar]
  2. Lenssen, R.H. Series Hybrid Electric Aircraft. Master’s Thesis, Delft University of Technology, Delft, Holland, 2016. [Google Scholar]
  3. Oelberg, E. A Hybrid Optimal Control Approach to Maximum Endurance of Aircraft. Master’s Thesis, The Department of Electrical and Computer Engineering, Concordia University, Montreal, QC, Canada, 2018. [Google Scholar]
  4. Friedrich, C.; Robertson, P.A. Design of hybrid-electric propulsion systems for light aircraft. In Proceedings of the 14th AIAA Aviation Technology, Integration, and Operations Conference, Atlanta, GA, USA, 16–20 June 2014. [Google Scholar]
  5. Riboldi, C.E.D. An optimal approach to the preliminary design of small hybrid-electric aircraft. Aerosp. Sci. Technol. 2018, 81, 14–31. [Google Scholar] [CrossRef]
  6. Li, S.; Gu, C.; Zhao, P.; Cheng, S. A novel hybrid propulsion system configuration and power distribution strategy for light electric aircraft. Energy Convers. Manag. 2021, 238, 114171. [Google Scholar] [CrossRef]
  7. Ji, Z.; Rokni, M.M.; Qin, J.; Zhang, S.; Dong, P. Energy and configuration management strategy for battery/fuel cell/jet engine hybrid propulsion and power systems on aircraft. Energy Convers. Manag. 2020, 225, 113393. [Google Scholar] [CrossRef]
  8. Hung, J.Y.; Gonzalez, L.F. On parallel hybrid-electric propulsion system for unmanned aerial vehicles. Prog. Aerosp. Sci. 2012, 51, 1–17. [Google Scholar] [CrossRef]
  9. Xie, Y.; Savvaris, A.; Tsourdos, A. Fuzzy logic based equivalent consumption optimization of a hybrid electric propulsion system for unmanned aerial vehicles. Aerosp. Sci. Technol. 2019, 85, 13–23. [Google Scholar] [CrossRef]
  10. Liu, W. Hybrid Electric Vehicle System Modeling and Control; John Wiley & Sons: Hoboken, NJ, USA, 2017; pp. 288–347. [Google Scholar] [CrossRef]
  11. Chen, G.; Ma, D.; Jia, Y.; Xia, X.; He, C. Comprehensive sizing and optimization method for series-hybrid unmanned convertiplane. Chin. J. Aeronaut. 2020, 34, 16. [Google Scholar] [CrossRef]
  12. Pulham, J. Designing unmanned aircraft systems: A comprehensive approach. Aeronaut. J. 2012, 116, 981–982. [Google Scholar] [CrossRef]
  13. Keith, J.; Hall, D. Rapid Sizing Methodologies for VTOL UAVs. In Proceedings of the AIAA Aerospace Sciences Meeting Including the New Horizons Forum & Aerospace Exposition, Orlando, FL, USA, 5–8 January 2009. [Google Scholar]
  14. Tyan, M.; Van Nguyen, N.; Kim, S.; Lee, J.W. Comprehensive preliminary sizing/resizing method for a fixed wing VTOL electric UAV. Aerosp. Sci. Technol. 2012, 71, 30–41. [Google Scholar] [CrossRef]
  15. Leishman, J.G. Principles of Helicopter Aerodynamics; Cambridge University Press: London, UK, 2002. [Google Scholar]
  16. Gao, X.Z.; Hou, Z.X.; Zheng, G.; Liu, J.X.; Chen, X.Q. Energy management strategy for solar-powered high-altitude long-endurance aircraft. Energy Convers. Manag. 2013, 70, 20–30. [Google Scholar] [CrossRef]
  17. Friedrich, C.; Robertson, P.A. Hybrid-Electric Propulsion for Aircraft. J. Aircr. 2015, 52, 176–189. [Google Scholar] [CrossRef]
  18. Available online: http://limbach.cn/ae/products/ICEs-15kw-40kw.html (accessed on 20 April 2022).
  19. Oudijk, M.F. Optimization of CVT Control: For Hybrid and Conventional Drive Lines. Master’s Thesis, Eindhoven University of Technology, Eindhoven, The Netherlands, University of California, Davis, CA, USA, 2005. [Google Scholar]
  20. Kermani, S.; Delprat, S.; Guerra, T.M.; Trigui, R. Real time control of hybrid electric vehicle on a prescribed road. IFAC Proc. Vol. 2008, 41, 3356–3361. [Google Scholar] [CrossRef]
  21. Peukert, W. Über die Abhängigkeit der Kapazität von der Entladestromstärke bei Bleiakkumulatoren. Elektrotechnische Z. 1897, 20, 20–21. [Google Scholar]
  22. Su, Y.; Liahng, H.; Wu, J. Multilevel Peukert equations based residual capacity estimation method for lead-acid batteries. In Proceedings of the IEEE International Conference on Sustainable Energy Technologies, Singapore, 24–27 November 2008; pp. 101–105. [Google Scholar]
  23. Dehesa, D.A.; Menon, S.K. Modeling of Hybrid-Electric Powertrain for Unmanned Aerial Systems. In Proceedings of the AIAA Propulsion and Energy 2019 Forum, Indianapolis, IN, USA, 19–22 August 2019. [Google Scholar]
  24. Wu, J.; Peng, J.; He, H.; Luo, J. Comparative Analysis on the Rule-based Control Strategy of Two Typical Hybrid Electric Vehicle Powertrain. Energy Procedia 2016, 104, 384–389. [Google Scholar] [CrossRef]
  25. Hou, C.; Ouyang, M.; Xu, L.; Wang, H. Approximate pontryagin minimum principle applied to the energy management of plug-in hybrid electric vehicles. Appl. Energy 2014, 115, 174–189. [Google Scholar] [CrossRef]
Figure 1. Fixed-wing VTOL aircraft.
Aerospace 09 00547 g001
Figure 2. Typical mission profile.
Aerospace 09 00547 g002
Figure 3. Power requirements under typical mission profile.
Aerospace 09 00547 g003
Figure 4. The structure of series hybrid electric propulsion system.
Aerospace 09 00547 g004
Figure 5. Limbach L275EF two-stroke ICE.
Aerospace 09 00547 g005
Figure 6. ICE characteristic. (a) ICE external characteristic. (b) Universal characteristic map.
Aerospace 09 00547 g006
Figure 7. Ideal operating line of Limbach L275EF. (a) Search for the optimal opera point. (b) Minimum BSFC @ different power.
Aerospace 09 00547 g007
Figure 8. Equivalent circuit model of battery.
Aerospace 09 00547 g008
Figure 9. Discharge tests under different discharge currents.
Aerospace 09 00547 g009
Figure 10. Relationship between open circuit voltage and SOC.
Aerospace 09 00547 g010
Figure 11. Degree of membership for fuzzy variables. (a) Degree of membership for Preq. (b) Degree of membership for SOC. (c) Degree of membership for Pgen.
Aerospace 09 00547 g011
Figure 12. Fuzzy inference surface.
Aerospace 09 00547 g012
Figure 13. Optimization result under IOL−FLCS.
Aerospace 09 00547 g013
Figure 14. Operating condition comparison between RBS, IOL-RBS and IOL-FLCS. (a) ICE power comparison between RBS, IOL-RBS and IOL-FLCS. (b) SOC comparison between RBS, IOL-RBS and IOL-FLCS.
Aerospace 09 00547 g014
Figure 15. Comparison between RBS, IOL-RBS and IOL-FLCS including BSFC and fuel consumption. (a) BSFC comparison between RBS, IOL-RBS and IOL-FLCS. (b) Fuel consumption comparison between RBS, IOL-RBS and IOL-FLCS.
Aerospace 09 00547 g015
Figure 16. Comparison between IOL-RBS and IOL-FLCS (excluding cruise stage).
Aerospace 09 00547 g016
Table 1. The design parameters of aircraft.
ParametersValue
Total weight12VTOL rate2 m/s
Wingspan4.0 mClimbing/Descent rate3 m/s
Wing area2.5 m2VTOL altitude300 m
Cruise lift coefficient0.44Cruise altitude1000 m
Cruise drag coefficient0.03Propeller efficiency65%
Cruise lift–drag ratio10Motor efficiency85%
Table 2. The parameters of Molicel P28A 18650 lithium battery.
ParametersValue
Capacity2800 mAhInternal resistance14 mΩ
Maximum charge current6 AMass46 g
Maximum discharge current35 AEnergy density220 Wh/kg
Rated voltage3.6 VPower density2739 W/kg
Cutoff voltage2.5 V
Table 3. Fuzzy logic control rule table.
PreqSOC
QLLMHQH
QSBBZOZOZO
SBBMMZO
MQBBBBM
BQBQBBBB
QBQBQBBBB
Table 4. Component parameters of hybrid electric system.
ComponentsParametersValue
ICEMaximum power18.5 kW
@7500 rpm
GeneratorEfficiency93%Battery packRated Voltage100 V
Rated power15 kW
@7000 rpm
Rated voltage110 VCapacity11.2 Ah
Maximum speed7500 rpmRectifier efficiency95%Maximum discharge/charge current140 A/24 A
Mass7 kgMass4.2 kgMass (including BMS)5.6 kg
Table 5. Comparison between RBS, IOL-RBS and IOL-FLCS.
RBSIOL
IOL-RBSIOL-FLCS
Original SOC (%)100100100
Final SOC (%)0.500.500.37
Fuel consumption (kg)3.933.823.69
Corrected SOC (%)505050
Corrected fuel consumption (kg)3.933.823.70
Fuel saving (%)2.805.85
Table 6. Comparison between IOL-RBS and IOL-FLCS.
IOL-RBSIOL-FLCS
Original SOC (%)100100
Final SOC (%)5037
Fuel consumption (kg)1.5341.438
Corrected final SOC (%)5050
Corrected fuel consumption (kg)1.5341.453
Fuel saving (%)-5.28
Publisher’s Note: MDPI stays neutral with regard to jurisdictional claims in published maps and institutional affiliations.

