
Aerodynamic Design, Analysis and Validation of a Small Blended-Wing-Body Unmanned Aerial Vehicle

Abstract
:1. Introduction
2. Design Methods under DEP Considerations
2.1. DEP Considerations and Simplification
2.2. Sectional Airfoil Parameterization
2.2.1. Planar Segment Parameterization (PSA-PSB)
2.2.2. Fictitious Airfoil Parameterization (LE-PSA and LE-TE)
2.2.3. Rear Curve Parameterization (PSB-TE)
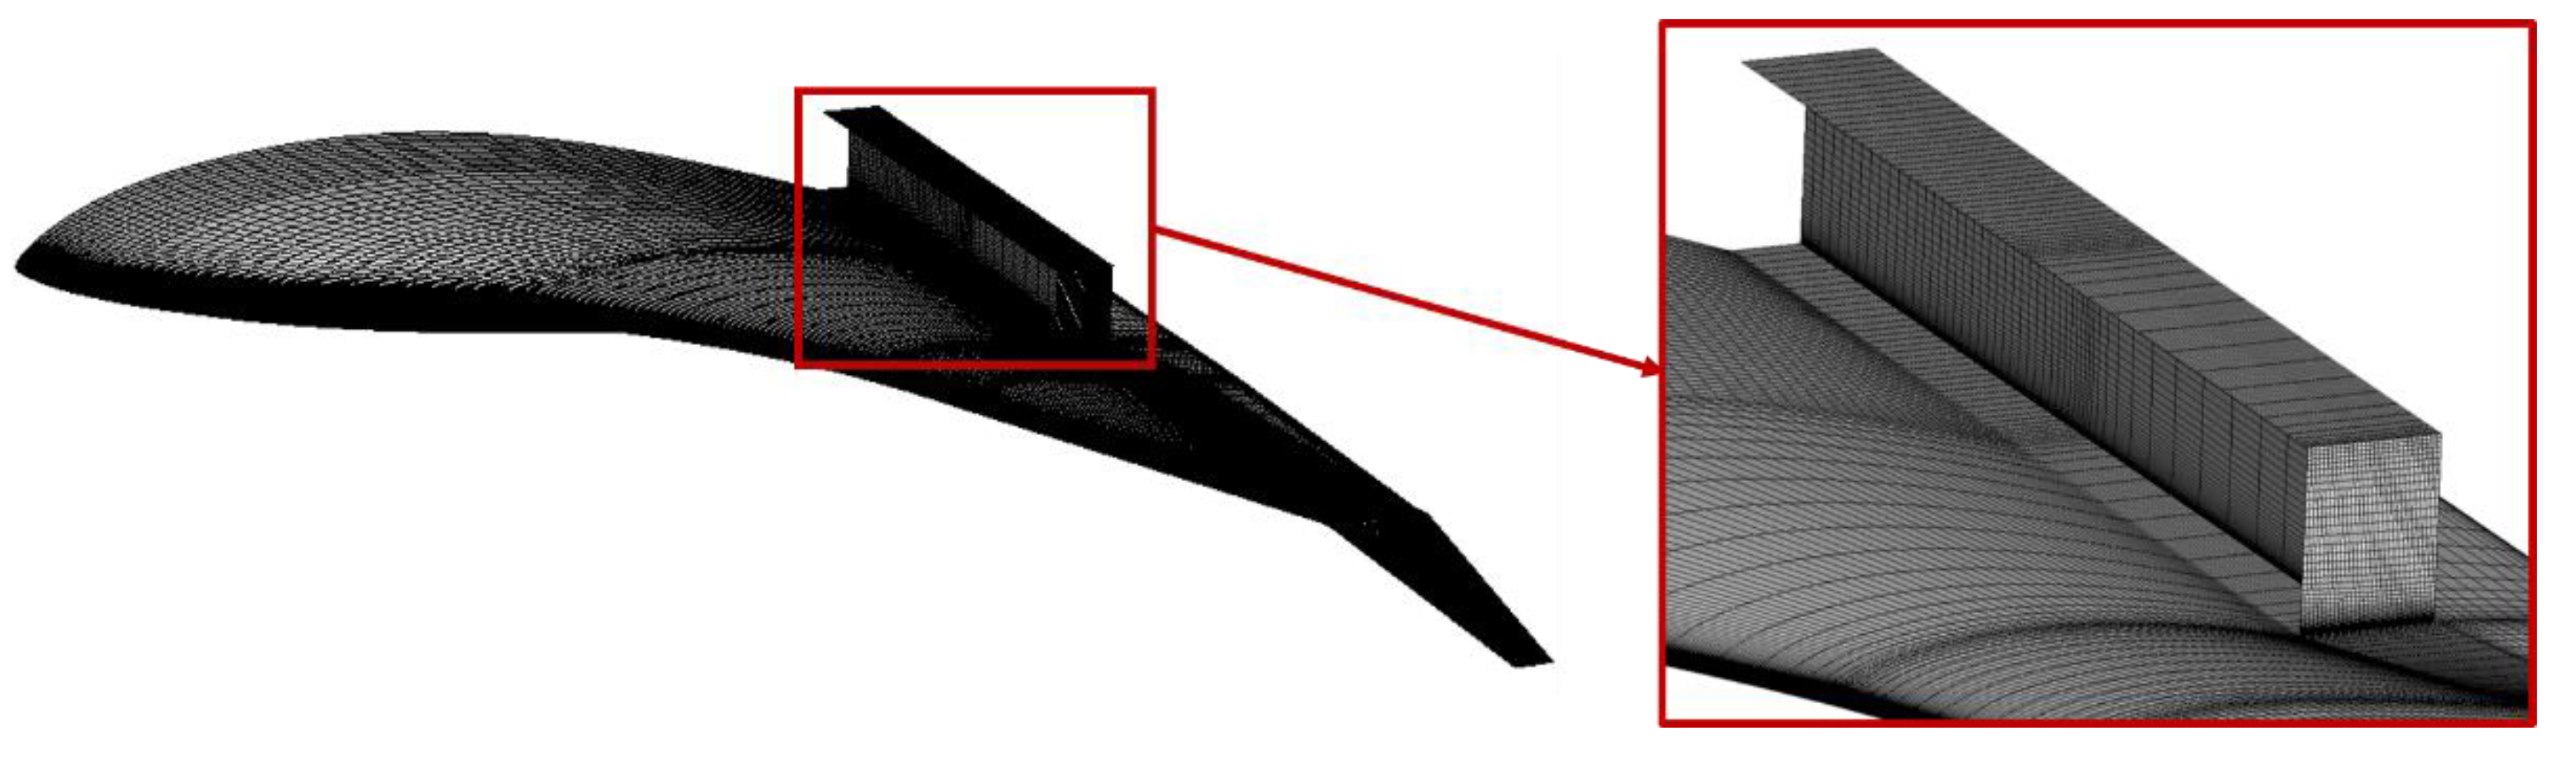
2.3. Mesh Generation and CFD Solver
2.4. Optimization Design Process
3. Results and Discussion
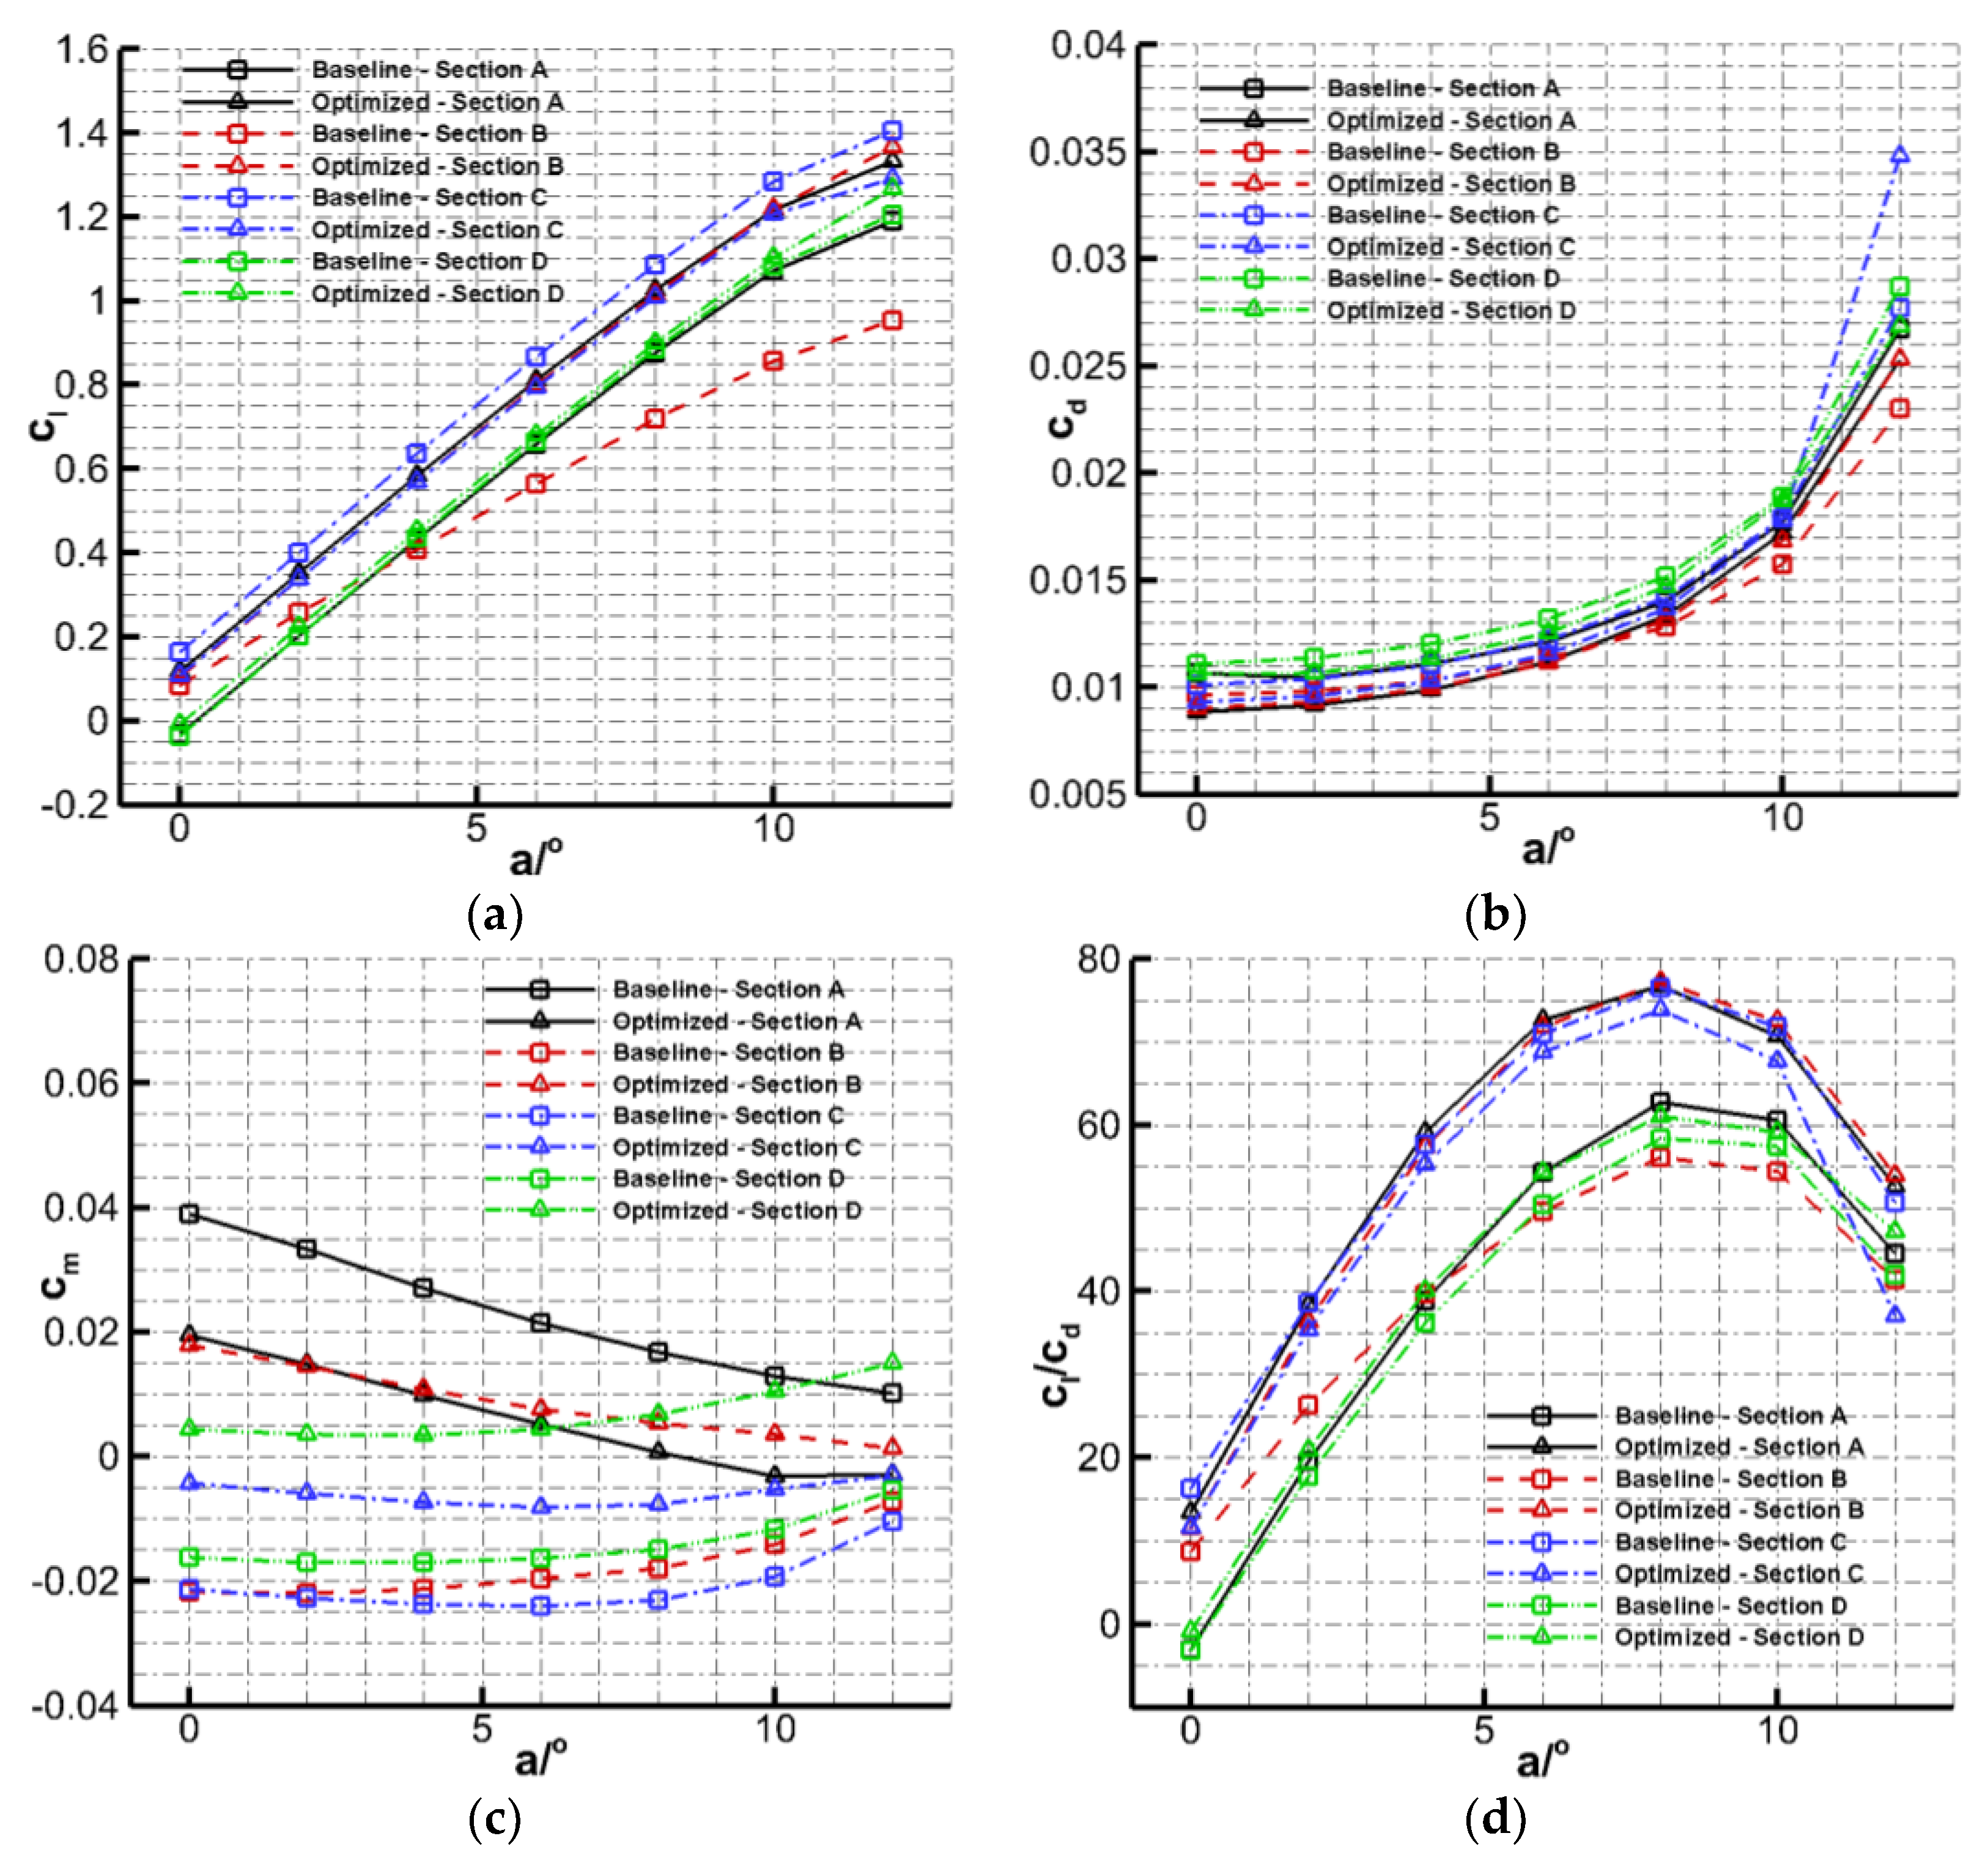
3.1. Sectional Foil Performance
3.2. BWB Configuration Performance
3.3. DEP Induced Effects Evaluation
4. Experimental Validations
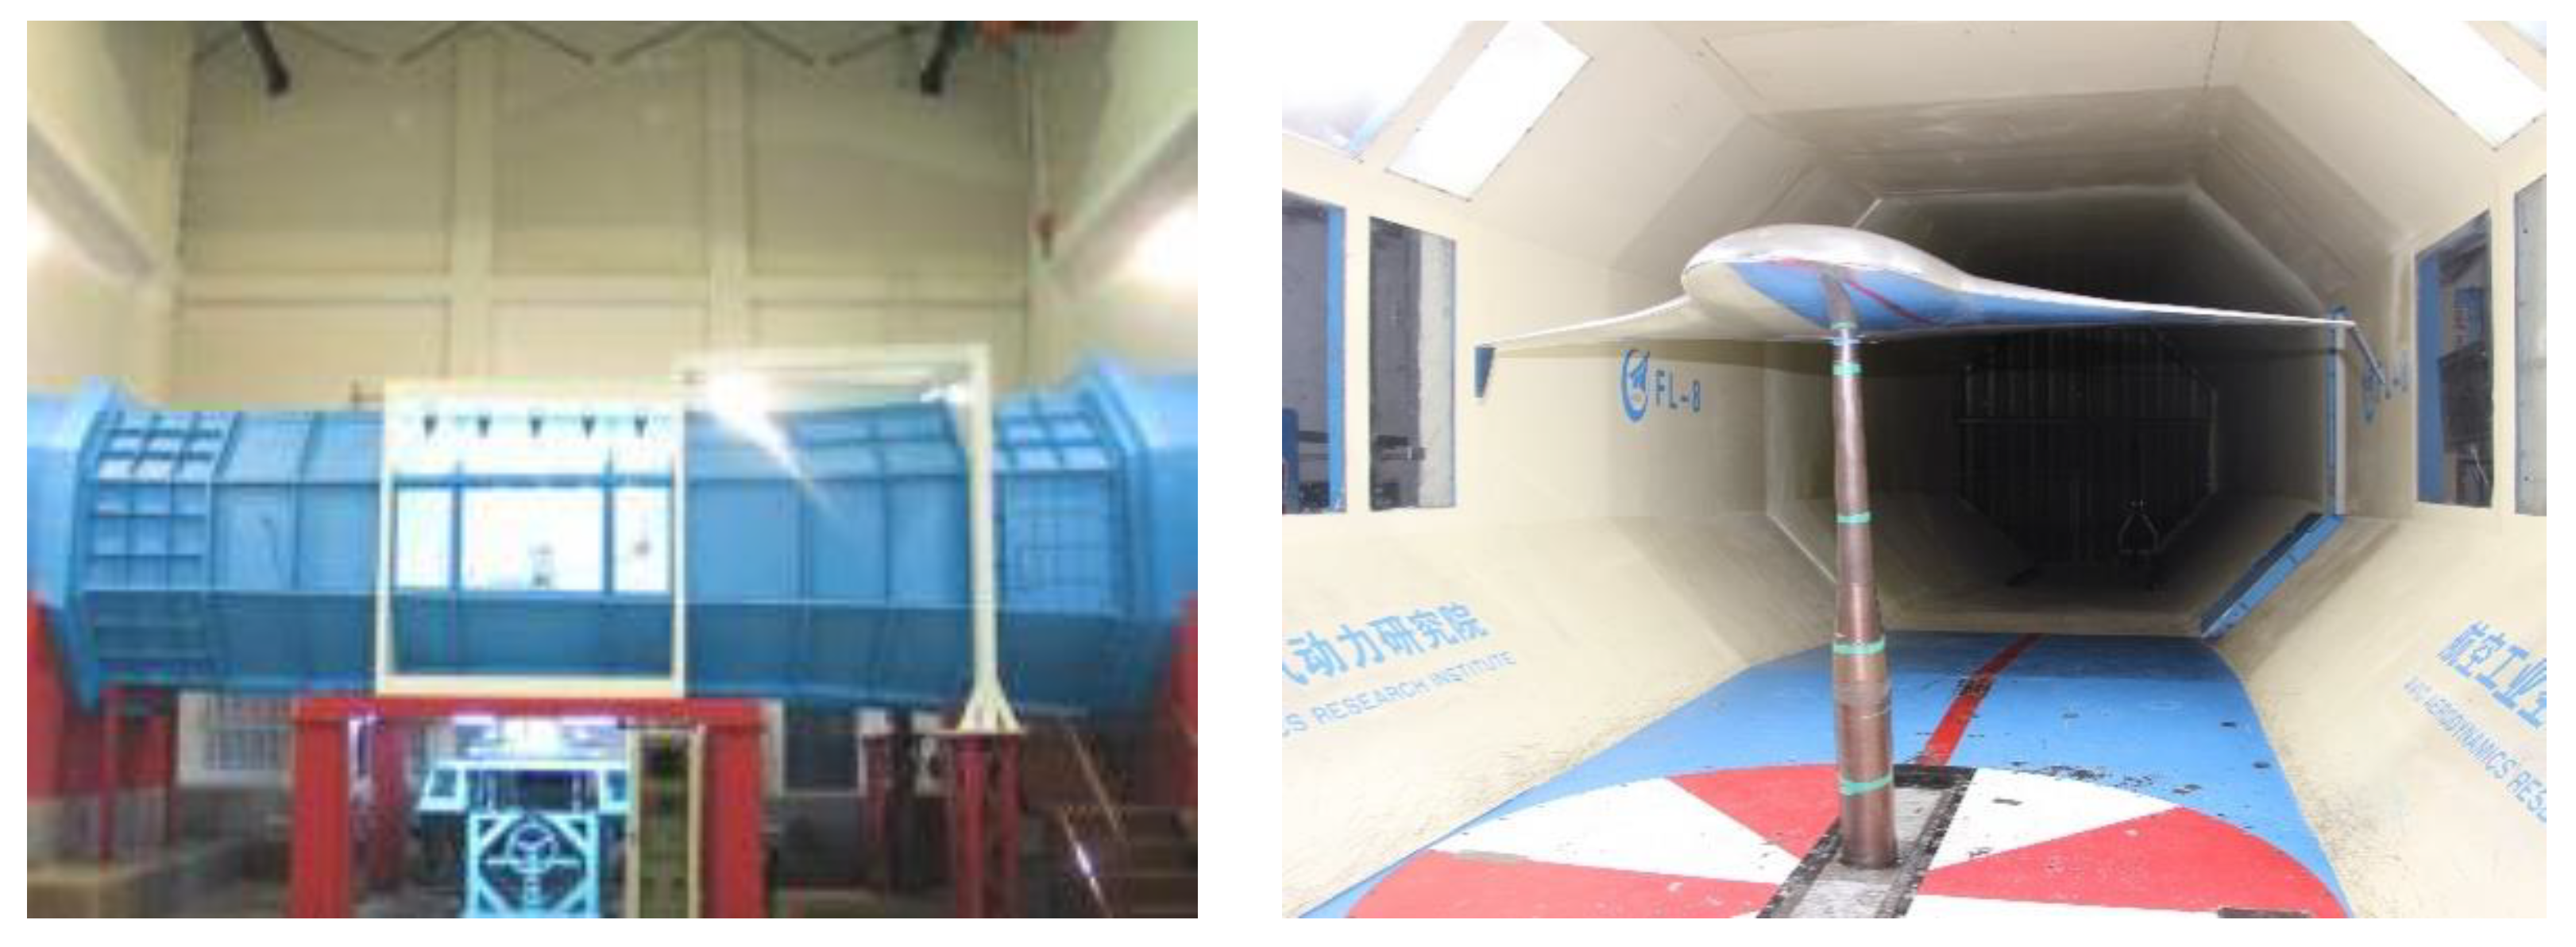
4.1. Wind Tunnel Testing
4.2. Experimental Data Analysis
4.2.1. Aerodynamic Characteristics Measurement
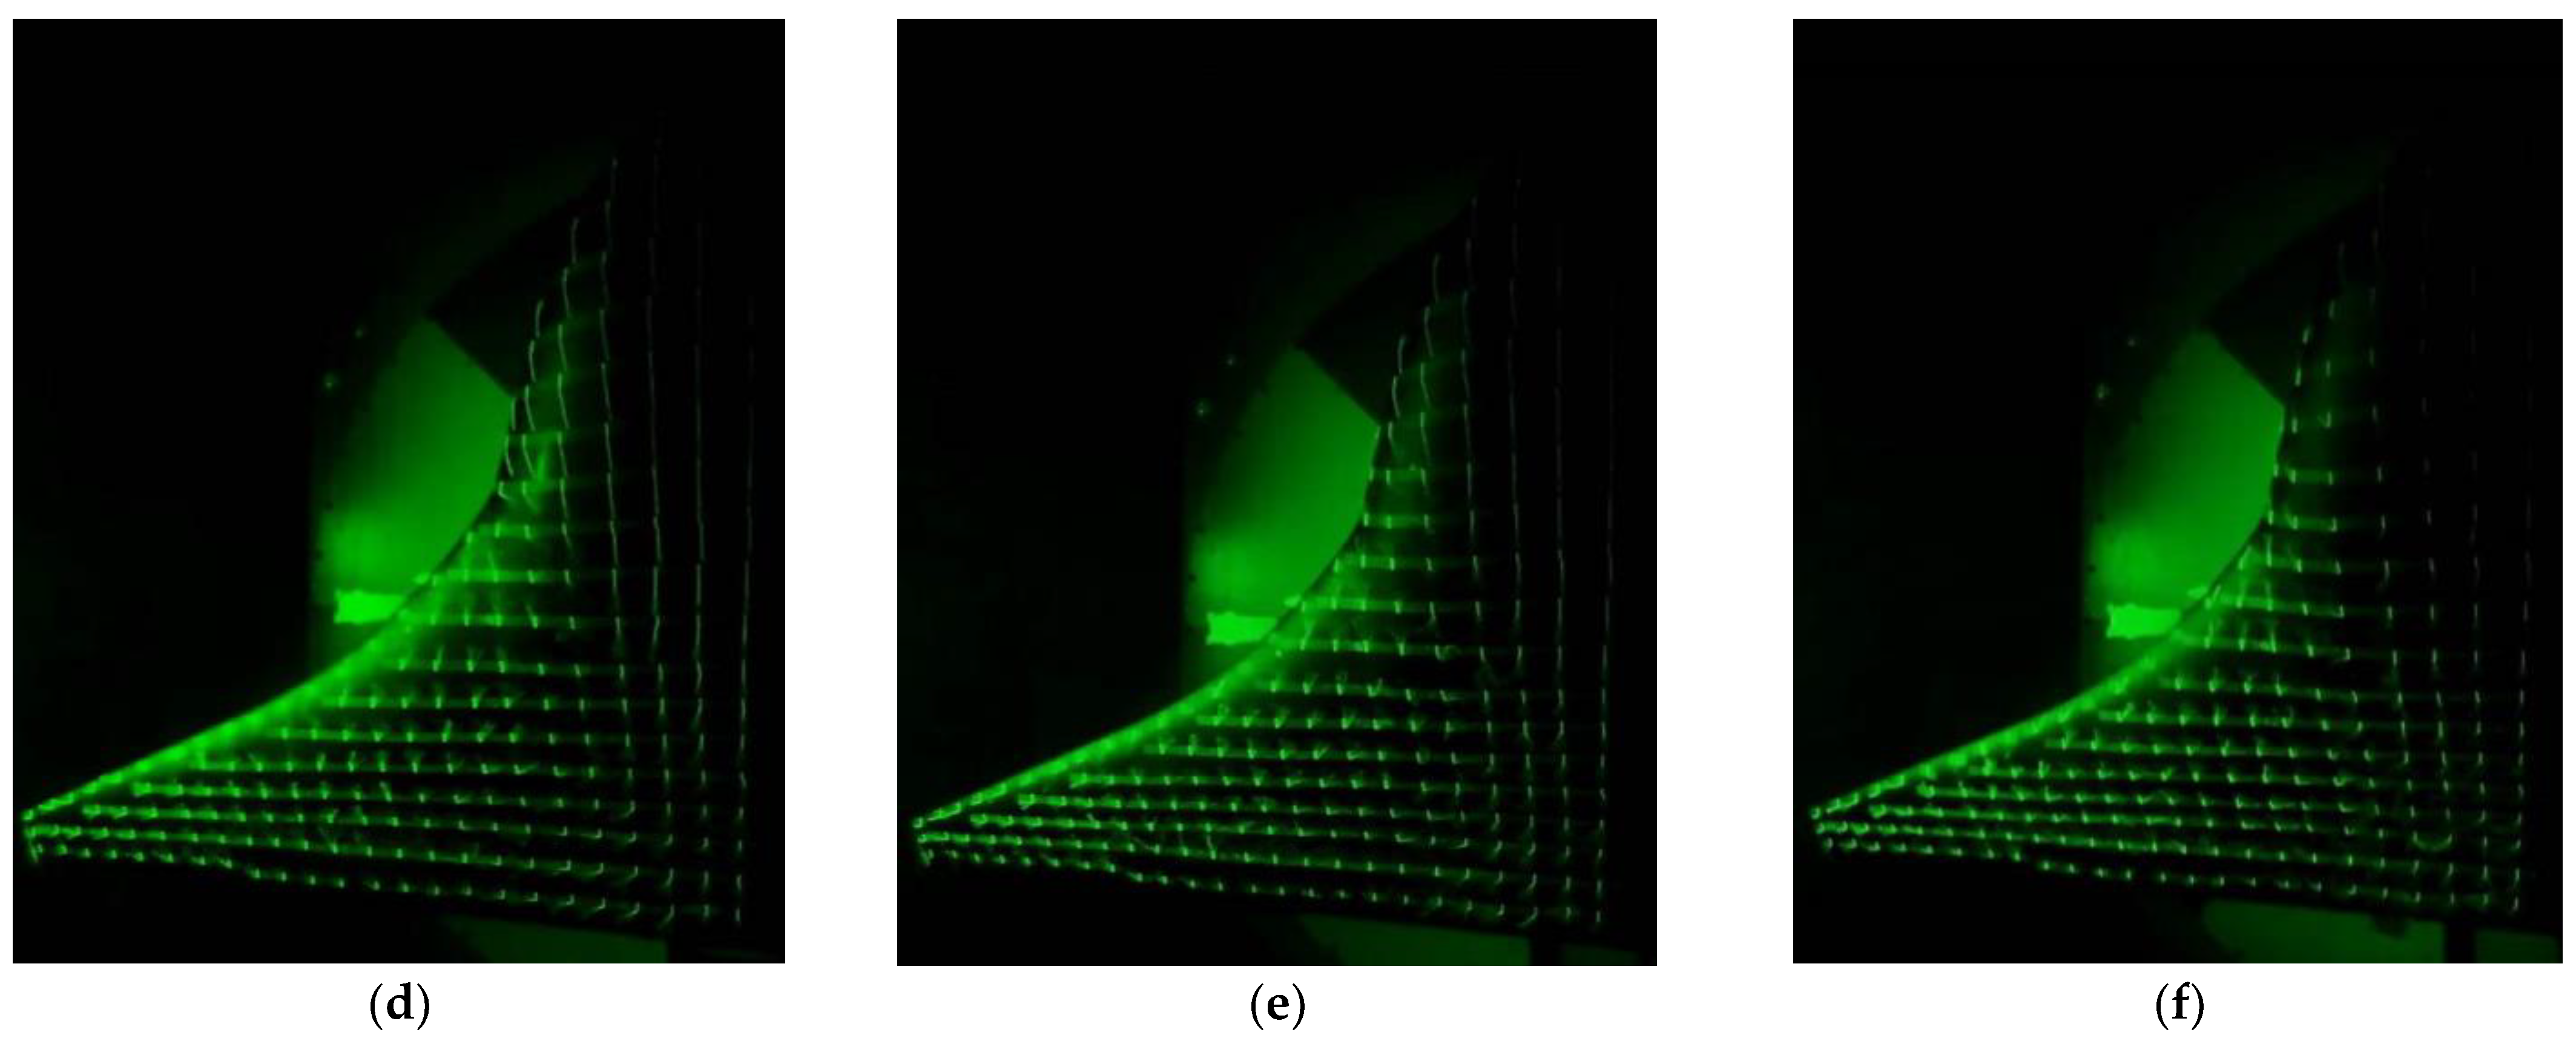
4.2.2. Surface Flow Visualization
5. Conclusions
Author Contributions
Funding
Acknowledgments
Conflicts of Interest
References
- Hyoungjun, K.; Mengsing, L. Shape Design Optimization of Embedded Engine Inlets for N2B Hybrid Wing-Body Configuration. Aerosp. Sci. Technol. 2013, 30, 128–149. [Google Scholar]
- Hyoungjun, K.; Mengsing, L. Flow Simulation and Optimal Shape Design of N3-X Hybrid Wing Body Configuration Using a Body Force Method. Aerosp. Sci. Technol. 2017, 71, 661–674. [Google Scholar]
- Kim, H.D. Distributed Propulsion Vehicles. In Proceedings of the 27th International Congress of the Aeronautical Sciences, Nice, France, 19–24 September 2010. ICAS Paper 2010-1.1.3. [Google Scholar]
- Rudi, K.; Lorenzo, R.; Andrew, R.; Panagiotis, L.; Georgios, D.; Riti, S. An Assessment of Distributed Propulsion: Part B—Advanced Propulsion System Architectures for Blended Wing Body Aircraft Configurations. Aerosp. Sci. Technol. 2016, 50, 212–219. [Google Scholar]
- Andrew, T.W.; John, R.H.; Christopher, J.H.; Cale, H.Z. Integrated Aerodynamic Benefits of Distributed Propulsion. In Proceedings of the 53rd AIAA Aerospace Sciences Meeting, Kissimmee, FL, USA, 5–9 January 2015. AIAA 2015-1500. [Google Scholar]
- Michael, F.K. Aero-Propulsive Coupling of an Embedded, Distributed Propulsion System. In Proceedings of the 33rd AIAA Applied Aerodynamics Conference, Dallas, TX, USA, 22 June 2015. AIAA 2015-3162. [Google Scholar]
- Aaron, T.P.; Phillip, J.A.; Michael, F.K. Aero-Propulsive and Propulsor Cross-Coupling Effects on a Distributed Propulsion System. J. Aircr. 2018, 55, 2414–2426. [Google Scholar]
- Sebastian, S.; Tomas, G. Performance analysis of turbo-electric propulsion system with fuselage boundary layer ingestion. Aerosp. Sci. Technol. 2021, 109, 106412. [Google Scholar] [CrossRef]
- Qin, N.; Vavalle, A.; Moigne, A.; Laban, M.; Hackett, K.; Weinerfelt, P. Aerodynamic considerations of blended wing body aircraft. Prog. Aerosp. Sci. 2004, 40, 321–343. [Google Scholar] [CrossRef]
- Zhenli, C.; Minghui, Z.; Yingchun, C.; Weimin, S.; Zhaoguang, T.; Dong, L.; Binqian, Z. Assessment on critical technologies for conceptual design of blended-wing-body civil aircraft. Chin. J. Aeronaut. 2019, 32, 1797–1827. [Google Scholar]
- Minghui, Z.; Zhenli, C.; Zhaoguang, T.; Wenting, G.; Dong, L.; Changsheng, Y.; Binqian, Z. Effects of stability margin and thrust specific fuel consumption constraints on multi-disciplinary optimization for blended-wing-body design. Chin. J. Aeronaut. 2019, 32, 1847–1859. [Google Scholar]
- Mader, C.; Martins, J. Stability-constrained aerodynamic shape optimization of flying wings. J. Aircr. 2013, 50, 1431–1449. [Google Scholar] [CrossRef] [Green Version]
- Panagiotou, P.; Fotiadis-Karras, S.; Yakinthos, K. Conceptual design of a blended wing body MALE UAV. Aerosp. Sci. Technol. 2018, 73, 32–47. [Google Scholar] [CrossRef]
- Payam, D.; Amir, N. The aerodynamic design evaluation of a blended-wing-body configuration. Aerosp. Sci. Technol. 2015, 43, 96–110. [Google Scholar]
- Heiko, E.; Wilfried, B.; Alan, M. Implementation of a multi-level optimization methodology within the e-design of a blended wing body. Aerosp. Sci. Technol. 2004, 8, 145–153. [Google Scholar]
- Parviz, Z.; Mohsen, S. An efficient aerodynamic shape optimization of blended wing body UAV using multi-fidelity models. Chin. J. Aeronaut. 2018, 31, 1165–1180. [Google Scholar]
- Kapsalis, S.; Panagiotou, P.; Yakinthos, K. CFD-aided optimization of a tactical blended-wing-body UAV configuration using the Taguchi method. Aerosp. Sci. Technol. 2021, 108, 106395. [Google Scholar] [CrossRef]
- Raymond, M.H.; Preston, A.H. Wing design by numerical optimization. J. Aircr. 1978, 15, 407–412. [Google Scholar]
- Menter, F.R. Two-equation eddy-viscosity turbulence models for engineering applications. AIAA J. 1994, 32, 1598–1605. [Google Scholar] [CrossRef] [Green Version]
- Sun, M.; Zhan, H. Application of Kriging Surrogate Model for Aerodynamic Shape Optimization of Wing. Acta Aerodyn. Sinca 2011, 29, 759–764. [Google Scholar]
- Wang, K.; Zhou, Z.; Zhu, X.; Guo, J.; Fan, Z. Reconstruction design of the propeller induced flow-field based on the aerodynamic loading distributions. Acta Aeronaut. Astronaut. Sin. 2020, 41, 123118. [Google Scholar] [CrossRef]
- Hu, X.Z.; Chen, X.Q.; Zhao, Y.; Yao, W. Optimization Design of Satellite Separation Systems Based on Multi-Island Genetic Algorithm. Adv. Space Res. 2014, 53, 870–876. [Google Scholar] [CrossRef]
- Elisa, M.; Andrea, B.; Domenico, Q.; Renato, T. Gradient based empirical cumulative distribution function approximation for robust aerodynamic design. Aerosp. Sci. Technol. 2021, 112, 106630. [Google Scholar] [CrossRef]
- Wang, G.; Zhang, M.; Tao, Y.; Li, J.; Li, D.; Zhang, Y.; Yuan, C.; Sang, W.; Zhang, B. Research on analytical scaling method and scale effects for subscale flight test of blended wing body civil aircraft. Aerosp. Sci. Technol. 2020, 106, 106114. [Google Scholar] [CrossRef]


| Parameter | Value |
|---|---|
| Reference area | Sref = 3.40 m2 |
| Reference chord | cref = 0.78 m |
| Reference span | b = 4.40 m |
| Moment reference point (MRP) location | (1.10, 0, 0) m |
| Total mass | m = 80 kg |
| Altitude | H = 5000 m |
| Velocity | V = 200 km/h |
| Chord Reynolds number | Rec = 2.0 × 10⁶ |
| Cruise lift coefficient | CL, cruise = 0.2 |
| Cruise pitching moment coefficient | CM, cruise ≈ 0.0 |
| Static stability margin | ΔCM/ΔCL ≤ −5% |
| Maximum lift-to-drag ratio | (CL/CD)max ≥ 16.0 |
| Cruise thrust | Tcruise = 50 N |
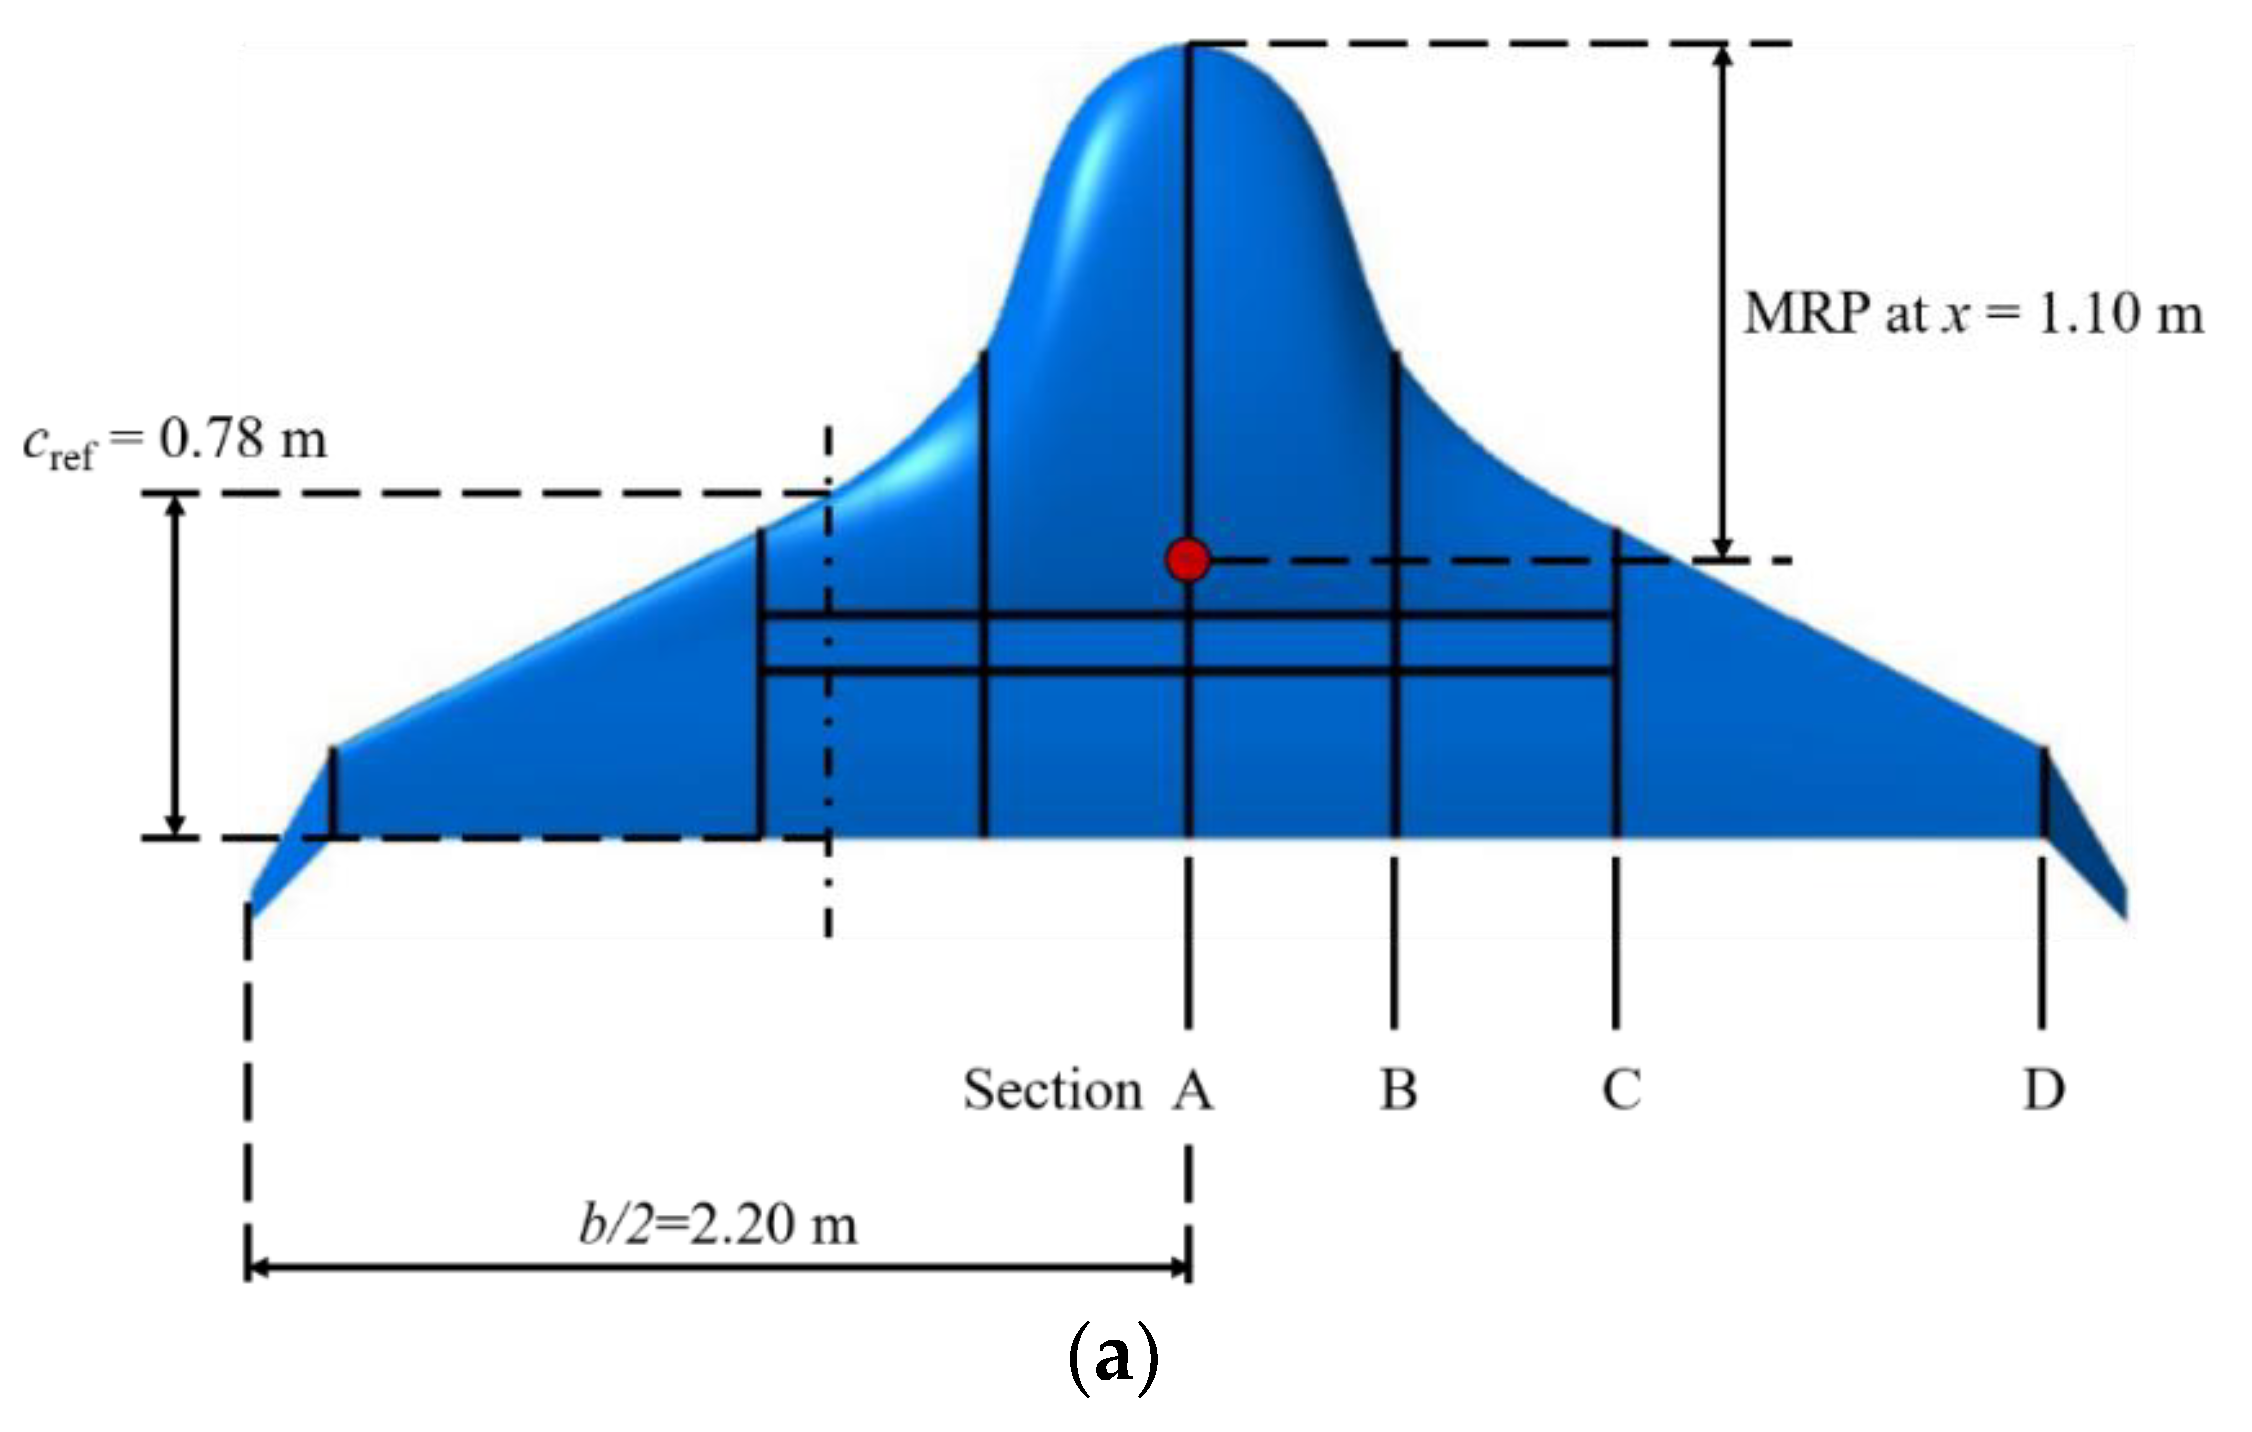
| Parameter | Section A | Section B | Section C | Section D |
|---|---|---|---|---|
| Span-wise location | zA = 0 m | zB = 0.48 m | zC = 1.00 m | zD = 2.00 m |
| Thickness | tA = 0.33 m | tB = 0.16 m | tC = 0.10 m | tD = 0.03 m |
| Chord length | cA = 1.80 m | cB = 1.10 m | cC = 0.70 m | cD = 0.25 m |
| Parameter | Section A | Section B | Section C | Section D |
| Variable | Definition and Unit | Initial Value | Upper Bound | Lower Bound |
|---|---|---|---|---|
| xPSA | chord-wise location of point PAS (m) | 1.30 | 1.60 | 1.20 |
| ck= 1~8 | participation coefficients (1) | 0.00 | −0.01 | 0.01 |
| xCP | chord-wise location of point CP (m) | 1.42 | 1.80 | 1.32 |
| Grid | Number of Cells | Computational Time | CL Difference | CD Difference | CM Difference |
|---|---|---|---|---|---|
| Fine | 6.7 × 10⁶ | 11 h | / | / | / |
| Medium | 3.3 × 10⁶ | 6 h | 0.68% | 1.30% | 1.12% |
| Coarse | 1.0 × 10⁶ | 4 h | 1.96% | 4.72% | 3.45% |
| / | Aerodynamic Coefficient | BWB | DEP-Based BWB | Increment |
|---|---|---|---|---|
| α = 2° | CL | 0.1899 | 0.2435 | +28.23% |
| CD | 0.0115 | 0.0159 | +38.26% | |
| CL/CD | 16.513 | 15.314 | −7.25% | |
| CM | 0.0049 | 0.0040 | −18.37% | |
| α = 4° | CL | 0.3232 | 0.3801 | +17.61% |
| CD | 0.0161 | 0.0195 | +21.06% | |
| CL/CD | 20.075 | 19.492 | −2.90% | |
| CM | −0.0156 | −0.0089 | +42.95% | |
| / | ΔCM/ΔCL | −15.38% | −9.44% | +38.62% |
Publisher’s Note: MDPI stays neutral with regard to jurisdictional claims in published maps and institutional affiliations. |
© 2022 by the authors. Licensee MDPI, Basel, Switzerland. This article is an open access article distributed under the terms and conditions of the Creative Commons Attribution (CC BY) license (https://creativecommons.org/licenses/by/4.0/).
Share and Cite
Wang, K.; Zhou, Z. Aerodynamic Design, Analysis and Validation of a Small Blended-Wing-Body Unmanned Aerial Vehicle. Aerospace 2022, 9, 36. https://doi.org/10.3390/aerospace9010036
Wang K, Zhou Z. Aerodynamic Design, Analysis and Validation of a Small Blended-Wing-Body Unmanned Aerial Vehicle. Aerospace. 2022; 9(1):36. https://doi.org/10.3390/aerospace9010036
Chicago/Turabian StyleWang, Kelei, and Zhou Zhou. 2022. "Aerodynamic Design, Analysis and Validation of a Small Blended-Wing-Body Unmanned Aerial Vehicle" Aerospace 9, no. 1: 36. https://doi.org/10.3390/aerospace9010036