
Evaluation of Influence Factors on the Visual Inspection Performance of Aircraft Engine Blades


Abstract
:
1. Introduction
2. Literature Review
3. Materials and Methods
3.1. Research Objective and Methodology
3.2. Research Sample (Stimuli)
3.2.1. Part Selection
3.2.2. Part Preparation
3.2.3. Image Acquisition
3.3. Research Population
3.4. Stimuli Presentation under Eye Tracking Observation
3.5. Influence Factors
3.5.1. Inspection Type
3.5.2. Defect Type
3.5.3. Defect Severity
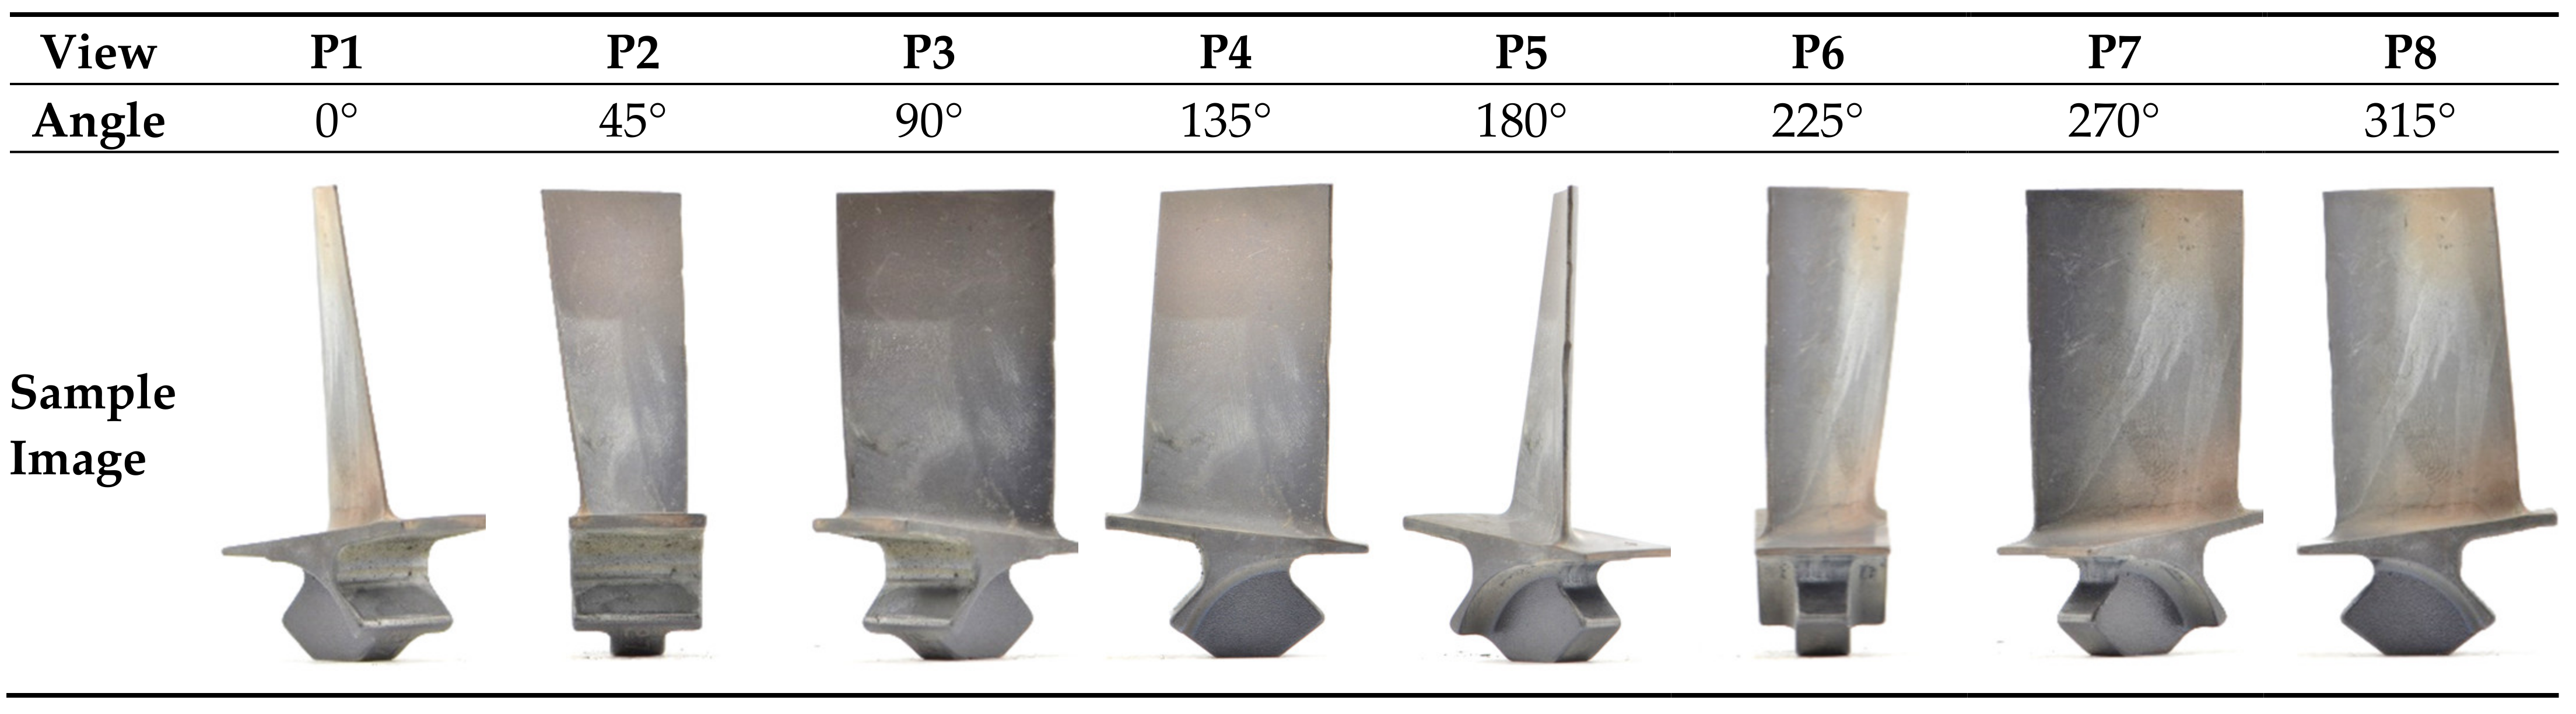
3.5.4. Blade Perspective
3.5.5. Background Colour
3.6. Data Analysis
4. Statistical Results
4.1. Inspection Type
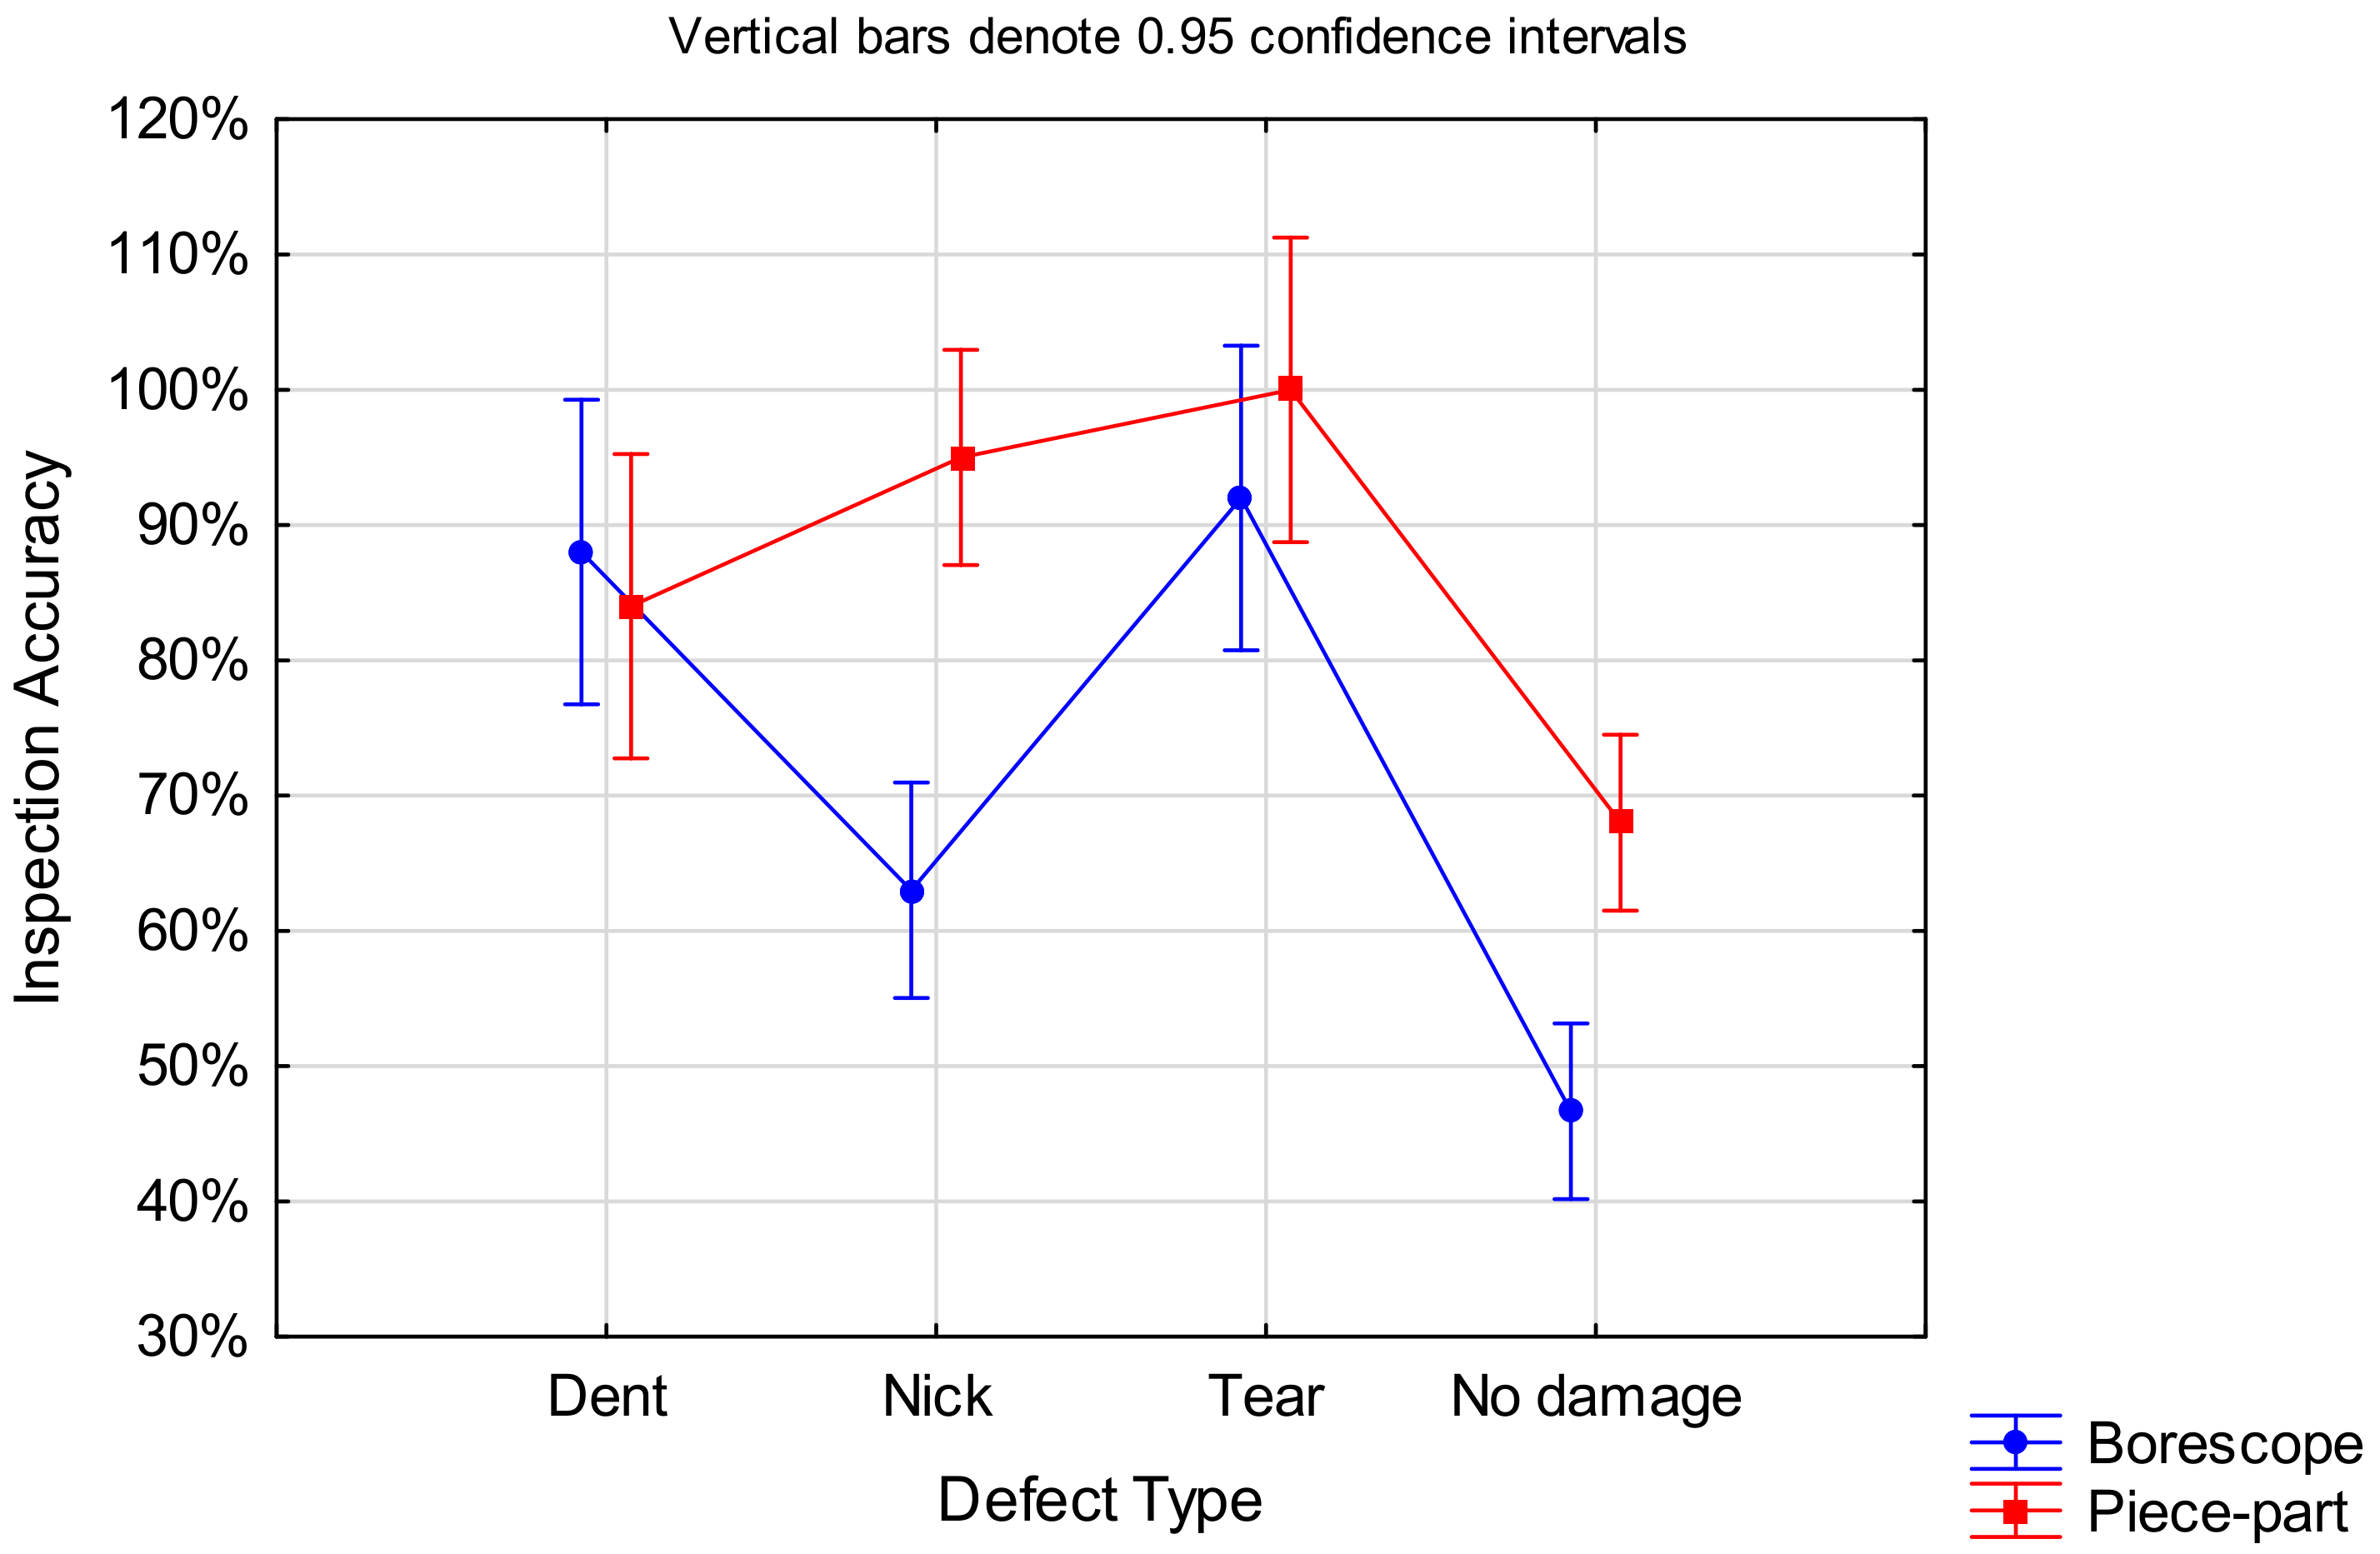
4.2. Defect Type
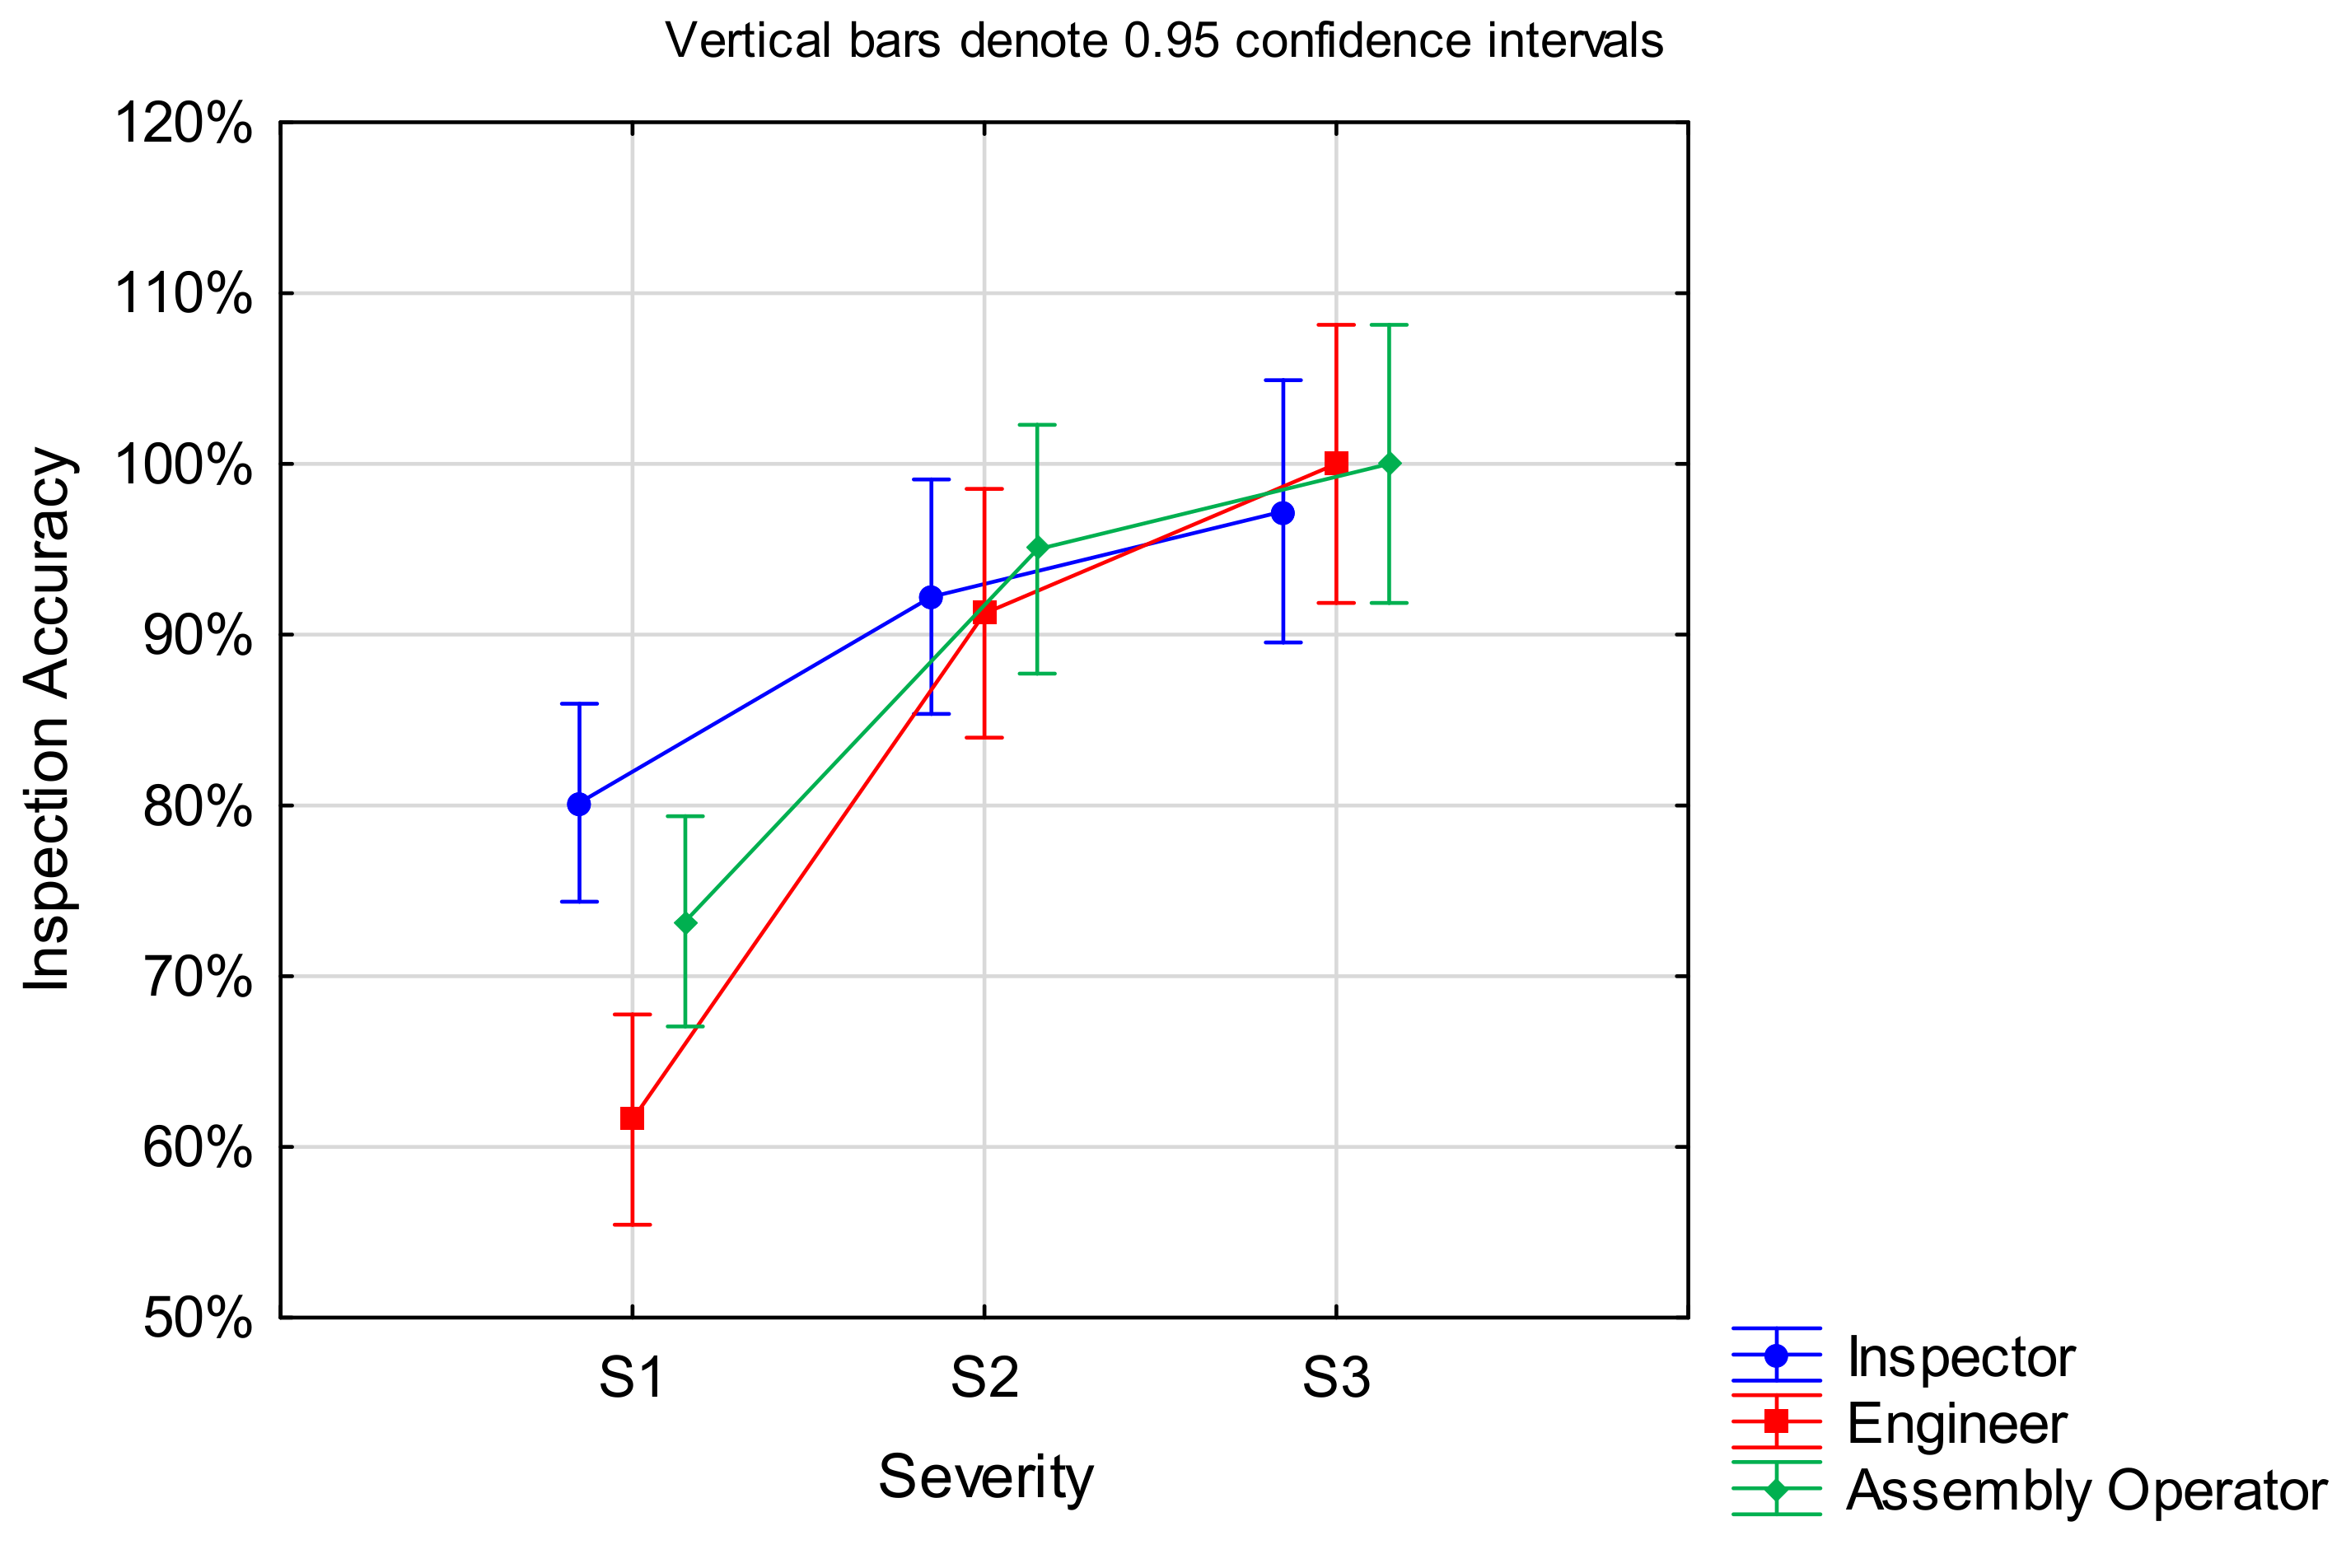
4.3. Severity
4.4. Blade Perspective
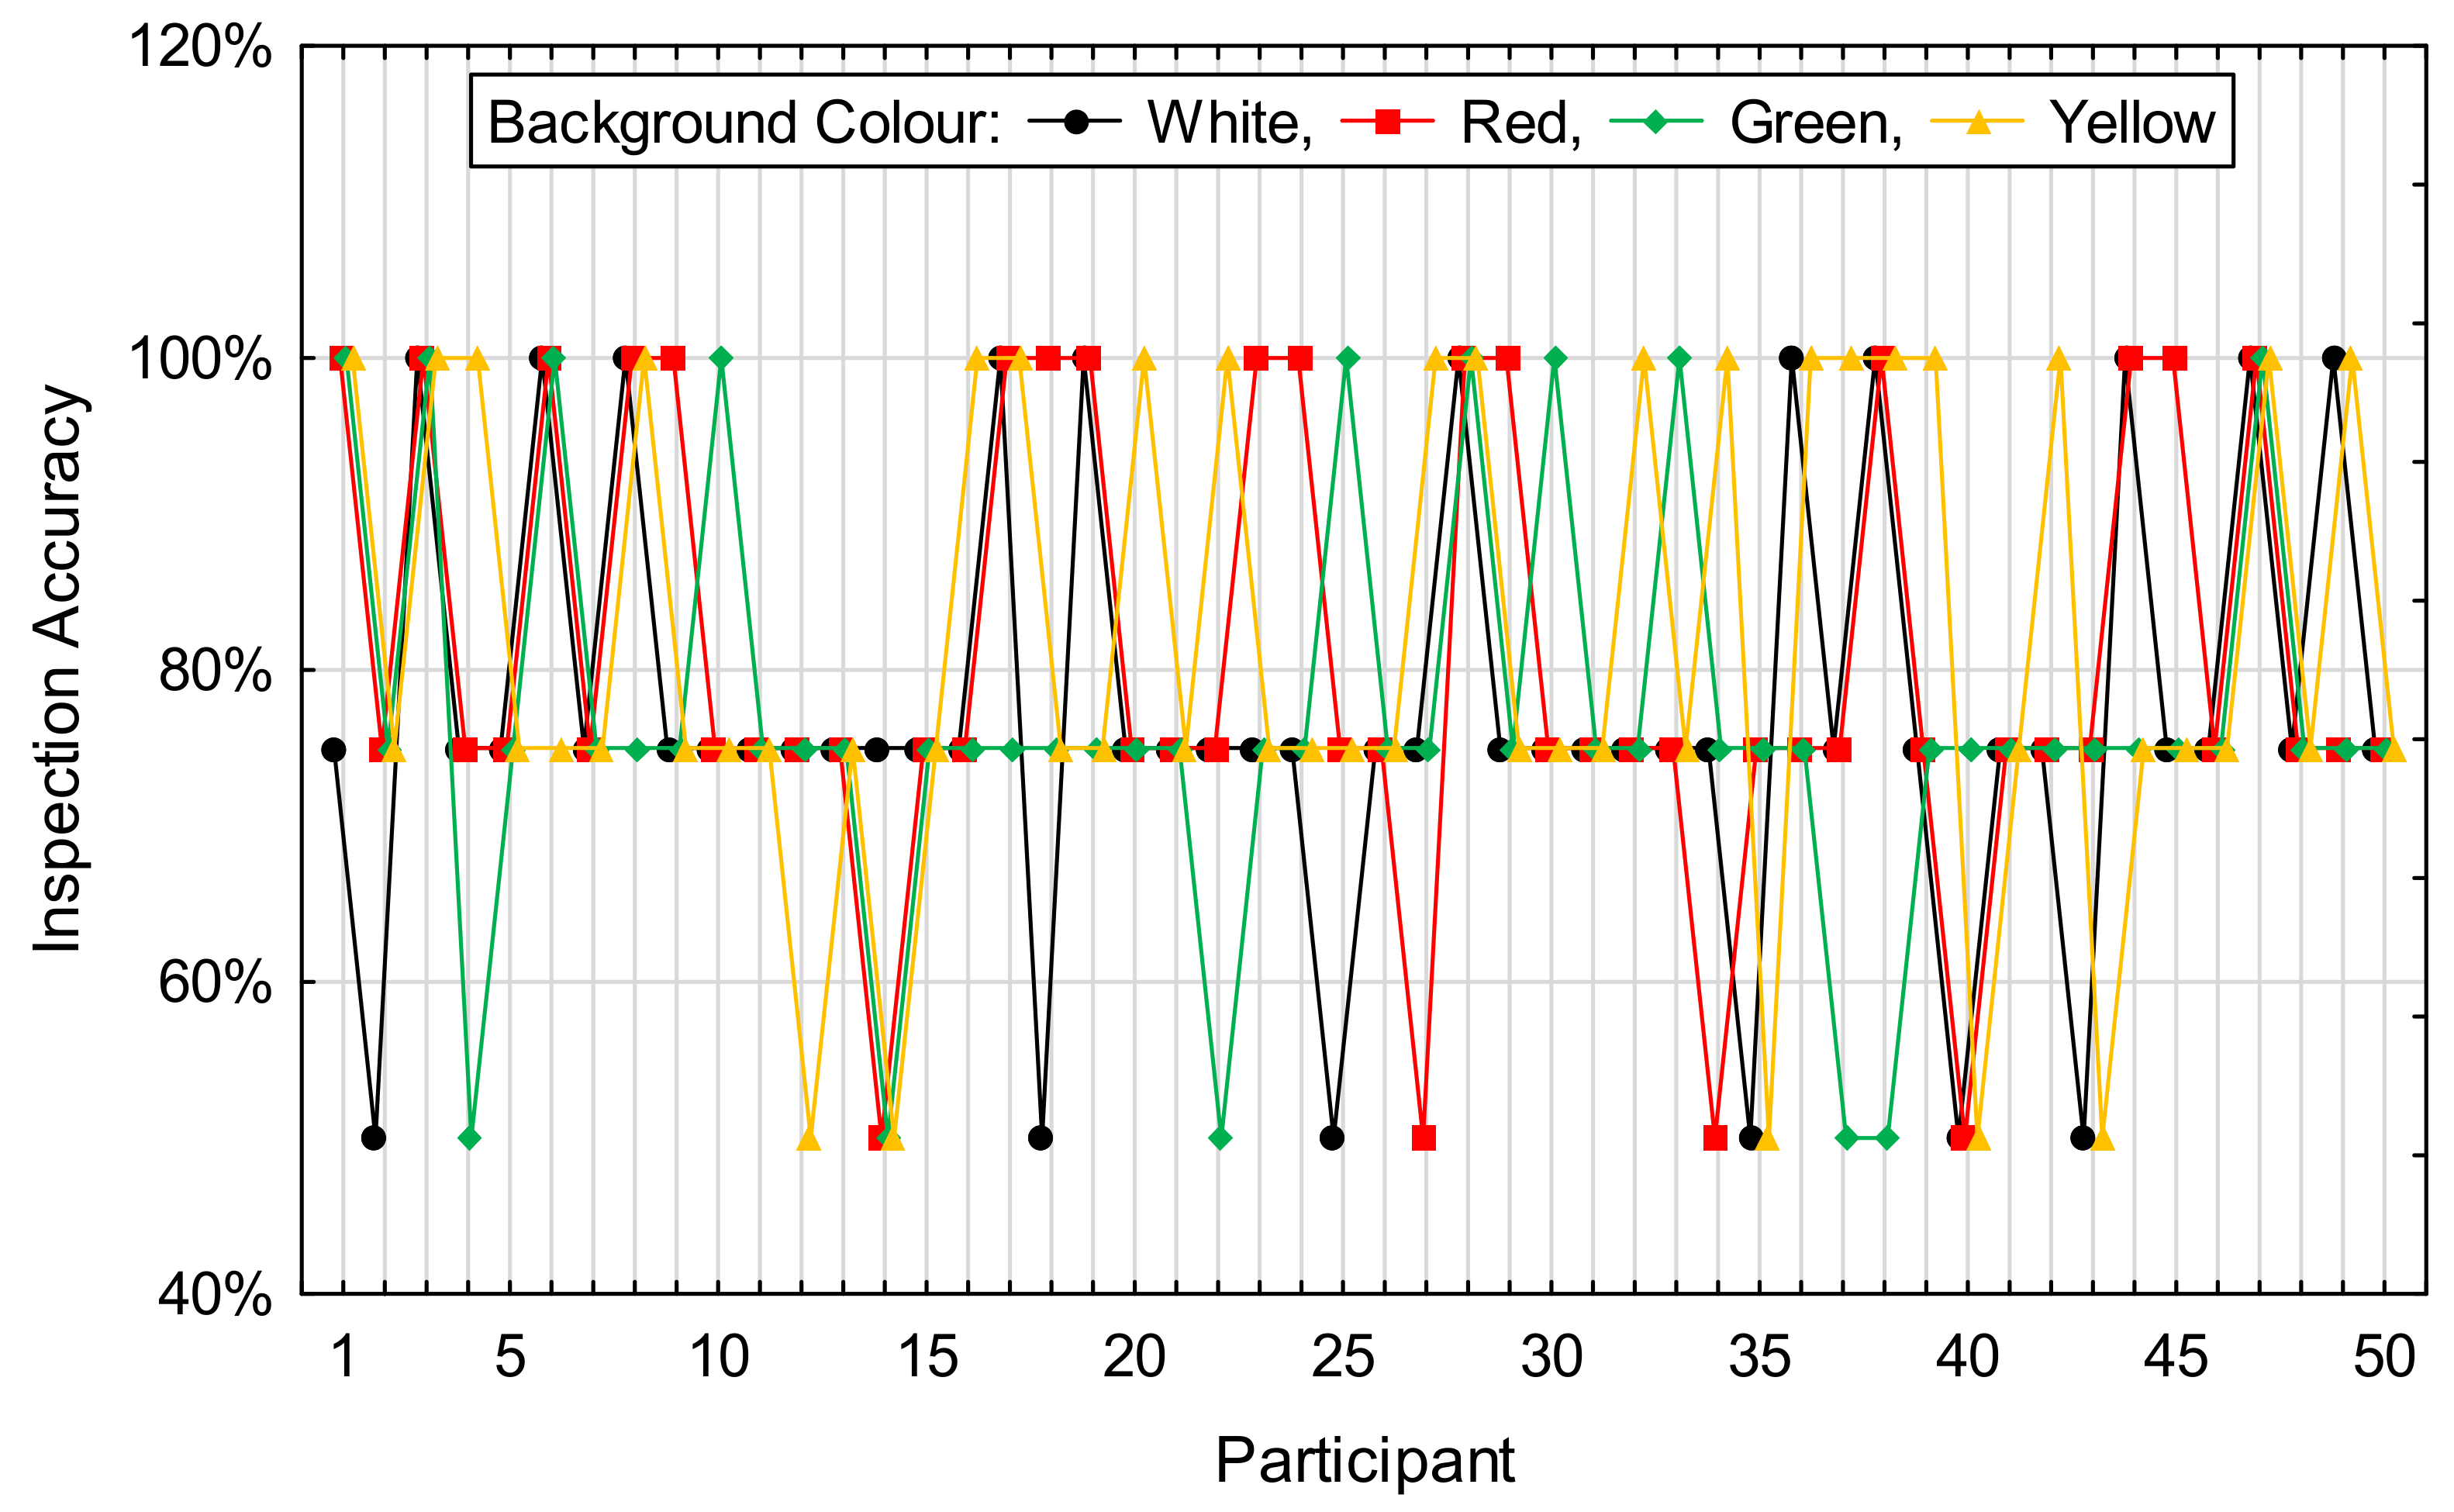
4.5. Background Colour
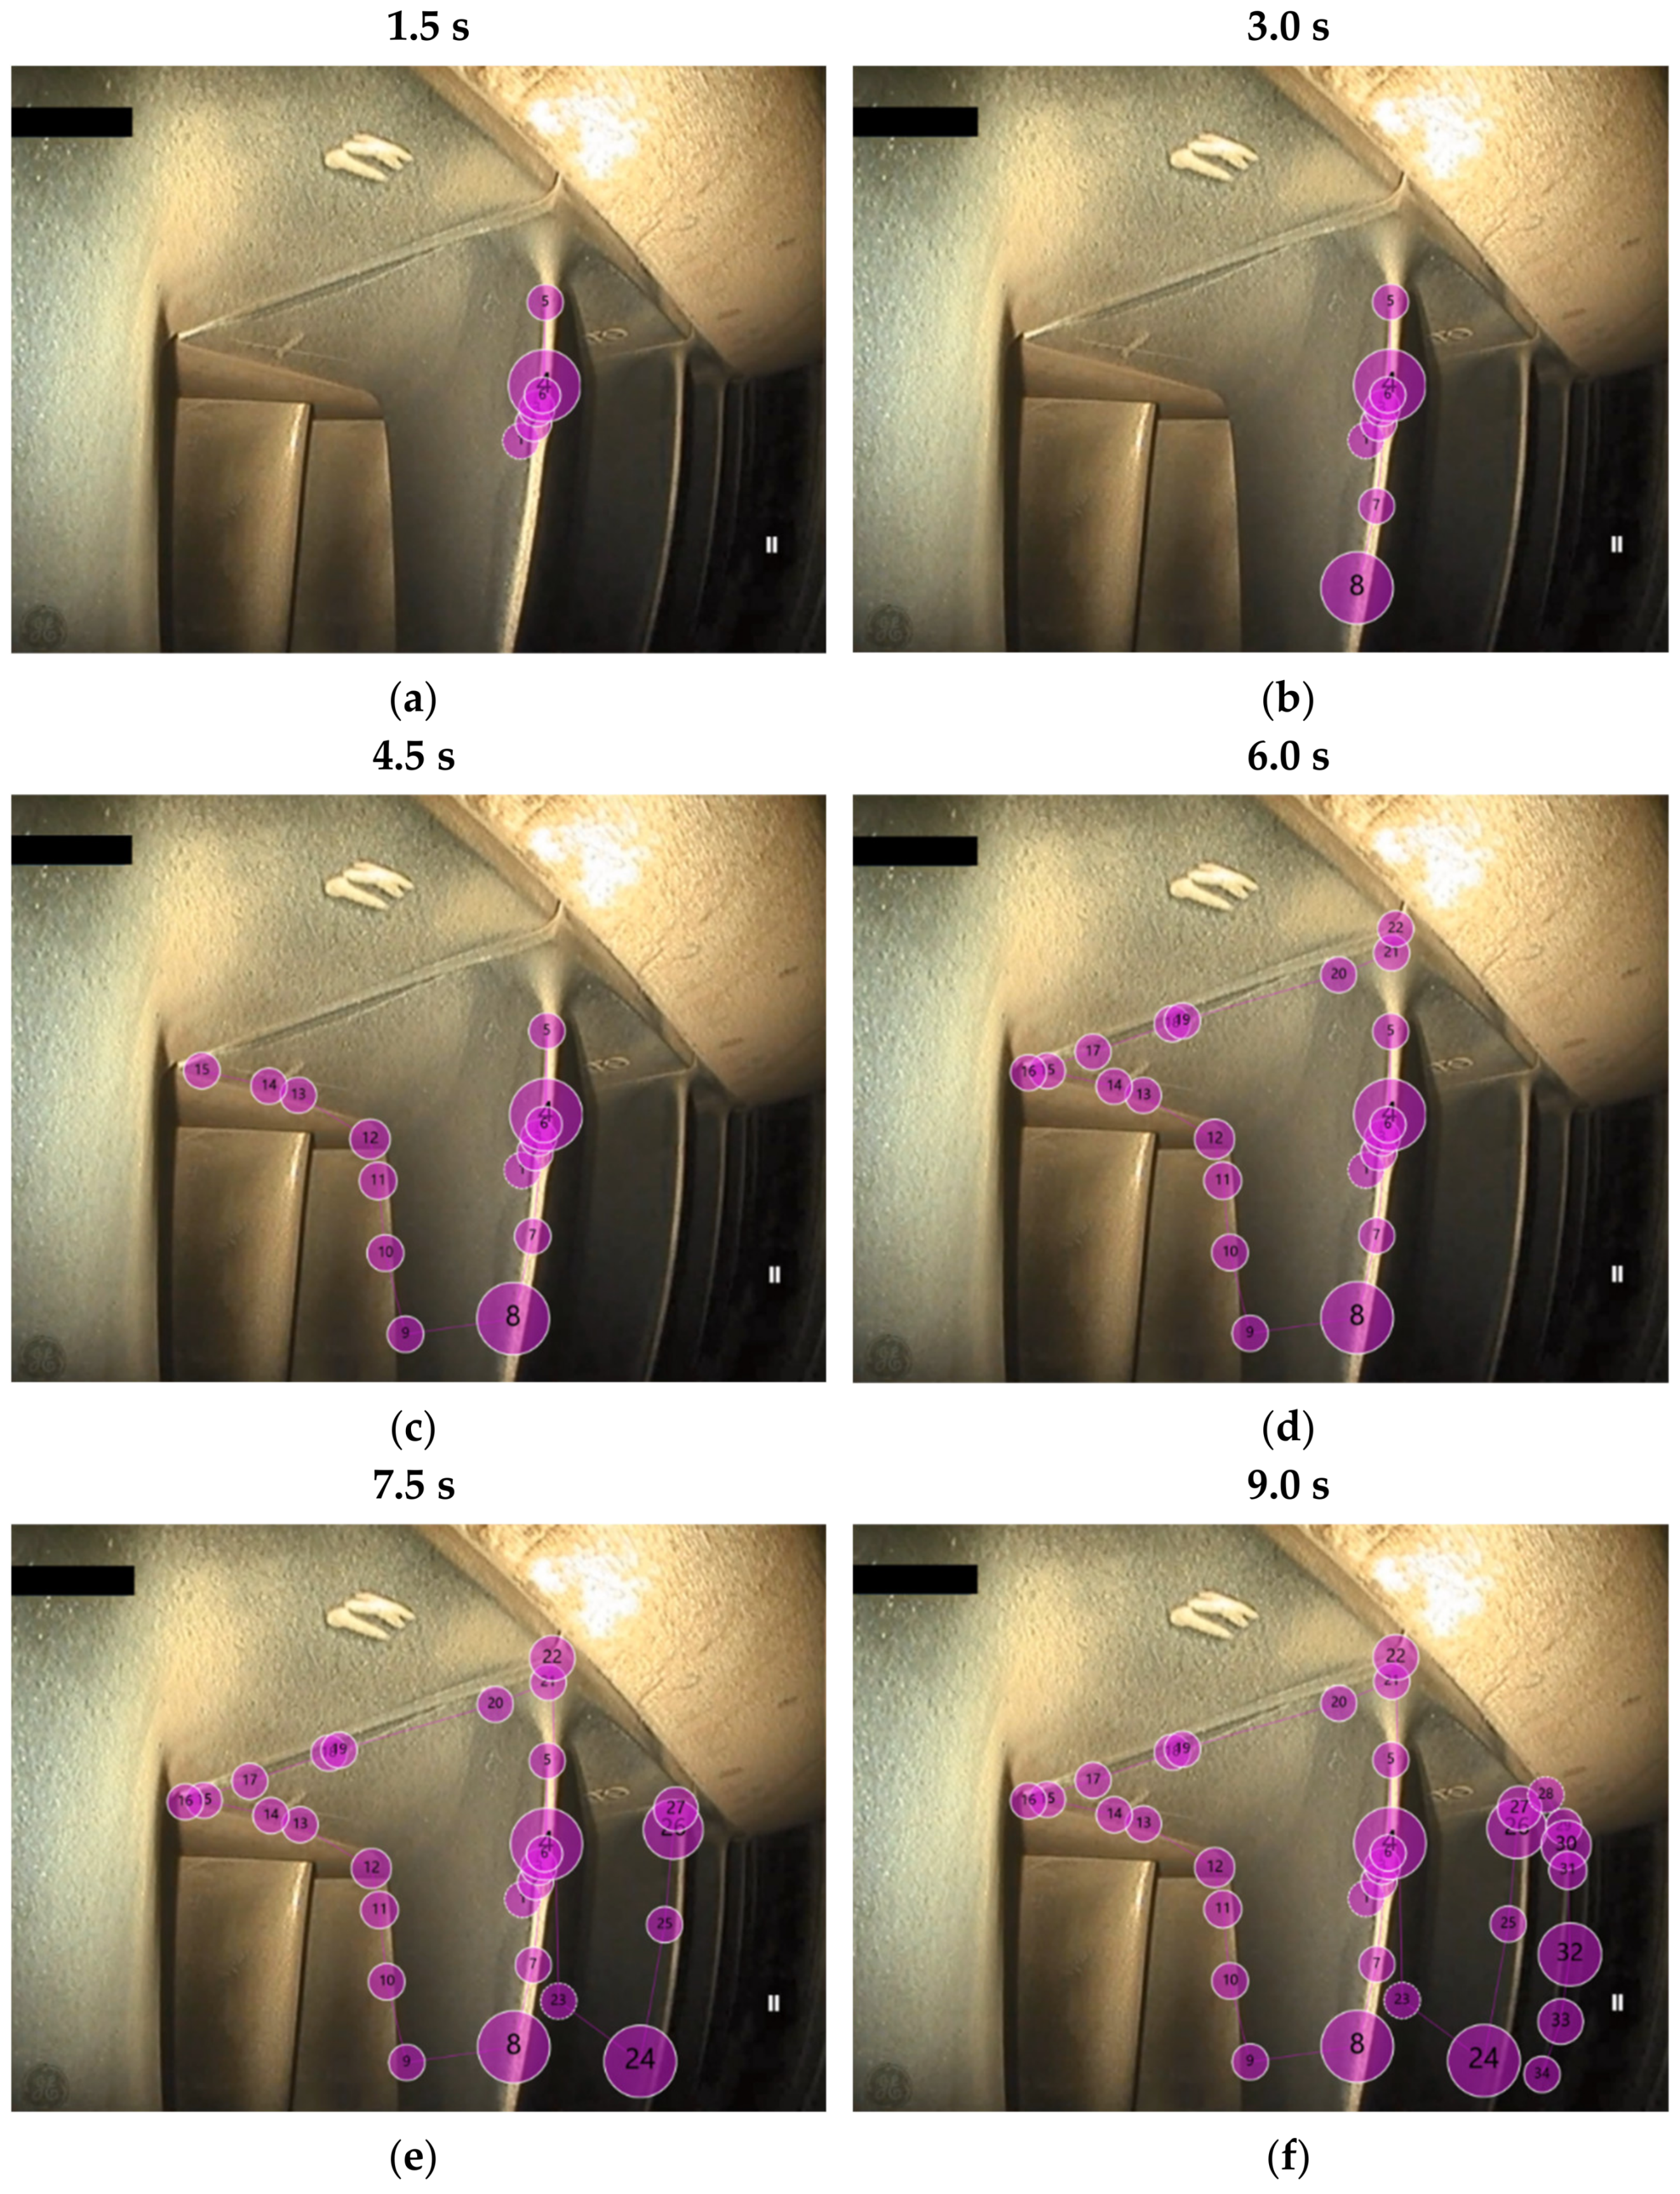
5. Evaluation of the Eye Tracking Data
5.1. Inspection Type
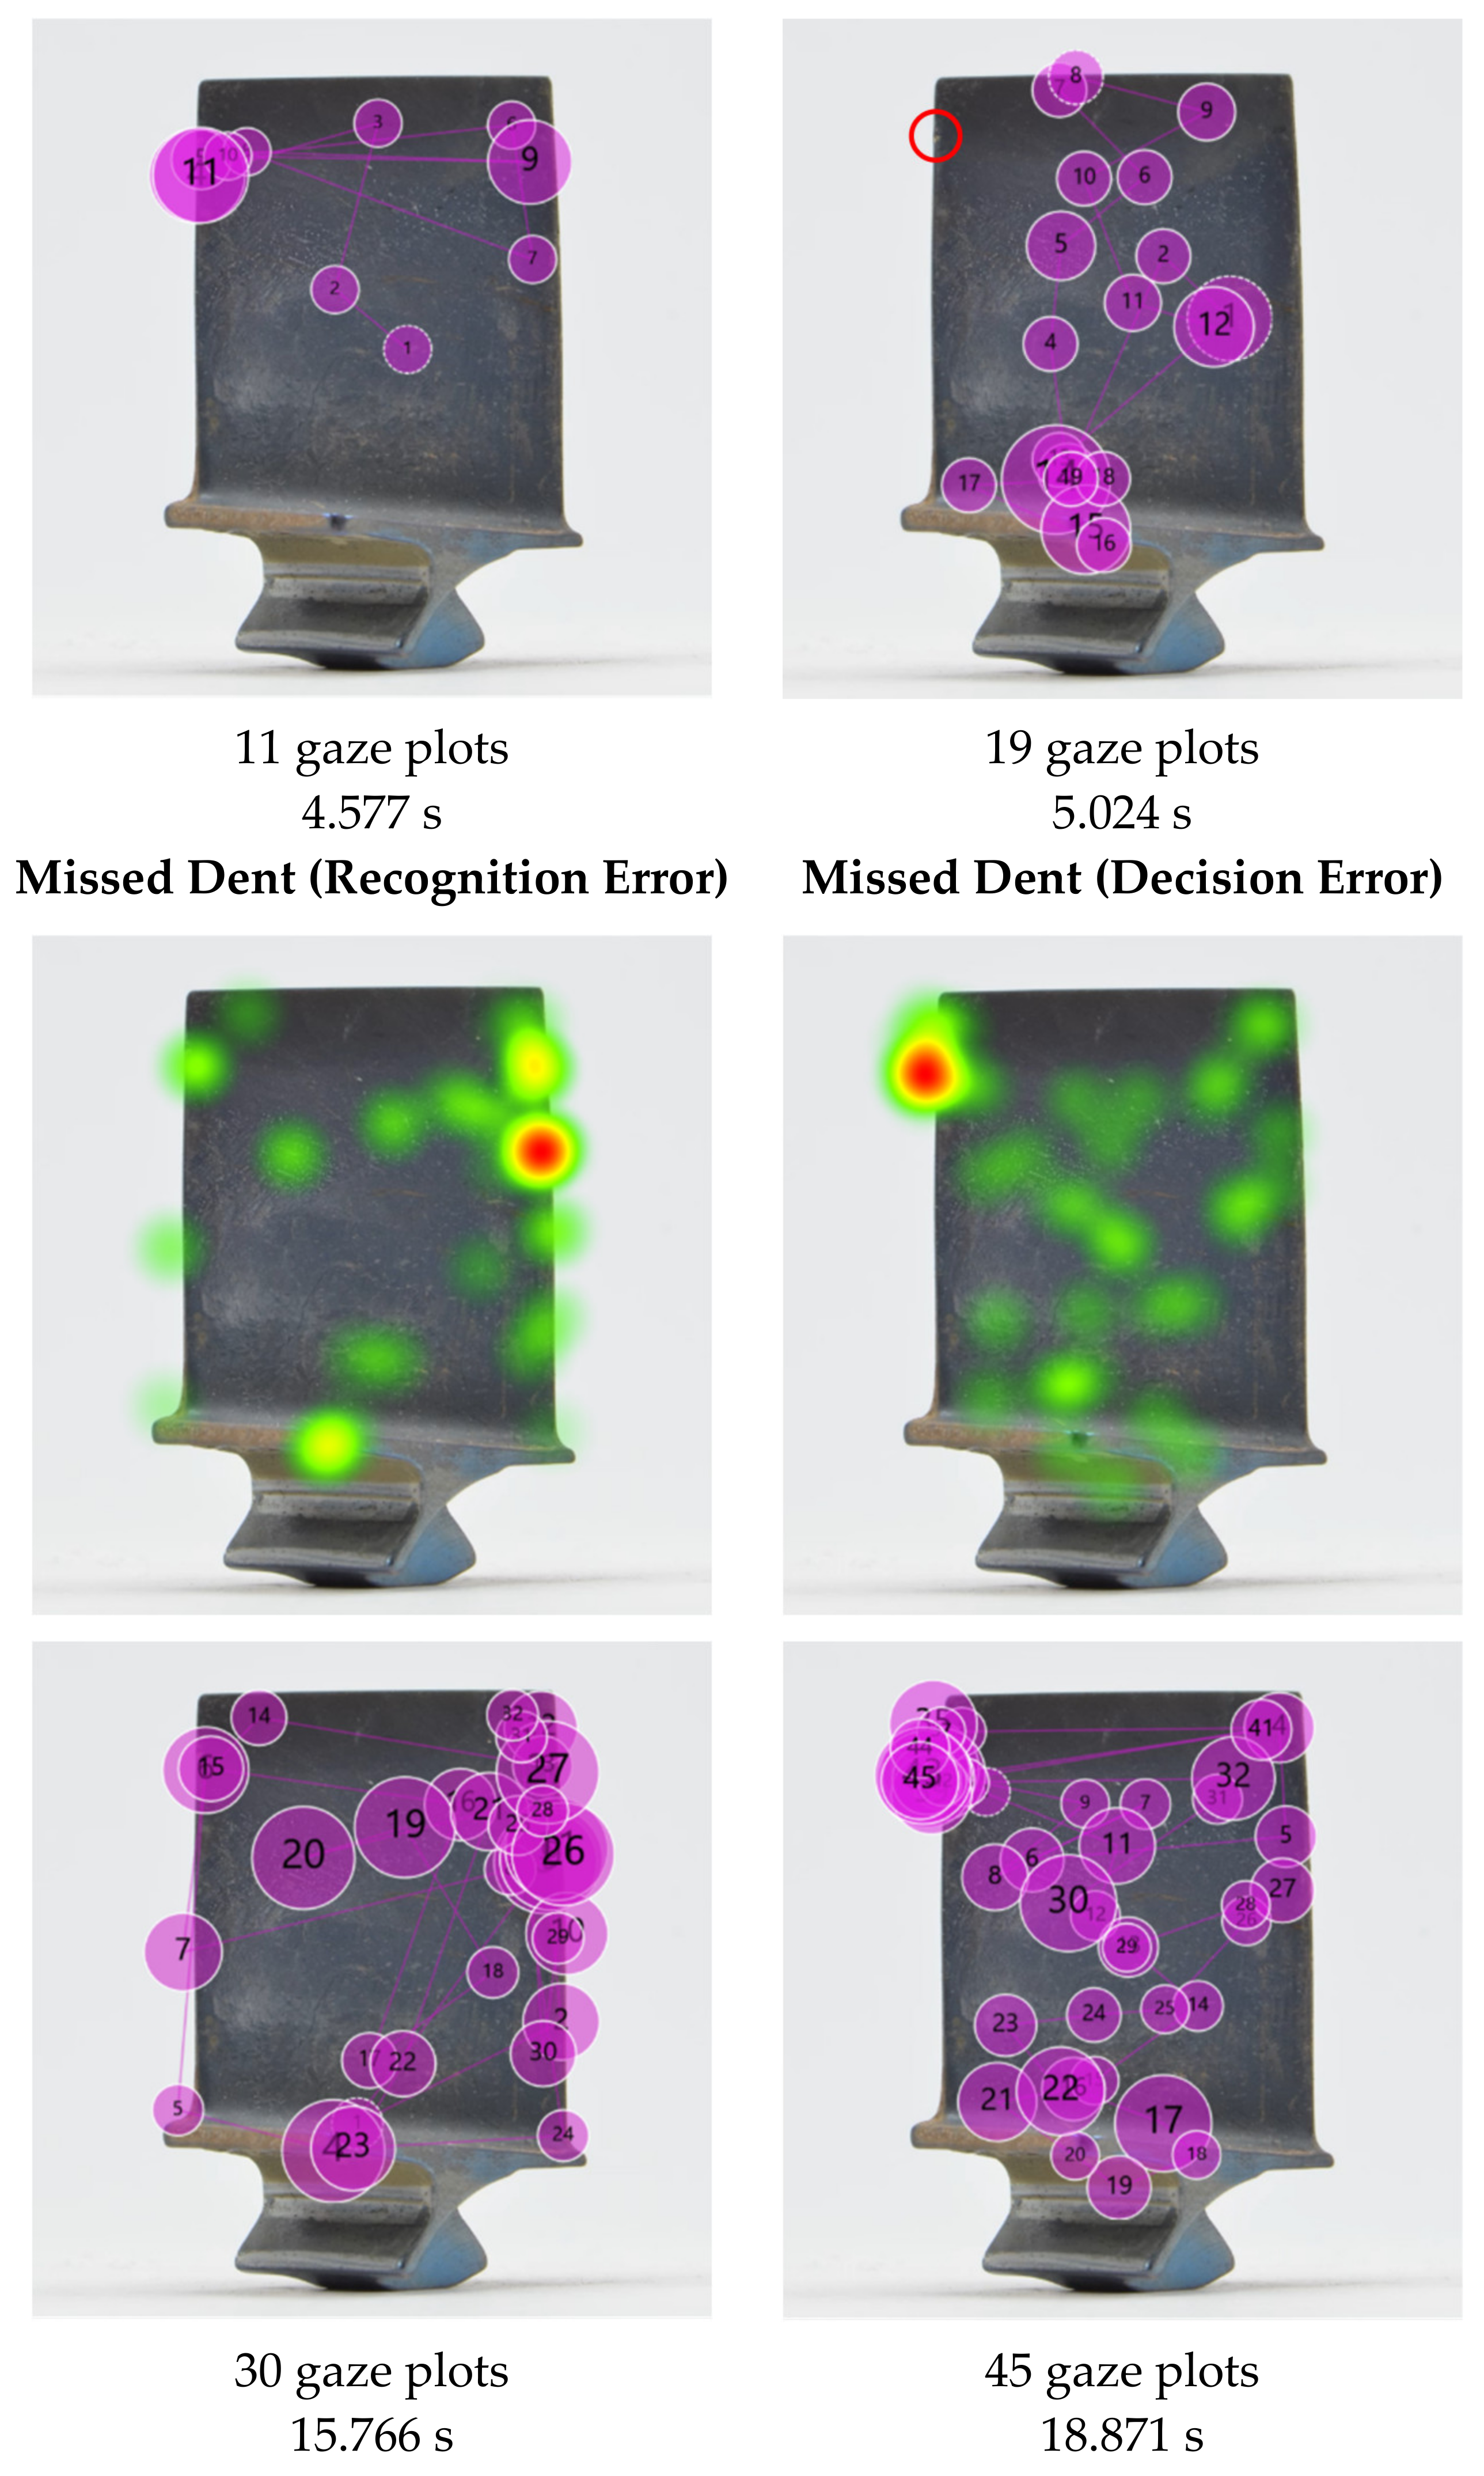
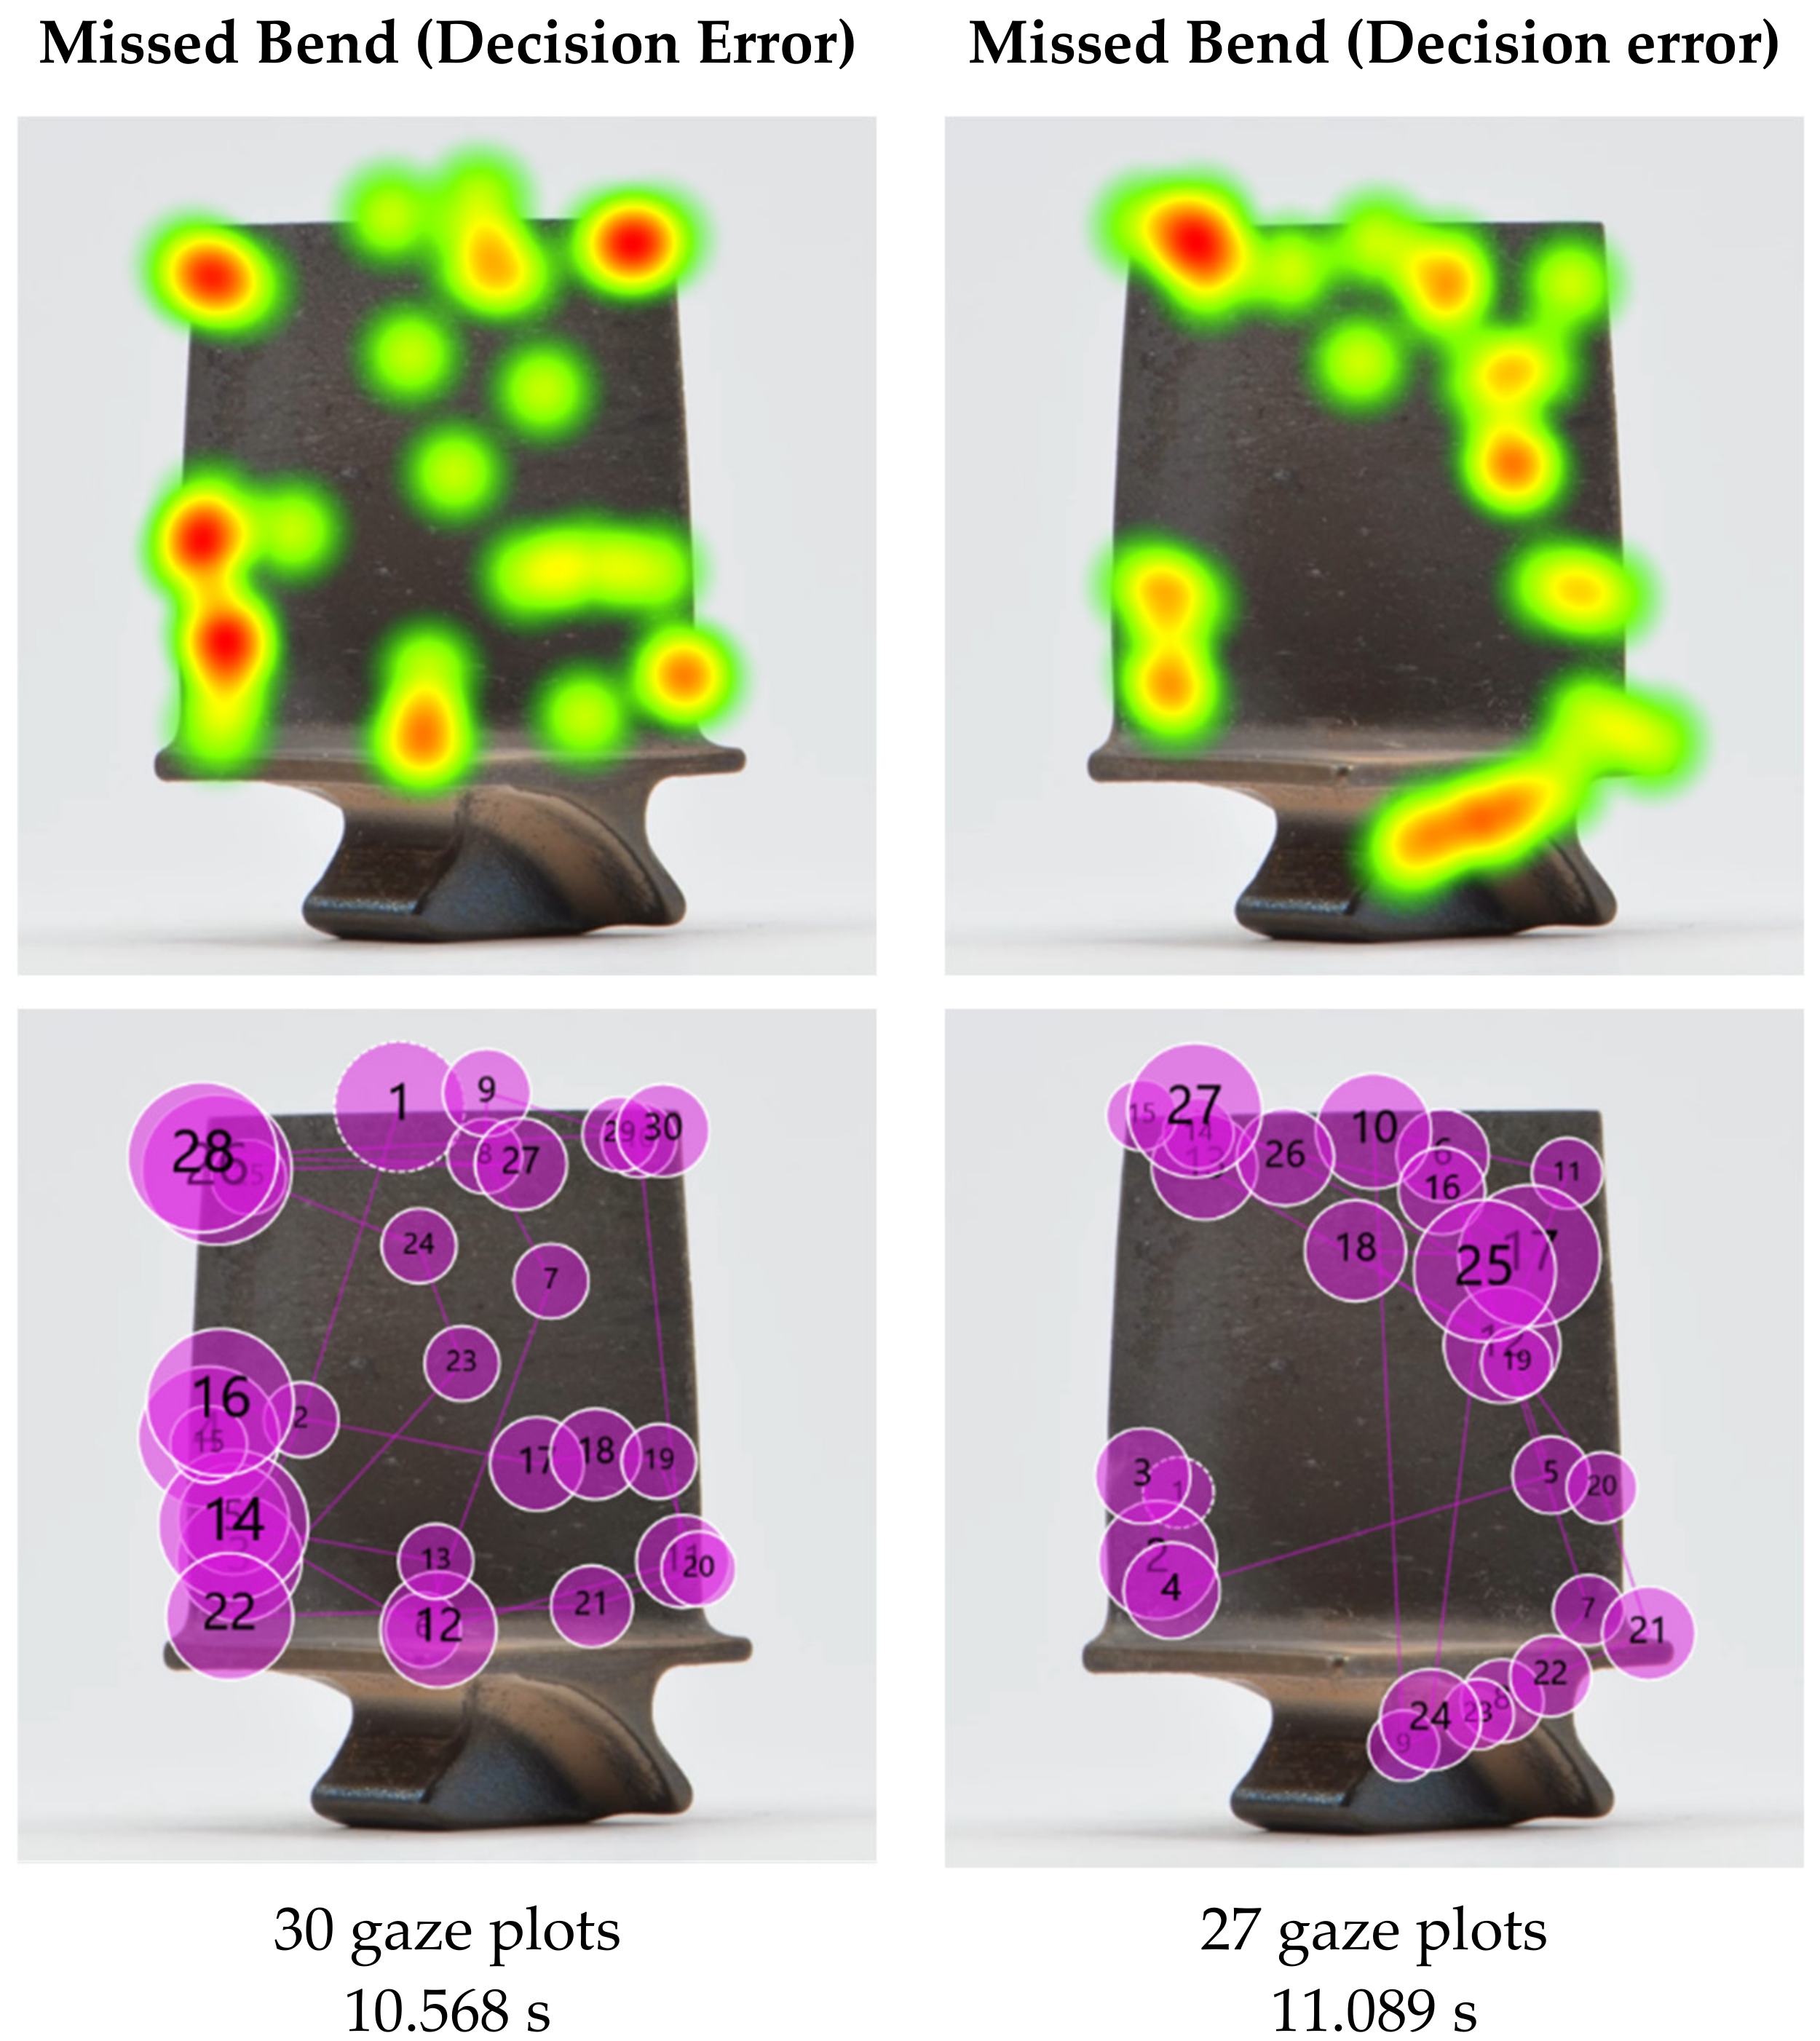
5.2. Defect Type
5.3. Severity
5.4. Blade Perspective
6. Discussion
6.1. Summary of Research Findings and Comparison with Other Studies
6.1.1. Inspection Performance
6.1.2. Inspection Approach
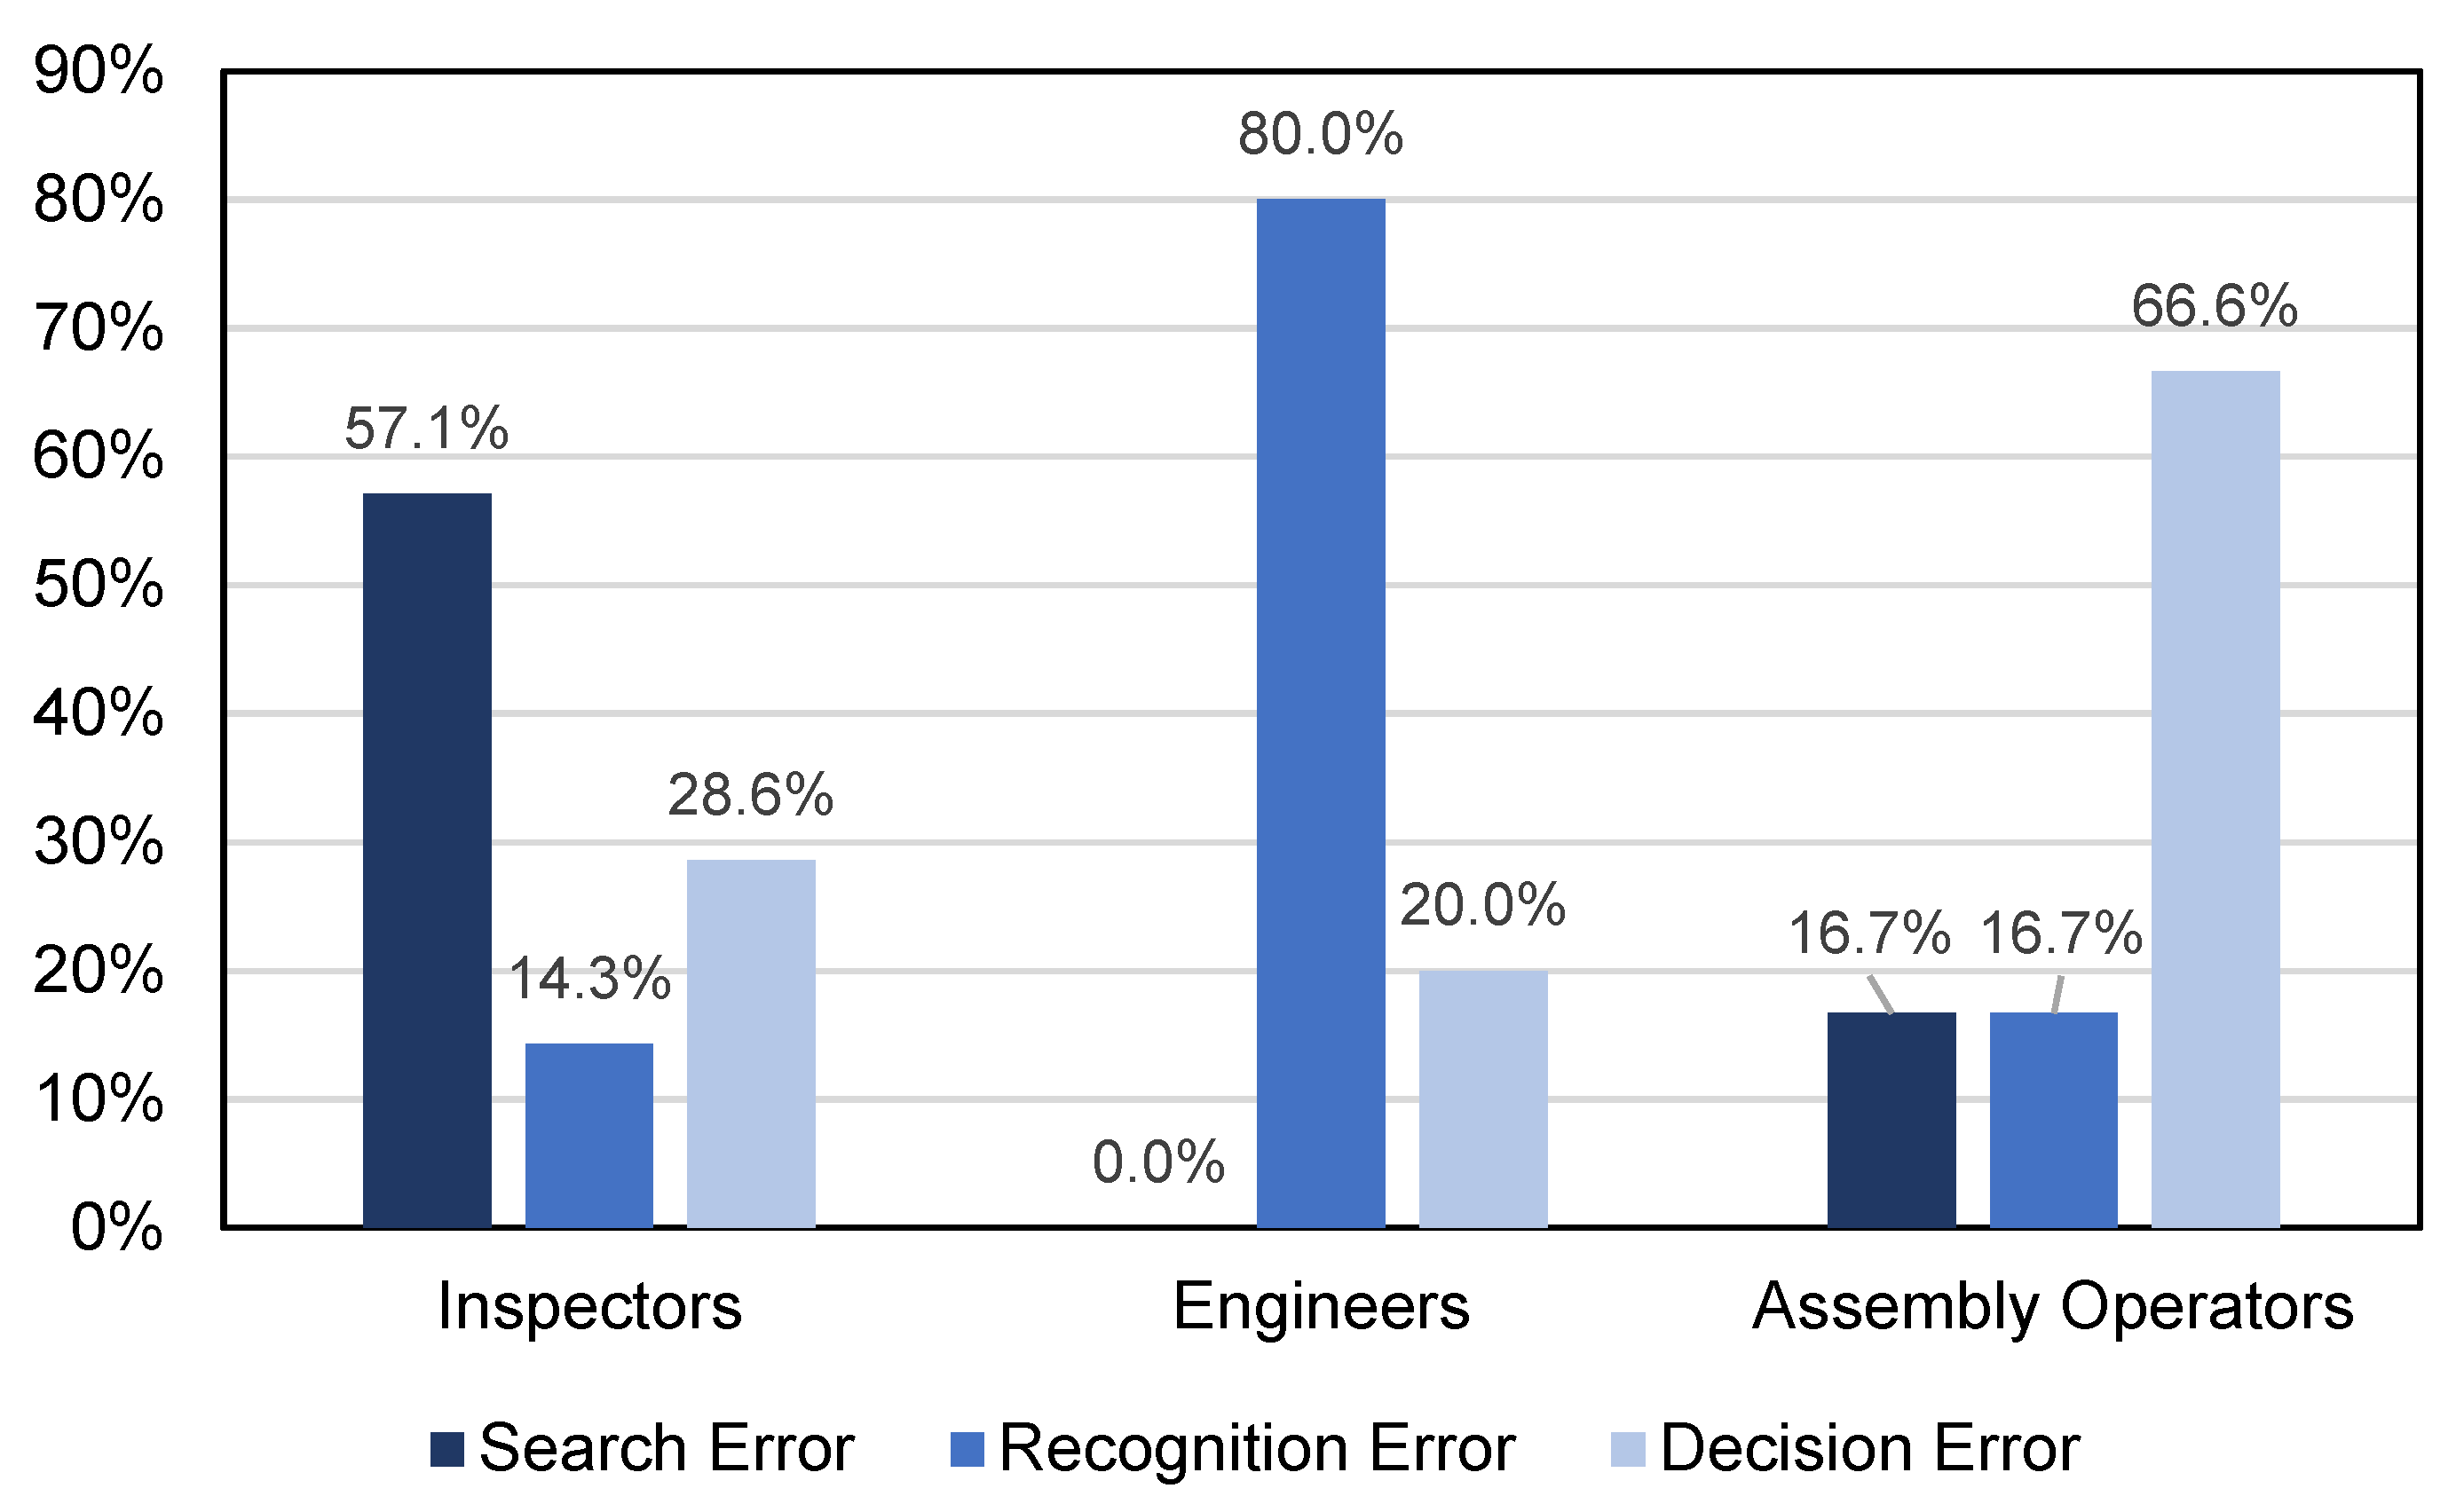
6.2. Towards a Revised Visual Inspection Framework Including Inspection Errors
6.3. Implications for Practitioners
6.3.1. Inspection Environment and Emerging Technologies
6.3.2. Training Implications
6.4. Limitations
6.5. Future Work
7. Conclusions
Author Contributions
Funding
Institutional Review Board Statement
Informed Consent Statement
Data Availability Statement
Acknowledgments
Conflicts of Interest
References
- Ackert, S. Engine maintenance concepts for financiers. Aircr. Monit. 2011, 2, 1–43. [Google Scholar]
- Latorella, K.; Prabhu, P. A review of human error in aviation maintenance and inspection. Int. J. Ind. Ergon. 2000, 26, 133–161. [Google Scholar] [CrossRef]
- Nickles, G.; Him, H.; Koenig, S.; Gramopadhye, A.; Melloy, B. A Descriptive Model of Aircraft Inspection Activities; Federal Aviation Administration (FAA): Washington, DC, USA, 2019.
- Megaw, E.D.; Richardson, J. Eye movements and industrial inspection. Appl. Ergon. 1979, 10, 145–154. [Google Scholar] [CrossRef]
- Drury, C.G.; Spencer, F.W.; Schurman, D.L. Measuring Human Detection Performance in Aircraft Visual Inspection. In Proceedings of the Human Factors and Ergonomics Society Annual Meeting, Albuquerque, NM, USA, 22–26 September 1997; Volume 41, pp. 304–308. [Google Scholar] [CrossRef]
- Hayes, A.S. Control of visual inspection. Ind. Qual. Control 1950, 6, 73–76. [Google Scholar]
- Carter, C.W. Quality Control of Visual Characteristics. In ASQC Convention Transactions; American Society Quality Control: Milwaukee, WI, USA, 1957; p. 634. [Google Scholar]
- See, J.E. Visual Inspection Reliability for Precision Manufactured Parts. Hum. Factors 2015, 57, 1427–1442. [Google Scholar] [CrossRef] [Green Version]
- Leach, J.; Morris, P.E. Cognitive Factors in the Close Visual and Magnetic Particle Inspection of Welds Underwater. Hum. Factors 1998, 40, 187–197. [Google Scholar] [CrossRef] [PubMed]
- Graybeal, B.A.; Phares, B.M.; Rolander, D.D.; Moore, M.; Washer, G. Visual Inspection of Highway Bridges. J. Nondestruct. Eval. 2002, 21, 67–83. [Google Scholar] [CrossRef]
- Heida, J.H. Characterization of inspection performance. In Proceedings of the 12th World Conference on NDT, Amsterdam, The Netherlands, 23–28 April 1989; pp. 1711–1716. [Google Scholar]
- Sadasivan, S.; Greenstein, J.S.; Gramopadhye, A.K.; Duchowski, A.T. Use of eye movements as feedforward training for a synthetic aircraft inspection task. In Proceedings of the SIGCHI Conference on Human Factors in Computing Systems, Portland, OR, USA, 2–7 April 2005; pp. 141–149. [Google Scholar]
- Aust, J.; Mitrovic, A.; Pons, D. Assessment of the Effect of Cleanliness on the Visual Inspection of Aircraft Engine Blades: An Eye Tracking Study. Sensors 2021, 21, 6135. [Google Scholar] [CrossRef]
- Cook, L. Visual Inspection Reliability for Composite Aircraft Structures; Cranfield University: Cranfield, UK, 2009. [Google Scholar]
- Baaran, J. Visual Inspection of Composite Structures; European Aviation Safety Agency (EASA): Cologne, Germany, 2009. [Google Scholar]
- Spencer, F.W. Visual Inspection Research Project Report on Benchmark Inspections; Aging Aircraft NDI Validation Center (AANC), Sandia National Labs: Albuquerque, NM, USA, 1996. [Google Scholar]
- Erhart, D.; Ostrom, L.T.; Wilhelmsen, C.A. Visual detectibility of dents on a composite aircraft inspection specimen: An initial study. Int. J. Appl. Aviat. Stud. 2004, 4, 111–122. [Google Scholar]
- Chen, X.; Ren, H.; Bil, C. Inspection Intervals Optimization for Aircraft Composite Structures Considering Dent Damage. J. Aircr. 2014, 51, 303–309. [Google Scholar] [CrossRef]
- Annis, C.; Gandossi, L.; Martin, O. Optimal sample size for probability of detection curves. Nucl. Eng. Des. 2013, 262, 98–105. [Google Scholar] [CrossRef]
- See, J.E. Visual inspection: A review of the literature. Sandia Natl. Lab. Albuq. New Mex. 2012. [Google Scholar] [CrossRef] [Green Version]
- Megaw, E.D. Factors affecting visual inspection accuracy. Appl. Ergon. 1979, 10, 27–32. [Google Scholar] [CrossRef]
- Aust, J.; Pons, D. A Systematic Methodology for Developing Bowtie in Risk Assessment: Application to Borescope Inspection. Aerospace 2020, 7, 86. [Google Scholar] [CrossRef]
- Aust, J.; Pons, D. Bowtie Methodology for Risk Analysis of Visual Borescope Inspection during Aircraft Engine Maintenance. Aerospace 2019, 6, 110. [Google Scholar] [CrossRef] [Green Version]
- Gant, S.K. Visual assessment of impact damage on painted composite aircraft structures. In Proceedings of the International SAMPE Symposium and Exhibition (Proceedings), Baltimore, MD, USA, 3–7 June 2007; Volume 52. [Google Scholar]
- Aust, J.; Pons, D. Taxonomy of Gas Turbine Blade Defects. Aerospace 2019, 6, 58. [Google Scholar] [CrossRef] [Green Version]
- Pernice, K.; Nielsen, J. How to Conduct Eyetracking Studies; Nielsen Norman Group: Fremont, CA, USA, 2019. [Google Scholar]
- Fan, M.; Shi, S.; Truong, K.N. Practices and Challenges of Using Think-Aloud Protocols in Industry: An International Survey. J. Usability Stud. 2020, 15, 85–102. [Google Scholar]
- Aust, J.; Pons, D. Methodology for Evaluating Risk of Visual Inspection Tasks of Aircraft Engine Blades. Aerospace 2021, 8, 117. [Google Scholar] [CrossRef]
- Aust, J.; Shankland, S.; Pons, D.; Mukundan, R.; Mitrovic, A. Automated Defect Detection and Decision-Support in Gas Turbine Blade Inspection. Aerospace 2021, 8, 30. [Google Scholar] [CrossRef]
- Kundel, H.L.; Nodine, C.F. Studies of Eye Movements and Visual Search in Radiology, 1st ed.; Senders, J.W., Fisher, D.F., Monty, R.A., Eds.; Lawrence Erlbaum Associates: Mahwah, NJ, USA, 1978; pp. 317–327. [Google Scholar]
- Drury, C.G.; Fox, J.G. The imperfect inspector. Hum. Reliab. Qual. Control 1975, 11–16. [Google Scholar] [CrossRef]
- Schoonard, J.W.; Gould, J.D.; Miller, L.A. Studies of visual inspection. Ergonomics 1973, 16, 365–379. [Google Scholar] [CrossRef]
- Jacobson, H.J. A study of inspector accuracy. Ind. Qual. Control 1952, 9, 16–25. [Google Scholar]
- Aust, J.; Mitrovic, A.; Pons, D. Comparison of Visual and Visual–Tactile Inspection of Aircraft Engine Blades. Aerospace 2021, 8, 313. [Google Scholar] [CrossRef]
- Waite, S. Defect Types and Inspection. In Proceedings of the MIL17 Maintenance Workshop, Chicago, IL, USA, 19–21 July 2006. [Google Scholar]
- Brunyé, T.T.; Carney, P.A.; Allison, K.H.; Shapiro, L.G.; Weaver, D.L.; Elmore, J.G. Eye Movements as an Index of Pathologist Visual Expertise: A Pilot Study. PLoS ONE 2014, 9, e103447. [Google Scholar] [CrossRef] [Green Version]
- Brunyé, T.T.; Mercan, E.; Weaver, D.L.; Elmore, J.G. Accuracy is in the eyes of the pathologist: The visual interpretive process and diagnostic accuracy with digital whole slide images. J. Biomed. Inf. 2017, 66, 171–179. [Google Scholar] [CrossRef]
- Ghanbari, L.; Wang, C.; Jeon, H.W. Industrial Energy Assessment Training Effectiveness Evaluation: An Eye-Tracking Study. Sensors 2021, 21, 1584. [Google Scholar] [CrossRef]
- Brunyé, T.T.; Drew, T.; Weaver, D.L.; Elmore, J.G. A review of eye tracking for understanding and improving diagnostic interpretation. Cogn. Res. Princ. Implic. 2019, 4, 7. [Google Scholar] [CrossRef]
- Chen, S.; Epps, J.; Ruiz, N.; Chen, F. Eye activity as a measure of human mental effort in HCI. In Proceedings of the 16th International Conference on Intelligent User Interfaces, Palo Alto, CA, USA, 13–16 February 2011; pp. 315–318. [Google Scholar]
- Debue, N.; van de Leemput, C. What does germane load mean? An empirical contribution to the cognitive load theory. Front. Psychol. 2014, 5, 1099. [Google Scholar] [CrossRef] [Green Version]
- Fabio, R.; Incorpora, C.; Falzone, A.; Caprì, T.; Errante, A.; Carrozza, C.; Mohammadhasani, N. The influence of cognitive load and amount of stimuli on entropy through eye tracking measures. EAPCogScience 2015, 1, 199–204. Available online: https://hdl.handle.net/11570/3064917 (accessed on 30 June 2021).
- Hooge, I.T.; Erkelens, C.J. Control of fixation duration in a simple search task. Percept. Psychophys. 1996, 58, 969–976. [Google Scholar] [CrossRef] [Green Version]
- Jacobs, A.M.; O’Regan, J.K. Spatial and/or temporal adjustments of scanning behavior to visibility changes. Acta Psychol. 1987, 65, 133–146. [Google Scholar] [CrossRef]
- Drury, C.G. Exploring search strategies in aircraft inspection. In Visual Search 2; Brogan, D., Gale, A., Carr, K., Eds.; Taylor & Francis Ltd.: London, UK, 1993; pp. 101–112. [Google Scholar]
- Drury, C.G.; Watson, J. Good Practices in Visual Inspection. Available online: https://www.faa.gov/about/initiatives/maintenance_hf/library/documents/#HumanFactorsMaintenance (accessed on 14 June 2021).
- Ji, Z.; Pons, D.; Pearse, J. Why do workers take safety risks?—A conceptual model for the motivation underpinning perverse agency. Safety 2018, 4, 24. [Google Scholar] [CrossRef] [Green Version]
- Heilemann, F.; Dadashi, A.; Wicke, K. Eeloscope—Towards a Novel Endoscopic System Enabling Digital Aircraft Fuel Tank Maintenance. Aerospace 2021, 8, 136. [Google Scholar] [CrossRef]
- Wang, M.; Dong, X.; Ba, W.; Mohammad, A.; Axinte, D.; Norton, A. Design, modelling and validation of a novel extra slender continuum robot for in-situ inspection and repair in aeroengine. Robot. Comput.–Integr. Manuf. 2021, 67, 102054. [Google Scholar] [CrossRef]
- Alatorre, D.; Nasser, B.; Rabani, A.; Nagy-Sochacki, A.; Dong, X.; Axinte, D.; Kell, J. Teleoperated, in situ repair of an aeroengine: Overcoming the internet latency hurdle. IEEE Robot. Autom. Mag. 2018, 26, 10–20. [Google Scholar] [CrossRef]
- Folmsbee, J.; Johnson, S.; Liu, X.; Brandwein-Weber, M.; Doyle, S. Fragile neural networks: The importance of image standardization for deep learning in digital pathology. In Medical Imaging 2019: Digital Pathology; SPIE—International Society for Optics and Photonics: Bellingham, DC, USA, 2019; Volume 10956. [Google Scholar]
- Clemons, A.J. Training Methods for Visual Inspection Tasks; Iowa State University: Ames, IA, USA, 2013. [Google Scholar]
- Wang, M.-J.; Lin, S.-C.; Drury, C. Training for strategy in visual search. Int. J. Ind. Ergon. 1997, 20, 101–108. [Google Scholar] [CrossRef]
- Khan, R.S.A.; Tien, G.; Atkins, M.S.; Zheng, B.; Panton, O.N.M.; Meneghetti, A.T. Analysis of eye gaze: Do novice surgeons look at the same location as expert surgeons during a laparoscopic operation? Surg. Endosc. 2012, 26, 3536–3540. [Google Scholar] [CrossRef]


| Demographic Factor | Levels |
|---|---|
| Expertise | Inspector, Engineer, Assembly Operator |
| Education | University degree, Diploma, Trade Certificate |
| Previous Inspection Experience | Yes, No |
| Work Experience in Aviation | 1 to 4, 5 to 9, 10 to 19, 20 and more years |
| Visual Acuity | Corrected vision, No corrected vision |
| Expertise | Borescope Inspection M (SD) | Piece-Part Inspection M (SD) |
|---|---|---|
| Inspectors (N = 18) | 66.7 (13.0) | 83.3 (10.1) |
| Engineers (N = 16) | 63.4 (11.6) | 82.1 (14.3) |
| Assembly Ops. (N = 16) | 60.7 (20.5) | 82.1 (12.2) |
| All participants (N = 50) | 63.7 (15.3) | 82.6 (12.0) |
| Defect Type | Mean Inspection Accuracy % Mean (SD) | Mean Classification Accuracy % Mean (SD) |
|---|---|---|
| Airfoil dent | 19.0 (31.8) | 5.3 (25.8) |
| Bend | 79.0 (30.5) | 58.8 (41.7) |
| Blockage | 8.0 (25.5) | 87.5 (44.7) |
| Burn | 79.5 (18.7) | 38.4 (38.2) |
| Coating Loss | 85.3 (24.4) | 98.1 (8.7) |
| Crack | 11.0 (29.1) | 73.3 (50.5) |
| Dent | 36.0 (32.0) | 54.3 (49.9) |
| Nick | 100.0 (0.0) | 90.0 (30.3) |
| No damage | 59.0 (23.0) | 100.0 (0.0) |
| Tear | 95.5 (6.1) | 44.9 (22.2) |
| Tip Curl | 89.0 (20.9) | 84.1 (29.0) |
| Tip Rub | 83.3 (16.8) | 76.0 (30.6) |
| Defect Group | Severity Level 1 M (SD) | Severity Level 2 M (SD) | Severity Level 3 M (SD) |
|---|---|---|---|
| Airfoil defects (surface damage) | 30.0 (46.3) | 76.0 (43.1) | 98.0 (14.1) |
| Edge defects (deformation) | 83.3 (37.4) | 98.0 (14.1) | 98.0 (14.1) |
| Edge defects (material loss) | 74.7 (43.6) | 96.7 (18.0) | 100 (0.0) |
| All defects | 72.0 (45.0) | 92.8 (25.9) | 99.0 (10.0) |
| Blade Perspective | Airfoil Defects (Surface Damage) M (SD) | Edge Defects (Deformation) M (SD) | Edge Defects (Material Loss) M (SD) | No Damage (Non-Defective) M (SD) | All Blades M (SD) |
|---|---|---|---|---|---|
| P1 | 98.0 (14.1) | 100.0 (0.0) | 10.0 (3.0) | 58.0 (49.9) | 66.5 (47.3) |
| P2 | 84.0 (37.0) | 98.0 (14.1) | 100.0 (0.0) | 44.0 (50.1) | 81.5 (38.9) |
| P3 | 100.0 (0.0) | 96.0 (19.8) | 100.0 (0.0) | 54.0 (50.4) | 87.5 (33.2) |
| P4 | 80.0 (40.1) | 98.0 (14.1) | 100.0 (0.0) | 44.0 (50.1) | 80.5 (39.7) |
| P5 | 38.0 (6.9) | 20.0 (5.7) | 100.0 (0.0) | 46.0 (50.4) | 51.0 (50.1) |
| P6 | 34.0 (47.9) | 100.0 (0.0) | 100.0 (0.0) | 64.0 (48.5) | 74.5 (43.7) |
| P7 | 64.0 (48.5) | 46.0 (7.1) | 100.0 (0.0) | 66.0 (47.9) | 69.0 (46.4) |
| P8 | 86.0 (35.1) | 96.0 (2.8) | 98.0 (2.0) | 44.0 (50.1) | 81.0 (39.3) |
| Defect Type | White M (SD) | Red M (SD) | Green M (SD) | Yellow M (SD) |
|---|---|---|---|---|
| Surface defects | 80.0 (40.4) | 86.0 (35.1) | 86.0 (35.1) | 82.0 (38.8) |
| Edge defects | 100.0 (0.0) | 100.0 (0.0) | 100.0 (0.0) | 100 (0.0) |
| No damage | 30.0 (46.3) | 38.0 (49.0) | 22.0 (41.9) | 46.0 (50.4) |
| All defects | 77.5 (41.9) | 81.0 (39.3) | 77.0 (42.2) | 82.0 (38.5) |
| Effect | Reference Level | Level of Effect | Wald. Stat | Estimate | Lower CL 95% | Upper CL 95% | p |
|---|---|---|---|---|---|---|---|
| Inspection Error | Recognition Error | Search Error | 14.2811 | −0.817130 | −1.24093 | −0.393333 | <0.001 |
| Inspection Error | Recognition Error | Decision Error | 43.3729 | 0.786754 | 0.55261 | 1.020895 | <0.001 |
| Hypotheses | Findings | |
|---|---|---|
| H1 | The inspection type affects the inspection performance. | Accepted. Piece-part inspection showed a higher inspection rate than borescope inspection. |
| H2 | The defect type affects the inspection and classification accuracy. | Accepted. Nicks, tears, and tip curls had the highest detection rates, while blockage, cracks, and airfoil dents were the categories more often missed. The classification accuracy was highest for coating loss, nicks, blockage, and tip curl. Airfoil dents, burns, and tears were most difficult to classify. |
| H3 | The defect severity affects the inspection performance. | Accepted. The inspection accuracy decreased with decreasing severity and the critical threshold was identified between severity level S1 and S2. |
| H4 | The blade perspective affects the inspection performance. | Accepted. Perspective P3 lead to the highest accuracy, while P2, P4, and P8 also achieved good results. The worst perspective was P5. |
| H5 | The background colour affects the inspection performance. | Rejected. The background colour had no impact on the inspection performance. |
| Process Step (Hazard) | Process Description | Potential Error (Top Event) and Possible Causes (Threats) | Tasks in the Example of Borescope Inspection (Barriers) |
|---|---|---|---|
| 1. Initiation | Inspection workplace setup and part preparation. Provision and setup of required inspection tools. Comprehend standard working procedure (SOP). | Initiation error:
| Pre-wash engine, select appropriate borescope tip and correct camera settings, read and comply with engine manual and standard work procedures. |
| 2. Access | Locate inspection area and gain access to location. Ensure best possible position for reliable part inspection. | Access error:
| Remove borescope hole plug, insert borescope, and manoeuvre borescope into appropriate location for blade inspection. |
| 3. Search | Comprehensively scan the part and systematically search for any irregularity. Ensure an adequate search strategy covering the entire stimulus is used. | Search error:
| Start video recording, initiate engine rotation, and search for any damages on the blade. |
| 4. Recognition | Process visual information and perceive indications of possible anomalies. Recognise that the part differs from its ideal condition and discriminate against other possibilities. | Recognition error:
| Pause engine rotation if indication is found. Inspect finding in detail. |
| 5. Judgement | Classify indication as condition or defect. Determine defect type and compare finding to corresponding limits in standard. Decide whether finding is within limits (acceptable) or outside limits (reject). | Decision or judgement error:
| Decide whether the finding is acceptable or needs to be repaired, i.e., whether an engine tear-down is required. |
| 6. Response | Record and report findings. Complete inspection documentation. | Response error:
| Take a picture (snapshot) of the paused borescope video, report finding (classify defect and location). Repeat from step 3 until all blades are inspected. |
| 7. Completion | Remove equipment from inspection area and return to storage for next use. Release part to next process in accordance with inspection outcomes (e.g., repair). | Completion error:
| Remove borescope and re-install borescope plug. Repeat from step 2 until all stages have been inspected. Continue maintenance procedure, e.g., engine tear down and repair. |
Publisher’s Note: MDPI stays neutral with regard to jurisdictional claims in published maps and institutional affiliations. |
© 2021 by the authors. Licensee MDPI, Basel, Switzerland. This article is an open access article distributed under the terms and conditions of the Creative Commons Attribution (CC BY) license (https://creativecommons.org/licenses/by/4.0/).
Share and Cite
Aust, J.; Pons, D.; Mitrovic, A. Evaluation of Influence Factors on the Visual Inspection Performance of Aircraft Engine Blades. Aerospace 2022, 9, 18. https://doi.org/10.3390/aerospace9010018
Aust J, Pons D, Mitrovic A. Evaluation of Influence Factors on the Visual Inspection Performance of Aircraft Engine Blades. Aerospace. 2022; 9(1):18. https://doi.org/10.3390/aerospace9010018
Chicago/Turabian StyleAust, Jonas, Dirk Pons, and Antonija Mitrovic. 2022. "Evaluation of Influence Factors on the Visual Inspection Performance of Aircraft Engine Blades" Aerospace 9, no. 1: 18. https://doi.org/10.3390/aerospace9010018