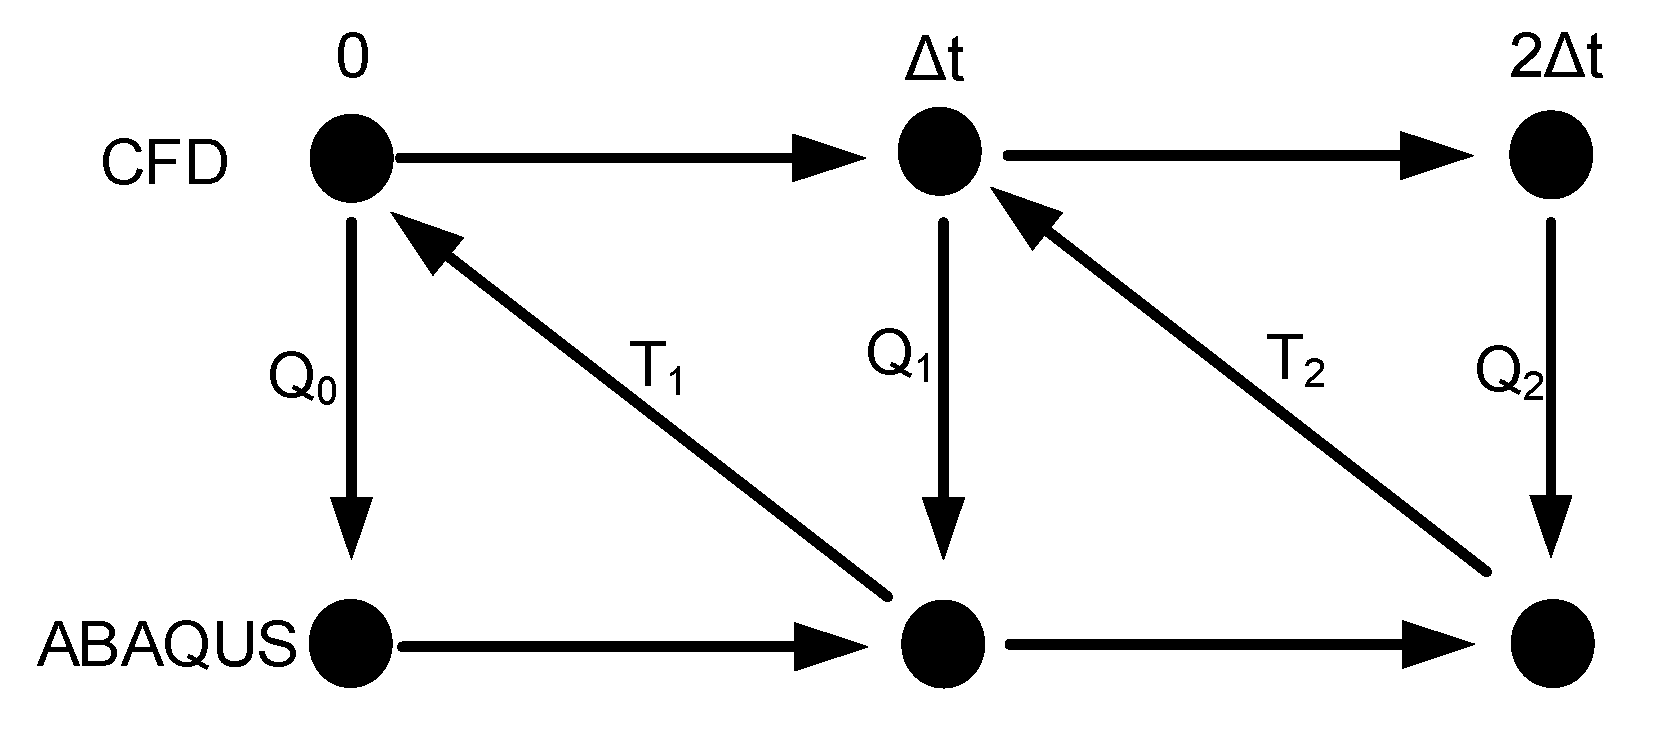
Figure 1.
Transient coupled method.
Figure 1.
Transient coupled method.
Figure 2.
Computational grids and boundary conditions.
Figure 2.
Computational grids and boundary conditions.
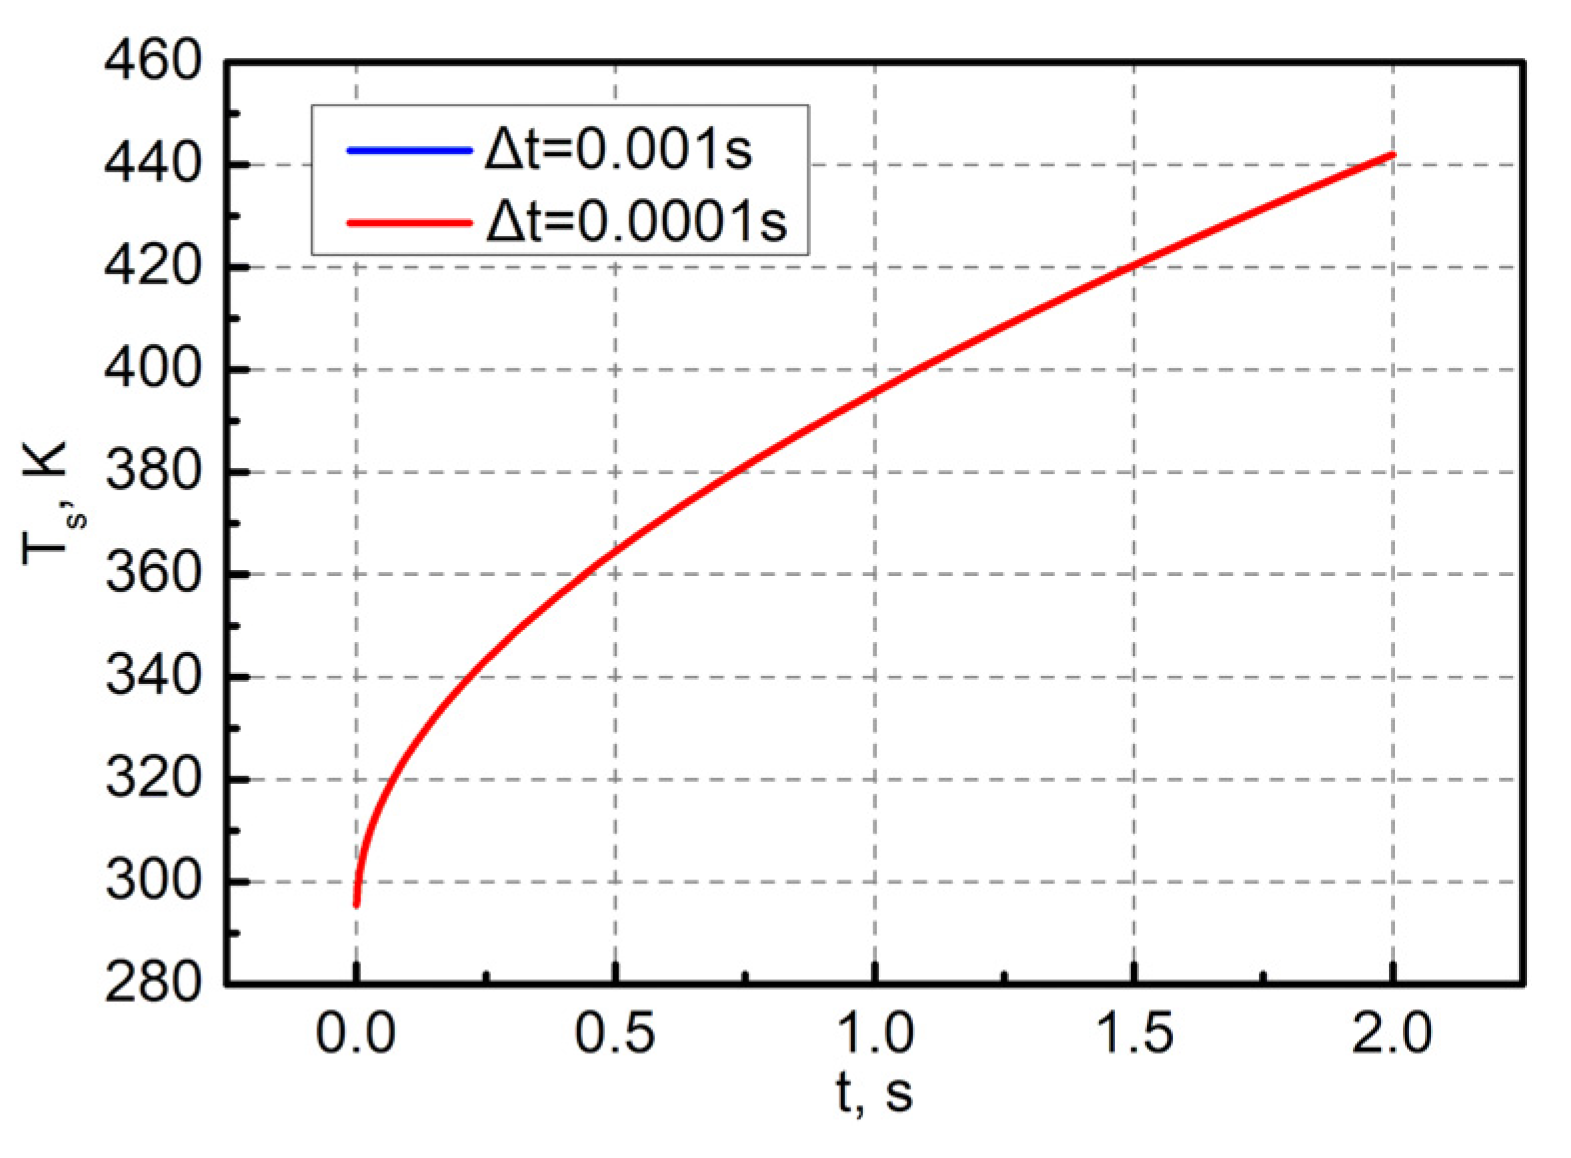
Figure 3.
Variation of stagnation temperature with time.
Figure 3.
Variation of stagnation temperature with time.
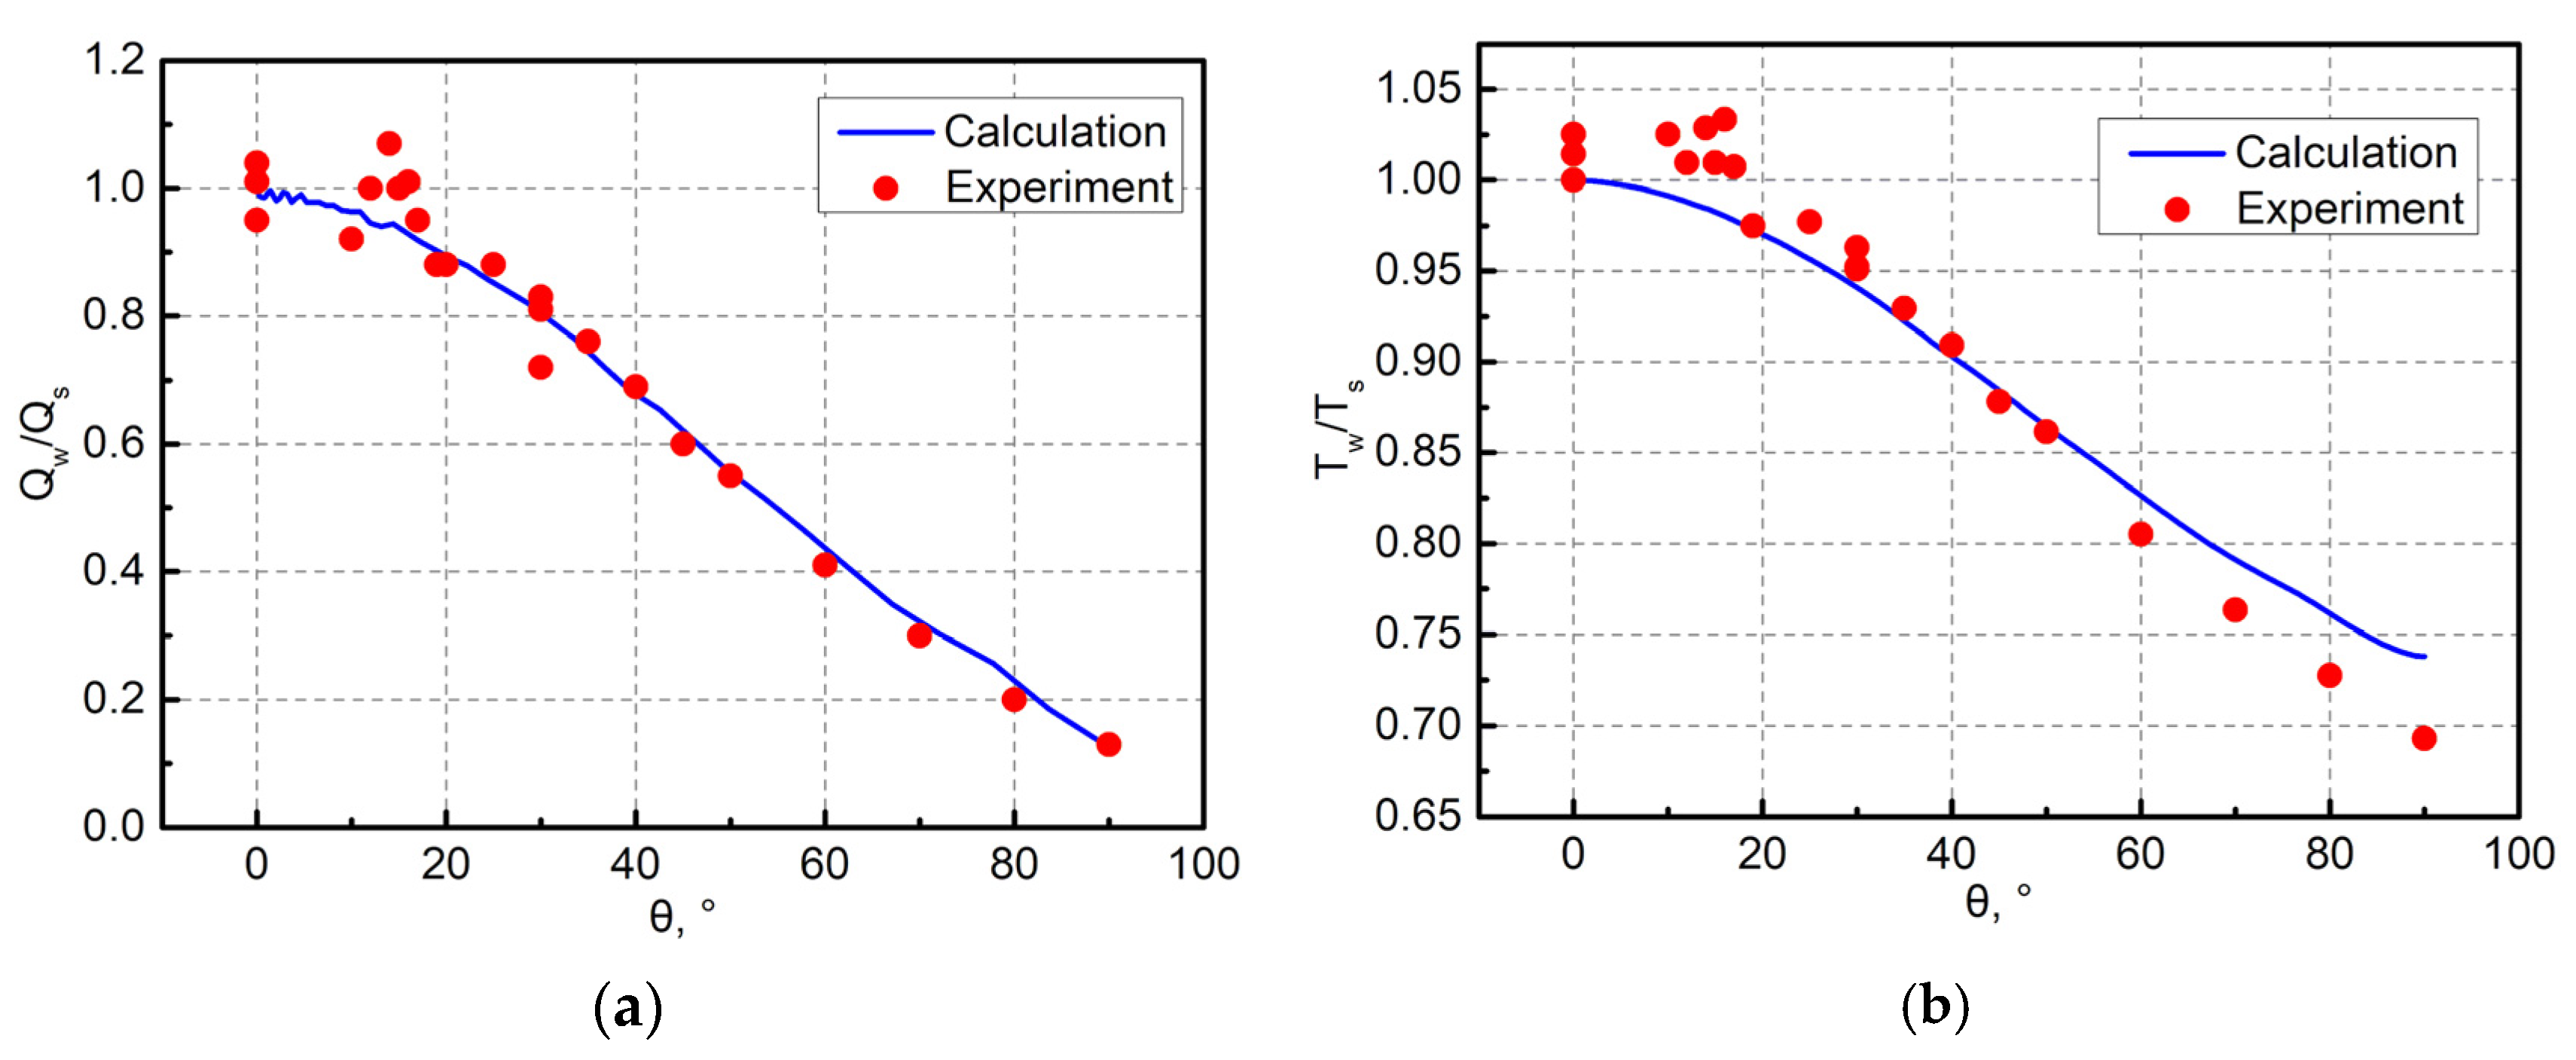
Figure 4.
Dimensionless heat flux and dimensionless temperature distributions of the outer wall at 2 s: (a) heat flux; (b) temperature.
Figure 4.
Dimensionless heat flux and dimensionless temperature distributions of the outer wall at 2 s: (a) heat flux; (b) temperature.
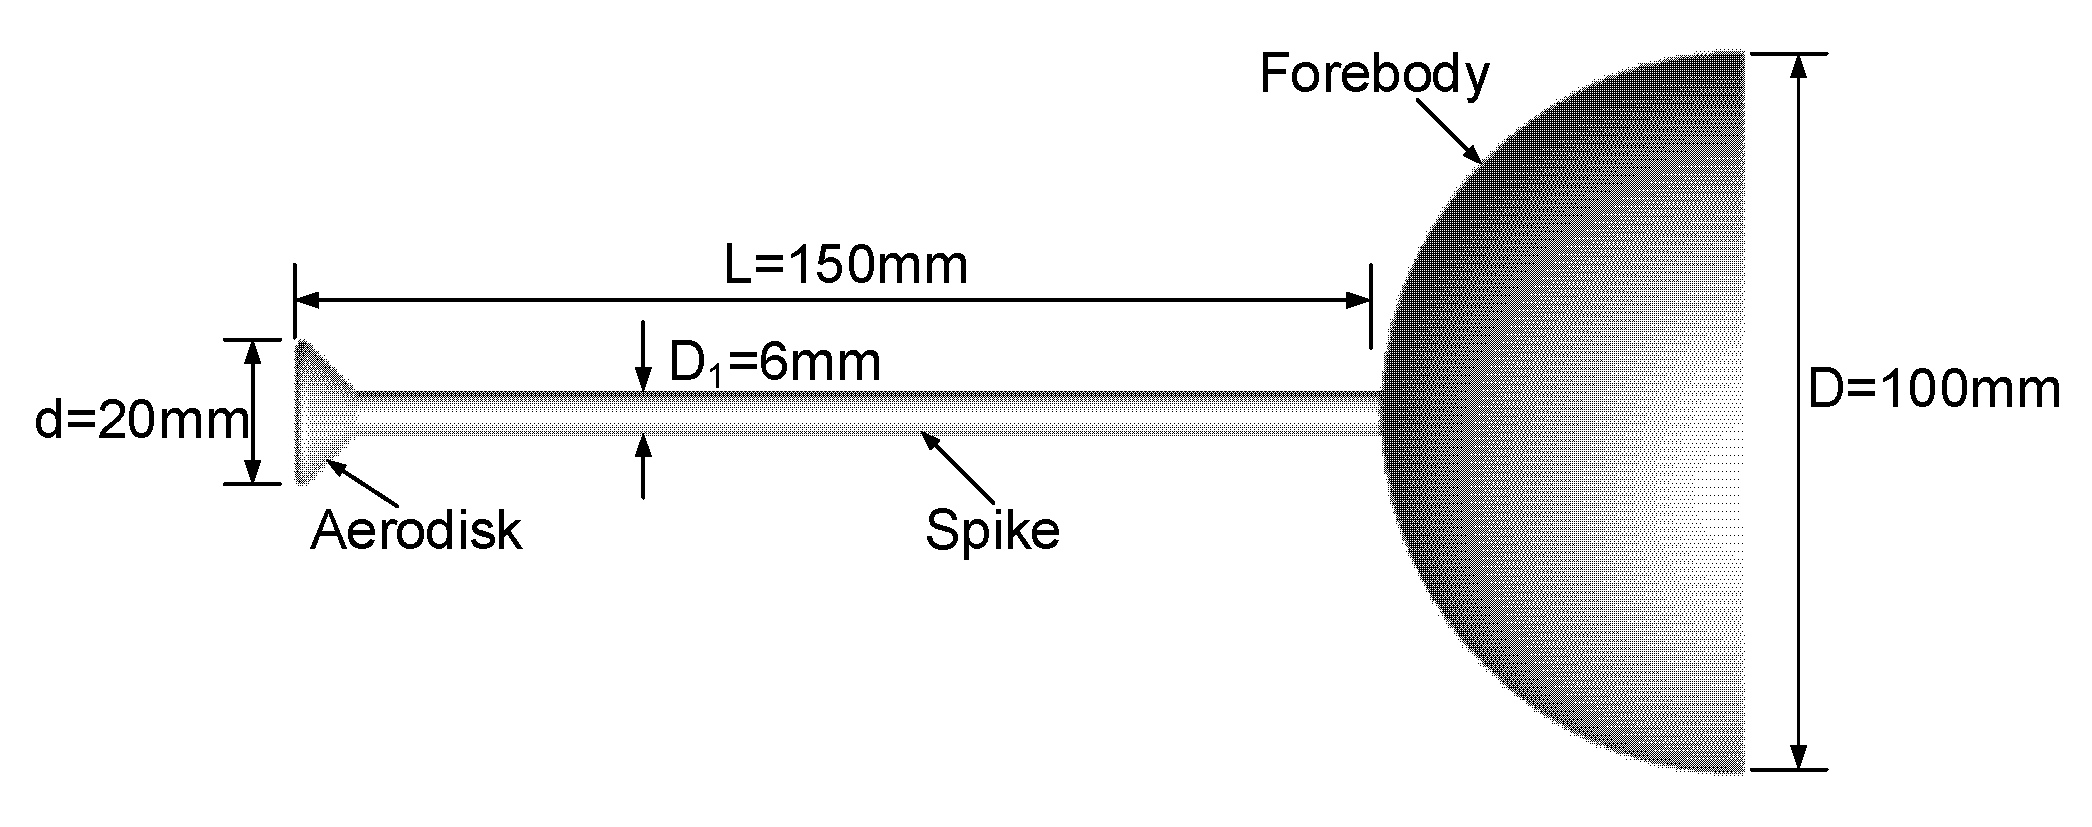
Figure 5.
Typical spiked blunt body with an aerodisk.
Figure 5.
Typical spiked blunt body with an aerodisk.
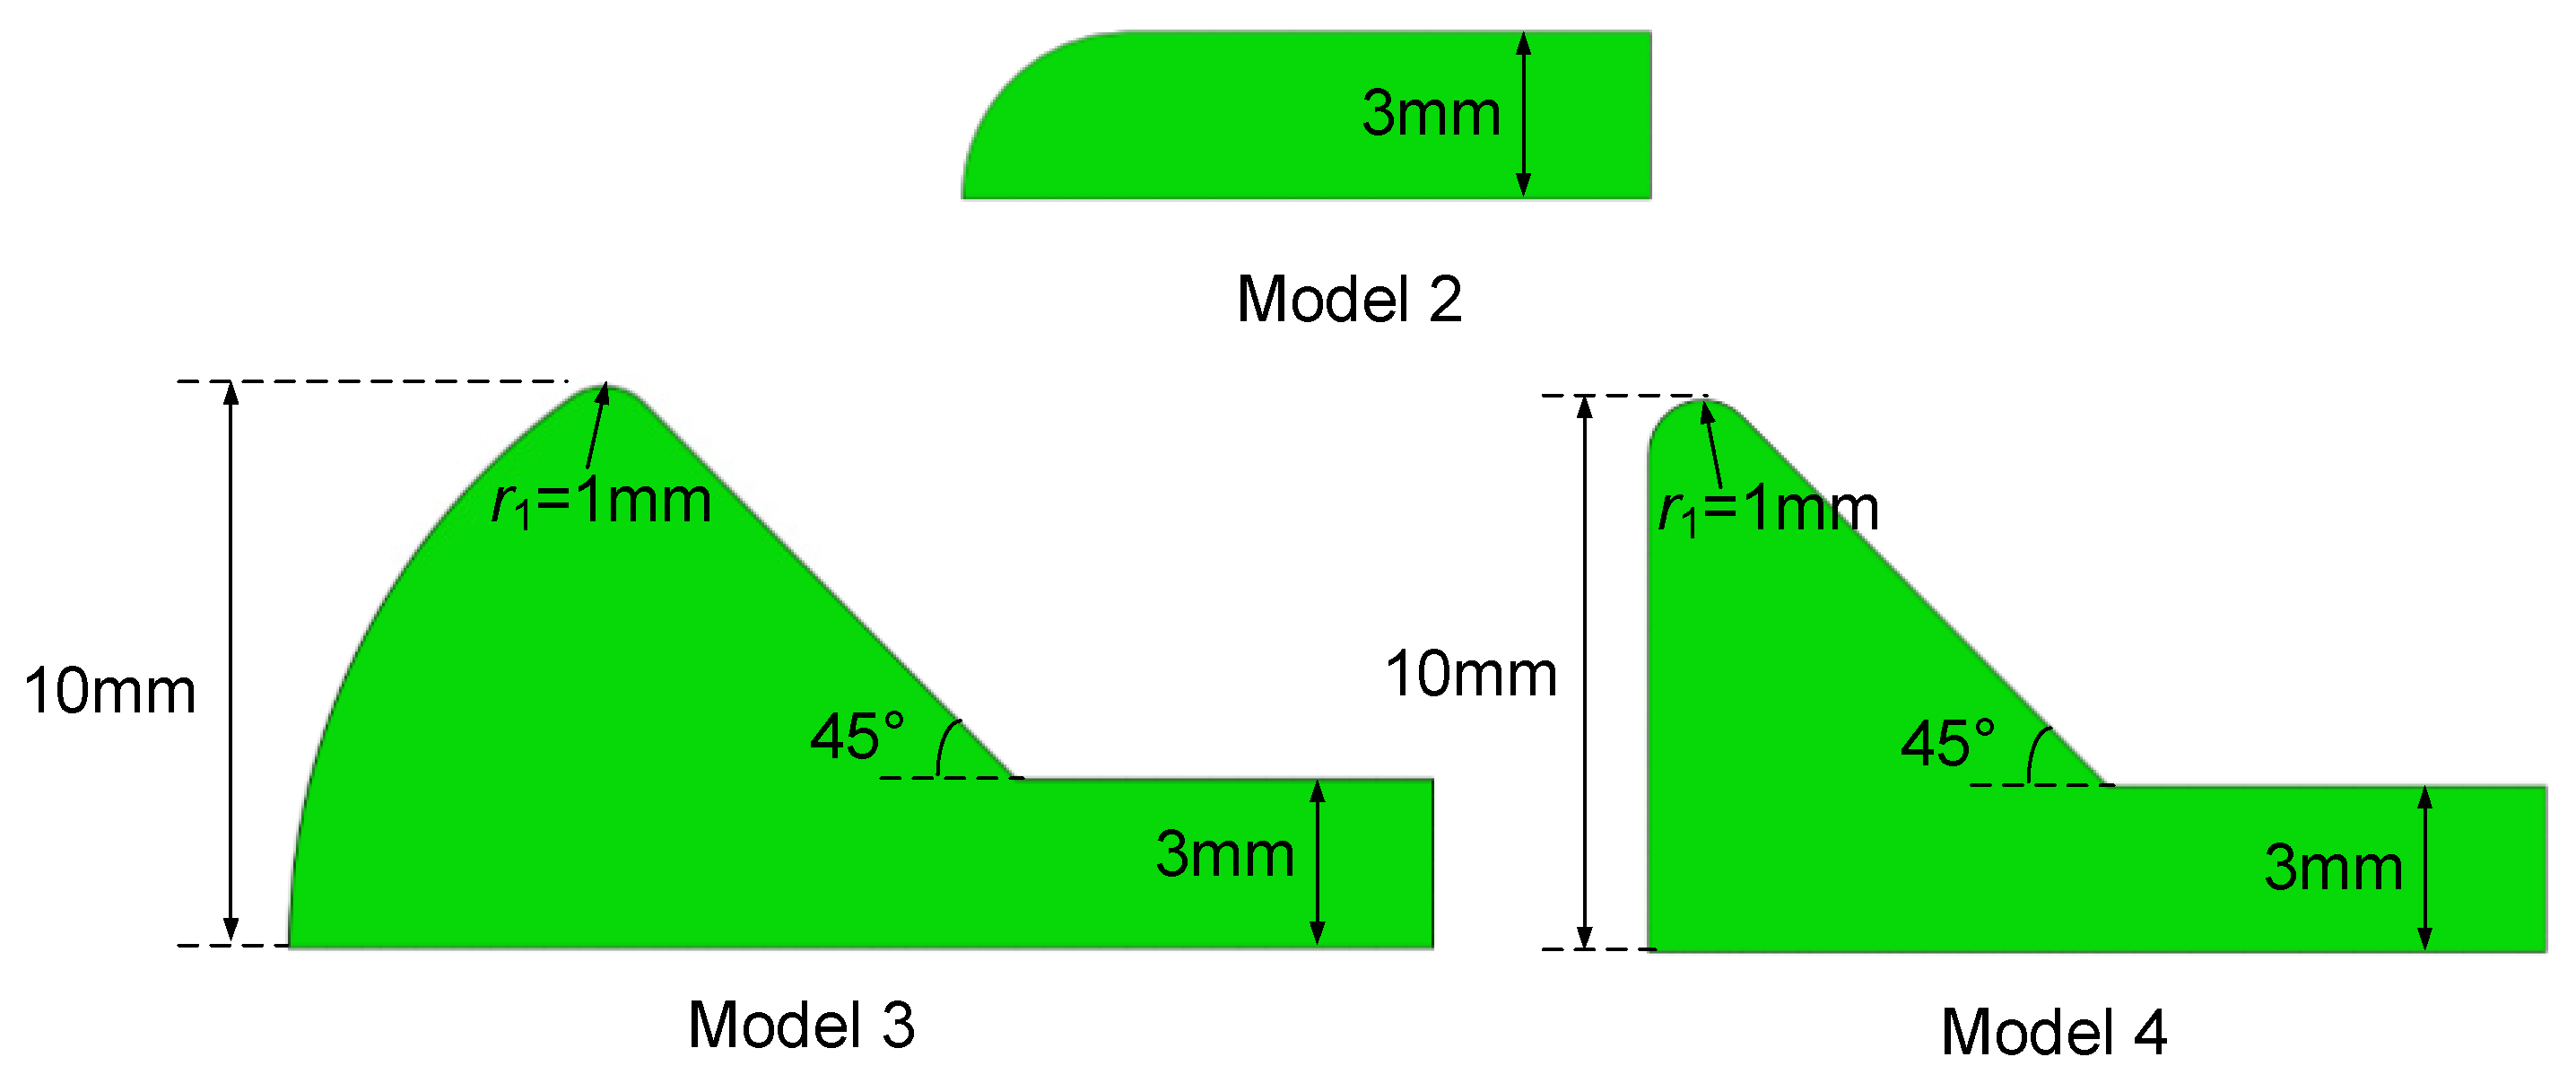
Figure 6.
Different spikes.
Figure 6.
Different spikes.
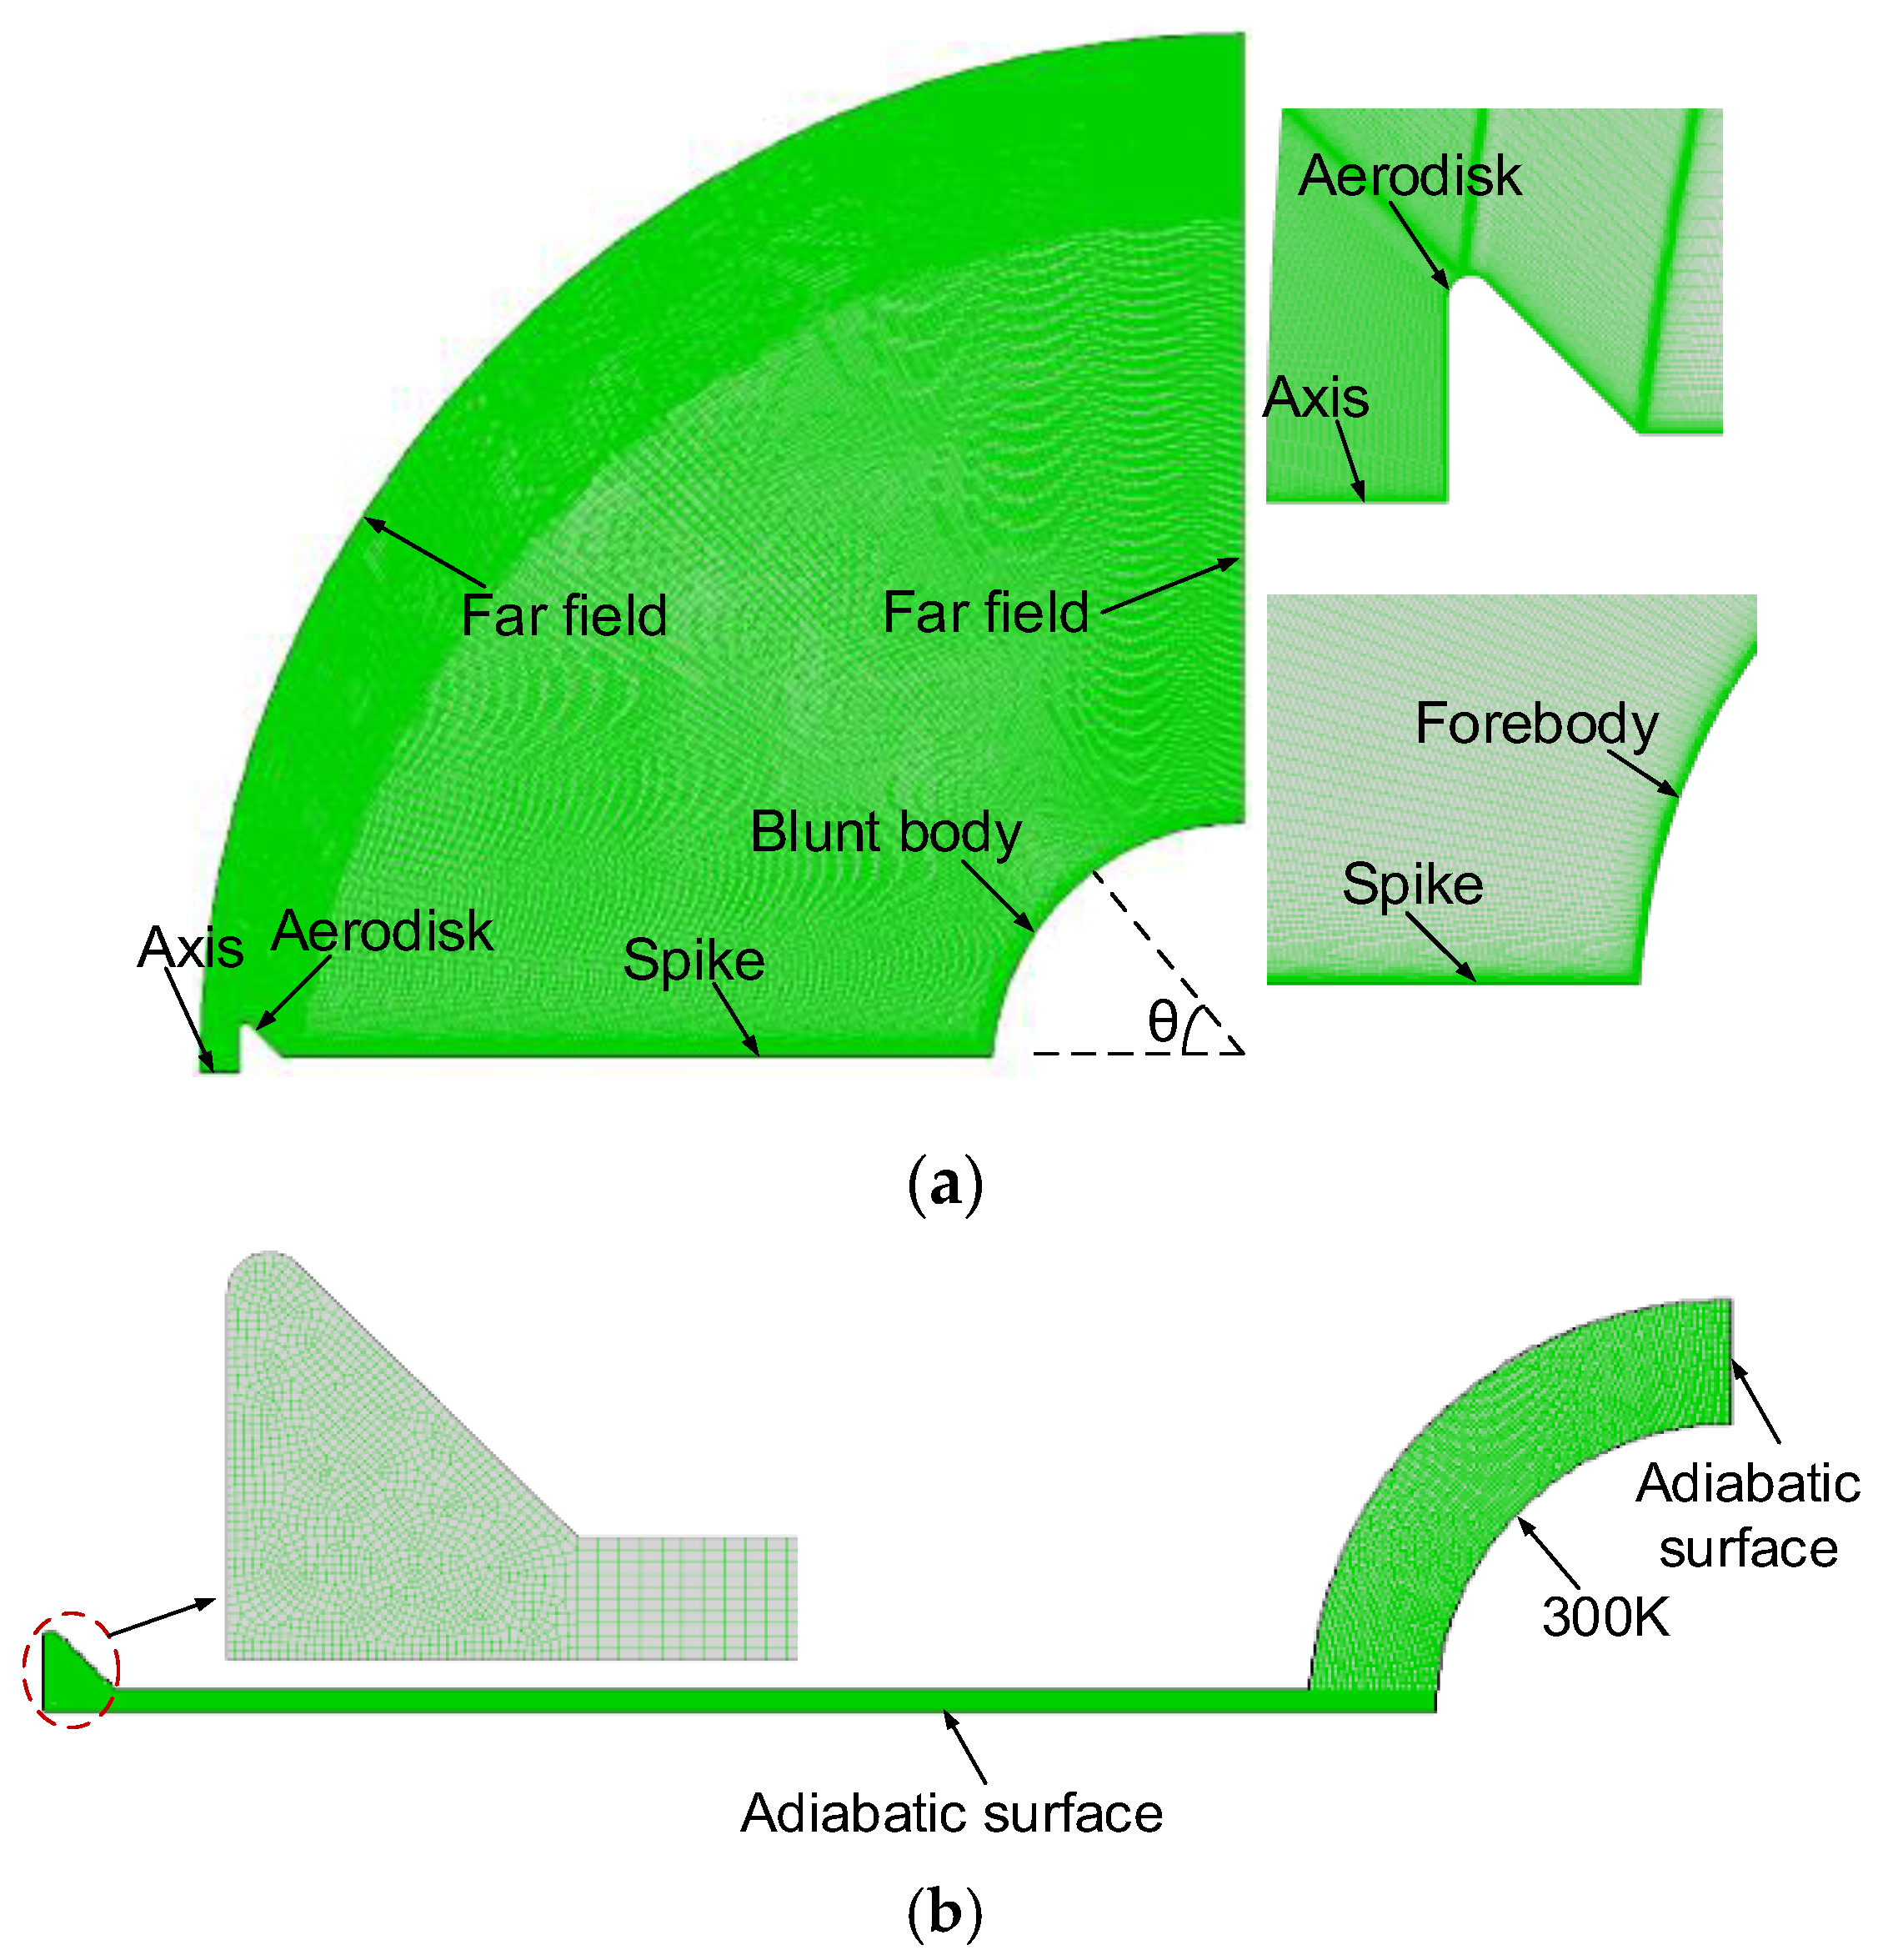
Figure 7.
Computational grids of model 4: (a) fluid; (b) structure.
Figure 7.
Computational grids of model 4: (a) fluid; (b) structure.
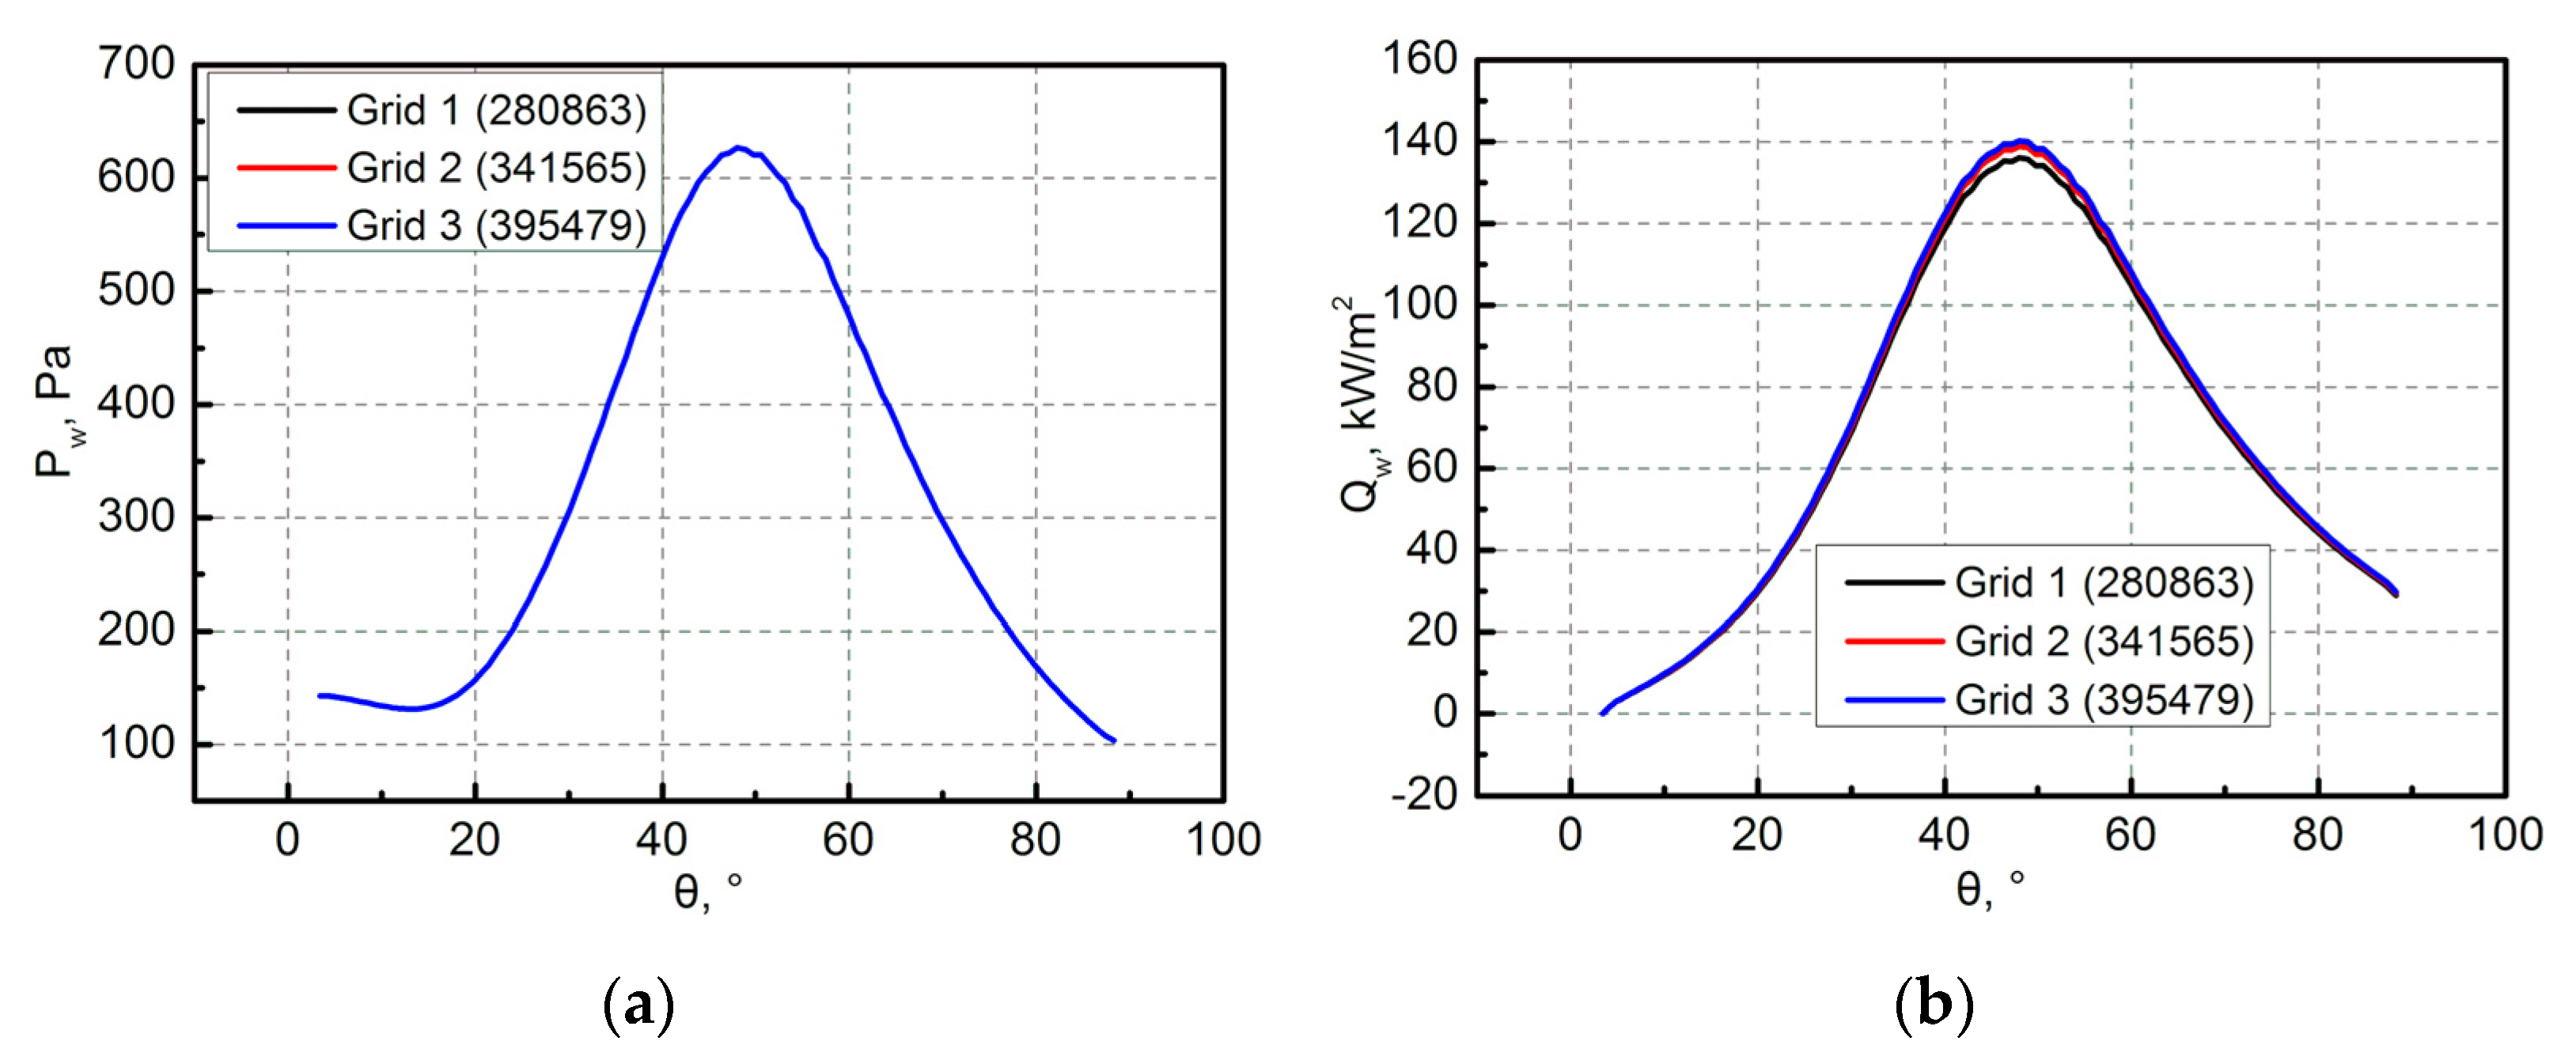
Figure 8.
Grid independency analysis results: (a) pressure; (b) heat flux.
Figure 8.
Grid independency analysis results: (a) pressure; (b) heat flux.
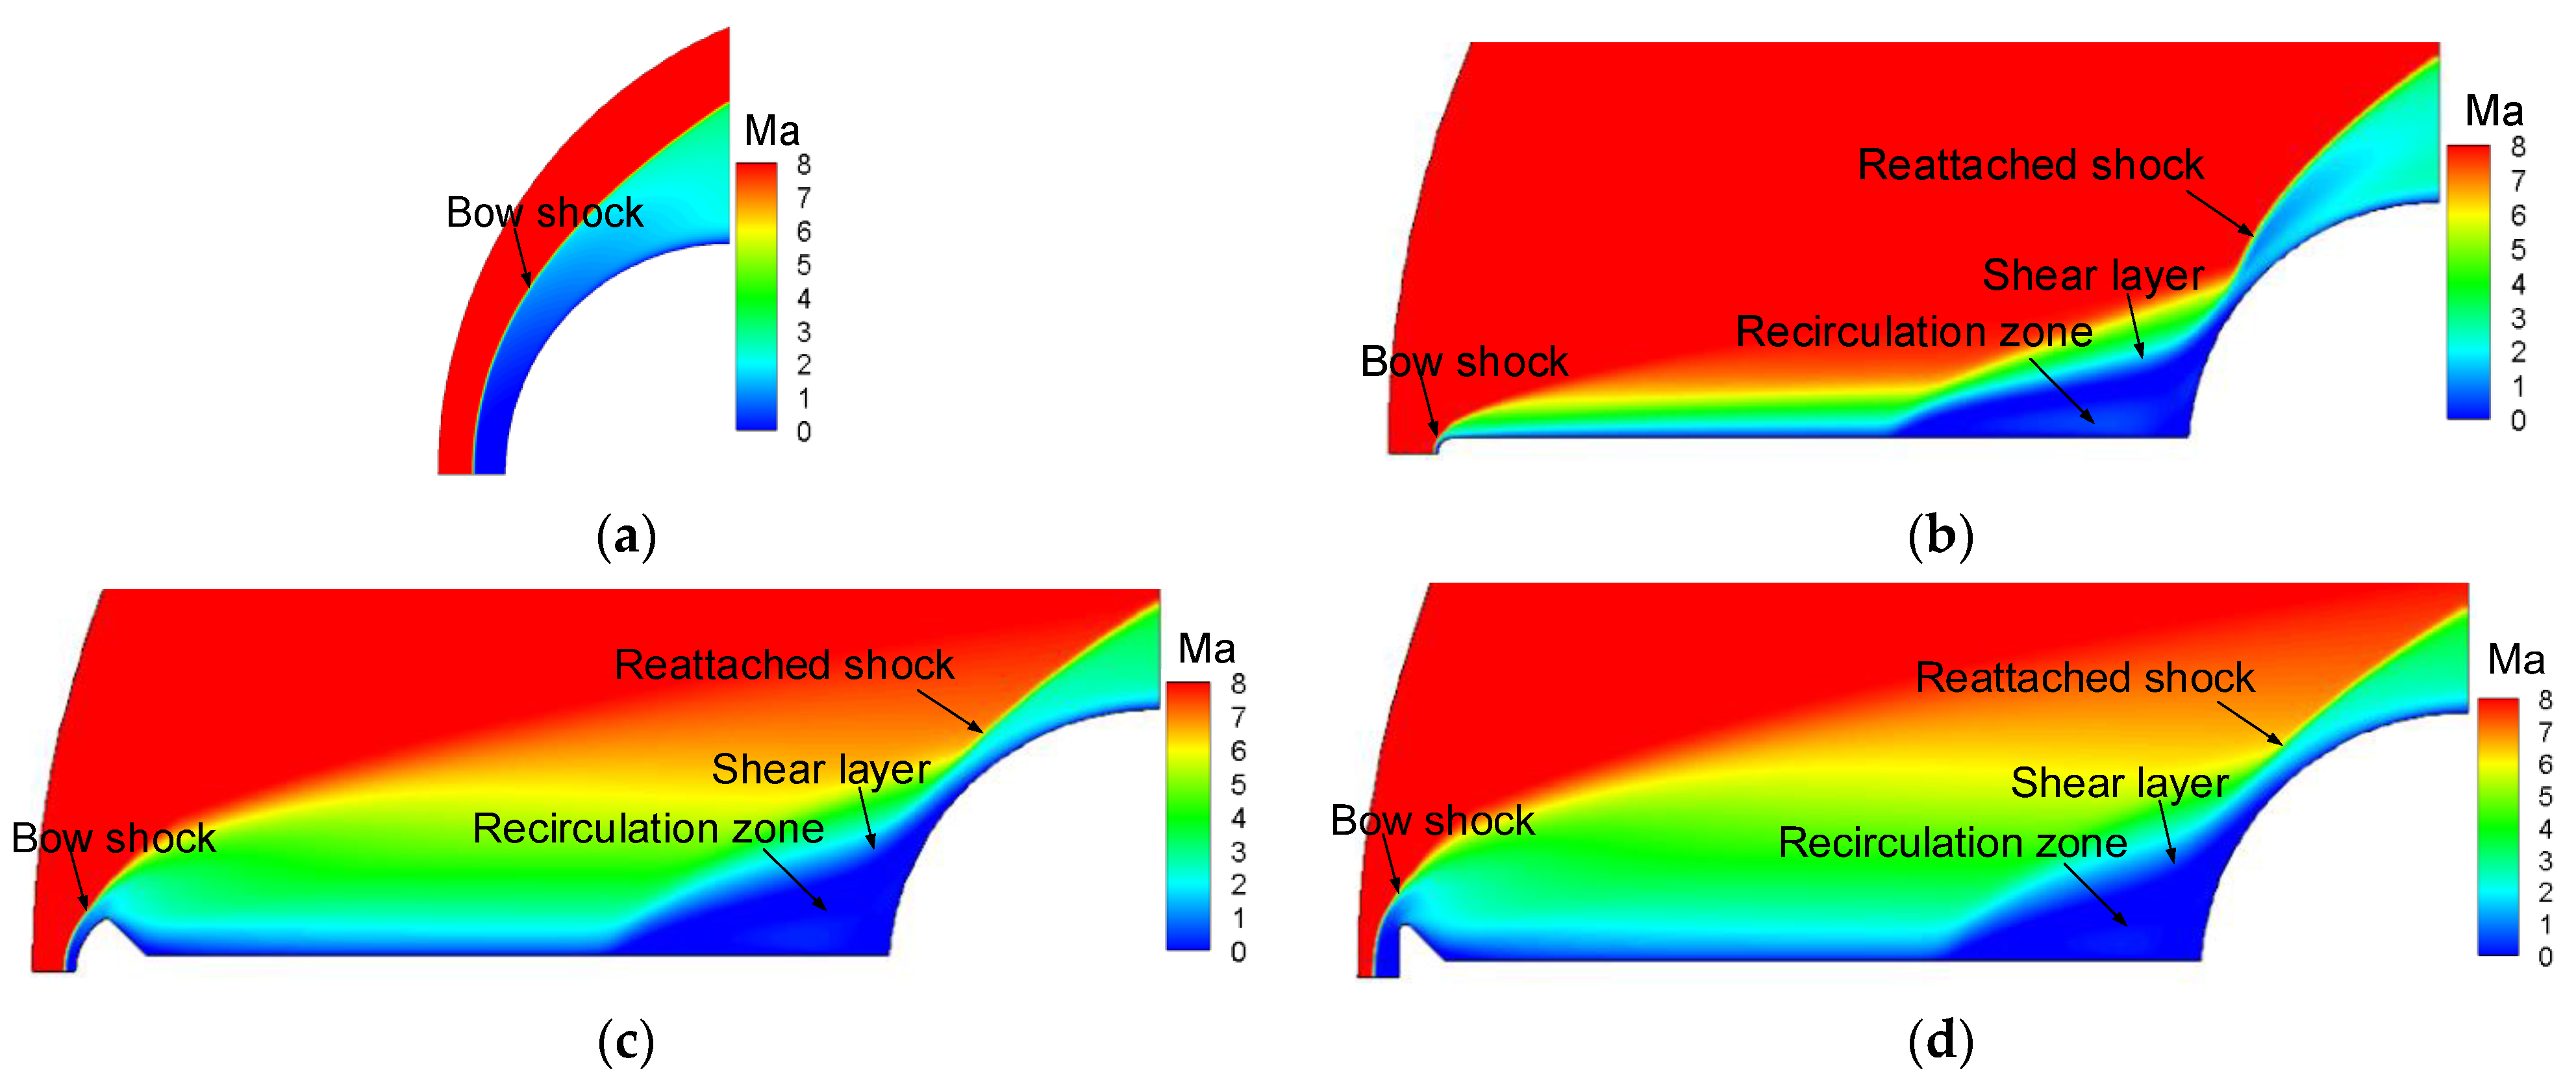
Figure 9.
Flow field: (a) Model 1; (b) Model 2; (c) Model 3; (d) Model 4.
Figure 9.
Flow field: (a) Model 1; (b) Model 2; (c) Model 3; (d) Model 4.
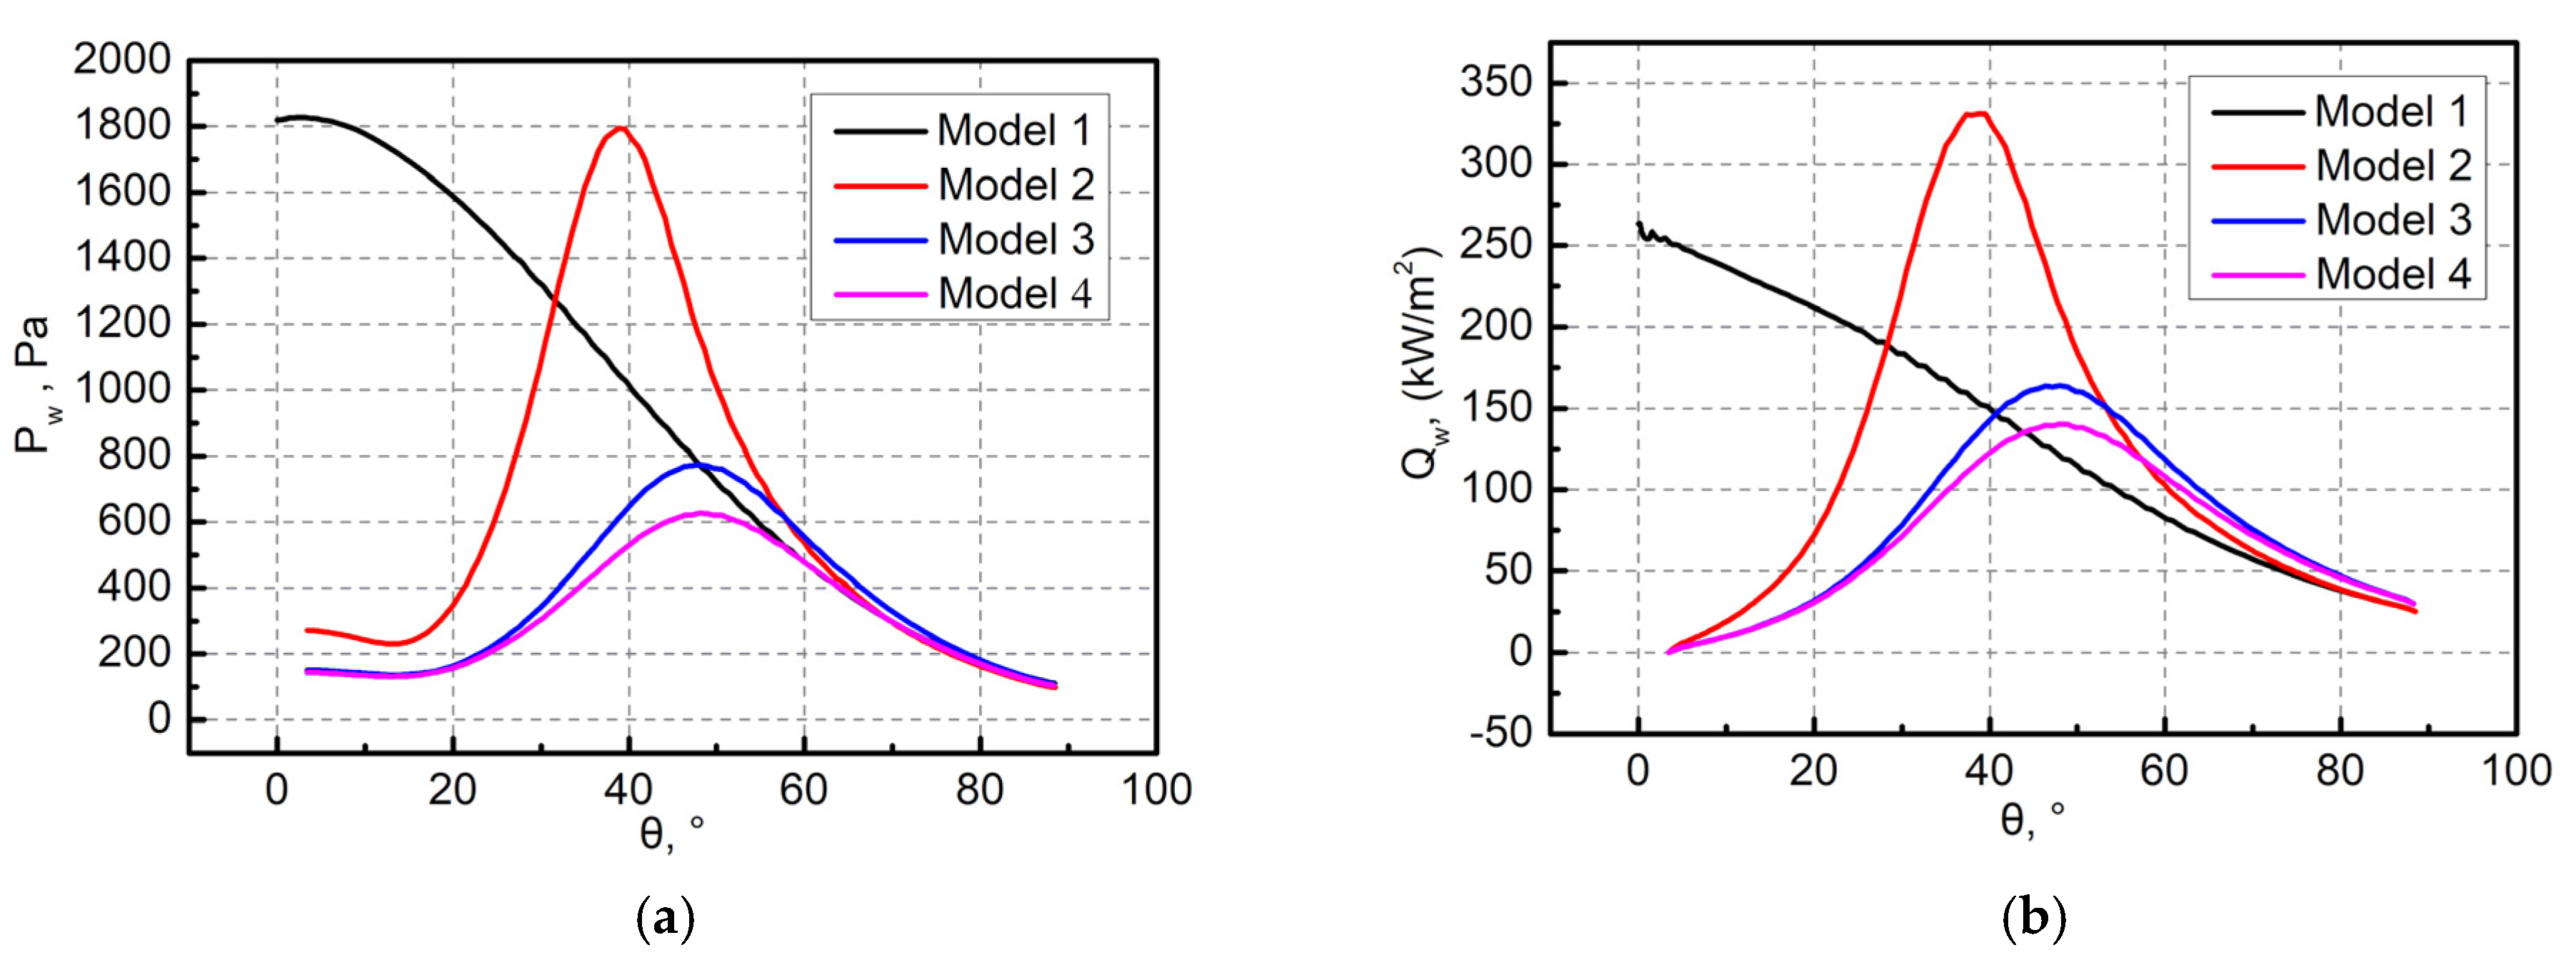
Figure 10.
Initial pressure and heat flux of forebody: (a) pressure; (b) heat flux.
Figure 10.
Initial pressure and heat flux of forebody: (a) pressure; (b) heat flux.
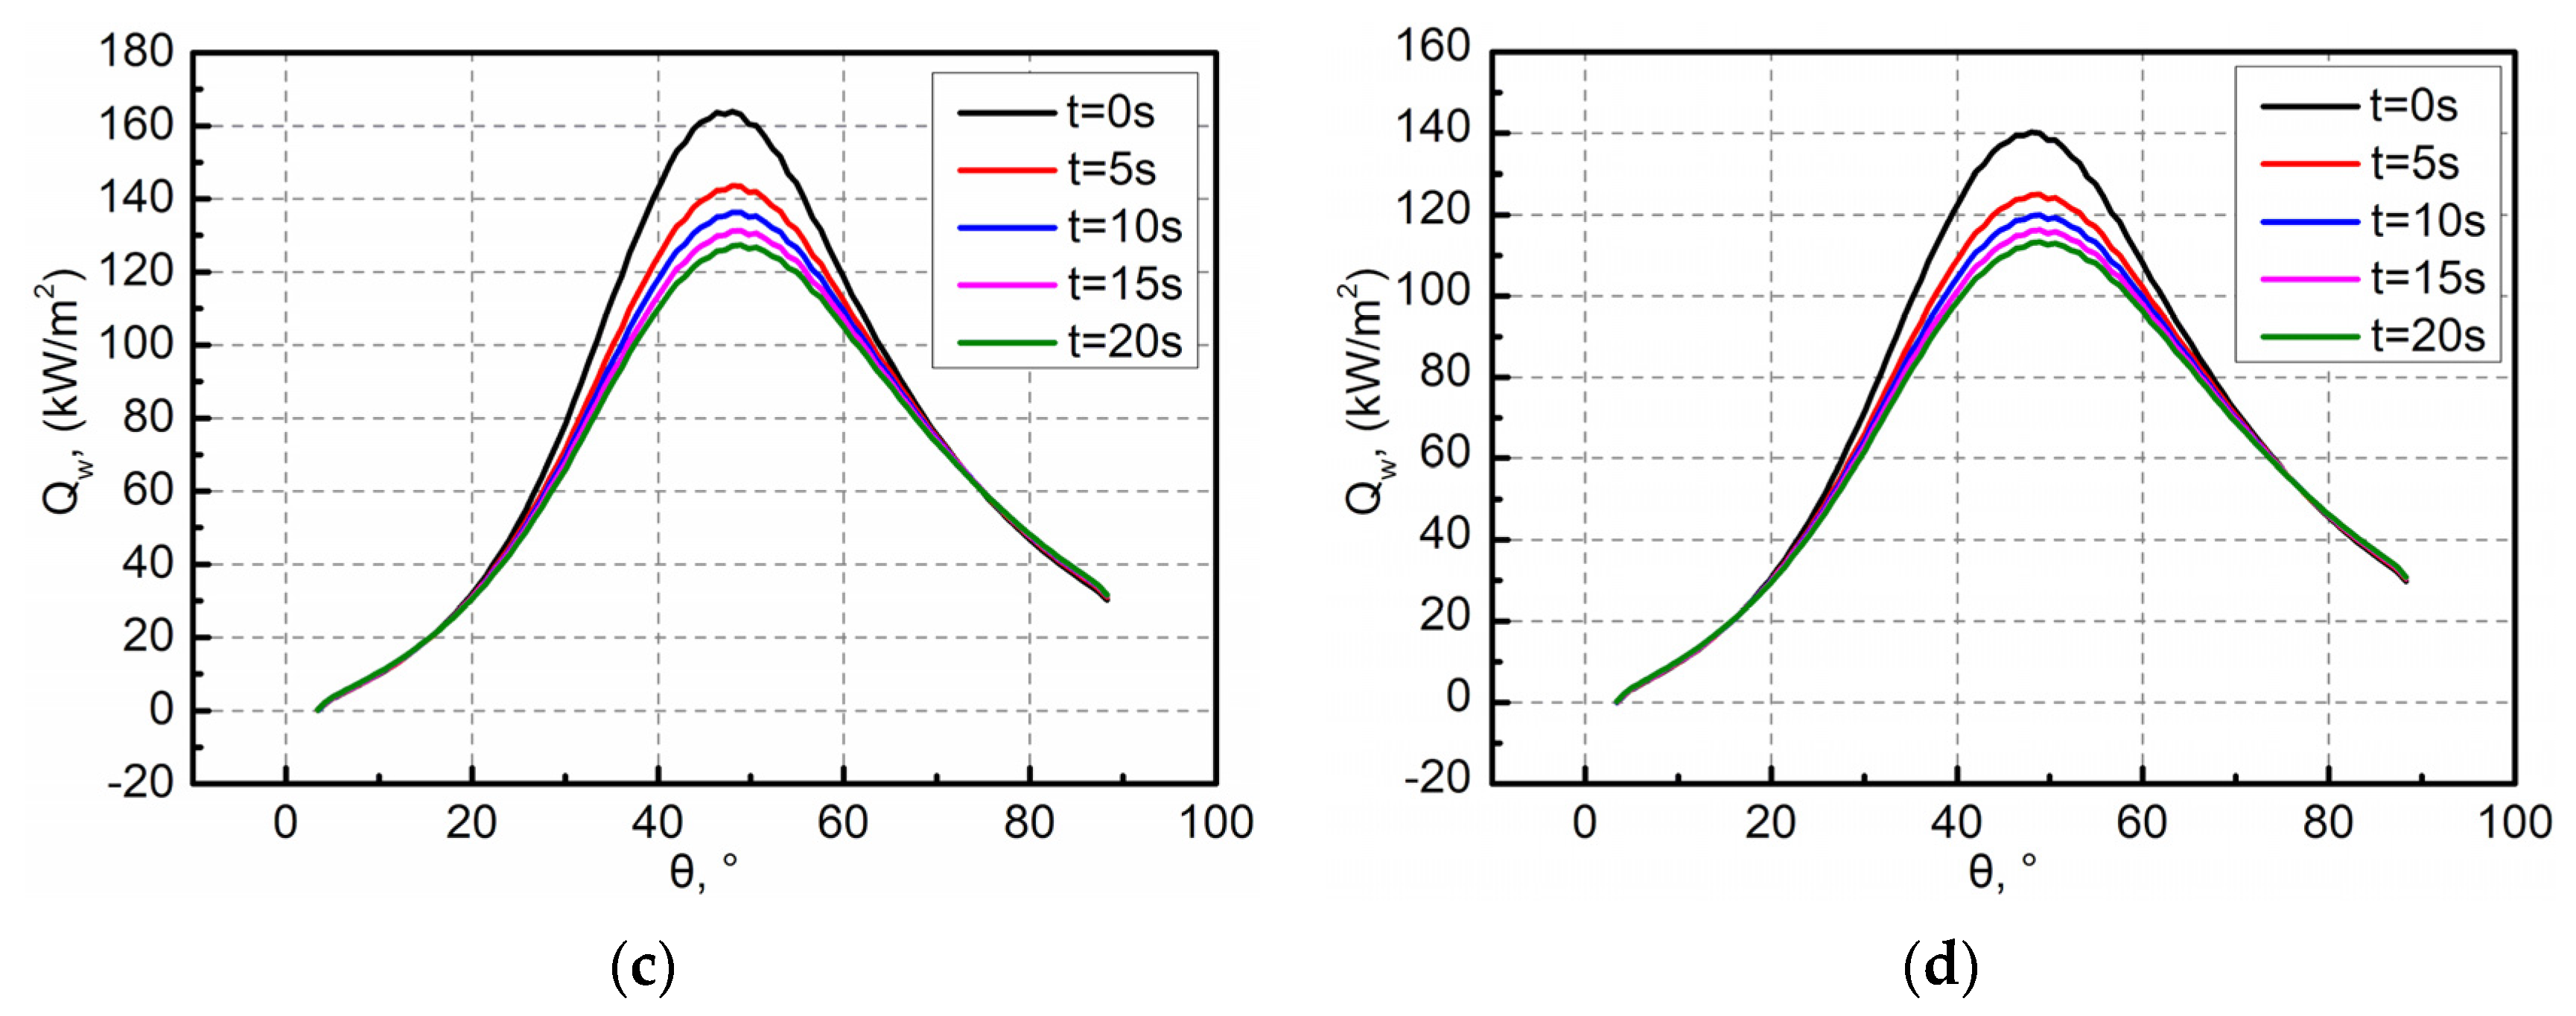
Figure 11.
Evolution of wall heat flux of the forebody: (a) Model 1; (b) Model 2; (c) Model 3; (d) Model 4.
Figure 11.
Evolution of wall heat flux of the forebody: (a) Model 1; (b) Model 2; (c) Model 3; (d) Model 4.
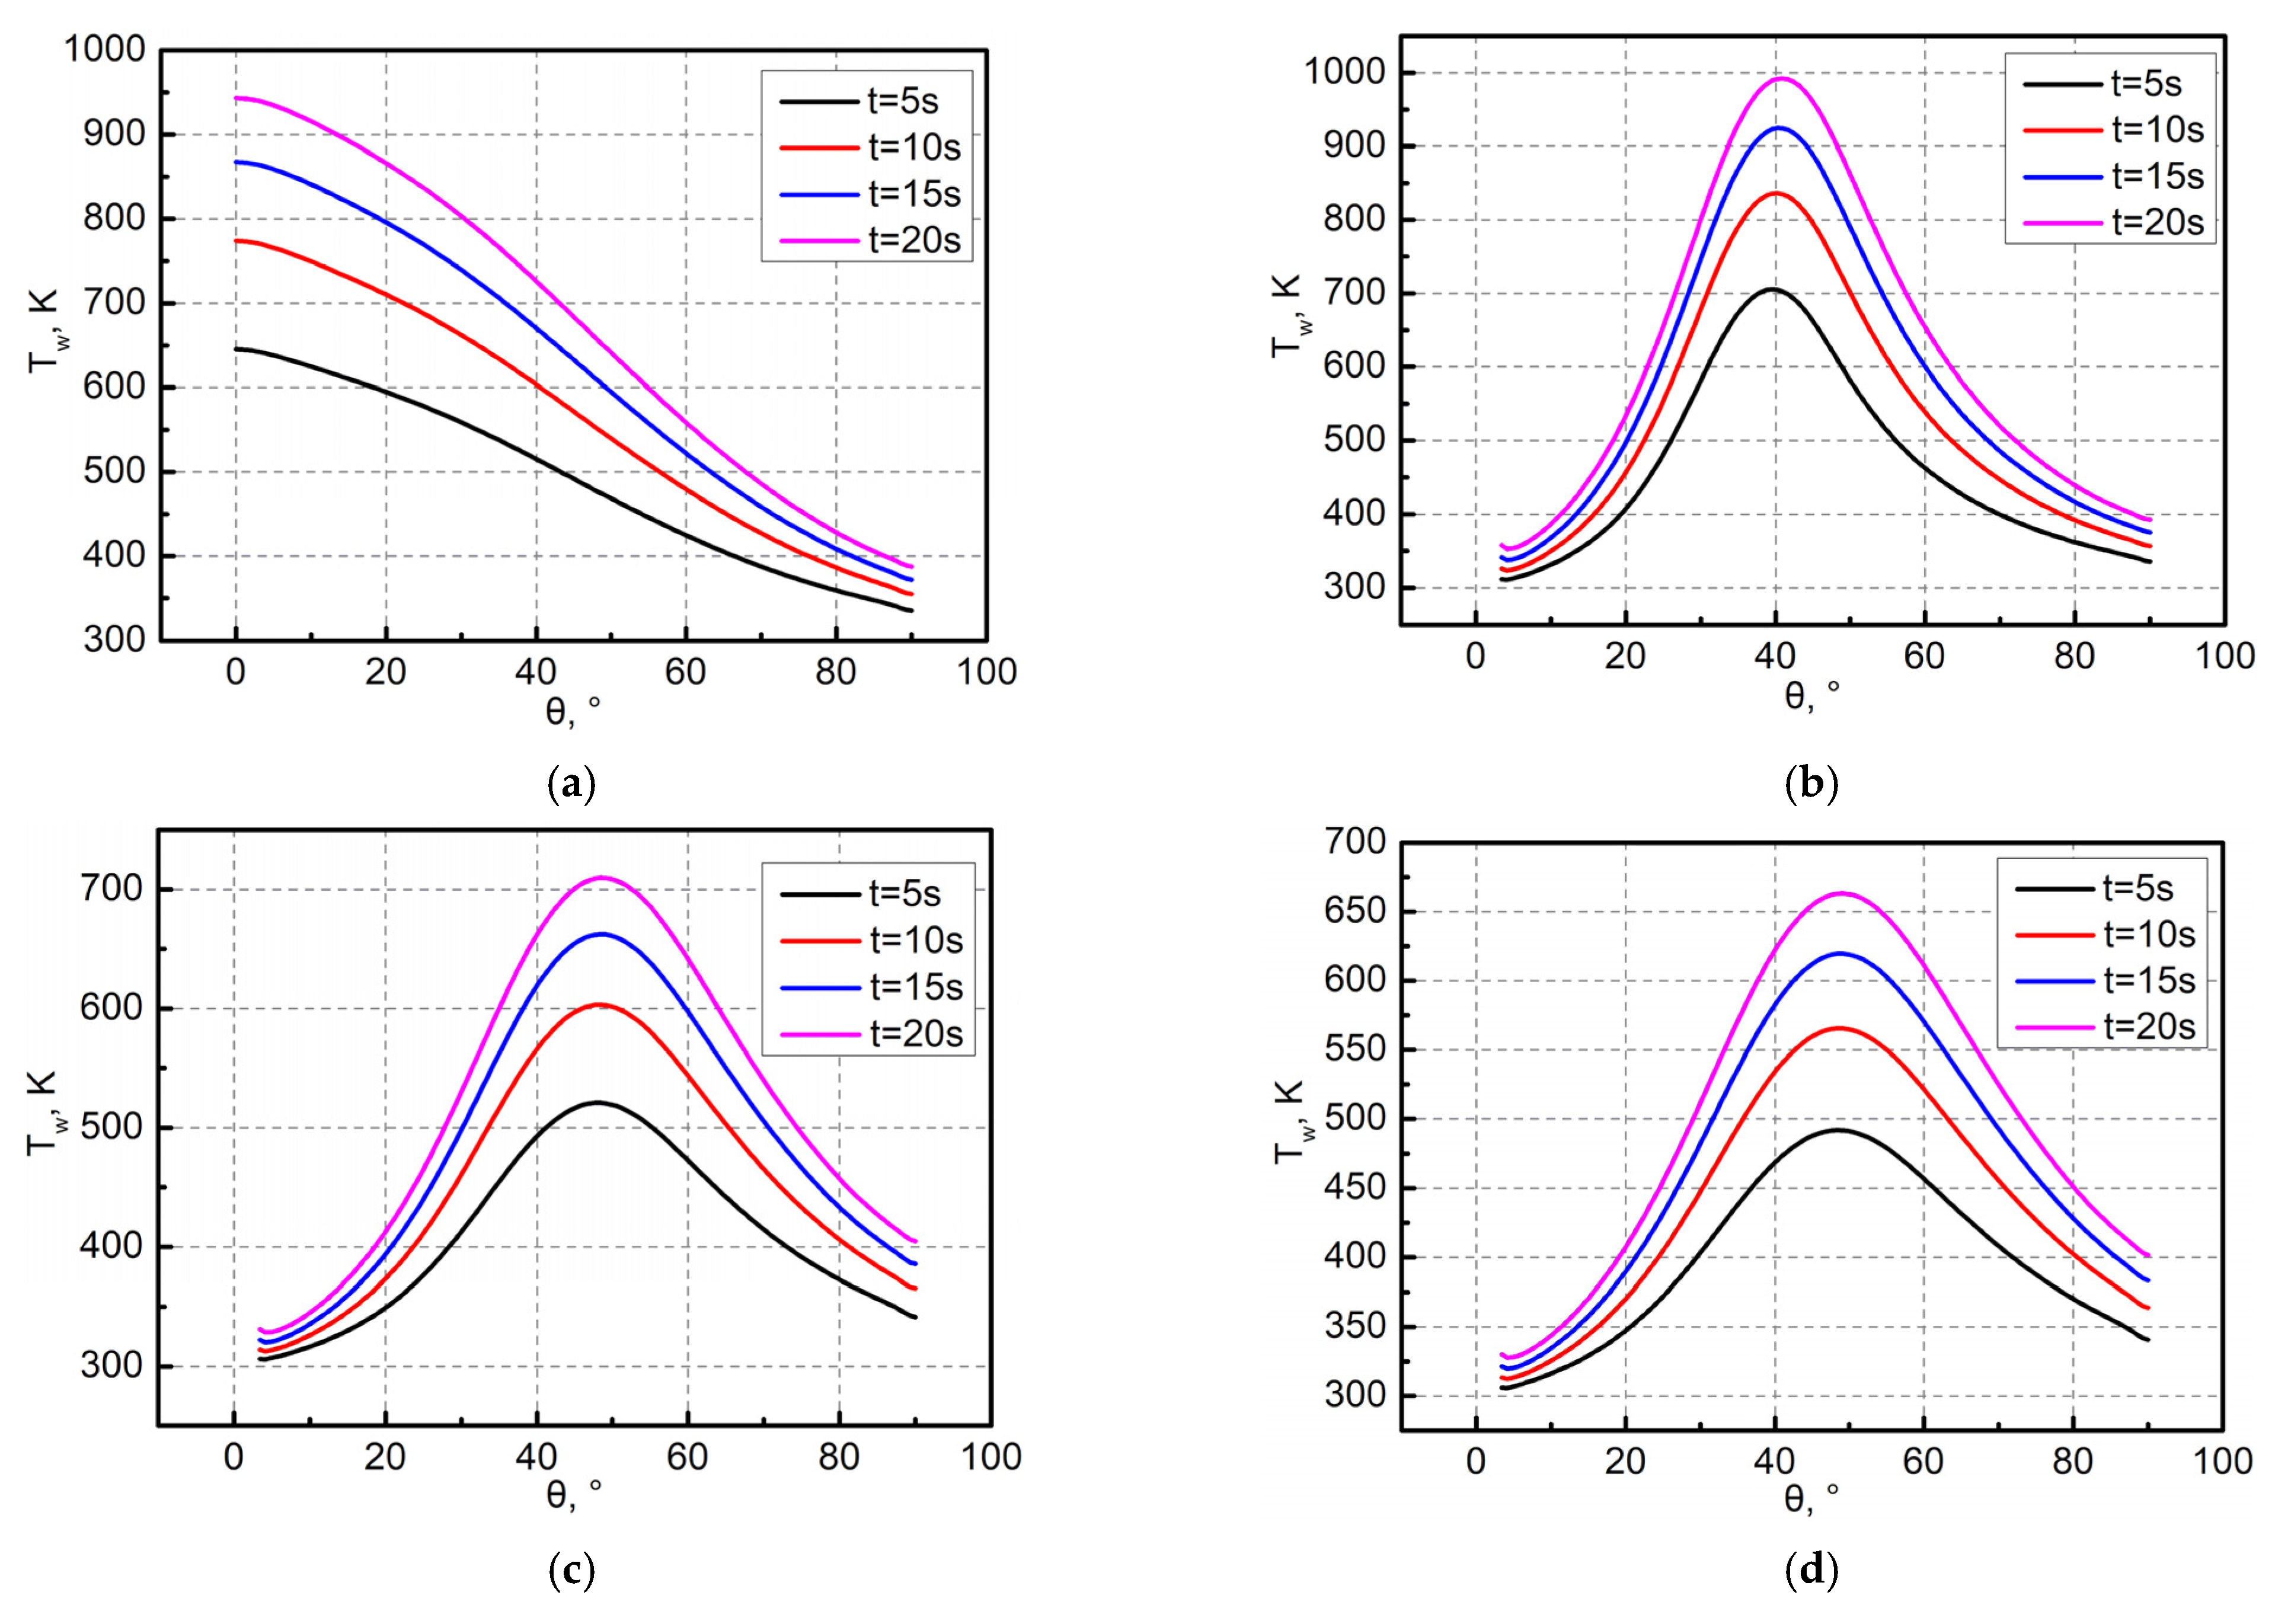
Figure 12.
Evolution of wall temperature of the forebody: (a) Model 1; (b) Model 2; (c) Model 3; (d) Model 4.
Figure 12.
Evolution of wall temperature of the forebody: (a) Model 1; (b) Model 2; (c) Model 3; (d) Model 4.
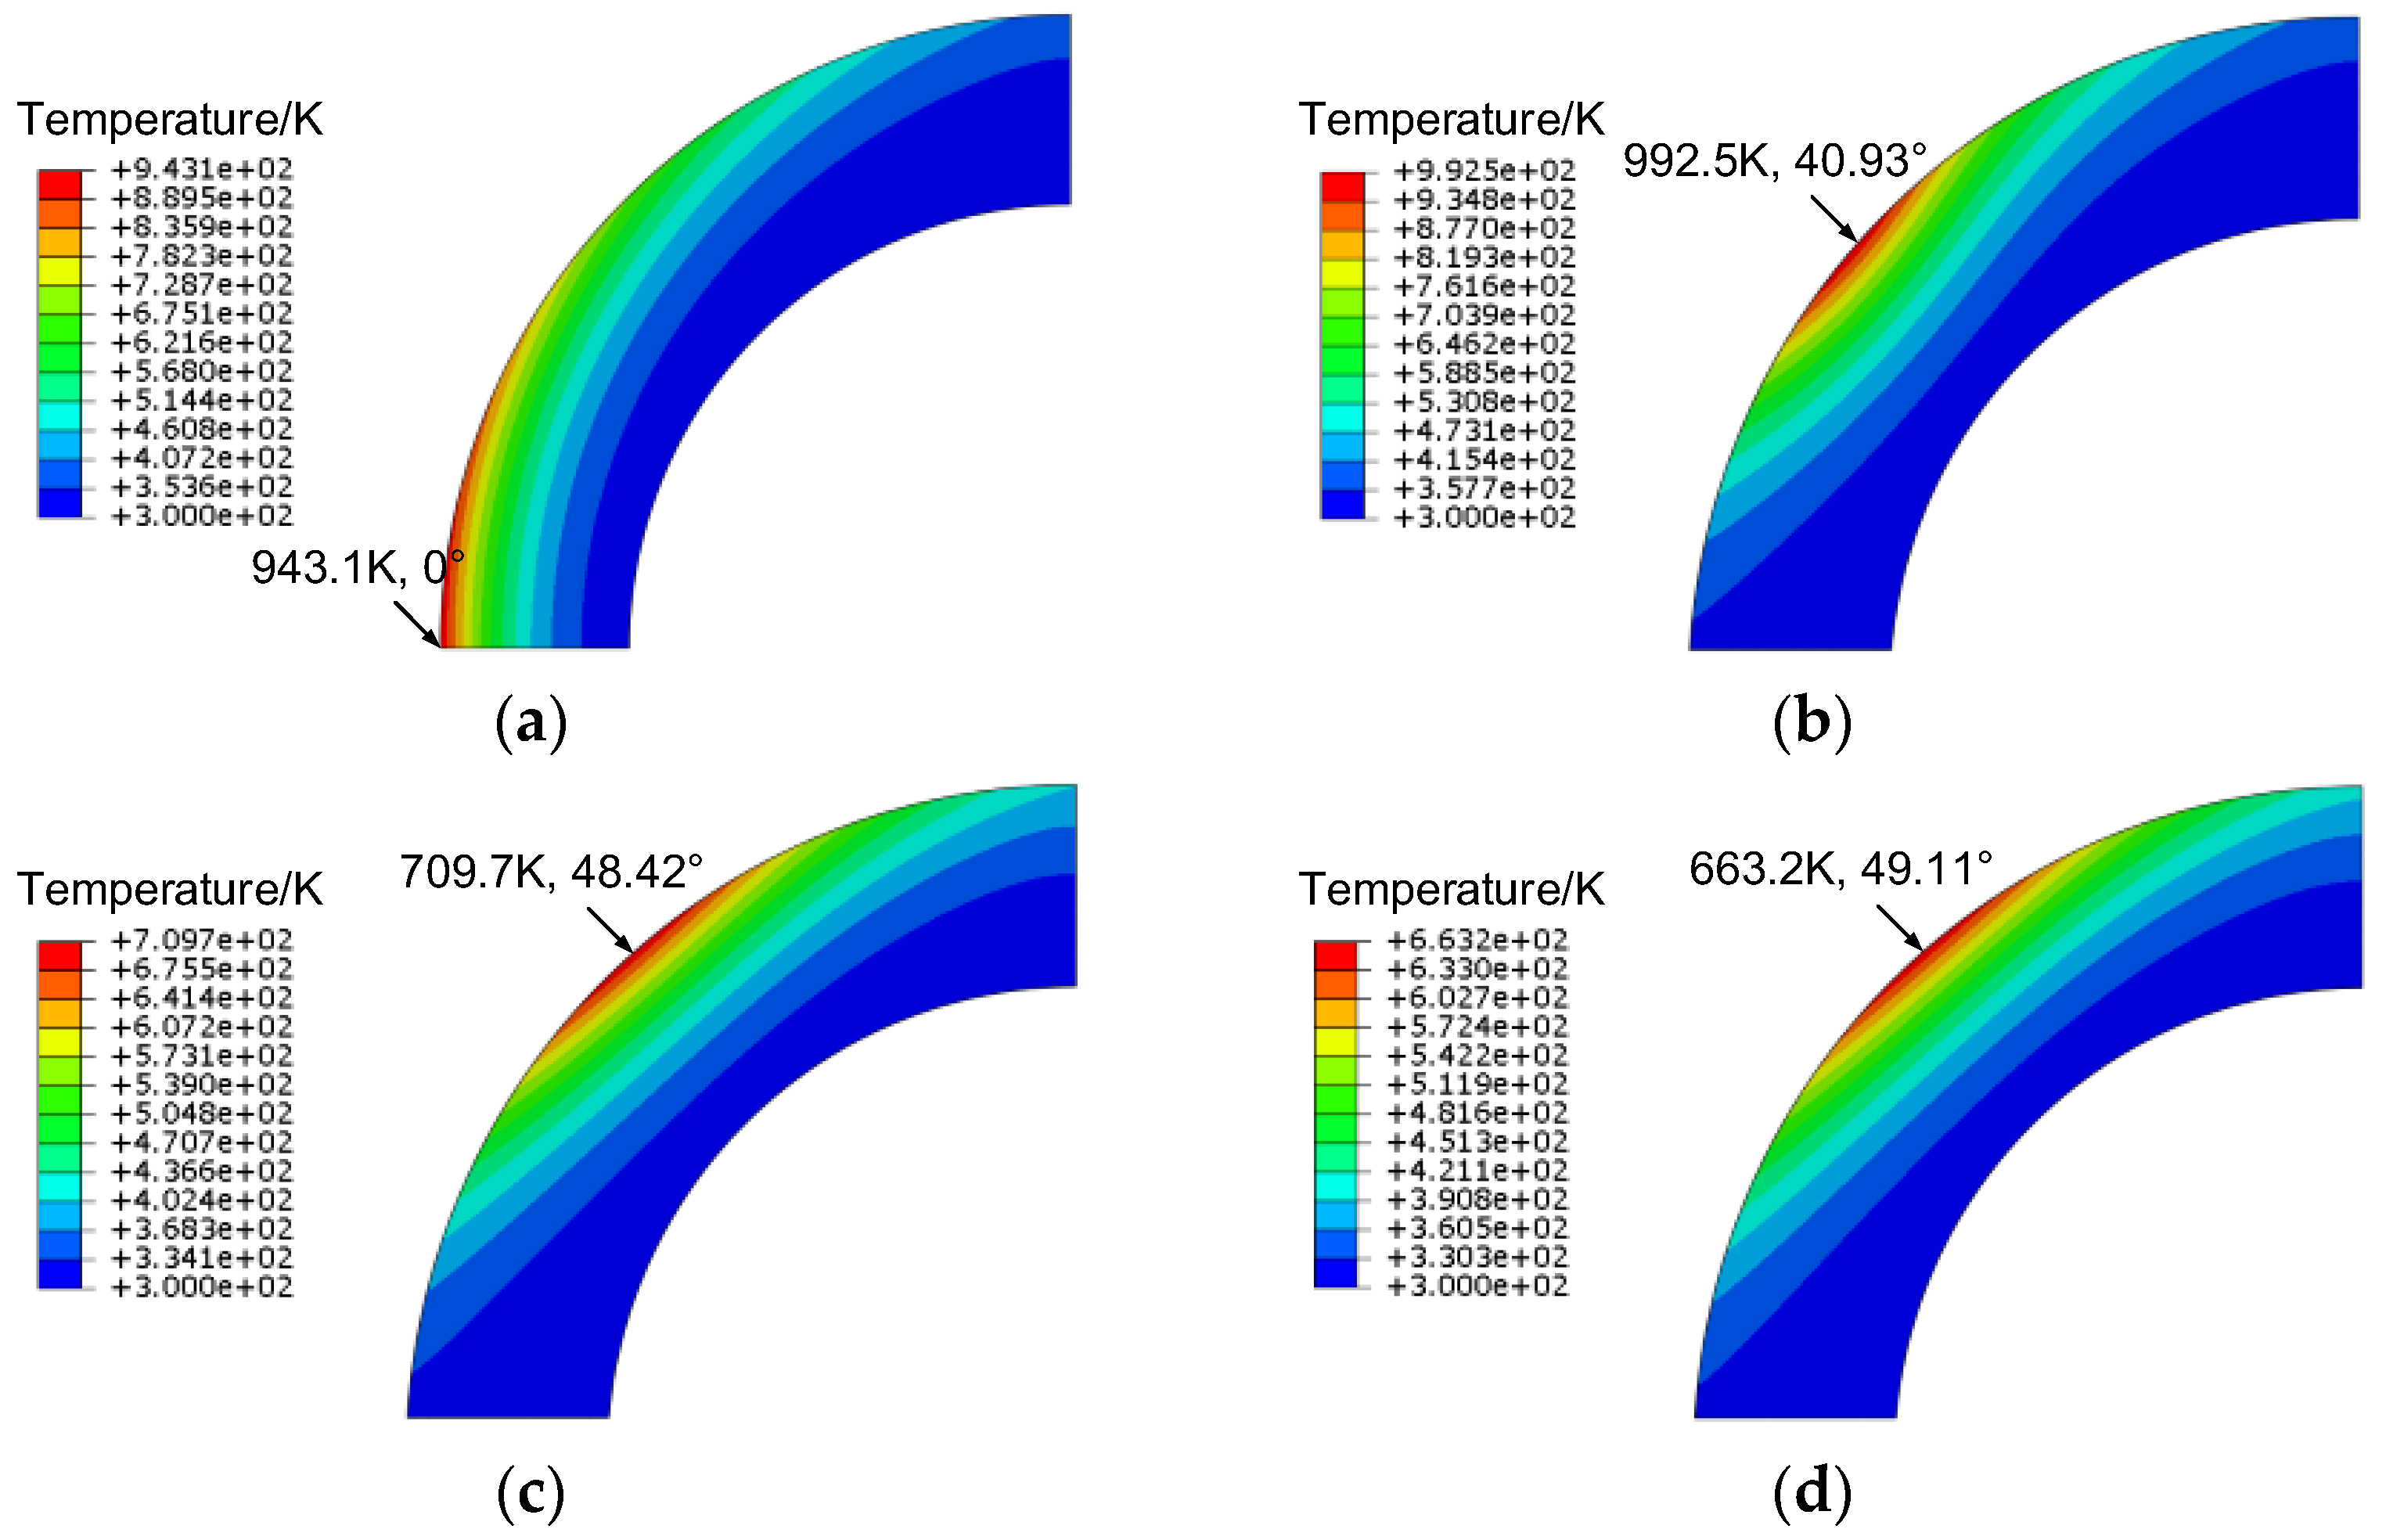
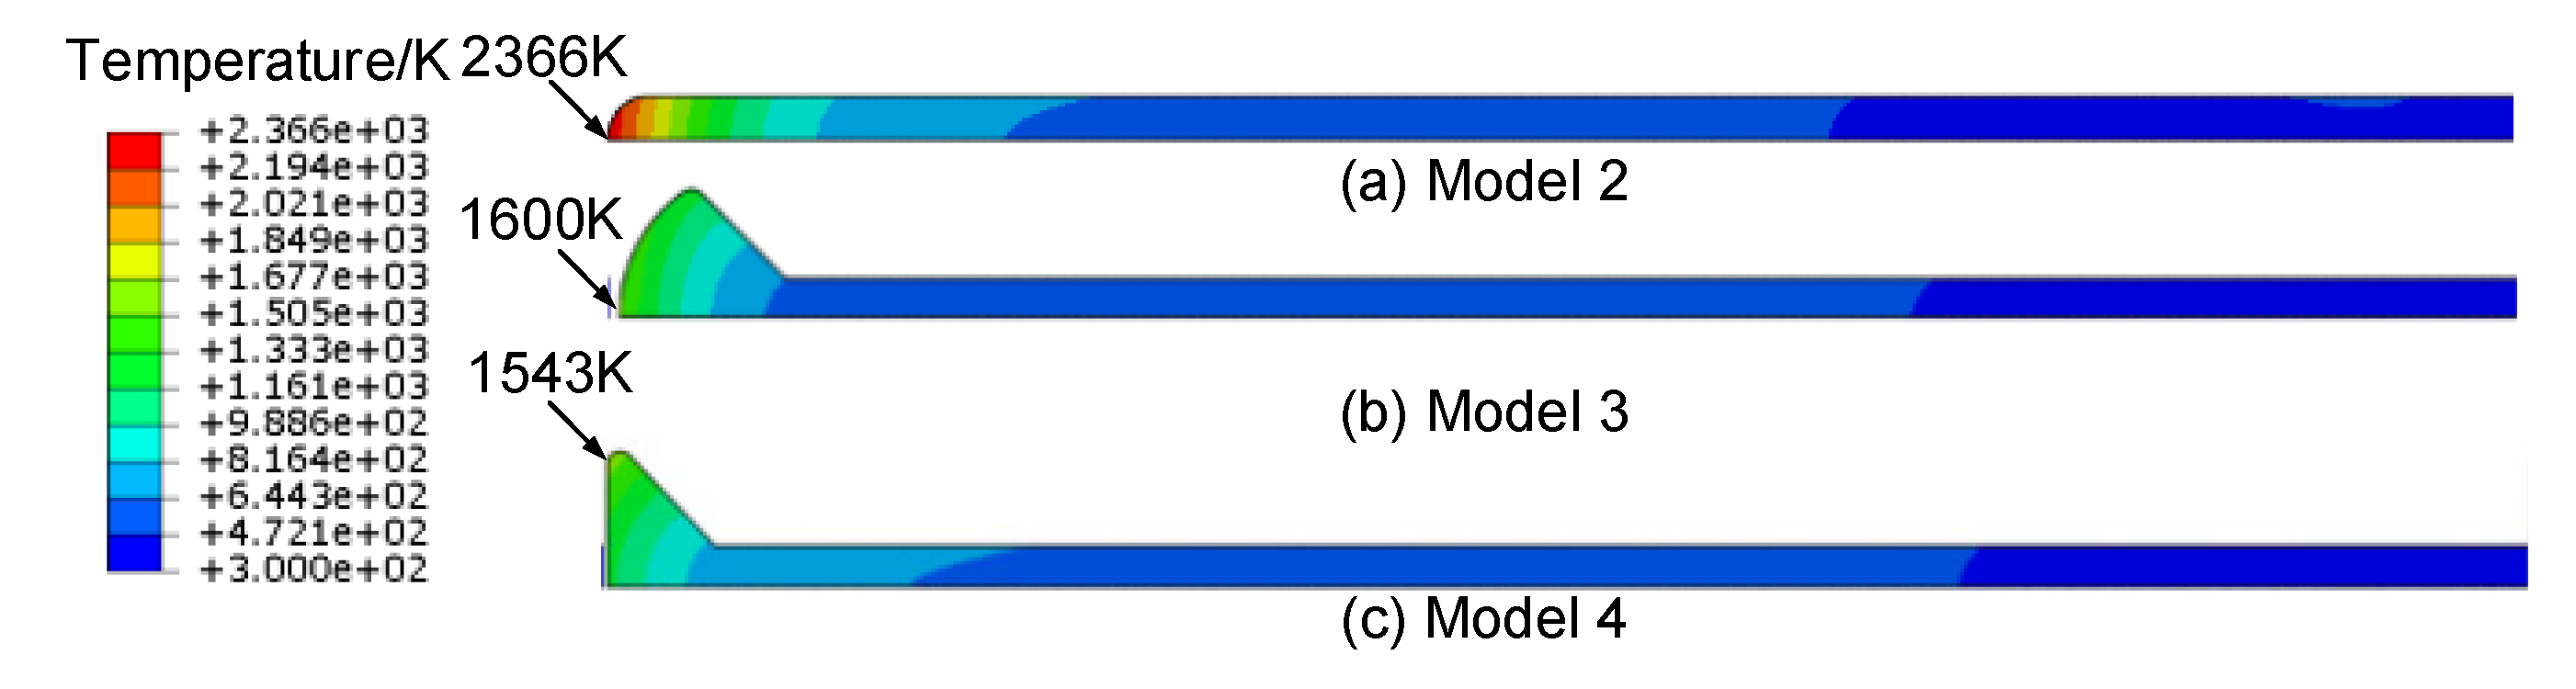
Figure 13.
Comparison of structural temperature field of the forebody at 20 s: (a) Model 1; (b) Model 2; (c) Model 3; (d) Model 4.
Figure 13.
Comparison of structural temperature field of the forebody at 20 s: (a) Model 1; (b) Model 2; (c) Model 3; (d) Model 4.
Figure 14.
Comparison of the structural temperature field of the spike at 20 s.
Figure 14.
Comparison of the structural temperature field of the spike at 20 s.
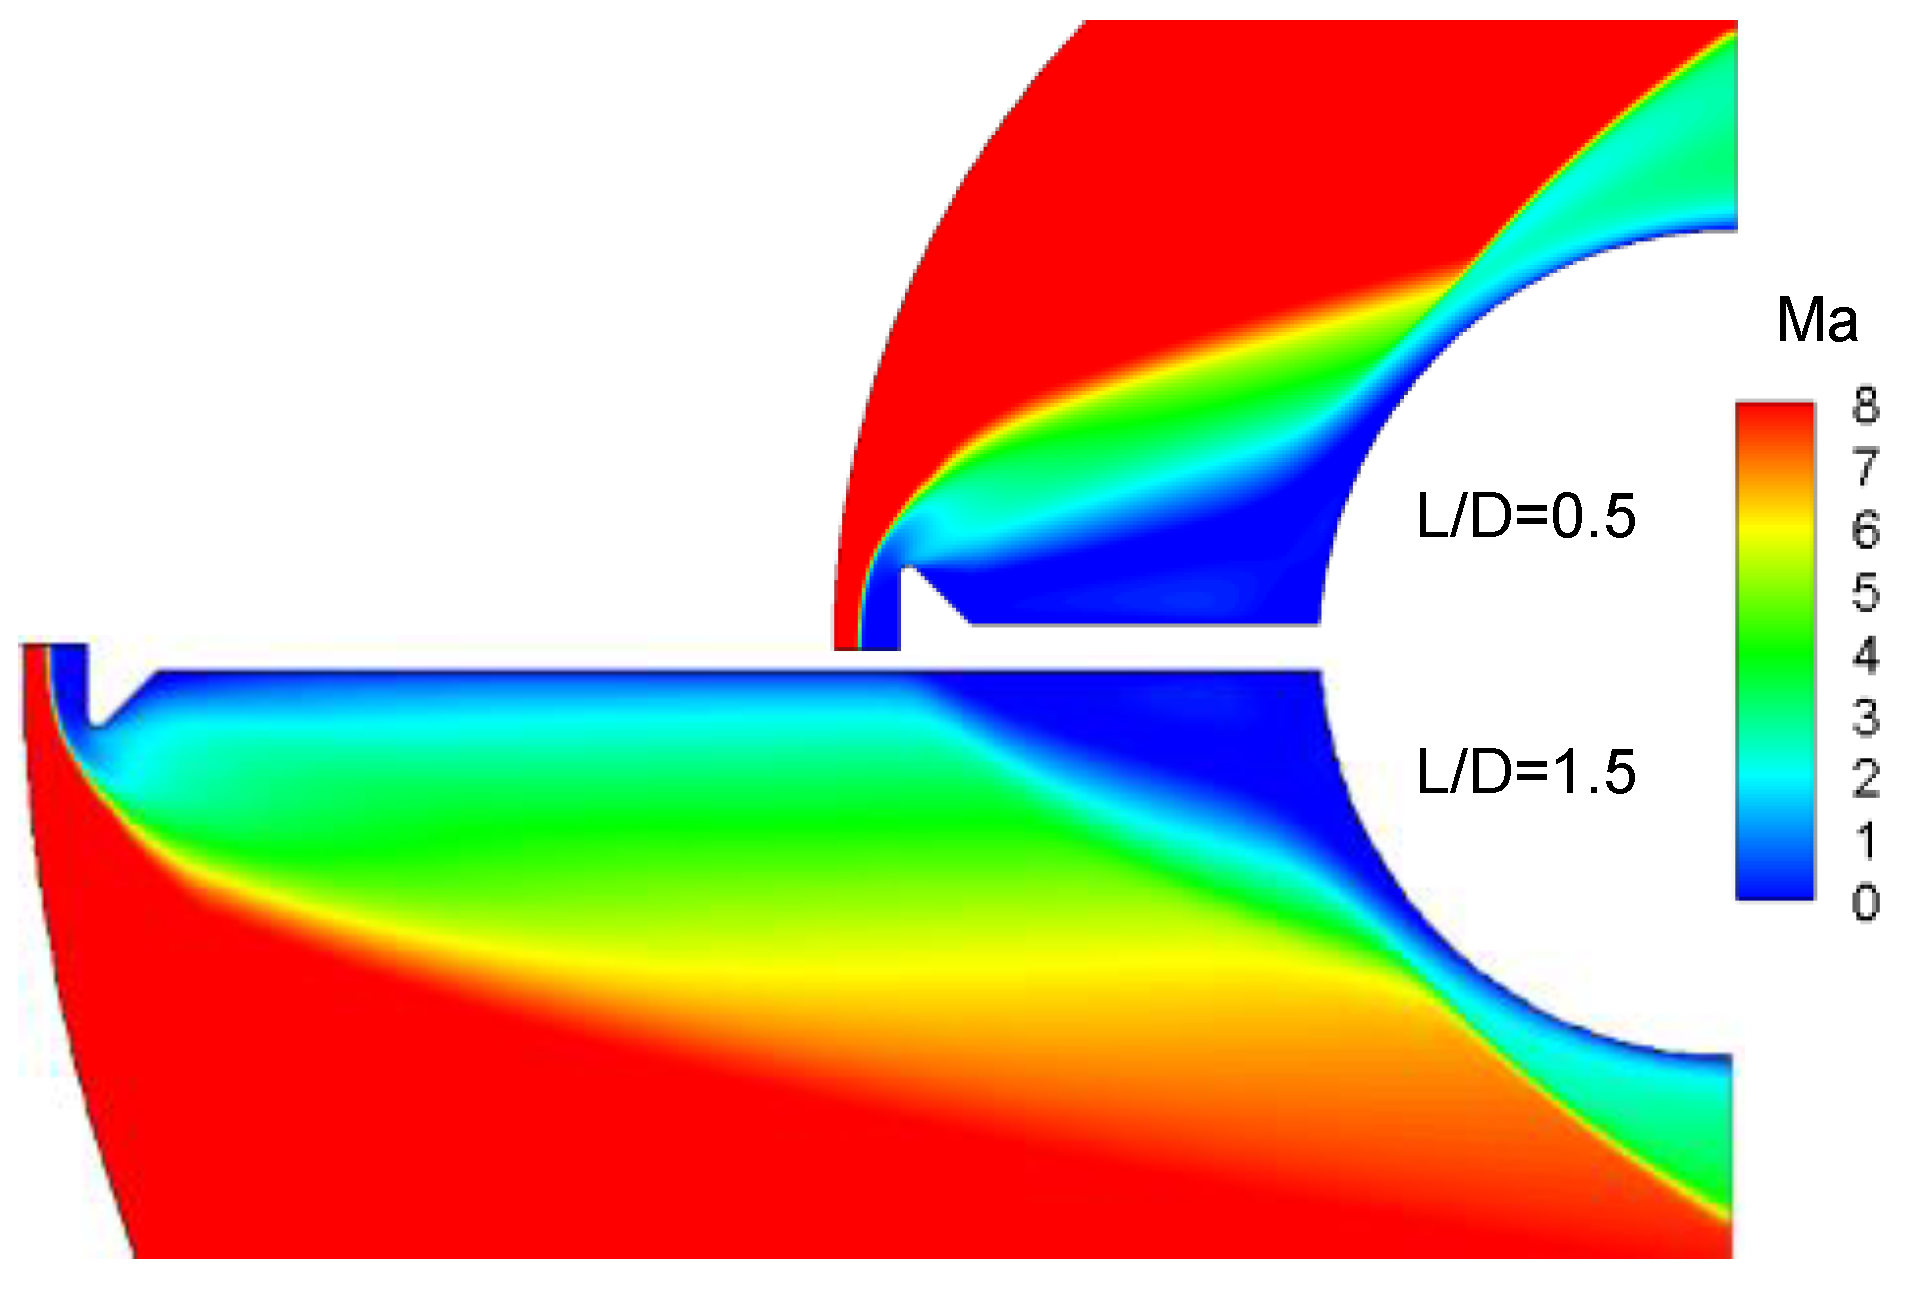
Figure 15.
Effect of the length of the spike on flow field.
Figure 15.
Effect of the length of the spike on flow field.
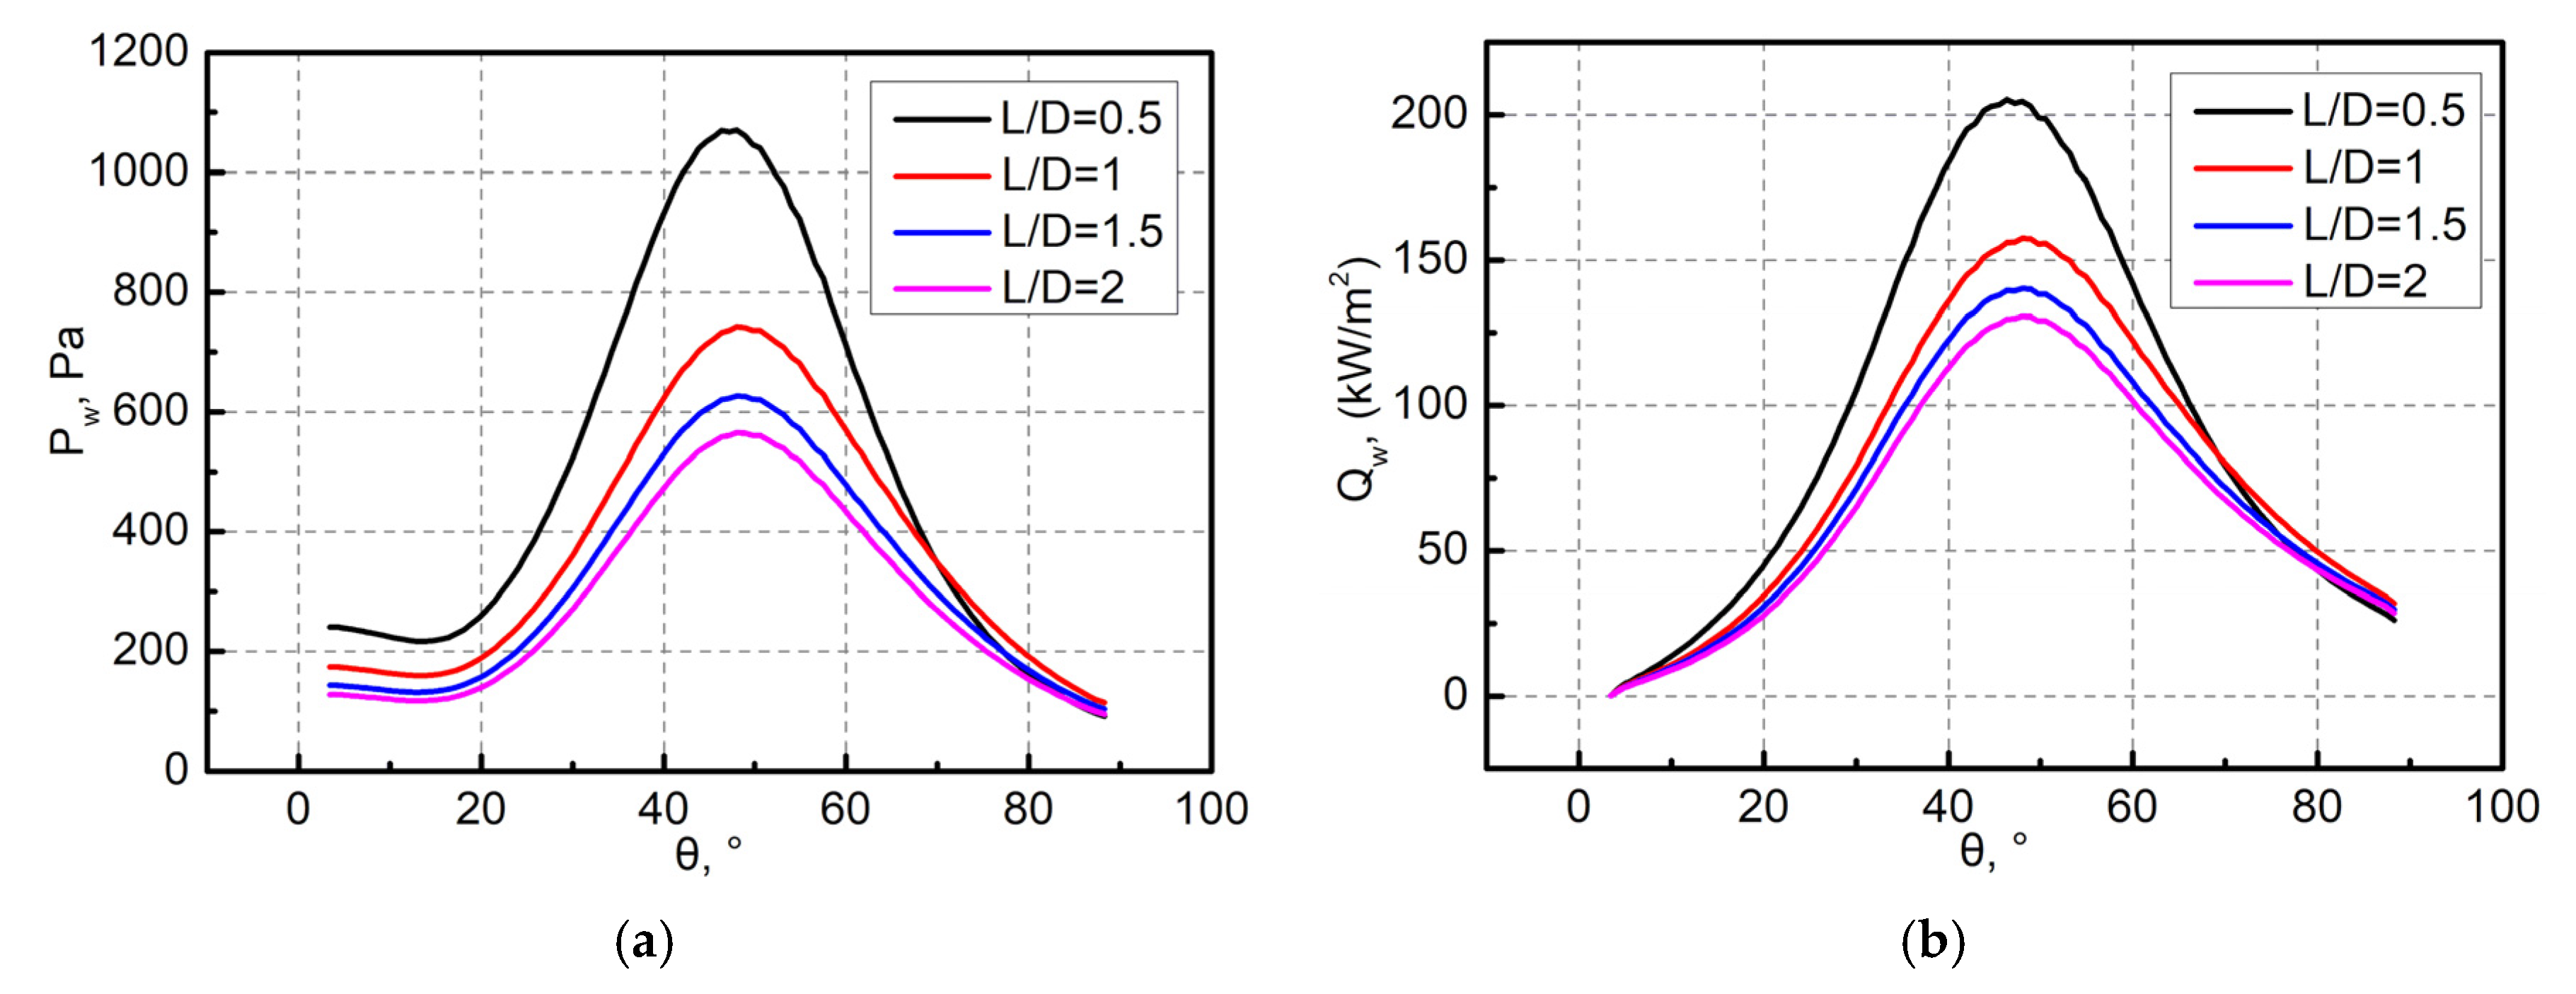
Figure 16.
Initial pressure and heat flux of the forebodies with different lengths L: (a) pressure; (b) heat flux.
Figure 16.
Initial pressure and heat flux of the forebodies with different lengths L: (a) pressure; (b) heat flux.
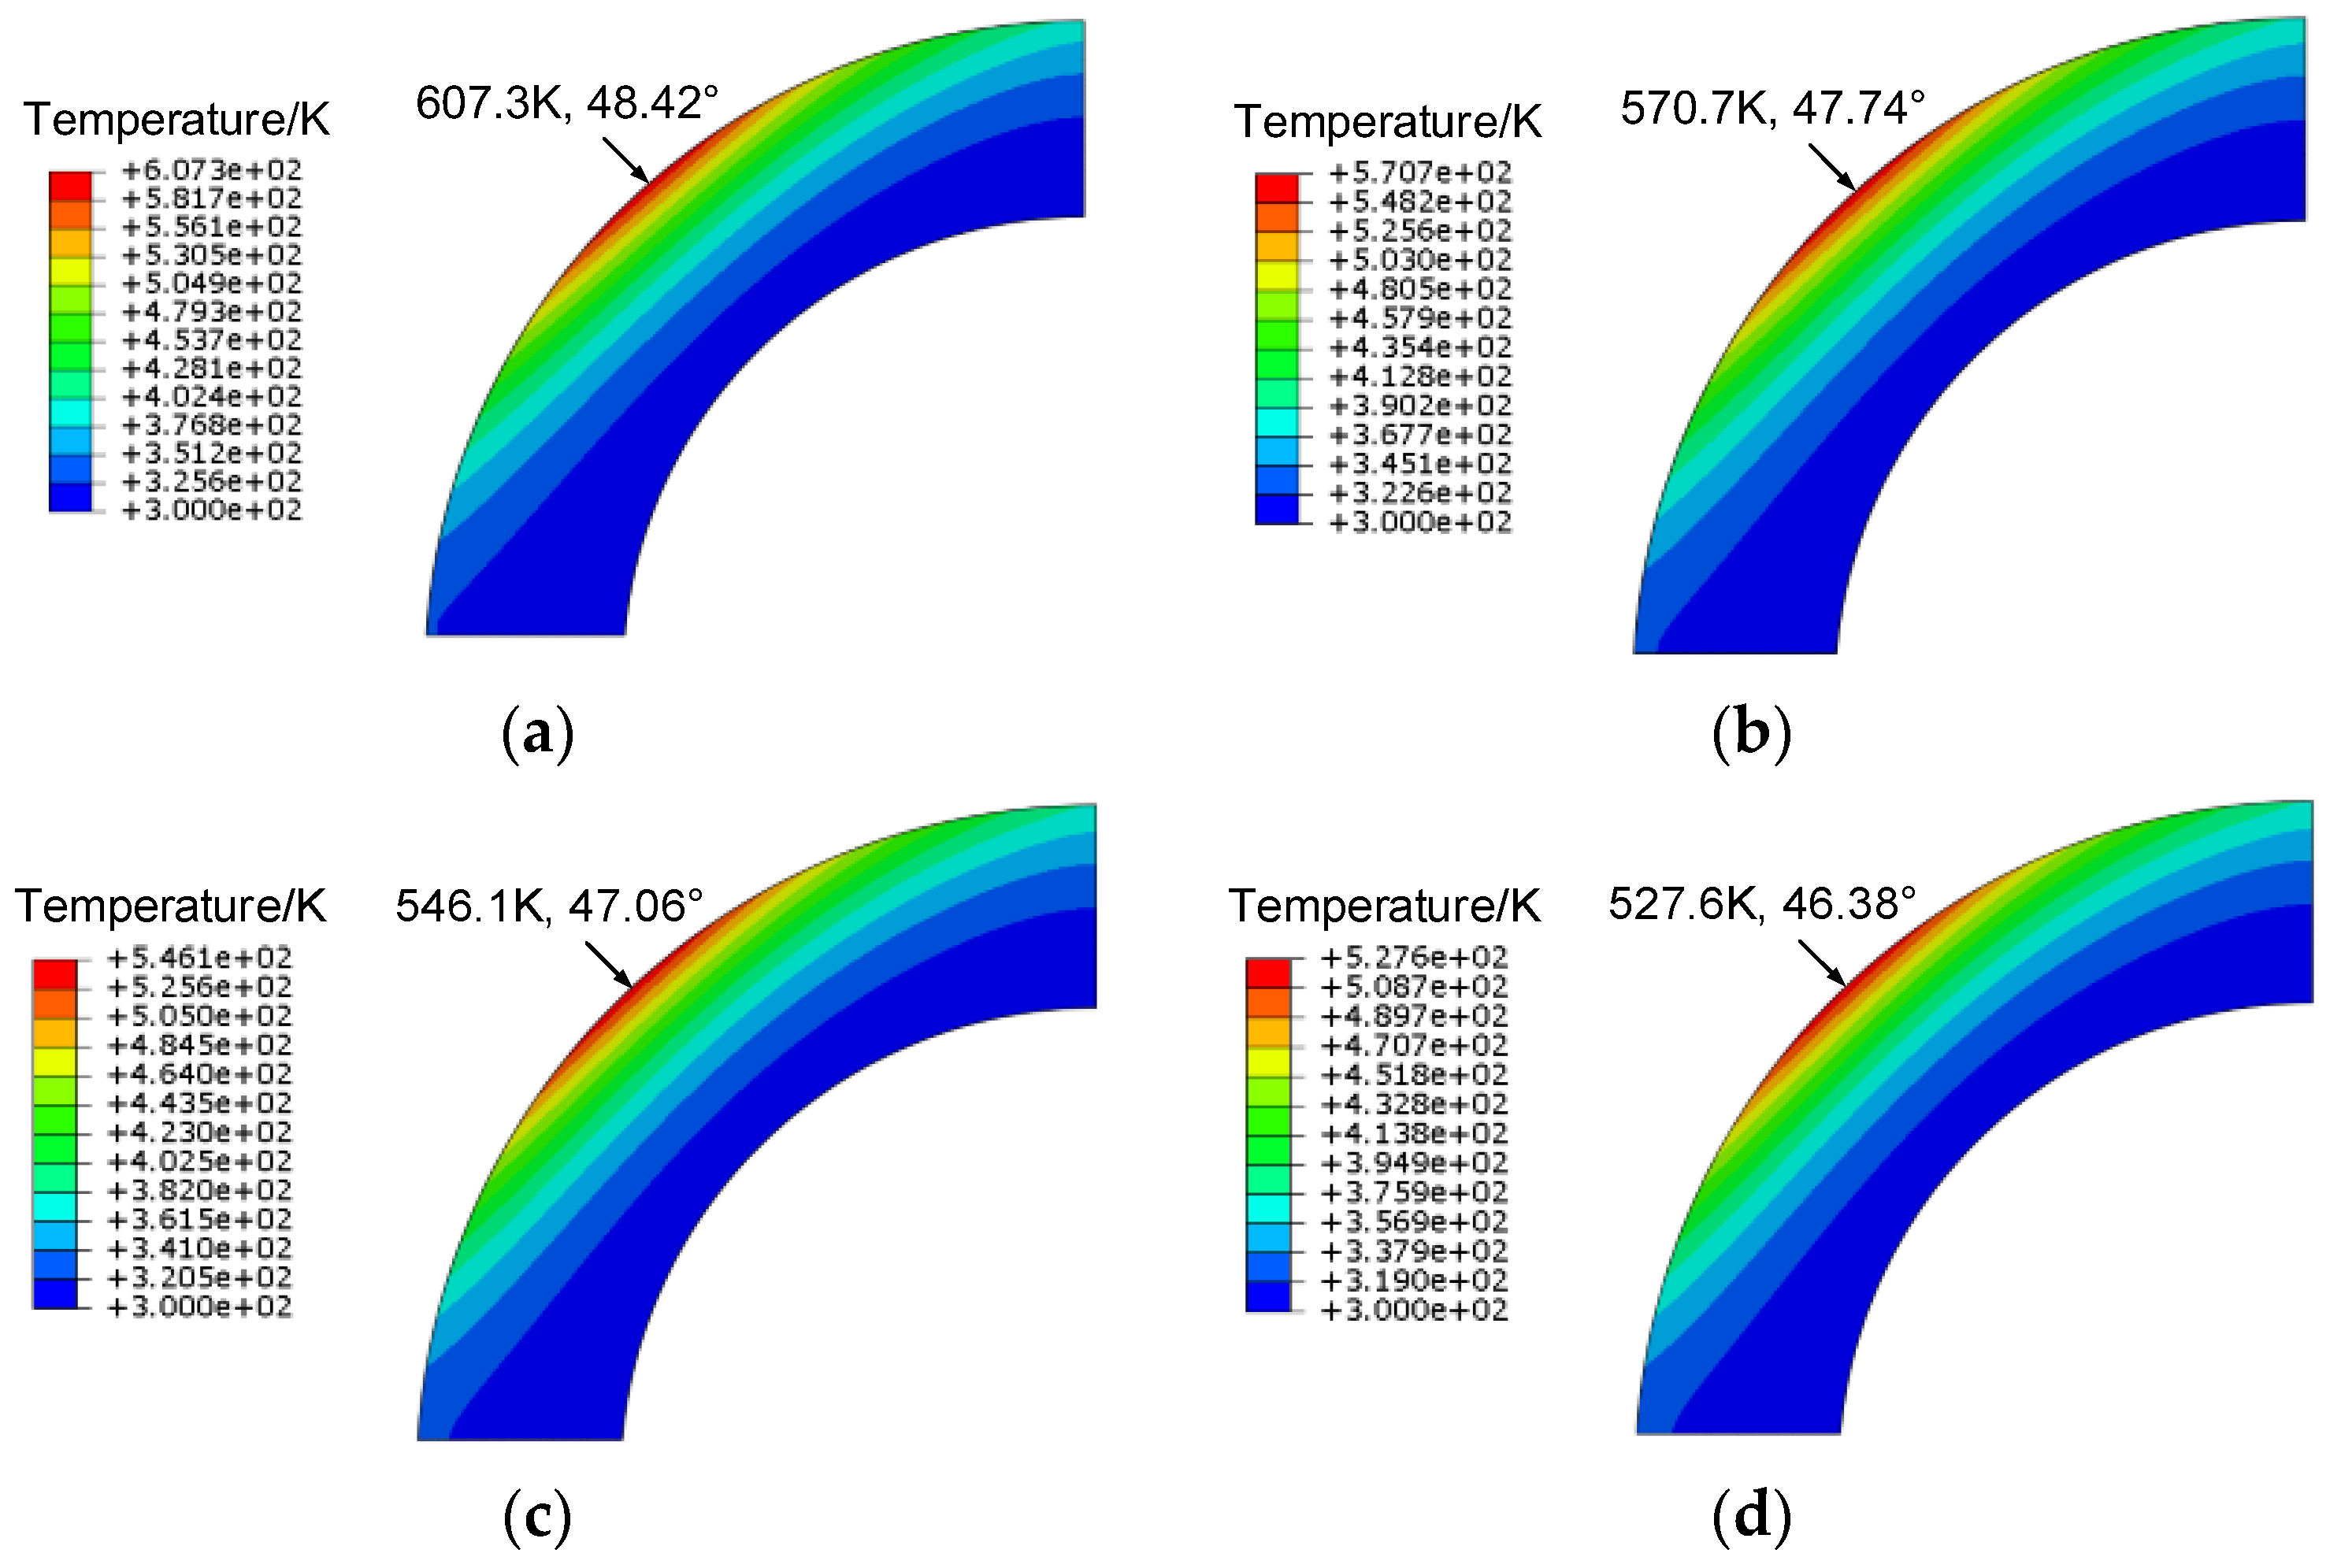
Figure 17.
Comparison of the structural temperature field of the forebody at 20 s: (a) L/D = 0.5; (b) L/D = 1; (c) L/D = 1.5; (d) L/D = 2.
Figure 17.
Comparison of the structural temperature field of the forebody at 20 s: (a) L/D = 0.5; (b) L/D = 1; (c) L/D = 1.5; (d) L/D = 2.
Figure 18.
Effect of the diameter of the aerodisk on flow field.
Figure 18.
Effect of the diameter of the aerodisk on flow field.
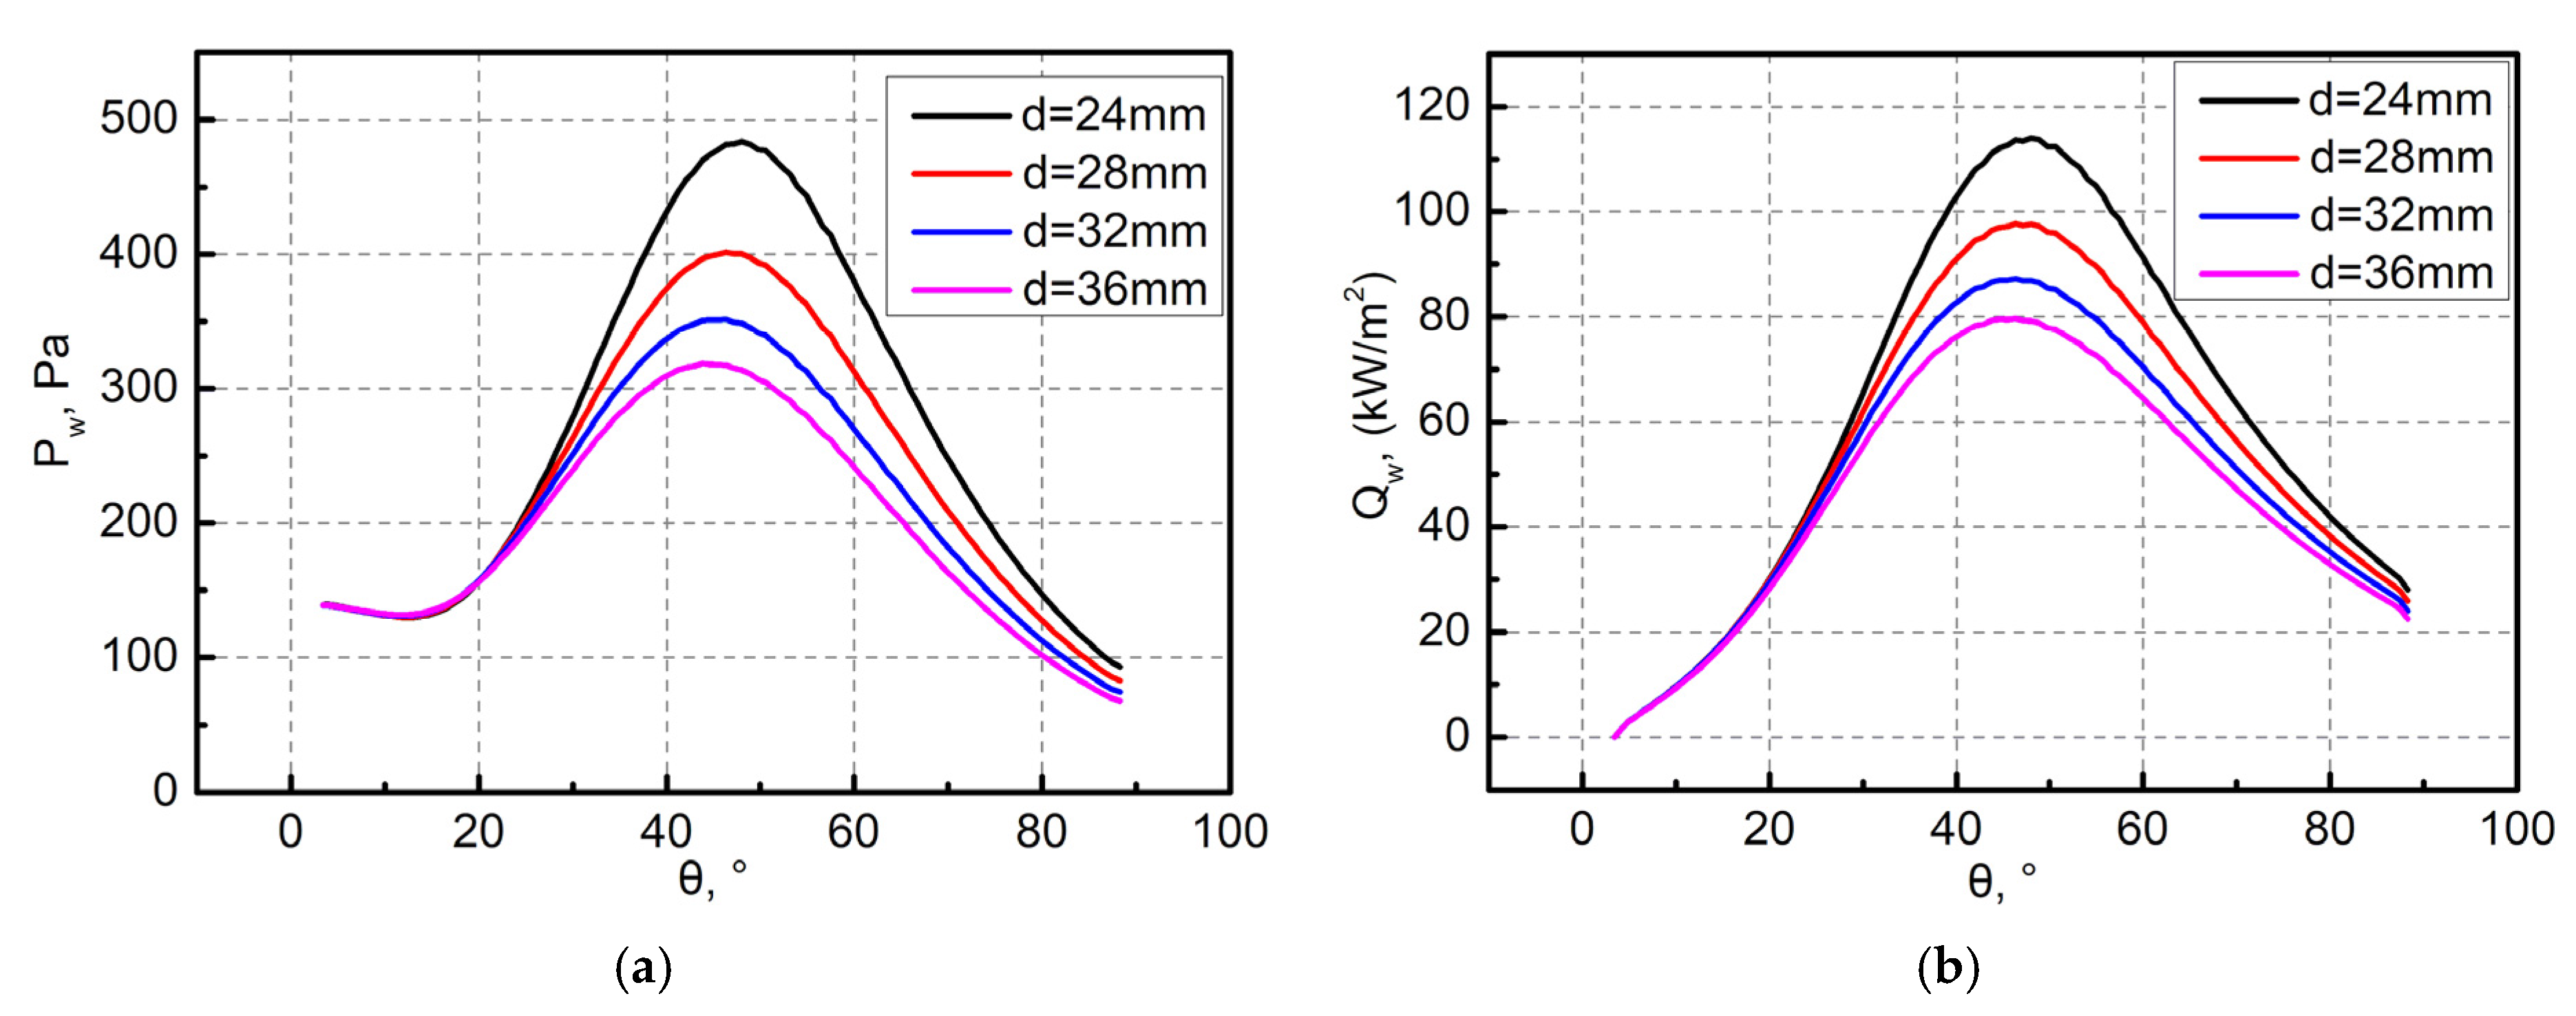
Figure 19.
Initial pressure and heat flux of forebodies with different diameters d: (a) pressure; (b) heat flux.
Figure 19.
Initial pressure and heat flux of forebodies with different diameters d: (a) pressure; (b) heat flux.
Figure 20.
Comparison of the structural temperature field of the forebody at 20 s: (a) d = 24 mm; (b) d = 28 mm; (c) d = 32 mm; (d) d = 36 mm.
Figure 20.
Comparison of the structural temperature field of the forebody at 20 s: (a) d = 24 mm; (b) d = 28 mm; (c) d = 32 mm; (d) d = 36 mm.
Table 1.
Material properties of circular tube.
Table 1.
Material properties of circular tube.
| Parameter | Value | Parameter Description |
|---|
| k (W/(m·K)) | 16.72 | Thermal conductivity |
| c (J/(kg·K)) | 502.48 | Specific heat |
| ρ (kg/m3) | 8030 | Density |
Table 2.
Parameters of hypersonic flow.
Table 2.
Parameters of hypersonic flow.
| Parameter | Value | Parameter Description |
|---|
| Ma∞ | 6.47 | Mach number |
| α (°) | 0 | Angle of attack |
| T∞ (K) | 241.5 | Static temperature |
| p∞ (Pa) | 648.1 | Static pressure |
Table 3.
Comparison of calculated and experimental results.
Table 3.
Comparison of calculated and experimental results.
| Results | Quantity | Calculation | Experiment |
|---|
| Qs (kW/m2) | Stagnation heat flux | 661 | 670 |
| Ts (K) | Stagnation temperature | 442 | 465 |
Table 4.
Parameters of hypersonic flow and wall temperature.
Table 4.
Parameters of hypersonic flow and wall temperature.
| Parameter | Value | Parameter Description |
|---|
| Ma∞ | 8 | Mach number |
| α (°) | 0 | Angle of attack |
| T∞ (K) | 247.02 | Static temperature |
| p∞ (Pa) | 21.96 | Static pressure |
| Tw (K) | 300 | Wall temperature |
Table 5.
Material thermal properties of the structure.
Table 5.
Material thermal properties of the structure.
| Parameter | Value | Parameter Description |
|---|
| k (W/(m·K)) | 2 | Thermal conductivity |
| c (J/(kg·K)) | 1000 | Specific heat |
| ρ (kg/m3) | 1500 | Density |
Table 6.
Drag coefficient and peak heat flux of forebody.
Table 6.
Drag coefficient and peak heat flux of forebody.
| Model | Cd | Qmax (kW/m2) |
|---|
| 1 | 0.966172 | 263.56 |
| 2 | 0.911118 | 331.37 |
| 3 | 0.557827 | 163.94 |
| 4 | 0.496696 | 140.25 |
Table 7.
Influence of the spike and forebody on drag coefficient.
Table 7.
Influence of the spike and forebody on drag coefficient.
| Model | Forebody | Spike |
|---|
| 1 | 0.966172 | 0 |
| 2 | 0.901042 | 0.010076 |
| 3 | 0.502472 | 0.055355 |
| 4 | 0.427148 | 0.069549 |
Table 8.
Influence of viscosity and pressure on drag coefficient.
Table 8.
Influence of viscosity and pressure on drag coefficient.
| Model | Pressure | Viscosity |
|---|
| 1 | 0.900701 | 0.065471 |
| 2 | 0.820853 | 0.090265 |
| 3 | 0.486492 | 0.071335 |
| 4 | 0.434233 | 0.062463 |
Table 9.
Evolution of the drag coefficient.
Table 9.
Evolution of the drag coefficient.
| Model | 1 | 2 | 3 | 4 |
|---|
| t = 0 s | 0.966172 | 0.911118 | 0.557827 | 0.496696 |
| t = 5 s | 0.968403 | 0.889627 | 0.544266 | 0.487179 |
| t = 10 s | 0.969502 | 0.879822 | 0.538436 | 0.483491 |
| t = 15 s | 0.970382 | 0.872595 | 0.533643 | 0.480497 |
| t = 20 s | 0.971165 | 0.866611 | 0.529479 | 0.477855 |
Table 10.
Comparison of the initial total drag coefficient and peak heat flux of the forebody.
Table 10.
Comparison of the initial total drag coefficient and peak heat flux of the forebody.
| L/D | Cd | Qmax (kW/m2) |
|---|
| 0.5 | 0.741191 | 205.21 |
| 1 | 0.572515 | 157.36 |
| 1.5 | 0.496696 | 140.25 |
| 2 | 0.455366 | 130.63 |
Table 11.
Comparison of initial total drag coefficient and peak heat flux of the forebody.
Table 11.
Comparison of initial total drag coefficient and peak heat flux of the forebody.
| d (mm) | Cd | Qmax (kW/m2) |
|---|
| 24 | 0.448826 | 113.95 |
| 28 | 0.434467 | 97.71 |
| 32 | 0.442206 | 87.26 |
| 36 | 0.464701 | 79.67 |
Table 12.
Drag coefficients of the spike and forebody.
Table 12.
Drag coefficients of the spike and forebody.
| d (mm) | Spike | Forebody |
|---|
| 24 | 0.098819 | 0.350007 |
| 28 | 0.133358 | 0.301109 |
| 32 | 0.173247 | 0.268960 |
| 36 | 0.218722 | 0.245978 |


