Article

Shape Optimization of Labyrinth Seals to Improve Sealing Performance

1
AECC Shenyang Engine Research Institute, No. 1 Wanlian Road, Shenyang 110015, China
2
College of Energy and Power Engineering, Nanjing University of Aeronautics and Astronautics, Nanjing 210016, China
*
Author to whom correspondence should be addressed.
Aerospace 2021, 8(4), 92; https://doi.org/10.3390/aerospace8040092
Submission received: 29 January 2021 / Revised: 18 March 2021 / Accepted: 19 March 2021 / Published: 1 April 2021

Abstract

:
To reduce gas leakage, shape optimization of a straight labyrinth seal was carried out. The six design parameters included seal clearance, fin width, fin height, fin pitch, fin backward, and forward expansion angle. The CFD (Computational Fluid Dynamics) model was solved to generate the training and testing samples for the surrogate model, which was established by the least square support vector machine. A kind of chaotic optimization algorithm was used to determine the optimal design parameters of the labyrinth seal. As seal clearance, fin width, fin height, fin pitch, fin backward and forward expansion angles are 0.2 mm, 0.1 mm, 7 mm, 9 mm, 0°, and 15°, the discharge coefficient can reach its minimum value in the design space. The chaotic optimization algorithm coupled with least square support vector machine is a promising scheme for labyrinth seal optimization.

1. Introduction

With the increase of operation pressure, leakage in gas turbines has attracted more and more attention. To prevent fluid leakage from high- to low-pressure regions, labyrinth seals, one kind of non-contacting mechanical seal, have been widely used for many decades. Labyrinth seals work by throttling flow through small successive openings in series, each one of which converts pressure into velocity, which ideally is dissipated in the intervening chambers. The main advantages of labyrinth seals are high flow resistance, structural reliability, and simplicity. Due to these advantages, labyrinth seals remain competitive compared with new designs such as brush and finger seals [1,2,3].
To analyze the performance of a labyrinth seal, many numerical and experimental studies have been performed. The influence of fin-shaped parameters on leakage were studied by Du et al. [4] in straight labyrinth seals. Their experimental results showed that increasing the seal clearance, fin width, and fin height all lead to an increase of discharge coefficient, while adding the fin pitch causes the decrease of the discharge coefficient. Anker and Mayer [5] reported that, at realistic clearance, due to negative incidence downstream stator, the flow separation of leakage flow takes place. Pychynski et al. [6] established the prediction model for discharge coefficient with a data mining method. In the model, the discharge coefficient relies on the number of seal fins, fin height, fin pitch, pressure ratio, seal clearance, step shift, honeycomb cell diameter, fin width, groove shift, step height, and groove width. Asok et al. [7] applied an artificial neural network for the prediction and optimization of square cavity labyrinth seals. Kim and Cha [8] indicated that, as the clearance increases, the performance of stepped seals becomes much better compared with straight seals. Labyrinth seals are complex systems under the influence of geometric and flow parameters. To find global optimal solutions for a given set of requirements, researchers need to handle a high-dimensional design space [9,10]. Therefore, an effective optimization tool is necessary to be developed for labyrinth seals.
In the present optimization method, the surrogate model was established by a supervised learning model called a least square support vector machine (LS-SVM). As one kind of SVM, LS-SVM [11,12] is an effective machine learning tool for regression analysis and pattern recognition. Compared with other surrogate models, LS-SVM shows better regression accuracy and lower computation cost. LS-SVM is especially suitable for machine learning with a small-size training sample. Moreover, a kind of chaotic optimization algorithm was applied for global and detail searches. Compared with the random ergodic searches, the chaotic optimization can perform global searches at higher efficiency due to non-repetition of the chaotic system [13,14]
In this paper, the optimization model of straight labyrinth seals was introduced firstly; and then a CFD (Computational Fluid Dynamics) solution was performed to generate the training and testing samples for the surrogate model; finally, the structural optimization was carried out with the chaotic optimization algorithm and LS-SVM surrogate model, and a detailed analysis of optimization results were provided.

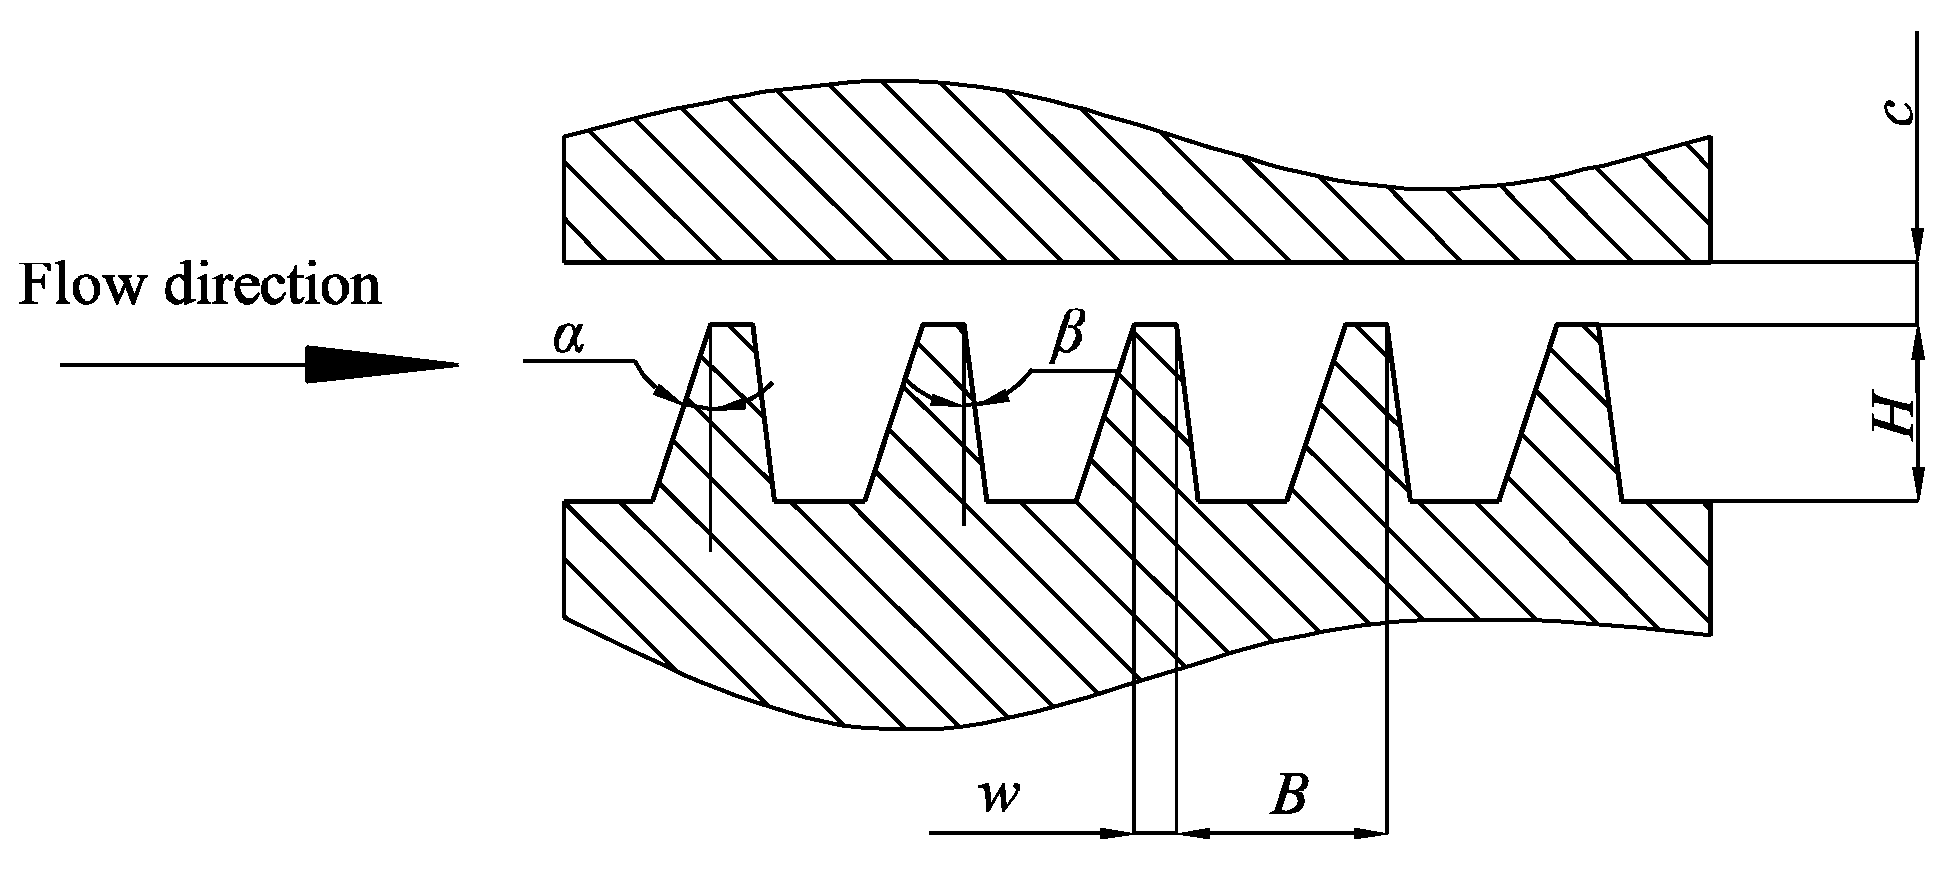
2. Objective Function and Design Variables

In current research, the design variables include seal clearance (c), fin pitch (B), fin height (H), fin width (w), fin forward expansion angle (β), and backward expansion angle (α). These parameters were defined in Figure 1, and their lower and upper limits are listed in Table 1. To meet the high sealing requirement in the outlet region of the high-pressure compressor, the seal in the present model has five fins. The inlet total temperature and pressure are 300 K and 0.12 MPa respectively. The outlet static pressure is 0.1 MPa.
The discharge coefficient is used to evaluate the seal performance quantitatively. Cd is defined as [2,15]:
C d = m a m i
where ma and mi denote the actual and ideal mass flow rate through the channel, respectively. mi can be expressed by:
m i = p 0 A k R T 0 2 k 2 k 1 ( p n p 0 ) 2 k [ 1 ( p n p 0 ) k 1 k ]
where k is the isentropic coefficient (k = 1.4). pn and p0 denote the static and total pressure at the outlet, respectively. R is the gas constant. A denotes the cross-section area of the channel, and T0 is the inlet total temperature.

3. Optimization Method
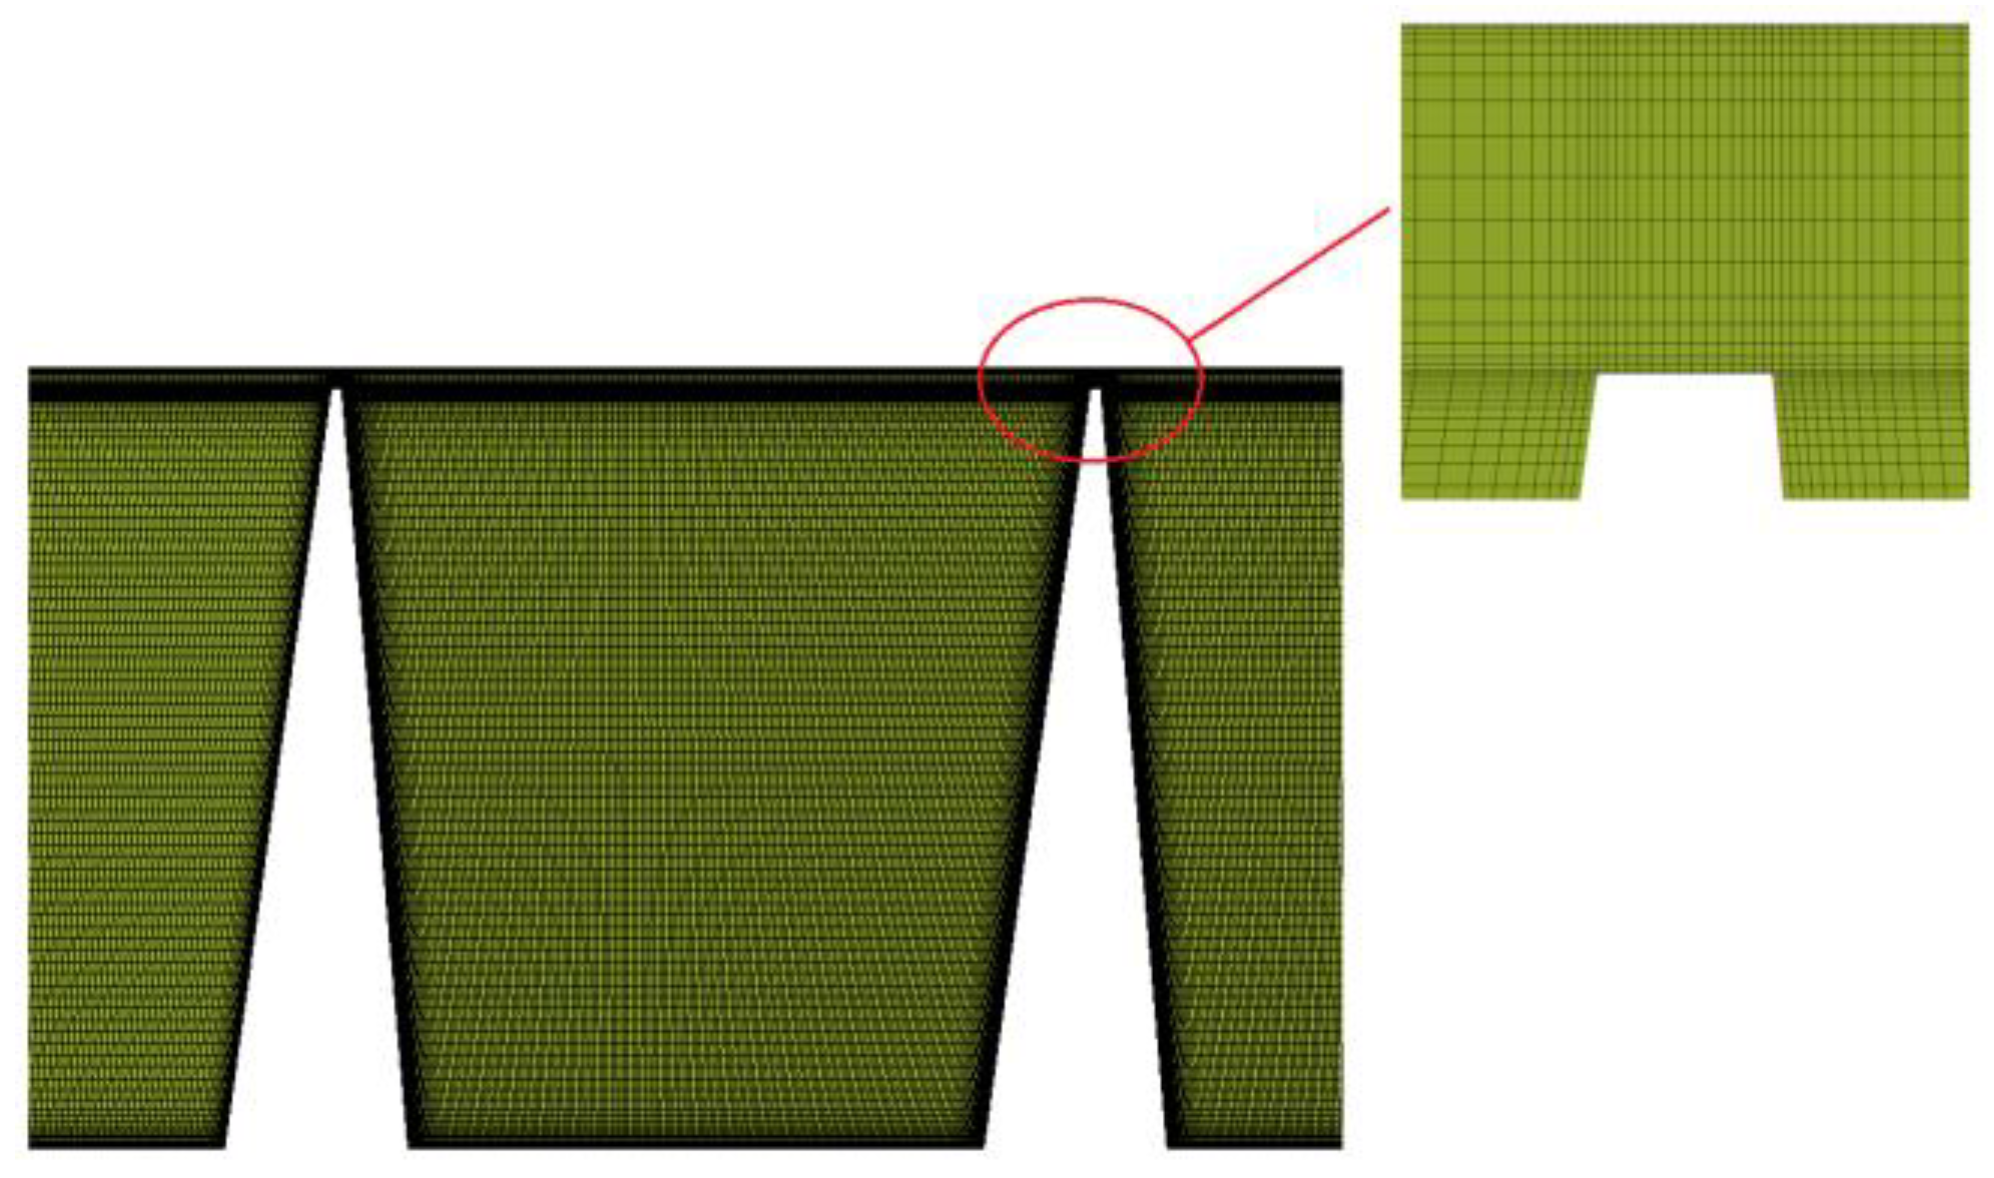
3.1. CFD Method

To study the influences of geometric variables on the discharge coefficient, numerical experiments were carried out by Ansys-Fluent 14.6. Static pressure at the channel outlet, total pressure at the channel inlet, and adiabatic and non-slip condition at the walls are specified. The standard k-ε turbulence model with the enhanced wall function, which has been proven to be suitable for labyrinth-seal flow by Morrison and Al-Ghasem [16], is used for modeling turbulence.
As shown in Figure 2, structured grids are generated by the use of ICEM software. In the clearance region, there are at least 13-layer grids for all the cases. Moreover, 5-layer meshes with the growing ratio of 1.2 were placed in the boundary layer region. The maximum y+ and x+ (flow direction) was less than 10.0 and 40, respectively. To determine the optimal grid number, a grid independent test was performed. Take one case with (c, w, H, B, α, β) = (0.2 mm, 0.1 mm, 7 mm, 7 mm, 8°, 5°) as example. Figure 3 shows the grid independent test results. As the number of computational girds exceeded 117,741, the discharge coefficient kept stable. Therefore, the grid number of 117,741 can be accepted.
Using the Latin hypercube sampling method, 72 groups of data samples were generated for the training samples for the surrogate model, and the other 20 groups generated randomly were used as the testing samples.

3.2. Surrogate Model Based on LS-SVM

It was assumed that there are training points G= {(Ii, Oi), i = 1,…,N} needed to be fitted, where N denotes the total number of training points, which is the input vector, and Ii and Oi denote the input vector and output value, respectively. According to LS-SVM theory, this problem can be expressed by [17,18]:
f ( I j ) = i = 1 N O i a i ker ( I j , I i ) + b
where f(Ij) is LS-SVM output value, and ker(·) denotes the kernel function. The following equations can be solved to determine a and b:
[ 0 A l T A l Ω + η 1 E ] [ b a ] = [ 0 O ]
where η is the penalty factor, E denotes the unit matrix, a = [a1,…, aN]T, Al= [1,…, 1], O = [O1,…, ONs]T, and Ω(i,j) = k(Ii, Ij). Kernel function can be expressed by radial basis function:
ker ( I i , I j ) = exp ( I i I j 2 δ 2 )
where δ is the kernel parameter.

3.3. Chaotic Optimization Algorithm

Currently, global optimization schemes including particle swarm algorithm, simulated annealing, evolutionary programming, and genetic algorithm have been widely applied for optimization practice. To escape from the local optimal values, the classical evolutionary (genetic) algorithm accepts some bad solutions under a certain probability. However, in a chaotic optimization scheme, the local optimal value can be avoided directly due to the regularity of chaotic motion [13,14,19]. In the present study, labyrinth seal geometries were optimized by a kind of chaotic algorithm.
The labyrinth seal optimization model can be expressed by:
min F ( c , w , H , B , α , β ) s . t .   { c [ c min , c max ] w [ w min , w max ] H [ H min , H max ] B [ B min , B max ] α [ α min , α max ] β [ β min , β max ]
where F(·) denotes the objective function. The chaotic time series is generated by logistic model, which is expressed by:
tm+1 = λtm(1 − tm) λ∈(0, 4.0)
Adaptive mutative scale chaos optimization can be divided into 9 steps [19]:
Step 1: Give N1 and N2 a large positive integer. Set m = 1 and n = 1, where, n and m denote global and detailed searching times.
Step 2: Give t(1) = (t1(1), t2(1), , t6(1)) a 6-dimensional random vector, and generate chaotic series t(j+1), j = 1,…,N1 according to the logistic model. Change ti(j+1) from the range (0,1) to (ti,min, ti,max), i = 1,2,…,6, by:
t i ( j ) = t i , min + ( t i , max t i , min ) t i ( j )
Step 3: Assign (t1′(n), t2′(n),, t6′(n)) to (c, w, H, B, α, β), and calculate Fn by LS-SVM. If n equals 1, then assign Fn to F*.
Step 4: If F* < Fn, then assign Fn and ti’(n) to F* and ti*.
Step 5: Assign n + 1 to n. If n is smaller than N1, return to Step 3. If n is larger than N1, then generate (ti,min, ti,max) by:
{ t i , min / = t i * φ ( t i , max t i , min ) t i , max / = t i * + φ ( t i , max t i , min )
where φ is in the interval of 0 and 0.5. If ti,min is smaller than ti,min, then assign ti,min to ti,min. If ti,max is higher than ti,max, then assign ti,max to ti,max.
Step 6: A new chaotic variable t*i can be generated by:
t i * = ( 1 β i ) t i * t i , min t i , max t i , min + β i t i N 1 t i , min t i , max t i , min
where adaptive adjustment coefficient, βi can be determined by the following equation:
β i = 1 ( m 1 m ) l
where l equals 2 in the present stduy.
Step 7: Assign ti* to ti(m), and give (t1(m), t2(m), , t6(m)) to (c, w, H, B, α, β). Calculate Fn. If m equals to 1, then assign Fn to F*.
Step 8: If F* is smaller than Fn, assign Fn and ti(m) to F* and ti*.
Step 9: Assign m + 1 to m. If m is smaller than N2, then go to 6th step. If m equals to N2, the optimization processes end.

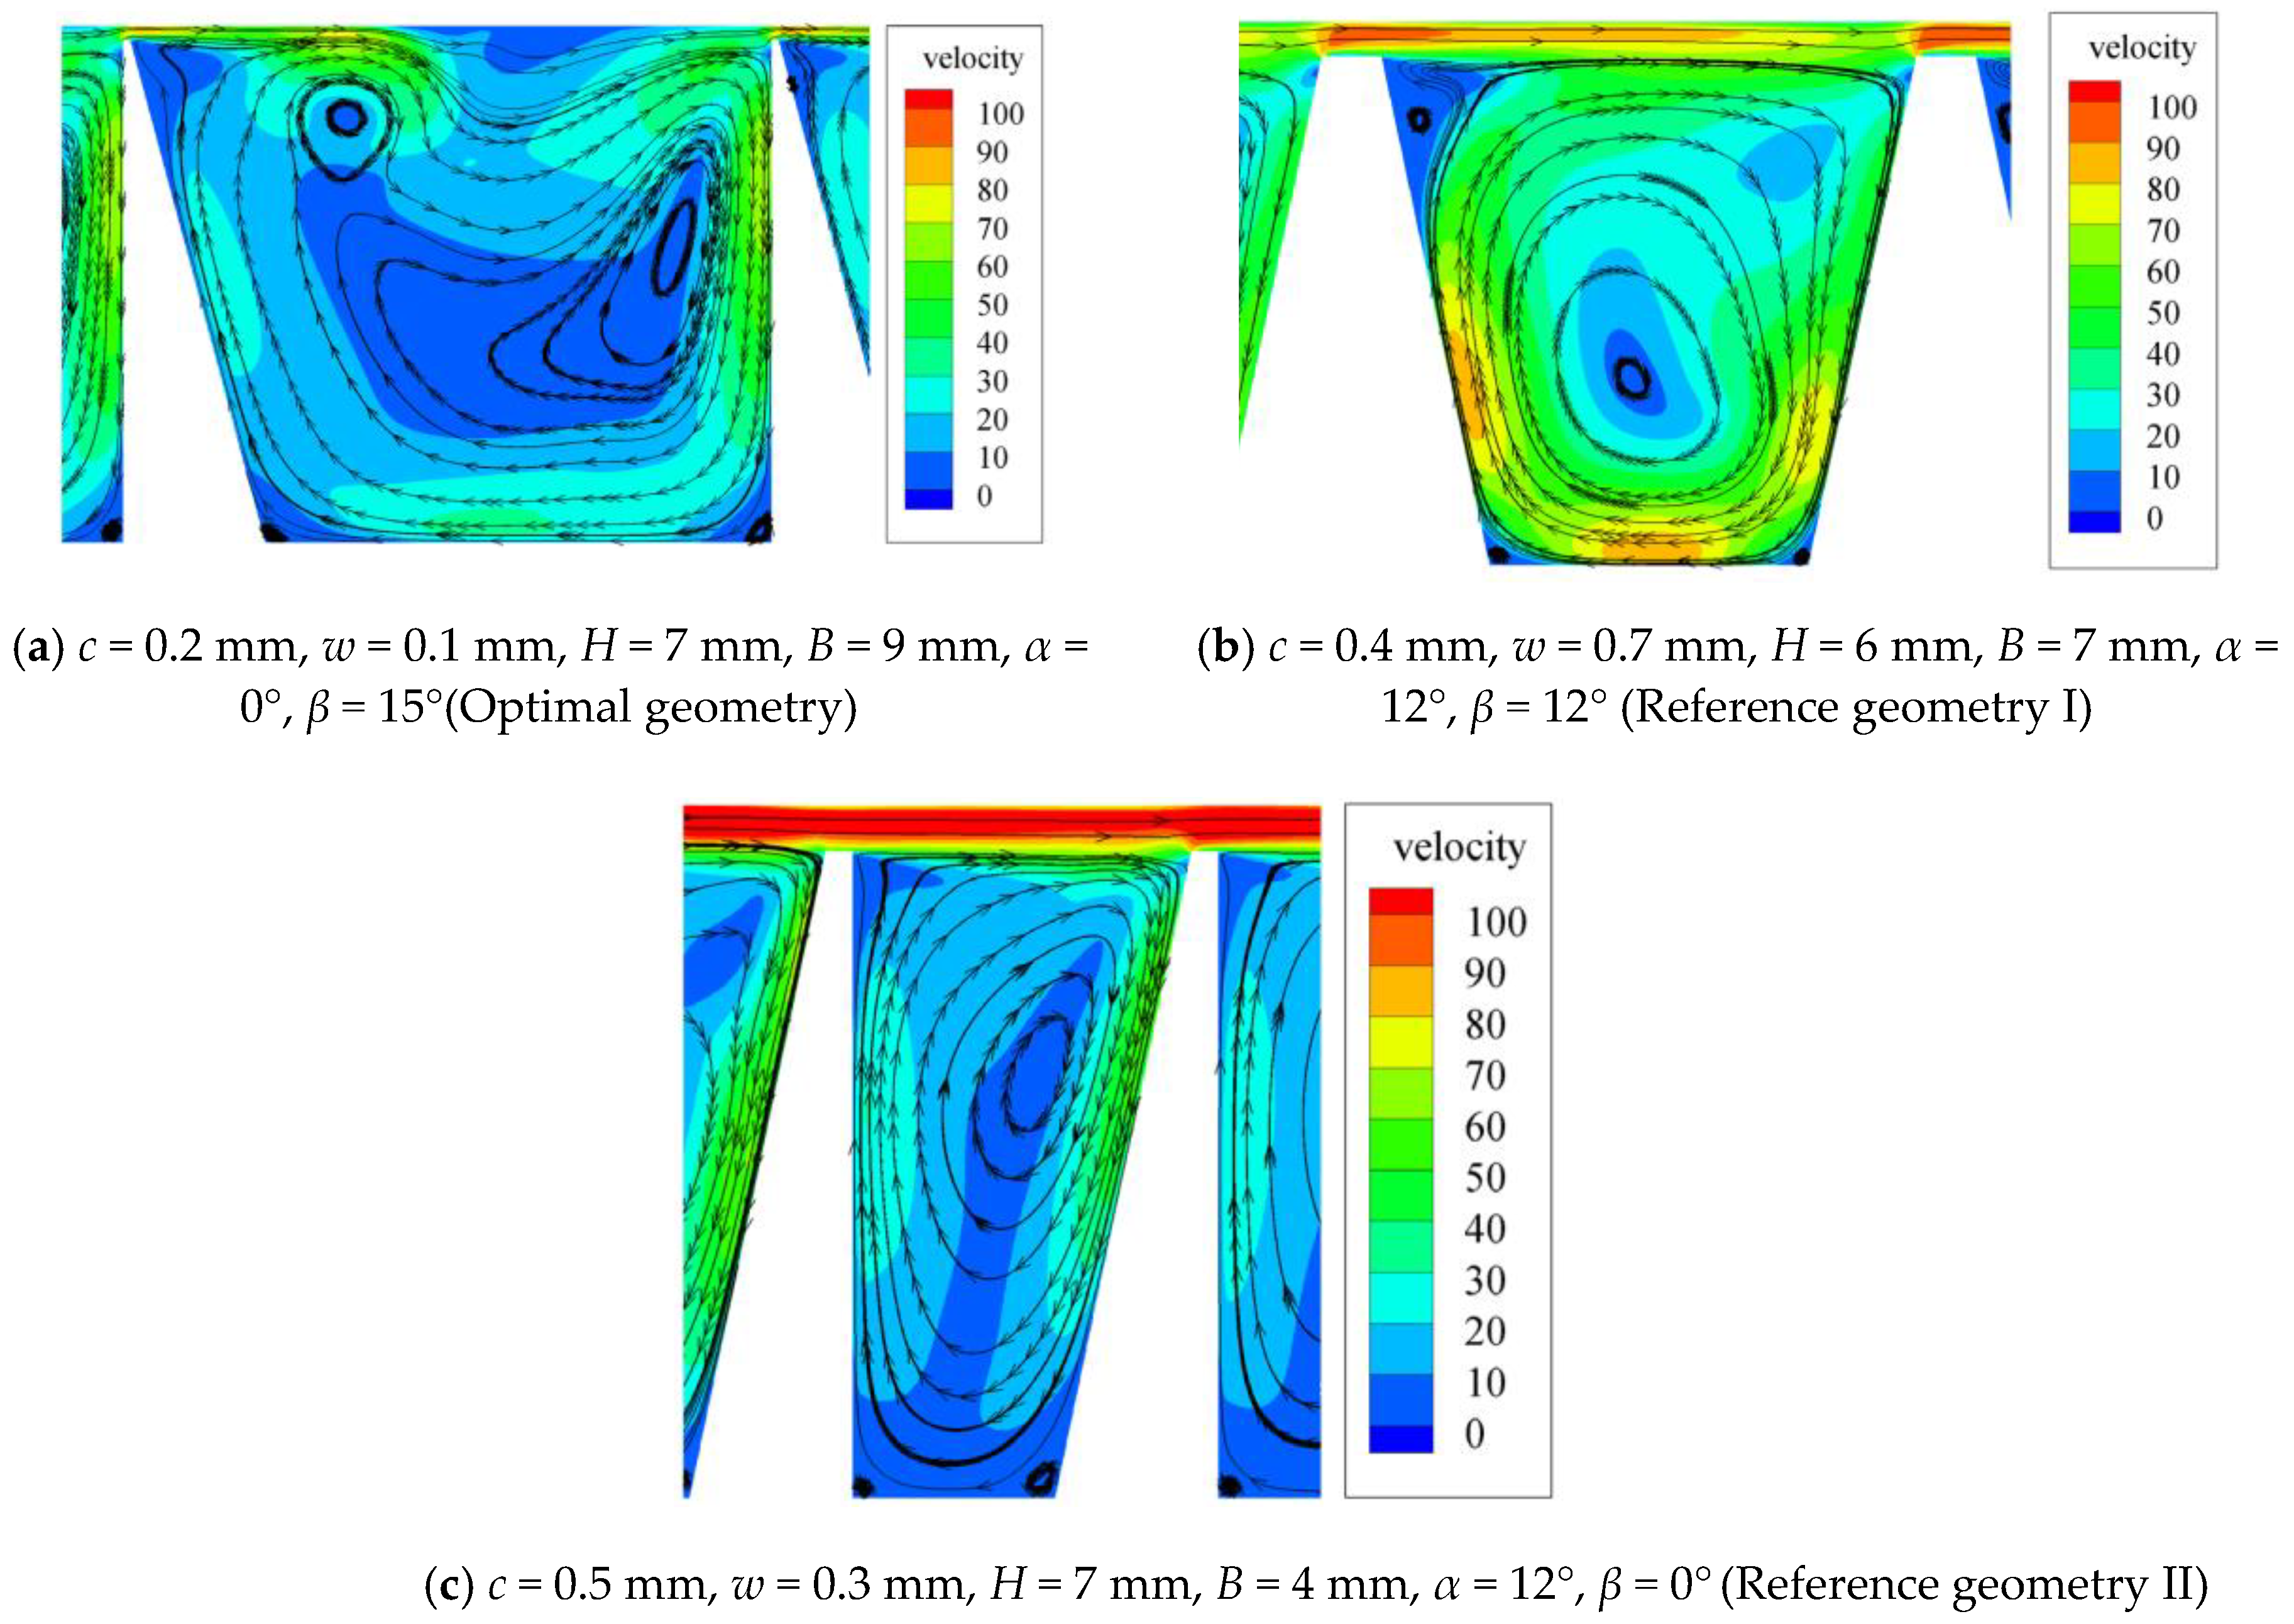
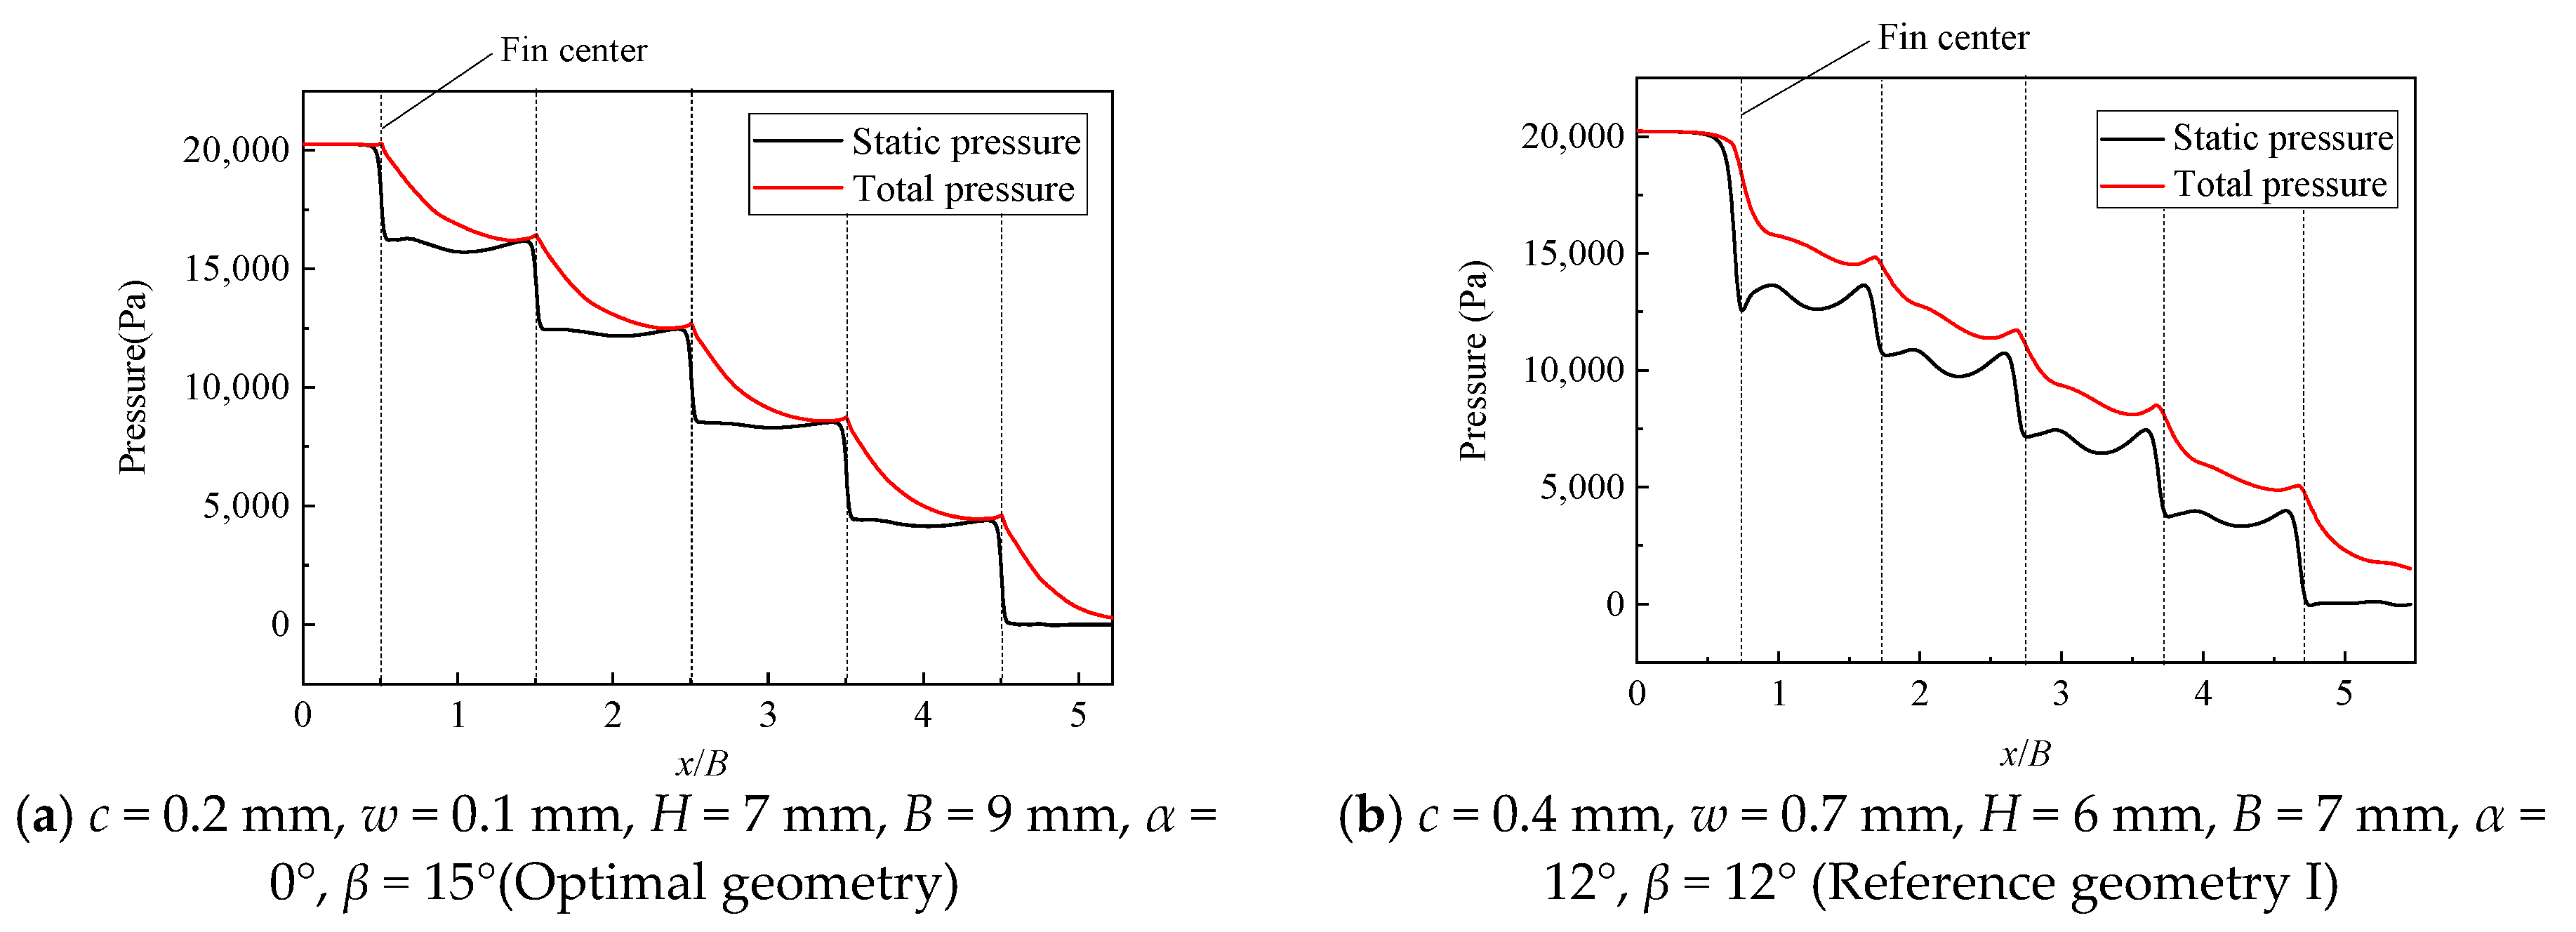
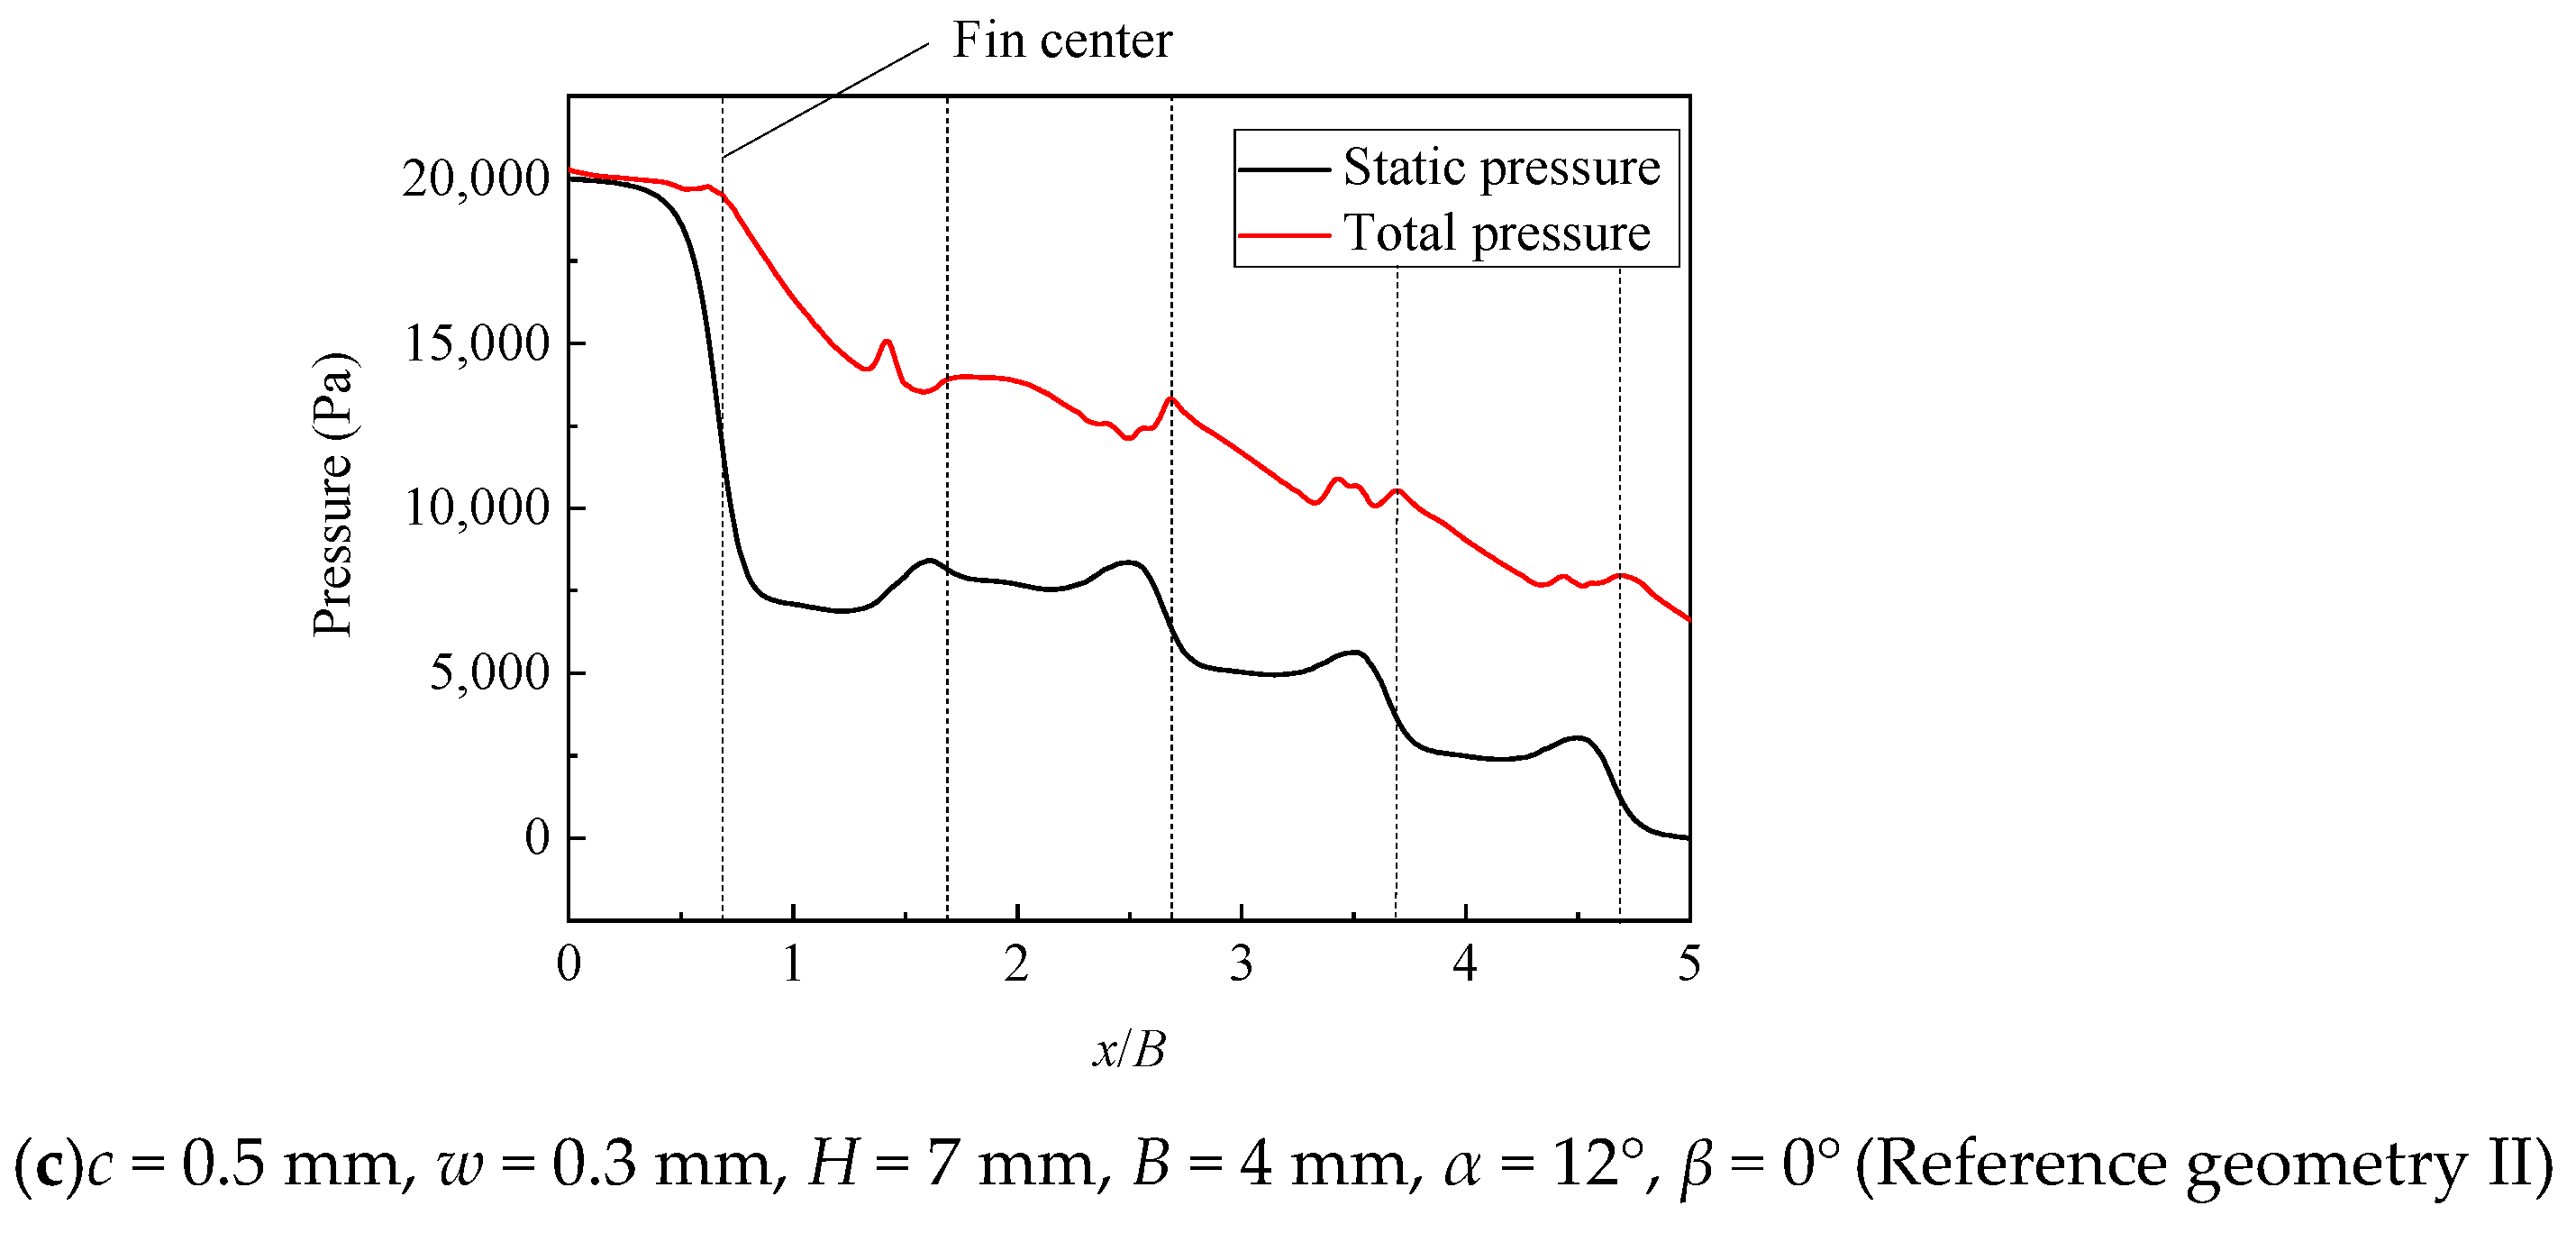
4. Analysis of Results

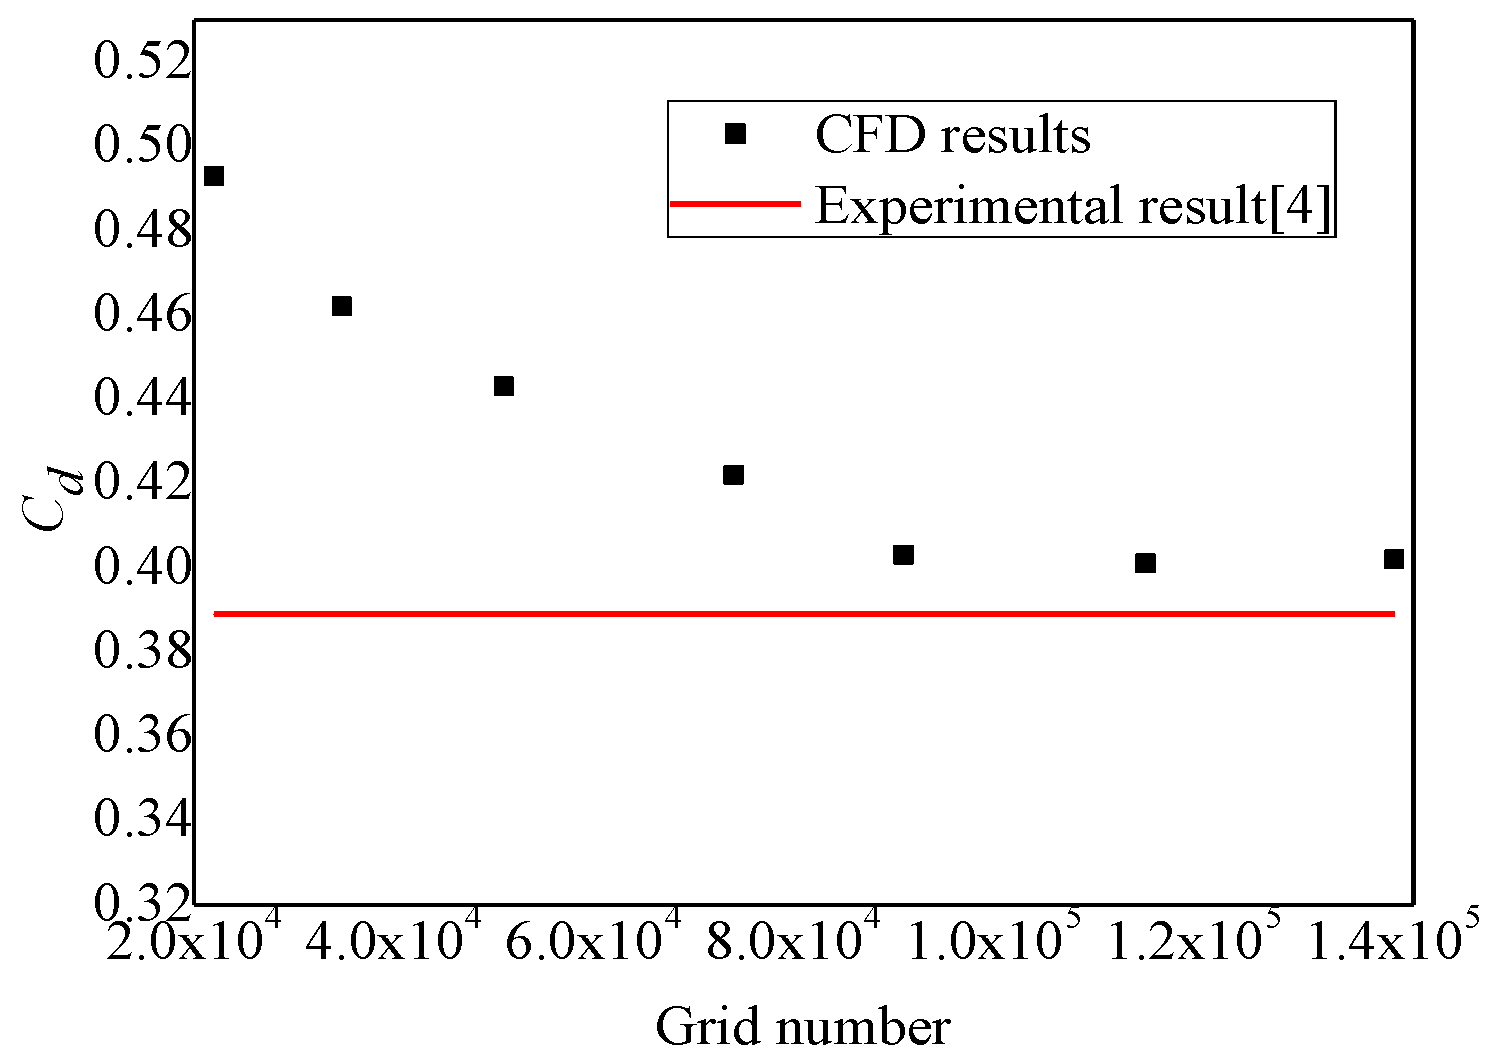
4.1. CFD Model Validation

The open-published experimental results from Ref. [4] were used for model validation. The 25 groups of experimental data are shown in Table 2. Define the calculation error as:
e r r o r = | C d , cal C d , exp C d , exp |
where Cd,cal is the CFD calculation results and Cd,exp is the experimental results. The mean error is 7.9%, the maximum calculation error is 11.7%, and the minimum error is 1.8%. Overall, CFD calculated results agree with the experimental results well.

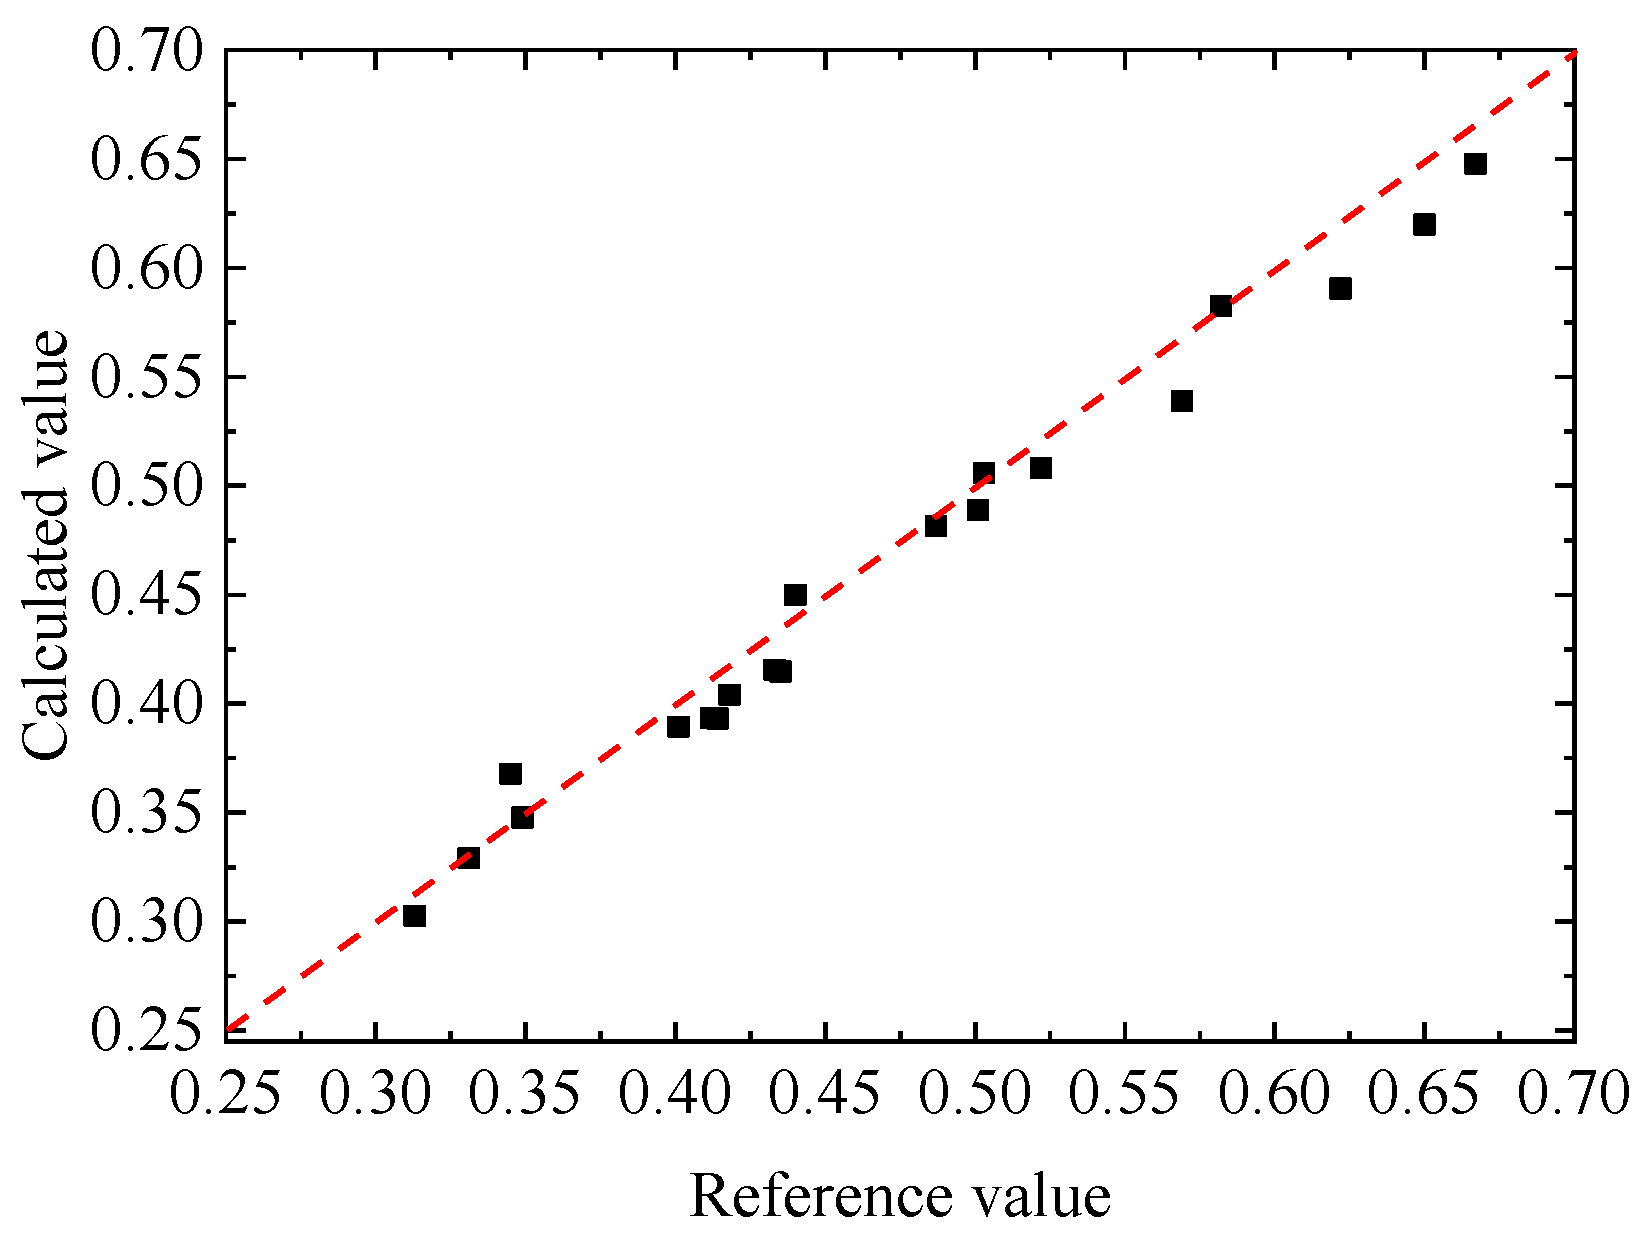
4.2. Surrogate Model Validation

The surrogate model is established by the support vector machine toolbox in Matlab software. In the LS-SVM model, the kernel parameter and the penalty factor affect the surrogate accuracy. In current research, these two parameters were determined by the trial-and-error method. The optimal value of the penalty factor and kernel parameter were chosen as 18 and 2.8, respectively, based on 20 groups of testing samples. The calculation error of LS-SVM was 4.31% (shown in Figure 4).

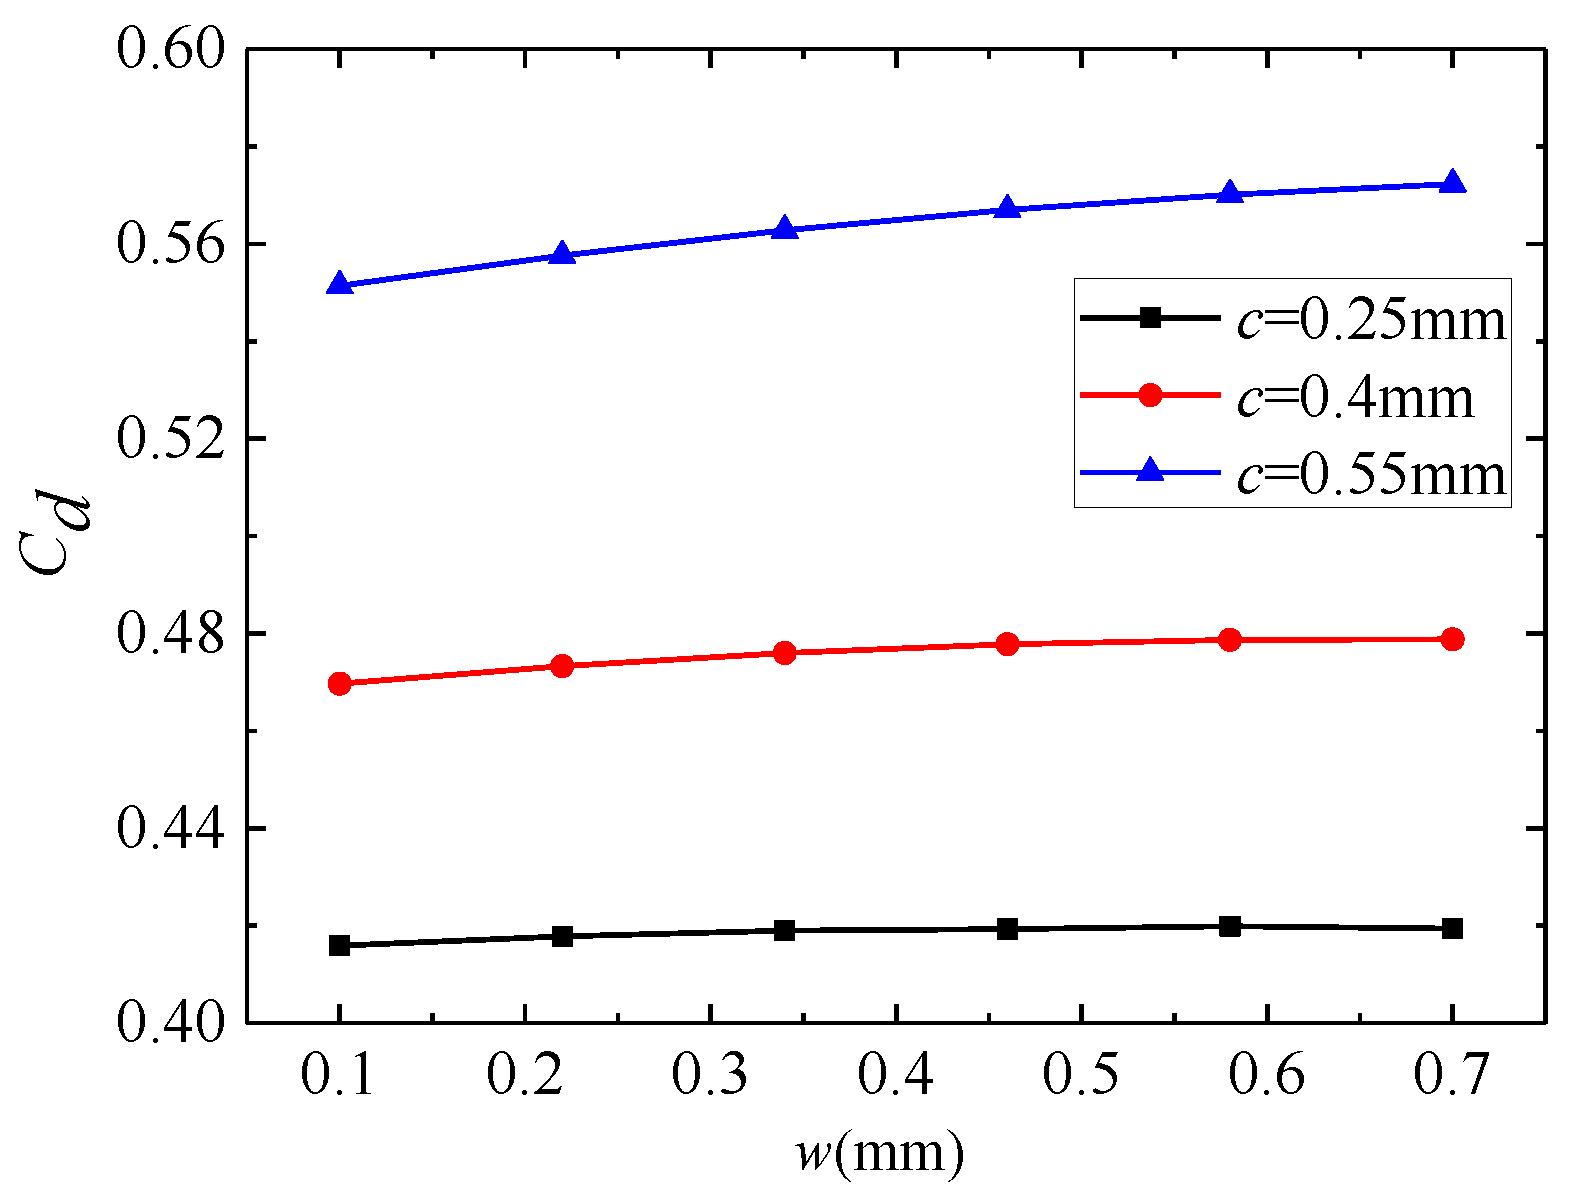
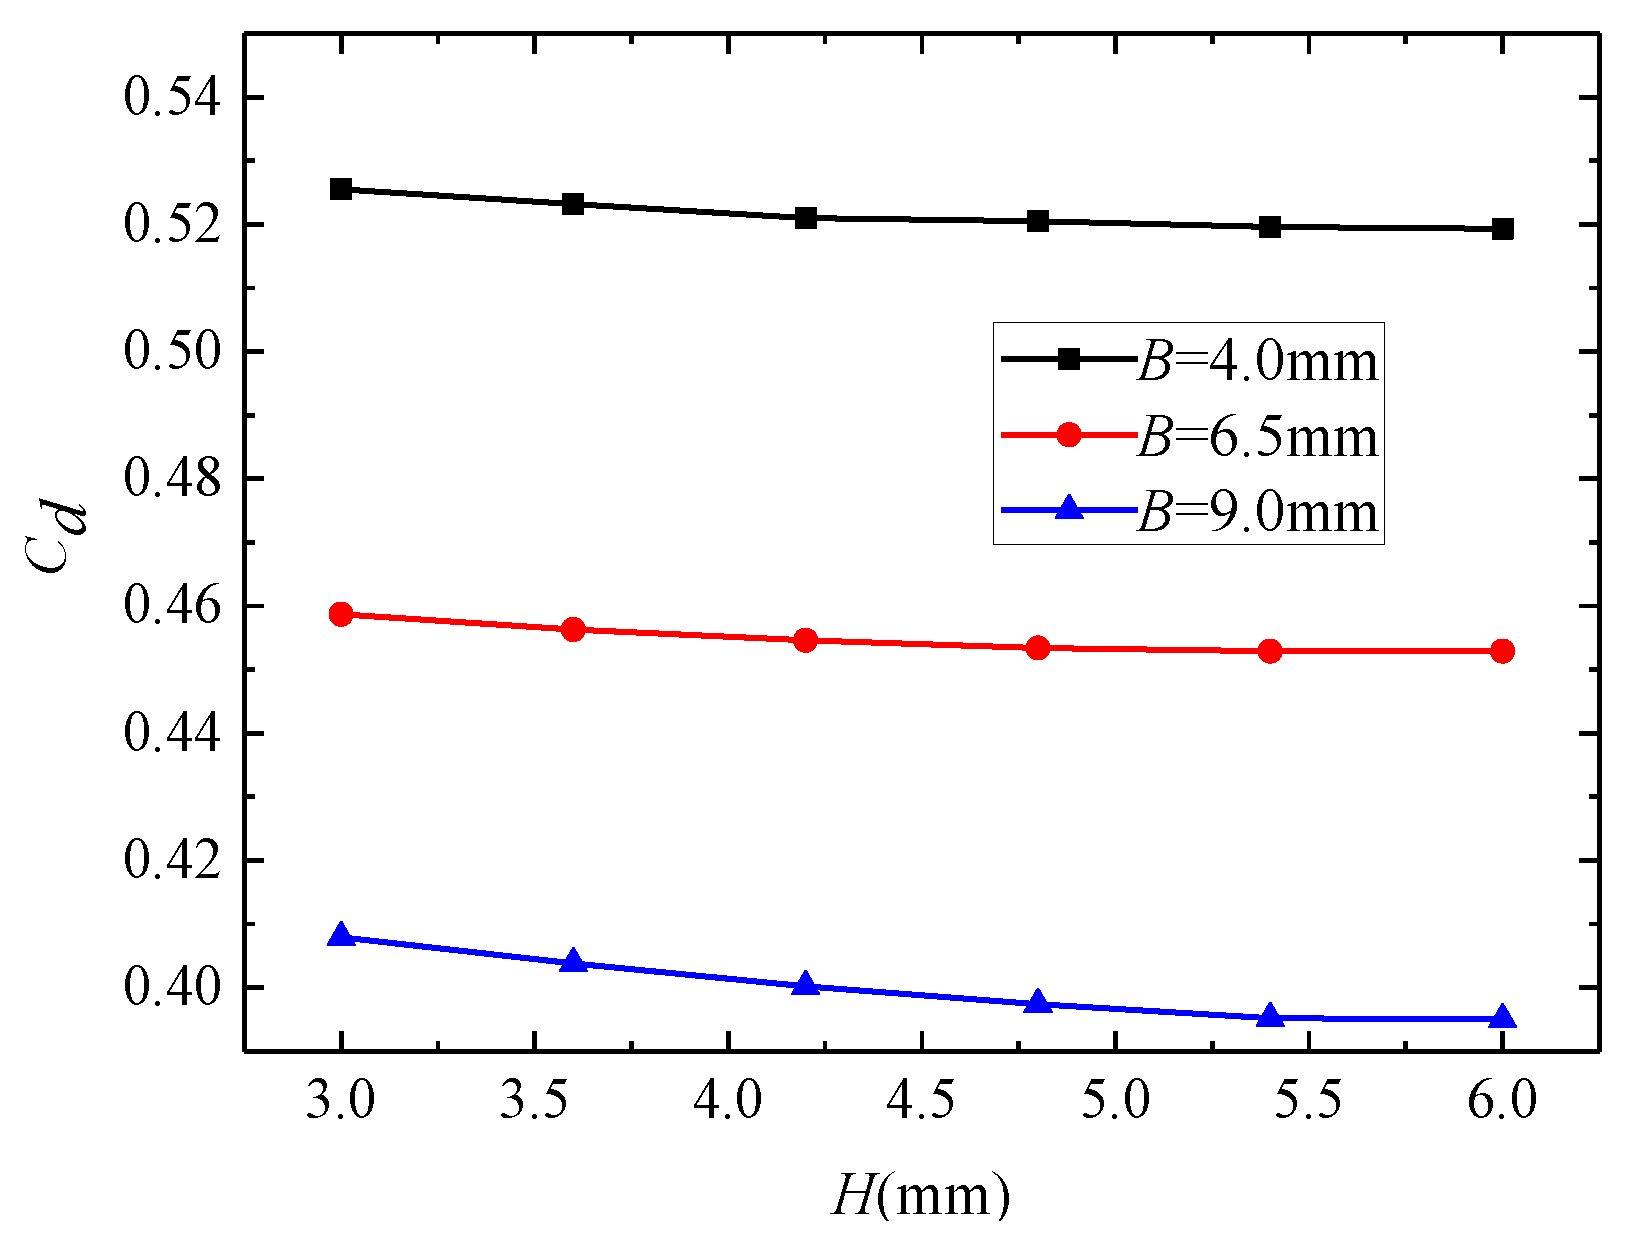
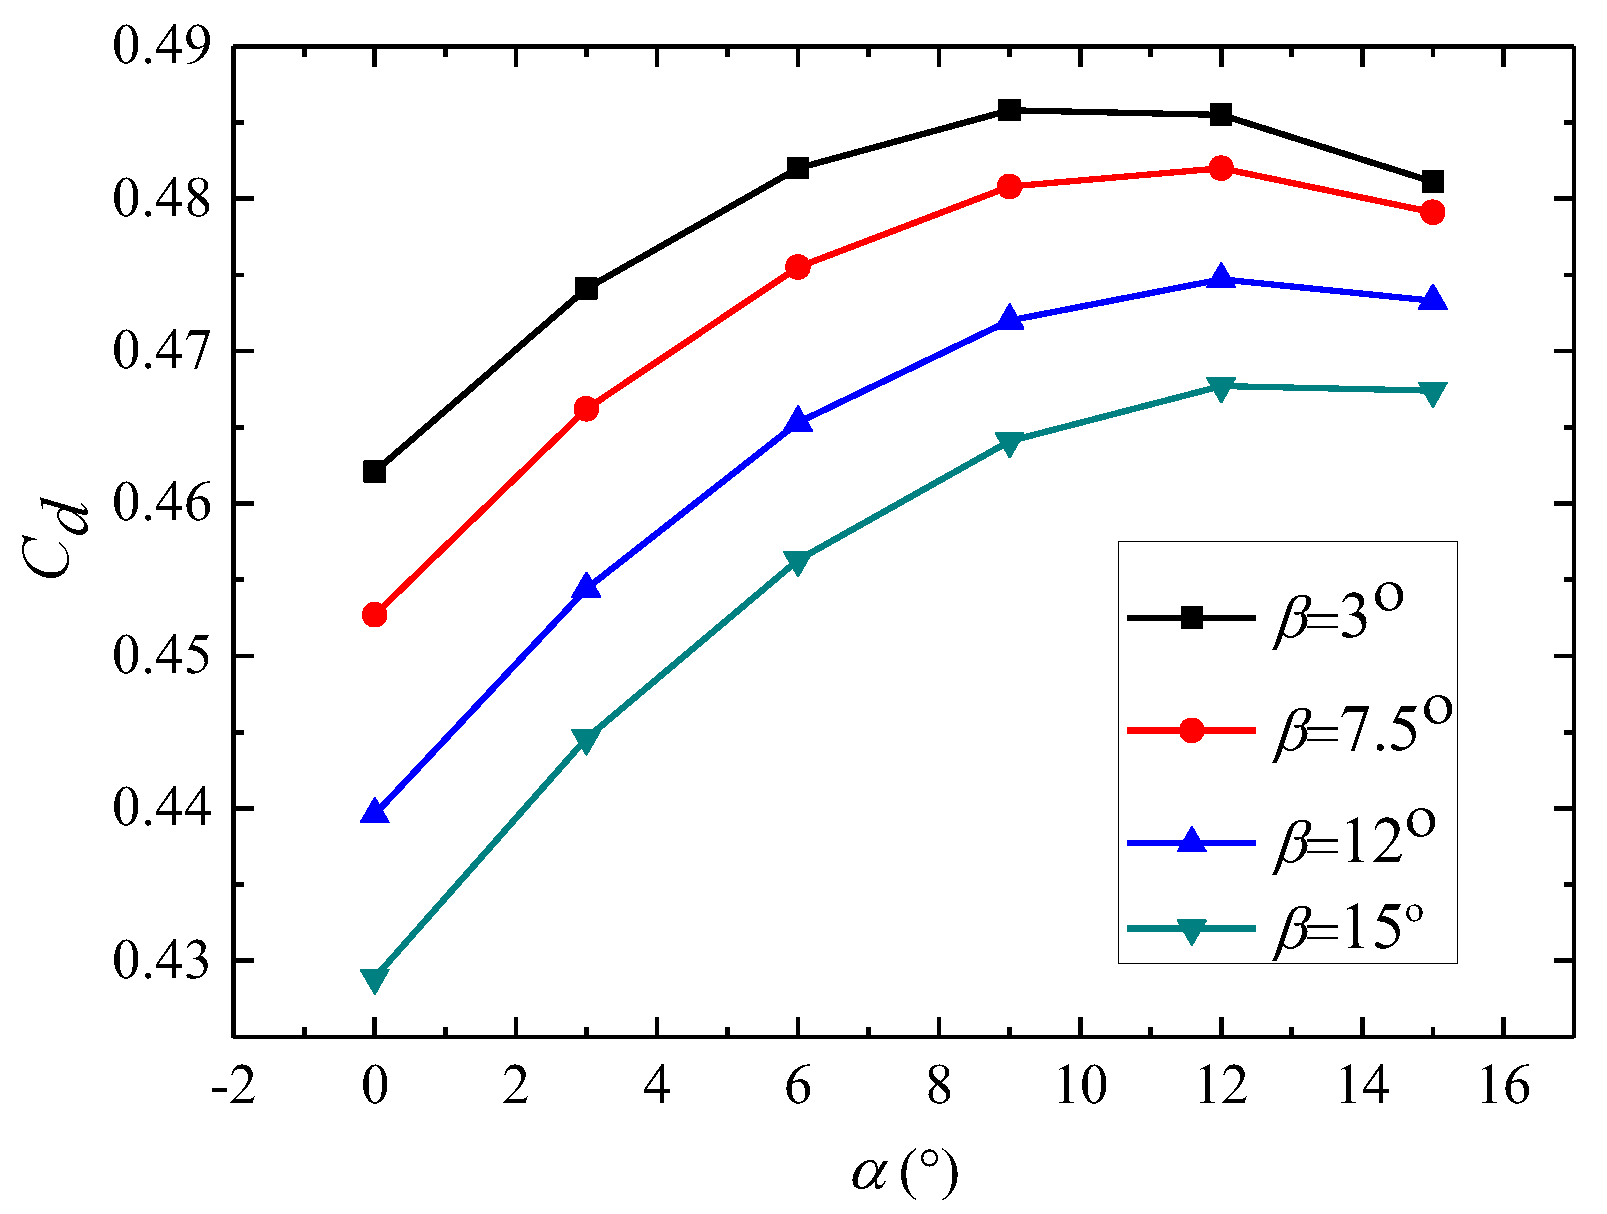
4.3. Analysis of Calculation Results from LS-SVM

The effects of fin width and seal clearance on the discharge coefficient are shown in Figure 5. Adding seal clearance led to the decrease of the jet velocity, which lowered the flow resistance and turbulence induced viscous loss [3]. Therefore, with the increase of seal clearance, the seal performance deteriorated, and the discharge coefficient increased. Adding fin width resulted in the increase of jet penetration length, which mitigated the vortex loss in the downstream cavity [20,21]. Therefore, the discharge coefficient increased with the rise of fin width. Compared with the fin width, the effect of the seal clearance on discharge coefficient is predominant.
(H = 5 mm, B = 6 mm, α = 7.5°, β = 7.5°)
Figure 6 shows the influences of fin height and pitch on the discharge coefficient. The rise of fin pitch resulted in the increase of cavity area; accordingly, vortex loss in the cavity was promoted. Therefore, as fin pitch increased, the discharge coefficient decreased. Adding the fin height promoted the vortex formation and the flow stagnation [21], and thus, the discharge coefficient decreased with the rise of fin height. Compared with the fin height, the effect of fin pitch on discharge coefficient was predominant.
(w = 0.4 mm, c = 0.4 mm, α = 7.5°, β = 7.5°)
Figure 7 shows the influences of fin forward and backward expansion angle on the discharge coefficient. As backward expansion angle increased, the cavity area decreased. Therefore, the discharge coefficient increased as the backward expansion angle increased from 0° to 12°. However, as the backward expansion angle exceeded 12°, the discharge coefficient decreased with the rise of backward expansion angle slightly. Reducing the fin forward expansion angle caused the decrease of jet expansion angle, which mitigated the vortex loss and flow stagnation loss in the subsequent downstream cavity [4]. Therefore, reducing the forward expansion angle caused the increase of discharge coefficient.
(w = 0.4 mm, c = 0.4 mm, H = 5 mm, B = 6 mm)

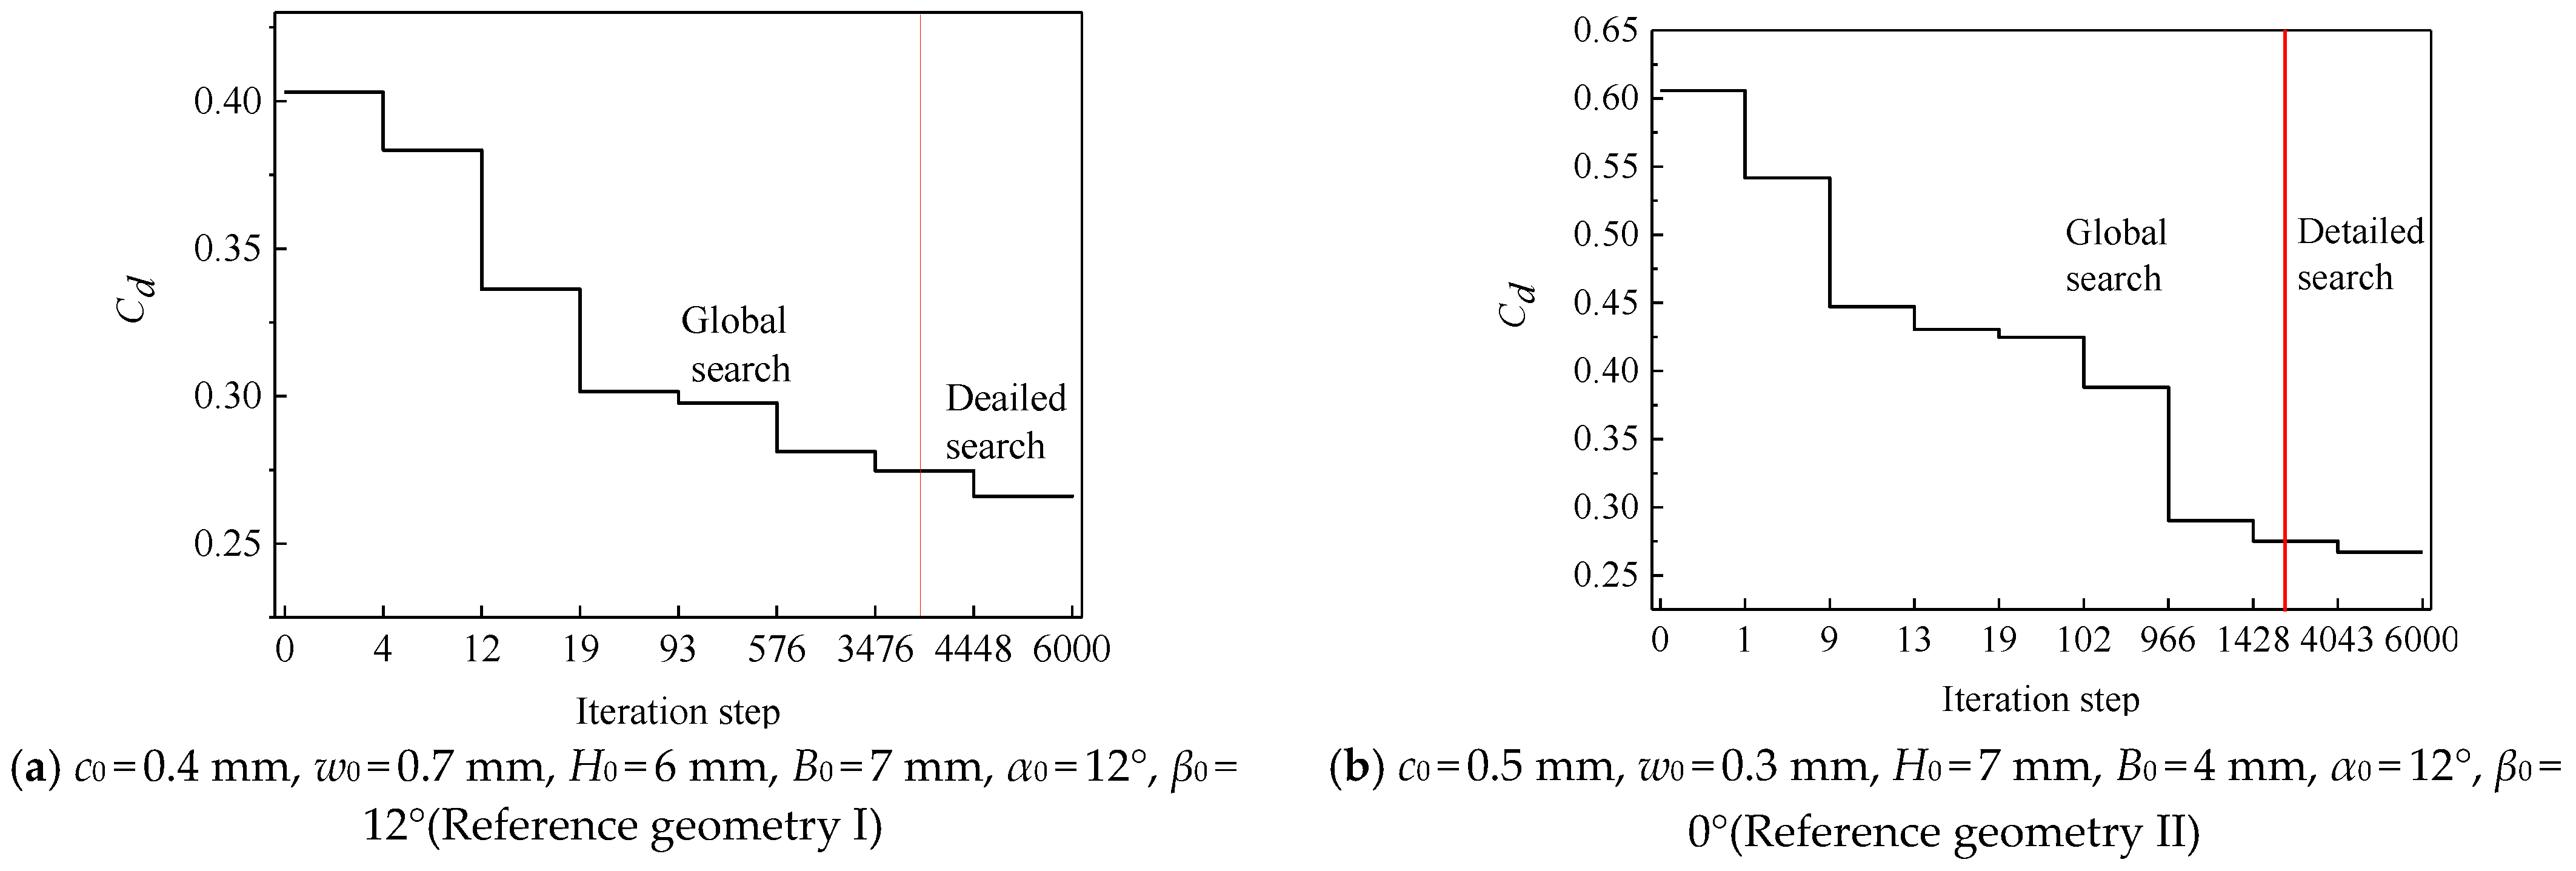
4.4. Optimization Processes

The labyrinth seal optimization model can be expressed by:
min C d ( c , w , H , B , α , β ) s . t .   { 0.2   mm c 0.6   mm 0.1   mm w 0.7   mm 3   mm H 7   mm 3   mm B 9   mm 0 ° α 15 ° 0 ° β 15 °
Set N1 = 4000 and N2 = 2000, where N1 and N2 denote the maximum global and detailed search step, respectively. Two different optimization processes with different initial design values were performed. In the first optimization process, the initial values of c, w, H, B, α, and β were 0.4 mm, 0.7 mm, 6 mm, 7 mm, 12°, and 12°. As shown in Figure 8a, by optimization, Cd decreased from 0.403 to 0.267, and the optimal design parameters were 0.202 mm, 0.103 mm, 6.950 mm, 8.991 mm, 0.007°, and 14.994°. In the second optimization process, the initial values of c, w, H, B, α, and β were 0.5 mm, 0.3 mm, 7 mm, 4 mm, 12°, and 0°. As shown in Figure 8b, by optimization, Cd decreased from 0.509 to 0.266, and the optimal design parameters were 0.212 mm, 0.105 mm, 6.989 mm, 8.930 mm, 0.009°, and 14.989°). This illustrates that the effects of initial values on optimization results were notobvious.
Gas-velocity distributions in the flow channel are shown in Figure 9. In the cavity, vortexes with different scales were formed. After optimization, the vortex effect was promoted effectively, and this promoted the vortex loss and flow stagnation loss. Moreover, by the optimization, the seal clearance decreased, and the gas leakage was mitigated effectively. The distributions of static and total pressure along the flow direction are shown in Figure 10. The profiles of static pressure show that, as the fluid passed through different seal elements, energy conversion took place. At each throttling location, it showed a gain in kinetic energy and a reduction in static pressure. Conversely, due to the dissipation of kinetic energy, the recovery of static pressure afterwards could also be observed [1]. By the optimization, the dissipation of gas kinetic energy was enhanced and the throttling effect was promoted. The seal performance after optimization was improved effectively.

5. Conclusions

A kind of optimization method was developed for straight labyrinth seals. The discharge coefficient was considered for objective function, which is to be minimized. For the six design variables, namely, seal clearance, fin width, fin height, fin pitch, and fin backward and forward expansion angle, 72 groups of training samples and 20 groups of testing samples were generated by solving a CFD model.
The surrogate model was established by LS-SVM. The prediction of LS-SVM for discharge coefficient agreed well with the experimental data. By analyzing LS-SVM output results, some meaningful conclusions are summarized: adding fin width and seal clearance both lead to the increase of discharge coefficient; the rises of fin forward expansion angle, fin pitch, and height all result in the decrease of discharge coefficient; as the backward expansion angle of fin increases, the discharge coefficient increases firstly, and then decreases slightly.
A chaotic optimization algorithm was used for global searches. By optimization, the sealing performance was improved effectively. The optimal shape of labyrinth seals has a seal clearance of 0.2 mm, fin width of 0.1 mm, fin height of 7 mm, fin pitch of 9 mm, fin backward expansion angle of 0°, and fin forward expansion angle of 15°. It could be found that a chaotic optimization algorithm coupled with LS-SVM suggorate model is an effective tool for labyrinth-seal optimization.
In the present study, only the discharge coefficient was considered an optimization goal. In fact, windage temperature rising performance is also a very important index. THerefore, in the future, muti-goal optimization should be carried out, especially with the condition of small fin number.

Author Contributions

Conceptualization, C.W. and Y.Z.; methodology, C.W. and Y.Z.; writing—original draft preparation, Y.Z.; writing—review and editing, C.W.; funding acquisition, C.W. All authors have read and agreed to the published version of the manuscript.

Funding

This research was supported by the Fundamental Research Funds for the Central Universities (grant No: NS2020013) and National Science and Technology Major Project of China (grant No: 2017-III-0011-0037).

Institutional Review Board Statement

Not applicable.

Informed Consent Statement

Not applicable.

Data Availability Statement

Data available on request due to restrictions e.g., privacy or ethical.

Conflicts of Interest

The authors declare no conflict of interest.

References

  1. Nayaka, C. Effect of rotation on leakage and windage heating in labyrinth seals with honeycomb lands. J. Eng. Gas Turbines Power Trans. ASME 2020, 142, 081001. [Google Scholar] [CrossRef]
  2. Suryanarayanan, S.; Morrison, G.L. Labyrinth seal discharge coefficient for rectangular cavities. In Proceedings of the ASME 2009 Fluids Engineering Division Summer Meeting, Vail, CO, USA, 2–6 August 2009. FEDSM2009-78152. [Google Scholar]
  3. Witting, S.; Schelling, U.; Kim, S.; Jacobsen, K. Numerical predictions and measurements of discharge coefficient in labyrinth seals. In Proceedings of the ASME International Gas Turbine Conference & Exhibition, Anaheim, CA, USA, 31 May–4 June 1987; The American Society of Mechanical Engineerings: Farifield, NY, USA, 1987. 87-GT-188. [Google Scholar]
  4. Du, F.Q.; Ji, H.F.; Shuai, H.S.; Zhang, B.; Wang, D.; Lu, H.Y.; Deng, M.C. Orthogonal experiment of effect of fin geometrical parameters on leakage of straight-labyrinth seals. J. Aerosp. Power 2013, 28, 825–831. [Google Scholar]
  5. Anker, J.E.; Mayer, J.F. Simulation of the interaction of labyrinth seal leakage flow and main flow in an axial turbine. In ASME Turbo Expo 2002: Power for Land, Sea and Air; The American Society of Mechanical Engineerings: Farifield, NY, USA, 2002; GT2002-30348. [Google Scholar]
  6. Pychynski, T.; Dullenkopf, K.; Bauer, H.J.; Mikut, R. Modeling the labyrinth seal discharge coefficient using data mining methods. In ASME Turbo Expo 2010: Power for Land, Sea, and Air; The American Society of Mechanical Engineerings: Farifield, NY, USA, 2010; GT2010-2266. [Google Scholar]
  7. Asok, S.P.; Sankaranarayanasamy, K.; Sundararajan, T.; Rajesh, K.; Ganeshan, S.G. Neural network and CFD-based optimisation of square cavity and curved cavity static labyrinth seals. Tribol. Int. 2007, 40, 1204–1216. [Google Scholar] [CrossRef]
  8. Kim, T.S.; Cha, K.S. Comparative analysis of the influence of labyrinth seal configuration on leakage behavior. J. Mech. Sci. Technol. 2009, 23, 2830–2838. [Google Scholar] [CrossRef]
  9. Schramm, V.; Denecke, J.; Kim, S.; Witting, S. Shape optimization of a labyrinth seal applying the simulated annealing method. Int. J. Rotating Mach. 2004, 10, 365–371. [Google Scholar] [CrossRef]
  10. Wang, Z.H.; Xu, L.Q.; Xi, G. Numerical investigation of the labyrinth seal design for a low flow coefficient centrifugal compressor. In ASME Turbo Expo 2010, Power for Land, Sea and Air; The American Society of Mechanical Engineerings: Farifield, NY, USA, 2010; GT2010-23096. [Google Scholar]
  11. Cortes, C.; Vapnik, V. Support-vector networks. Mach. Learn. 1995, 20, 273–297. [Google Scholar] [CrossRef]
  12. Wang, C.H.; Zhang, J.Z.; Zhou, J.H. Prediction of film-cooling effectiveness based on support vector machine. Appl. Therm. Eng. 2015, 83, 82–93. [Google Scholar] [CrossRef]
  13. Shayeghi, H.; Shayanfar, H.A.; Jalizadeh, S.; Safari, A. Multi-machine power system stabilizers design using chaotic optimization algorithm. Energy Convers. Manag. 2010, 51, 1572–1580. [Google Scholar] [CrossRef]
  14. Santos, C.L. Turning of PID controller for an automatic regulator voltage system using chaotic optimization approach. ChaosSolitons Fractals 2009, 39, 1504–1514. [Google Scholar] [CrossRef]
  15. Willenborg, K.; Kim, S.; Witting, S. Effects of Reynolds number and pressure ratio on leakage loss and heat transfer in a stepped labyrinth seal. ASME J. Turbomach. 2011, 123, 815–822. [Google Scholar] [CrossRef]
  16. Morrison, G.L.; Adnan, A.G. Experimental and computational analysis of a gas compressor windback seal. In ASME Turbo Expo 2007: Power for Land, Sea, and Air; The American Society of Mechanical Engineerings: Farifield, NY, USA, 2007; GT2007-27986. [Google Scholar]
  17. Suykens, J.A.K.; Vandewalle, J. Least squares support vector machine classifiers. Neural Process. Lett. 1999, 9, 293–300. [Google Scholar] [CrossRef]
  18. Wang, H.C.; Fang, H.R.; Meng, L.; Xu, F.X. A pre-warning system of abnormal energy consumption in lead smelting based on LSSVR-RP-CI. J. Cent. South Univ. 2019, 26, 2175–2184. [Google Scholar] [CrossRef]
  19. Jiaqiang, E.; Wang, C.H.; Gong, J.K.; Wang, Y.N. A new adaptive mutative scale chaos optimization algorithm and its application. Control Theory Appl. 2008, 6, 141–145. [Google Scholar]
  20. Qin, H.Q.; Lu, D.G.; Zhong, D.W.; Wang, Y.; Song, Y. Experimental and numerical investigation for the geometrical parameters effect on the labyrinth-seal flow characteristics of fast reactor fuel assembly. Ann. Nucl. Energy 2020, 135, 106964. [Google Scholar] [CrossRef]
  21. Ji, G.J.; Ji, H.H. Numerical and experimental investigation of pressure loss and critical sealing characteristics of straight-through labyrinth seals. J. Aerosp. Power 2008, 23, 415–420. [Google Scholar]
Figure 1. Structure of straight-labyrinth seal.
Aerospace 08 00092 g001
Figure 2. Details of the grid used in the simulation.
Aerospace 08 00092 g002
Figure 3. Grid independence test result.
Aerospace 08 00092 g003
Figure 4. Validation of least square support vector machine (LS-SVM) model.
Aerospace 08 00092 g004
Figure 5. Influences of seal clearance and fin width on discharge coefficient.
Aerospace 08 00092 g005
Figure 6. Influences of fin height and pitch on discharge coefficient.
Aerospace 08 00092 g006
Figure 7. Influences of fin expansion angle on discharge coefficient.
Aerospace 08 00092 g007
Figure 8. Variation of Cd with iteration steps.
Aerospace 08 00092 g008
Figure 9. Distribution of gas velocity in the second seal cavity (Unit: m/s).
Aerospace 08 00092 g009
Figure 10. Distribution of pressure profile on the flow direction.
Aerospace 08 00092 g010aAerospace 08 00092 g010b
Table 1. Design variables and design space.
Design VariableSymbolUnitLower BoundUpper Bound
Fin clearancecmm0.20.6
Fin widthwmm0.10.7
Fin heightHmm37
Fin pitchBmm39
Fin backward expansion angleα°015
Fin forward expansion angleβ°015
Table 2. Experimental data vs. CFD data.
Numberc (mm)w (mm)H (mm)B (mm)α(°)Β(°)Cd,calCd,exp
10.20.733000.4380.450
20.30.744550.4910.500
30.50.756880.5300.581
40.40.76712120.4030.389
50.60.77915150.5000.449
60.20.54612150.3220.361
70.30.5571500.3650.426
80.50.569050.4090.440
90.40.573580.5730.641
100.60.5348120.6080.551
110.20.3595120.3400.357
120.30.3638150.4720.427
130.50.3741200.6090.595
140.40.3361550.5140.476
150.60.347080.5110.494
160.20.2641580.4600.516
170.30.2760120.4090.386
180.50.2375150.3420.36
190.40.249800.4120.369
200.60.2531250.6520.587
210.20.177850.3630.331
220.30.1391280.2920.274
230.50.14315120.5570.509
240.40.1540150.3730.344
250.60.166500.5390.497
Publisher’s Note: MDPI stays neutral with regard to jurisdictional claims in published maps and institutional affiliations.

