Article

Fuel Planning Strategies Considering Operational Uncertainties of Aerodynamic Formation Flight

1
Deutsches Zentrum für Luft- und Raumfahrt (DLR), Lufttransportsysteme, 21079 Hamburg, Germany
2
Institut für Lufttransportsysteme, Technische Universität Hamburg (TUHH), 21079 Hamburg, Germany
*
Author to whom correspondence should be addressed.
Aerospace 2021, 8(3), 67; https://doi.org/10.3390/aerospace8030067
Submission received: 31 December 2020 / Revised: 1 March 2021 / Accepted: 2 March 2021 / Published: 7 March 2021

Abstract

:
The operational concept of aerodynamic formation flight, also referred to as aircraft wake-surfing for efficiency (AWSE), has high potential in terms of fuel savings and climate impact mitigation. In order to implement this concept, many technological and operational challenges have to be coped with. As the fuel consumption during a mission strongly depends on a successful execution of AWSE, the existing uncertainties regarding flight planning increase. While a conservative fuel planning ensures a follower to complete the mission even in the case of a formation failure, it might result in high amounts of excess fuel and, therefore, additional fuel consumption. In this study, this issue is addressed by the adaptation of flight planning procedures to the requirements of AWSE focusing on fuel planning in particular, considered from the perspective of a designated follower aircraft of a two-aircraft formation. This trade-off is modeled as an n-action two-event decision-making problem. Each of the possible actions is represented by a combination of mission routing and a corresponding diversion airport, taking atmospheric effects (e.g., wind) into account in order to determine the resulting amount of trip fuel. The two events under consideration are a total formation failure in contrast to a complete success. Based on a scenario with a set of double origin destination pairs characterizing the formations and representative weather patterns for the North Atlantic region, each action is analyzed with regard to the expected fuel consumption and expense. Based on a set of assumed formation success probabilities, we find that the proposed method holds a savings potential to reduce the follower’s fuel consumption by 4.8 % and its monetary expenses by 1.2 % compared with a conventional flight planning. In order to gain a monetary profit margin applying this method, the required formation success probability is shown to vary between 92 % and 96 % , depending on the assumed fuel price.

1. Introduction

As efficiency in transportation sector with regard to energy and environmental impact has an increasing amount of relevance in the context of climate change, there have been many studies focusing on fuel efficiency in aviation and optimized flight planning in particular. In comparison with flight path optimization, which is a predominant subcategory in the research field of flight planning, fuel planning usually gains less notice. However, fuel planning can have a decisive impact on the economy of a mission as well, which particularly applies for low-cost airlines, since fuel represents a major share of their operating costs. At the same time, fuel planning is a crucial step in flight planning regarding operational safety. The prevailing regulations [1] in terms of mission fuel demand that significant amounts of reserve fuel are loaded, which are designated to cover various sources of operational uncertainty. According to [2], the most important sources are represented by meteorological effects on the one hand, and by the possibility of commanded detours by Air Traffic Control on the other hand. An aircraft operator, therefore, needs to find a trade-off in fuel planning that maintains safety while considering aspects of economy. Since each additional fuel component that is added to the take-off mass results in higher values of fuel consumption during the mission, it is recommended to use reasonable guide values, which help with avoiding unnecessarily high amounts of excess fuel. This relation has been exemplarily examined for a major US carrier in [3]. The analysis of actual mission data records found distinct Cost-To-Carry effects, sometimes simply referred to as Fuel-for-Fuel (FFF) effects, concluding that a reduced fuel uplift due to an adapted flight dispatching might save 1.04 % of fuel consumption.
A further study in the same field, lean and responsible fuel planning, is presented by [4], proposing a methodology, which provides support in the decision-making process regarding the derivation of optimal holding fuel quantity. The FFF effects, here referred to as Fuel Carriage Penalty, are investigated based on a continuous decision tree approach that derives the expected expense for a given interval of holding time. Among other findings, it concludes that a slightly more cautious holding fuel policy provides a high benefit regarding diversion prevention for a comparably small cost increase.
Beyond the measures of fuel planning, there are operational concepts as well that are aiming at the reduction of FFF effects, such as Intermediate Stop Operations. The concept proposes splitting long-haul flights in two or more segments and conducting refueling stops at favorably located airports along the track. The resulting savings due to reduced take-off masses clearly outweigh the additional fuel consumption induced by the extra climb segments, providing an average fuel savings potential of 4.8 % , as shown in [5].
Therefore, we investigate a possible utilization of the discussed FFF effects, specifically in the context of aerodynamic formation flight. This operational concept, also referred to as aircraft wake-surfing for efficiency (AWSE), allows a follower aircraft to utilize the energy in the leader aircraft’s wake vortex and can result in a significant reduction of fuel consumption, as long as the formation can be maintained. Conducting a Trans-Atlantic mission with AWSE, for instance, the follower can easily reduce its fuel consumption by 15–20% [6,7,8] compared with the case for which the mission is conducted along the same flight path without benefits. As a consequence, the follower’s fuel requirements do not solely depend on the aircraft’s own operative uncertainties, but also on those associated with the leader aircraft, and affecting the probability of unforeseen events during the mission. Moreover, the possible margin of up to 15–20% adds a high variability to the required mission fuel, considering that the success of AWSE conduction is only one parameter of uncertainty among many. It cumulates to further factors and might be causatively connected to other occurrences, such as Air Traffic Control and weather, inducing additional fuel demand. The situation under investigation, therefore, constitutes a novelty in flight planning and raises the question, whether the expected benefits should be considered in the course of the fuel planning process.
A break-even analysis was conducted in [7], quantifying the FFF induced savings potential regarding fuel consumption and direct operating costs (DOC) of a flight planning procedure that fully includes the anticipated benefits induced by AWSE and balances them with the additional expenses to be expected from a formation failure. For a formation success, the procedure was demonstrated to enable fuel savings up to 5 % (2000 kg per mission). The additional expenses, however, essentially arise from a detour for a refueling stop along the route, which is optionally scheduled according to a variant of the established Decision Point Procedure (DPP). This procedure has been adapted to the special characteristics of AWSE and is henceforth referred to as AWSE-DPP. It was shown that a refueling stop due to formation failure does not necessarily result in additional fuel consumption. With a favorable refueling airport available, detours can be achieved to be small and the reduced take-off mass still results in slight fuel savings compared to a conventional fuel planning. Although a diversion was shown to be feasible at almost neutral cost regarding fuel consumption, it was found that the assessment of a refueling stop regarding costs C DOC can be highly disadvantageous. The possible monetary loss exceeded the monetary benefit by a factor of 15 to 30, mainly depending on the availability of airports along the track. This raises the question regarding whether a flight plan according to AWSE-DPP might be conducted depending on the ratio of achievable values of profit and loss. Therefore, a workflow is developed in order to derive fuel planning decisions with optimal expected outcome, presuming various levels of formation success probability. Furthermore, it is necessary to verify whether a slight adjustment in routing towards available En-Route-Alternates (ERAs) along the track might affect this ratio favorably. These questions are addressed in the course of this study for a statistically significant meteorological setting, several west-bound Trans-Atlantic flight connections, and under consideration of flight performance.

2. Adaptation of Decision Point Procedure to AWSE

The regulation on calculating the usable fuel in the course of flight preparation of commercial air transportation is documented in [2], which also includes designated fuel reserves for various purposes that are associated with specific flight phases. The subject of investigation throughout this study is the combined mass of trip fuel (TF) and contingency fuel (CF). The trip fuel is the required fuel mass m TF to enable an aircraft to fly from take-off, or from a predefined in-flight position, until touch-down at the destination airport (ADES) and represents the main share of the loaded fuel. The contingency fuel is intended to cover unforeseen circumstances during the mission. For a conventional planning process, the contingency fuel mass m CF should be at least equal to 5 % of the trip fuel mass. Instead of a conventional planning procedure, an operator can choose from a diversity of fuel policies in order to determine the contingency fuel, based on the terms as described in [9]. This study is focused on an adapted version of DPP, which is subsequently discussed in detail.

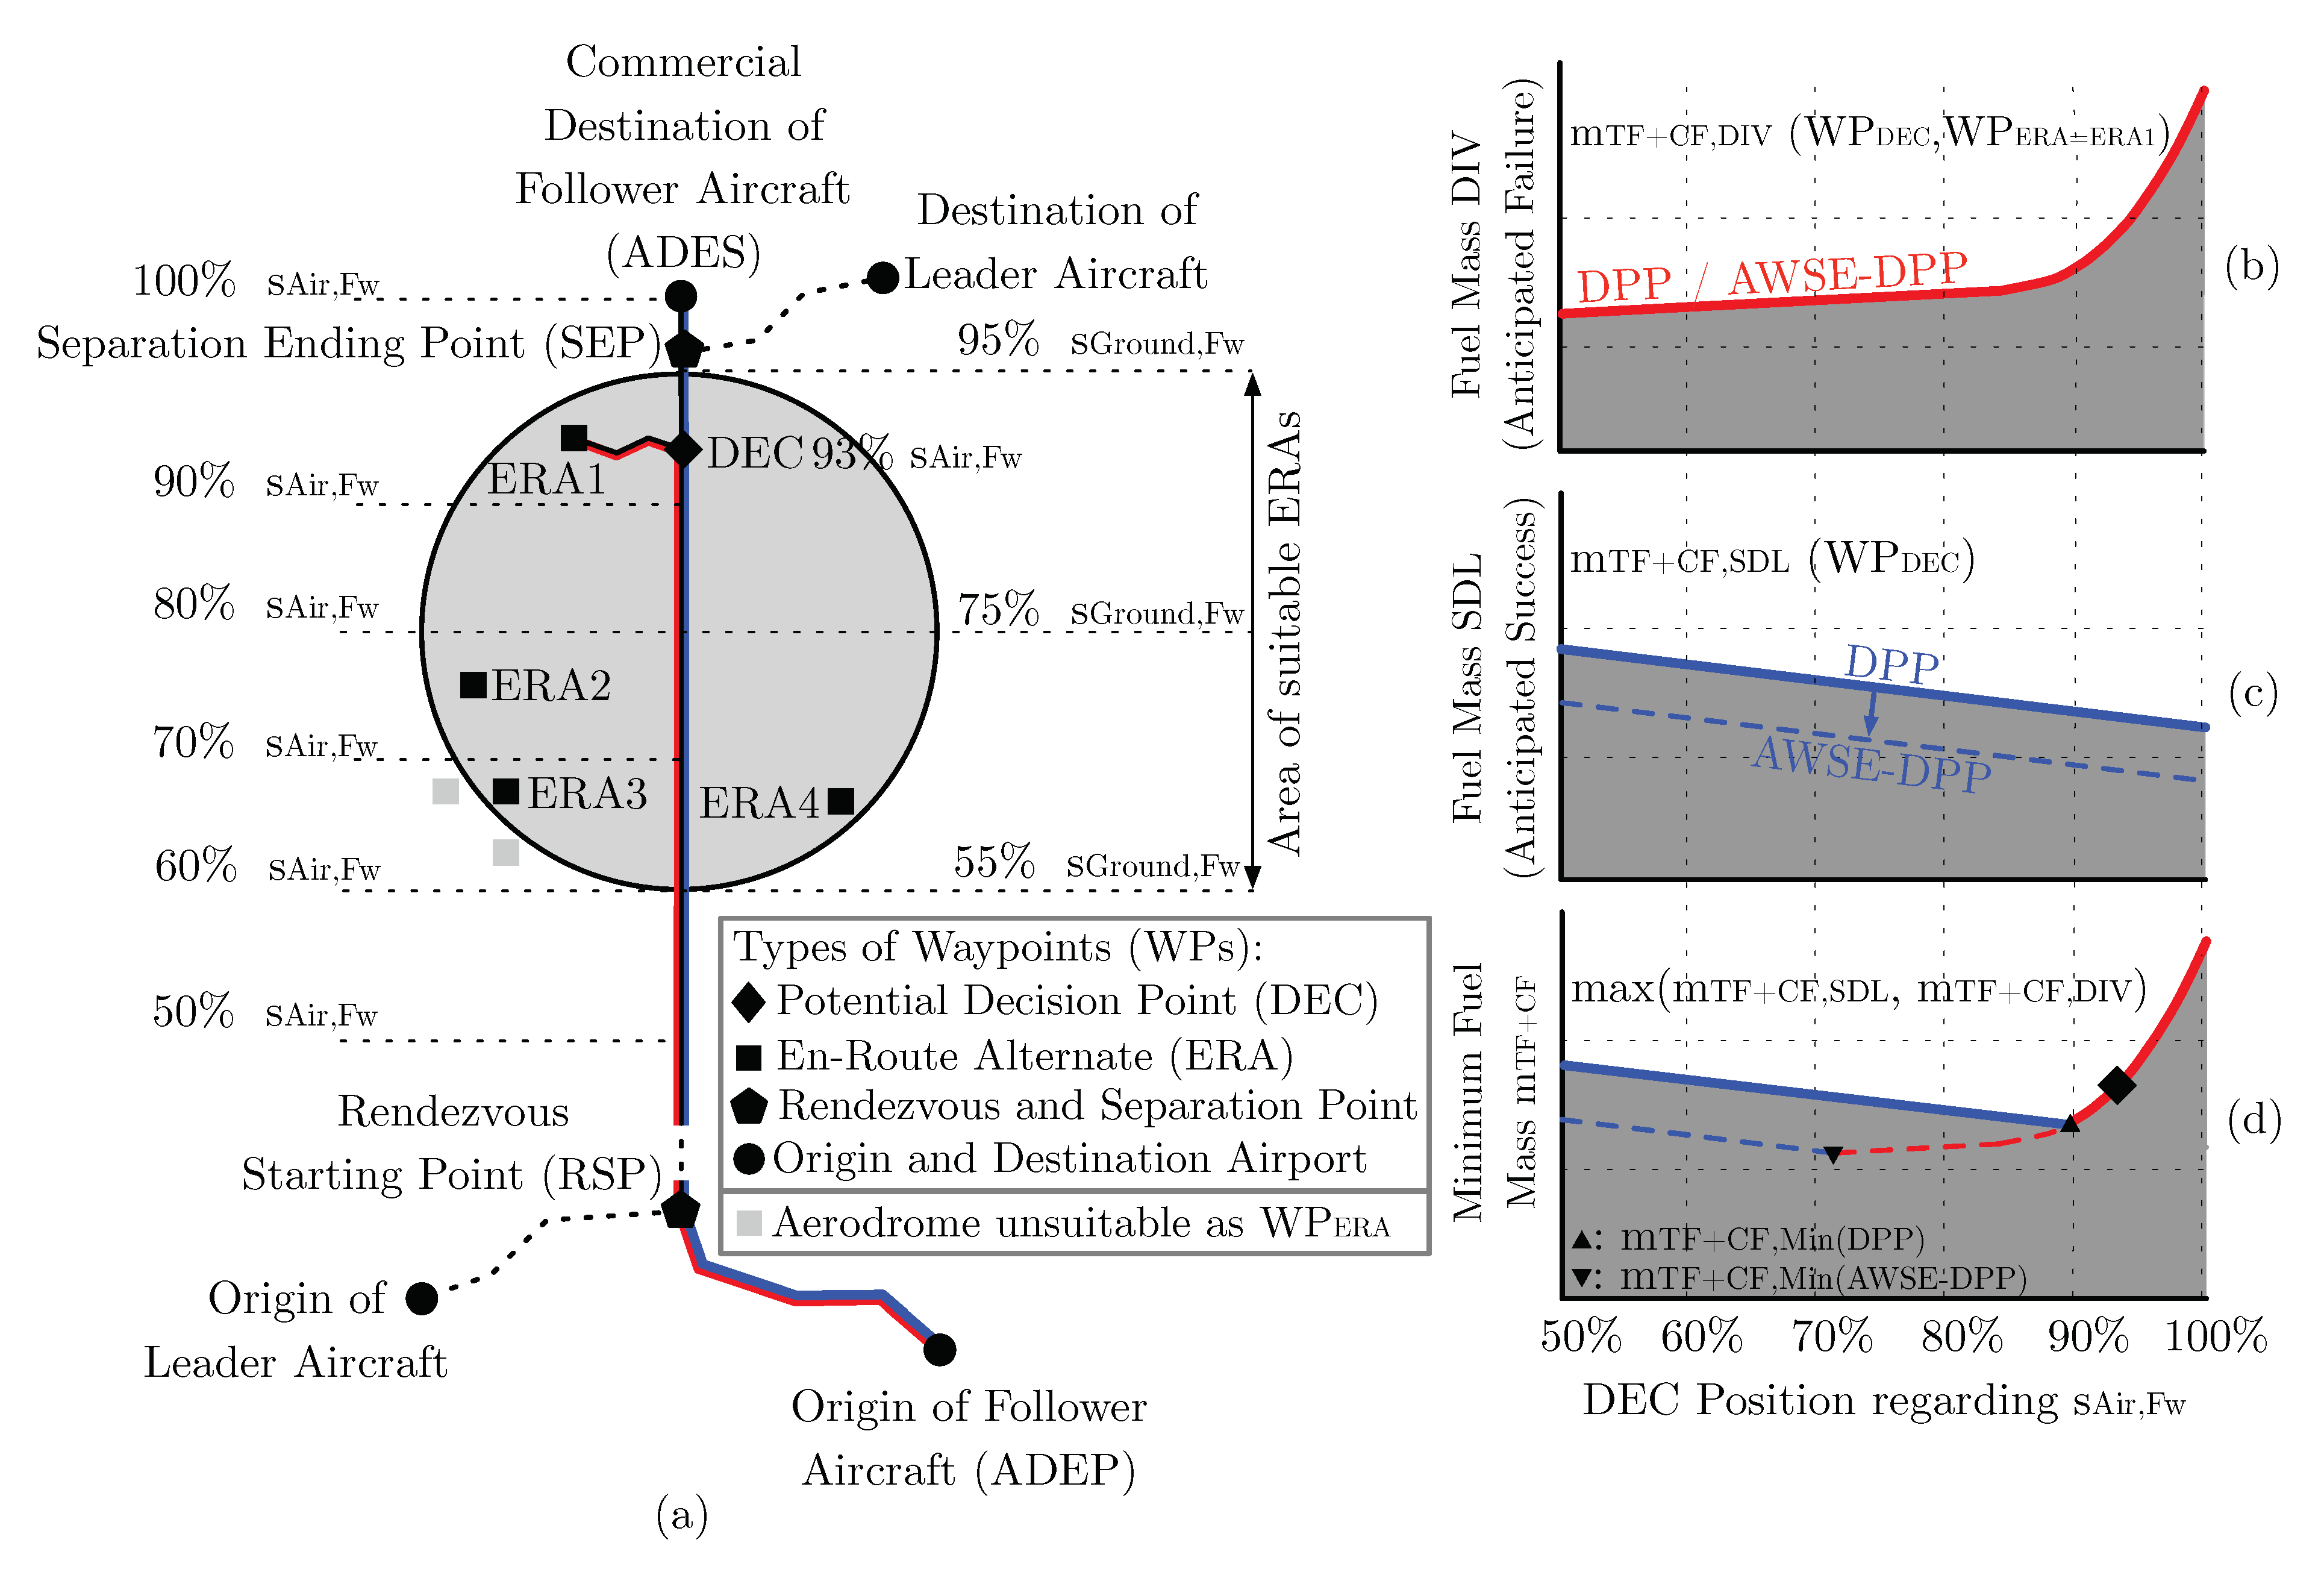
2.1. The Principle of DPP

An established option of flight planning with Reduced Contingency Fuel is the Decision Point Procedure, which presumes that the contingency fuel is not used along the mission segment before reaching a predefined Decision Point (DEC). Along this segment, the mission is operated according to a flight plan that is officially heading to the ERA. If the mission is going according to schedule and the aircraft successfully passes the DEC position with sufficient fuel on board, a second flight plan takes effect, which is heading to ADES. In the case of unexpected complications, on the other hand, the commander will hold on to the initial flight plan, conducting a refueling stop at the predefined ERA.
The required reference values determining the fuel amount for a mission conducted according to DPP are depicted in Figure 1, the resulting equations based on regulations from [2] are given in Equations (1)–(3), deriving the combined amount of trip fuel and contingency fuel. Initially, the procedure instructs the operator to calculate the trip fuel associated with the original flight plan, which is heading to the defined ERA, and charges that the amount of required trip fuel along the marked segment with an additional amount of 3 % contingency fuel. These segments are defined by serially arranged waypoints, which are classified by type as depicted in Figure 1. Henceforth, these types of waypoints will be referred to as W P X , while a segment consisting of multiple waypoints will be referred to as W P X Y .
m TF + CF , DIV = m TF W P ADEP DEC ERA + 0.03 · m TF W P ADEP DEC ERA
m TF + CF , SDL = m TF W P ADEP DEC ADES + 0.05 · m TF W P DEC ADES
m TF + CF = max m TF + CF , DIV , m TF + CF , SDL
A mission affiliated with that original flight plan and its corresponding fuel amount is referred to as Diversion Mission (DIV), see Equation (1). Subsequently, the required trip fuel is derived for a mission heading to the intended destination and 5 % of the required trip fuel along the route segment between W P DEC and the commercial destination airport W P ADES is added for contingency fuel. This option is henceforth referred to as Schedule Mission (SDL, see Equation (2)). Finally, Equation (3) instructs the operator to calculate both options, DIV and SDL, and selects the respective higher value, ensuring that the defined W P ERA is in range for all events. If the mission goes according to plan, trip fuel and contingency fuel are expected to cover a safe arrival at W P ADES . These two viable options are marked red (DIV) and blue (SDL) in Figure 1, on the left-hand side highlighting the corresponding track, on the right-hand side schematically depicting the evolution of combined fuel mass m TF + CF depending on the position of W P DEC along the track.

2.2. Minimum Required Fuel with DPP

In this study, we calculate the position of W P DEC in percentage of air distance s Air with regard to the follower aircraft (FW). The air distance takes atmospheric effects into consideration, such as wind and temperature (see Section 4), and can strongly differ from the ground distance s Ground . The evolution of m TF + CF according to Equation (1) is exemplarily depicted in Figure 1b for W P DEC positions between 50 % and 100 % regarding s Air , Fw under consideration of a single En-Route-Alternate (here ERA1). The plot in Figure 1c depicts the combined amount of m TF + CF for SDL, derived from Equation (2). Finally, the acceptable amount m TF + CF according to Equation (3) is depicted in Figure 1d, illustrating the rules of DPP for a single aerodrome under consideration. An optimized flight planning, however, should select the combination of W P DEC and W P ERA from a larger set of options, as the W P ERA position along the track not only has a strong impact on safety, but also on the consequences of a refueling stop regarding flight time extension and the involved additional cost. In order to be a suitable W P ERA for refueling according to the regulations by European Union Aviation Safety Agency [1], the selected aerodrome should be located within a specific area along the track as represented by the highlighted circle in Figure 1. This area has a radius equal to 20 % of the flight distance and its center is located at a position of 75 % , both with regard to the track’s ground distance.

2.3. Application of Adapted AWSE-DPP

As depicted in Figure 1, a mission conducted with AWSE involves two airplanes, referred to as leader and follower, heading to the rendezvous starting point ( W P RSP ) in order to fly jointly in aerodynamic formation until passing the separation ending point ( W P SEP ). We assume that the follower is positioned approximately 30 wingspans behind the leader, utilizing the energy of the leader’s wake. Along the segment between W P RSP and W P SEP , this procedure can significantly reduce the follower’s fuel burn. After passing W P SEP , both aircraft continue to their respective destination airports. Adopting the idea of original DPP and adapting it to the characteristics of AWSE as initially proposed in [7], the SDL scenario assumes an accurate mission progress, including a full success regarding formation benefits. The expected AWSE benefits of the follower are therefore fully considered in fuel calculation according to Equation (2). On the contrary, when deriving trip fuel and contingency fuel for the case of diversion according to Equation (1), there is no consideration of expected AWSE benefits at all, assuming a total formation failure. In both cases, the routing of the follower remains unchanged until arriving at W P RSP , reflecting a scenario in which the crew has no information on the imminent formation failure. Therefore, the crew has to cope with a situation, in which the option of saving fuel due to a more direct routing to W P ADES or W P ERA is not available. Due to this adaptation, the blue line in Figure 1c is vertically shifted to lower values (DPP → AWSE-DPP), affecting the minimum fuel value to be located at W P DEC positions earlier along the track, as indicated by the dashed lines depicted in red and blue.

3. Optimized Flight Planning with AWSE-DPP

Our proposed procedure to optimize fuel planning scenarios for a formation flight follower aircraft can be divided into four steps. Firstly, a search space is generated, each point representing a potential W P DEC , using formation geometries as data input. Secondly, multiple planning scenarios are derived, applying AWSE-DPP. In a third step, these scenarios are evaluated regarding their fuel savings potential for each W P DEC . In the final step, the expected expenses are analyzed for various levels of assumed success rates regarding AWSE execution. In the following, the four steps according to Figure 2 are discussed in detail.

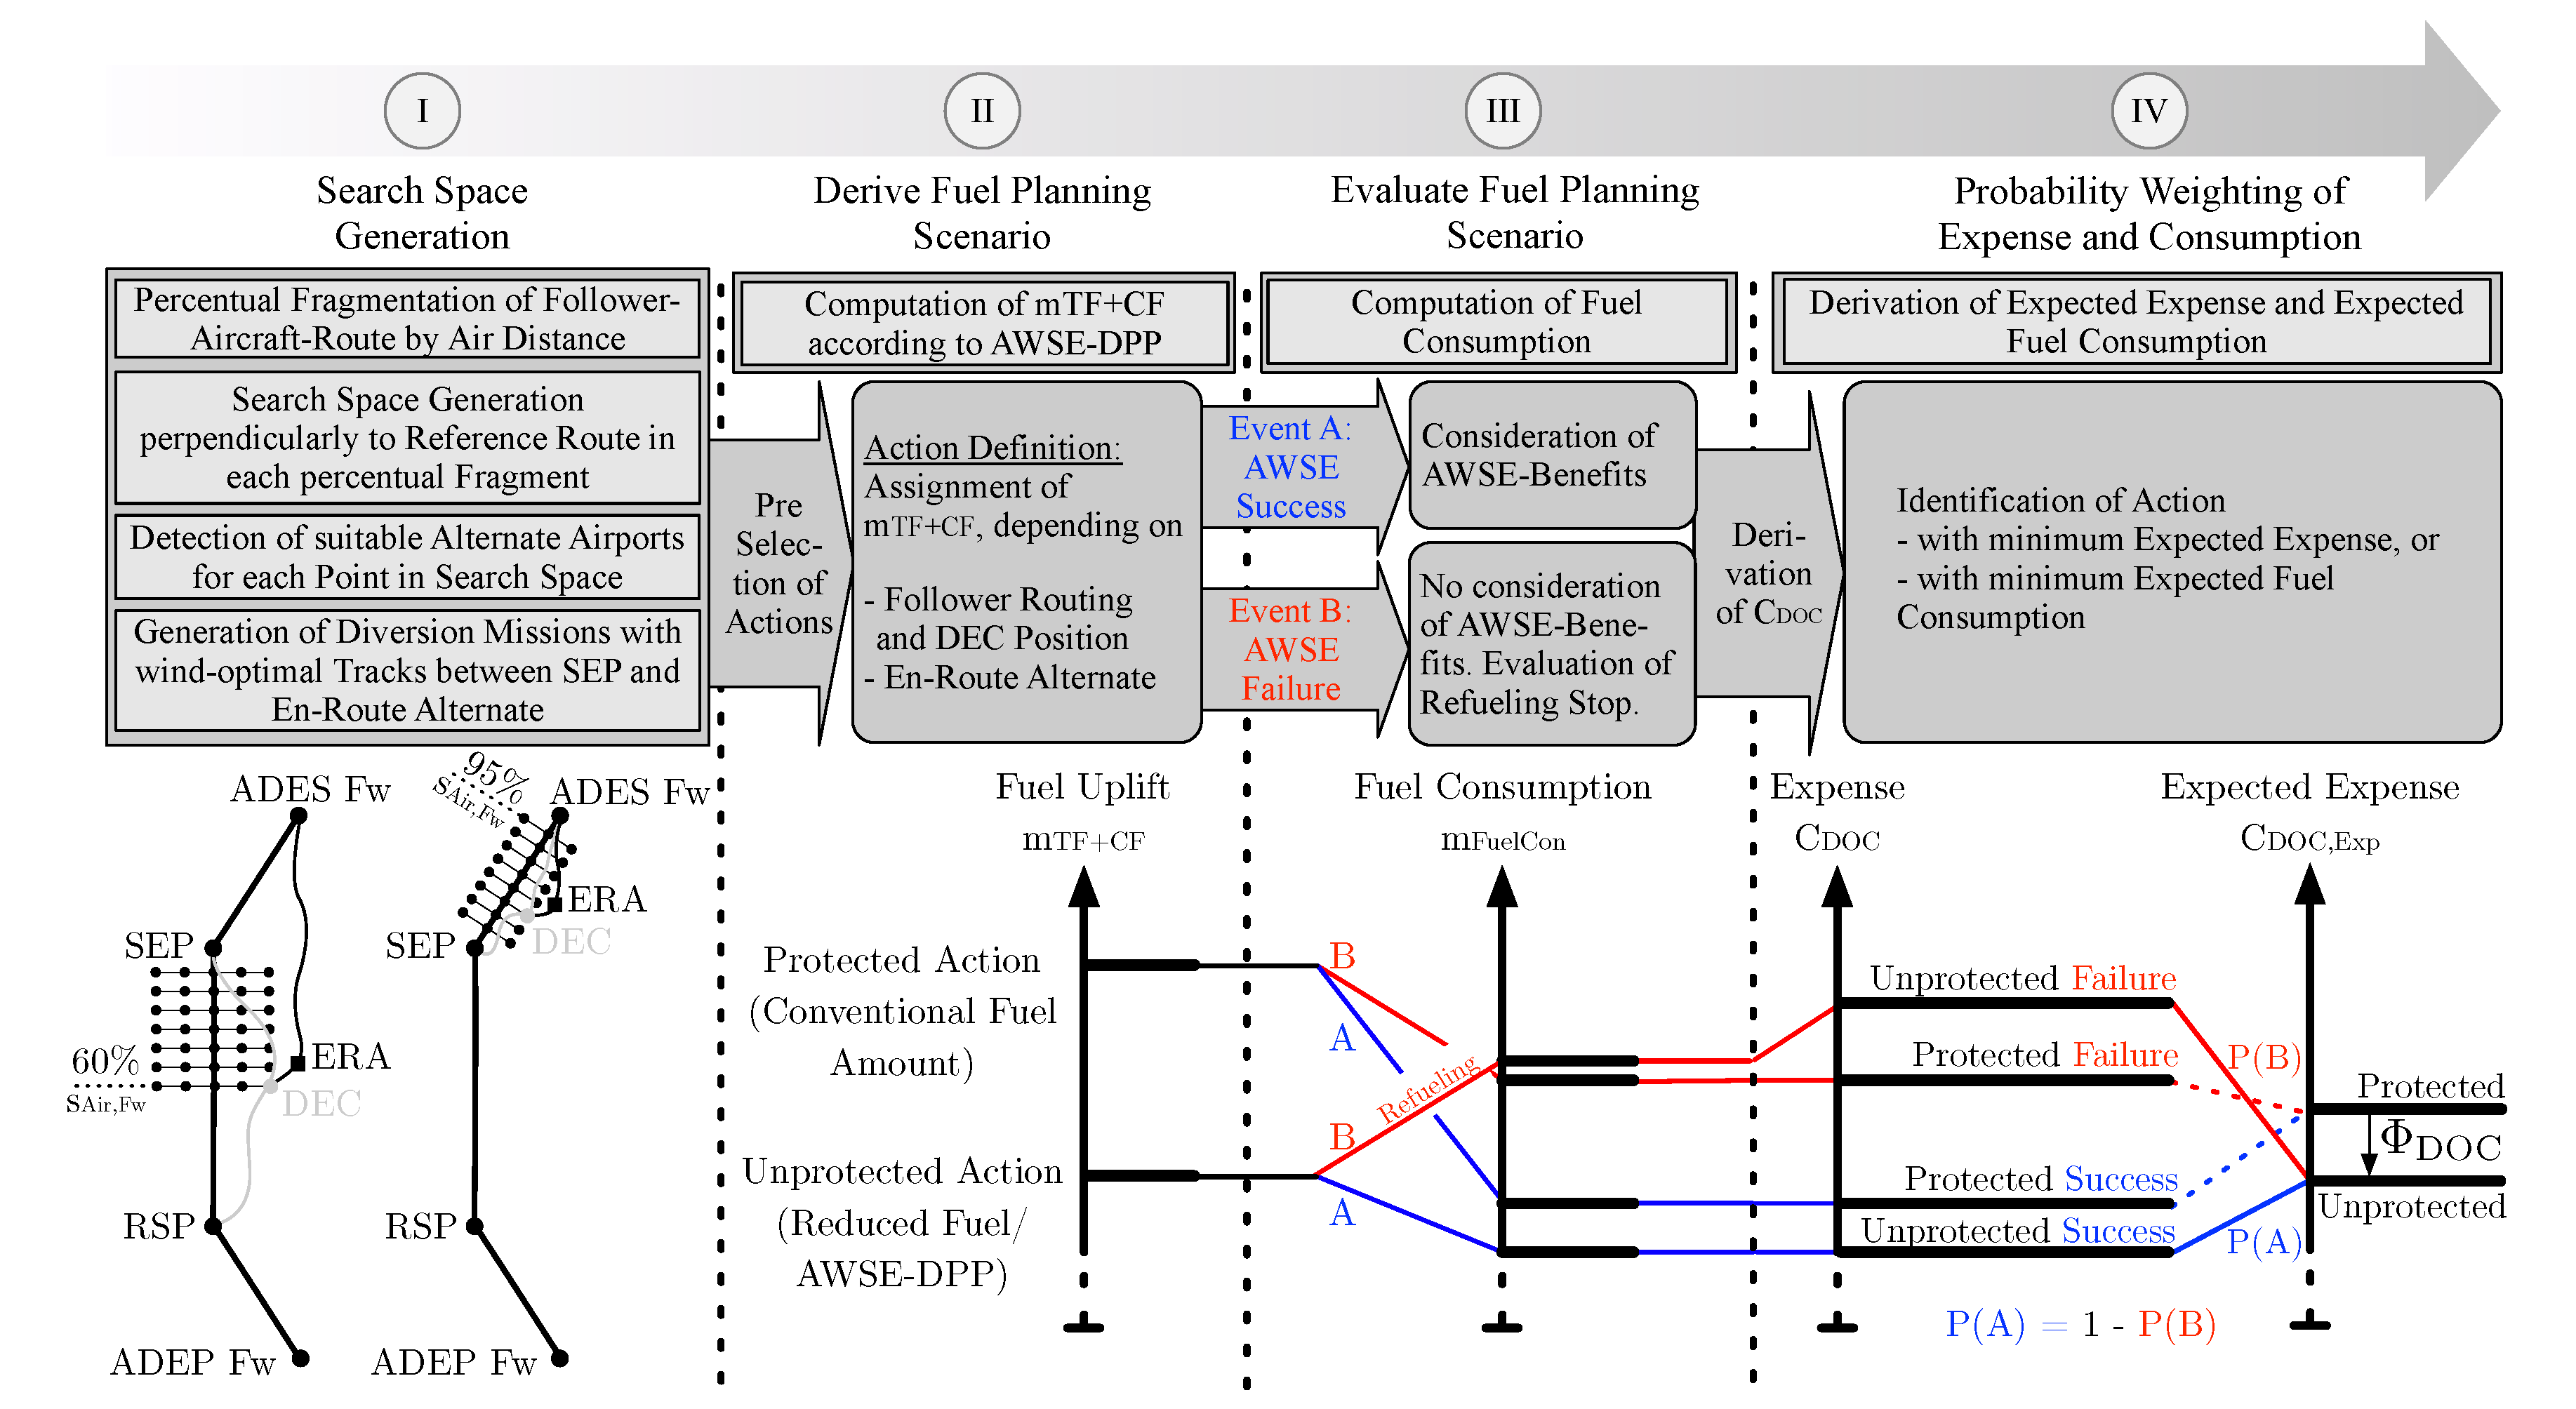
3.1. Search Space Generation

Following the question regarding to which extent a minor deviation from the reference track yields potential to reduce additional mission costs induced by a refueling stop, a search space needs to be designed to perform an investigation. Since the cost C DOC of a mission might be strongly affected by an increase regarding flight time in case of a diversion mission, it is examined whether that cost increase can be damped in exchange for a marginal increase of fuel consumption on a mission according to schedule. This trade-off is implemented by a slight shift of the mission track towards a suitable position of W P ERA . In order to examine these effects, while mostly maintaining optimality (see Section 4) of the reference track, the search space is generated as depicted in Figure 2 (Step I). Based on a reference mission geometry (black line) that is processed as input data, the follower routing is subdivided into percental segments, henceforth considered as unit step, with regard to air distance s Air , Fw . Beginning at W P DEC position 60 % , an initial set of possible waypoints W P DEC is generated along the reference track, proceeding until position 95 % is reached. Originating in each of these positions, referred to as on-track W P DEC , arrays are generated containing additional points that are arranged perpendicularly to the reference track and henceforth are referred to as off-track W P DEC .
Maintaining the depicted set of fixed waypoints W P ADEP Fw , W P RSP , W P SEP , and W P ADES Fw that are adopted from the reference mission geometry of the follower aircraft, the set of schedule mission geometries is derived from the W P DEC positions subsequently. In order to comply with these mandatory constraints, each W P DEC of the search space is connected to the corresponding closest fixed points according to the integration sequences in Equations (4) and (5):
s Air , Fw ( W P SEP ) > s Air , Fw ( W P DEC ) : W P ADEP Fw RSP DEC SEP ADES Fw
s Air , Fw ( W P DEC ) > s Air , Fw ( W P SEP ) : W P ADEP Fw RSP SEP DEC ADES Fw
Each connection between a W P DEC and a fixed point is derived applying a wind optimal routing algorithm, solving a Zermelo’s problem. Assuming a spherical earth and the aircraft to be a massless point, the algorithm applies an optimal control approach to the heading angle in order to derive the minimum time track crossing a wind field. Further details on route optimization are documented in [10]. Before the generated SDL mission profiles are considered feasible, the relative detour of each routing is compared to the reference track. In order to be taken into consideration for further analysis, the detour via the W P DEC with regard to the complete mission air distance must not exceed 1 % compared to the reference formation follower track or otherwise, the point is discarded:
s Air , Fw ( W P SEP ) > s Air , Fw ( W P DEC ) : W P ADEP Fw RSP DEC ERA ADES Fw
s Air , Fw ( W P DEC ) > s Air , Fw ( W P SEP ) : W P ADEP Fw RSP SEP DEC ERA ADES Fw
In the last step of search space generation, a set of corresponding diversion missions is derived for each generated schedule mission. Depending on availability, up to three en-route alternates W P ERA are assigned to each W P DEC in search space under consideration of the regulation on suitability of aerodromes, as depicted in Figure 1. In the case of more than three suitable options, the alternate airports corresponding to W P ERA are selected favoring shorter DIV missions with regard to air distance. In analogy to SDL mission generation, the assembly of DIV mission geometries is carried out according to predefined sequences taking W P ERA into account for integration as intermediate stop (see Equations (6) and (7)).

3.2. Derivation and Evaluation of Fuel Planning Scenarios

A decision support procedure is presented in [11] that optimizes the long-term expected expense under consideration of forecasted occurrence probability of events. The analysis considers the quality of forecast information as a significant factor. Although we do not implement a consideration of forecast data, but assume perfect information regarding meteorology, effectively neglecting forecast induced uncertainties, the follower aircraft fuel planning problem is formulated according to the terminology of an n-action two-event decision-making problem, preparing the implementation of discussed uncertainties. In a situation of two possible events, the decision maker (i.e., the flight planner) has to select one of n actions, each associated with a level of protection, before the event is revealed and the outcome is clear.
As the search space subdivision is discretized by decision point positions, setting the two parameters W P DEC and W P ERA can distinctively identify the corresponding mission geometry that is obtained from Step I. The resulting fuel plans consisting of m TF + CF for the corresponding mission geometries are derived based on a trajectory calculation model (TCM). The evaluation of SDL missions is performed including the expected AWSE-benefits (see Equation (2)), while neglecting the AWSE-benefits for DIV missions (see Equation (1)). Finally, the respective higher value is selected according to Equation (3). Henceforth, the combination of mission geometry and associated fuel plan is referred to as action α ( W P DEC , W P ERA ) . The amount of m TF + CF is supplemented by further fuel reserves (see Section 4) that are not part of the optimization process. The full amount of fuel load associated with an action is referred to as Block Fuel. In addition to the set of DPP-based actions, TCM is applied to the reference mission geometry in order to derive a conventional fuel planning without consideration of AWSE benefits and DPP. The detected amount m TF is charged with a designated mass m CF equal to 5 % of m TF . This action, being used as a reference case in the following, accepts an increased level of costs beforehand to the mission in exchange for ensured capability of operating the full mission autonomously. According to the terminology discussed before, this reference case is considered to be a fully protected action, for the sake of ease simply referred to as Protected Action in the following. The actions applying AWSE-DPP, on the other hand, are considered Unprotected Actions, as they are based on a strategy that minimizes expenses beforehand in order to maximize potential outcome and accept the possible appearance of a re-fuel stop in case of a formation failure.
With completion of Step II, the set of available actions is complete and needs to be evaluated for both events, A (Formation Success) and B (Formation Failure). The possibilities of outcome are schematically depicted at the bottom of Figure 2, resembling an event-tree in their presentation. The three axes are associated with Steps II to IV and exemplarily show the effect of events A and B on the fuel consumption and the resulting expenses for two actions, differing in their level of protection. When following the path that originates in the unprotected action, the occurring event in transition from Steps II to III splits the string of outcomes in two possibilities. In the case of event A, represented as the blue path, the choice of an unprotected action results in the lowest possible fuel consumption due to the decreased take-off mass and formation success. When following this path to Step IV, the unprotected success is found to be the most favorable combination, regarding its fuel consumption as well as expense. In case of event B, the red path shows fuel consumption (on arrival at W P ADES ) that is higher than its original fuel uplift (at W P ADEP )—caused due to a refueling stop at W P ERA . The transition of unprotected failure to Step IV shows by far the highest value of expense.
In comparison, the fuel consumption of the protected action is positioned in the center between the results of the unprotected action. Showing a distinct gap between outcomes for events A and B, the four cases under consideration are therefore arranged in two groups depending on formation success. The fuel consumption of the protected failure is exemplarily depicted lower than unprotected failure. Depending on the reference mission geometry and meteorology, however, inverse situations regarding fuel consumption have been observed in [7]. In Step IV, the comparison between protected and unprotected failure is supposed to underline the disproportionately high effect of cost increases due to a refueling stop. While the differences of protected success and protected failure regarding their expenses can be traced back to saved fuel costs alone, the unprotected failure also takes increased flight time, landing fees, and various other factors of a diversion mission into account, leading to a clear increase compared to the protected failure.

3.3. Selection of Fuel Planning Scenarios

The calculation of trajectories applying TCM evaluates investigated actions regarding the evolution of flight time, fuel burn rate, position, and further parameters, enabling the analysis of mission cost C DOC according to the parameters discussed in Section 4. For the decision-maker, these results provide a base to select an action according to prevailing preferences, which for instance can be represented by a minimization of long-term fuel consumption or expenses. However, in order to decide whether a planned mission should be operated according to an unprotected action or not, it is necessary to estimate the probability weighted, expected values for the full set of available options, and to conduct a comparison to the alternative protected action. Since there are no available data on success rates of formation flight in European airspace, assumed values for the probability of event P Event ( i ) are introduced. The expected fuel consumption m FuelCon , Exp and expected expense C DOC , Exp of action α can be therefore easily derived according to Equations (8)–(10):
  m FuelCon , Exp ( α ) = Event i = 1 2 ( P Event ( i ) · m FuelCon ( α , i ) )
  C DOC , Exp ( α ) = Event i = 1 2 ( P Event ( i ) · C DOC ( α , i ) )
for Event i = 1 2 P Event ( i ) = 1
Provided that an unprotected action holds a savings potential compared to the protected action, the action can be considered as a profitable decision. The quantity of the savings potential is henceforth referred to as Φ FuelCon with regard to fuel consumption and Φ DOC with regard to monetary savings. According to Equations (11) and (12), the potential takes negative values for favorable, unprotected actions.
Φ FuelCon = m FuelCon , Exp ( α Unprotected ) m FuelCon , Exp ( α Protected ) m FuelCon , Exp ( α Protected )
Φ DOC = C DOC , Exp ( α Unprotected ) C DOC , Exp ( α Protected ) C DOC , Exp ( α Protected )
In Step IV, the full set of available actions is compared to detect the lowest value of Φ FuelCon , respectively Φ DOC , depending on the optimization criterion.

4. Assumptions, Data Input, and Scope of Investigation

In the context of a two-aircraft aerodynamic formation flight mission, a combination of departure and destination airports is referred to as double-origin-destination-pair (DODP). In the scope of this study, we examine the investigated effects based on four DODPs that are combined from four different airports (see Table 1). All investigated missions are westbound Trans-Atlantic flights, starting in London (LHR) and Paris (CDG) with destinations in New York (JFK) and Chicago (ORD). In each case, the follower aircraft departs in LHR and lands in JFK. However, the DODPs are combined such that all permutations regarding common and different departure and destination airport are represented, therefore varying the benefit-yielding formation segment in length and position. Our mission geometries have been optimized with regard to a total fuel consumption including both formation partners. In the course of this optimization process, various combinations of W P RSP and W P SEP positions, arranged in a search grid, are varied by a pattern search algorithm, maximizing the AWSE benefits while minimizing the air distance and fuel consumption for both partners. The prevailing wind situation is taken into account regarding the routing, based on an optimal control algorithm. Further details on the procedure for derivation of mission geometries are presented in [8].
The geometry optimization described above has been conducted for each DODP and for eight atmosphere days, yielding 32 investigated mission geometries in total. Our selection of considered atmosphere data (see Appendix A) is based on an investigation [12], in which typical weather situations in the North-Atlantic region were identified and classified into representative summer and winter patterns. The detected variation between atmosphere days is particularly clear for winter months, yielding five different atmosphere patterns for winter and three patterns for summer. The high degree of variance among these patterns becomes visible, when exemplarily comparing the time optimal tracks between London (LHR) and New York (JFK), which were found to vary by more than 60 min of flight time. As the jet streams significantly differ in their positions, directions, and velocities in the set of patterns, the examined formation geometries hold a distinct diversity. This leads to a variance of the investigated missions with regard to routing, total air distance, relative length, and arrangement of the formation segment as well as the set of suitable alternate airports W P ERA .
The atmosphere data used in this study are based on the European Reanalysis Interim data set and can be obtained from the European Center for Medium-Range Weather Forecasts (ECMWF). The data are arranged in a coordinate grid with a spatial resolution of 0 . 75 in horizontal dimension and a total of 60 vertically distributed layers between surface and an altitude level corresponding to a pressure level of 0.1 hPa . The atmosphere data comprise wind vector information, temperature, humidity as well as pressure and are projected on flight trajectories using a linear interpolation routine between the data points. Further information on the atmosphere data is provided by ECMWF [13].
The determination and evaluation of fuel planning scenarios are based on a trajectory calculation model taking expected aerodynamic benefits induced by AWSE into account (MultiFly-TCM), as presented in [14]. The implemented flight performance model is provided by the Base of Aircraft Data models in version 4, supplied by EUROCONTROL and documented in [15], enabling a detailed calculation of the evolution of fuel. The leader and follower aircraft type are selected to be a Boeing 777-200 with a load factor 0.78. Along the formation segment, the mission is conducted with a cruise Mach number of 0.84 and a flight level FL390. In addition to the fuel amount m TF + CF , an allowance of 4500 kg is loaded, covering additional fuel reserves required for a holding phase. As described in Section 2, an aerodrome needs to fulfill certain requirements regarding its location along the track to be suitable as W P ERA . Furthermore, a considered airport needs to be available for commercial aviation and to provide the required infrastructure. Based on the assumption of a standard meteorological day, the B777-200 needs a minimum runway length of 10,000 ft [16]. The collected information [17] on the aerodromes is summarized in Appendix B, containing the names, locations, and the specific color code, which is assigned to each airport considered throughout this study.
The monetary evaluation method for obtaining C DOC is employed according to [18]. This approach analyzes several factors of a mission, including fuel consumption and mission time as well as crew-, maintenance-, landing-, navigation-, and ground handling-fees. Furthermore, the maximum take-off mass and payload are taken into account, representing equivalent values for the aircraft size, which allows a consideration of depreciation and insurance. Based on average values of the year 2019, the fuel price is set to 0.64 Euro kg . The remaining costs are scaled to the year 2016, based on initial values from 2012, under consideration of the U.S. inflation rate of average consumer prices.

5. Results and Discussion

The results of the proposed workflow are presented in this section, beginning with the analysis of search space in order to select and evaluate optimal flight planning scenarios. Subsequently, the optimization potential provided by AWSE-DPP is quantified with regard to fuel savings and monetary costs. Finally, the minimum required success probabilities for sustainable operations are analyzed.

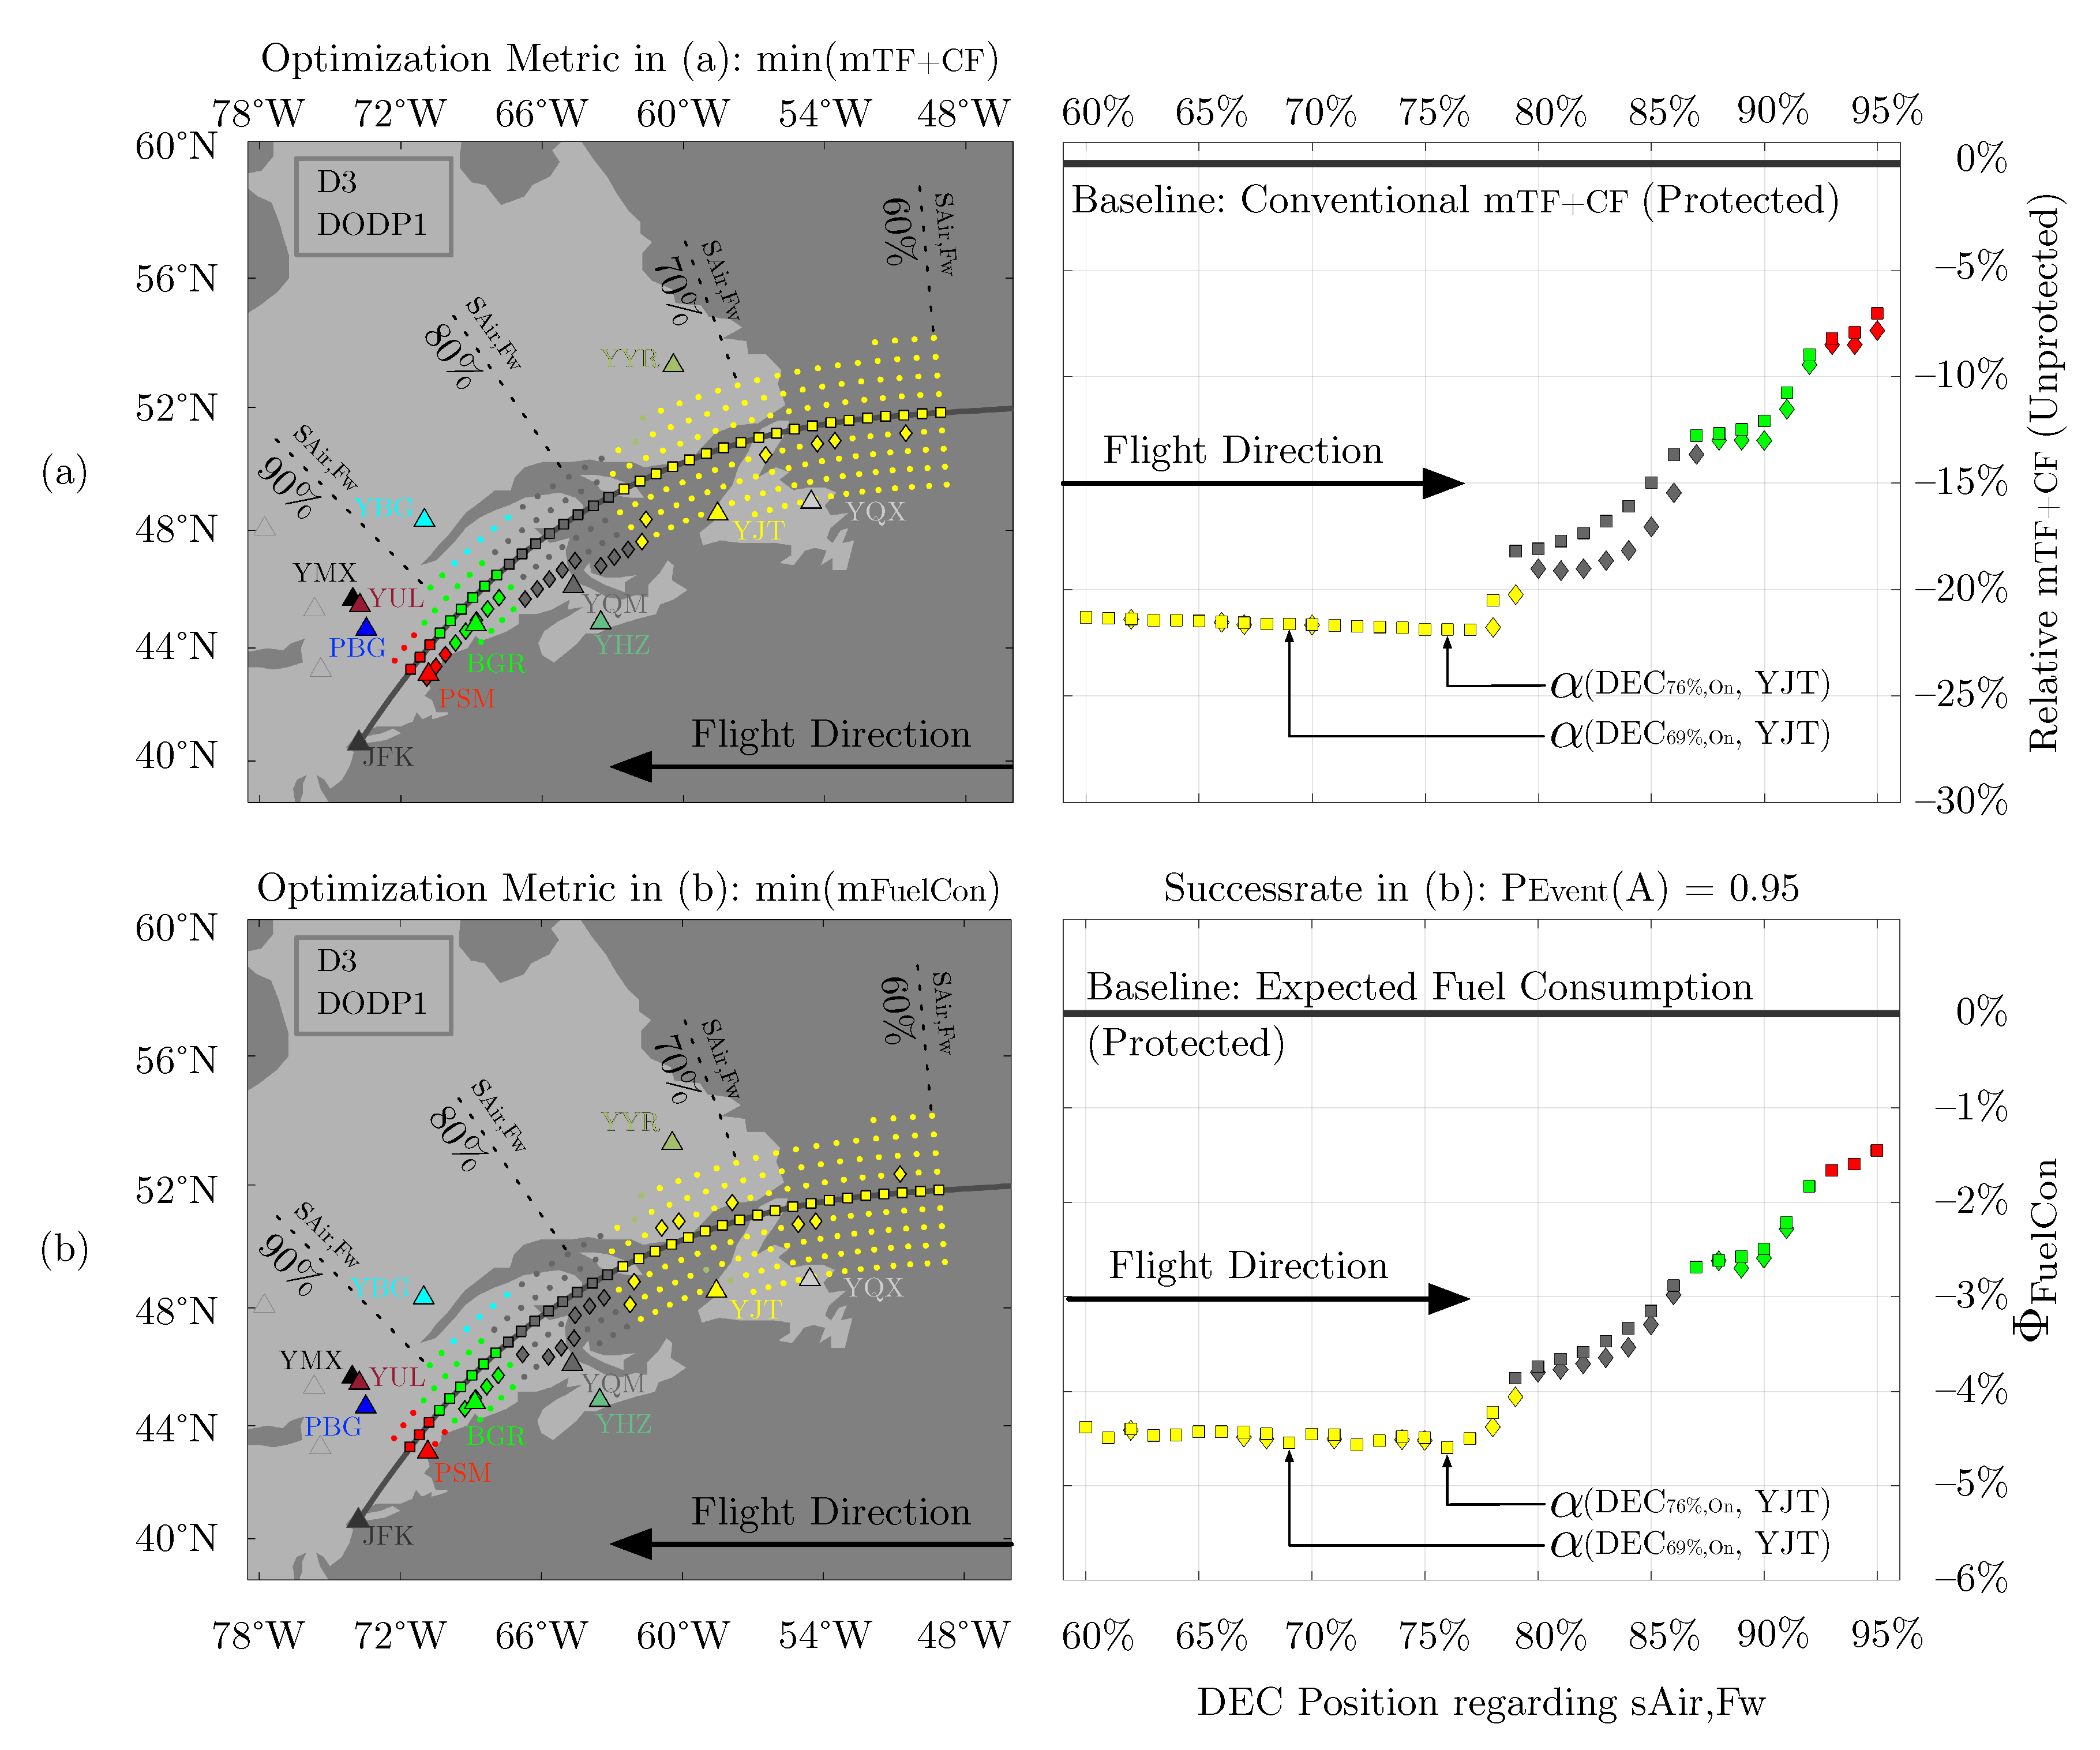
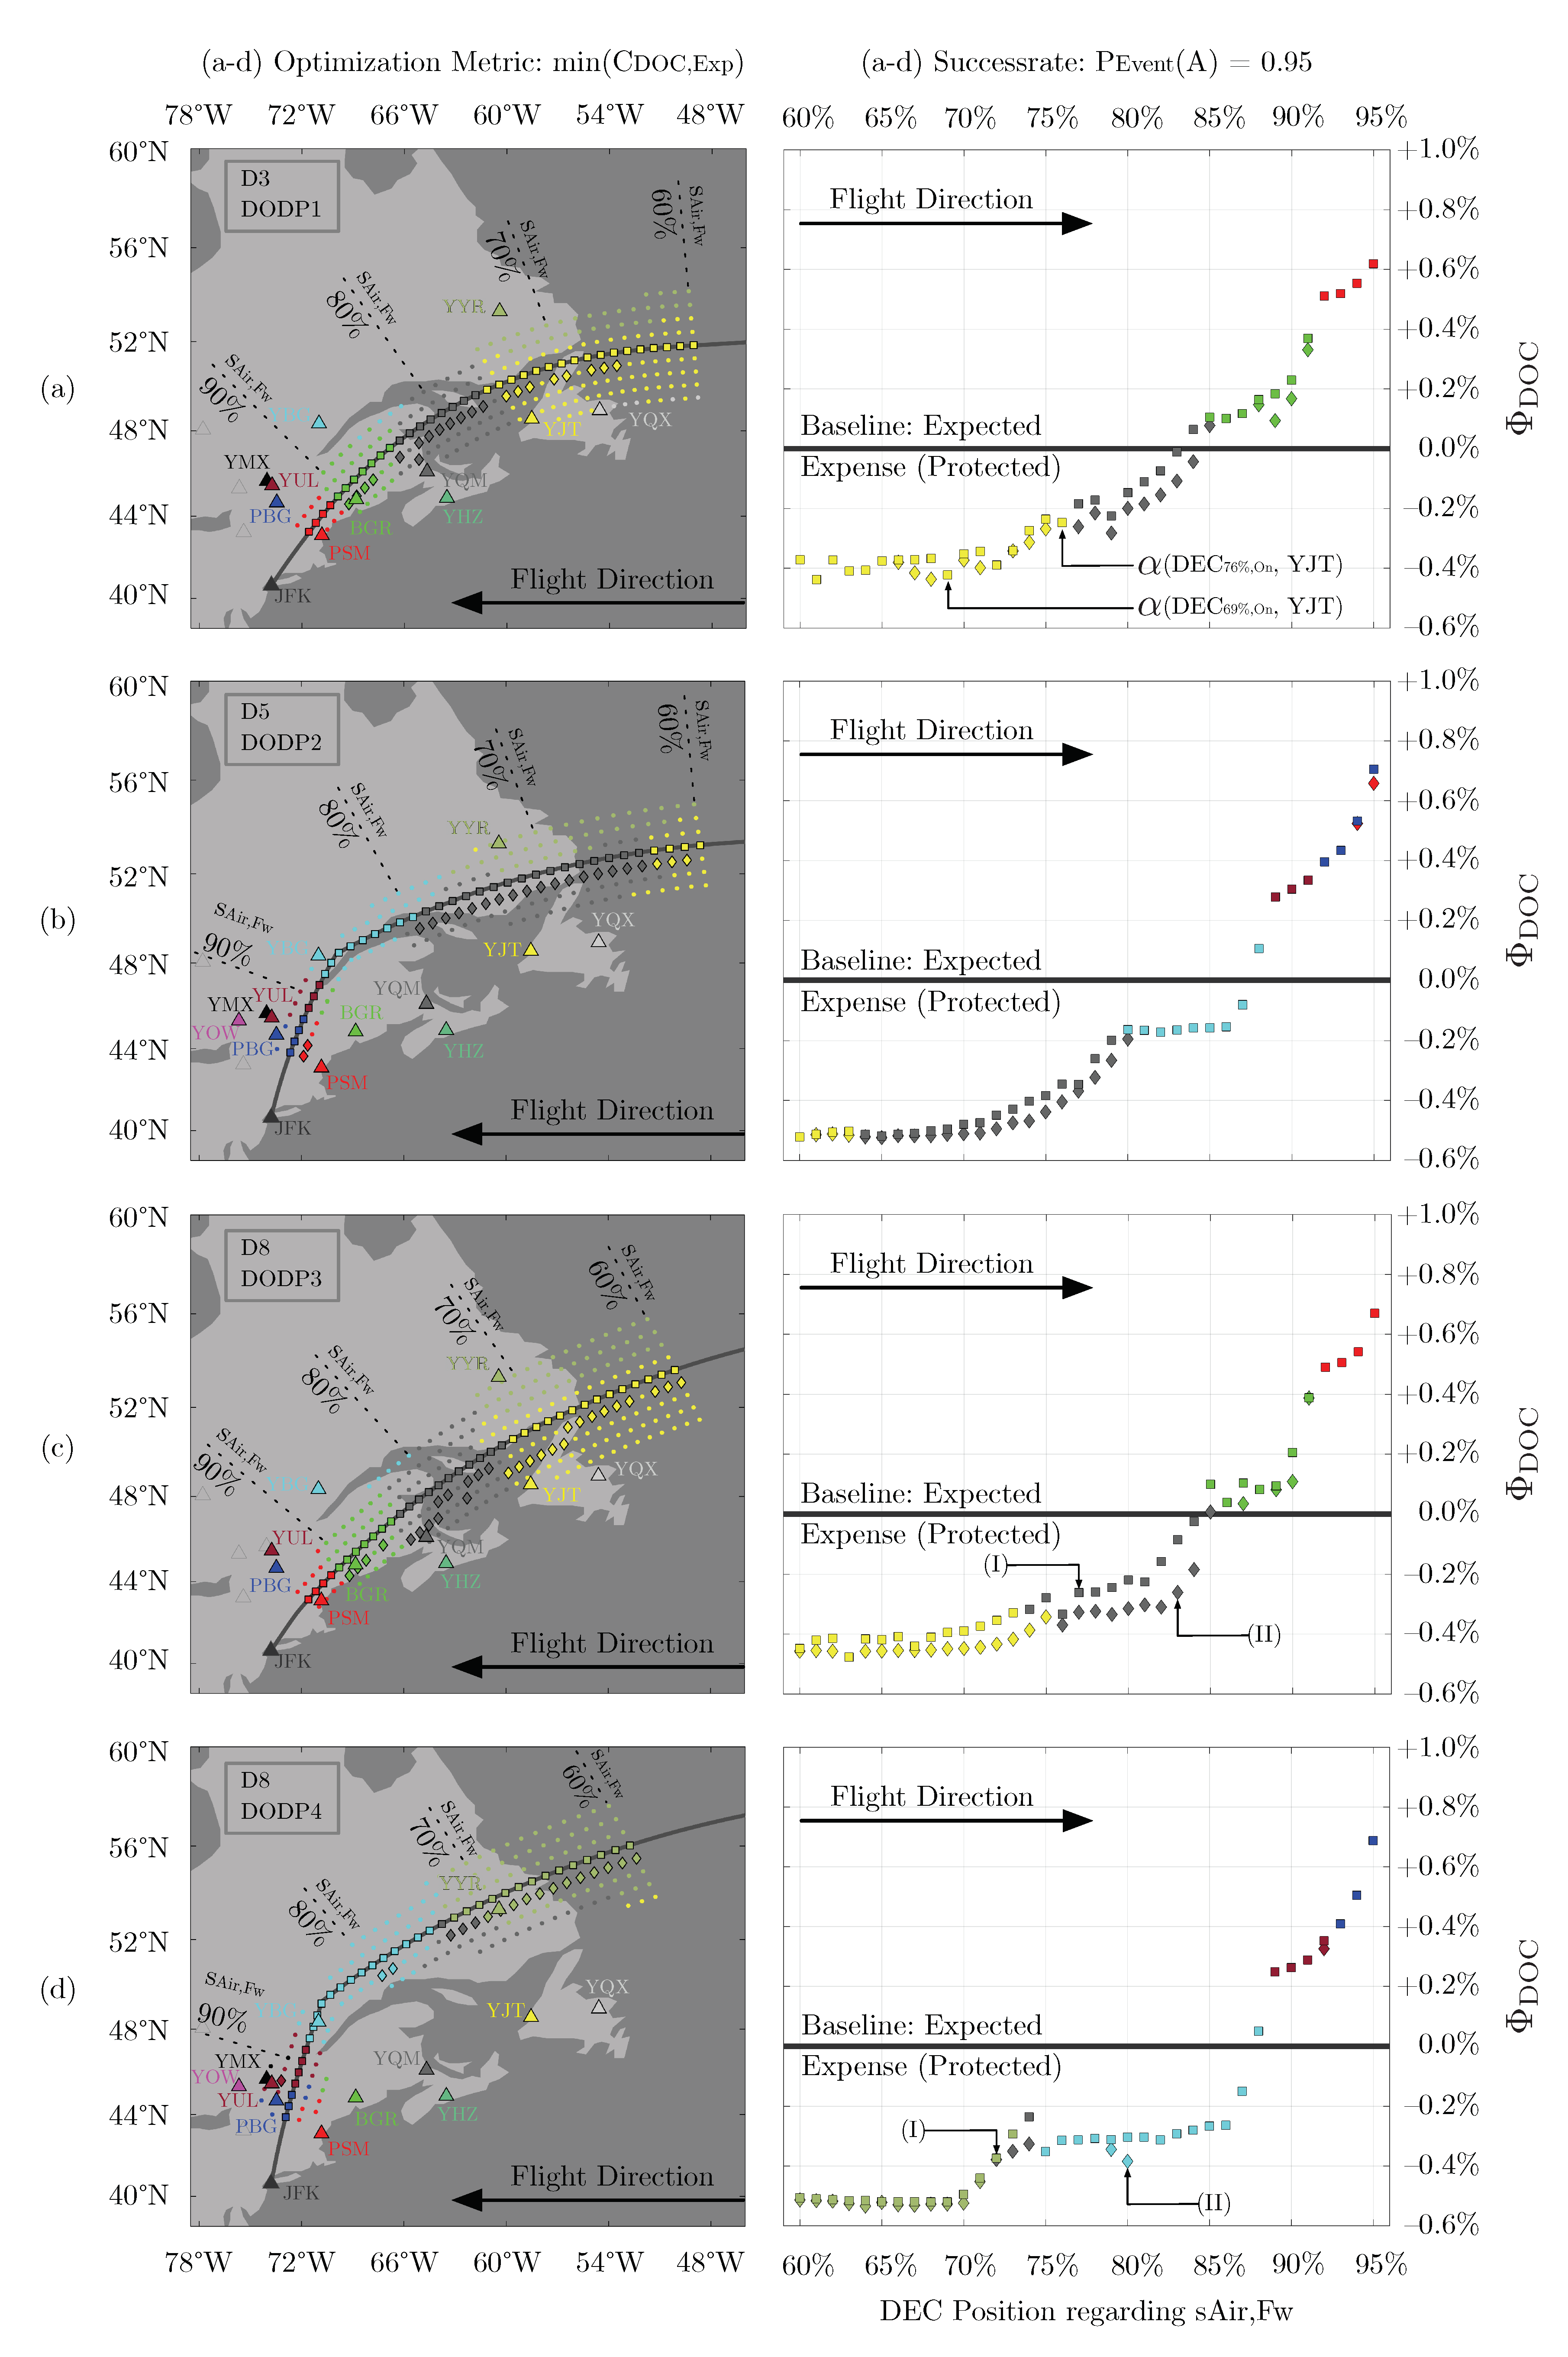
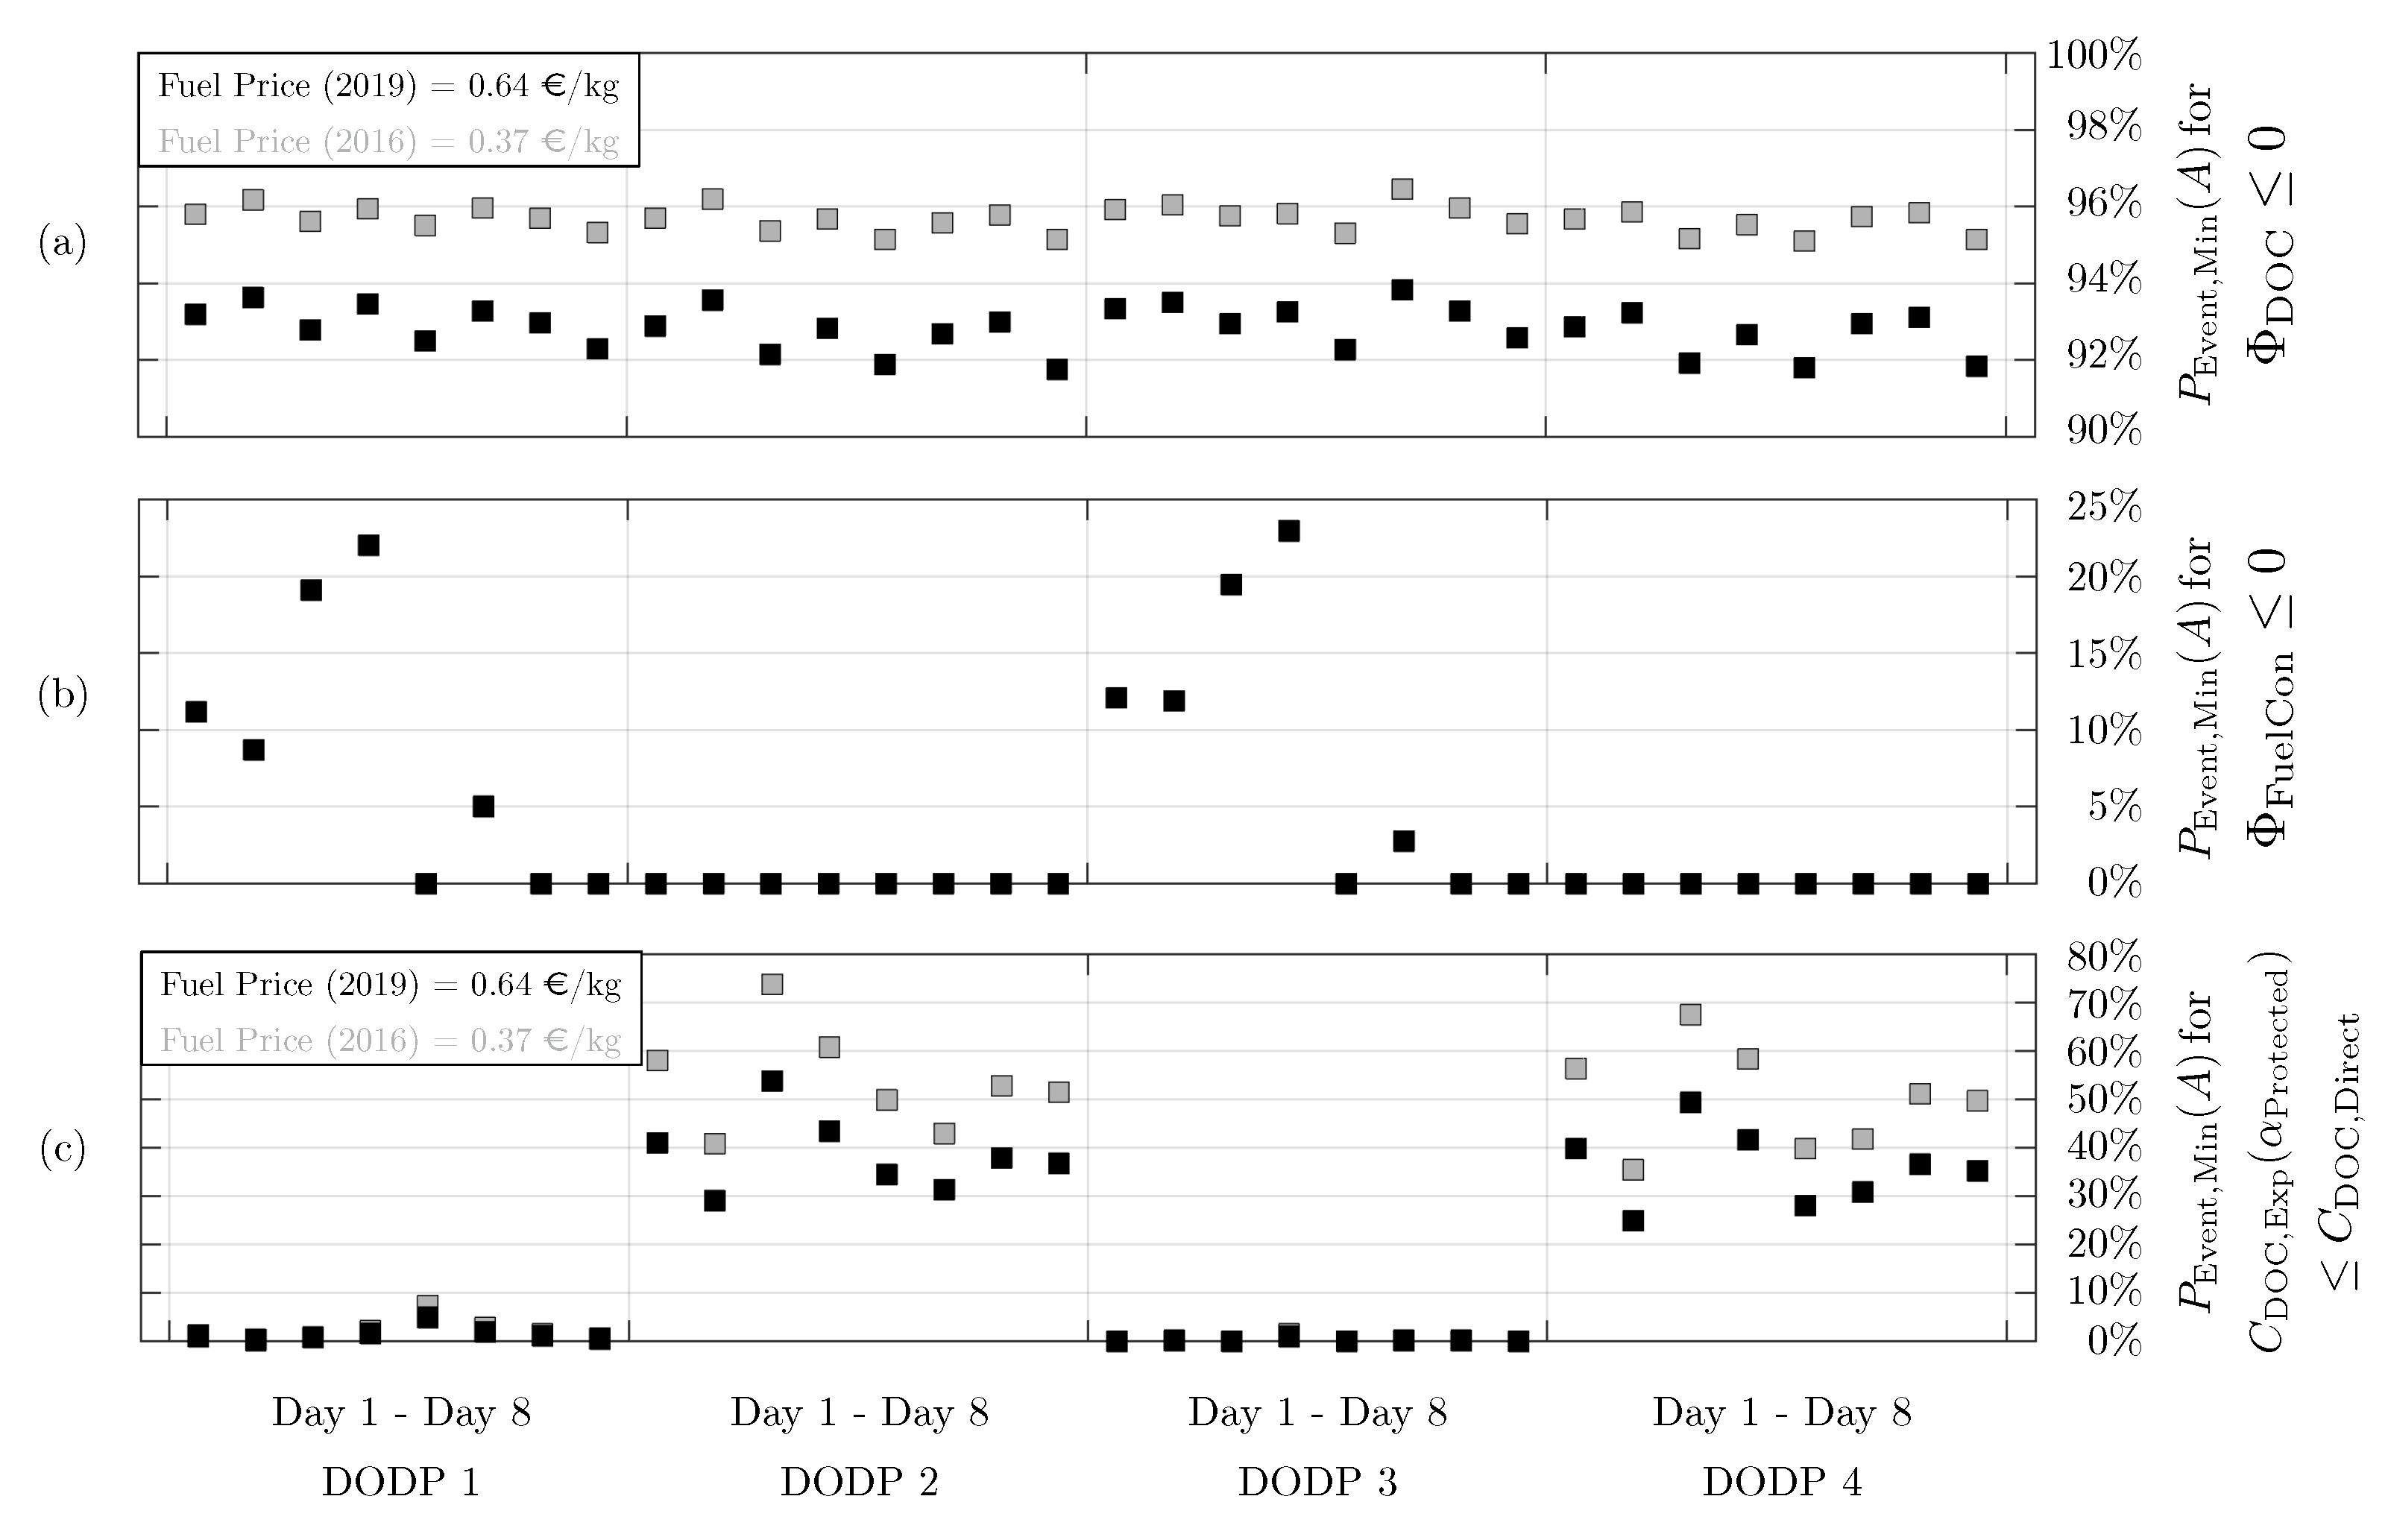
5.1. Selection and Evaluation of Optimal Actions

In Figure 3, the presented fuel planning results are arranged in rows of two charts, respectively, both with a common color code and linked data. The search space, depicted on the left-hand side, is generated for each combination of meteorological day and DODP, which is displayed on each map and refers to the nomenclature in Table 1 and Appendix A.
In this map, a set of three symbols is used in order to represent the search space around the follower’s reference track, which is marked as black line. The squares represent W P DEC located on the reference track (henceforth labeled by index On), quantifying the fuel planning optimization potential of the reference track with regard to the given optimization metric (see Section 3.1). There is one node-array allocated to each W P DEC , On , containing a set of off-track DECs (henceforth labeled by index Off), which are represented by small circles. In the course of the optimization process, the points W P DEC , Off allow a slight shift of the planned track towards the surrounding aerodromes. These aerodromes are depicted as colored triangles, if suitable as W P ERA , or grey, if they do not fulfill the requirements (see Section 2.2) for the track under investigation. Finally, a subset of the points W P DEC , Off is depicted as diamonds, indicating that they hold a higher optimization potential than the corresponding W P DEC , On . The availability of diamond markers in each node-array is therefore optional.
The right-hand chart shows all depicted square- and diamond-shaped W P DEC of the search space map with regard to their relative position in terms of s Air , Fw on the x-axis, while the y-coordinate depicts the numeric value with regard to the examined metric. In Figure 3a, AWSE-DPP is applied to each node array in order to obtain the achievable local minimum values of m TF + CF . The baseline, marked by 0 % , refers to the amount of fuel for a conventional fuel planning. The chart shows that the amount of fuel uplift m TF + CF for unprotected actions can be reduced by 22 % compared to the conventional reference value, if W P DEC , On is located at s Air , Fw = 77 % and W P ERA is selected to be the aerodrome YJT, as it is indicated by the yellow color. Along the s Air , Fw interval between 60 % and 77 % , the fuel m TF + CF is derived according to Equation (2), continuously decreasing with proceeding W P DEC position. Beyond that position, however, Equation (1) resumes being dominant, as implied by Equation (3). This results in continuously increasing values m TF + CF and alternating aerodromes W P ERA regarding the local minimum of acceptable fuel load m TF + CF (compare Figure 1d). In Figure 3b, the assignment of one W P ERA to each W P DEC in search space is conducted according to the criterion of minimum fuel consumption. Both cases, Figure 3a,b, show the same set of selected W P ERA and similar areas of W P ERA -affiliation over the search space, and a comparison between the two curves shows a close correlation. Based on the information given in Figure 3, the apparently best action for a decision maker to select seems to be the on-track W P DEC located at s Air , Fw = 76 % with the aerodrome YJT to be the designated W P ERA . This action— α DEC 76 % , On , YJT —allows a fuel load reduction of 22 % in comparison to the baseline and holds an expected savings potential Φ FuelCon regarding fuel consumption of 4.5 % , provided that a diversion occurs in only one out of twenty missions. The same search space is depicted in Figure 5a, whereas, here, the W P ERA assignment to the search space elements is conducted according to a minimum expected expense. The search space map, therefore, provides merged information on potential fuel savings and all further costs, resulting from a diversion. In this chart, the savings potential Φ DOC for an action α DEC 69 % , On , YJT is pointed out to be a far more favorable option than α DEC 76 % , On , YJT , yielding an expected reduction of 0.41 % regarding C DOC , rather than 0.22 % . As the position W P DEC = 76 % , On is located considerably beyond the track’s closest point to aerodrome YJT, a diversion conducted from that position would cause unnecessarily high detours in terms of time, and therefore W P DEC positions located earlier along the track should be favored. In this case, the selected action α DEC 69 % , On , YJT is the monetarily optimal option.

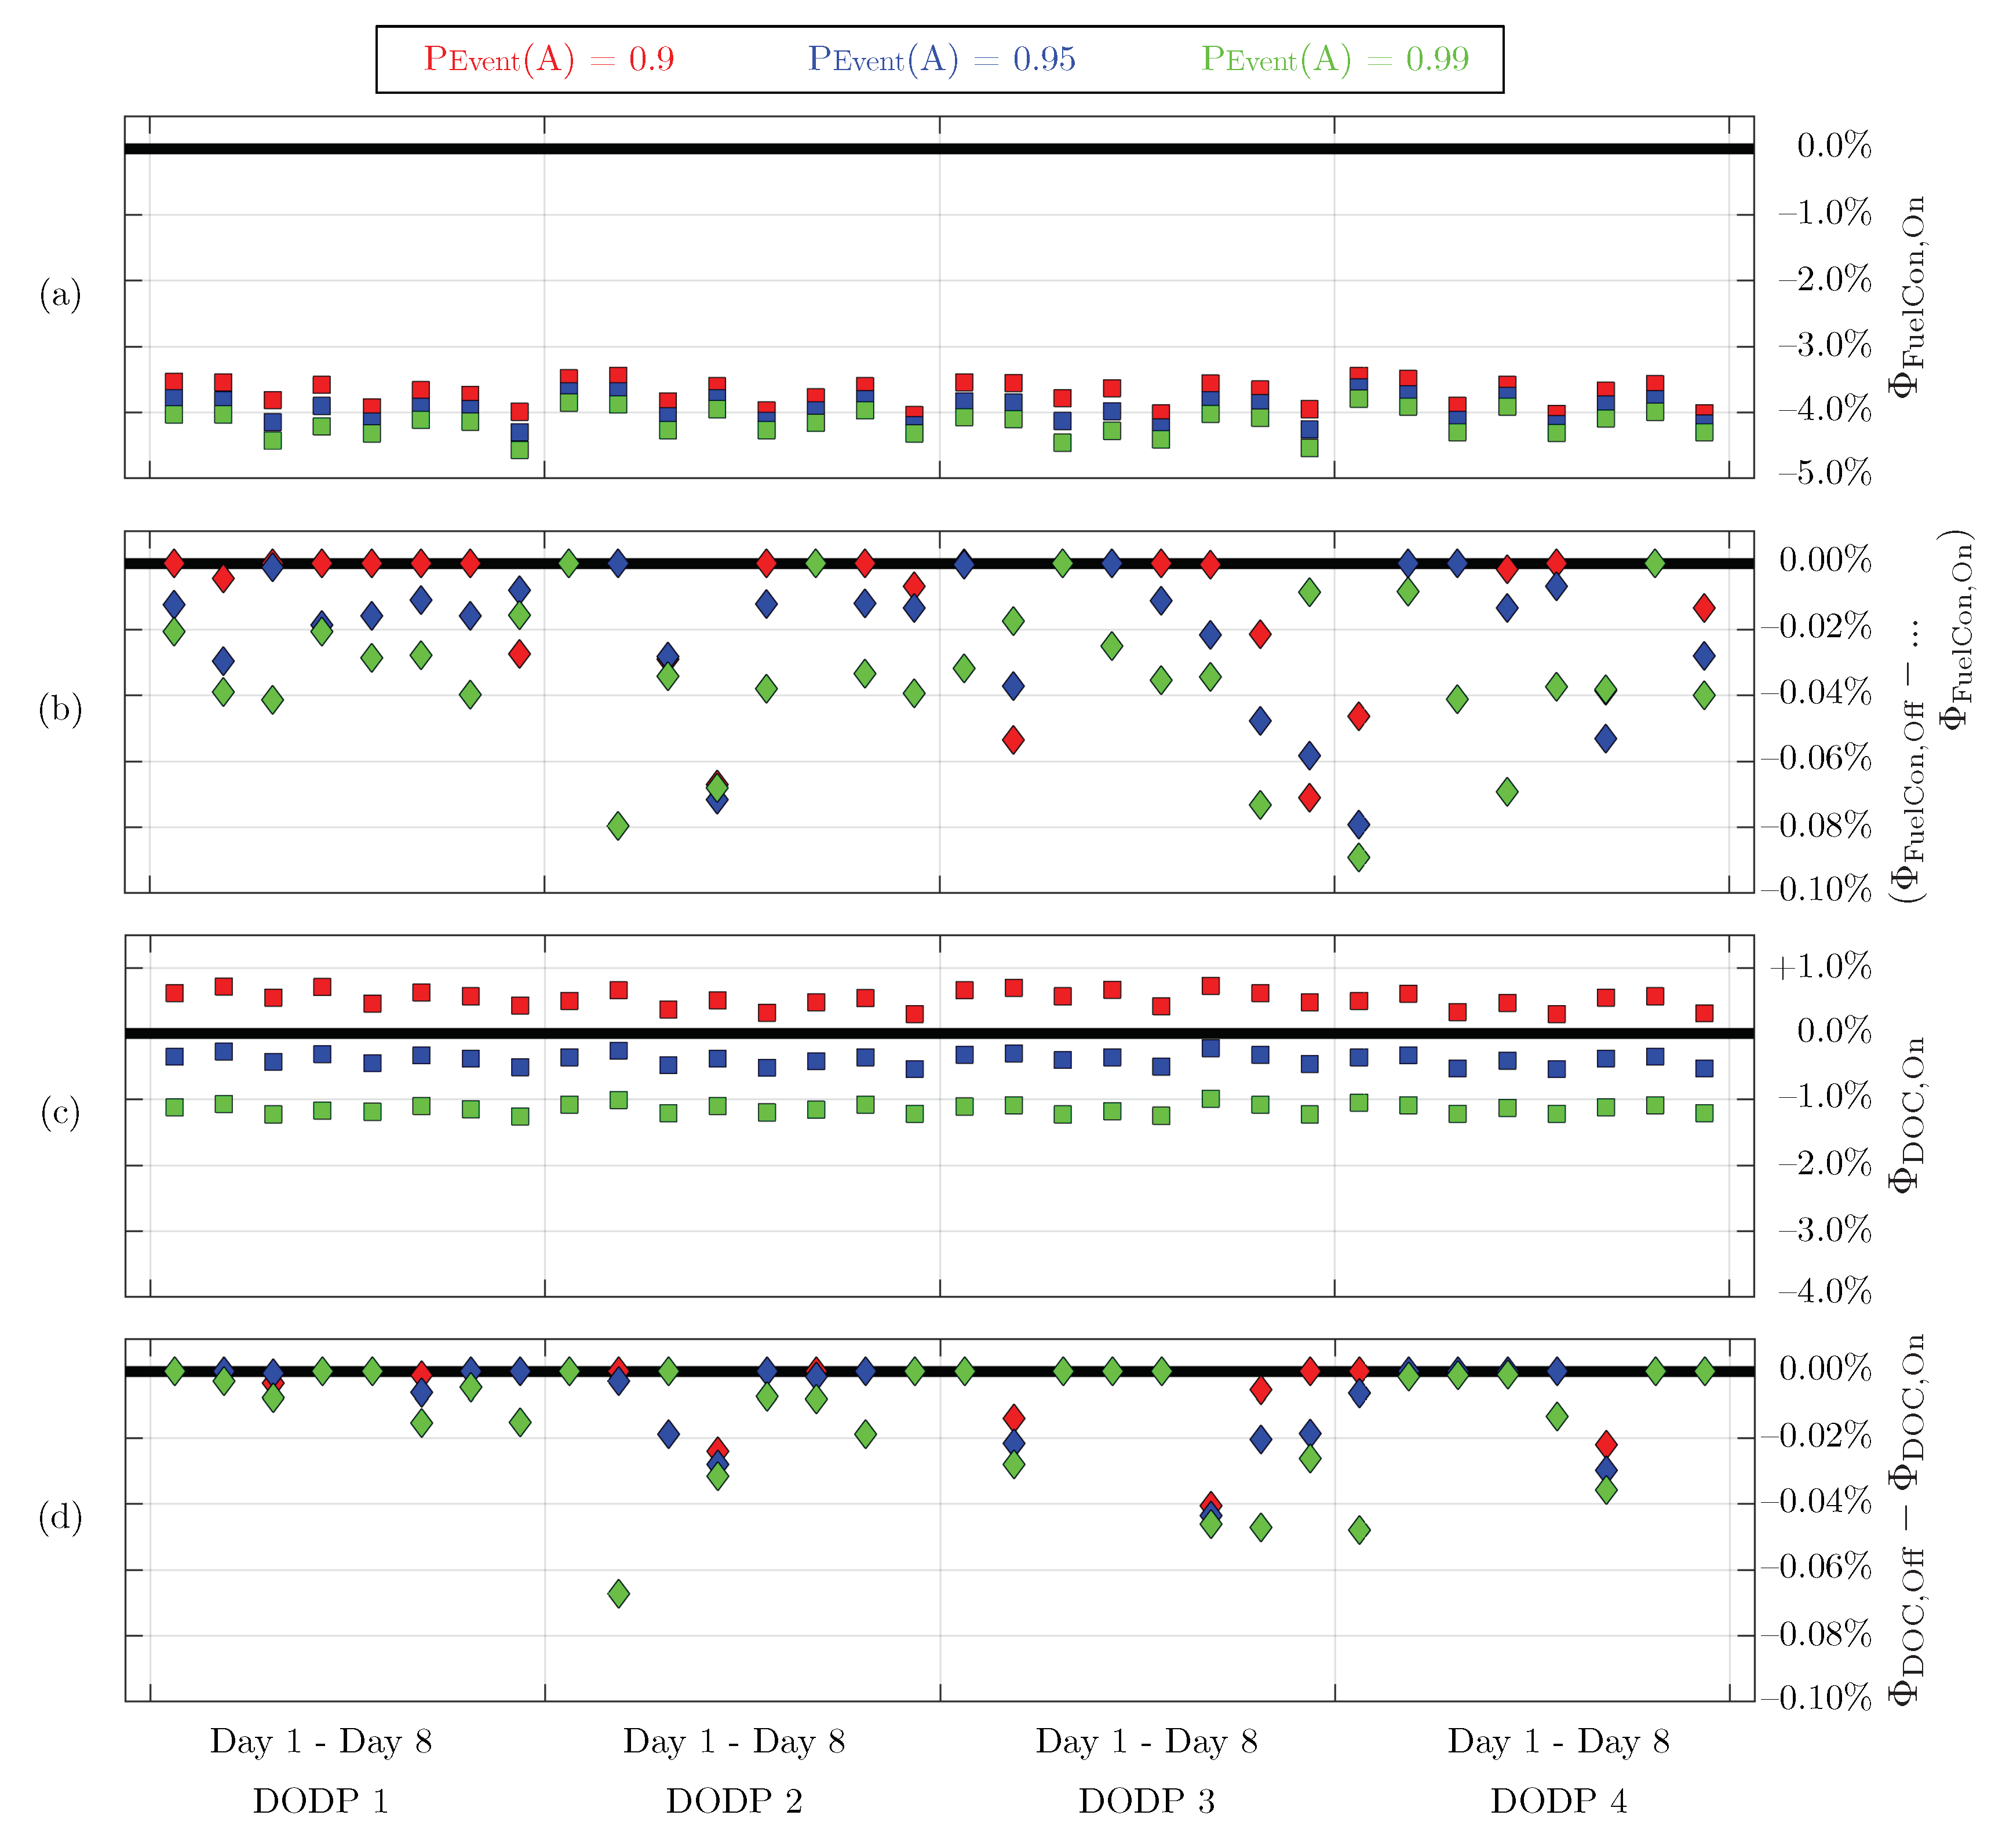
5.2. Quantification of Savings Potential

The savings potential regarding expected fuel consumption Φ FuelCon and expected expense Φ DOC is depicted in Figure 4, summarizing the 32 investigated combinations of DODPs and meteorological days, arranged in four DODP-wise segments. The color code refers to the underlying probability of success P Event ( A ) .
The savings potential regarding fuel consumption as presented in Figure 4a shows that all investigated combinations easily exceed Φ FuelCon = 3 % . In some cases, the potential almost reaches values of 5 % —savings that come in addition to the AWSE-benefits. Between the segments, the fluctuation of savings potential shows a comparably small dependency on the DODP, but a high dependency on the meteorological days. The deviation of savings potential shows repeating sequences in each segment of Figure 4. The observable impact of the atmospheric effects, partially caused by routing adaptation and partially by effects on flight time, can be quantified to approximately 0.8 % . The remainder of the Φ FuelCon fluctuation is mainly induced by the success probability, which shows a significant dependency on the DODPs. Exemplarily comparing the values Φ FuelCon of D8, a similarity can be observed between the DODP1 and DODP3, showing a distinct variance between cases of high and low success probability. In segments 2 and 4, on the other hand, the results of D8 show a significantly smaller sensitivity on the success probability P Event ( A ) . This dependency can be confirmed for most other days, allowing the conclusion that the impact of success probability particularly depends on the investigated DODP. These exemplary combinations, D8 and DODP3 respectively DODP4, can be compared in Figure 5c,d in detail. While DODP4 is passing a convenient W P ERA (aerodrome YYR) in direct proximity, the track of DODP3 is far-off. This offset results in longer detours for a diversion, which cannot even be compensated by placing off-track decision points and explains the dependency on the success probability.
Another subject of investigation throughout this study is the quantification of additional savings potential, induced by a formation routing adapted to optimal fuel planning. Therefore, Figure 4b depicts the difference between actions including W P DEC , On and W P DEC , Off with regard to their expected fuel savings potential Φ FuelCon .
Expanding the search space by off-track decision points, the additional potential gained by that measure does not exceed 0.1 % and can, therefore, assumed to be negligible. Furthermore, we found no distinct connection between P Event ( A ) and the additional optimization potential. The combination DODP3 and D2, for instance, shows an opposite behavior compared to the majority of the other combinations, as the highest value P Event ( A ) holds the smallest difference Φ FuelCon , Off Φ FuelCon , On in savings potential. Although no further savings can be gained due to utilizing off-track decision points, the analysis of the numeric charts in Figure 5 shows that, in some cases, such as (b) and particularly (c), a W P DEC , Off can provide a measure to considerably shift decision point positions to higher values s Air , Fw while the level of Φ FuelCon , respectively Φ DOC , remains almost constant (compare W P DEC (I) and W P DEC (II) in Figure 5c,d, respectively).
The monetary savings potential with regard to C DOC is summarized in Figure 4c. Varying the success probability P Event ( A ) between 90 % and 99 % , the resulting potential Φ DOC , On ranges from approximately + 0.9 % (unprofitable area) to 1.2 % (profitable area). As observed before with regard to Φ FuelCon , the values Φ DOC show a predominant sensitivity on the meteorological days. Finally, the additional savings potential due to the expansion of search space to off-track decision points is summarized in Figure 4d. Except for one case, the potential does not exceed values of 0.05 % and can be assumed to be negligible in terms of additional savings.

5.3. Minimum Required Success Probability

In order to operate on the edge of break-even condition, when conducting unprotected actions, a minimum success probability needs to be achieved. The monetary break-even probabilities are depicted for two levels of fuel price in Figure 6a. It can be observed that, for fuel prices as in the year 2019 (black markers), minimum values of success probability between P Event , Min ( A ) = 92 % and 94 % are sufficient in order achieve a monetary savings potential by AWSE-DPP, depending on the meteorological day.
In the case of lower fuel prices, however, such as in the year 2016 (gray markers), the achievable fuel savings have less weight in comparison to the high additional costs due to a diversion mission, shifting the minimum success probability P Event , Min ( A ) to higher values between 95 % and 96.5 % , indicating that AWSE-DPP is particularly rewarding for high fuel prices.
From a perspective of fuel savings, the minimum break-even probabilities depicted in Figure 6b show a distinct dependency on both the DODP and the atmospheric day. For DODP1 and DODP3, the break-even probability takes values up to 23 % , which is nevertheless clearly below the monetary break-even level. For DODP2 and DODP4, it can be observed that, even in the case of a diversion mission, fuel consumption can be reduced, resulting in required break-even probabilities of P Event , Min ( A ) = 0 % .
As long as an aerodynamic formation is conducted successfully, rich savings regarding fuel consumption can compensate a possible detour along W P ADEP RSP SEP ADES , but, in the case of a formation failure, this detour can induce unnecessary expenses compared to a direct routing W P ADEP ADES . In order to derive break-even rates for the concept of AWSE itself, these margins of potential savings and loss have been balanced with the operating costs C DOC , Direct , which result from a conventional mission without AWSE benefits, and a default fuel planning according to m TF + CF = 1.05 · m TF ( W P ADEP ADES ) . Since the monetary efficiency is a crucial prerequisite before commercial airlines can consider adopting the concept of AWSE in the future, the depicted break-even probabilities in Figure 6c represent a minimum level of P Event , Min ( A ) that must not be undershot for economic reasons and can therefore be taken for granted in the course of investigations on AWSE-DPP. However, these values show that, for DODP2 and DODP4 (differing destination airports), the minimum probability ranges from 25 % up to 74 % , depending on the fuel price and atmospheric day. The required probabilities P Event ( A ) for connections DODP1 and DODP3 (common destination airports), on the other hand, range between 0 % and 7 % and show small variability regarding day and fuel price.

6. Conclusions and Outlook

The approach presented in this study allows for including the anticipated AWSE-induced reduction regarding mission fuel demand in the course of the fuel planning process and, therefore, to take advantage of a significantly reduced take-off mass. An adapted version of the Decision Point Procedure has been applied, allowing the derivation of flight planning scenarios for AWSE formations. The procedure comprises an integrated view on fuel demand, routing, and airport availability along the track that can be used for refueling stops in a contingency case. The results show that, for a two-aircraft Trans-Atlantic mission conducting AWSE, the adapted planning procedure provides a fuel saving potential of 3 % to 5 % in addition to the savings of aerodynamic formation flight itself. Therefore, the success rate of conducting the formation has been assumed to take values between 90 % and 99 % . The expected fuel savings by using the new procedure and the monetary expenses arising from occasional refueling stops have been traded against each other by applying an assessment method for direct operating costs, considering flight time, fuel costs, navigation fees, landing fees, and other factors. We quantified the expected monetary outcome to vary between + 0.8 % (cost increase) and 1.2 % (cost savings), depending on the value of formation success probability ( 90 % to 99 % ). Assuming a high fuel price as in the year 2019, we showed that the monetary savings potential reaches profitable values in all examined cases, as long as success probabilities higher than 94 % can be maintained. The required break-even probability in order to reduce the long-term fuel consumption was shown to be significantly lower, taking values between 0 % and 23 % . A further break-even analysis showed that the requirements for economically efficient operations conducting AWSE-DPP are significantly higher compared to the mere concept of AWSE, which was found to require success probabilities P Event , Min ( A ) between 0 % and 74 % , particularly depending on the DODP, but also on atmospheric day and fuel price.
Furthermore, it was shown that a route optimization in terms of slightly shifting a track towards potential diversion airports, in order to decrease time-dependent costs for refueling, merely provides a marginal potential of saving fuel and monetary expenses. Nevertheless, we found that the route optimization grants a certain extent of planning flexibility, as it allows for shifting the predefined decision point along the track while maintaining the resulting savings.
The presented method and the results, however, are solely valid under the assumption of a full formation success or failure. The case of an early formation breakup, e.g., induced due to a technical problem during the formation, has not been modeled yet. A related gap is represented by the likewise missing analysis of critical points. This step, which is required according to the regulations on flight planning, has not been included in the procedure so far. Therefore, the derivation of the designated fuel component additional fuel, as well as a detailed analysis of the requirements that come along with isolated aerodromes, is marked for implementation in the course of future work.
Another aspect for future work is a more elaborate analysis of diversion costs, as, by now, there are no soft costs taken into account, like, for instance, the lack of passenger’s comfort in the case of a diversion mission, or possible occurring problems regarding interconnecting flights.
Requiring formation success rates beyond 90 % , the realization of economically sustainable operations applying AWSE-DPP was shown to be a challenging task. The development of active policies might represent a conceivable measure in order to achieve the required level of reliability, for instance, by new concepts in Air Traffic Management that support compatibility with AWSE. Supplementary research on indirect measures might significantly contribute to increasing attainable levels of success probability P Event ( A ) , e.g., by optimal selection procedures for formation partners as well as by predictive methods with regard to corresponding success probabilities. While the current work is based on meteorological reanalysis data, effectively neglecting forecast induced uncertainties, future work is intended to consider forecast data regarding meteorology and air traffic flow, and combining these indirect methods with the development of active measures.

Author Contributions

Conceptualization: M.S.; Data Curation: M.S., T.M., and F.L.; Formal Analysis: M.S.; Funding Acquisition: T.M., F.L., and V.G.; Investigation and Visualization: M.S.; Methodology: M.S.; Resources: M.S., T.M., and F.L.; Supervision: F.L. and V.G.; Validation: M.S.; Writing—Original Draft Preparation: M.S.; Writing—Review and Editing: M.S., T.M., F.L., and V.G. All authors have read and agreed to the published version of the manuscript.

Funding

This work has received funding from the German Ministry of Economic Affairs and Energy (BMWi) under the National Aeronautical Research Program (LuFo) V-2 under Grant No. 20E1508.

Institutional Review Board Statement

Not applicable.

Informed Consent Statement

Not applicable.

Data Availability Statement

The data presented in this study are available on reasonable request from the corresponding author.

Acknowledgments

The authors would like to thank Malte Niklaß for the DLR-internal review and Benjamin Lührs for valuable discussions. The Base of Aircraft Data (BADA) aircraft performance models were kindly provided by EUROCONTROL.

Conflicts of Interest

The authors declare no conflict of interest.

Abbreviations

The following abbreviations are used in this manuscript:
ADEPDeparture Airport
ADESDestination Airport
AWSEAircraft Wake-Surfing for Efficiency
CFContingency Fuel
DECDecision Point
DIVDiversion
DOCDirect Operating Cost
DODPDouble-Origin-Destination-Pair
DPPDecision Point Procedure
ECMWFEuropean Center for Medium-Range Weather Forecasts
ERAEn-Route Alternate Airport
FFFFuel-for-Fuel
FWFollower Aircraft
RSPRendezvous Starting Point
SDLSchedule
SEPSeparation Ending Point
TCMTrajectory Calculation Module
TFTrip Fuel
WPWaypoint

Appendix A. Atmosphere Days

Table A1. Atmosphere data under consideration.
IndexAtmosphere Day (Y-M-D-T)
D1Summer Pattern 1: 2008-08-02-12
D2Summer Pattern 2: 2012-06-08-12
D3Summer Pattern 3: 2012-08-29-12
D4Winter Pattern 1: 2006-12-30-12
D5Winter Pattern 2: 2011-02-22-12
D6Winter Pattern 3: 2009-02-17-12
D7Winter Pattern 4: 2010-02-19-12
D8Winter Pattern 5: 2008-02-04-12

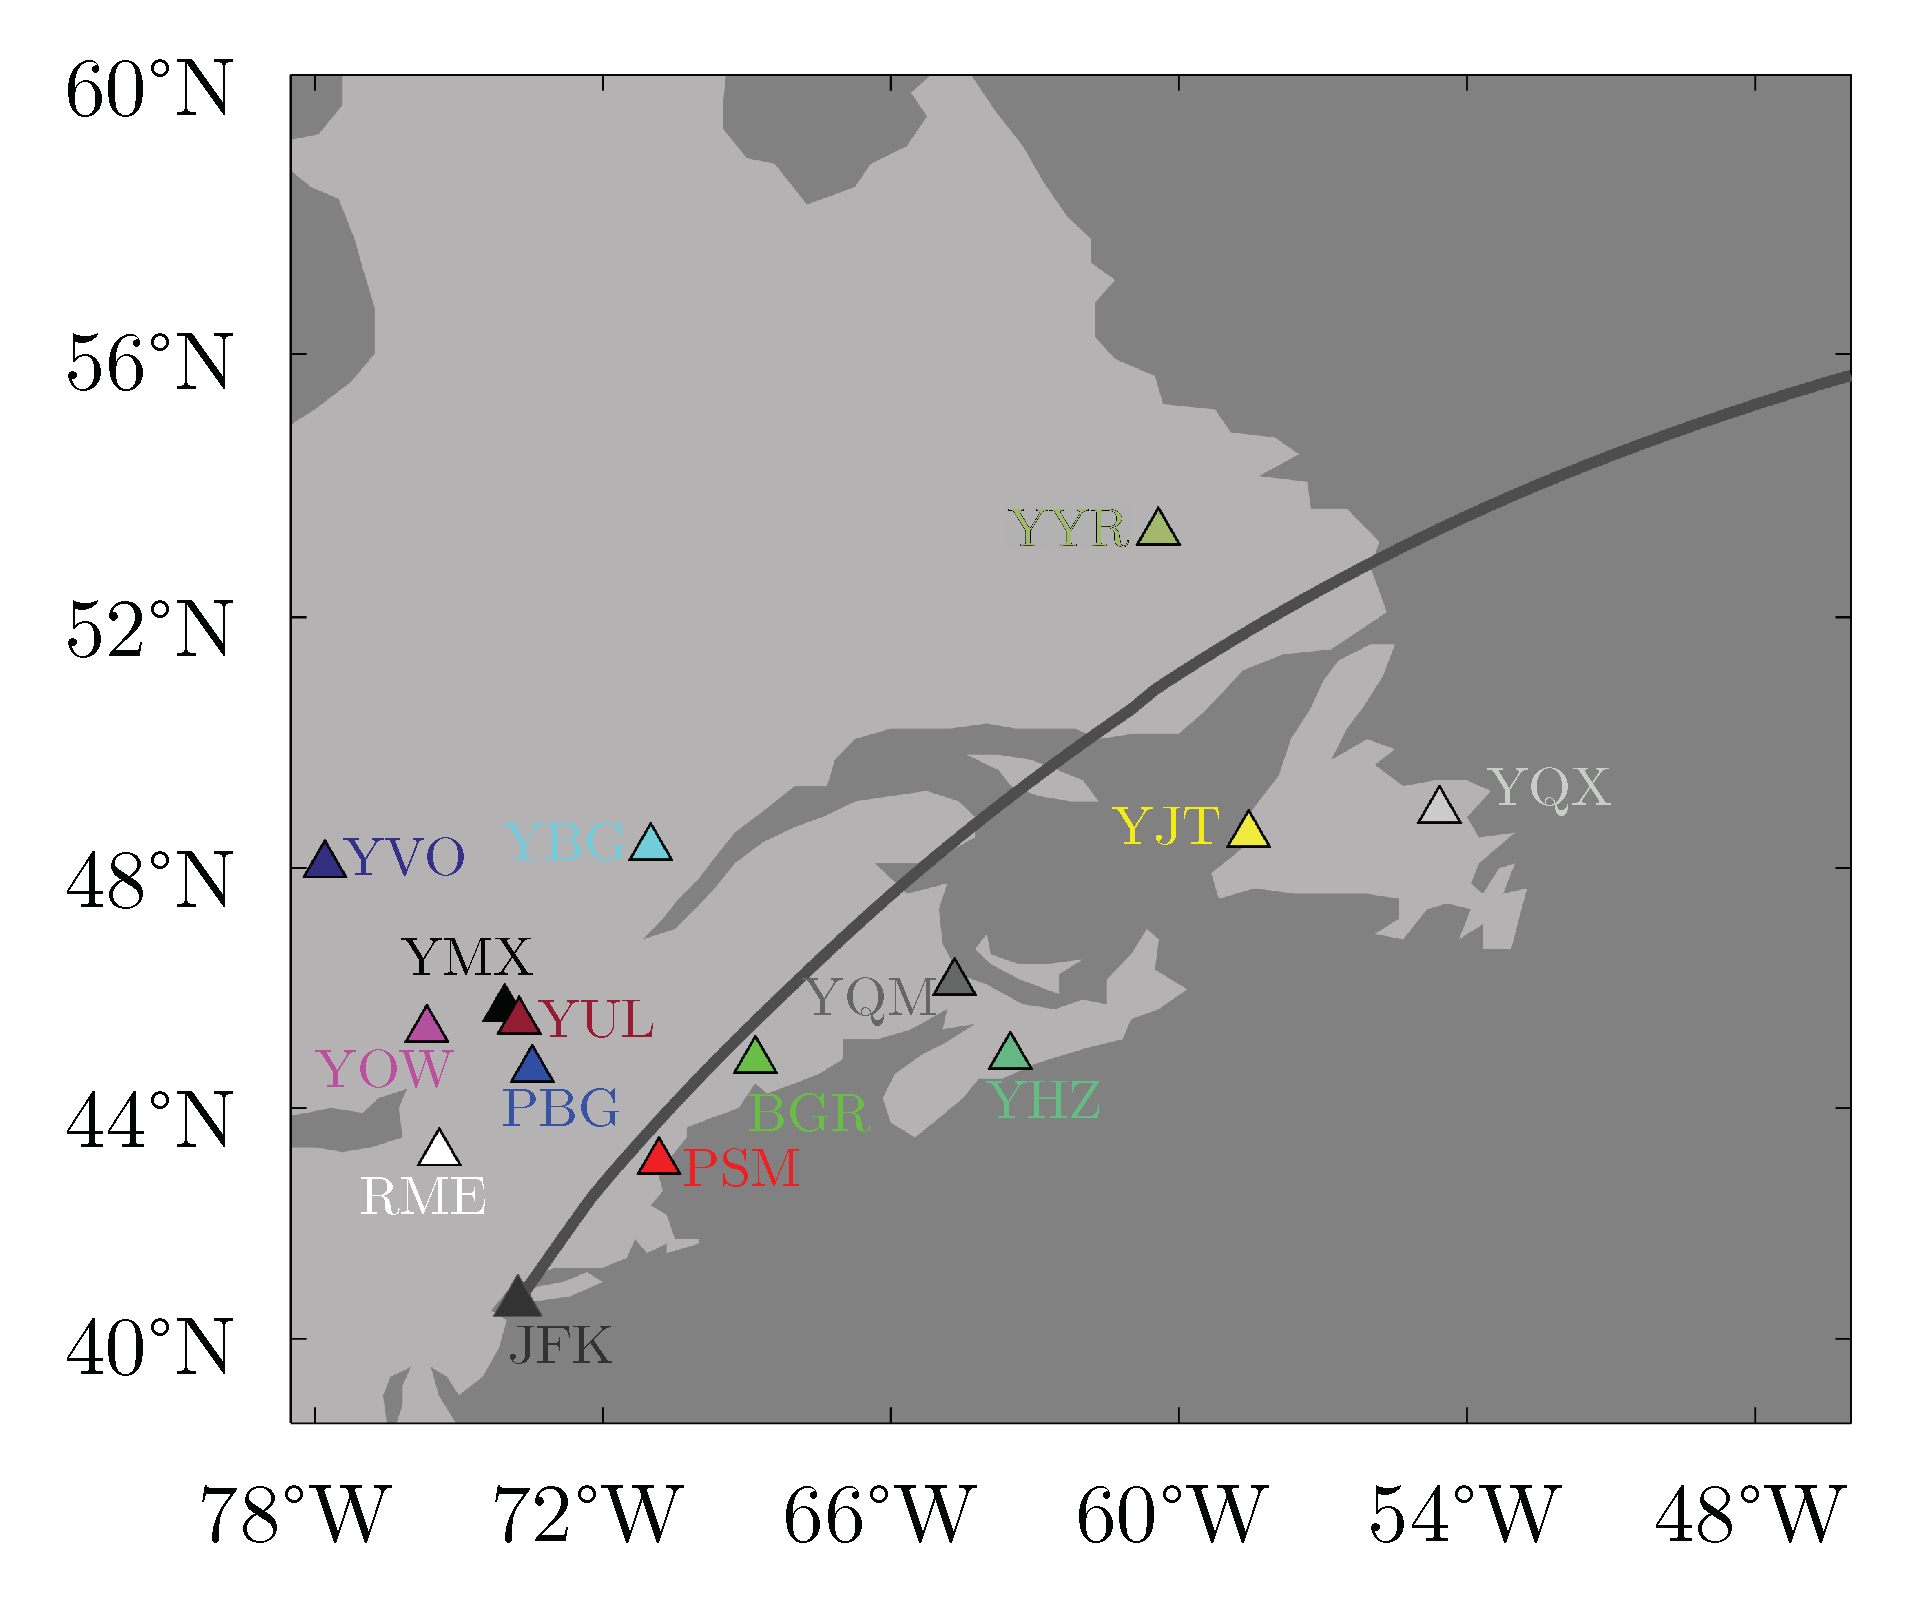
Appendix B. Aerodromes

Figure A1. Aerodromes under consideration for DPP planning.
Aerospace 08 00067 g0a1
Table A2. Aerodromes under consideration.
ICAO CodeIATA CodeDeparture AerodromesLatitudeLongitude
EGLLLHRLondon Heathrow Airport51.4775 −0.4614
LFPGCDGParis Charles de Gaulle Airport49.0097 2.5478
ICAO CodeIATA CodeDestination AerodromesLatitudeLongitude
KJFKJFKJohn F. Kennedy International Airport40.6398 −73.7789
KORDORDChicago O’Hare International Airport41.9786 −87.9048
ICAO CodeIATA CodeEn-Route-Alternate AerodromesLatitudeLongitude
KBGRBGRBangor International Airport44.8074 −68.8281
KPBGPBGPlattsburgh International Airport44.6509 −73.4681
KPSMPSMPortsmouth International at Pease Airport43.0779 −70.8233
KRMERMEGriffiss International Airport43.2338 −75.4070
CYBGYBGCFB Bagotville48.3306 −70.9964
CYHZYHZHalifax/Stanfield International Airport44.8808 −63.5086
CYJTYJTStephenville Airport48.5442 −58.5500
CYMXYMXMontreal International (Mirabel) Airport45.6795 −74.0387
CYOWYOWOttawa Macdonald-Cartier International Airport45.3225 −75.6692
CYQMYQMGreater Moncton International Airport46.1122 −64.6786
CYQXYQXGander International Airport48.9369 −54.5681
CYULYULMontreal/Pierre Elliott Trudeau International Airport45.4706 −73.7408
CYVOYVOVal-d’Or Airport48.0533 −77.7828
CYYRYYRGoose Bay Airport53.3192 −60.4258

References

  1. Easy Access Rules for Air Operations, Regulation (EU) No 965/2012. October 2019. Available online: https://www.easa.europa.eu/sites/default/files/dfu/EasyAccessRules_for_AirOperations-Oct2019.pdf (accessed on 10 July 2020).
  2. Fuel Planning and Management, Sub-NPA (A), Aeroplanes—Annex I (Definitions), Part-ARO, Part-CAT. July 2016. Available online: https://www.easa.europa.eu/sites/default/files/dfu/NPA%202016-06%20%28A%29.pdf (accessed on 10 July 2020).
  3. Ryerson, M.S.; Hansen, M.; Hao, L.; Seelhorst, M. Landing on Empty: Estimating the Benefits from Reducing Fuel Uplift in US Civil Aviation; IOP Publishing: Bristol, UK, 2015. [Google Scholar]
  4. Ayra, E.; Rios, D.; Cano, J. To Fuel or Not to Fuel. Is that the Question? J. Am. Stat. Assoc. 2014, 109, 465–476. [Google Scholar] [CrossRef]
  5. Linke, F.; Grewe, V.; Gollnick, V. The Implications of Intermediate Stop Operations on Aviation Emissions and Climate. Meteorol. Z. 2017, 26. [Google Scholar] [CrossRef]
  6. Kent, E.T.; Richards, A.G. Analytic Approach to Optimal Routing for Commercial Formation Flight. J. Guid. Control. Dyn. 2015, 38. [Google Scholar] [CrossRef]
  7. Swaid, M.; Marks, T.; Lührs, B.; Gollnick, V. Quantification of Formation Flight Benefits under Consideration of Uncertainties on Fuel Planning. In Proceedings of the 31st Congress of the International Council of the Aeronautical Sciences, Belo Horizonte, Brazil, 9–14 September 2018. [Google Scholar]
  8. Marks, T.; Swaid, M.; Lührs, B.; Gollnick, V. Identification of optimal rendezvous and separation areas for formation flight under consideration of wind. In Proceedings of the 31st Congress of the International Council of the Aeronautical Sciences, Belo Horizonte, Brazil, 9–14 September 2018. [Google Scholar]
  9. Flight Planning and Fuel Management Manual. DOC 9976; Advanced 2012 Edition (Unedited); International Civil Aviation Organization: Montréal, QC, Canada, 2012.
  10. Lührs, B.; Linke, F.; Gollnick, V. Erweiterung eines Trajektorienrechners zur Nutzung meteorologischer Daten für die Optimierung von Flugzeugtrajektorien. In Proceedings of the 63th Deutscher Luft- und Raumfahrtkongress (DLRK), Augsburg, Germany, 16–18 September 2014. [Google Scholar]
  11. Murphy, A.H. Decision Making and the Value of Forecasts in a Generalized Model of the Cost-Loss Ratio Situation. Monthly Weather Rev. 1984, 113, 362–369. [Google Scholar] [CrossRef] [Green Version]
  12. Irvine, E.A.; Hoskins, B.J.; Shine, K.P.; Lunnon, R.W.; Froemming, C. Characterizing North Atlantic weather patterns for climate-optimal aircraft routing. Meteorol. Appl. 2013, 20, 80–93. [Google Scholar] [CrossRef] [Green Version]
  13. Berrisford, P.; Dee, D.; Poli, P.; Brugge, R.; Fielding, K.; Fuentes, M.; Kållberg, P.; Kobayashi, S.; Uppala, S.; Simmons, A. The ERA-Interim Archive; European Center for Medium-Range Weather Forecasts: Shinfield Park, UK, 2011. [Google Scholar]
  14. Marks, T.; Zumegen, C.; Gollnick, V.; Stumpf, E. Assessing formation flight benefits on trajectory level including turbulence and gust. In Proceedings of the Italian Association of Aeronautics and Astronautics XXV International Congress, Rome, Italy, 9–12 September 2019. [Google Scholar]
  15. Nuic, A.; Mouillet, V. User Manual for the Base of Aircraft Data (BADA) Family 4; ECC Technical/Scientific Report No. 12/11/22-58; Eurocontrol: Brussels, Belgium, 2012. [Google Scholar]
  16. The Boeing Company. Airplane Performance. Available online: http://www.boeing.com/assets/pdf/commercial/airports/acaps/7772sec3.pdf (accessed on 28 February 2021).
  17. OurAirports. 2018. Available online: https://ourairports.com/data/ (accessed on 1 January 2018).
  18. Thorbeck, J. With remarks by Scholz, D. DOC-Assessment Method. In Proceedings of the 3rd Symposium on Collaboration in Aircraft Design, Linköping, Sweden, 19–20 September 2013. Available online: https://www.fzt.haw-hamburg.de/pers/Scholz/Aero/TU-Berlin_DOC-Method_with_remarks_13-09-19.pdf (accessed on 28 February 2021).
Figure 1. According to DPP [2], the follower’s amount m TF + CF is calculated for two cases: firstly up to ERA, according to Equation (1) (red line), secondly up to ADES, according to Equation (2) (blue line). The respective higher value is selected for fuel planning to ensure safety for all events. The adapted variant AWSE-DPP takes AWSE benefits into consideration for an anticipated success (SDL) and neglects them for an anticipated failure (DIV). (a) formation mission geometry including relevant parameters for AWSE-DPP; (bd) Qualitative visualization of m TF + CF according to Equations (1)–(3) under consideration of ERA1.
Aerospace 08 00067 g001
Figure 2. Proposed workflow for optimized flight planning with AWSE-DPP, subdivided into Step I to IV. Based on assumed values P(A) for AWSE success probability, the depicted event tree between Step II and IV shows exemplarily the derivation of the expected expense and the resulting savings potential Φ DOC of an AWSE-DPP action in comparison to a conventional action.
Aerospace 08 00067 g002
Figure 3. Overview on fuel planning scenarios with regard to (a) minimum fuel uplift, and (b) minimum fuel consumption for an assumed formation success probability of P Event ( A ) = 0.95 . Appropriate aerodromes W P ERA are displayed as triangles, and the color code is used to assign decision points W P DEC to the corresponding optimal W P ERA . Squares represent W P DEC located on the reference track. Small circles represent W P DEC located offside the reference track. Diamonds represent W P DEC offside the reference track with a higher savings potential than the corresponding on-track W P DEC .
Aerospace 08 00067 g003
Figure 4. Expected potential Φ of unprotected actions compared to protected actions with regard to (a) reduction in fuel consumption for on-track decision points; (b) additional reduction in fuel consumption for off-track decision points; (c) reduction in C DOC for on-track decision points; (d) reduction in C DOC for off-track decision points.
Aerospace 08 00067 g004
Figure 5. Optimization potential regarding expected expense, resulting from unprotected actions compared to protected actions. The depicted cases (ad) show exemplarily four combinations of DODP and meteorological day for an assumed value of formation success probability P Event ( A ) = 0.95 .
Aerospace 08 00067 g005
Figure 6. Required success probabilities P ( A ) under operating conditions on the edge of break-even. (a) required success probabilities for a monetary break-even condition of AWSE-DPP; (b) required success probabilities for a break-even condition of AWSE-DPP in terms of fuel consumption; (c) required success probabilities for a monetary break-even condition of AWSE, conducting a conventional fuel planning.
Aerospace 08 00067 g006
Table 1. Scope of investigation.
ParameterValue
DODP 1CDG and LHR to JFK and JFK
DODP 2CDG and LHR to ORD and JFK
DODP 3LHR and LHR to JFK and JFK
DODP 4LHR and LHR to ORD and JFK
Number of meteorological days8
Aircraft type (Ld and Fw)B777-200
Cruise Mach0.84
Cruise Flight LevelFL390
Loadfactor0.78
Fuel reserves4500 kg
Publisher’s Note: MDPI stays neutral with regard to jurisdictional claims in published maps and institutional affiliations.

