Article

Temperature and Pressure Dynamic Control for the Aircraft Engine Bleed Air Simulation Test Using the LPID Controller

School of Aeronautic Science and Engineering, Beihang University, Beijing 100191, China
*
Author to whom correspondence should be addressed.
Aerospace 2021, 8(12), 367; https://doi.org/10.3390/aerospace8120367
Submission received: 31 October 2021 / Revised: 16 November 2021 / Accepted: 24 November 2021 / Published: 27 November 2021
(This article belongs to the Special Issue Advances in Aerothermal Engineering)

Abstract

:
The aircraft engine bleed air simulation thermodynamic laboratory simulation parameters include the bleed air pressure and temperature. However, existing laboratories cannot carry out the dynamic test of the engine bleed air simulation. In the engine bleed air simulation dynamic test, the temperature control has the characteristics of strong coupling and nonlinear and large inertia. The conventional control strategy cannot solve the contradictions of the response speed and stability of the system. Moreover, the dynamic control of the pressure and temperature involve strong coupling. That often leads to the failure of control decisions. Therefore, there is still no relevant report on the laboratory equipment used for the engine dynamic bleed air simulation. According to the above problem, this study adopted heat exchangers for indirect heating to reduce the coupling of dynamic control between temperature and pressure. Specifically, to take into account the rapid response and stability of the system, this study used the lookup table-based PID (LPID) controller to control the temperature and pressure of the bleed air simulation test. The dynamic test errors were within 10%, and the steady-state accuracies were within ±2%. The simulation software results and the engine bleed air simulation test results showed that temperature and pressure control systems based on the LPID controller have advantages: high control precision, a low overshoot amount, a fast response, and a high stability.

1. Introduction

The thermal anti-icing and environmental control system (TAI/ECS) is one of the critical systems of onboard aircraft equipment [1,2] which guarantees the safety, health, and comfort of the pilots and passengers as well as the regular operation of onboard equipment [3]. The thermodynamic laboratory equipment for the engine bleed air simulation is a universal test platform for performance testing of the TAI/ECS. However, existing laboratories are still unable to carry out dynamic tests of engine bleed air at present. It is because the heating equipment has the characteristics of a wide temperature range, non-linearity, and large inertia. That often leads to the failure of control decisions. Moreover, the dynamic control of pressure and temperature involve strong coupling, and it is hard to obtain the ideal control effect through the conventional method. As a result, it is difficult for the system to consider the rapidity and stability requirements of temperature and pressure control. Therefore, the thermodynamic laboratory equipment mainly tests the principle verification and the static performance index. Zheng Dai and Yi Cui [4] proposed a hot and cold blending method to achieve the rapid temperature adjustment in the thermodynamic laboratory. This was verified to be effective by Yi Cui [5] with a Simulink simulation, but the work only considered theoretical simulations. Jian Wang et al. [6] proposed a comprehensive control method based on humanoid intelligence to solve problems such as the slow heating rate, the long state switching response time, and so on in the current aircraft engine compressor bleed air simulation test equipment. However, dynamic test results are lacking in his work. The equipment applied to the engine bleed air simulation dynamically are rarely reported. As a result, the dynamic performance test of the TAI/ECS faces considerable challenges [7].
In recent years, scientists and researchers have developed multiple control strategies to enhance and improve the stability and movement of temperature and pressure control systems. Most of these methods involve using conventional PID controllers [8], which are easy to implement. However, the temperature and pressure control involve strong coupling and nonlinear and large inertia in this thermodynamic laboratory equipment. The single PID parameter cannot meet the requirements of stability and rapidity of temperature and pressure control. Some other methods use advanced process control algorithms such as fuzzy logic controllers [9,10,11], intelligent controls [12,13], and the cascade controller [14,15,16], which have a good performance but have an inferior stability and require a lot of processing power.
This novel equipment adopts heat exchangers for indirect heating to make up for the insufficient dynamic capability of the previously developed thermodynamic laboratory equipment and by controlling the mixing ratio of hot and cold air to control the temperature. Therefore, the nonlinearity and coupling of the system’s temperature and pressure control were reduced. Specifically, the equipment applies an LPID controller to the dynamic response and steady-state temperature and pressure control. The distinguishing feature of the proposed algorithm is the use of the pre-calculated to make a PID parameter scheduling table. Then, according to expert experience, additional PID gains were scheduled under different temperature and pressure conditions. Our method provides a better performance than that of a PID controller. Moreover, it is more stable and requires less computational effort from the processing unit than advanced process controls.
In this paper, we simplified the model of the temperature and pressure control for the system, and the system model with the simple PID and the LPID were designed using simulation software. Then, we analyzed the advantages of the LPID controller compared with a simple PID based on the simulation results. Remarkably, this investigation applied the LPID controller to the thermodynamic laboratory control program; the control program used Windows7 SP1/LabVIEW2015 SP1 [17] as the development platform. The laboratory was used for the optimization and fault detection of TAI/ECS and the transient and steady-state control of the temperature and pressure of the aircraft engine bleed air simulation met the entire flight envelope thermal test requirements of different types of TAI/ECS.

2. Methodology

2.1. Mathematical Modeling

This paper addresses the temperature and pressure control of an engine bleed air simulation on thermodynamic laboratory equipment. The equipment’s main simulation parameters included the bleed air pressure and temperature. The laboratory was comprised of the compressed air system, silicon-controlled rectifier control cabinets, transformers, electric heaters, sensors, pneumatic control valves, and other equipment. Peter Hodal et al. [18] proposed three temperature control strategies to ensure that the use of ram air is minimized under the condition of rapid temperature response. According to Peter Hodal’s research, this study used a heat exchanger to heat the ram air indirectly, mixed it with cold air in the bypass pipe, and then controlled the ratio of cold to hot air by controlling the opening of the pneumatic valves.
The working principle of the equipment is shown in Figure 1. Firstly, the centrifugal fan and the electric heater are turned on, satisfying a specific flow of air through the electric heater. Then, a PC or remote-control heating instruction is provided for the SCR control cabinet by identifying the difference of a given temperature and feedback. The electric heater’s outlet temperature T 1 and flow rate of are controlled by the control program that came with the intelligent PID temperature controllers. Then in the case of sufficient heat exchange, the dynamic temperature of the counterflow heat exchanger is approximated by a first-order response with a time constant [19,20].
Secondly, compressed air comes from an air pressure station. The air source pressure is about 3.5 MPa. The LPID controller adjusts the opening angle of pressure control valves according to the measured value of P 2 compared with the sett value. To reduce the area of the control dead zone of the valve, a pressure control valve P V 2 is installed on the branch pipe linking to the pressure control valve P V 1 on the main pipe. Both valves use the same 4~20 mA DC signal. At 20 mA, the valve P V 1 is fully opened and the valve P V 2 is fully closed.
Then, after the compressed air passes through the mass flowmeter V H , it enters the temperature control components. The temperature control components are shown in Figure 2. Specifically, the globe valve G V 1 and G V 2 are used to balance the flow resistance of the hot and cold branches. Then that the action of the temperature control valves will not interfere with the pressure control, thereby reducing the non-linearity of pressure control. Both the temperature control valves use the same 4~20 mA DC signal. At 20 mA, the valve on the high-temperature branch is fully opened and the valve on the room-temperature branch is fully closed.
The flow state of the system is complex, and it was simplified appropriately to facilitate the modeling of this system. The test results of C. Youn et al. [21] showed the step response dynamic characteristics of the pneumatic valve that has been debugged, which are approximately of the first-order:
{ K V = 100 ( 20 4 ) % Δ l Δ I = K V G V = 0.0625 e 0.4 s 0.4 s + 1
where l is the fraction of valve opening and I is the control signal. Furthermore, G V is the inertial element used to express the dynamic characteristics of the pneumatic valves used in this equipment.
The relationship between the outlet flow of the control valve and the opening follows the following formula [22]:
Q v = C v m a x f ( l ) Δ p v s . g
where f ( l ) is the flow characteristic of the control valve, Q v is the volumetric flow rate through the control valve, C v m a x is the max flow coefficient of control valve ( m 3 / h ), Δ p v is the pressure drop across the valve (bar), and s . g is the specific gravity of the compressed air ( kg / L ).
In practical work, the flow characteristics of the control valve will be distorted. The specific relationship is:
f ( l ) = f ( l ) 1 r + ( 1 r ) f 2 ( l )
where r is the pressure drop ratio at both ends to the inlet pressure of the control valve when the valve is fully open.
The control valves P V 1 and P V 2 are equal percentage valves. For an equal percentage valve, f ( l ) = α l 1 . α is the inherent rangeability of a control valve. According to the parameters of valves, the max flow coefficients and inherent rangeabilities of the control valves P V 1 and P V 2   can be obtained:
C v 1 m a x = 100   m 3 / h C v 2 m a x = 40   m 3 / h α 1 = α 2 = 100 f 1 ( l ) = α 1 l 1 1 f 2 ( l ) = α 2 l 2 1 ; l 1 + l 2 = 1
Under a particular test condition, when P V 1 is fully open ( l 1 = 1 ), the absolute pressure P 1 is measured as:
P 1 = 3430   kPa
We can determine the pressure drop and pressure drop ratio of P V 1 as:
Δ p v = P 0 P 1 = r 1 P 0 = 70   kPa r 1 = 0.02
where P 0 = 3500   kPa is the inlet pressure at the front end of the valve P V 1 .
Since the P V 2 is the atmospheric relief valve, the pressure drop ratio must be:
r 2 1
For the parameters given above, we can calculate the particular working flow of the valve P V 1 . That is:
{ Q 1 = C v 1 m a x f 1 ( l ) Δ p v s . g 1 W 1 = Q 1 ρ 0 = Q 1 P 0 R T r
where T is the thermodynamic temperature of the flowing air, W is the air mass flow rate, R is the gas constant, and the room temperature of airflow is T r = 293   K .
The Q 1 and the valve P V 2 opening ( 1 l ) determine the Q 2 . That is:
{ Q 2 C v 2 m a x C v 1 m a x f 2 ( l ) Q 1 W 2 = Q 2 ρ 1 = Q 2 P 1 l R T r W t = W 1 W 2
where P 1 l is the absolute pressure measurement of P 1 .
Under a particular test condition, the gauge pressure P g 1 l at the measuring point P 1 is approximately linear with the pressure control valve opening l :
P g 1 l P g 1 1 = l
where the superscript l represents the valve opening and the subscript g represents the gauge pressure. The gauge pressure P g 1 1 = P 1 P a = 3329   kPa , P a = 101   kPa is the standard atmospheric pressure. For this particular condition, assume that P g 2 l = 0.95 P g 1 l .
The volume and resistance of the pipeline and apparatuses will affect the variation ratio of flow and pressure. The pressure transmission from the inlet of the valve P V 1 to the measuring point P 1 is approximately equal to an inertia element. Assume that:
G p 1 = 1 T p 1 s + 1
The pressure transmission between measuring points P 1 and P 2 , which is approximately the first-order inertia element with time delay, is:
G p 2 = e τ p 2 s T p 2 s + 1
where T p 1 = 0.1 , T p 2 = 0.5 , and τ p 2 = 0.6 , are determined by the volume of the pipelines and apparatuses in the laboratory.
The ratio of cold to hot air of the two branches can be adjusted by controlling the opening angle of the valves to control the inlet temperature of the bleed air. The temperature control valves P V 3 and P V 4 are linear. Since the flow resistance of the cold and hot branches is balanced, the mass flow rates through the two linear valves are approximately linearly related to the opening l h :
{ W h = l h W t W r = ( 1 l h ) W t
According to the actual working efficiency of the heat exchanger, assume that T h T r ( T 1 T r ) × 95 % . According to the temperature loss between T 2 and T 3 due to heat dissipation, assume that T 3 T r ( T 2 T r ) × 98 % .
The temperature T 2 is the weighted sum of the two air masses and temperatures. The formula is as follows:
T 2 = W r T r + W h T h W r + W h
The article uses a lowest-order approximation method to deal with complex high-order models. The heat exchanger, a three-capacity object, is approximately described by a first-order element link with time-delay:
G t 1 = K t 1 e τ t 1 s T t 1 s + 1
where K t 1 is the variable gain (typically 1); T t 1 = 5 is the time constant, which reflects the speed of response of the heating process; τ t 1 = 1 , determined by the flow lag in the pipeline.
The valve P V 5 is used for the safe exhaust to ensure that the compressed air is not blocked. When the valve remains closed, P 2 P 3 . The temperature transmission from point T 2 to point T 3 can be regarded as a first-order inertia element, that is:
G t 2 = 1 T t 2 s + 1
where T t 2 = 2 , which was determined by the heat capacity of the pipelines between T 2 and T 3 .

2.2. Lookup Table-Based PID Controller

In this paper, an incremental PID controller was used to process discrete signals [23]. An incremental PID controller only outputs the changed part of the valve opening. When the computer fails, the output can be restricted or prohibited by logic judgment to increase the system’s stability. Figure 3 is a schematic diagram of the LPID. The LPID control was developed from traditional PID. The relationship between three PID parameters K p , K i , K d , and the error e was established based on this specific system.
According to different e , the parameters K P , K I , K D can be self-adjusted online to make the controlled object have a good dynamic and static performance. Therefore, it can make the temperature and pressure of bleed air stable and avoid the shock in the error range, rapidly meeting the test requirements.
The designation of the parameter table of the LPID controller is related to the control error e according to the expert experiences. The maximum error value is set as the M m a x , the middle error value is set as the M m i d , and the minimum error value is set as the M m i n . At time k , we consider the ideal position signal as y d ( k ) , the output as y ( k ) , and then the tracking error is e ( k ) = y d ( k ) y ( k ) at time k . Then we can perform the following analysis:
  • Debug as many PID parameters as possible under different working conditions, including strong PID, general PID, weak PID with excellent steady-state accuracy.
  • When the | e ( k ) | > M m a x , we use the strong PID to minimize error quickly.
  • When the M m i n < | e ( k ) | M m i d , we adopt the weak PID.
  • When the | e ( k ) | M m i n , which indicates the absolute error value, tends to be very small, we can use the PI to decrease the static error.
  • When the deviation is slight to a certain extent, | e ( k ) | < ε , the concept of the dead zone can even be introduced, at this moment, the output of the controller retains invariable, namely, u ( k ) = u ( k 1 ) .

2.3. Simulation

Process simulation was necessary to prove the feasibility of the structure design and control scheme for the system. In this study, the simulation of the temperature and pressure control used the MATLAB/Simulink. Figure 4 is the Simulink simulation diagram of the system. The simulation conditions were set as follows: the inlet pressure P 0 was 3500 kPa, the inlet temperature T 1 of the warm end of the heat exchanger was 1023 K, and the compressed air temperature T r was 293 K. The pressure setting value increased from 200 kPa to 3100 kPa (or 1500 kPa), the pressure variation ratio was 900 kPa/s, the temperature setting value increased from 373 K to 853 K (or 600 K), and the temperature variation ratio was 90 K/s, both of which started to rise at the same time at 40 s. The simulation time was 100 s. The sampling period was 5 ms, which was consistent with the actual thermodynamic equipment.
In software simulation, the LIPD and PID controllers were used to control the pressure and temperature of the system dynamically. The dynamic responses to the vast range of pressure and temperature variation are shown in Figure 5. Moreover, the dynamic responses of the low range of pressure and temperature variation are shown in Figure 6. SP is the set point of pressure, and ST is the set point of temperature.
Due to the large inertia of the temperature control, when a simple PID is used for the dynamic temperature control, in order to keep up with the change of the ST, PID parameters with a more significant proportional coefficient K p were used to speed up the rapid response. This caused the system’s stability to deteriorate. Then the temperature overshoot increased and led to oscillations of the steady-state control. The LPID controller can simultaneously consider the fast response and steady-state adjustment performance through gain schedule compared with the simple PID. The temperature control results show that the LPID controller gave a better performance than the PID controller by reducing the overshoot and eliminating oscillation and steady-state errors.
The simple PID temperature control in Figure 5 did not produce an overshoot, and the temperature oscillation was smaller than that in Figure 6. This is because the upper limit of the ST setting value in Figure 5 was relatively large. When the outlet temperature T 3 is close to the ST, the temperature control valve P V 3 is near the fully open state. When oscillation occurs, the temperature valve opening can only vary within a smaller range.
In this simulation model, the pressure control was not affected by temperature control. Compared with temperature control, the inertia of pressure control was smaller. The results displayed that the dynamic response and steady-state performance of the pressure control with PID controller were good, but there was a certain amount of overshoot in Figure 6. To avoid overshooting of pressure control, the LPID can also be appropriately used in the pressure control of the thermodynamic laboratory.

3. Experimental Work

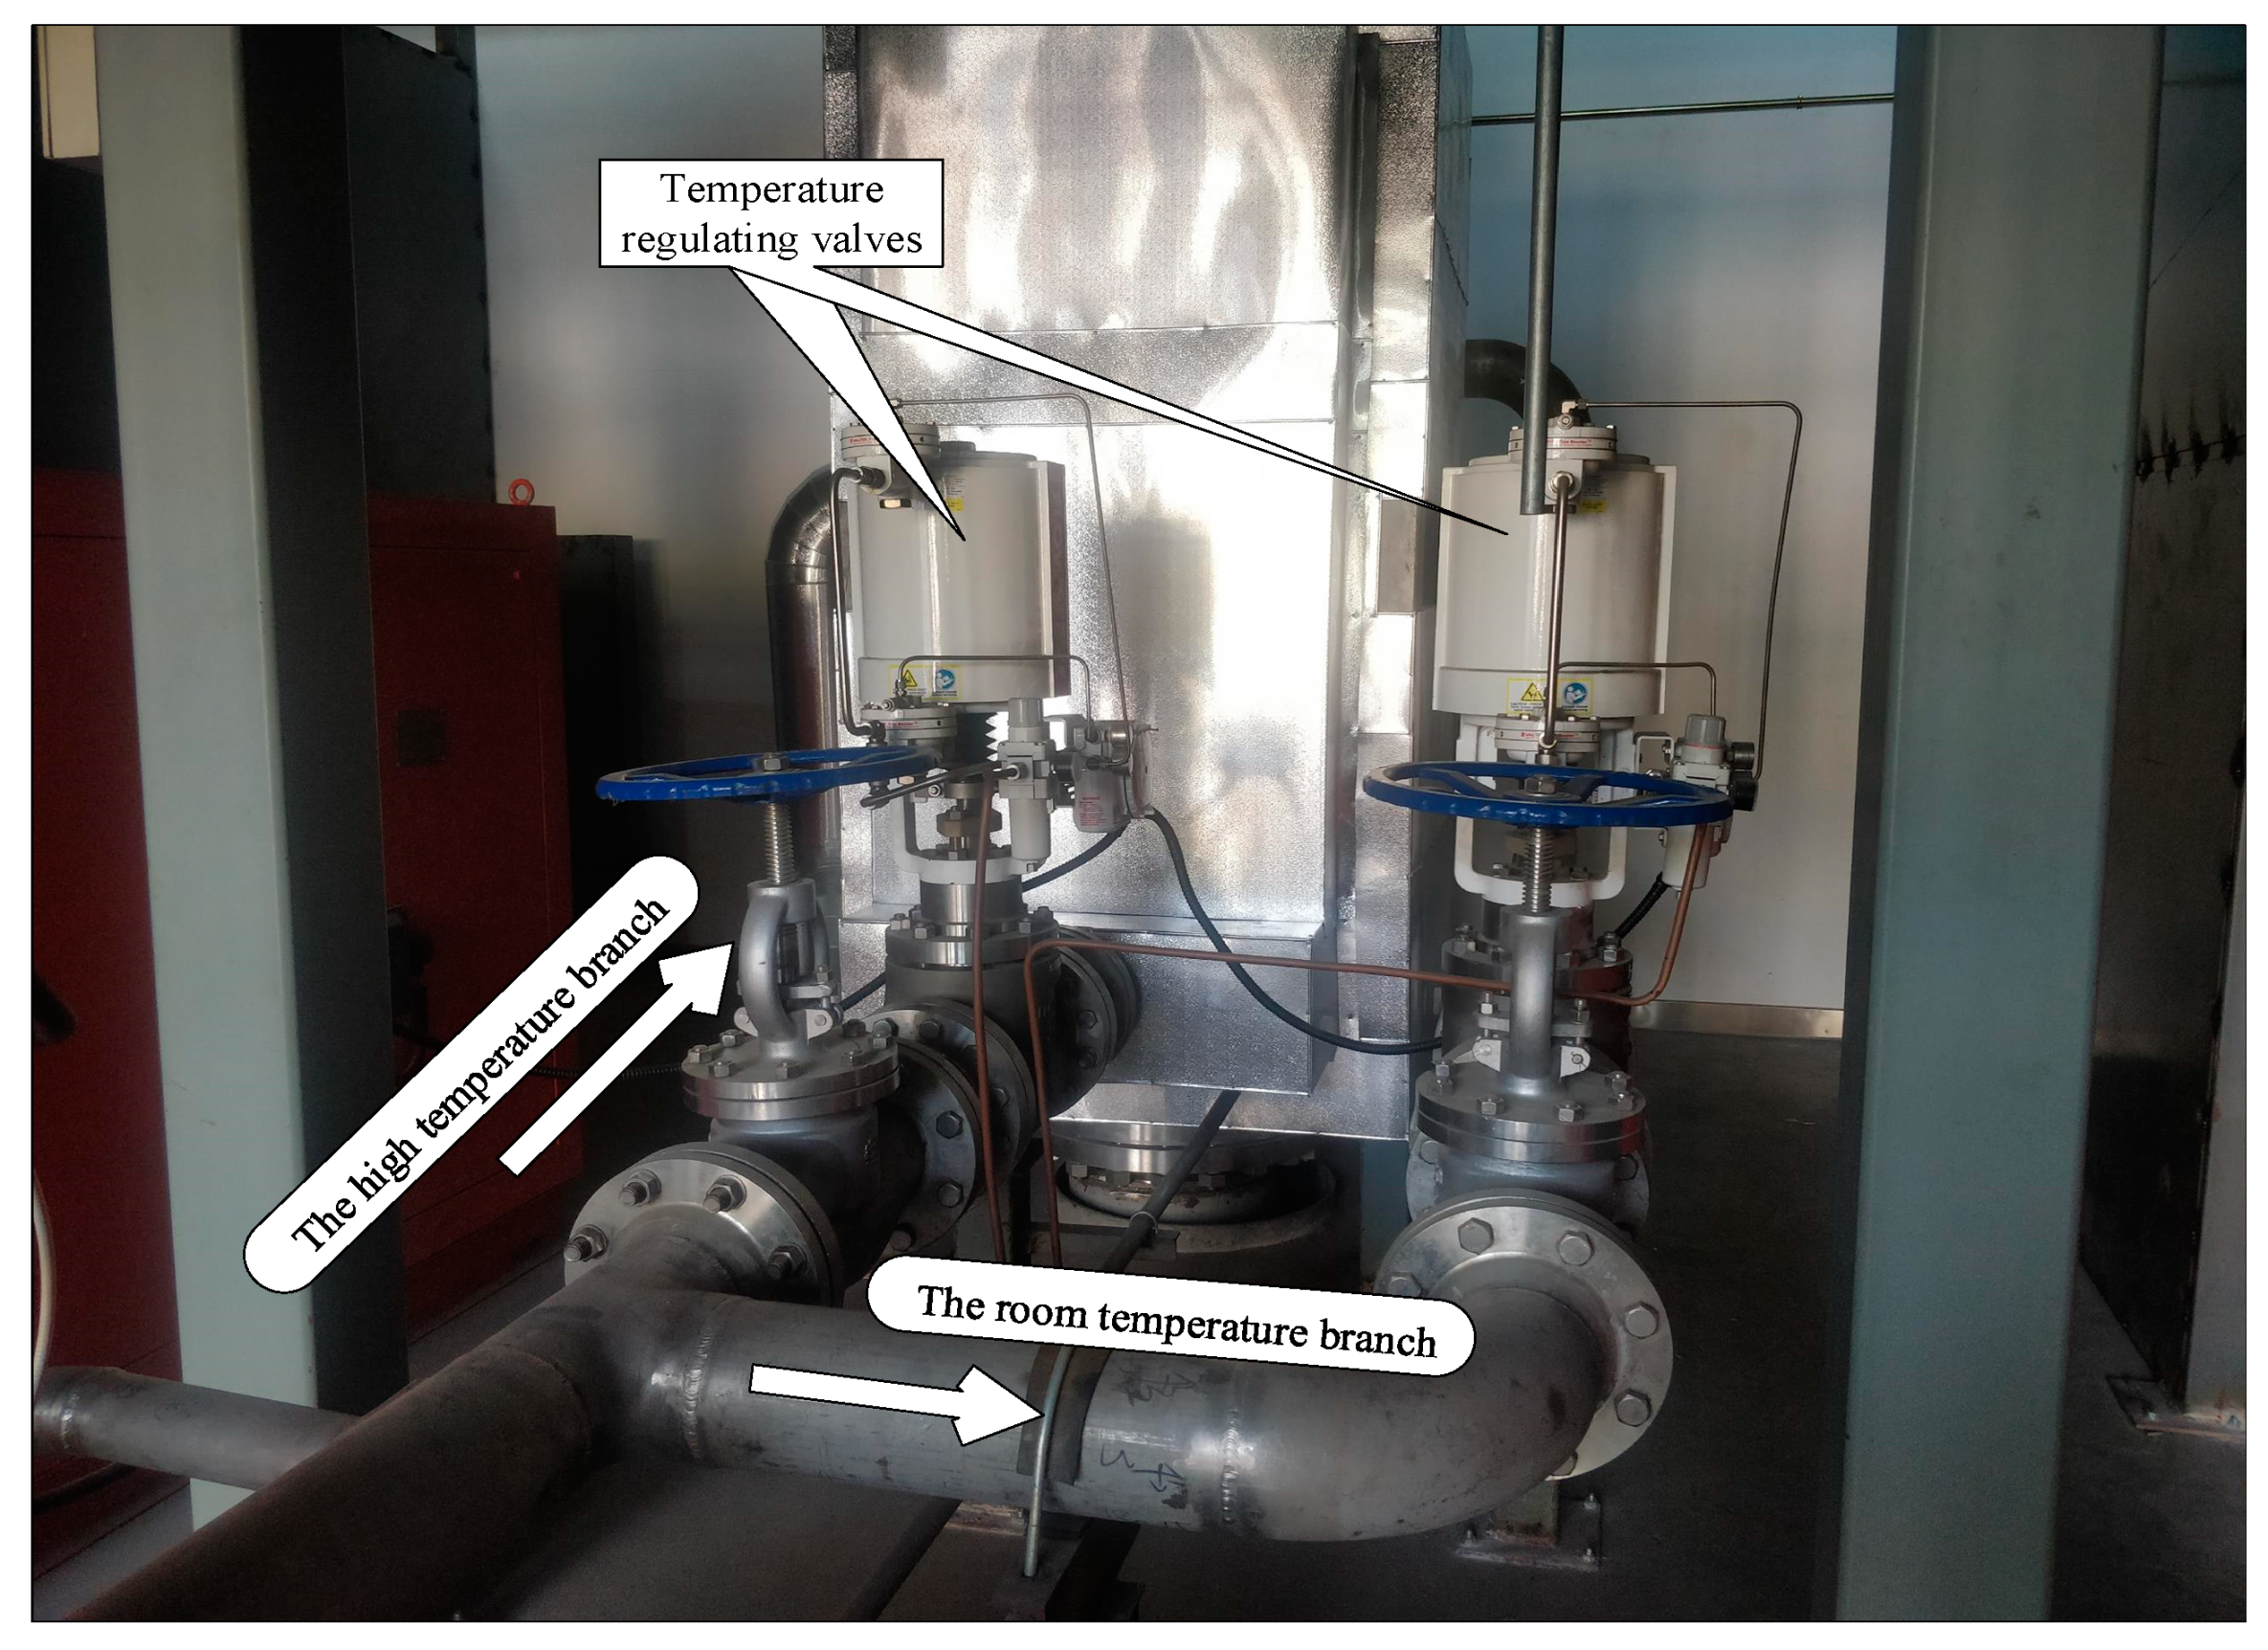
3.1. Overall Design of the TT&C System

The TT&C system of the thermodynamic laboratory is a typical distributed control system with the characteristics of centralized management and decentralized control. The structure diagram of the TT&C system of the thermodynamic laboratory is shown in Figure 7. The system is mainly divided into three parts. Firstly, the top layer is the master management layer. This layer comprises industrial control computers, which can realize real-time monitoring, display, recording. Then, the middle layer is the control layer, composed of industrial control computers and intelligent instruments to achieve temperature and pressure control. Finally, the lowest layer is the detection and execution layer, mainly composed of on-site actuators (valves, electric heaters, fan, etc.) and various sensors (temperature sensor, pressure sensor, mass flow sensor).
The laboratory equipment used the fast-response thermocouple with a sampling frequency of 200 Hz, and the measurement accuracy was better than ± 0.5%. The pressure sensor with a response time of 0.5 ms, the measurement accuracy was better than ±0.25%.
The real-time plant was interfaced with LabVIEW with the NI data acquisition card. The simulation results show that the LPID control performed well by reducing the peak overshoot and eliminating oscillation. This investigation applied the LPID controller to the control program, and the control program used Windows7 SP1/LabVIEW2015 SP1 as the development platform. In the debugging of the controller, the 4:1 attenuation curve method [24] with expert experiences was mainly used for debugging the PID parameters. The manual adjustment method was applied to adjust the control parameters.

3.2. Experimental Method

In the experiments, the thermodynamic laboratory equipment was used to supply the air stream with the same pressure and temperature as air stream extracted from the engine core of the aircraft. In the test, the ambient conditions that affected pressure and temperature control were the inlet pressure P 0 , the electric heater outlet temperature T 1 , the centrifugal fan air volume Q F and the resistance characteristics of the TAI/ECS test piece. We built two types of test equipment to provide two kinds of bleed air conditions for the ECS/TAI of aircraft: compressor bleed air and fan bleed air.
This paper performed dynamic bleed air tests on three different sets of TAI/ECS test pieces, respectively. Moreover, we selected multiple sets of specific parameters to verify the performance of the LPID controller. The operation parameters are listed in Table 1. These parameters basically covered the test requirements of existing TAI/ECS.
At the beginning of the test, the axial-flow fan and the electric heater were turned on first, and the fan frequency and electric heater outlet temperature were set according to the test requirements. Then, the ranges and change rates of temperature and pressure required for the test were set on the controller. Firstly, the optimized LPID controller maintained the temperature and pressure of the bleed air at the set minimum value. Secondly, the LPID controller increased the temperature and pressure at a constant rate. Finally, when reaching the set maximum value, the temperature and pressure tended to be stable.
In this paper, the dynamic test requirements of TAI/ECS required that the temperature and pressure control errors were within ±10% within the dynamic test time t t e s t .
t t e s t = S V m a x S V m i n S R
where S V m a x is the upper limit of the set value; S V m i n is the lower limit of the set value; S R is the rate of change.

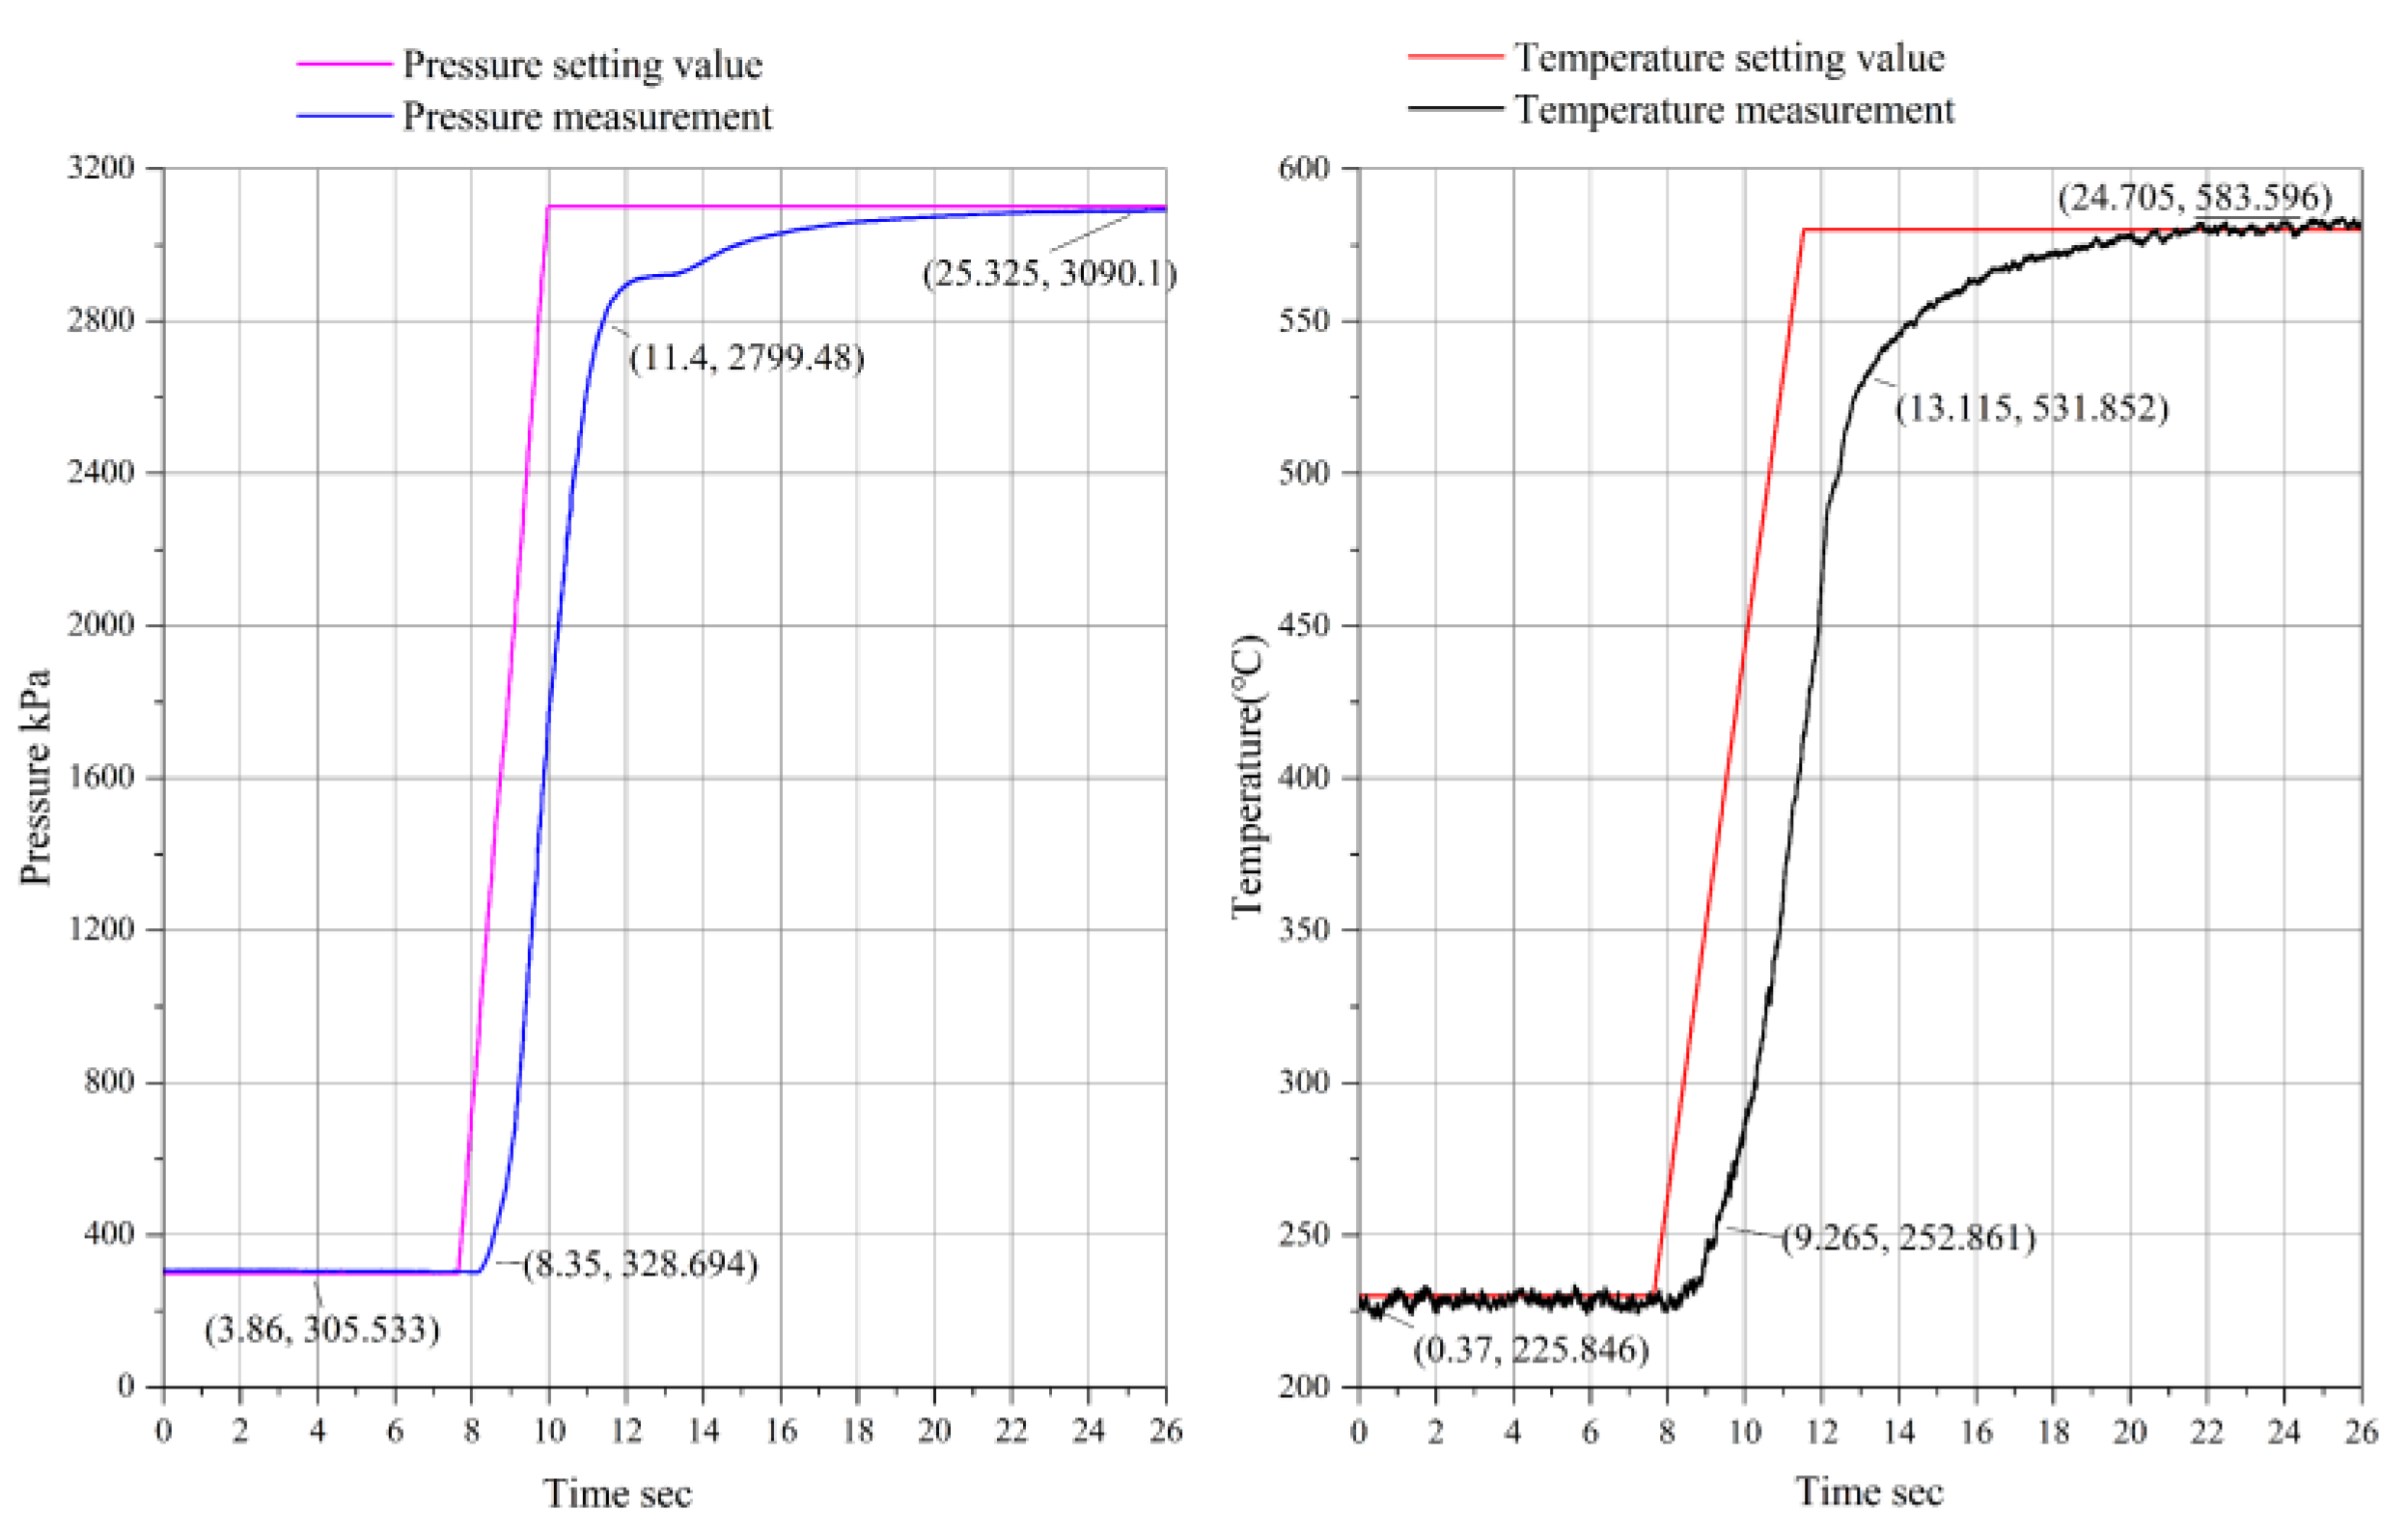
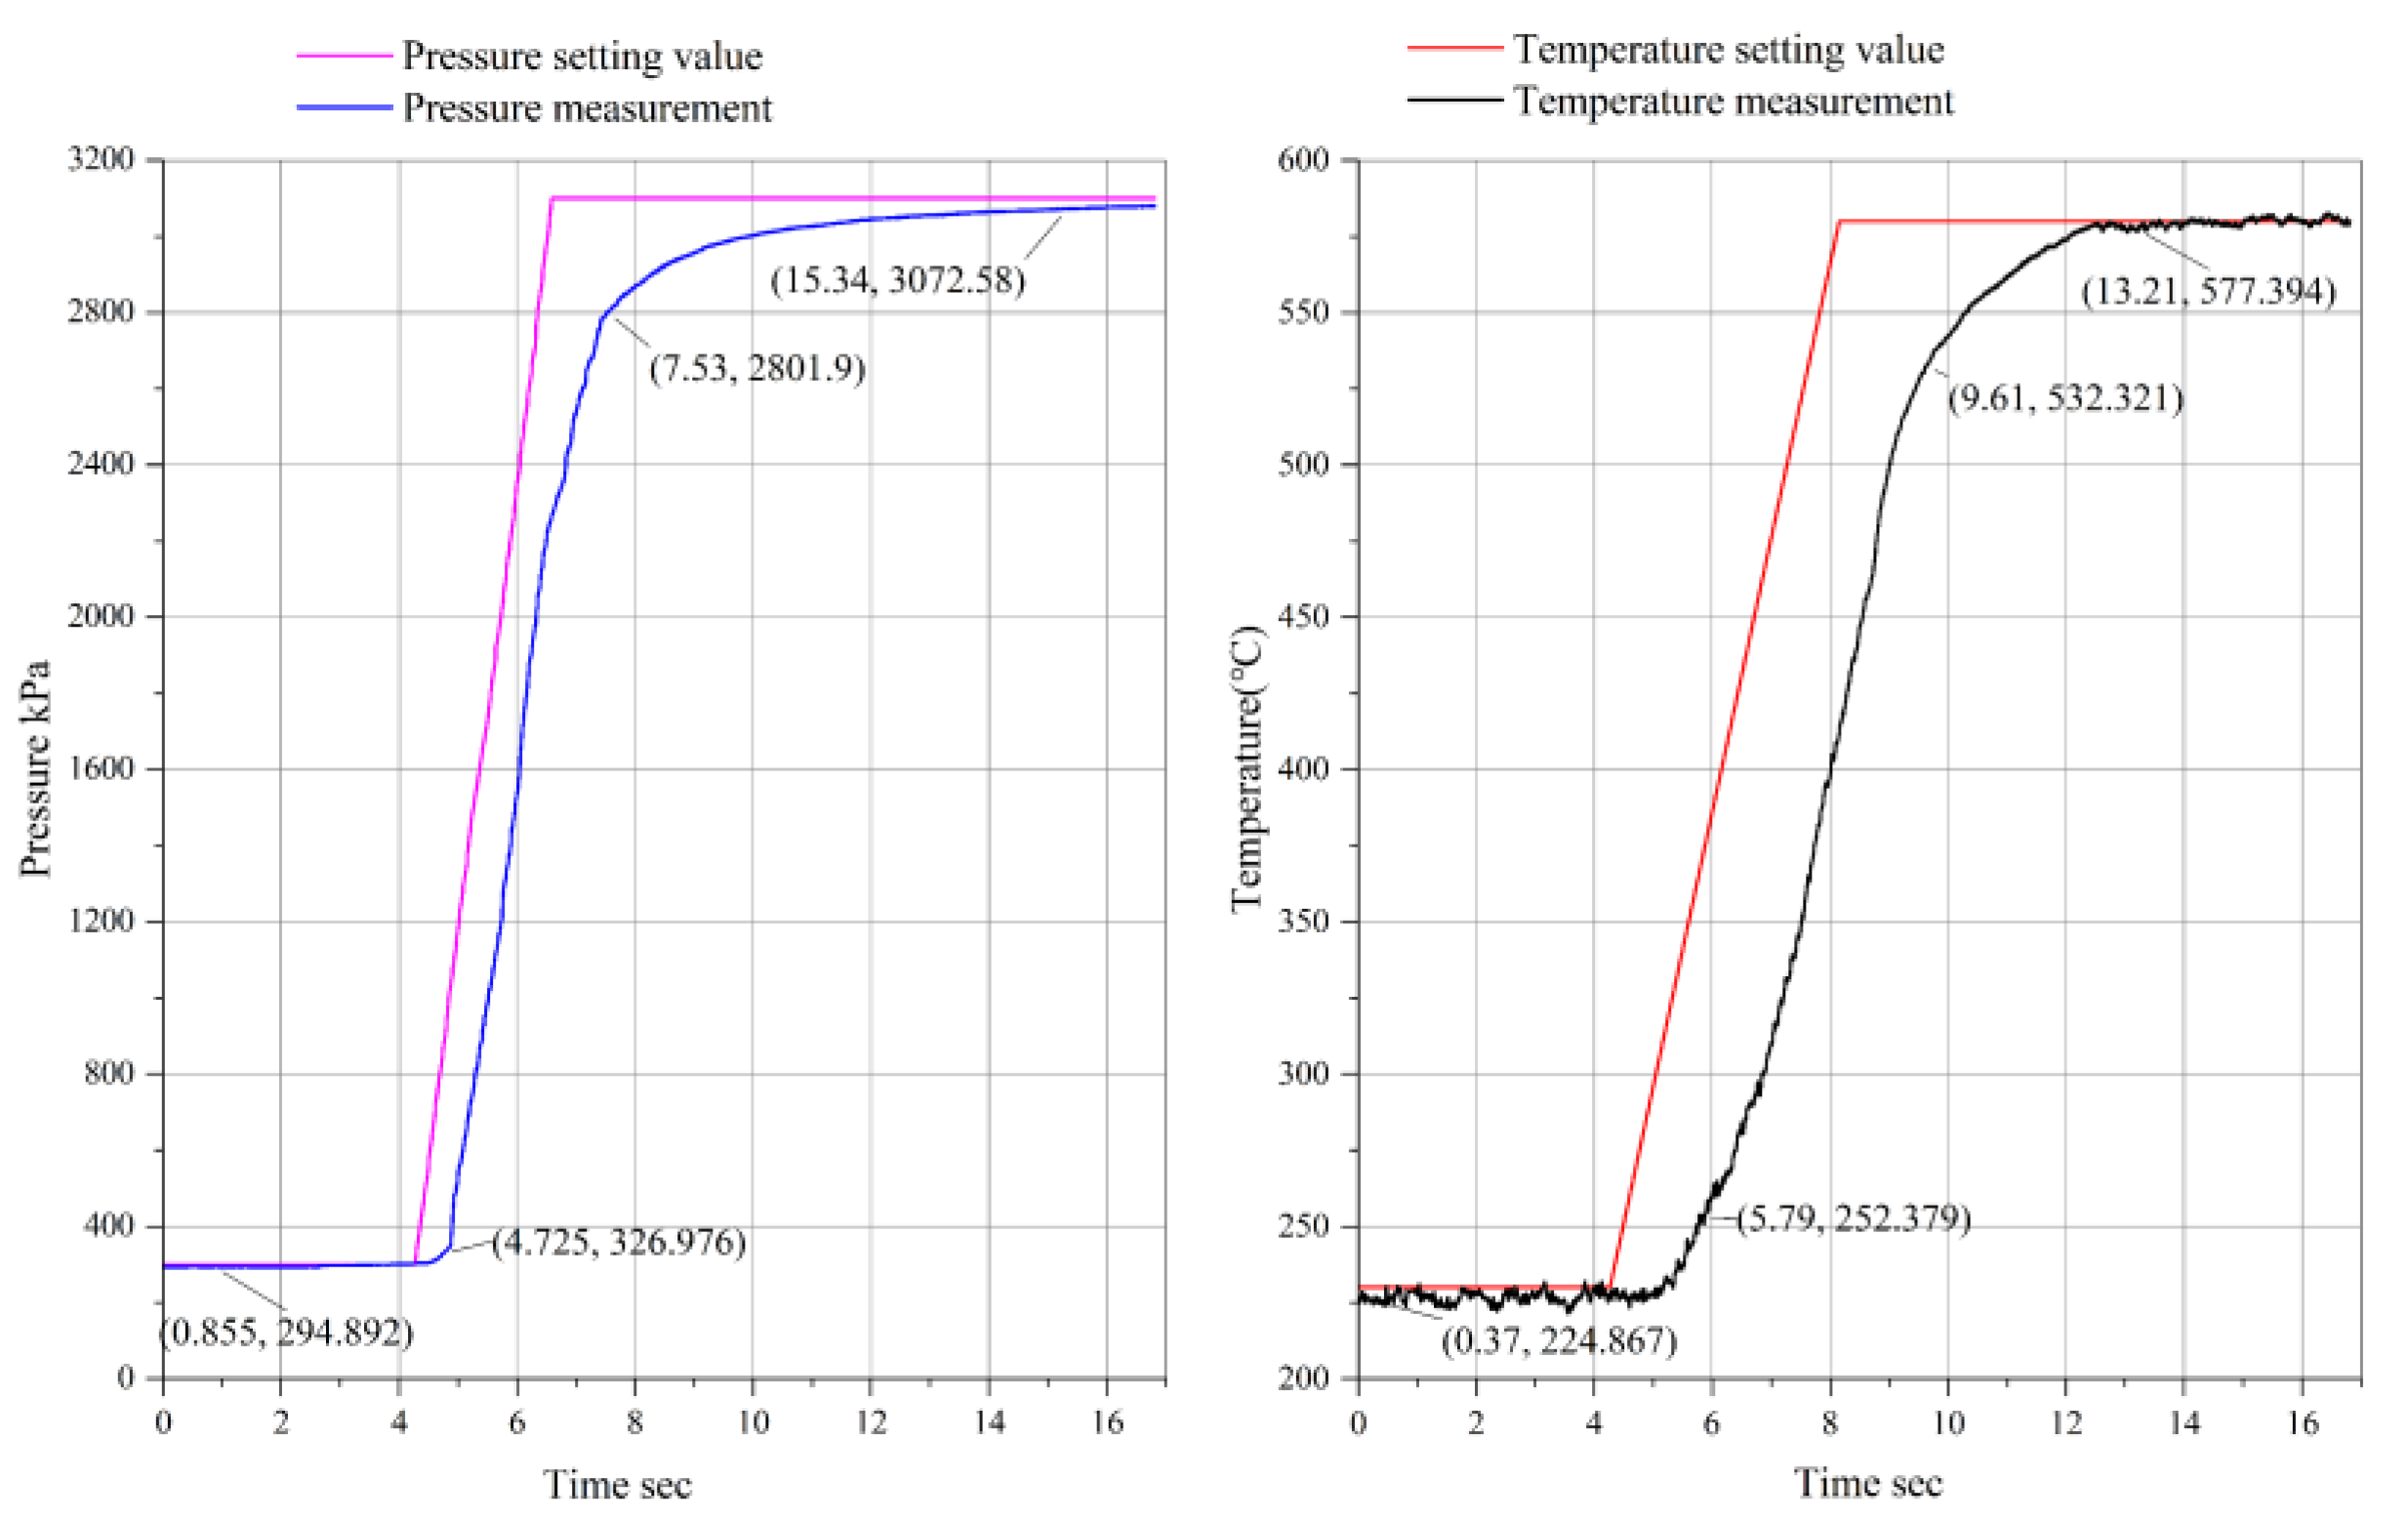
4. Results and Discussion

The performance of the laboratory equipment with LPID controllers was tested by setting various values of temperature and pressure and recording the system’s response through the data acquisition equipment. From the experimental data, the responses of the LPID controller to different rising slopes in various setting values are depicted in Figure 8, Figure 9, Figure 10, Figure 11 and Figure 12.
Figure 8 shows the variation of the compressor bleed air simulation test under the rise rates of 930 kPa/s and 90 °C/s. The pressure dynamic test time was about 3.11 s, and the temperature dynamic test time was about 3.89 s. As shown in Figure 8, the pressure rose from 328.694 kPa to 2799.48 kPa. Compared with the set value of 300–3100 kPa, the dynamic test error was controlled within 10%. The temperature rose from 252.861 °C to 531.852 °C. Compared with the set value of 230–580 °C, the error could also be controlled within 10%. Moreover, the steady-state errors of temperature and pressure were within ±2%. The results of Figure 9, Figure 10, Figure 11 and Figure 12 show that the temperature and pressure dynamic tests errors were within 10%, and the steady-state accuracies were within ±2%, which met the TAI/ECS dynamic test requirements.
Comparing the results of Figure 8 and Figure 11, it can be seen that under the condition of ensuring sufficient test conditions ( P 0 3500   kPa ,   T 1 650   ° C ), the test results of different test pieces show that the pressure and temperature control were different due to the test pieces’ resistance characteristics, but the changing trend was the same. Moreover, both the dynamic error and steady-state error were within the required range. The results show that the repeatability of the test was acceptable.
It can be seen from the results that the system structure designed in this paper has reduced the coupling effect on temperature control and pressure control. However, as shown in Figure 9, the temperature suddenly dropped when the pressure rose. The main reason for this phenomenon is that when the initial set temperature value is low, the opening of the valve in the high-temperature branch is low at the time. When the valve is at a low opening, the valve’s mass flow characteristic is seriously non-linear, so the sudden increase in mass flow has a more significant impact on temperature.
In addition, as shown in Figure 10, the temperature control could not eliminate the steady-state error before reaching the maximum value. The specific reason is that the control valve opening at this time reached more than 95%, the valve’s response to the input was prolonged, and the control entered the dead zone. Therefore, the outlet temperature of the electric heater should be increased reasonably in the test to prevent the temperature control valve from entering the dead control zone.
Figure 12 shows that when the equipment is running in a low state, it can also meet the test accuracy requirements.

5. Conclusions

In this study, with the help of the theoretical model of the thermodynamic laboratory equipment, the pressure and the temperature change were controlled with the same control organs in simulation software, and then compared the performance difference between the PID controller and LPID controller in temperature control. The simulation results showed that the LPID controller gave a better performance than the PID controller.
Obviously, we applied the LPID controller to the temperature and pressure control program of the laboratory equipment. Moreover, the dynamic response and steady-state control performance of the LPID controller were verified through specific experiments.
The test results demonstrate that:
(1)
The test results were consistent with the simulation results, which shows the effectiveness of the LPID controller;
(2)
The temperature and pressure dynamic tests errors were within 10%, and the steady-state accuracies were within ±2%. The pressure and temperature control had a high precision and a low overshoot amount, and the dynamic response and stability had a high control performance;
(3)
The laboratory with the LPID controller can create a thermal environment with a vast range of pressure and temperature variation. Moreover, the temperature and pressure change rate can be selected in a wide range;
(4)
Under sufficient test conditions, the repeatability of the tests is acceptable, and dynamic and steady-state tests can be performed on different TAI/ECS test pieces.
In conclusion, the LPID controller can not only control the temperature and pressure at the steady state but can also raise the temperature and pressure by a given slope efficiently. Compared with the conventional thermodynamic laboratory equipment, which can only test the steady-state performance of the TAI/ECS, the proposed system can effectively test various TAI/ECSs at the entire flight envelope creatively. It provides strong support for the development of the TAI/ECS on new models of aircraft.

Author Contributions

Conceptualization, J.W.; System design, M.L.; Data curation, Y.Z.; Formal analysis, Y.Z.; Methodology, Y.Z.; Resources, M.L.; Software, H.W.; Supervision, M.L.; Validation, Y.Z.; Experiment, Y.Z. All authors have read and agreed to the published version of the manuscript.

Funding

This research received no external funding.

Data Availability Statement

The data presented in this study are available on request from the corresponding author. All data are calculated by the author and have been included in this paper.

Conflicts of Interest

No conflict of interest exists in the submission of this manuscript, and the manuscript is approved by all authors for publication. I would like to declare on behalf of my co-authors that the work described was original research that has not been published previously, and not under consideration for publication elsewhere, in whole or in part. All the authors listed have approved the manuscript that is enclosed.

References

  1. Reddy, P.K.P. Environmental control system of military aircraft, LCA. Int. J. Eng. 2013, 6, 635–642. [Google Scholar]
  2. Cao, Y.; Tan, W.; Wu, Z. Aircraft icing: An ongoing threat to aviation safety. Aerosp. Sci. Technol. 2018, 75, 353–385. [Google Scholar] [CrossRef]
  3. Bagshaw, M.; Illig, P. The Aircraft Cabin Environment. In Travel Medicine; Elsevier: Amsterdam, The Netherlands, 2019; pp. 429–436. [Google Scholar]
  4. Dai, Z.; Cui, Y. Study on the Fast Air Heating Method for the Rig of the Environmental Control System of the Aircraft. J. Phys. Conf. Ser. 2018, 1060, 012072. [Google Scholar] [CrossRef]
  5. Cui, Y. Study on the Simulink Model for the Rig of the Environmental Control System of the Aircraft. J. Phys. Conf. Ser. 2018, 1060, 012073. [Google Scholar] [CrossRef] [Green Version]
  6. Jian, W.; Xue, L.-X. Design of engine bleed air simulation test bench temperature control system based on humanoid intelligence. In Proceedings of the CSAA/IET International Conference on Aircraft Utility Systems (AUS 2018), Guiyang, China, 19–22 June 2018; IET: London, UK, 2018. [Google Scholar]
  7. Zhao, H.; Hou, Y.; Zhu, Y.; Chen, L.; Chen, S. Experimental study on the performance of an aircraft environmental control system. Appl. Therm. Eng. 2009, 29, 3284–3288. [Google Scholar] [CrossRef]
  8. Şahin, Y.; Göçer, A. Control of air flow temperature and pressure in the pipelines with PID. Int. Rev. Appl. Sci. Eng. 2020, 11, 167–173. [Google Scholar] [CrossRef]
  9. Liu, H.; Lee, J.-C.; Li, B.-R. High precision pressure control of a pneumatic chamber using a hybrid fuzzy PID controller. Int. J. Precis. Eng. Manuf. 2007, 8, 8–13. [Google Scholar]
  10. Dequan, S.; Guili, G.; Zhiwei, G.; Peng, X. Application of Expert Fuzzy PID Method for Temperature Control of Heating Furnace. Procedia Eng. 2012, 29, 257–261. [Google Scholar] [CrossRef]
  11. Singhala, P.; Dhrumil, S.; Bhavikkumar, P. Temperature control using fuzzy logic. arXiv 2014, arXiv:1402.3654. [Google Scholar]
  12. Khalid, M.; Omatu, S. A neural network controller for a temperature control system. IEEE Control Syst. 1992, 12, 58–64. [Google Scholar]
  13. Yu, L.; Lim, J.G.; Fei, S. An improved single neuron self-adaptive PID control scheme of superheated steam temperature control system. Int. J. Syst. Control Inf. Process. 2017, 2, 1–13. [Google Scholar] [CrossRef]
  14. Wang, G.Y.; Han, P.; Wang, D.F.; Zhou, L.H. Studies andof PFC-PID cascade control strategy in main steam temperature control system. Proc. CSEE 2002, 12, 011. [Google Scholar]
  15. Zhang, J.; Zhang, F.; Ren, M.; Hou, G.; Fang, F. Cascade control of superheated steam temperature with neuro-PID controller. ISA Trans. 2012, 51, 778–785. [Google Scholar] [CrossRef] [PubMed]
  16. Chew, I.M.; Wong, F.; Bono, A.; Nandong, J.; Wong, K.I. Genetic algorithm optimization analysis for temperature control system using cascade control loop model. Int. J. Comput. Digit. Syst. 2020, 9, 119–128. [Google Scholar]
  17. Kodosky, J. LabVIEW. In Proceedings of the ACM on Programming Languages 4.HOPL (2020), London, UK, 14–16 June 2020; pp. 1–54. [Google Scholar]
  18. Hodal, P.; Liu, G. Bleed air temperature regulation system: Modeling, control, and simulation. In Proceedings of the 2005 IEEE Conference on Control Applications, Toronto, ON, Canada, 28–31 August 2005. [Google Scholar]
  19. Cui, G.M.; Wang, J.Y.; Jiang, T.; Hu, X.B. Transfer Behavior of Heat Exchanger. In Advanced Materials Research; Trans Tech Publications Ltd.: Freienbach, Switzerland, 2011; Volume 233. [Google Scholar]
  20. Yin, J.; Jensen, M.K. Analytic model for transient heat exchanger response. Int. J. Heat Mass Transf. 2003, 46, 3255–3264. [Google Scholar] [CrossRef]
  21. Youn, C.; Saito, K.; Furuya, M. Simulation of Dynamic Characteristics of Pneumatic Control Valve with Smart Valve Positioner. In Fluids Engineering Division Summer Meeting; American Society of Mechanical Engineers: New York, NY, USA, 2019; Volume 59049. [Google Scholar]
  22. Bequette, B.W. Process Control: Modeling, Design, and Simulation; Prentice Hall Professional: Hoboken, NJ, USA, 2003. [Google Scholar]
  23. Lei, Z.; Jing, Z. Implement of Increment-model PID Control of PLC in Constant-pressure Water System. In Proceedings of the 2007 8th International Conference on Electronic Measurement and Instruments, Xi’an, China, 16–18 August 2007. [Google Scholar]
  24. Shahrokhi, M.; Alireza, Z. Comparison of PID Controller Tuning Methods; Department of Chemical & Petroleum Engineering Sharif University of Technology: Tehran, Iran, 2013; pp. 1–2. [Google Scholar]
Figure 1. System flow chart of the laboratory equipment.
Aerospace 08 00367 g001
Figure 2. The temperature control components.
Aerospace 08 00367 g002
Figure 3. Schematic diagram of the LPID.
Aerospace 08 00367 g003
Figure 4. Simulation model diagram of the system.
Aerospace 08 00367 g004
Figure 5. Dynamic response simulation with the PID and LPID controllers of (a) a huge range of pressure variation; (b) a huge range of temperature variation.
Aerospace 08 00367 g005
Figure 6. Dynamic response simulation with the PID and LPID controllers of (a) a low range of pressure variation; (b) a low range of temperature variation.
Aerospace 08 00367 g006
Figure 7. Structure diagram of the TT&C system.
Aerospace 08 00367 g007
Figure 8. Compressor bleed air simulation of test piece one under the rise rates of 900 kPa/s and 90 °C/s.
Aerospace 08 00367 g008
Figure 9. Compressor bleed air simulation of test piece one under the rise rates of 480 kPa/s and 55 °C/s.
Aerospace 08 00367 g009
Figure 10. Compressor bleed air simulation of test piece one under the rise rates of 50 kPa/s and 5 °C/s.
Aerospace 08 00367 g010
Figure 11. Compressor bleed air simulation of test piece two under the rise rates of 900 kPa/s and 90 °C/s.
Aerospace 08 00367 g011
Figure 12. Fan bleed air simulation under the rise rates of 10 kPa/s and 20 °C/s.
Aerospace 08 00367 g012
Table 1. The dynamic test parameters of the engine bleed air simulation.
VariablesTest Equipment 1: Compressor Bleed AirTest Equipment 2: Fan Bleed Air
Conditions Test   piece   one ,   P 0 3500   kPa ,   T 1   = 650 °C Test   piece   two ,   P 0 3500   kPa ,   T 1   = 650 °C Test   piece   three   &   P 0 1000   kPa ,   T 1   = 200 °C
Pressure range (kPa)300–3100250–1400300–3100300–3100105–220
Pressure variation ratio (kPa/s)9004805090010
Temperature range (°C)230–580150–480230–580230–58040–115
Temperature variation ratio (°C/s)905559020
Publisher’s Note: MDPI stays neutral with regard to jurisdictional claims in published maps and institutional affiliations.

