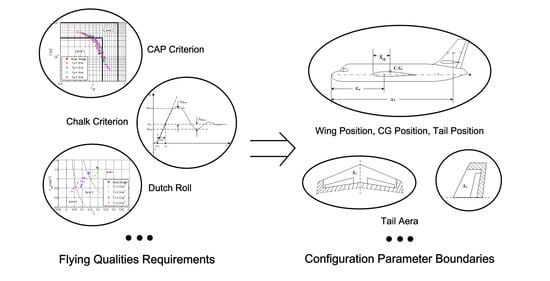
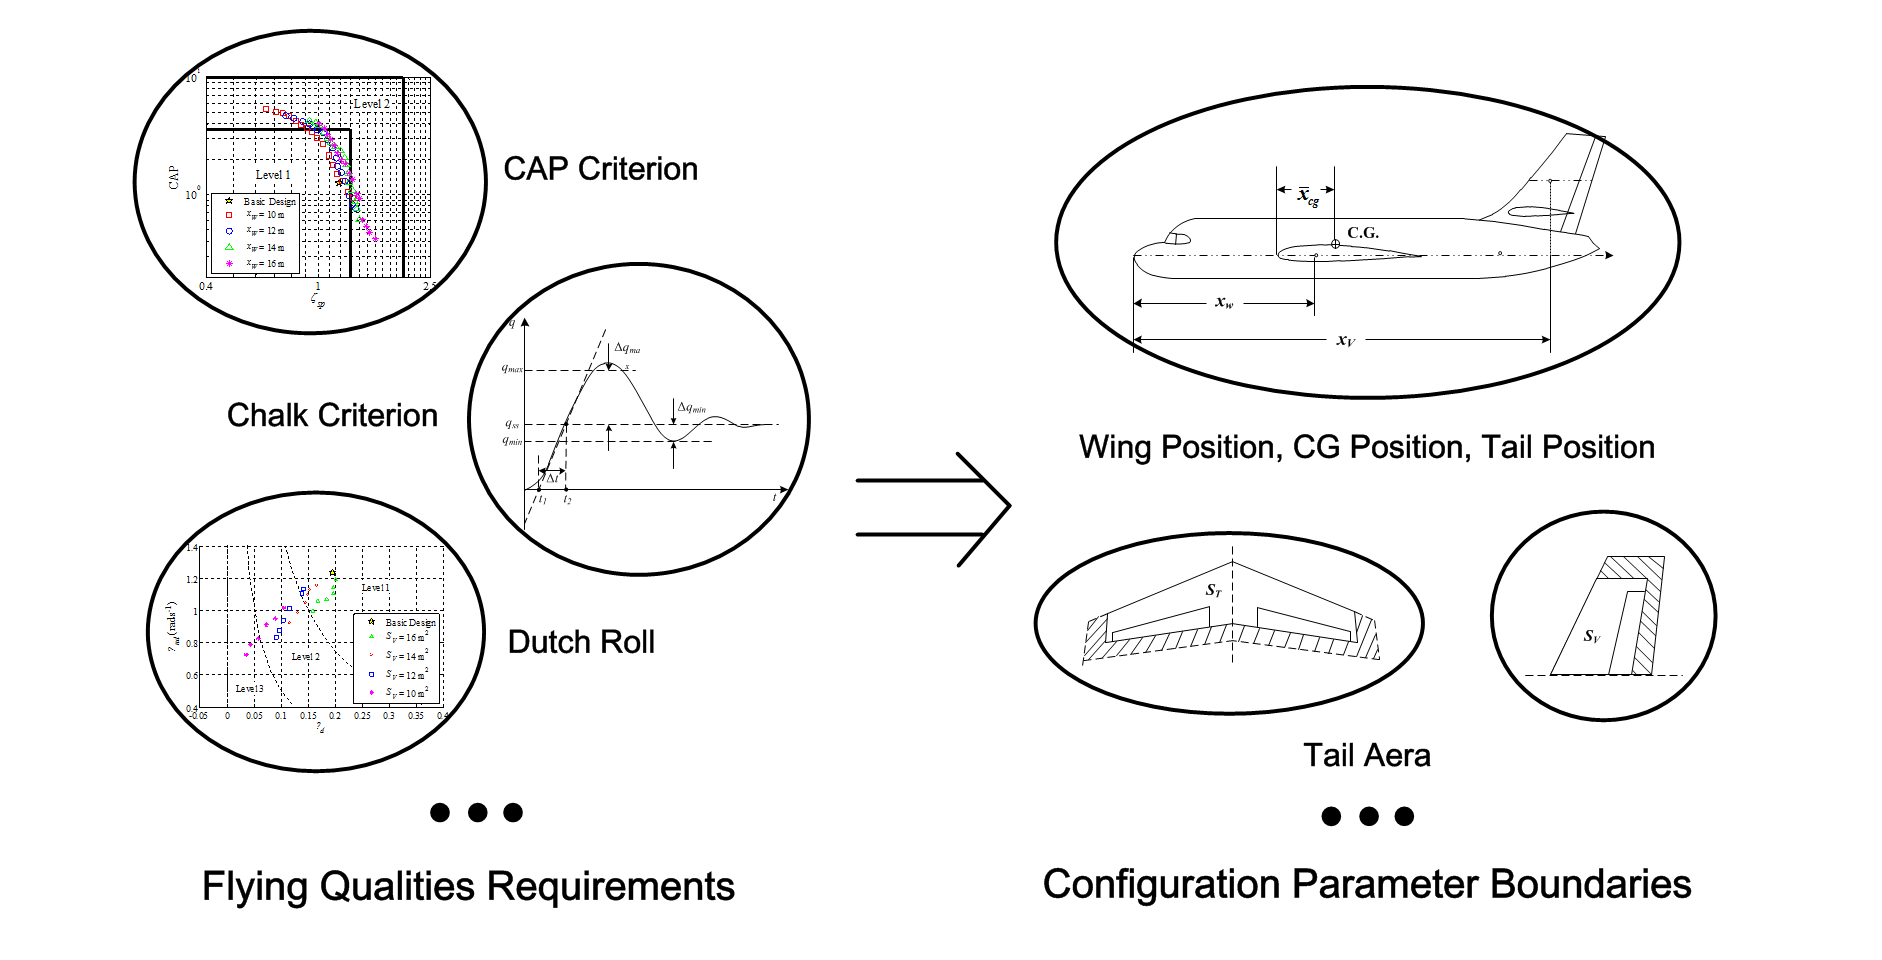
5.1. Boundaries of the Wing Position and Horizontal Tail Area
For the sample aircraft, the forward CG limit appears in the take-off phase (sea-level, low-speed, forward CG position, maximum take-off weight, maximum thrust, flaps and landing gear retracted), while the rearward CG limit appears in the landing phase (sea-level, low-speed, rearward CG position, minimum landing weight, landing engine setting, flaps and landing gear down). According to the previous discussion, the forward range of and the minimum limit of should be designed by evaluating the flying qualities in landing phase according to the most stringent requirement among the upper boundary of the CAP value, the lower boundary of , and the Chalk criterion. Likewise, the rearward range of and the maximum limit of should be designed in take-off phase according to the most stringent requirement among the lower boundary of the CAP value, the upper boundary of and the Chalk criterion.
Preliminary sizing requires that the CG position is on the MAC of the wing; thus, the first estimate of ranges from 10 m to 16 m. Then, according to the requirements of the longitudinal Level 1 FQ of closed-loop aircraft, the design range of corresponding to different is determined. Since the rearward range of and the maximum limit of both reflect the maneuverability requirements, the upper boundary of corresponding to different can also be regarded as the rearward boundary corresponding to different . Similarly, the lower boundary of corresponding to different can also be regarded as the forward boundary of corresponding to different . The design range of is determined by the design range of .
The variation series of
is established as follows: within the preliminary range from 10 m to 16 m, one point is selected every 1 m, yielding seven points in total. For each
, a series of
with an interval of 2 m
2 is selected. Then, the CAP criterion is applied to evaluate the flying qualities of aircraft with different
–
combinations in the take-off phase. Partial evaluation results with
values of 10 m, 12 m, 14 m, and 16 m are shown in
Figure 5. The CAP criterion characteristics with
values of 12 m and 14 m are shown in
Table 3.
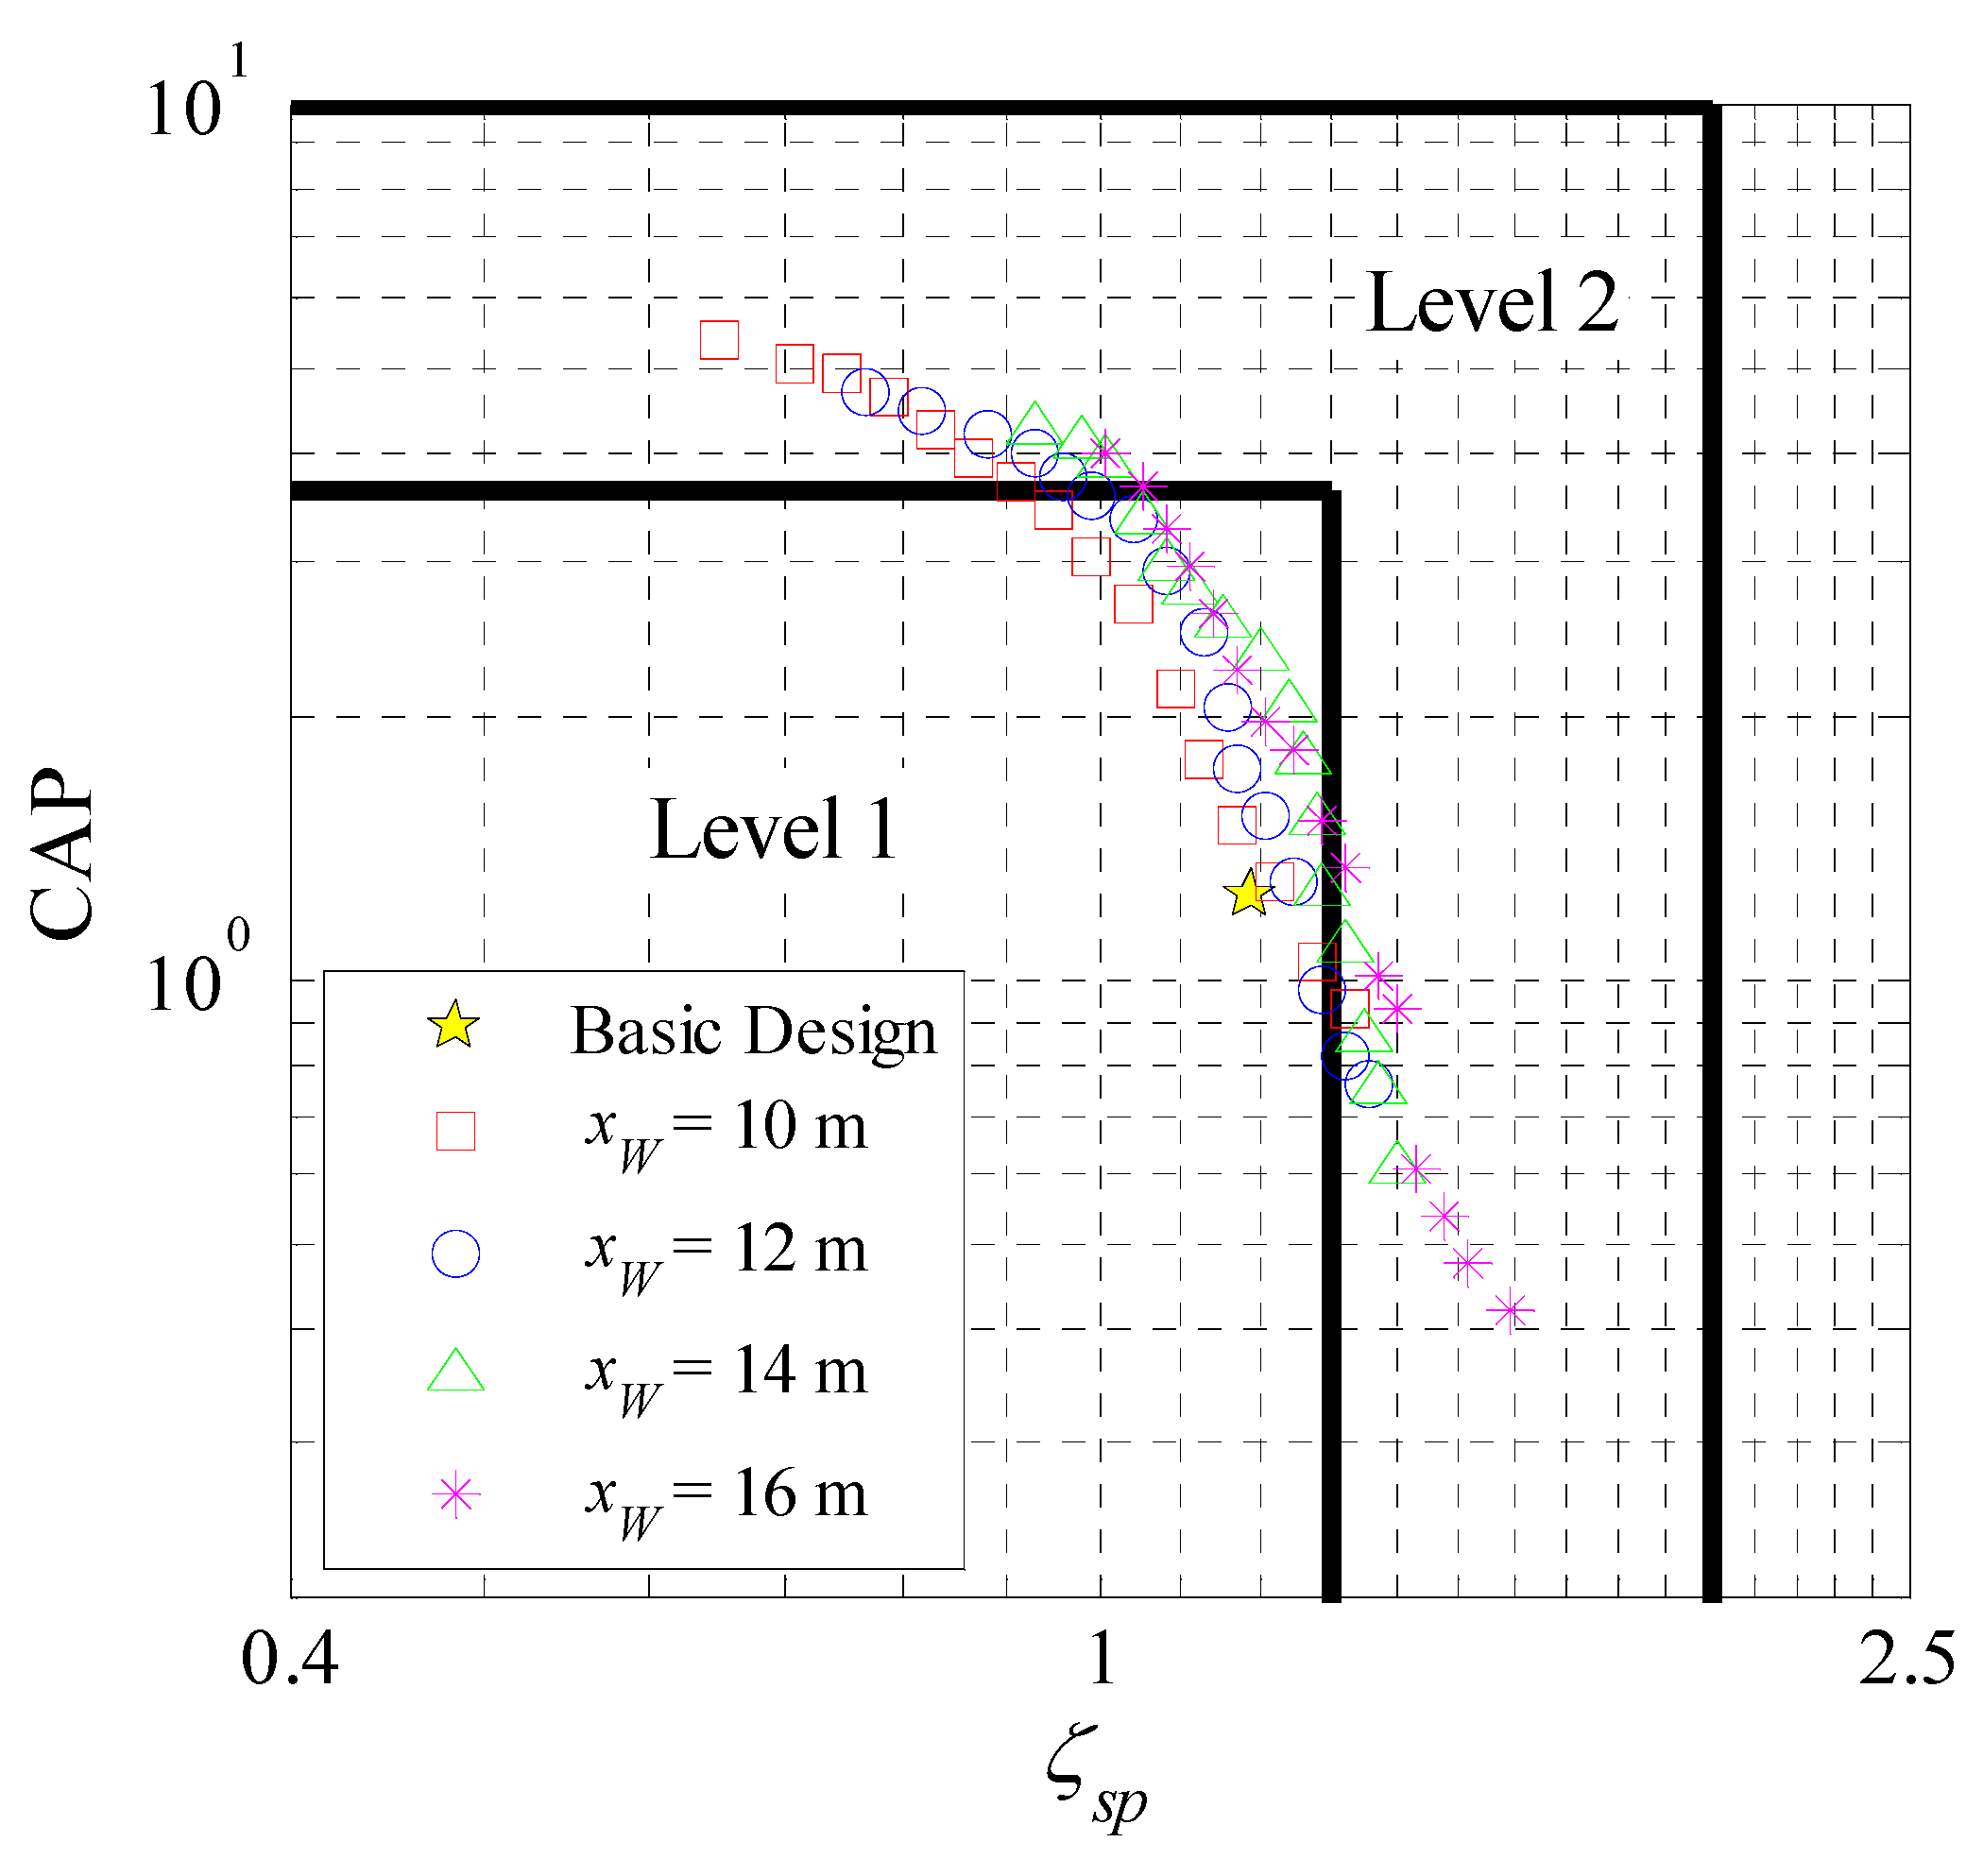
For a certain , the CAP value decreases gradually with increasing , and the damping ratio increases. The maximum limit of defined by the CAP criterion is the critical value that leads to the degradation of the flying qualities to Level 2. When is set to 12 m and 14 m, the corresponding maximum limit of is 36 m2 and 32 m2, respectively. Hence, as the wing position moves rearward, the maximum limit of gradually decreases.
According to all the above evaluation results, the level boundaries of the
–
combination defined by the CAP criterion in take-off phase are presented in
Figure 6. According to this figure, to ensure the Level 1 FQ of the CAP criterion, when
is set as 10 m, the corresponding design range of
is from 24 m
2 to 38 m
2; when
is set as 16 m, the
design range is from 14 m
2 to 26 m
2. The right boundary of Level 1 in
Figure 6 determines the maximum limit of
corresponding to different
, and the rearward range of
corresponding to different
.
The Chalk criterion is also applied to evaluate the flying qualities in the take-off phase.
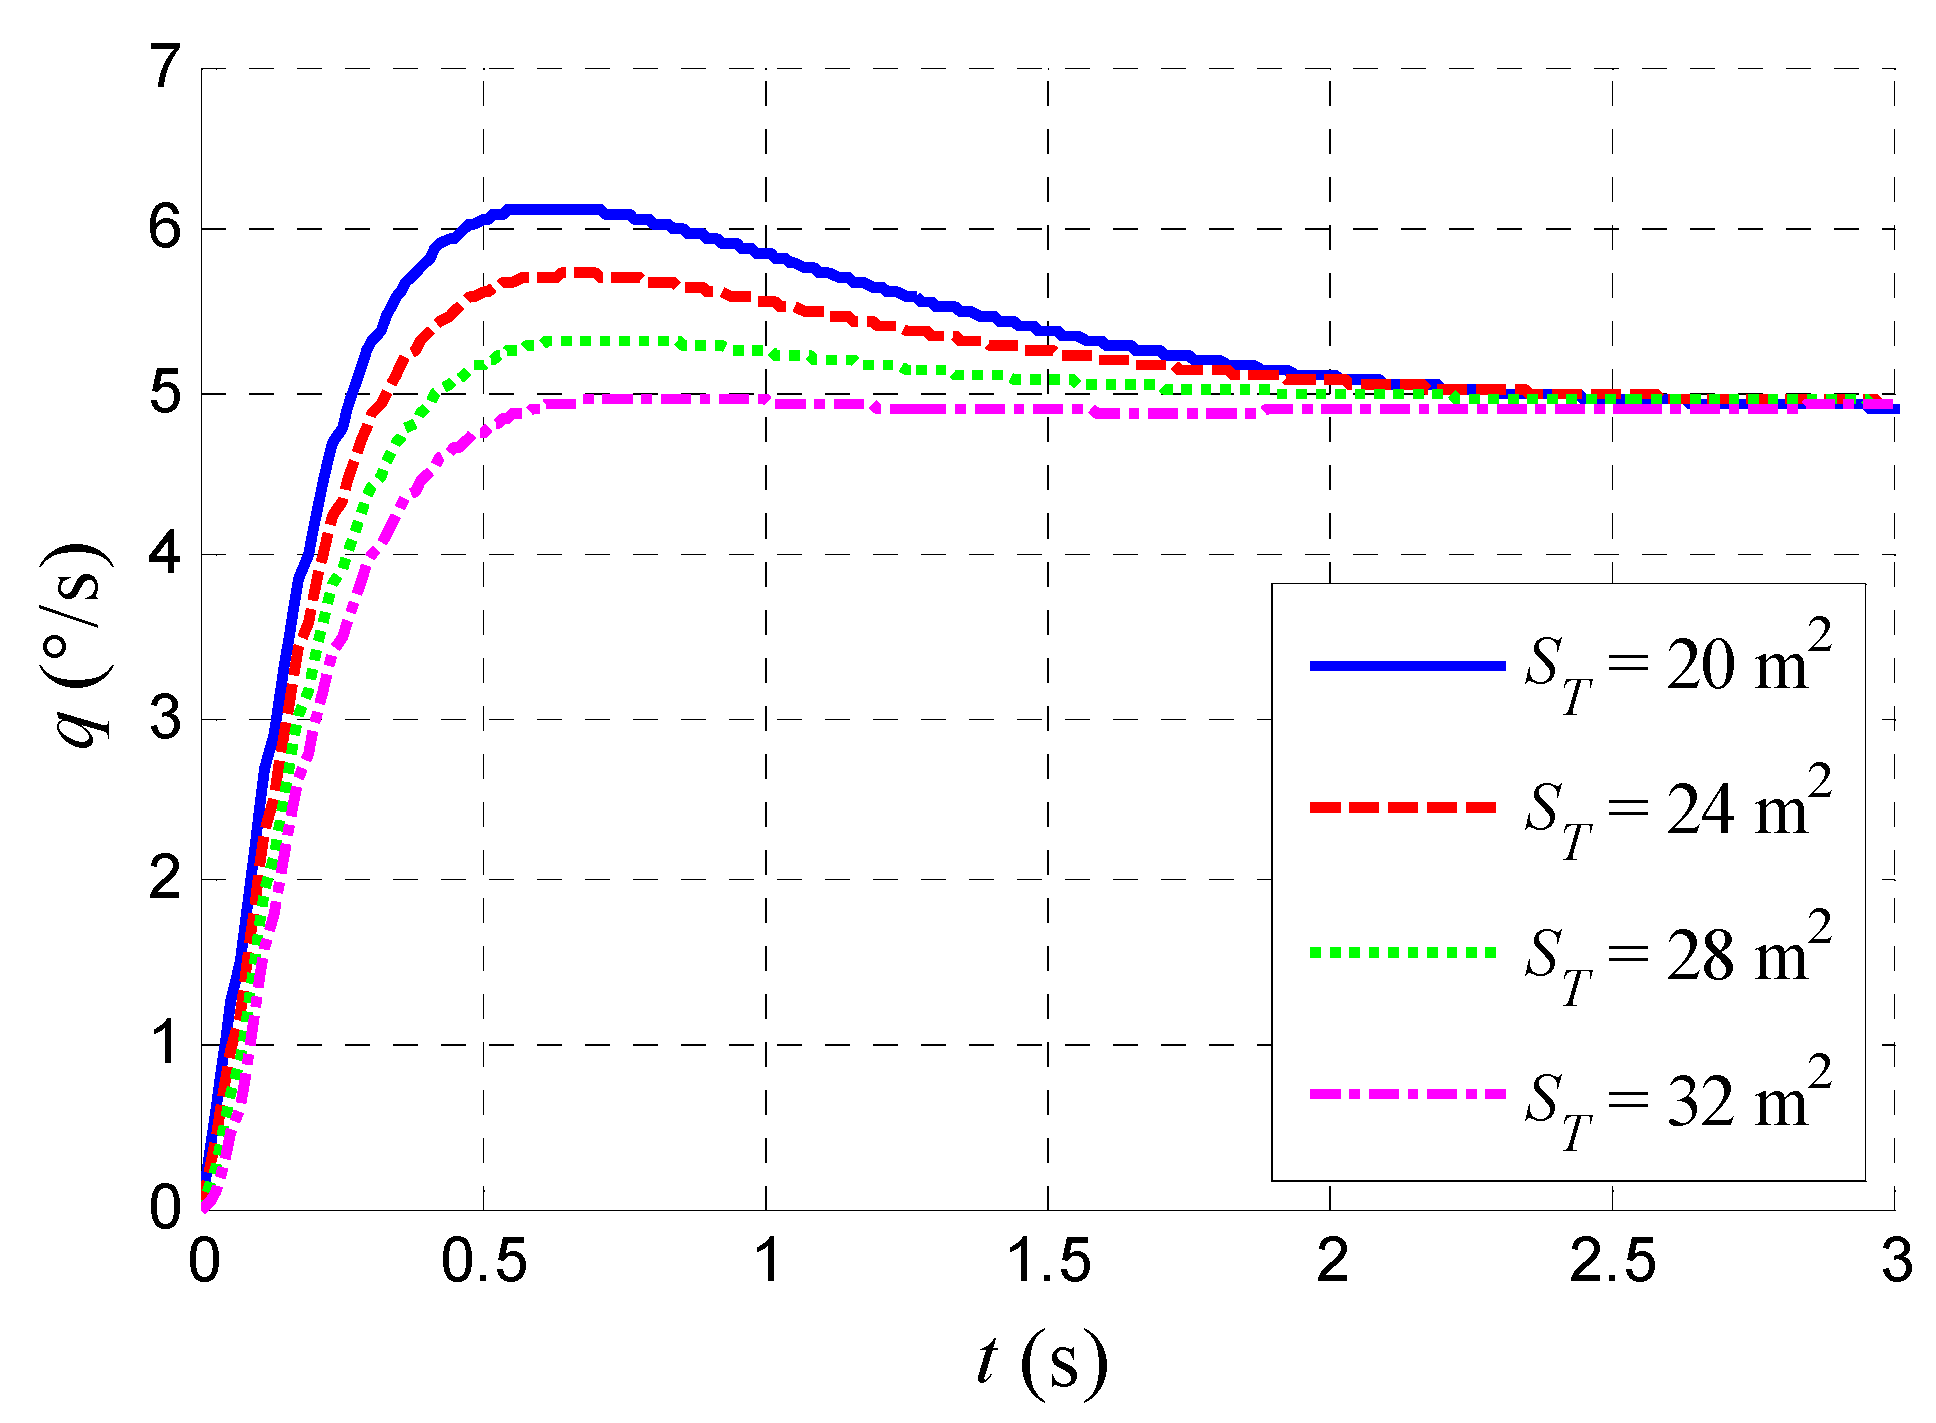
Figure 7 shows the influence of changing
on the pitch rate response with
= 12 m. The variations in the tail area exert the main influences on the response peak and response speed of the pitch rate. As
increases, the response peak decreases, and the response time delay increases. The influence of the rearward displacement of the wing is similar to that of changing
, which means that decreasing
will reduce both the response peak and the response speed.
Among all Chalk criterion parameters, the effective time delay
is the most affected by the variations in and
. The evaluation results of
are shown in
Table 4. The transient peak ratio
and the effective rise time
are also affected, but the FQ Level is not degraded. With the rearward movement of the wing and an increase in the tail area, the
of the pitch response increases, which indicates poor maneuverability. The FQ Level is degraded to Level 2 (0.12 s <
< 0.17 s) or even Level 3 (
> 0.17 s). In the chosen ranges of
and
, an increase in
and a decrease in
will not degrade the flying qualities of the Chalk criterion.
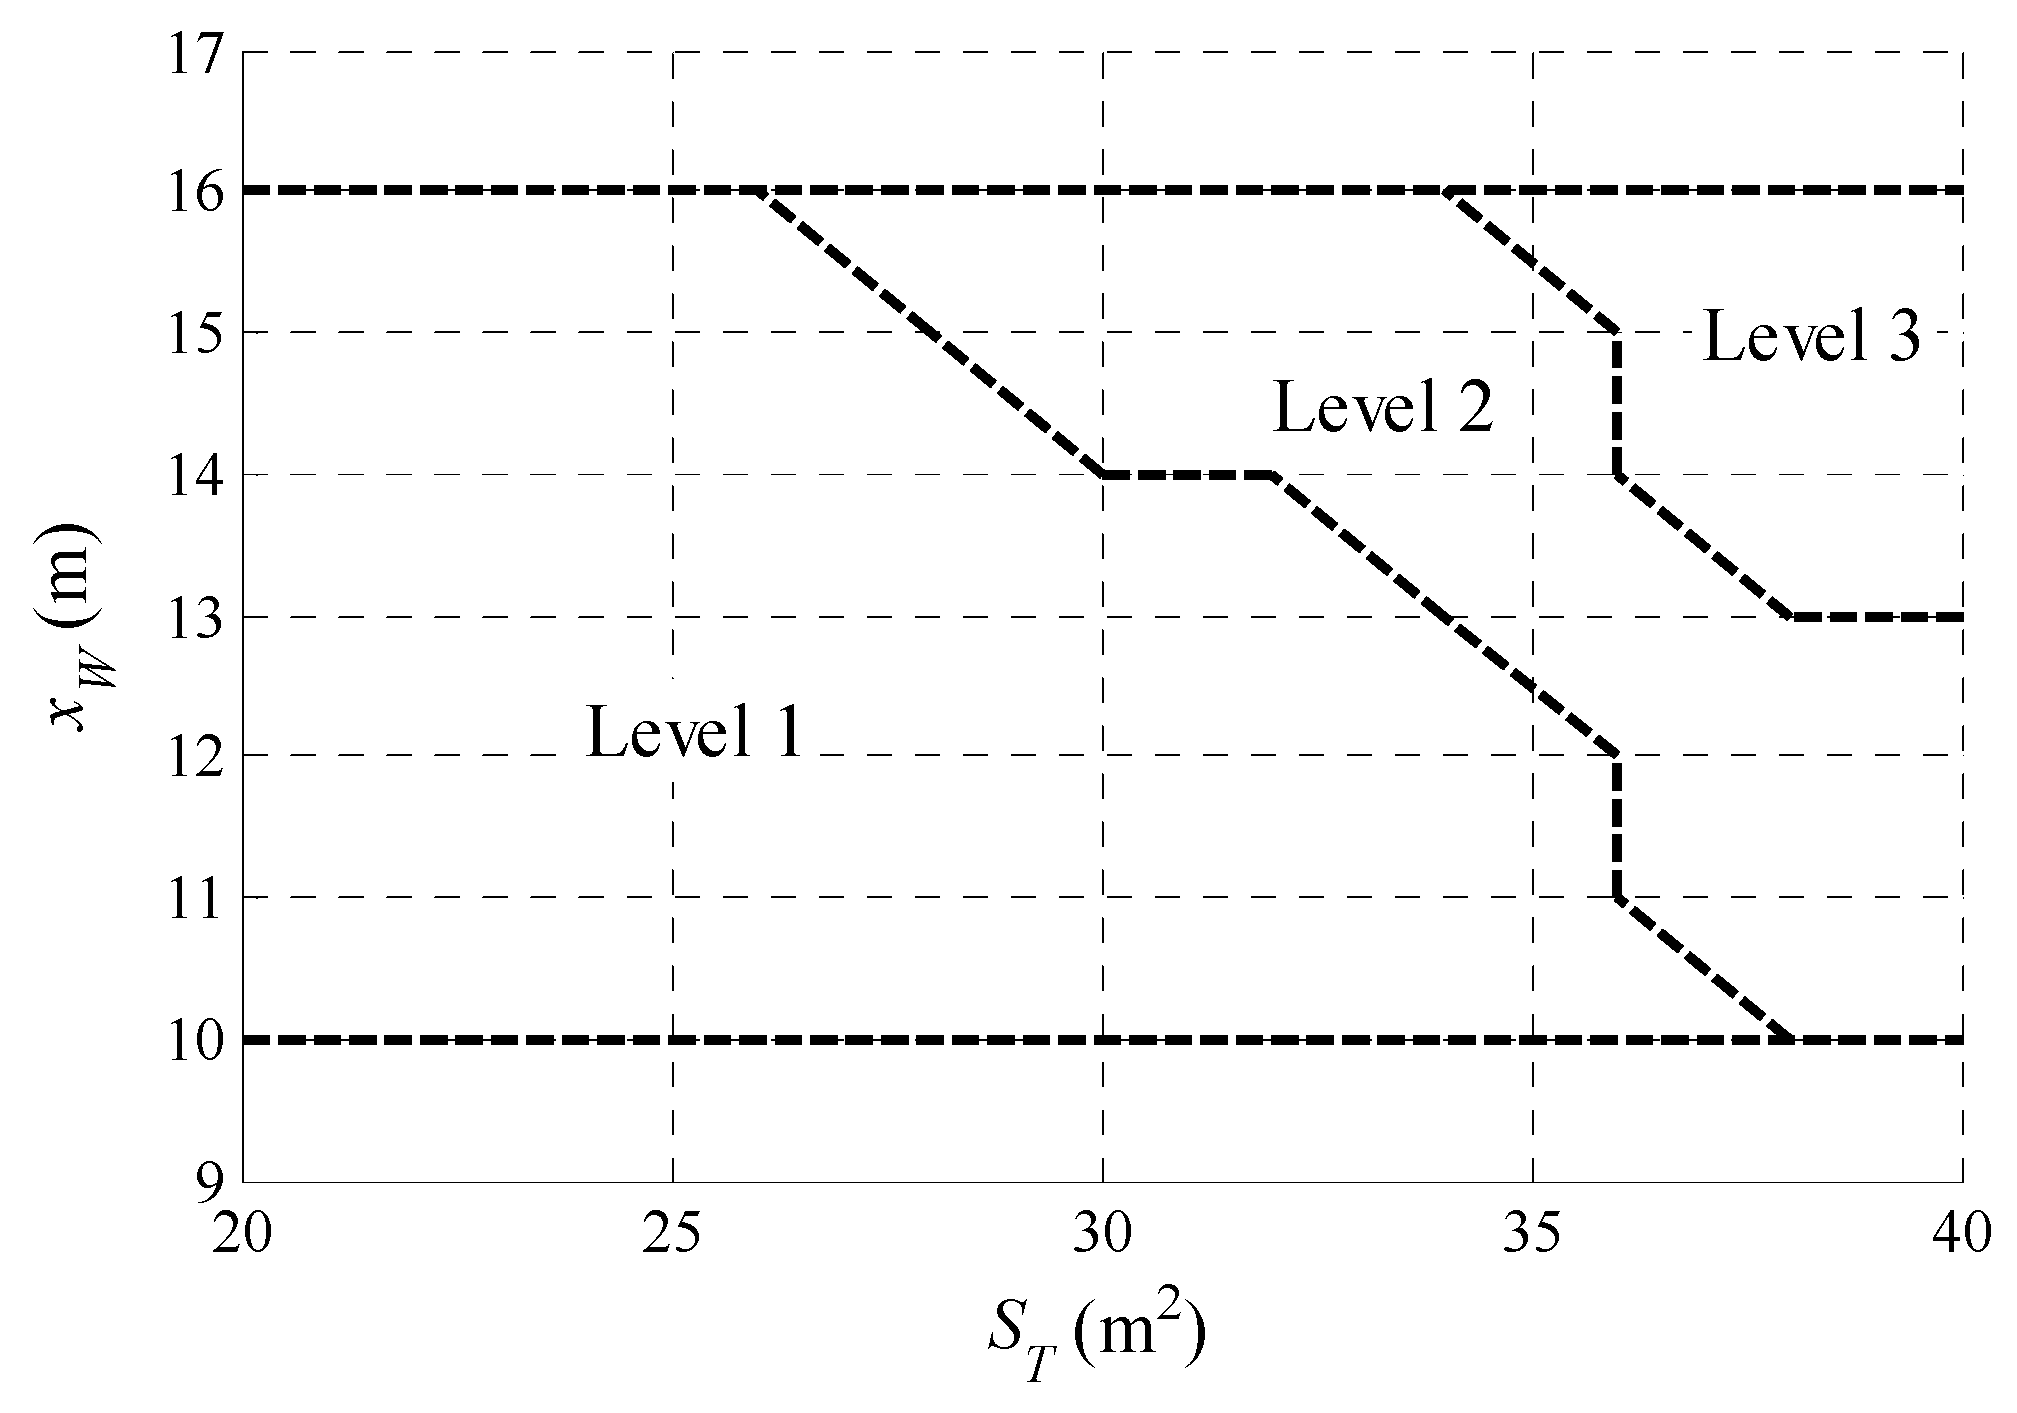
The level boundaries of the
–
combination defined by the Chalk criterion in the take-off phase are shown in
Figure 8. According to this figure, to ensure the Level 1 FQ of the Chalk criterion, the maximum limit of
is 38 m
2 when
= 10 m, and the maximum limit is 26 m
2 when
= 16 m. Compared with the parameter boundaries defined by the CAP criterion shown in
Figure 6, the Chalk criterion defines a more relaxed Level 1 boundary of the rearward range of
and the maximum limit of
. In contrast, the Level 2 boundary defined by the Chalk criterion is stricter and can be used as a supplement to the CAP criterion boundaries.
The selection of the
and
series is the same as the design of the maximum
range. The CAP criterion is applied to evaluate the flying qualities in the landing phase. Partial evaluation results with
values of 10 m, 12 m, 14 m, and 16 m are shown in
Figure 9, where the corresponding minimum limits of
are 26 m
2, 22 m
2, 20 m
2, and 16 m
2, respectively. As the wing position moves forward, the minimum limit of
gradually increases.
The level boundaries of the
–
combination defined by the CAP criterion in landing phase are shown in
Figure 10. According to this figure, to ensure the Level 1 FQ of the CAP criterion, the design range of
is from 26 m
2 to 40 m
2 when
= 10 m and from 16 m
2 to 32 m
2 when
= 16 m. The left boundary of Level 1 in
Figure 10 can determine the minimum limit of
corresponding to different
, and the forward range of
corresponding to different
.
According to the evaluation results of the Chalk criterion in the landing phase, the effective rise time and the response time delay decrease as the wing moves forward and the tail area decreases, which represents a better response speed of the pitch rate. Meanwhile, the pitch damping characteristics become worse as the transient peak ratio increases, but the FQ Level is not degraded. Therefore, the forward boundary of and the minimum limit of should be determined only by the CAP criterion.
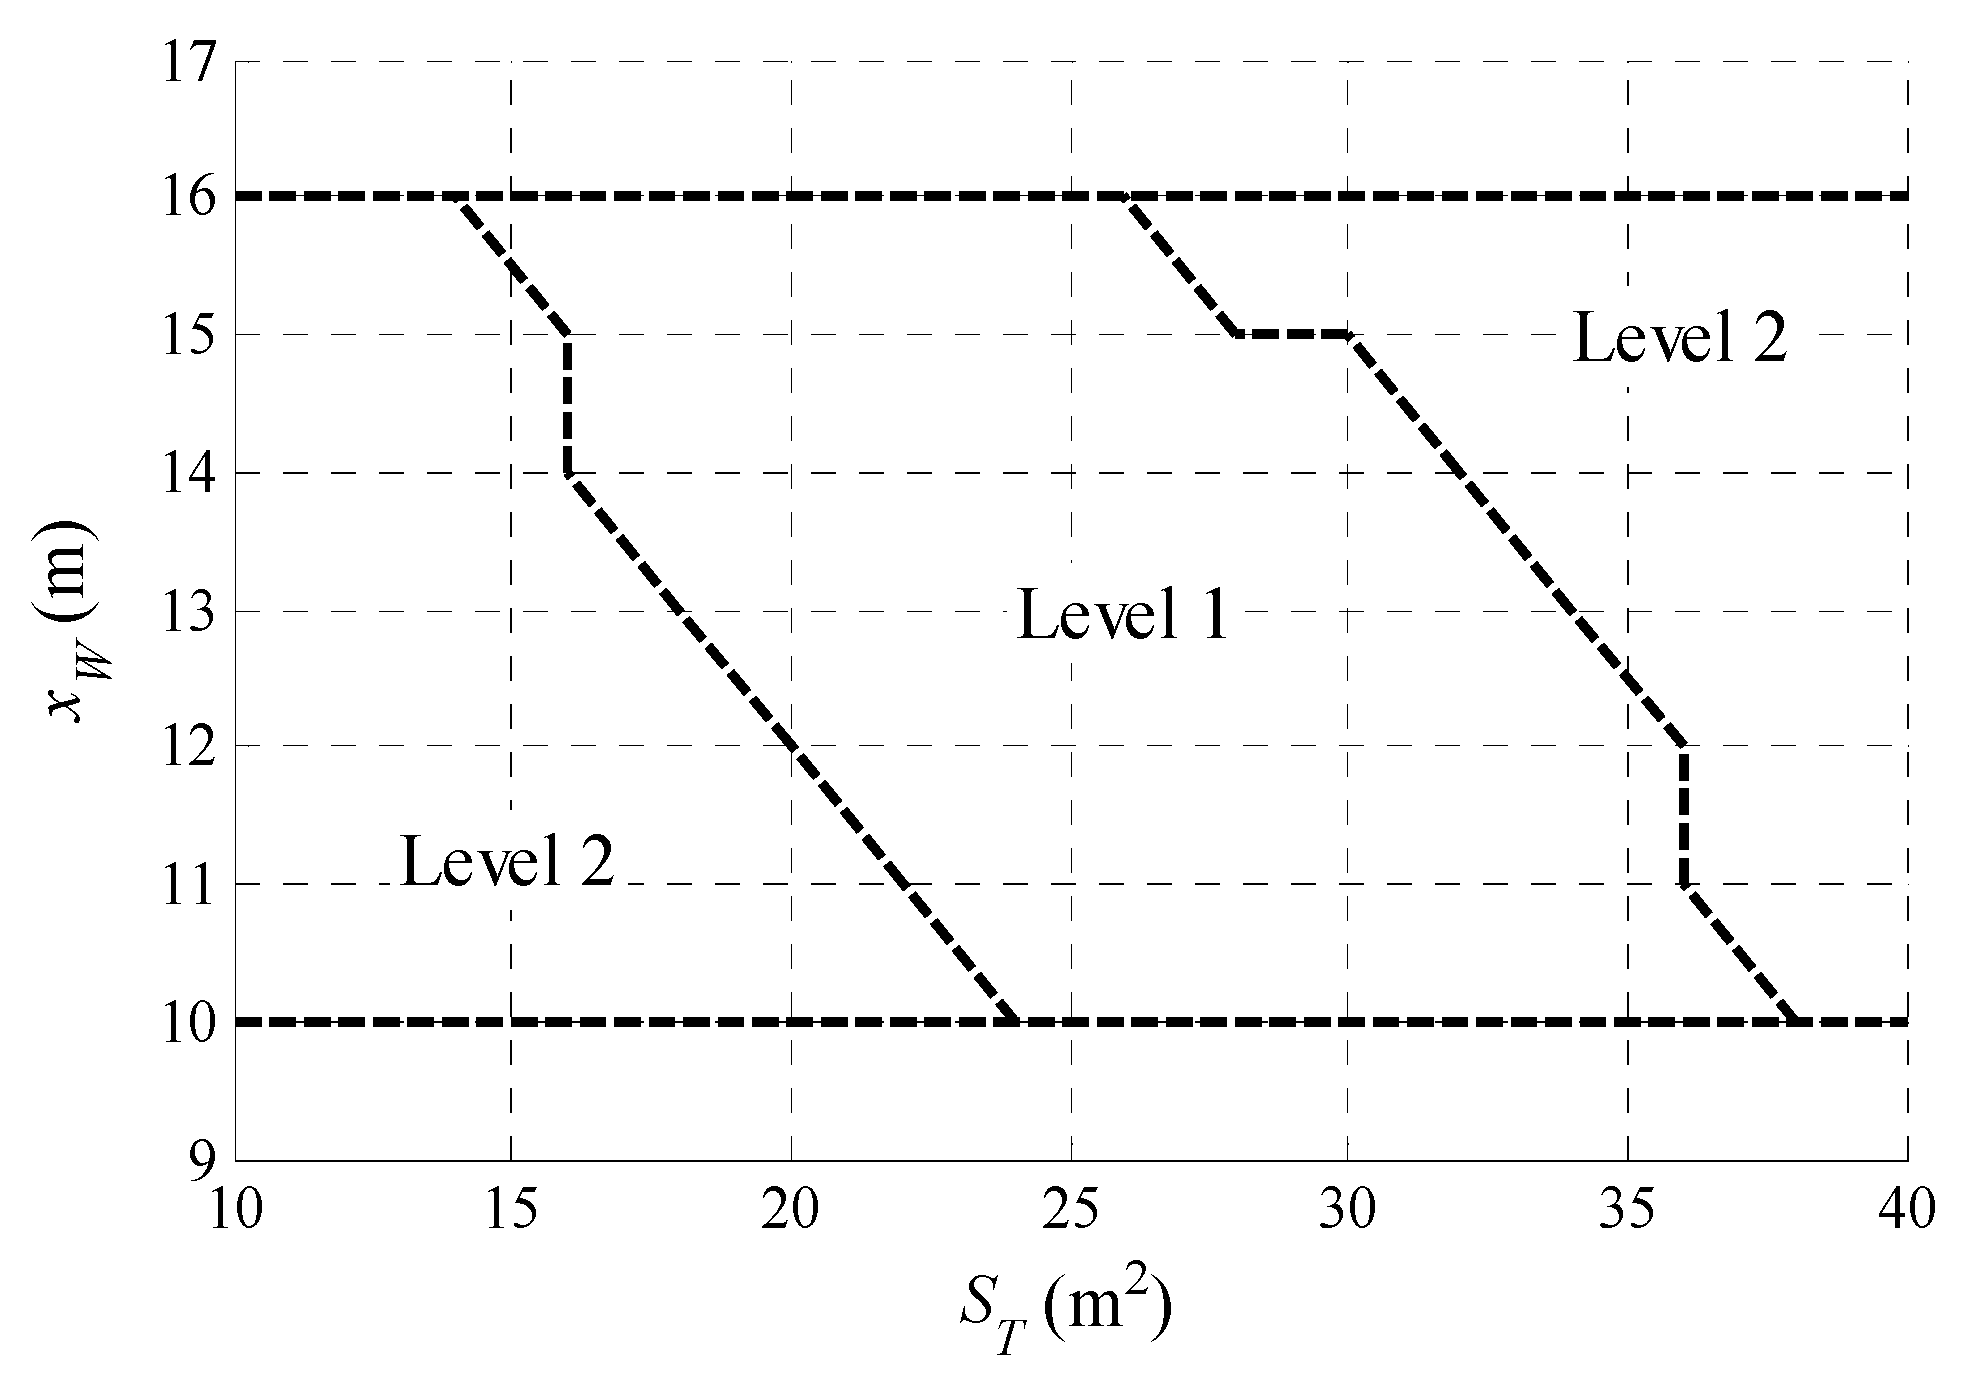
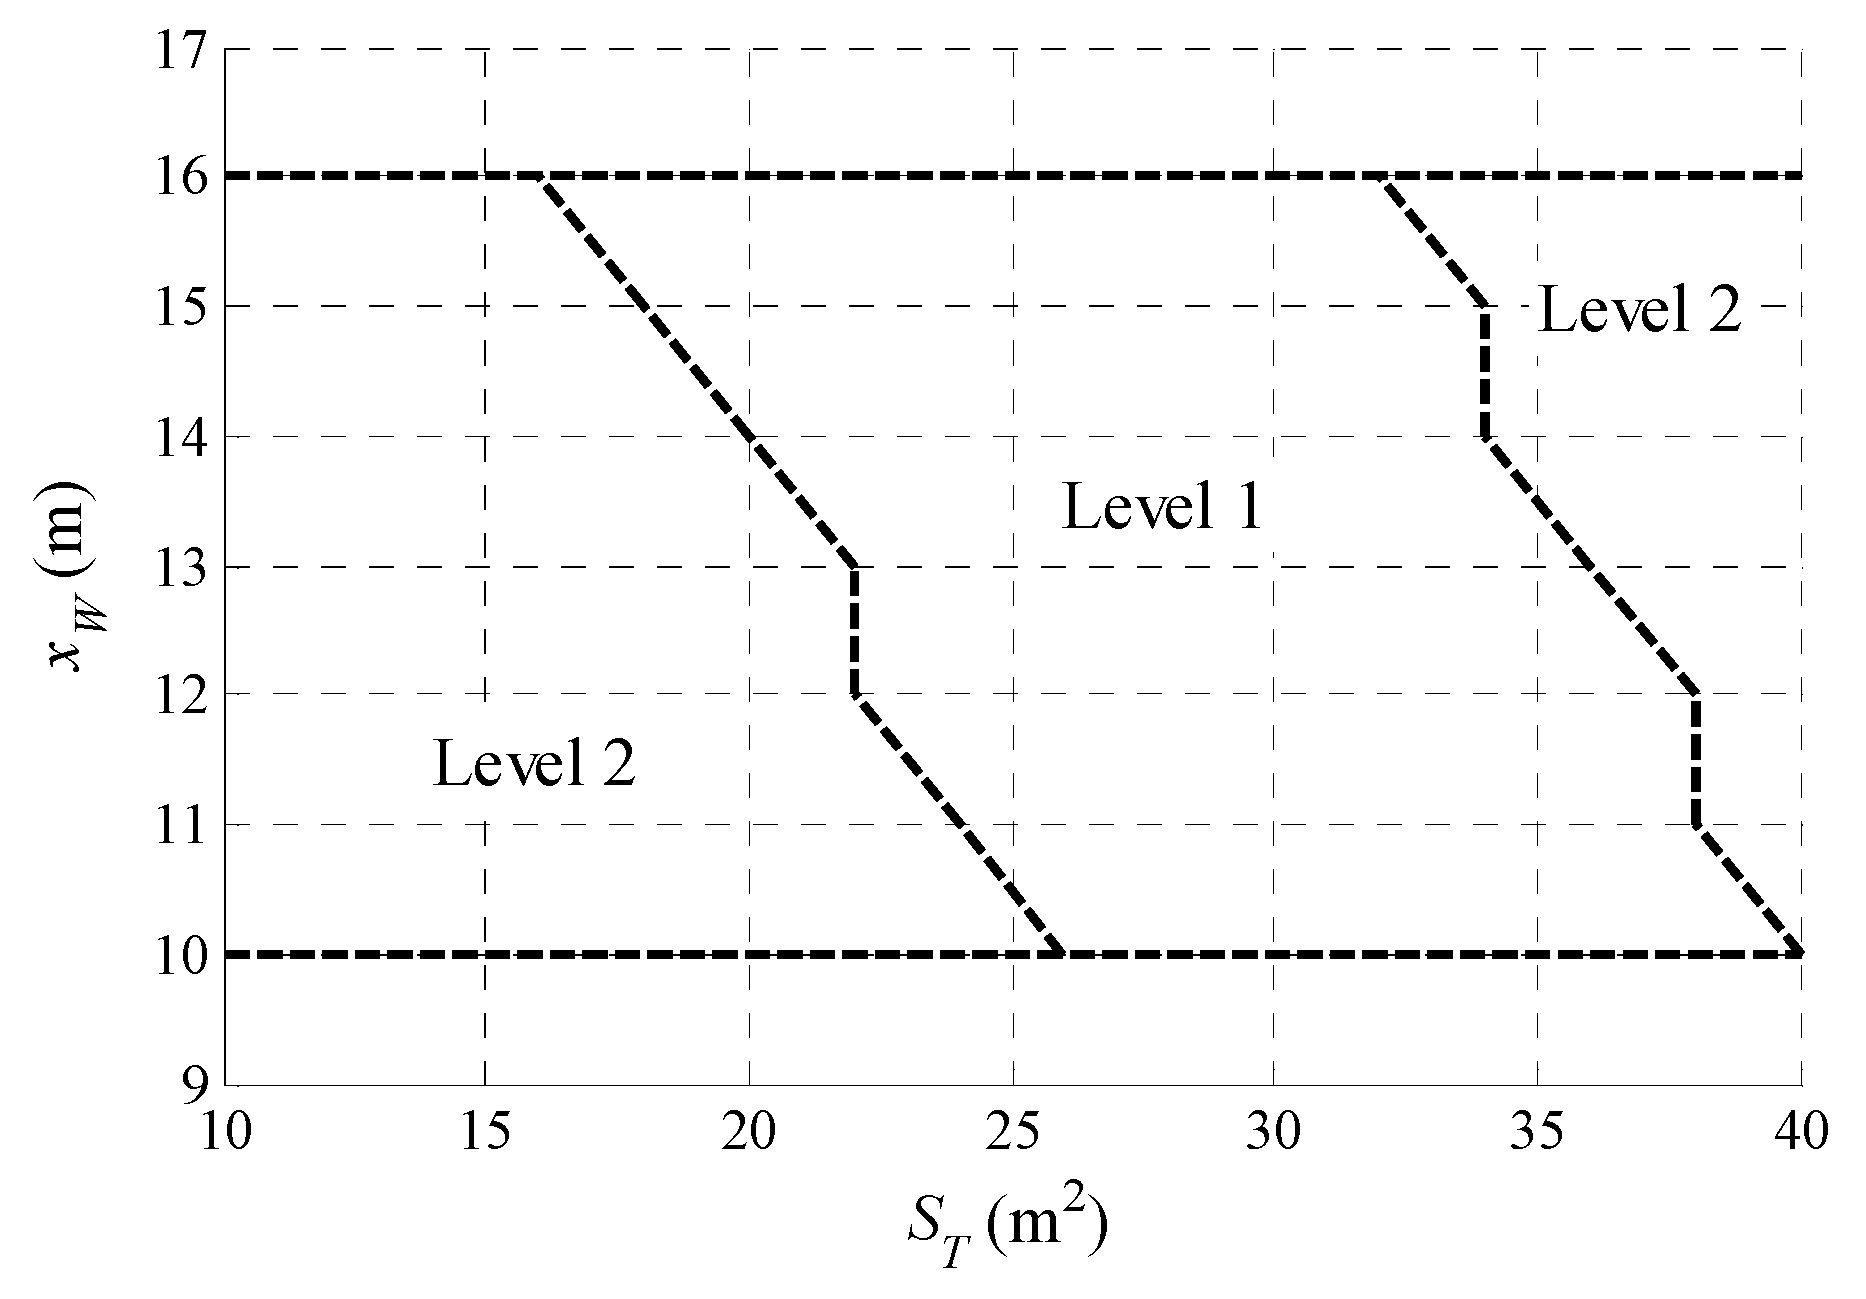
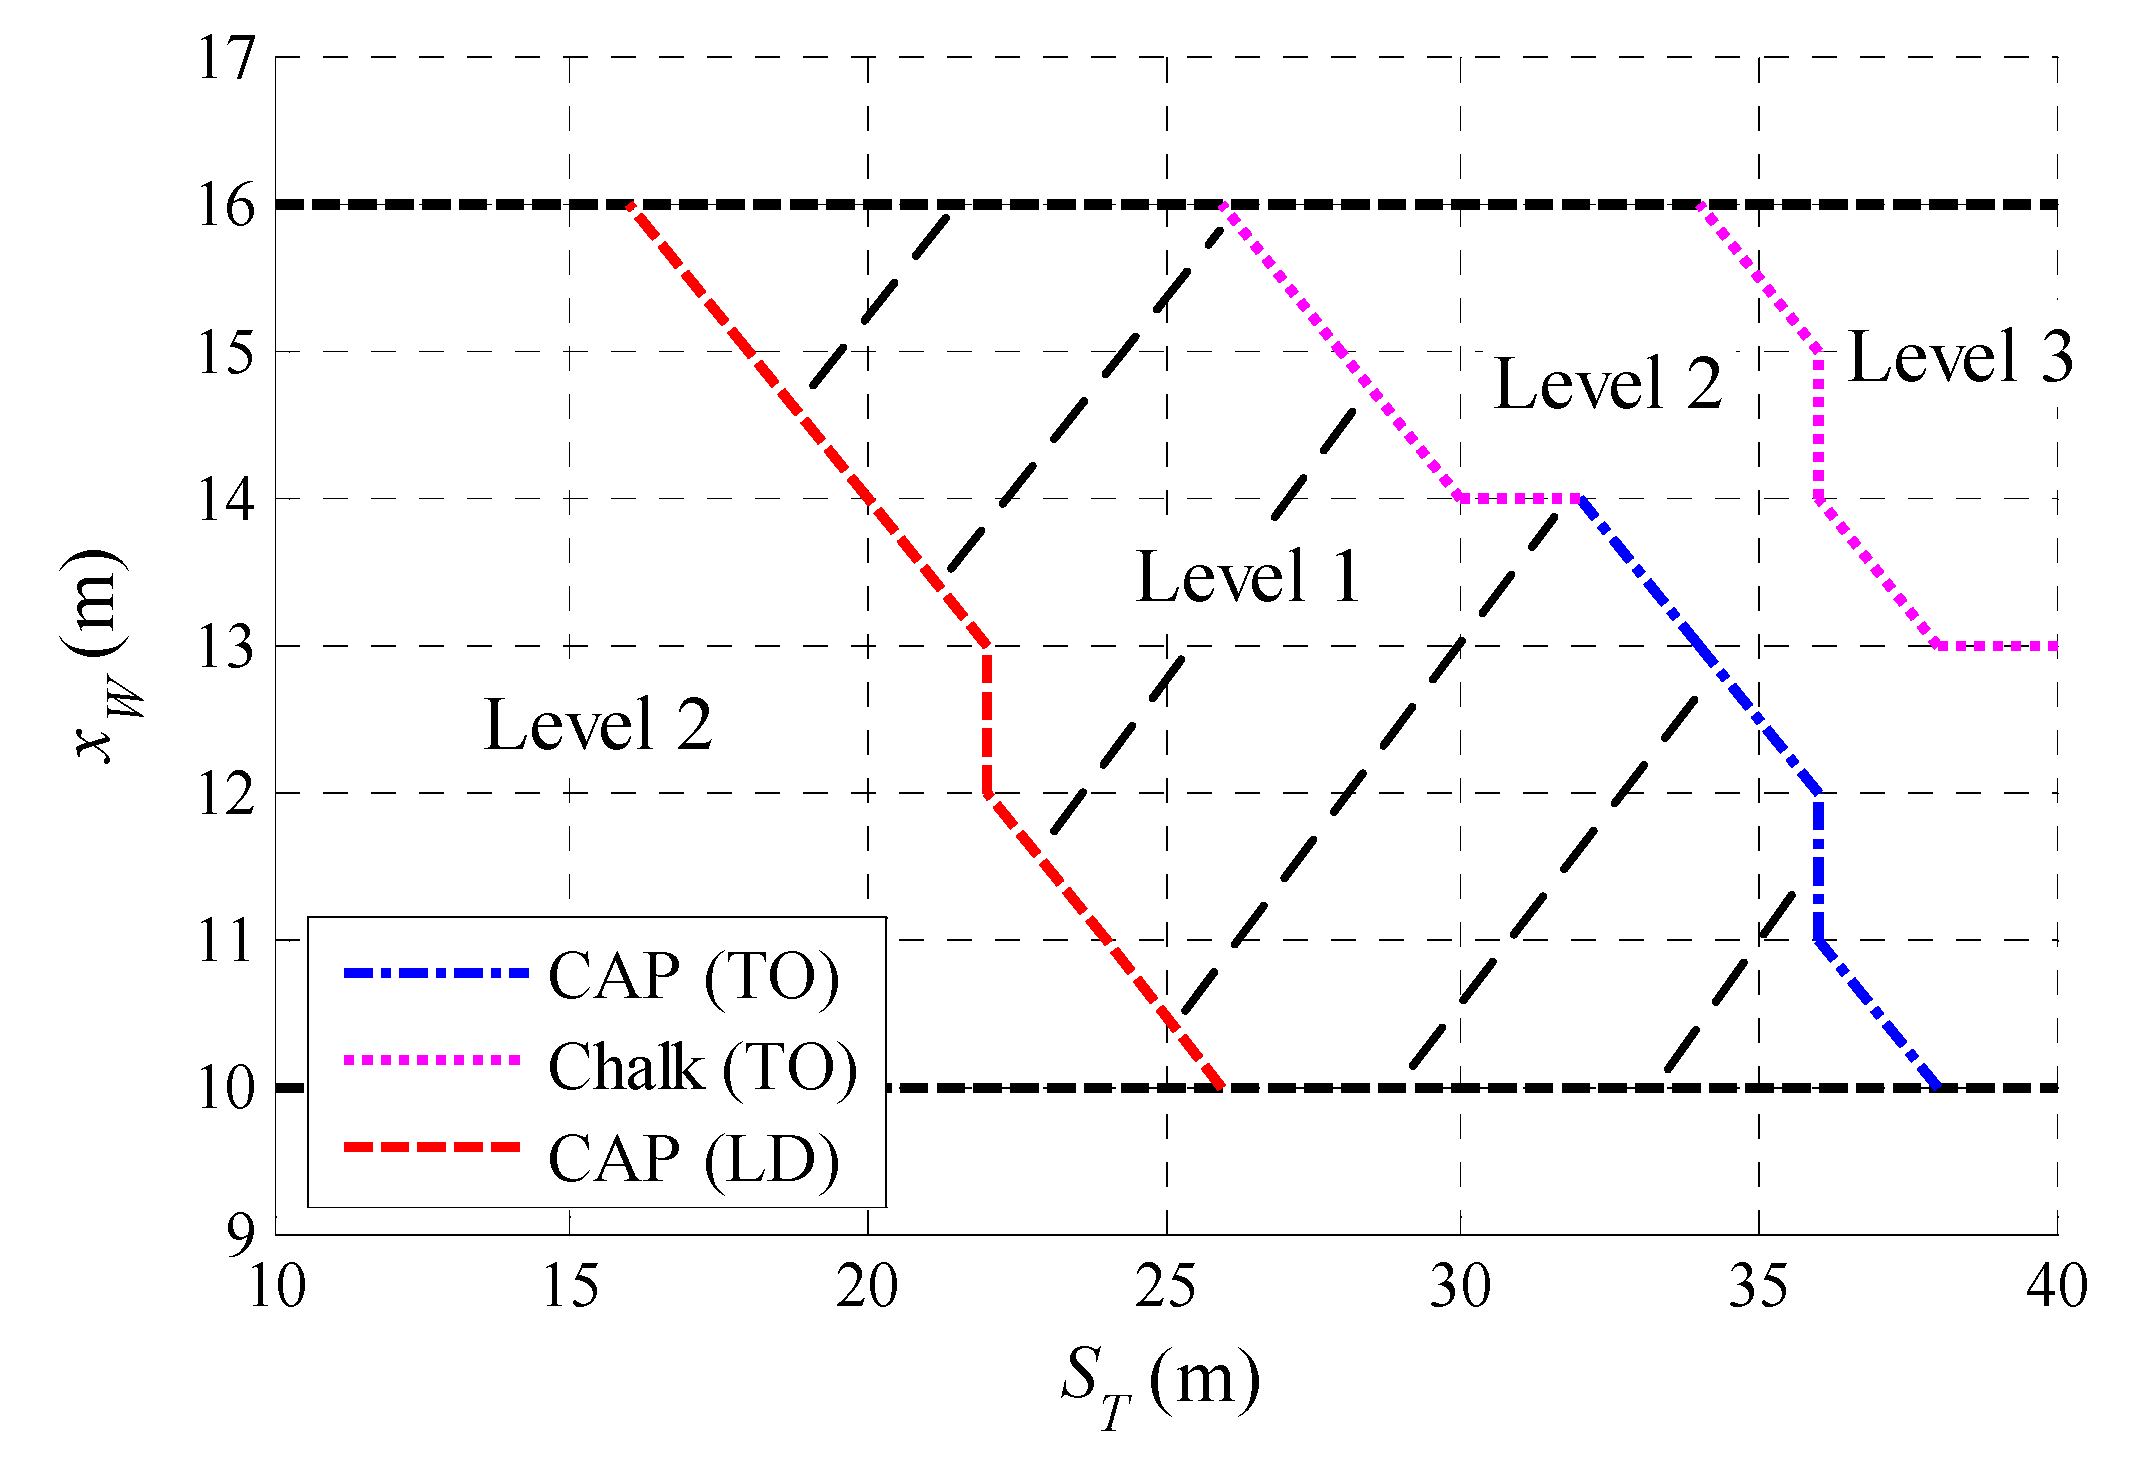
To determine the design ranges of
and
according to the Level 1 FQ requirements in the entire flight envelope, the most stringent boundaries in
Figure 6,
Figure 8 and
Figure 10 are combined to form the final parameter level boundary diagram, as shown in
Figure 11.
According to
Figure 11, the Level 1 boundary of the rearward
and the maximum
(right side in
Figure 11) is determined by the evaluation results in the take-off phase; the upper half is defined by the Chalk criterion and the lower half is defined by the CAP criterion. The Level 2 boundary (top right in
Figure 11) is determined in take-off phase by the Chalk criterion. The Level 1 boundary of the forward
and the minimum
(left side in
Figure 11) is defined in the landing phase by the CAP criterion. The design range of
determined by the Level 1 FQ requirements is from 26 m
2 to 38 m
2 when
= 10 m and from 16 m
2 to 26 m
2 when
= 16 m. In the configuration design process, the design range of
can be defined as the horizontal interval within the Level 1 zone (shaded part in
Figure 11) corresponding to the designed
. Similarly, the design range of
is defined as the vertical interval within the Level 1 zone according to the designed
.
5.2. Boundaries of the Center of Gravity Position
The forward limit of should be designed in the take-off phase according to the most stringent requirement among the lower boundary of the CAP value, the upper boundary of , and the Chalk criterion. Likewise, the rearward limit of should be designed by evaluating the flying qualities in the landing phase according to the most stringent requirement among the upper boundary of the CAP value, the lower boundary of , and the Chalk criterion.
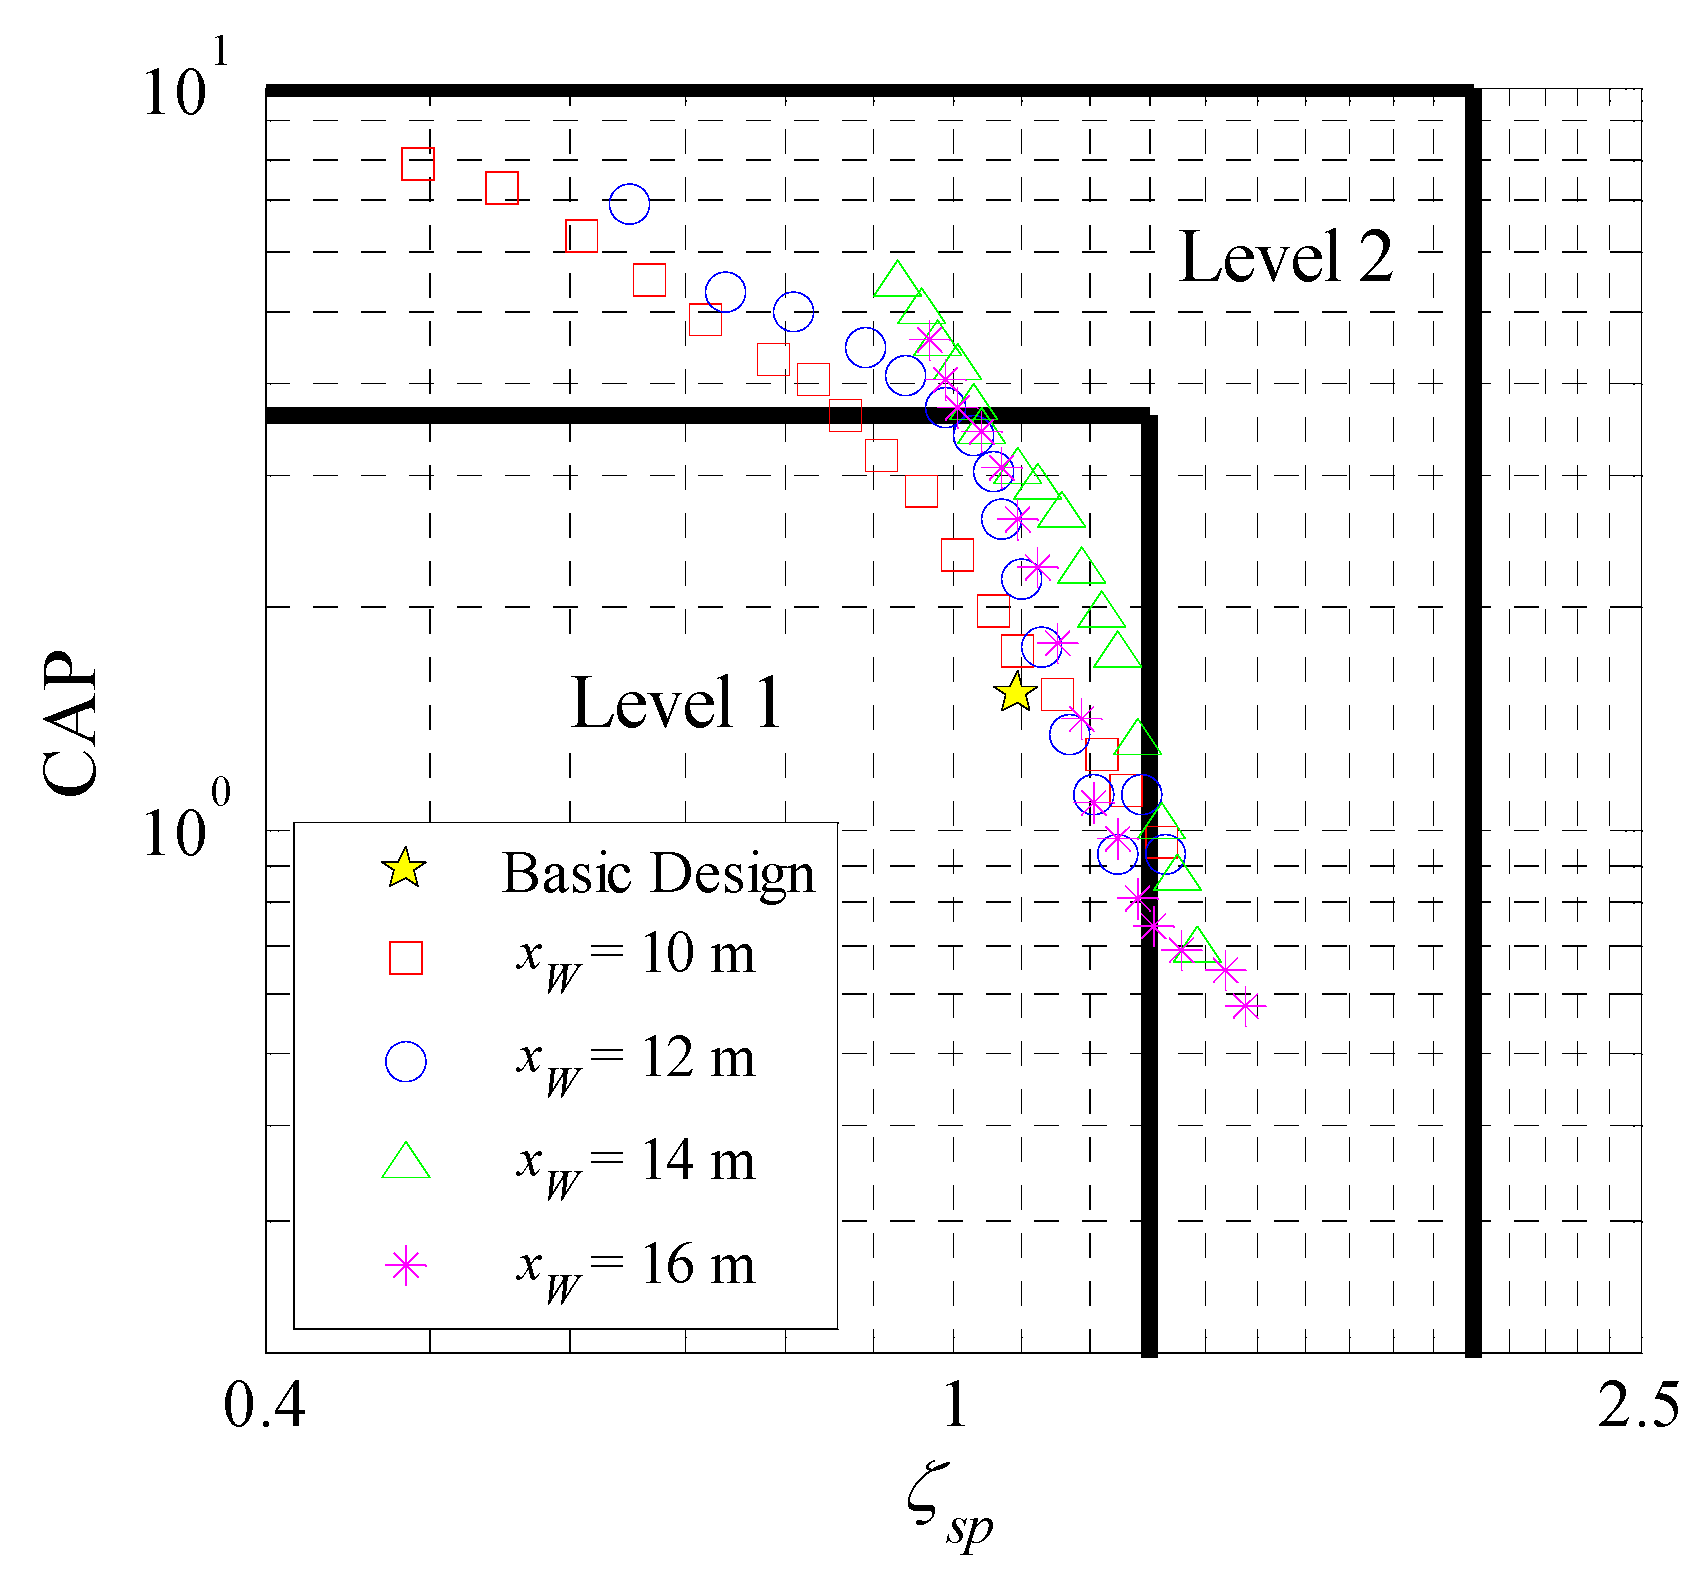
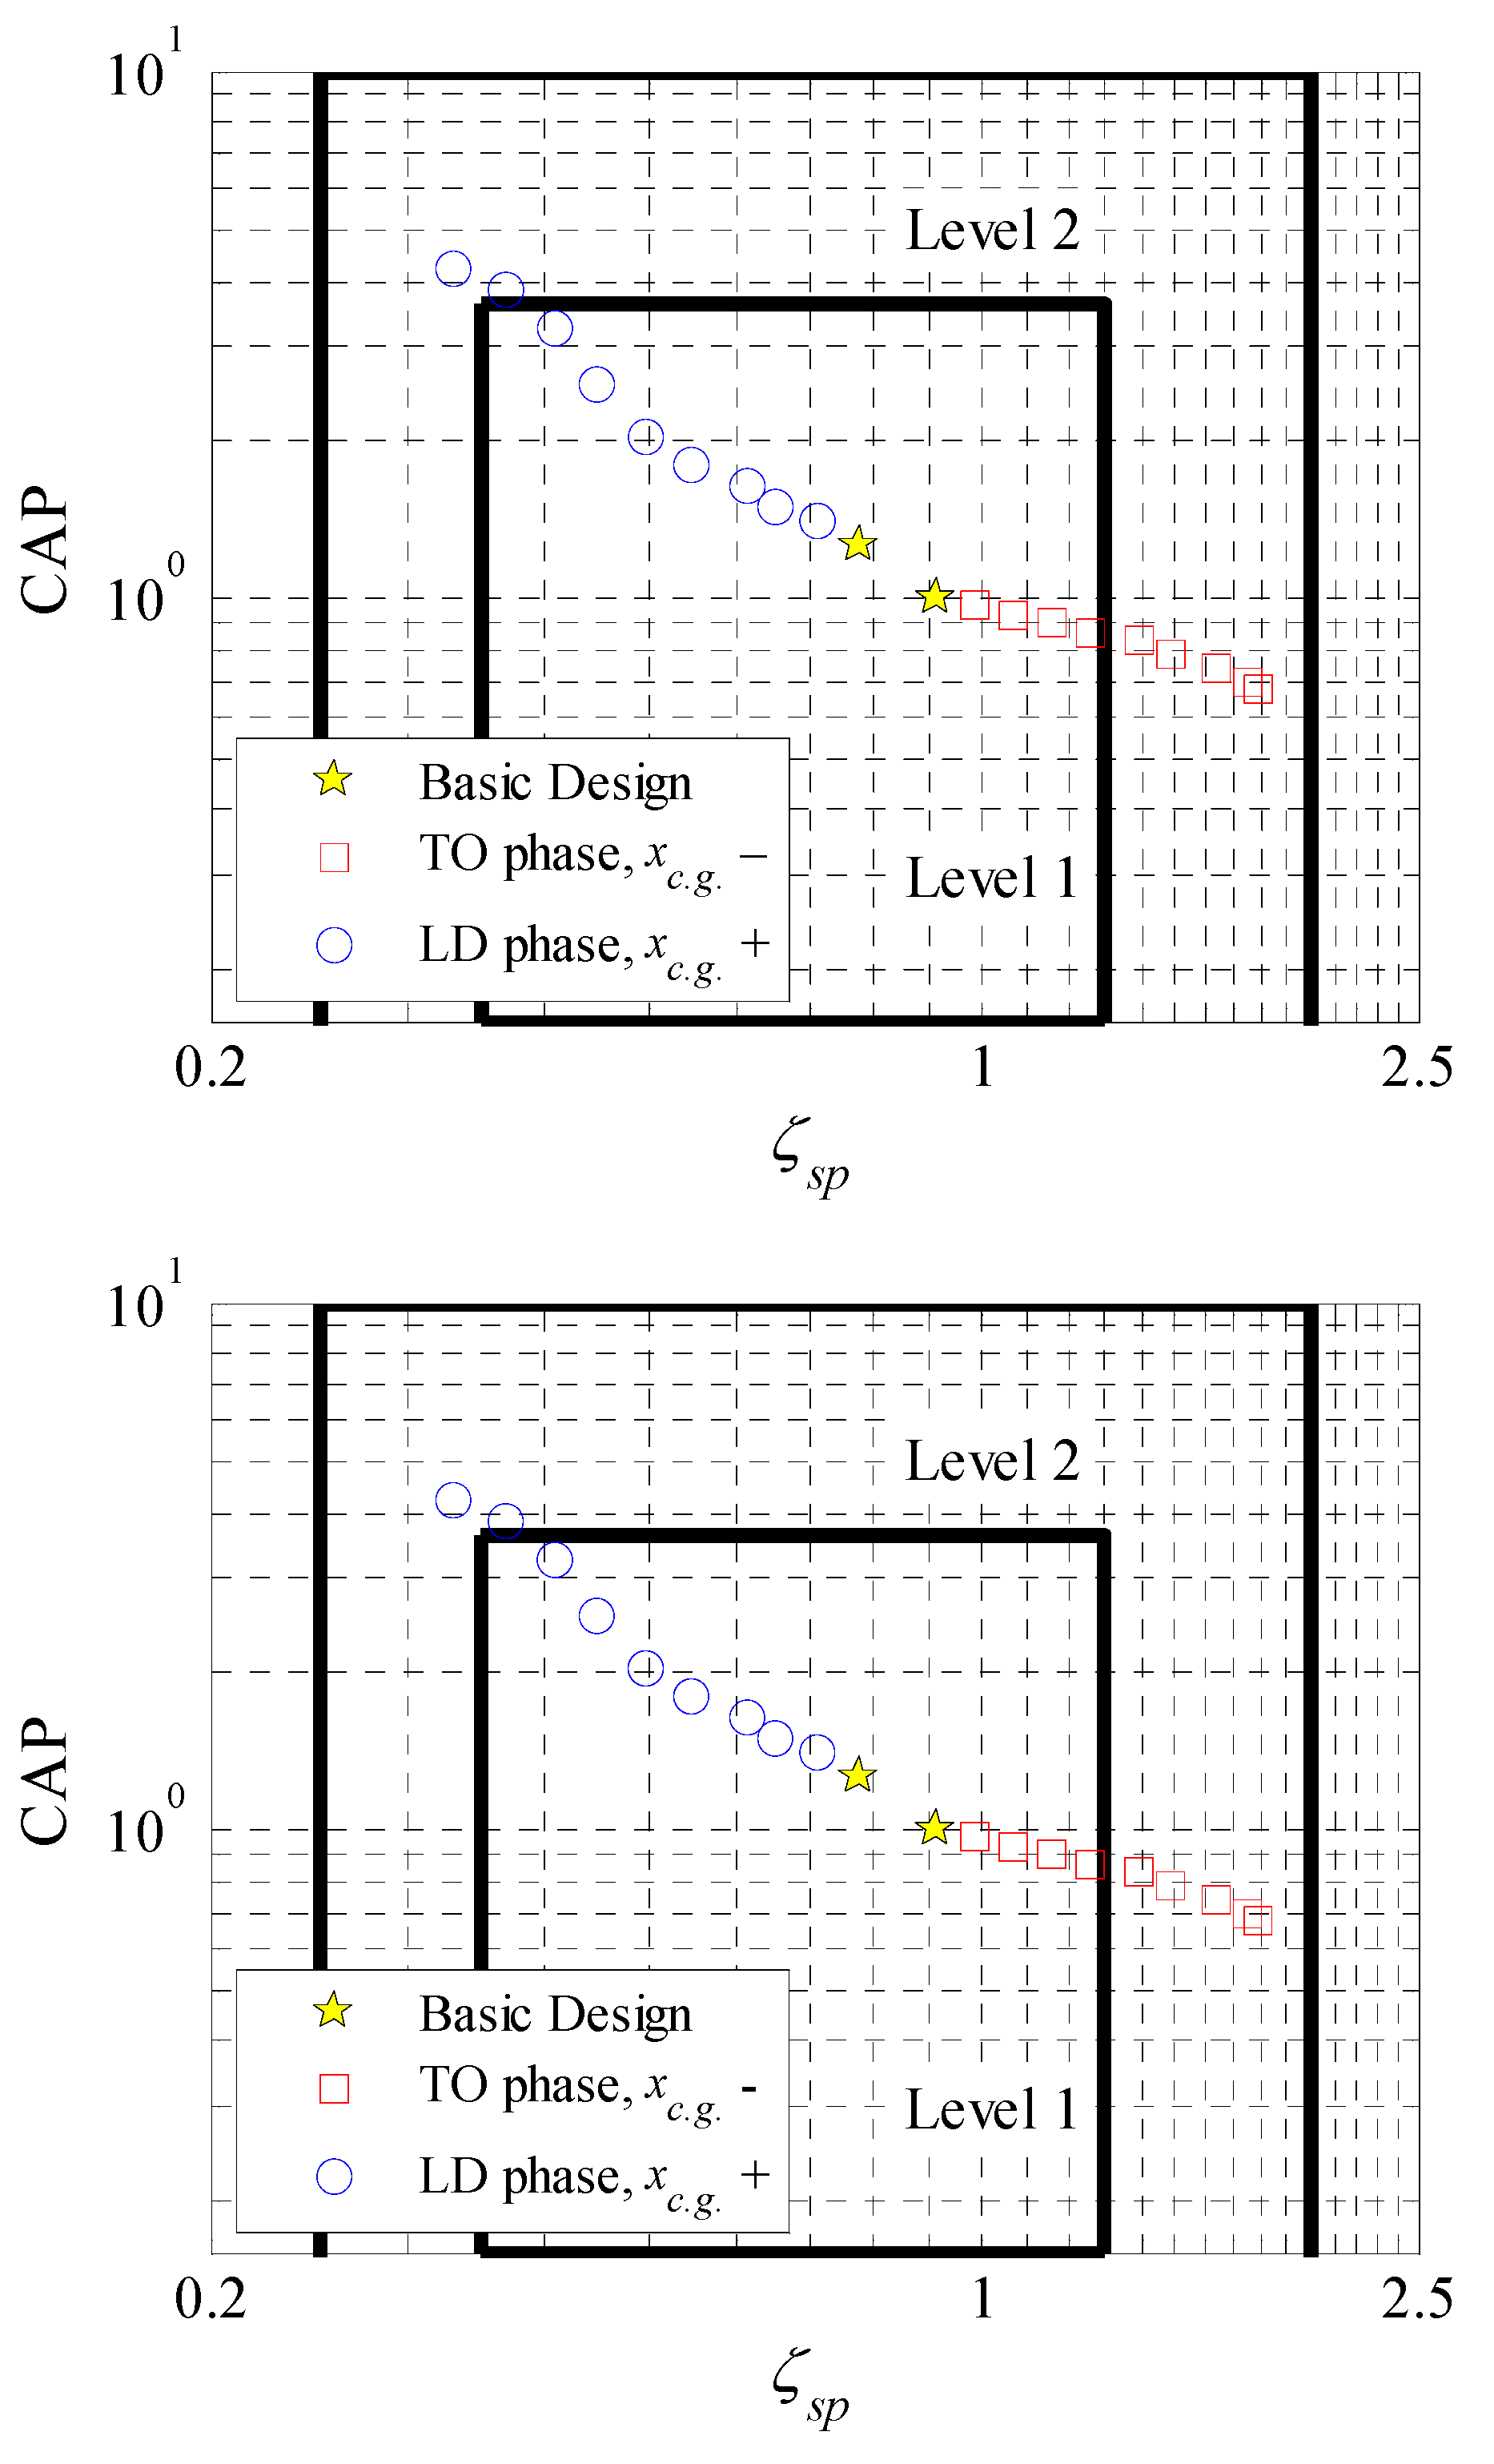
The series for the forward
limit design is set as follows: from 6% to 36%, a point is selected every 3% of the wing MAC, yielding ten points in total. Likewise, the series for the rearward
limit design is set as follows: from 38% to 65%, a point is selected every 3% of the wing MAC, also yielding ten points in total. Then, the CAP criterion is applied to evaluate the flying qualities of the aircraft with the forward
in the take-off phase, while the rearward
designs are evaluated in the landing phase. The evaluation results are presented in
Figure 12. Compared with the basic design of the sample aircraft in the take-off phase, as the CG position moves forward (TO phase,
–), the CAP value decreases gradually, the damping ratio
increases, and the FQ Level is degraded from Level 1 to Level 2. In the landing phase, as the CG position moves rearward (LD phase,
+), the CAP value increases, and the damping ratio
decreases.
The forward
designs are also evaluated by the Chalk criterion in the take-off phase. The effective time delay
is the parameter most affected by the variation in
; the evaluation results of
are shown in
Table 5. As CG moves forward, the
value of the pitch response increases, which indicates poor maneuverability. The FQ Level is degraded to Level 2 or even Level 3.
According to the evaluation results of the Chalk criterion in the landing phase, the pitch damping characteristics of the aircraft become worse as the CG moves rearward, but the FQ Level is not degraded. Therefore, the Chalk criterion is only applied to design the forward limit.
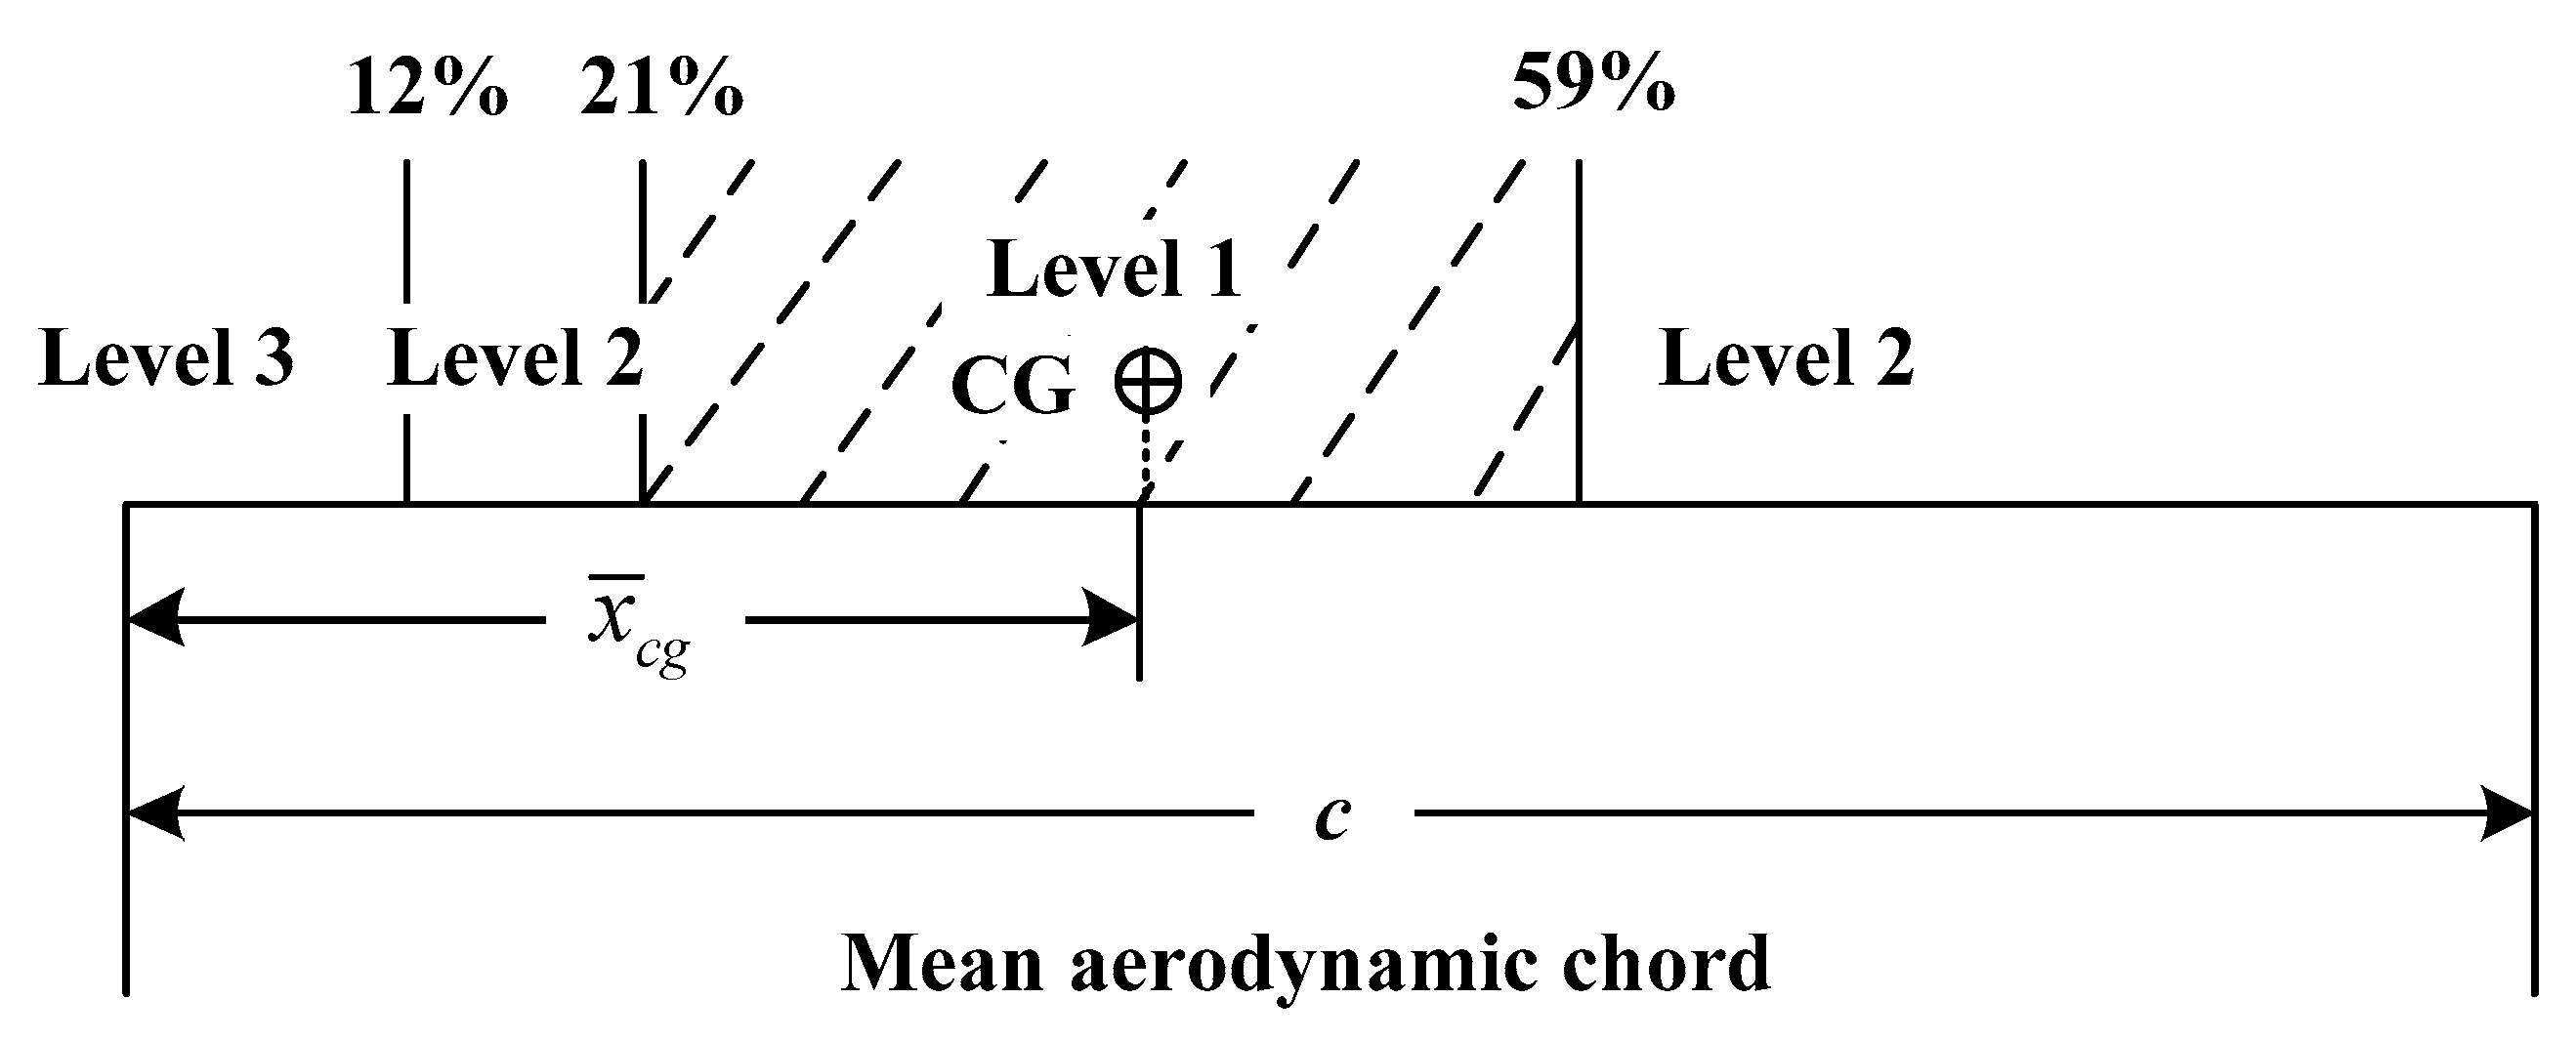
The level boundaries of
are defined as in
Figure 13. According to this figure, the Level 1 boundary of the forward CG limit is 21% of the wing MAC, determined by the upper boundary of
in the CAP criterion in the take-off phase. The Level 2 boundary of the forward CG limit is 12% of the wing MAC, determined by the Chalk criterion. Finally, the Level 1 boundary of the rearward CG limit is 59% of the wing MAC, determined by the upper boundary of the CAP value in the landing phase. The
range should be kept within the Level 1 zone (shaded part in
Figure 13).
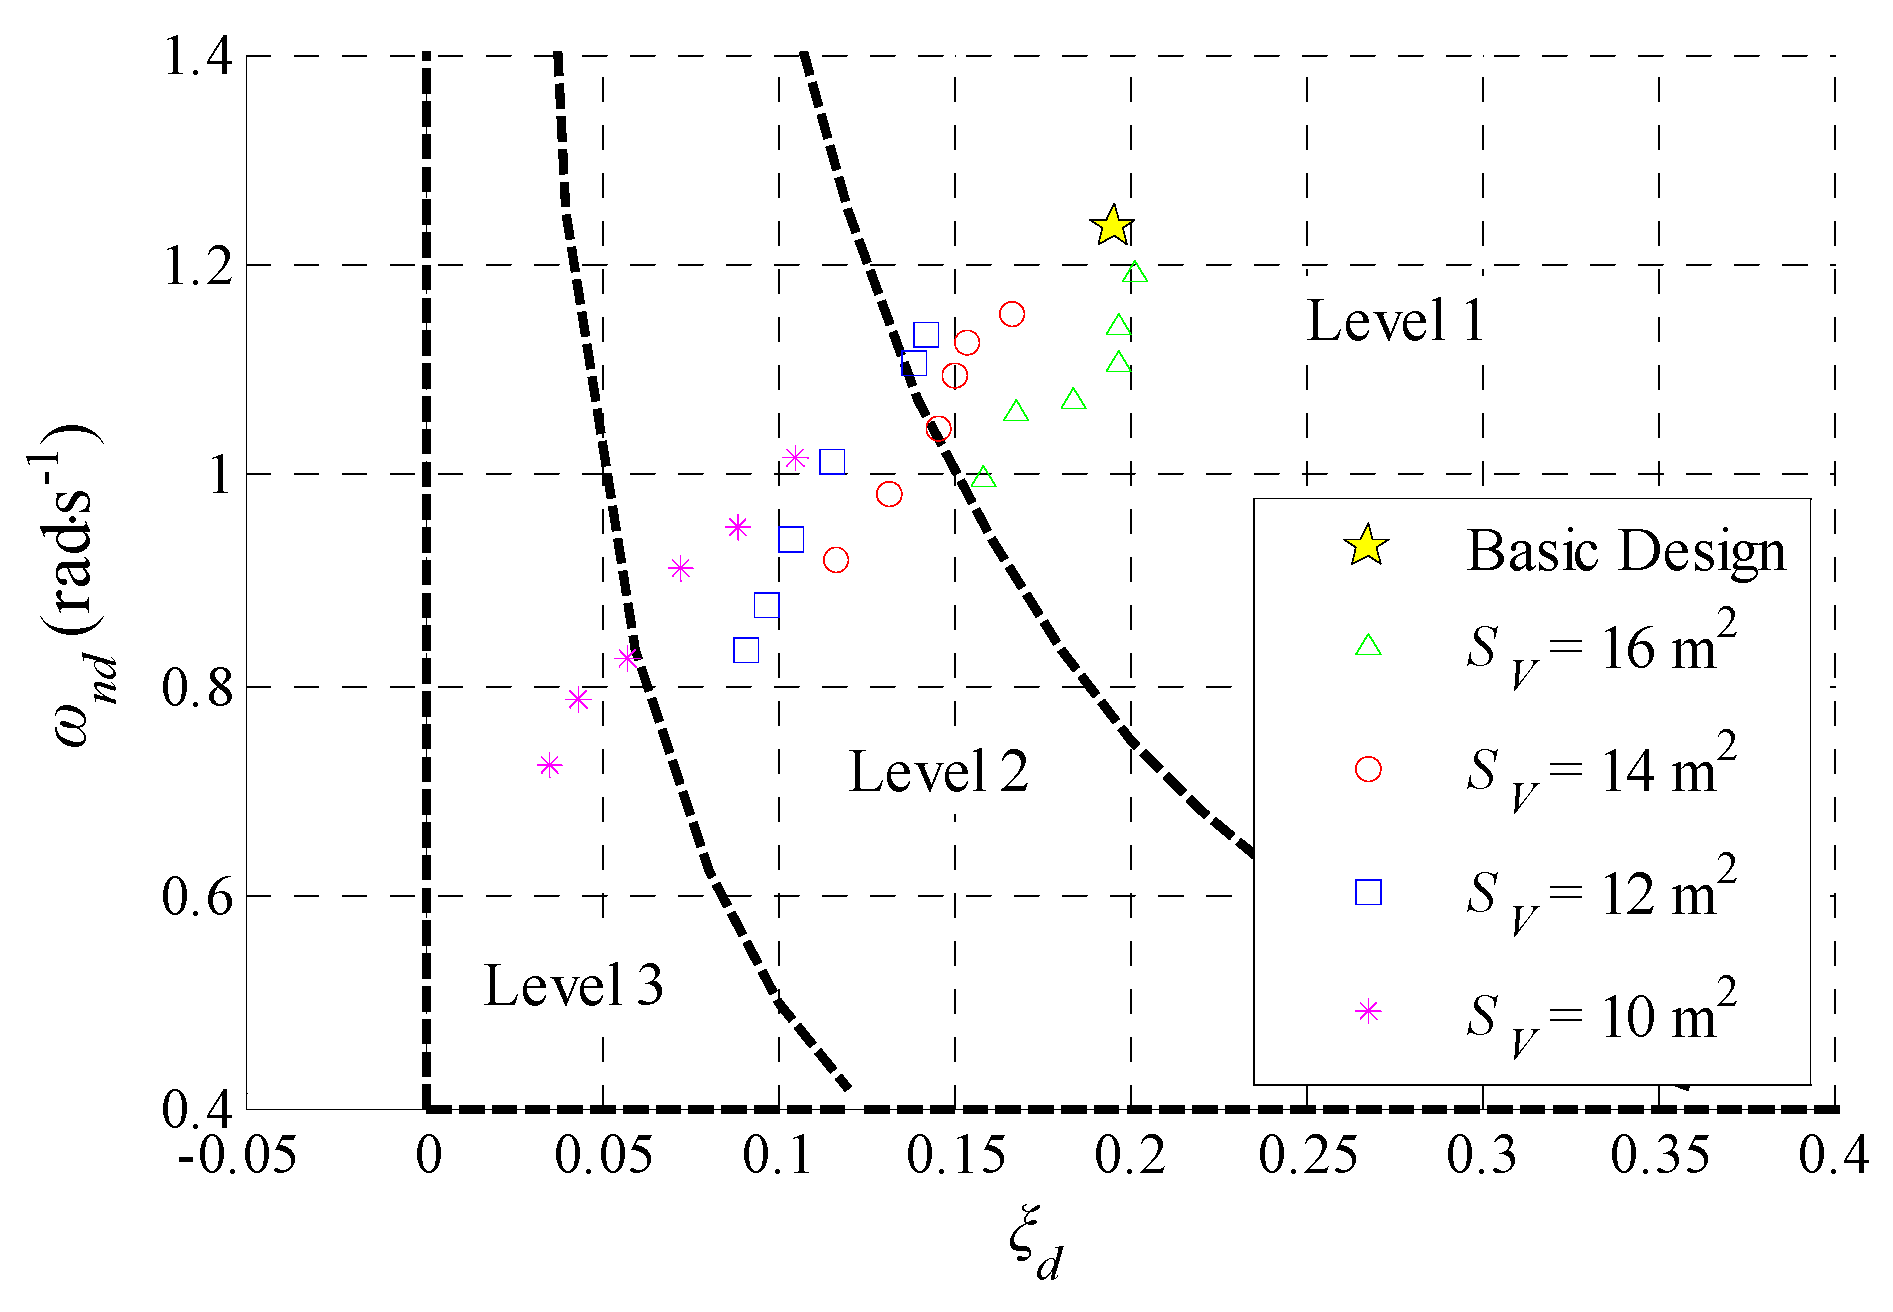
5.3. Boundaries of the Vertical Tail Area and Position
The vertical tail area
and position
should be designed in the cruise phase (high speed, high altitude, cruise engine setting and configuration) according to the requirements of the Dutch roll criterion. The variation series of
is set as follows: below the basic value of
, a point is selected every 1 m
2, and for each
, a series of
with an interval of 1 m is selected. As
is adjusted by changing the quarter chord point of the vertical tail without moving the root position, the design range of
is limited from 26 m to 31 m. Then, the Dutch roll criterion is applied to evaluate the flying qualities of different
–
combinations. Partial evaluation results with
values of 10 m
2, 12 m
2, 14 m
2, and 16 m
2 are shown in
Figure 14, and the Dutch roll characteristics with
values of 12 m
2 and 14 m
2 are shown in
Table 6.
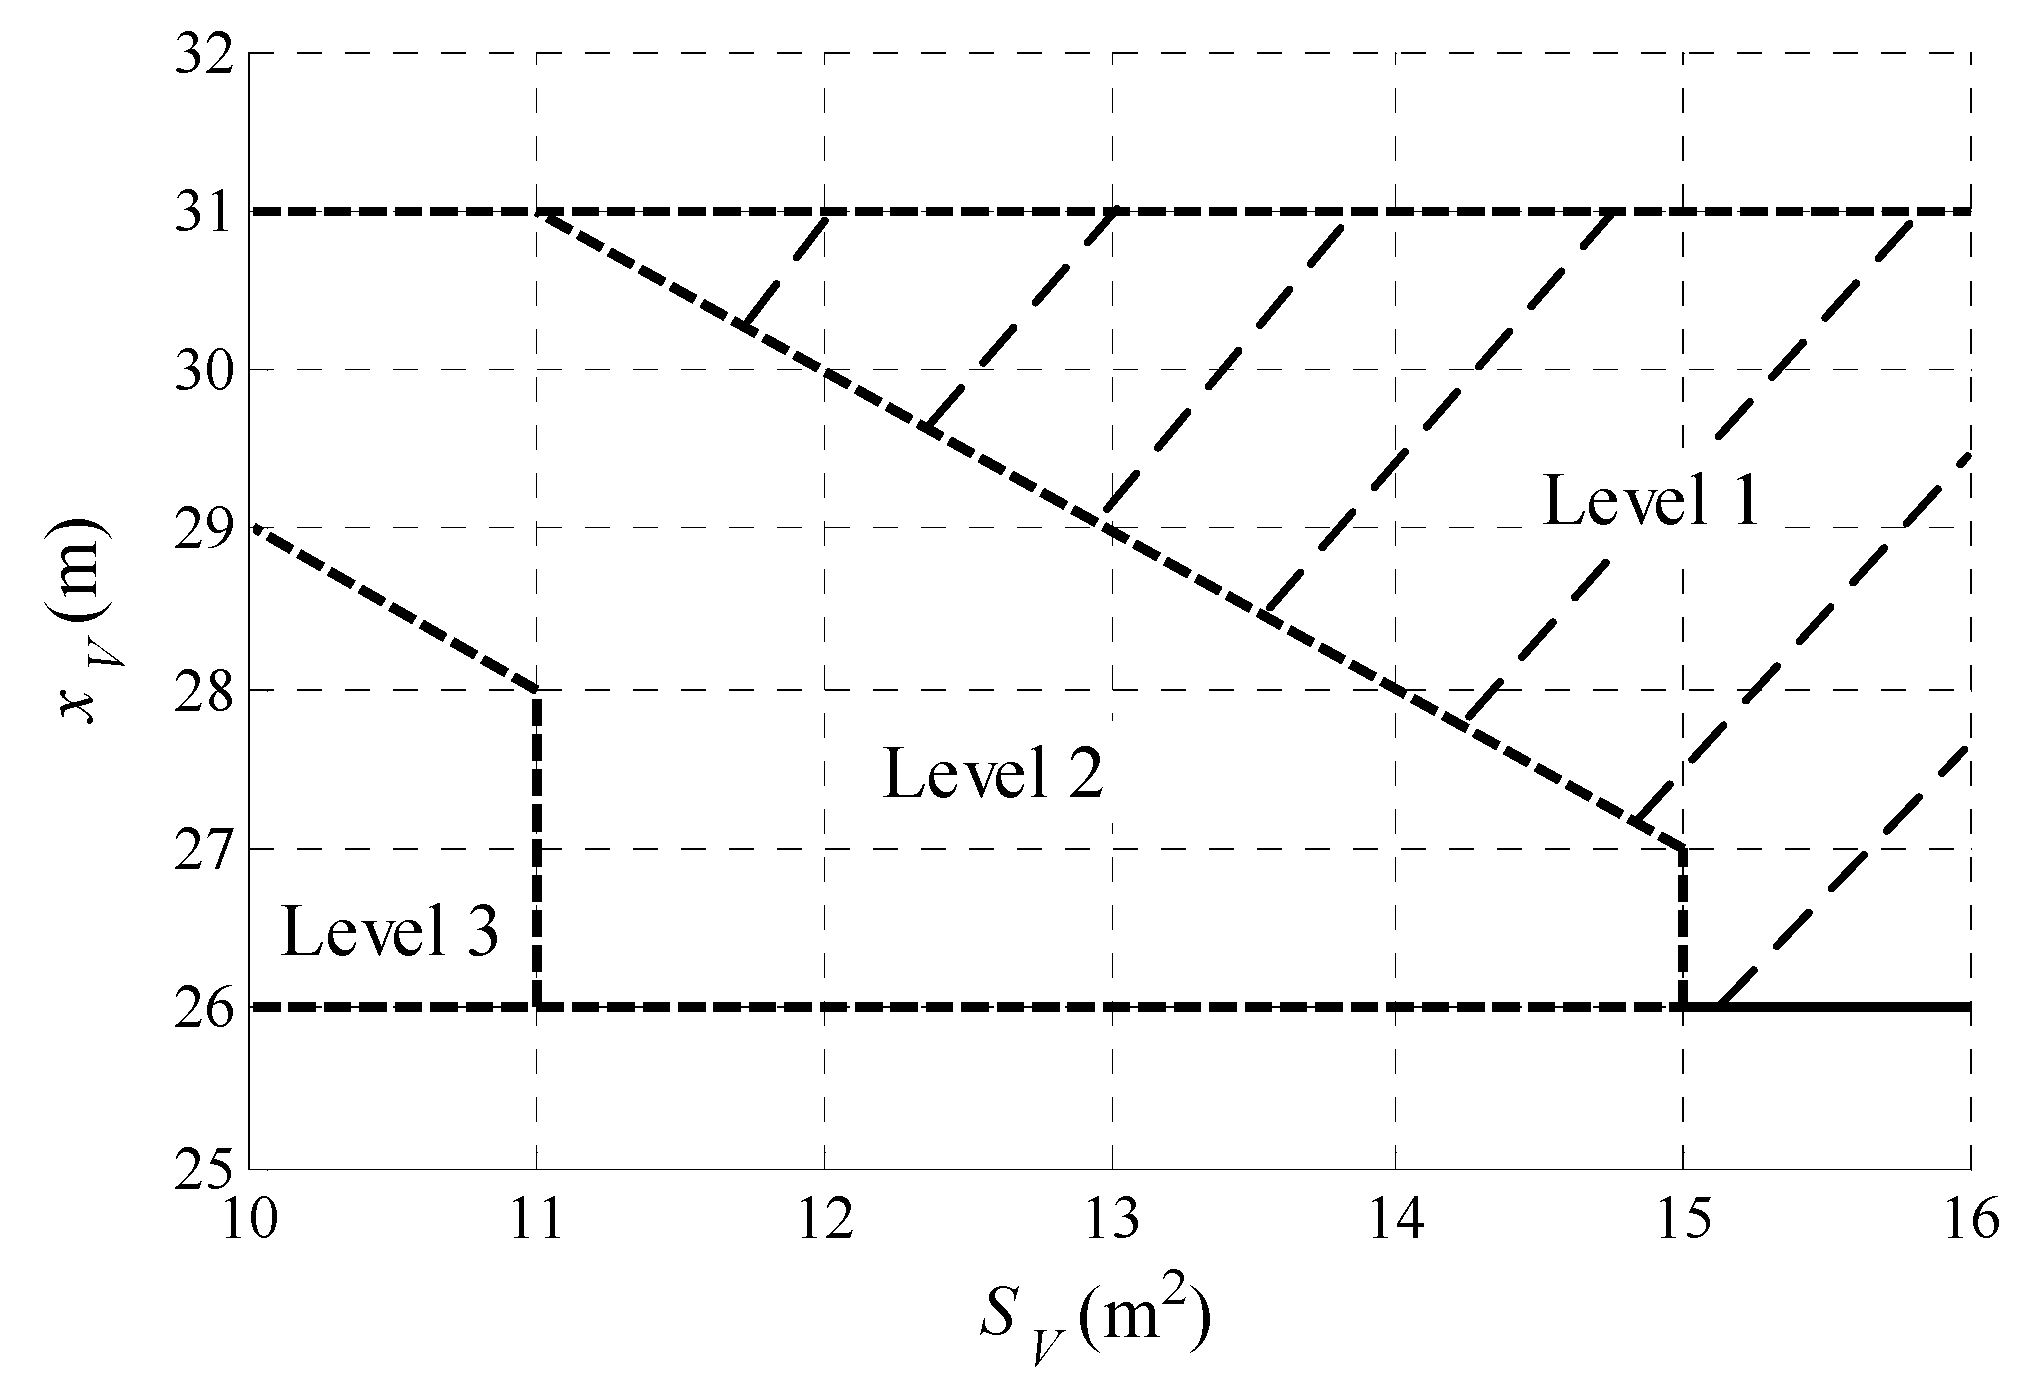
For a certain , both and of the Dutch roll mode decrease gradually with the forward movement of the tail. The forward range of is defined as the critical value that leads to the degradation of directional flying qualities. When is set as 12 m2 and 14 m2, the corresponding forward range of is 30 m and 28 m, respectively. With decreasing , the design range of gradually decreases. The minimum limit of is defined as the critical value without the corresponding that meets the requirements of the Level 1 FQ.
According to all evaluation results, the level boundaries of the
–
combination are defined as in
Figure 15.
Considering that the drag force due to the vertical tail is largely related to the vertical tail area, it is necessary to restrict the tail area while satisfying the flying qualities requirements. According to
Figure 15,
within the design range can ensure Level 1 FQ of the closed-loop aircraft when
is not less than 15 m
2. The minimum limit of
is 11 m
2 and the corresponding
is 31 m. In the configuration design process, the design range of
can be defined as the horizontal interval within the shaded Level 1 zone in
Figure 15, corresponding to the designed
. Similarly, the design range of
is defined as the vertical interval within the Level 1 zone according to the designed
.


