Article

Investigation of the Impact of a Particle Foam Insulation on Airflow, Temperature Distribution, Pressure Profile and Frost Buildup on the Aircraft Structure

Fraunhofer Institute for Building Physics IBP, Fraunhoferstr. 10, D-83626 Valley, Germany
*
Author to whom correspondence should be addressed.
Aerospace 2021, 8(12), 359; https://doi.org/10.3390/aerospace8120359
Submission received: 21 October 2021 / Revised: 16 November 2021 / Accepted: 18 November 2021 / Published: 23 November 2021

Abstract

:
Aircraft insulation separates the thermally comfortable cabin interior environment from the extremely cold outside conditions. However, the fabrication and installation of the insulation in the aircraft is a labor-intensive task. Tailored, rigid particle foam parts could be a solution to speed up the installation process. The presented study investigates the feasibility of such a concept from a hygrothermal point of view. Due to the temperature difference between the cold air trapped between aircraft skin and insulation on one side and the warm cabin air on the other side, a buoyancy-induced pressure difference forms. This effect drives the warmer air through leakages in the insulation system towards the cold skin. Here, moisture contained in the air condenses on the cold surfaces, increasing the risk for uncontrolled dripping (“rain in the plane”) when it melts. Therefore, this study compares the condensate build-up of different installations of a rigid particle foam frame insulation with the classical glass fiber capstrip. Tests are hosted in the Fraunhofer Lining and Insulation Test Environment chamber. It is shown that careful installation of the particle foam frame insulation provides similar level of moisture protection as the current state of the art insulation, and that the condensate amount does not depend on the amount of airflow directly behind the sidewall.

1. Introduction

The typical aircraft cabin operative temperature is in the range of 18.3 to 26.7 °C (65 to 80 °F) [1], whereas the external temperature is around −56.5 °C [2]. This temperature difference can be maintained due to the presence of thermal insulation in the aircraft, leading to a sufficiently warm sidewall surface. In [1], it is specified that the sidewall surface temperature shall not differ more than 5.6 K (10 °F) from the cabin temperature to maintain passenger thermal comfort.
The main material for insulating an aircraft is glass fiber [3] wrapped by a cover film (e.g., [4]). Besides the thermal protection, the insulation system provides acoustic dampening of the aircraft noise, and most importantly for certification aspects, it protects passengers in the case of fire and therefore undergoes thorough testing [5]. These tests cover the flame propagation, heat and smoke release and burn through resistance. An insulation material may only be installed onboard the aircraft if all four tests are successfully passed.
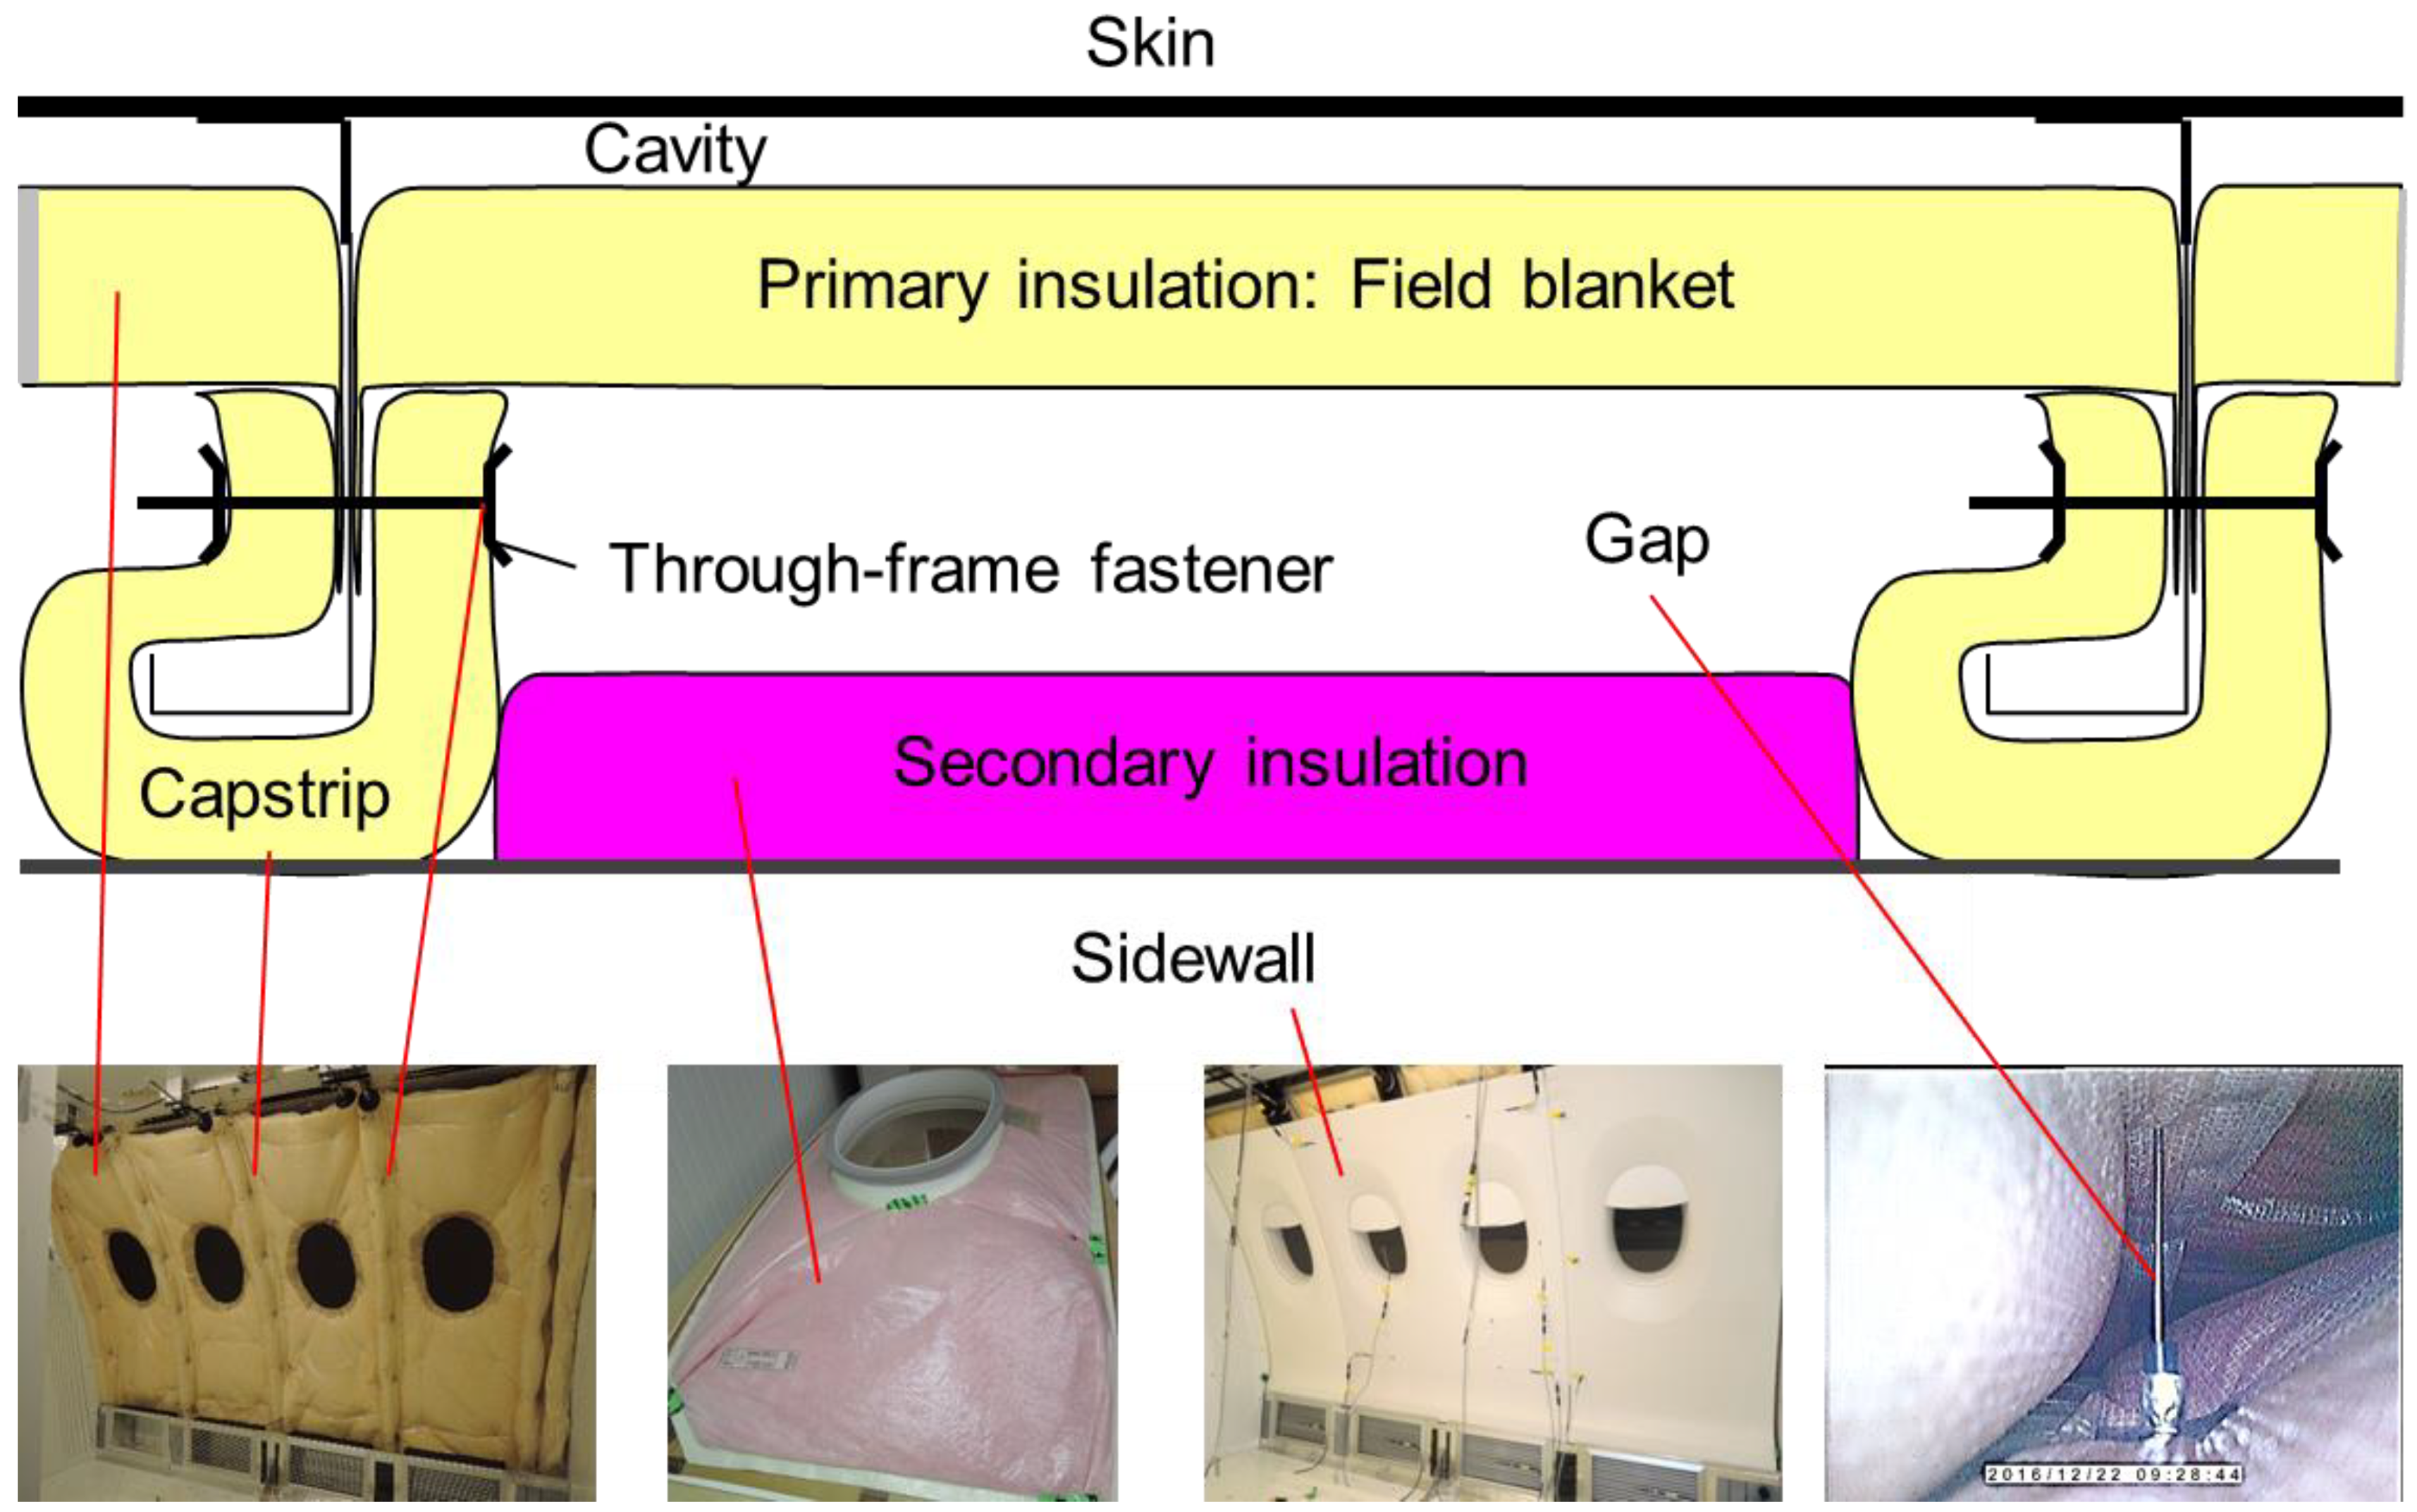
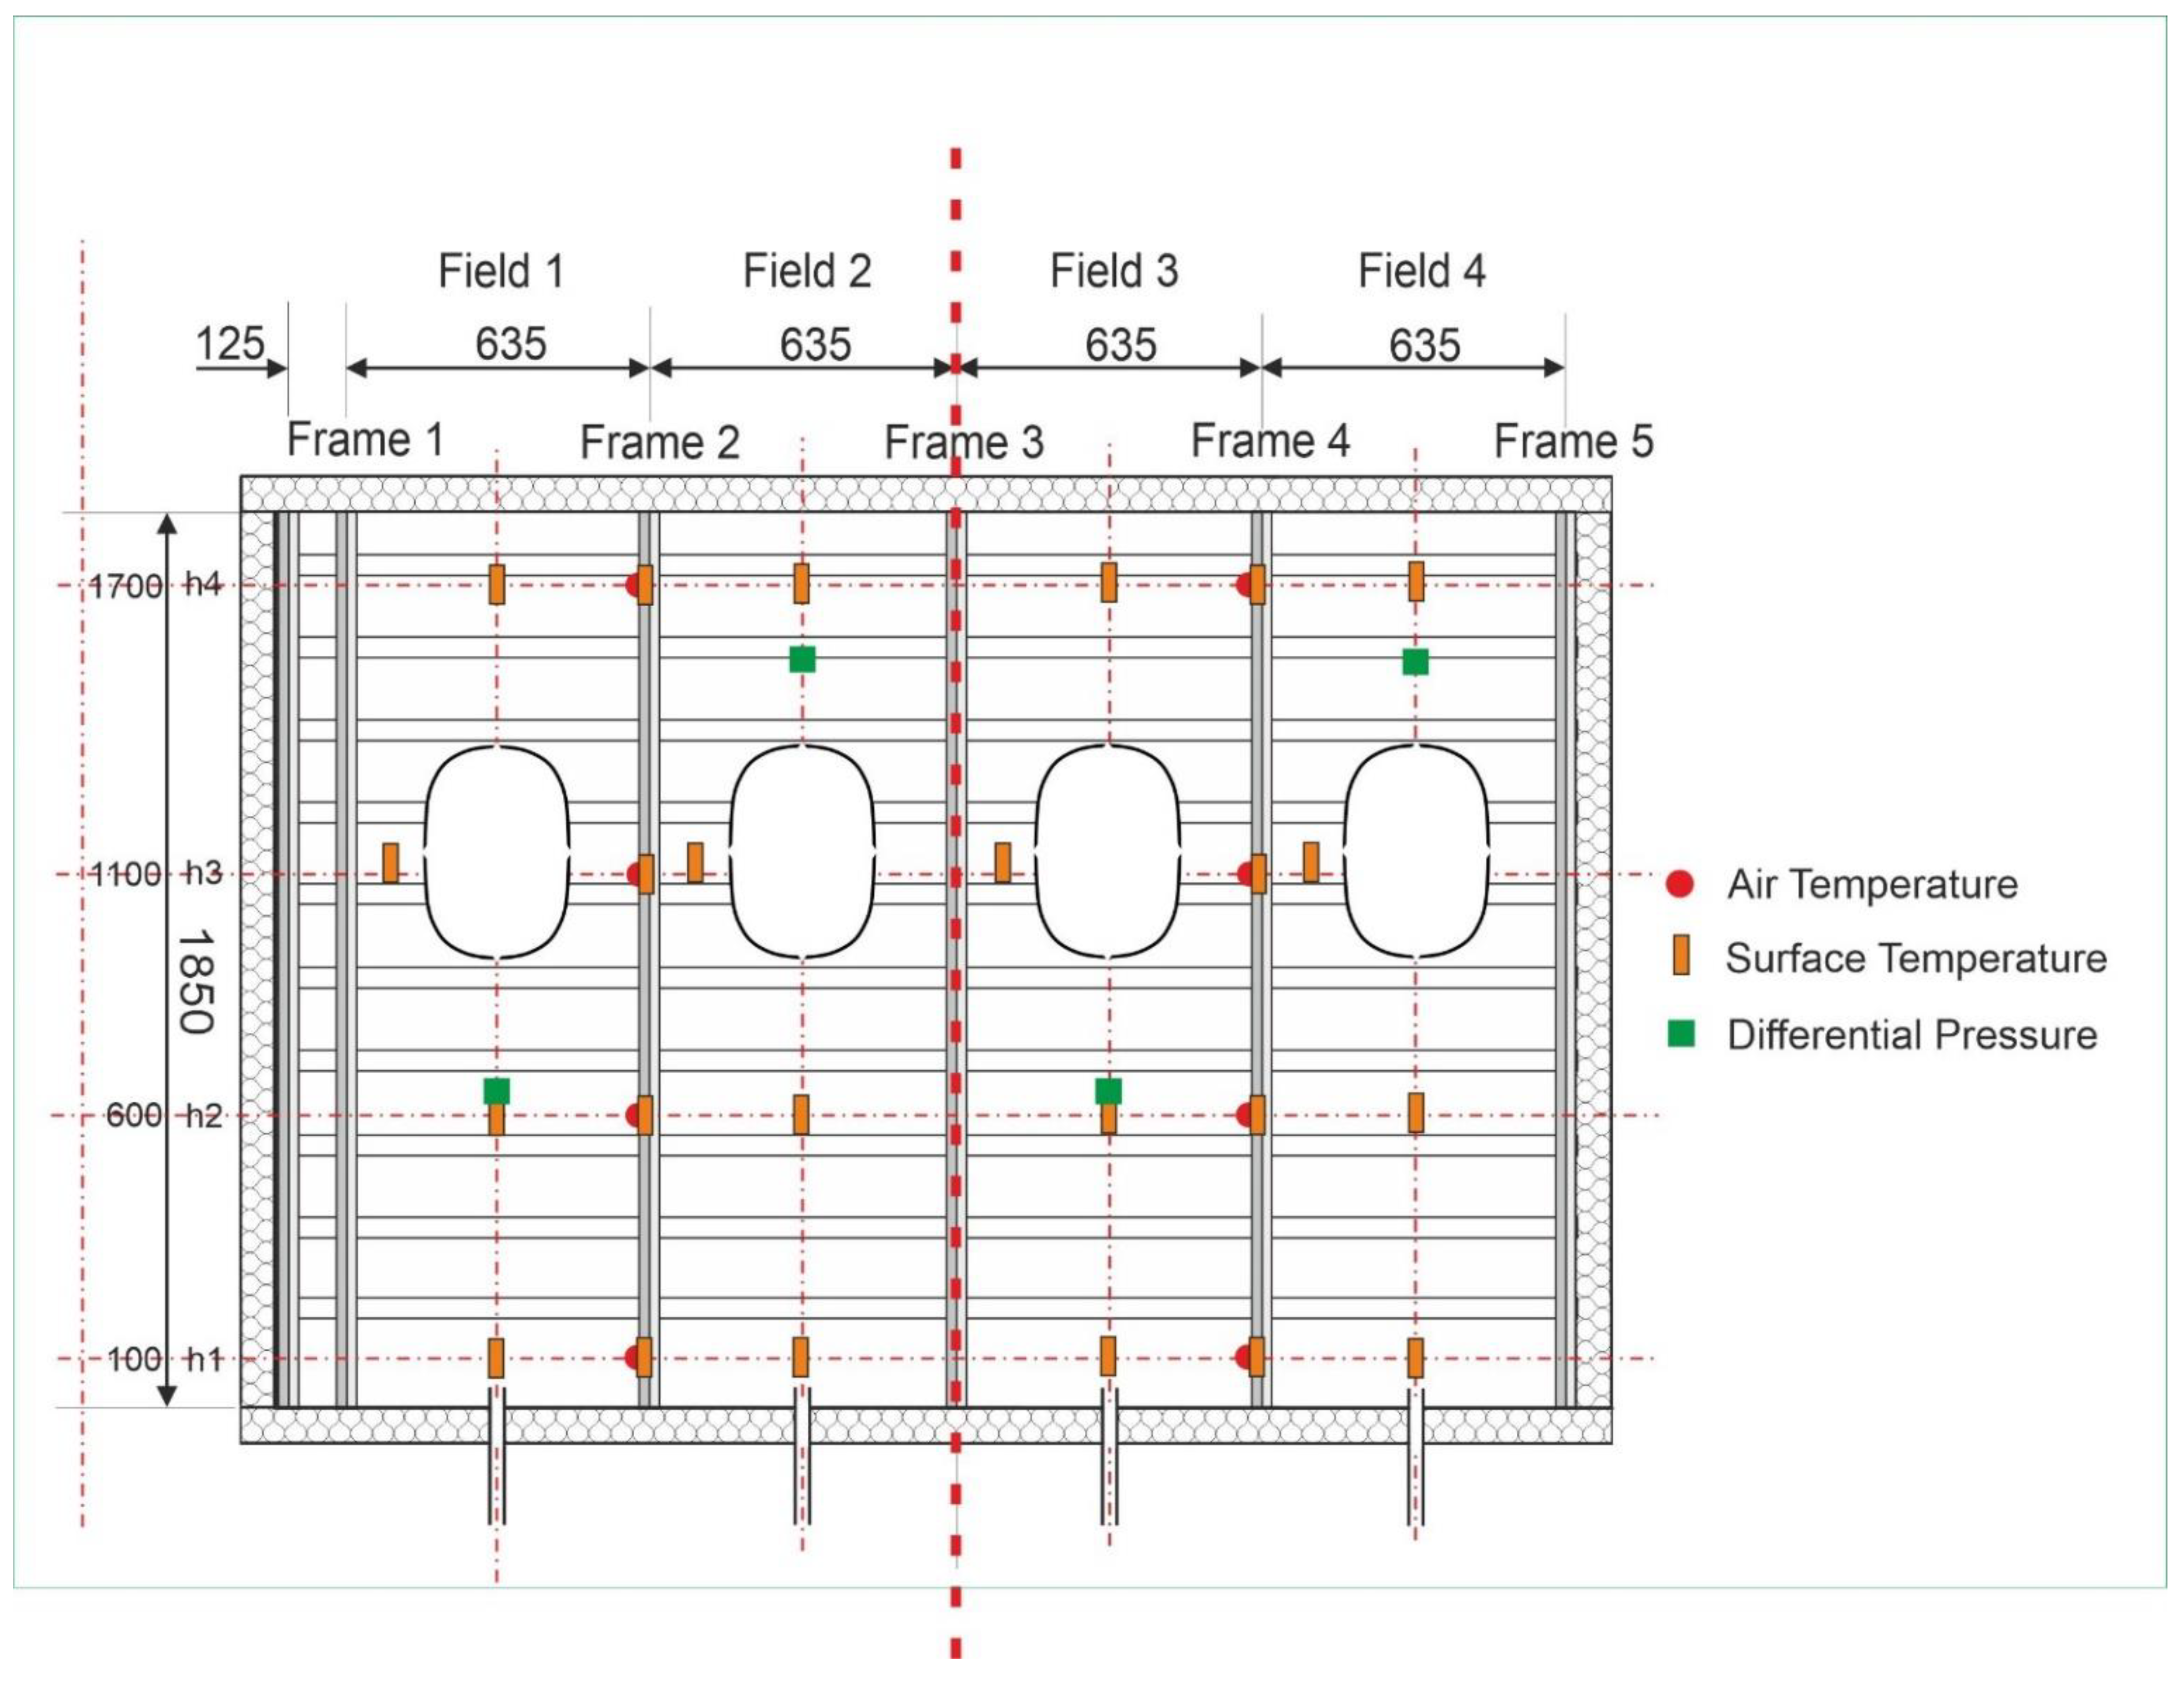
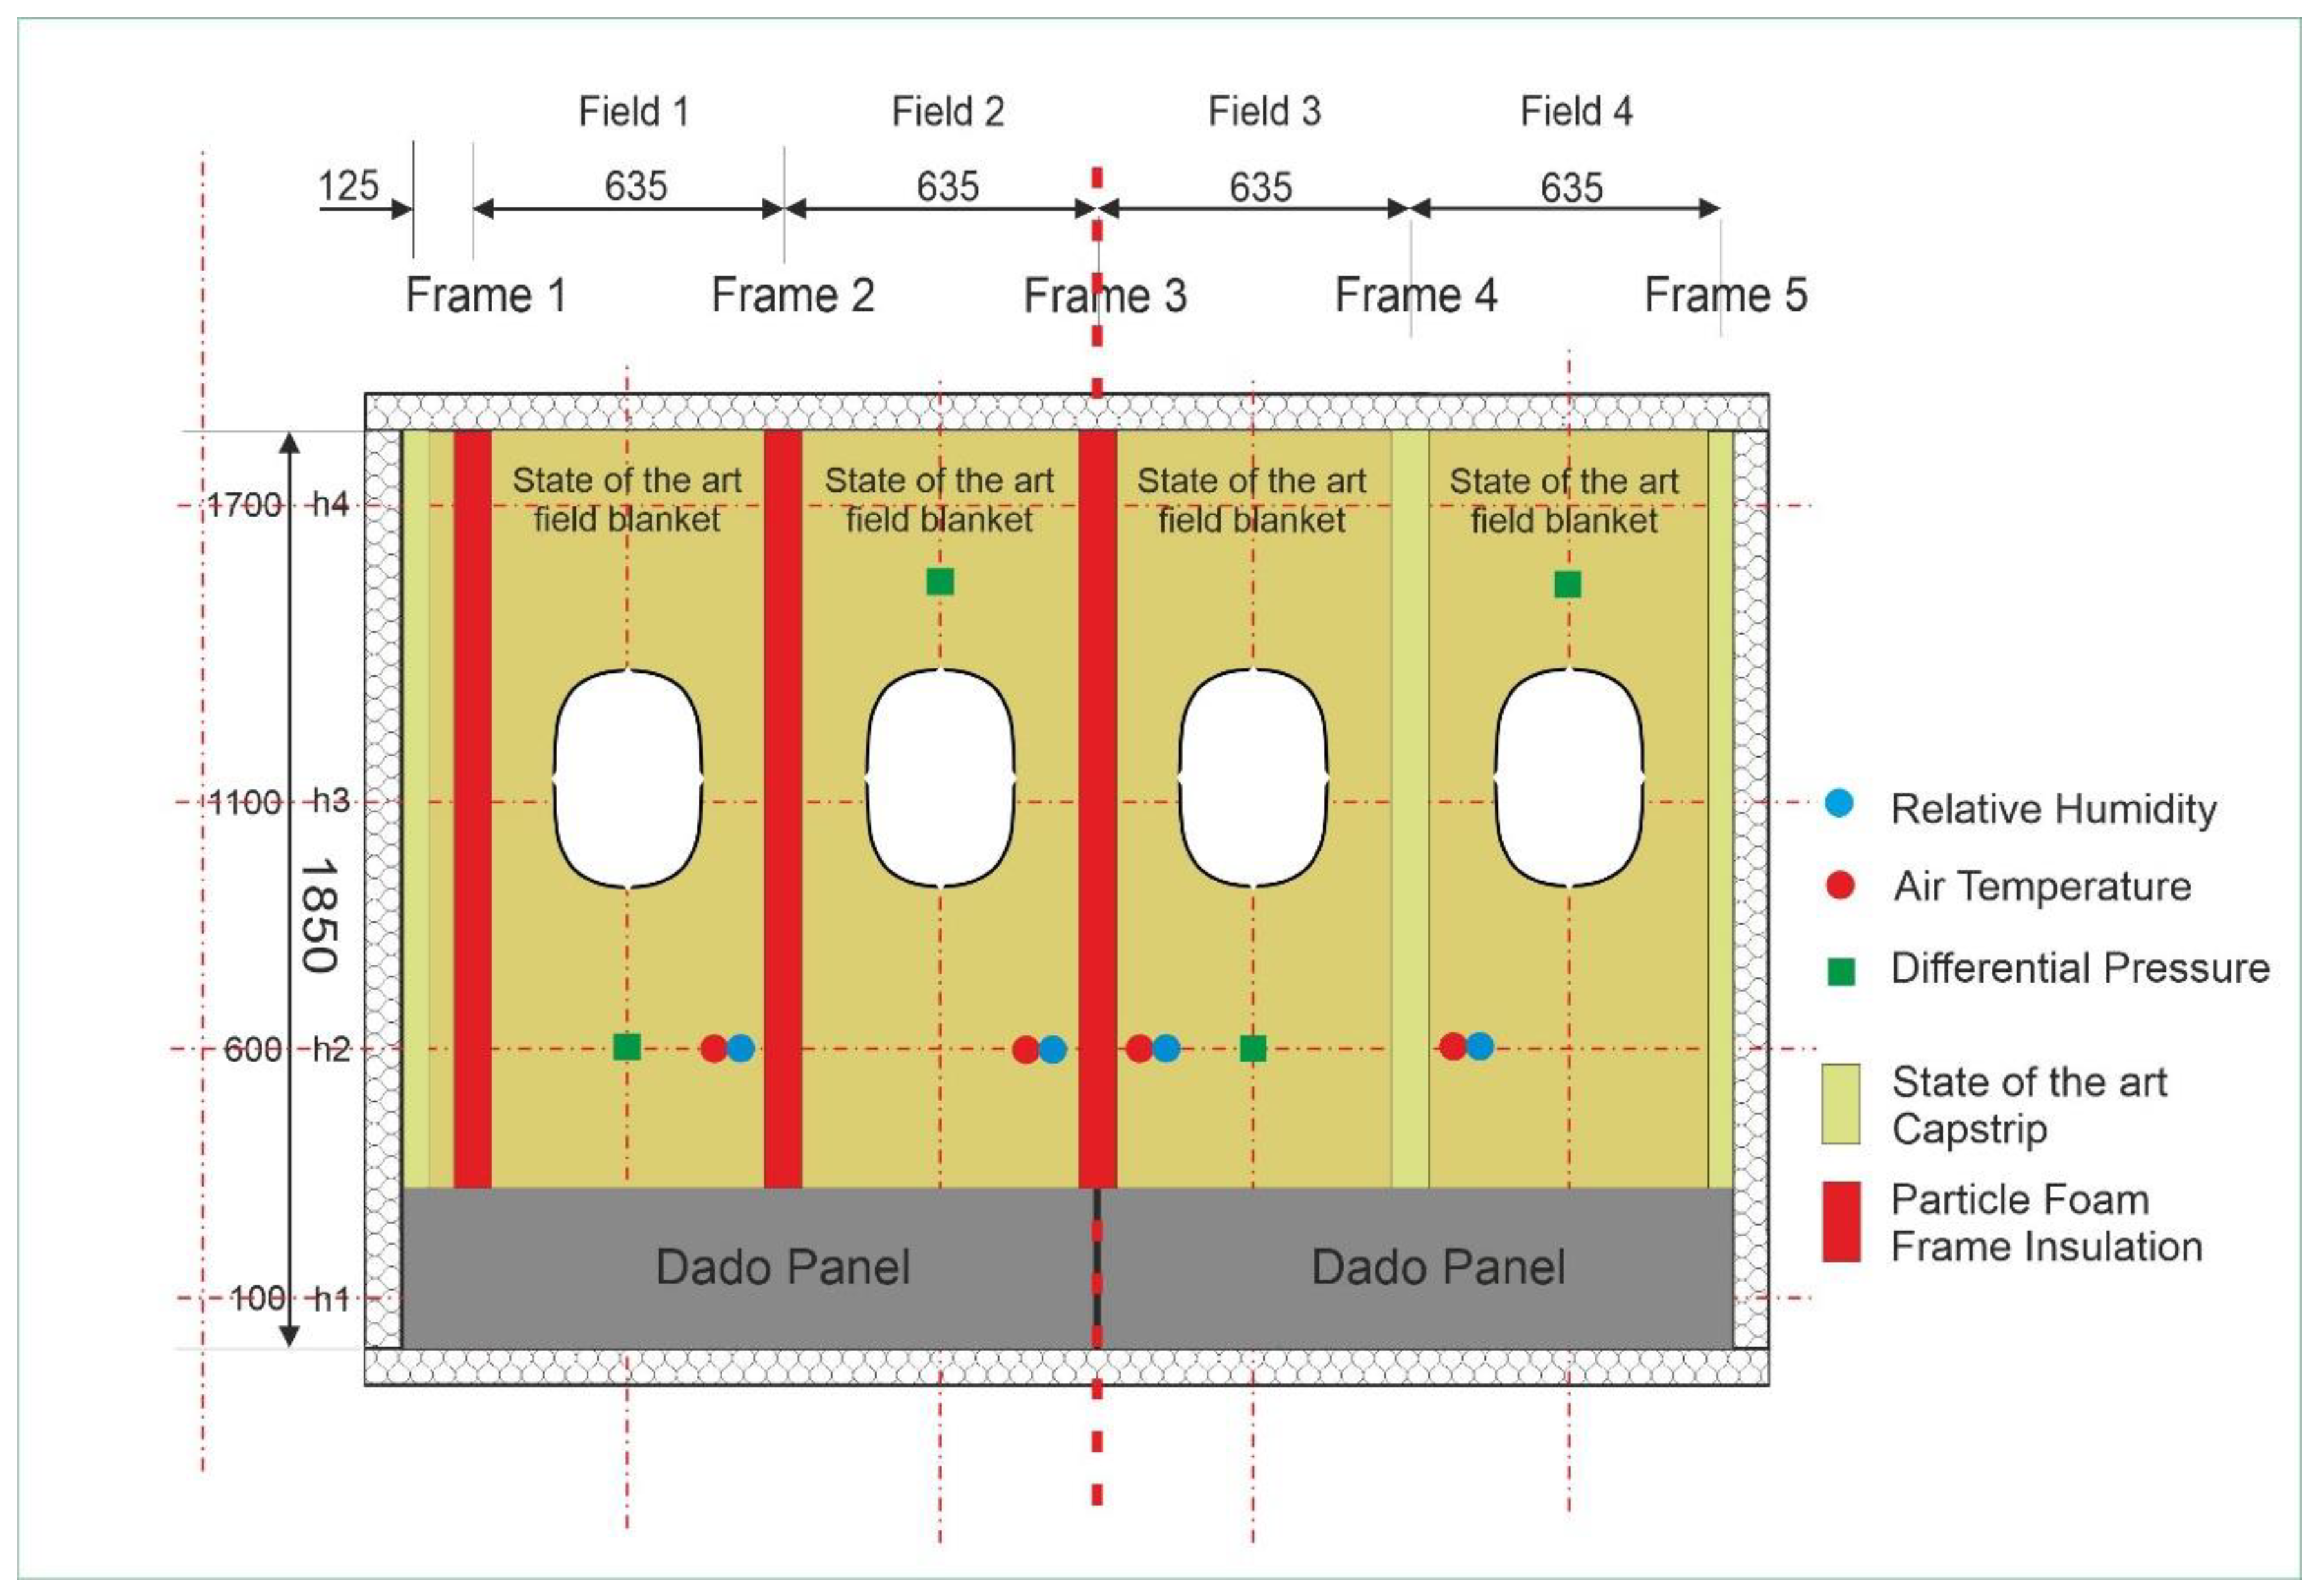
The insulation has the form of blankets and covers the frames and fields (
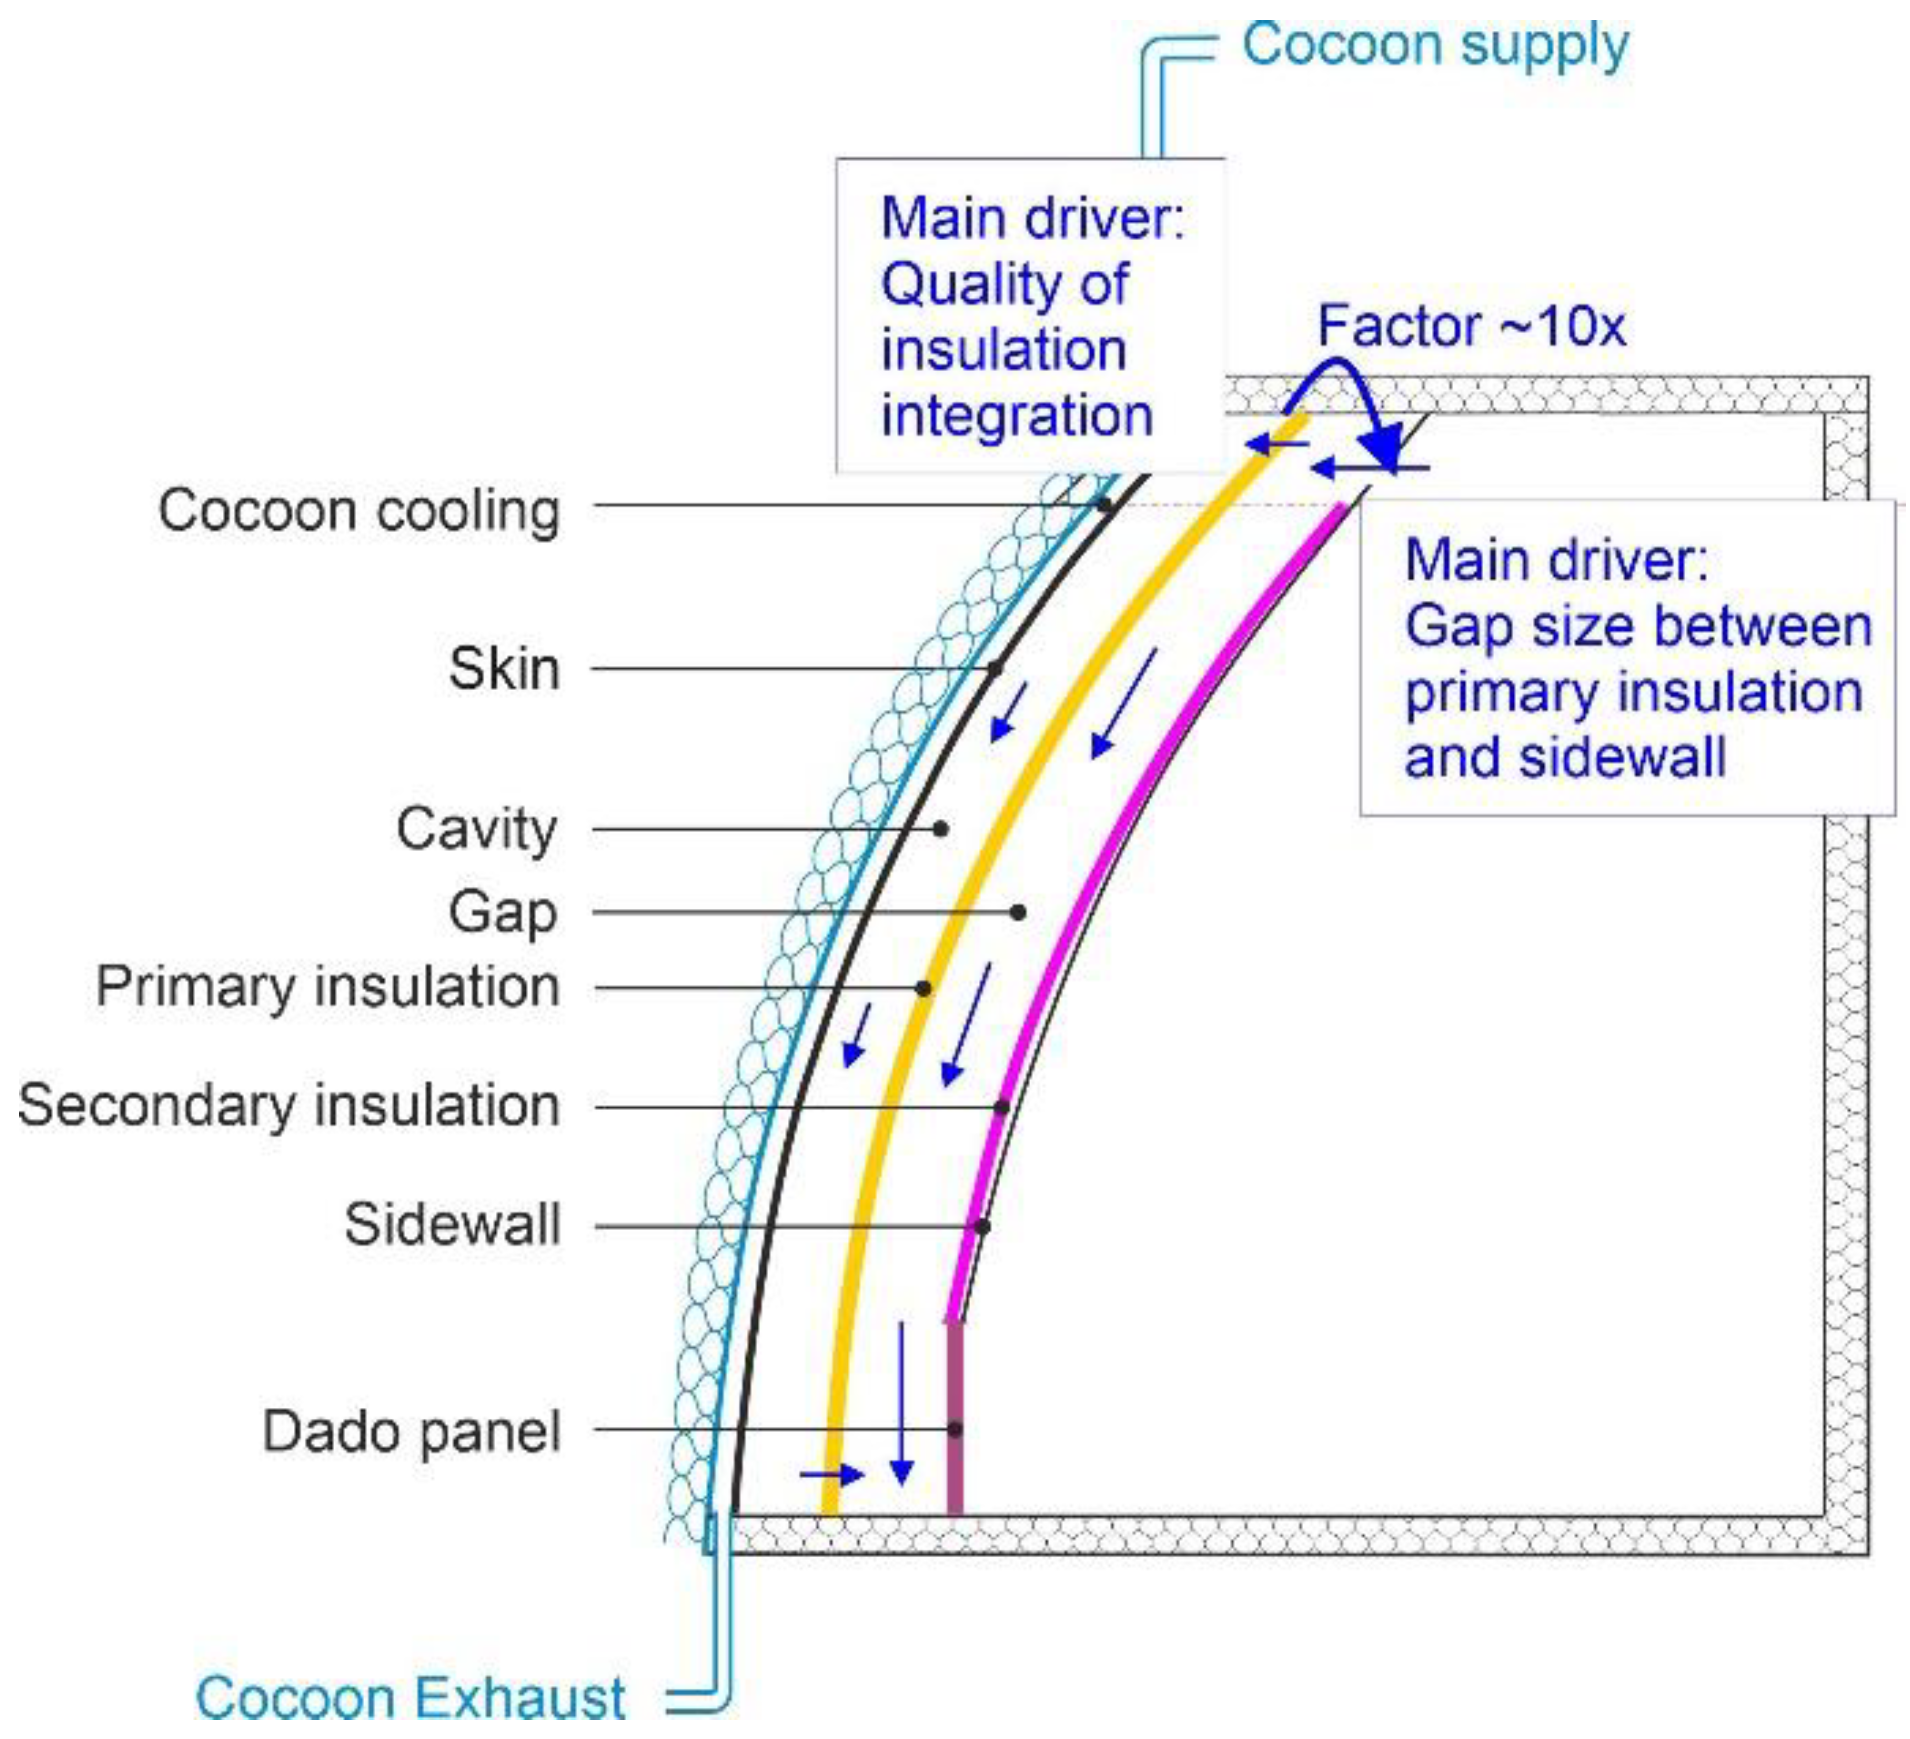
Figure 1). These blankets are flexible and compressible and thus can be wrapped around the aircraft structure The insulation concept used within this publication is deduced from [6] and extended where needed (
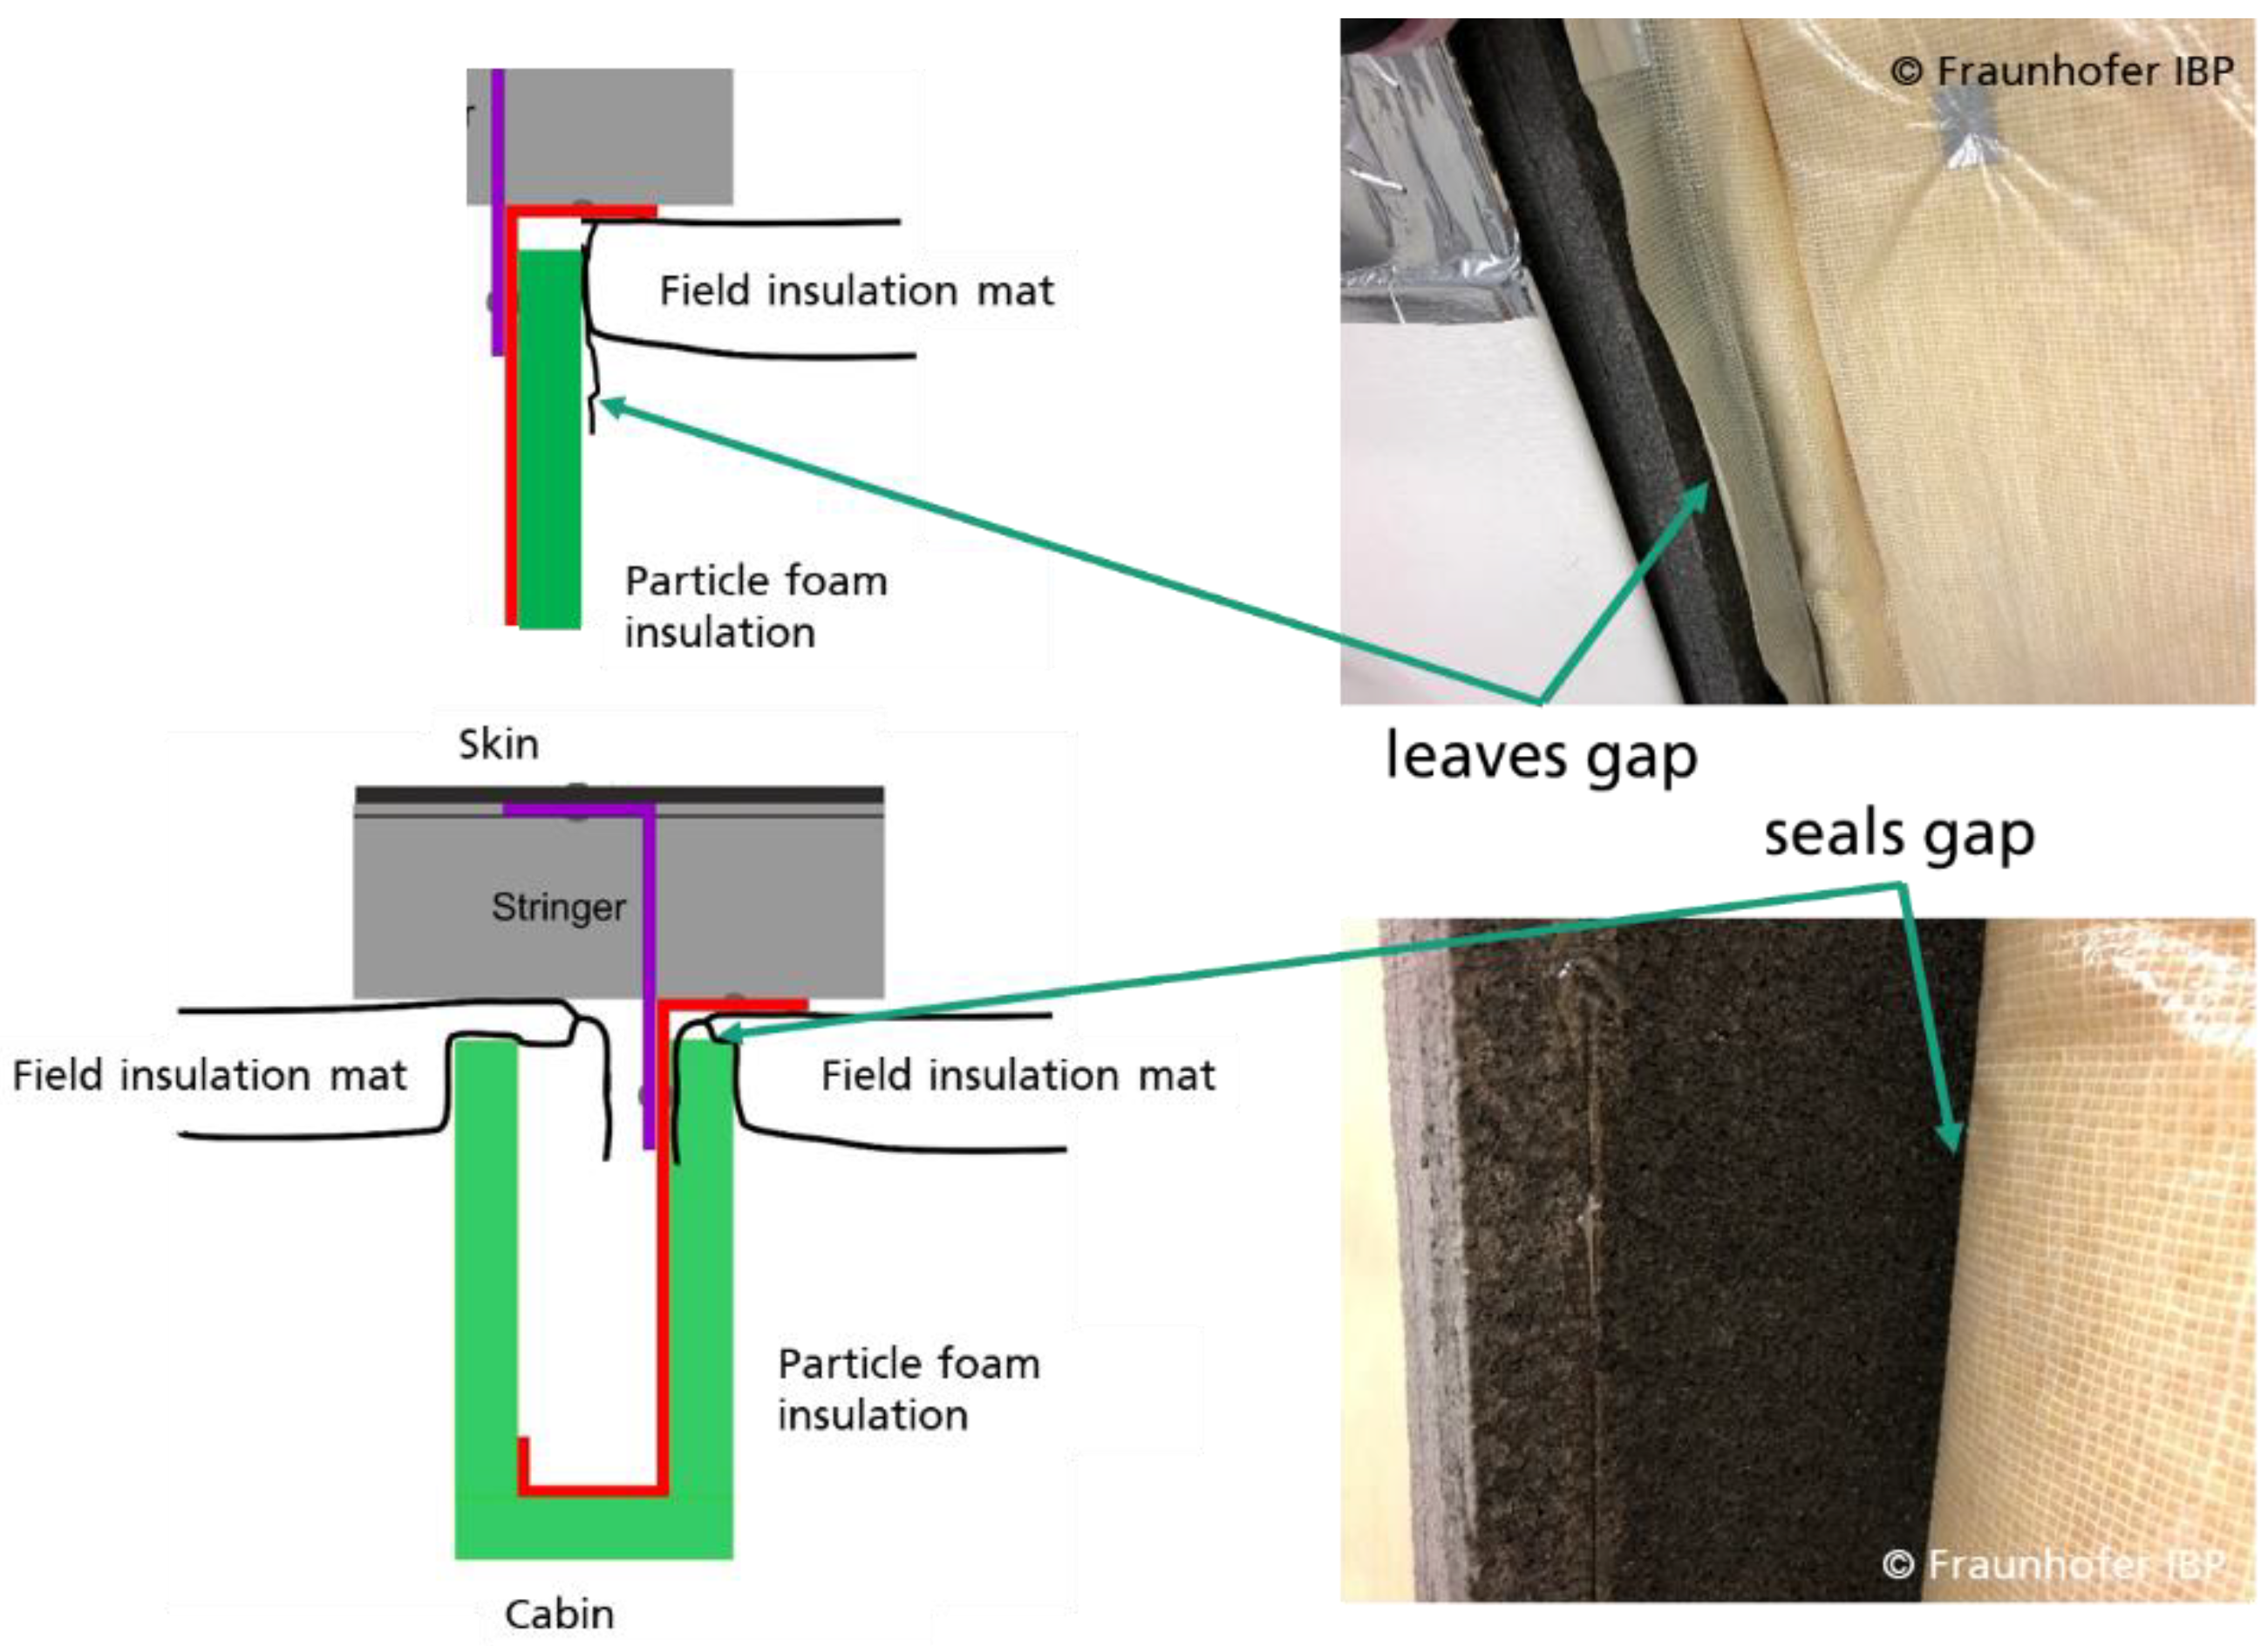
Figure 1). Within this publication, the “cavity” denotes the air gap between skin and the outboard side of the primary insulation blanket, and “gap” denotes the air gap between the primary insulation blanket and the sidewall and secondary insulation. Both air volumes are of undefined shape as they depend on the blanket deformations, structural obstacles, etc.
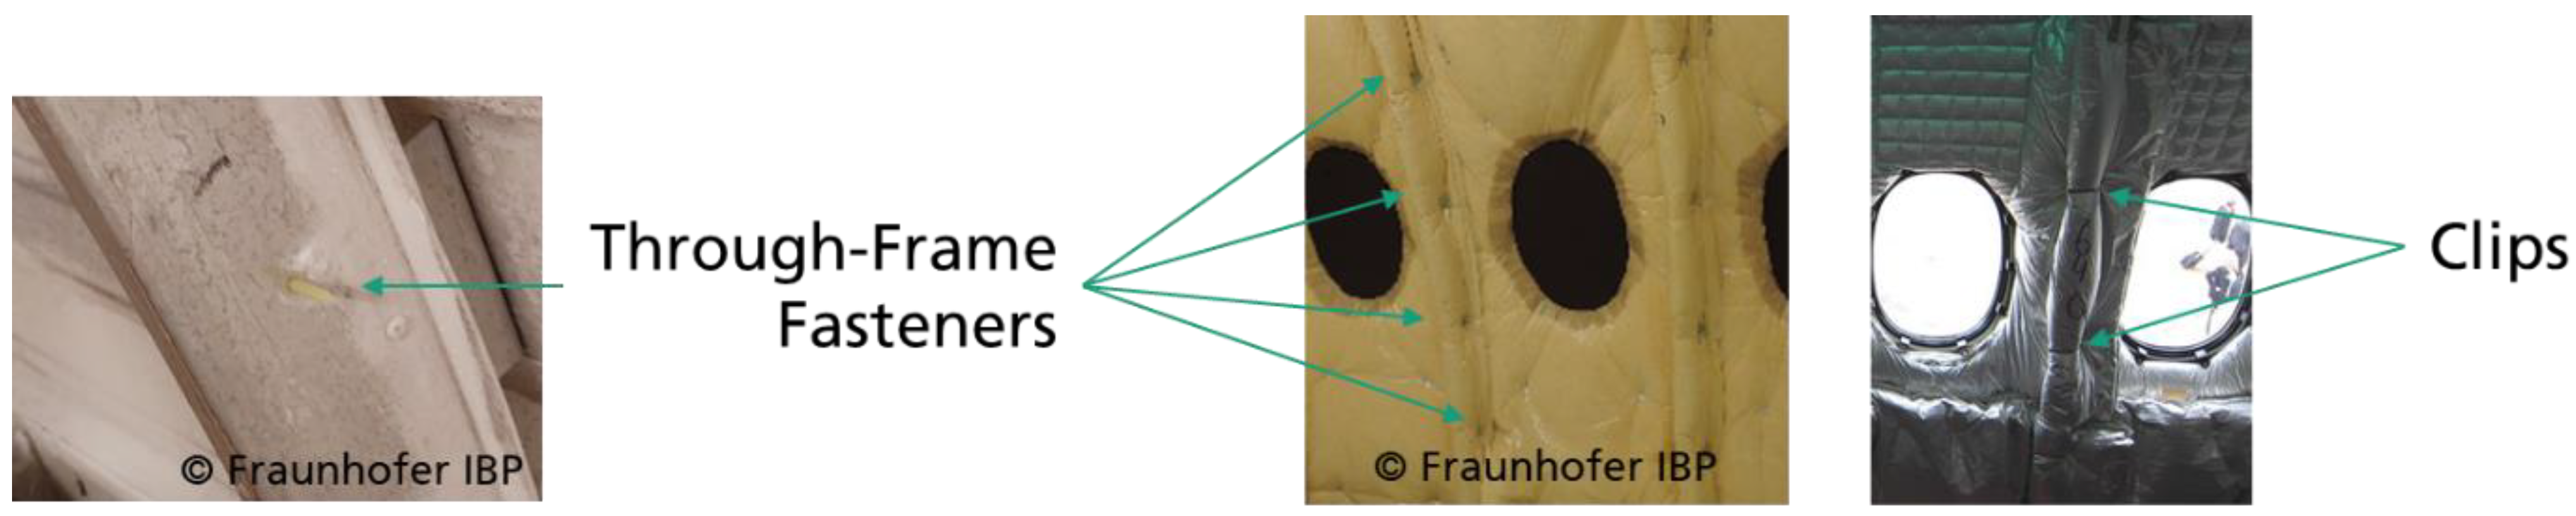
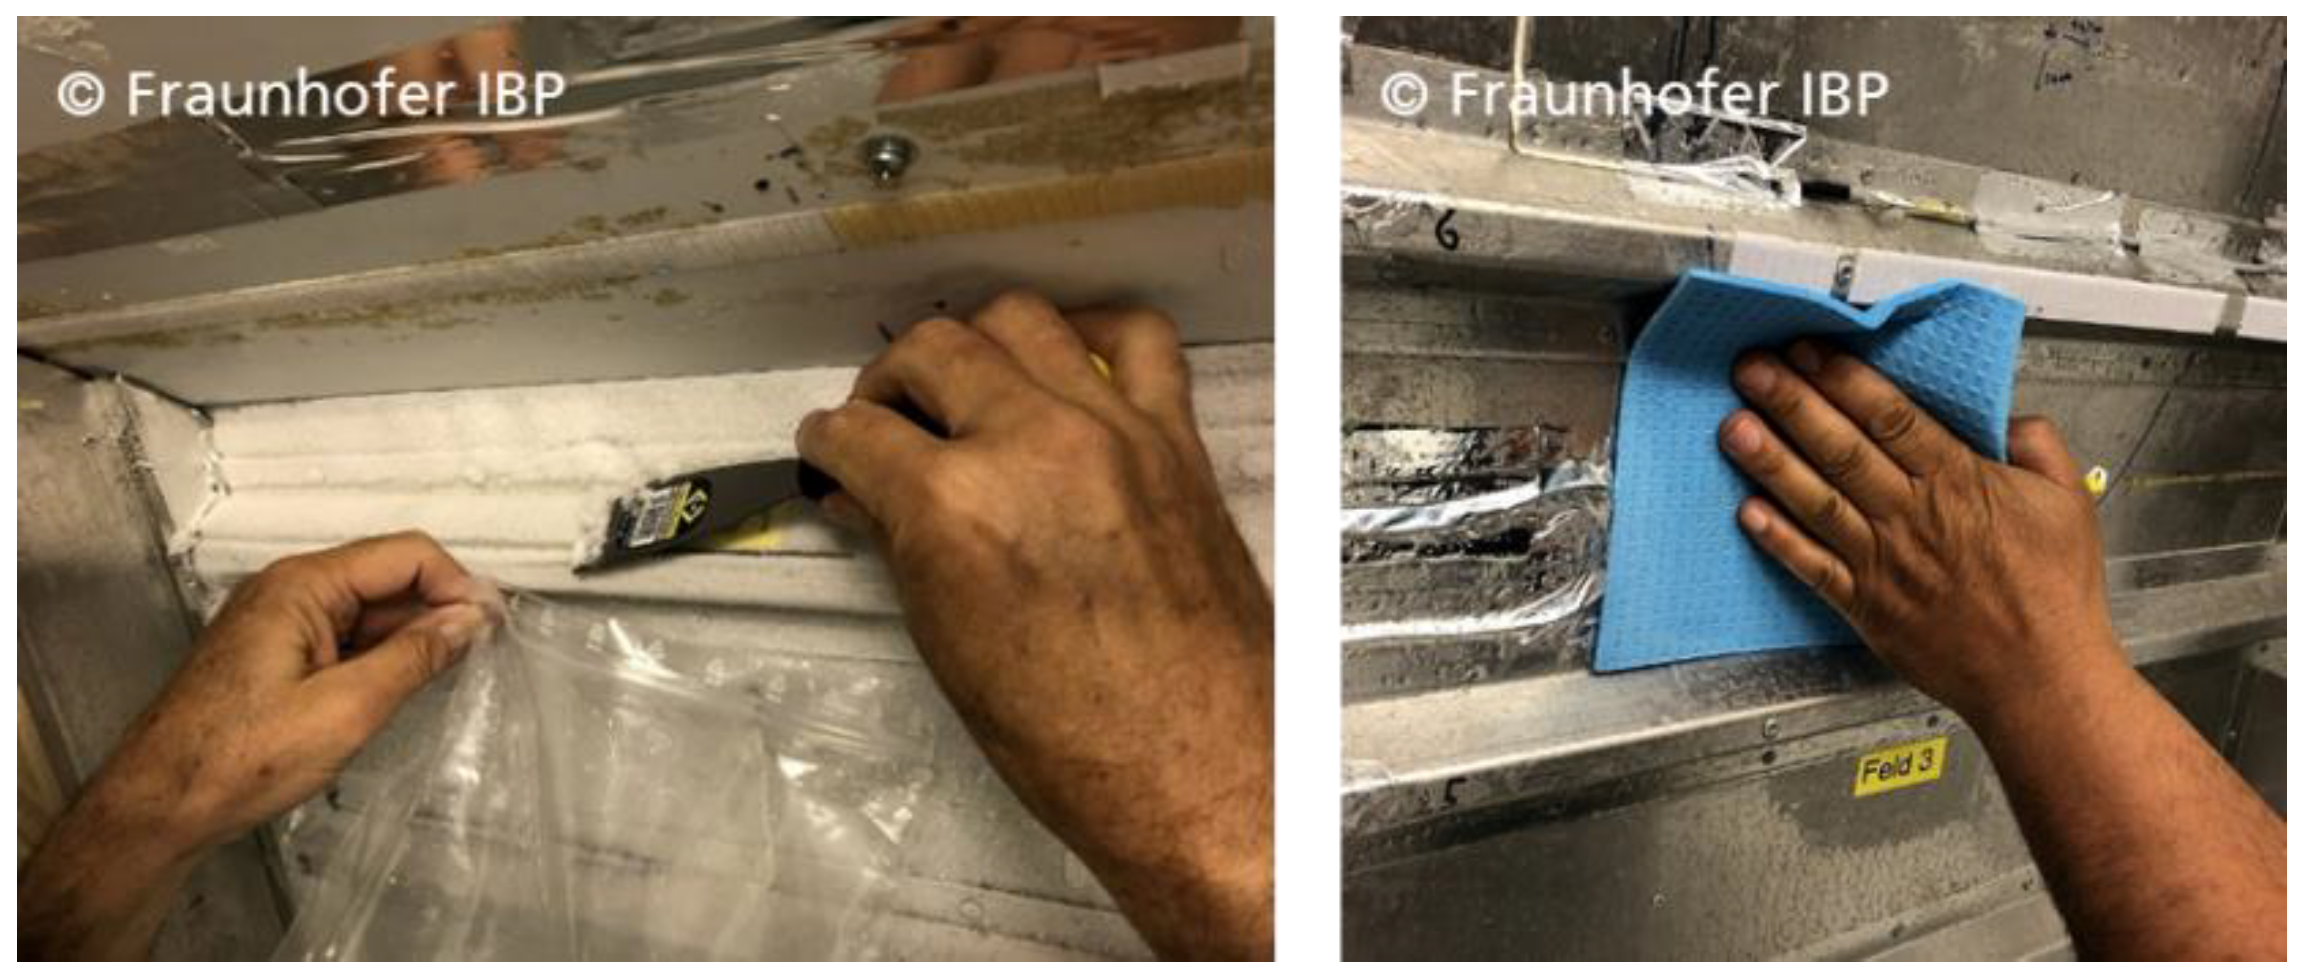
Whereas field blankets are comparably easy to install, the capstrip covering the frame requires more manual work. [6] demands that the capstrip should be fixed either with so called through frame fasteners or with brackets at least every 14” (35.5 cm, Figure 2). With this installation, the flexible capstrip blanket is adequately pushed against the field blanket to provide sufficient burnthrough resistance without leaving large, unprotected air gaps. Thus, a high amount of manual work is required to install this piece of insulation on the frame. With the use of a rigid particle foam capstrip, this installation effort is reduced because it clamps on the frame and does not require the fasteners.
In addition to the thermal protection, the insulation has a function of airflow and moisture barrier in the aircraft. The major source of moisture in the aircraft cabin is the water vapor emitted by passengers. In [7], a literature review was conducted on cabin air quality measurements and it was concluded that the average cabin relative humidity level amounts to 16% with a minimum of 0.9%. In a subject study, [8] found that the perception of dryness significantly increases after 90 min at low humidity levels of 10%. In [9], measurements were performed on domestic short-haul flights and found relative humidity levels in the cabin between 17.9% and 27%, which are typically reached after 15 min of flight. Based on the CO2 balance, the resulting fresh airflow rate was back-computed and a parametric study was conducted showing that a reduction in the fresh airflow rate would contribute to a higher and more comfortable cabin moisture content. [10] conducted a subject study with variable fresh airflow rates between 1.1 and 5.2 L/s per passenger in a cabin mock-up and found resulting relative humidity levels in the cabin between 13% and 33%.
Most of the emitted moisture vents out by the cabin ventilation system. Nevertheless, some moisture can accumulate by two major paths: through molecular diffusion into the blanket, driven by the water vapor pressure gradient between the warm inbound and the cold outbound blanket sides, and by convective transport of air towards cold structures. In order to prevent moisture from diffusing into the insulation blanket and being trapped, the cover film should have a sufficient moisture resistance. Reference [11] measured a 420 kg weight increase in the insulation blankets in an A310 during a D-check. The dependence of water uptake from the cover film’s moisture diffusion resistance is experimentally proven in [12], where a 75% reduction in accumulated water in the blanket could be achieved by using a cover film with the moisture diffusion equivalent length sd = 5.3 m instead of sd = 0.66 m. An sd-value of 1 m corresponds to the moisture diffusion resistance of a 1 m thick layer of stagnant air.
Due to the temperature difference between the warm cabin and crown section and the cold exterior skin, a stack pressure forms [13,14], resulting in a pressure difference and consequently an airflow towards the skin cavity in the upper section of the aircraft envelope. Reference [13] estimates the magnitude of the driving stack pressure to around 4 Pa and shows the correlation between of the sizes of leakages in the insulation layer and the resulting air ingress. Reference [15] developed a simplified test setup representing a field section of the cabin sidewall and investigated the frost buildup with and without insulation blanket installed. It was found that the installation of an insulation blanket reduces the frost by a factor of 40, compared with guiding the airflow across the uncovered skin. Hence, a careful installation of the insulation blankets helps reducing the airflow to cold structure. Even though passengers often perceive the air as dry, its dew point in cruise is at about −10 °C and thus above typical fuselage temperatures in cruise. As a result, frost will form on the cold structure outboard the insulation. On ground, most of this ice drains after melting by a suited installation of the insulation blankets similar to roof shingles. However, some water may flow in an uncontrolled way and ultimately drip into the cabin [16] (“rain in the plane”). Reference [11] reviews data from a survey conducted by [16] on the B757 fleet and concludes an average daily amount of water condensation of 91 g per field (area between two frames).
Hence, the careful installation of the insulation blankets is crucial to reduce moisture-related issues in the aircraft. As this installation requires a high amount of manual workforce in the production line, new concepts with at least equal functional performance are of interest. The research presented in this paper conducts an experimental investigation into what extent a rigid particle foam insulation on the frame provides the same level of protection against air ingress and thus frost formation as the conventional capstrip.

2. Materials and Methods

The tests of the particle foam insulation are carried out in the Lining and Insulation Test Environment (LITE) chamber of the Fraunhofer IBP in Holzkirchen, Germany. The chamber is constructed for the experimental investigation of aircraft insulation systems. It consists of an aluminum fuselage with five frames thus resulting in four fields. The floor area is 2.89 × 1.74 m, and it is 1.86 m high (Figure 3). The chamber walls are insulated to limit thermal losses. In an airliner, the chamber section would accommodate approximately nine economy passengers.

2.1. Airflow Patttern

Figure 4 depicts the ventilation system of the LITE chamber. In order to condition the exterior fuselage, a cocoon is built leaving an approximately 5 cm wide air gap. This gap is flushed with conditioned air in order to represent cold exterior conditions or hot day on ground. An air conditioning system providing heating, cooling and humidity control ventilates the chamber to represent the cabin climatic conditions. In the real aircraft, the cabin extraction would flow through the dado panel resulting in a pressure drop between the cabin and the gap behind the sidewall. As a result, some air may overflow behind the sidewall through leakages, for example behind the stowage bins. This air flows downwards through the gap between primary and secondary insulation and some air may leak into the cavity behind the primary insulation. This leakage is actively generated using an exhaust fan in the LITE chamber. An opening on the suction side of the HVAC system ducting compensates the excess of air removed by the extraction fan behind the dado panel.

2.2. Sensor Distribution

Figure 5 shows the skin sensor distribution for the test conduct. Surface temperatures of the fuselage are measured in four heights in all four fields. Two frames are equipped with surface temperature sensors and air temperature sensors to determine the air temperature in the cavity between frame and insulation. To measure temperatures, four-wire PT100 sensors are used with an accuracy of 0.1 K @ 20 °C according to DIN EN 60751 class A [17]. The pressure difference between cavity and cabin is measured in four positions using Fischer DE23 sensors (FISCHER Mess- und Regeltechnik GmbH, 32107 Bad Salzuflen, Germany) with an accuracy of 1% in the range ±25 Pa.
Figure 6 shows the sensor distribution on the primary insulation. The temperature and humidity (Rotronic HygroClip HC2-C05 sensor with an accuracy of ±1.5% RH, rotronic messgeräte GmbH, 76275 Ettlingen, Germany) in the gap are measured, as well as the pressure difference between cabin and gap. The left pressure difference at 600 mm height is used as reference pressure for the control of the extraction fan behind the dado panel.
The surface temperature of the sidewall is monitored using infrared cameras taking one picture every minute (type Optris PI 640, post processing with software Optris PI connect, Optris GmbH, 13127 Berlin, Germany).

2.3. Specimen Installation

For the experimental testing program, the fuselage section is split into two subsections. On the left section, the frames are covered by the particle foam insulation, whereas on the right side, the conventional capstrip with through-frame fasteners is used. The primary field insulation blankets are of the same type on all sections. Through this installation, three major types of leakages emerge (Figure 7):
  • Between the particle foam frame insulation and the field blanket.
  • Between the capstrip and the field blanket.
  • On the upper and lower edges of the field blankets.
Gaps in the middle frame connecting the second and third field are thoroughly sealed to avoid lateral flows behind the primary insulation.
The particle foam insulation is manufactured from EPERAN PP MH24 [18], an expanded polypropylene material. The density of the particle foam insulation is 60 kg/m³ and its thermal conductivity is 0.043 W/(m·K). All other insulation blankets are made of classical glass fiber insulation wrapped in foil, as used in the aircraft, with a thermal conductivity of 0.03 to 0.04 W/(m·K) and a density between 6.7 to 24 kg/m³ [3]. Thus, the thermal conductivities of particle foam and state of the art insulation are comparable, whereas densities noticeably differ.
The primary insulation layer is covered with sidewall lining panels (Figure 8). On the rear side, state of the art secondary insulation is fixed. This insulation consists of glass fiber blankets wrapped in foil. The window openings in the sidewall are plugged with Styrofoam bluff bodies to align with the field blanket and seal the opening against air ingress.
The sidewall is supported on its lower edge by a U-bar mounted on top of the reconstructed dado panel (black lower panel in Figure 8). On the upper edge, it is prolonged with a self-constructed structure and pressed against the frame using stamps attached to threaded bars that are fixed on the ceiling. The top structure leaves an overflow path between cabin air and the gap between primary and secondary insulation. In the aircraft, such a gap is not visible to the passenger but is present behind the stowage bin.

2.4. Test Matrix

The testing program is designed to answer two major questions from a hygrothermal point of view:
  • Does the installation sequence of the insulation parts influence the condensate?
  • Can the material thickness be reduced to save weight?
The first question addresses the sensitivity of condensate buildup towards optimizations in the installation process. In order to address this, the installation sequence of the insulation pieces is altered (Figure 9). In a first test, the frame insulation is first installed and then the field blankets are put between the frames. Thus, a somewhat undefined gap prevails between frame insulation and blanket. As this procedure requires less careful manual work, it is considered the low quality, uncareful installation. In the second test, the field blankets are first installed, and it is made sure the blankets’ edges are clamped by the particle foam insulation. This is considered to be a careful and high-quality installation. Both tests are conducted using a frame insulation of 20 mm thickness.
In order to investigate the potential to reduce material, a third test is performed using 10 mm thick frame insulation carefully installed to clamp the field insulation.

2.5. Test Conduct

The boundary conditions summarized in Table 1 are applied. Cabin humidity is exaggerated in order to receive a clearer frost buildup distinction between the test cases.
After the exposure, the sidewall and the insulation are removed. The condensate buildup is photographed, and the quantity is assessed by weight difference after scratching frost into a bag and wiping melted water from the structure with a sponge (Figure 10). The inherent uncertainty of this method is that not all moisture can be collected because some water may be unreachable in corners, and drips off when melting or evaporates. In order to reduce the impact of such uncertainty, the exposure time was selected as several hours, and the cabin moisture was increased to obtain a noticeable amount of condensate. The uncertainty of the weight difference between the dry and wet sponges and bags is considered negligible because a sufficiently accurate scale was used. Overall, the weighted water mass thus presents a lower limit measurement, but covers the major amount.

3. Results

Tests are started at 9:30 in the morning. 1 to 1.5 h later (11:00), the skin surface temperature, cabin temperature and flow rates, differential pressures, etc., show stable conditions. For the following analysis, temperatures are averaged between 13:30 and 14:30 in order to ease comparisons between the tests. The exposure finishes at 16:30 with switching off the ventilation and cooling system, dismounting the sidewall and collecting frost and water from the skin.

3.1. Cabin Boundary Conditions

For all three tests, the boundary conditions in the cabin are similar within 1.5 K and lead to comparable results as depicted in Table 2. Thermal stratification remains below 0.5 K and is thus negligible.

3.2. Sidewall Surface Temperature

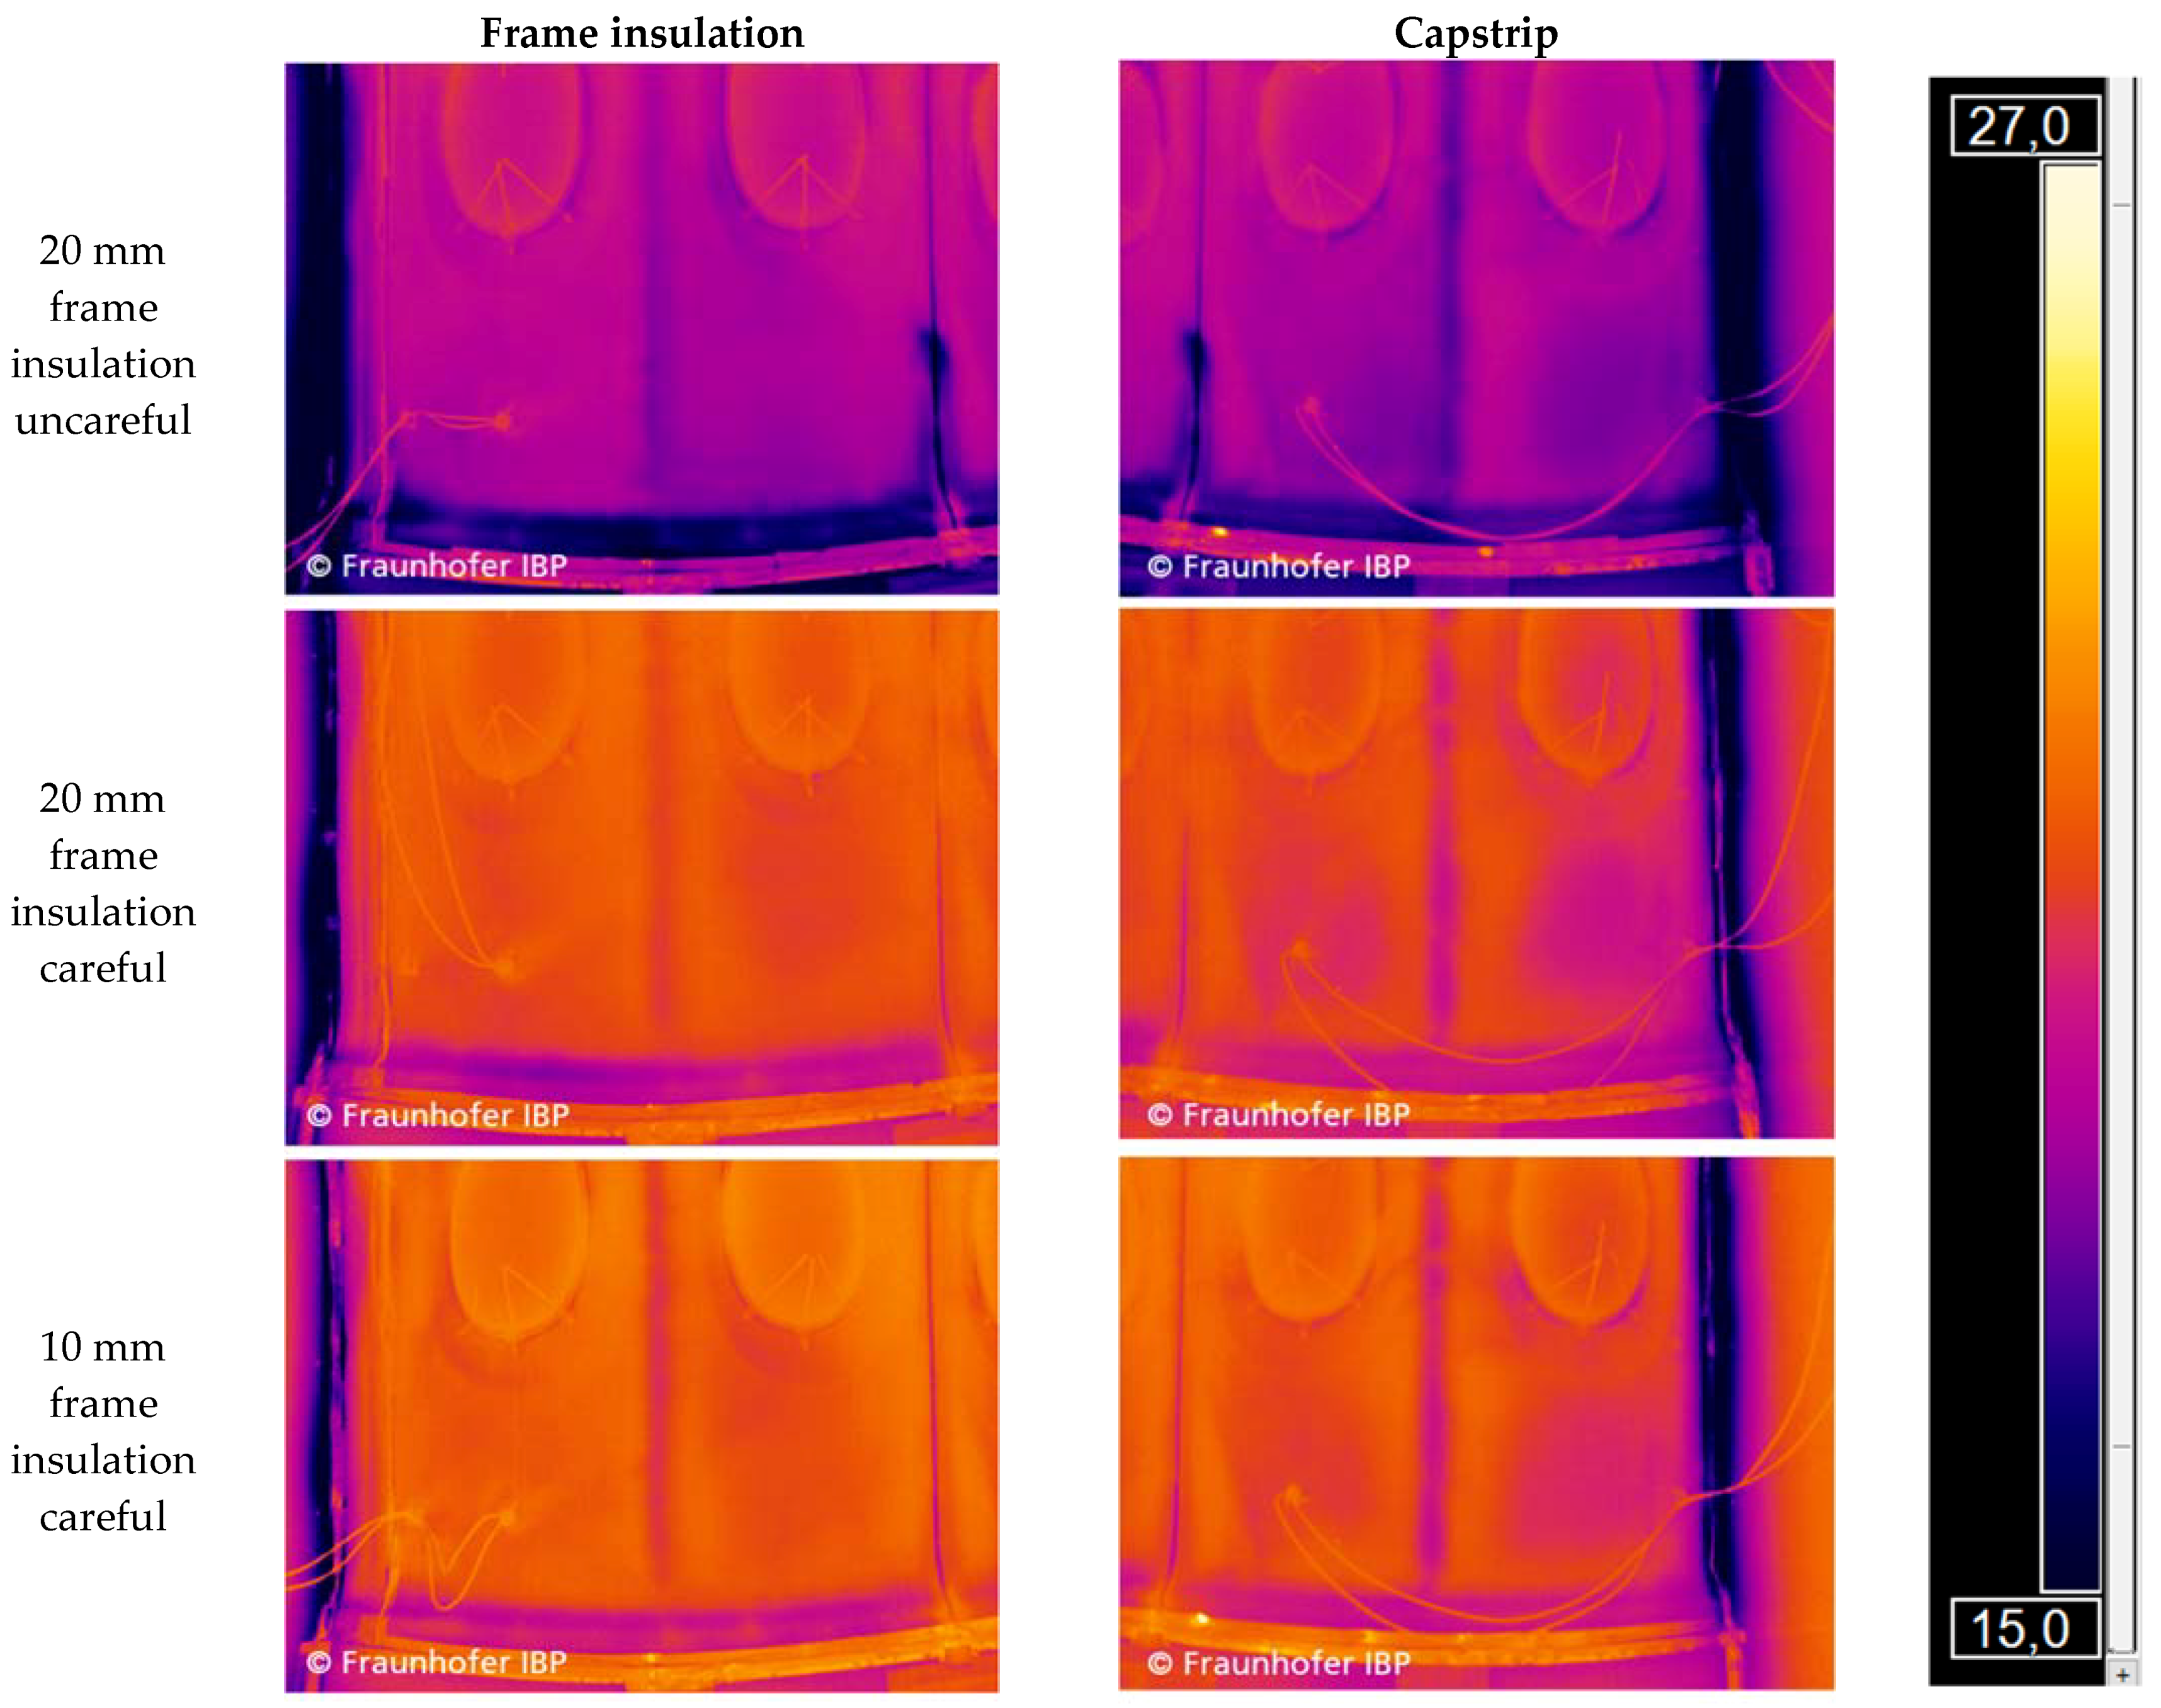
Figure 11 shows the IR signature of the frame insulations on the lower sidewall surface. It can be seen that the section on top of the particle foam frame insulation is warmer than the section on top of the state-of-the-art capstrip. The reason is that the capstrip is compressed by the sidewall, whereas the particle foam insulation remains rigid. The thicker (20 mm) particle foam insulation results in higher surface temperature than the thinner one (10 mm). Even through the effect is visible, its magnitude is not considered to have an impact on the passenger comfort due to the relatively local confinement.

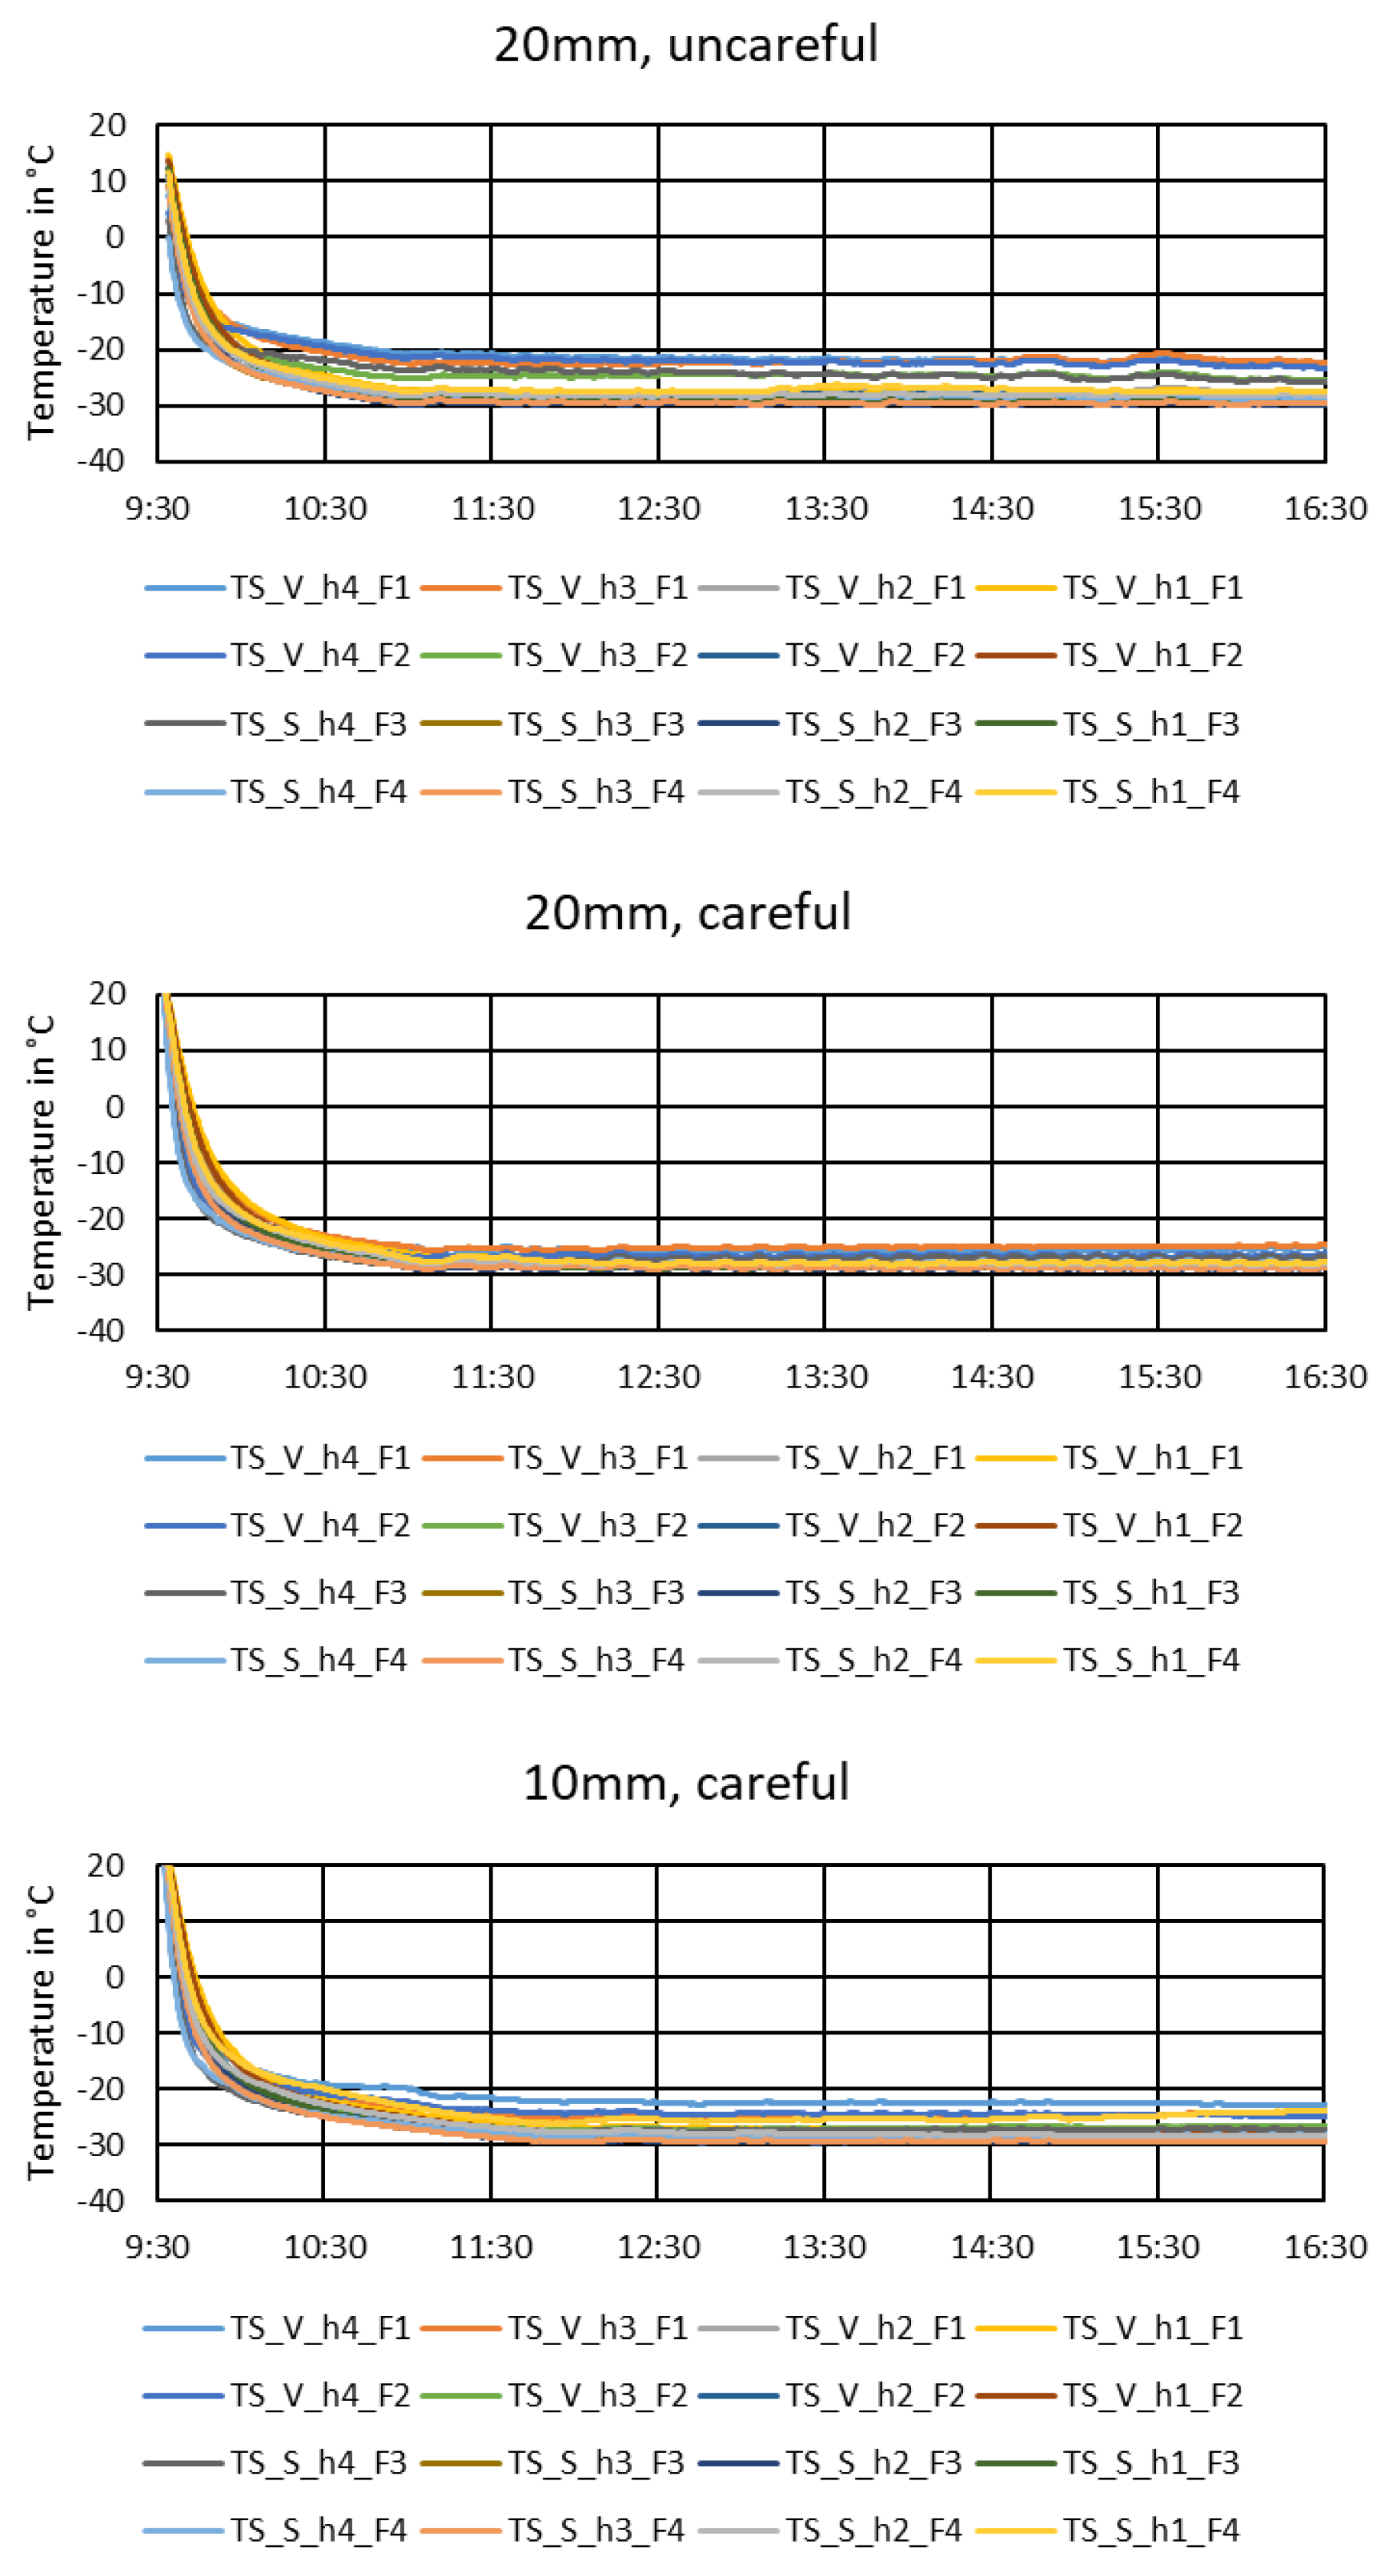
3.3. Skin Temperatures

For all tests, skin temperatures between −21.5 and −30.1 °C are measured with an average value of −27.2 °C. This corresponds to a saturation water vapor fraction of 0.5 to 1.0 g/m³. Thus, the difference between the cabin humidity and this residual humidity contained in air after contact with the cold skin determines the frost buildup potential.
Figure 12 shows the measured inboard skin surface temperatures. The pulldown after activation of the cocoon cooling is performed within approximately 1 to 1.5 h. For the remaining 5.5 to 6 h of the test, the temperatures remain rather constant. A real aircraft in operation probably would have faster pulldown because the external heat transfer coefficient during flight is higher due to the elevated cruising speed of the aircraft. Furthermore, typical air temperatures at flight altitudes are lower than the cocoon cooling provides. The duration of the temperature stabilized phase, and thus a constant frost buildup rate would depend on the length of the flight, ranging from only few minutes for short-haul flights to several hours for long-haul flights.

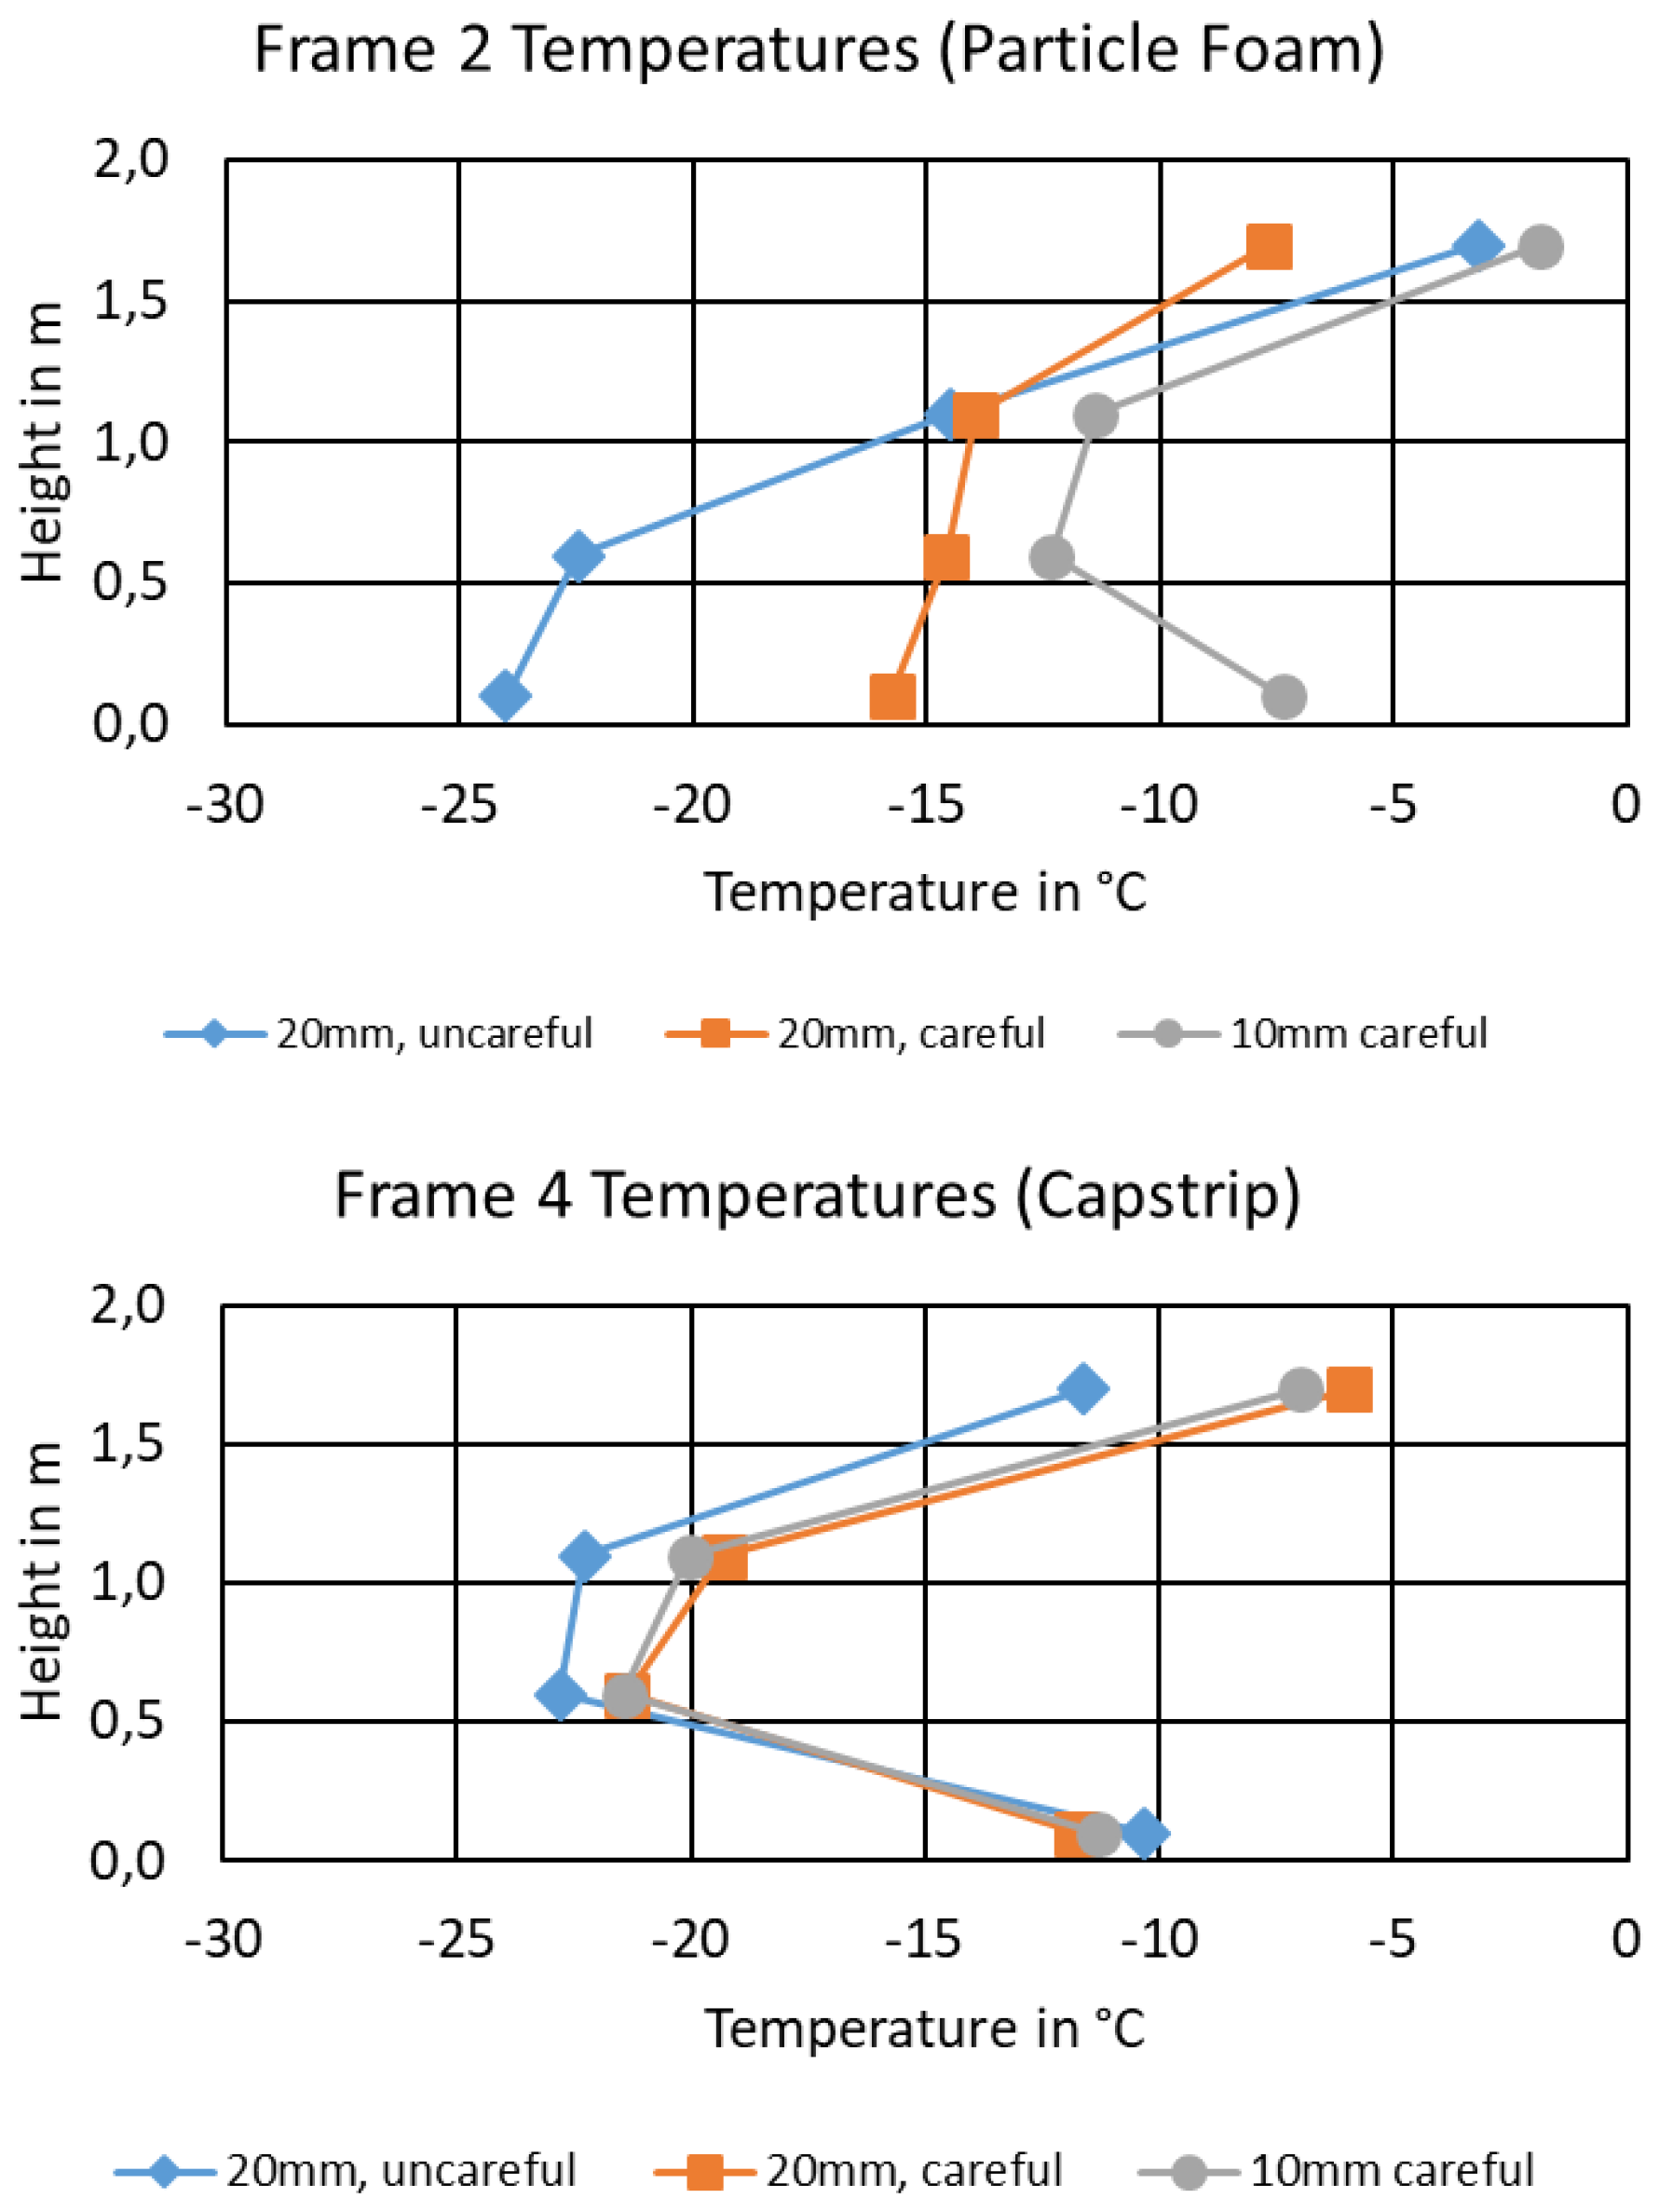
3.4. Frame Temperatures

Two frame surface temperature profiles are measured:
  • Frame 2 with particle foam insulation.
  • Frame 4 with state-of-the-art capstrip.
Figure 13 shows the temperature profiles for both frames. The following main observations are noted, and a possible explanation is provided:
  • Seemingly, some effect affects the lowest positions’ (0.1 m) temperature on Frame 4. Possibly, there is a heat bridge warming the lower frame section or air exchange is inhibited in the lower section, leading to dominant heat flow through the capstrip.
  • For the uncareful installation (blue line), Frame 2 is approximately 8 K warmer in the upper half than Frame 4. At 0.6 m height, both show similar measurements, in the lower section, Frame 2 is considerably colder. Due to the uncareful installation, more air ingresses from gap to cavity by buoyancy in the upper part, leading to a higher frame temperature. This air falls downwards in the cavity along the cold structure and thus leads to convective cooling of the lower frame part.
  • For the careful installation with 20 mm thickness, Frame 2 shows a similar temperature as Frame 4. Further downwards, Frame 2 shows approximately 5 K higher temperatures than Frame 4.
  • Using a 10 mm thick frame insulation leads to a higher frame temperature compared with the other concepts and compared with the capstrip. The thinner insulation results in a higher frame temperature.

3.5. Gap pressure and Flow Rate

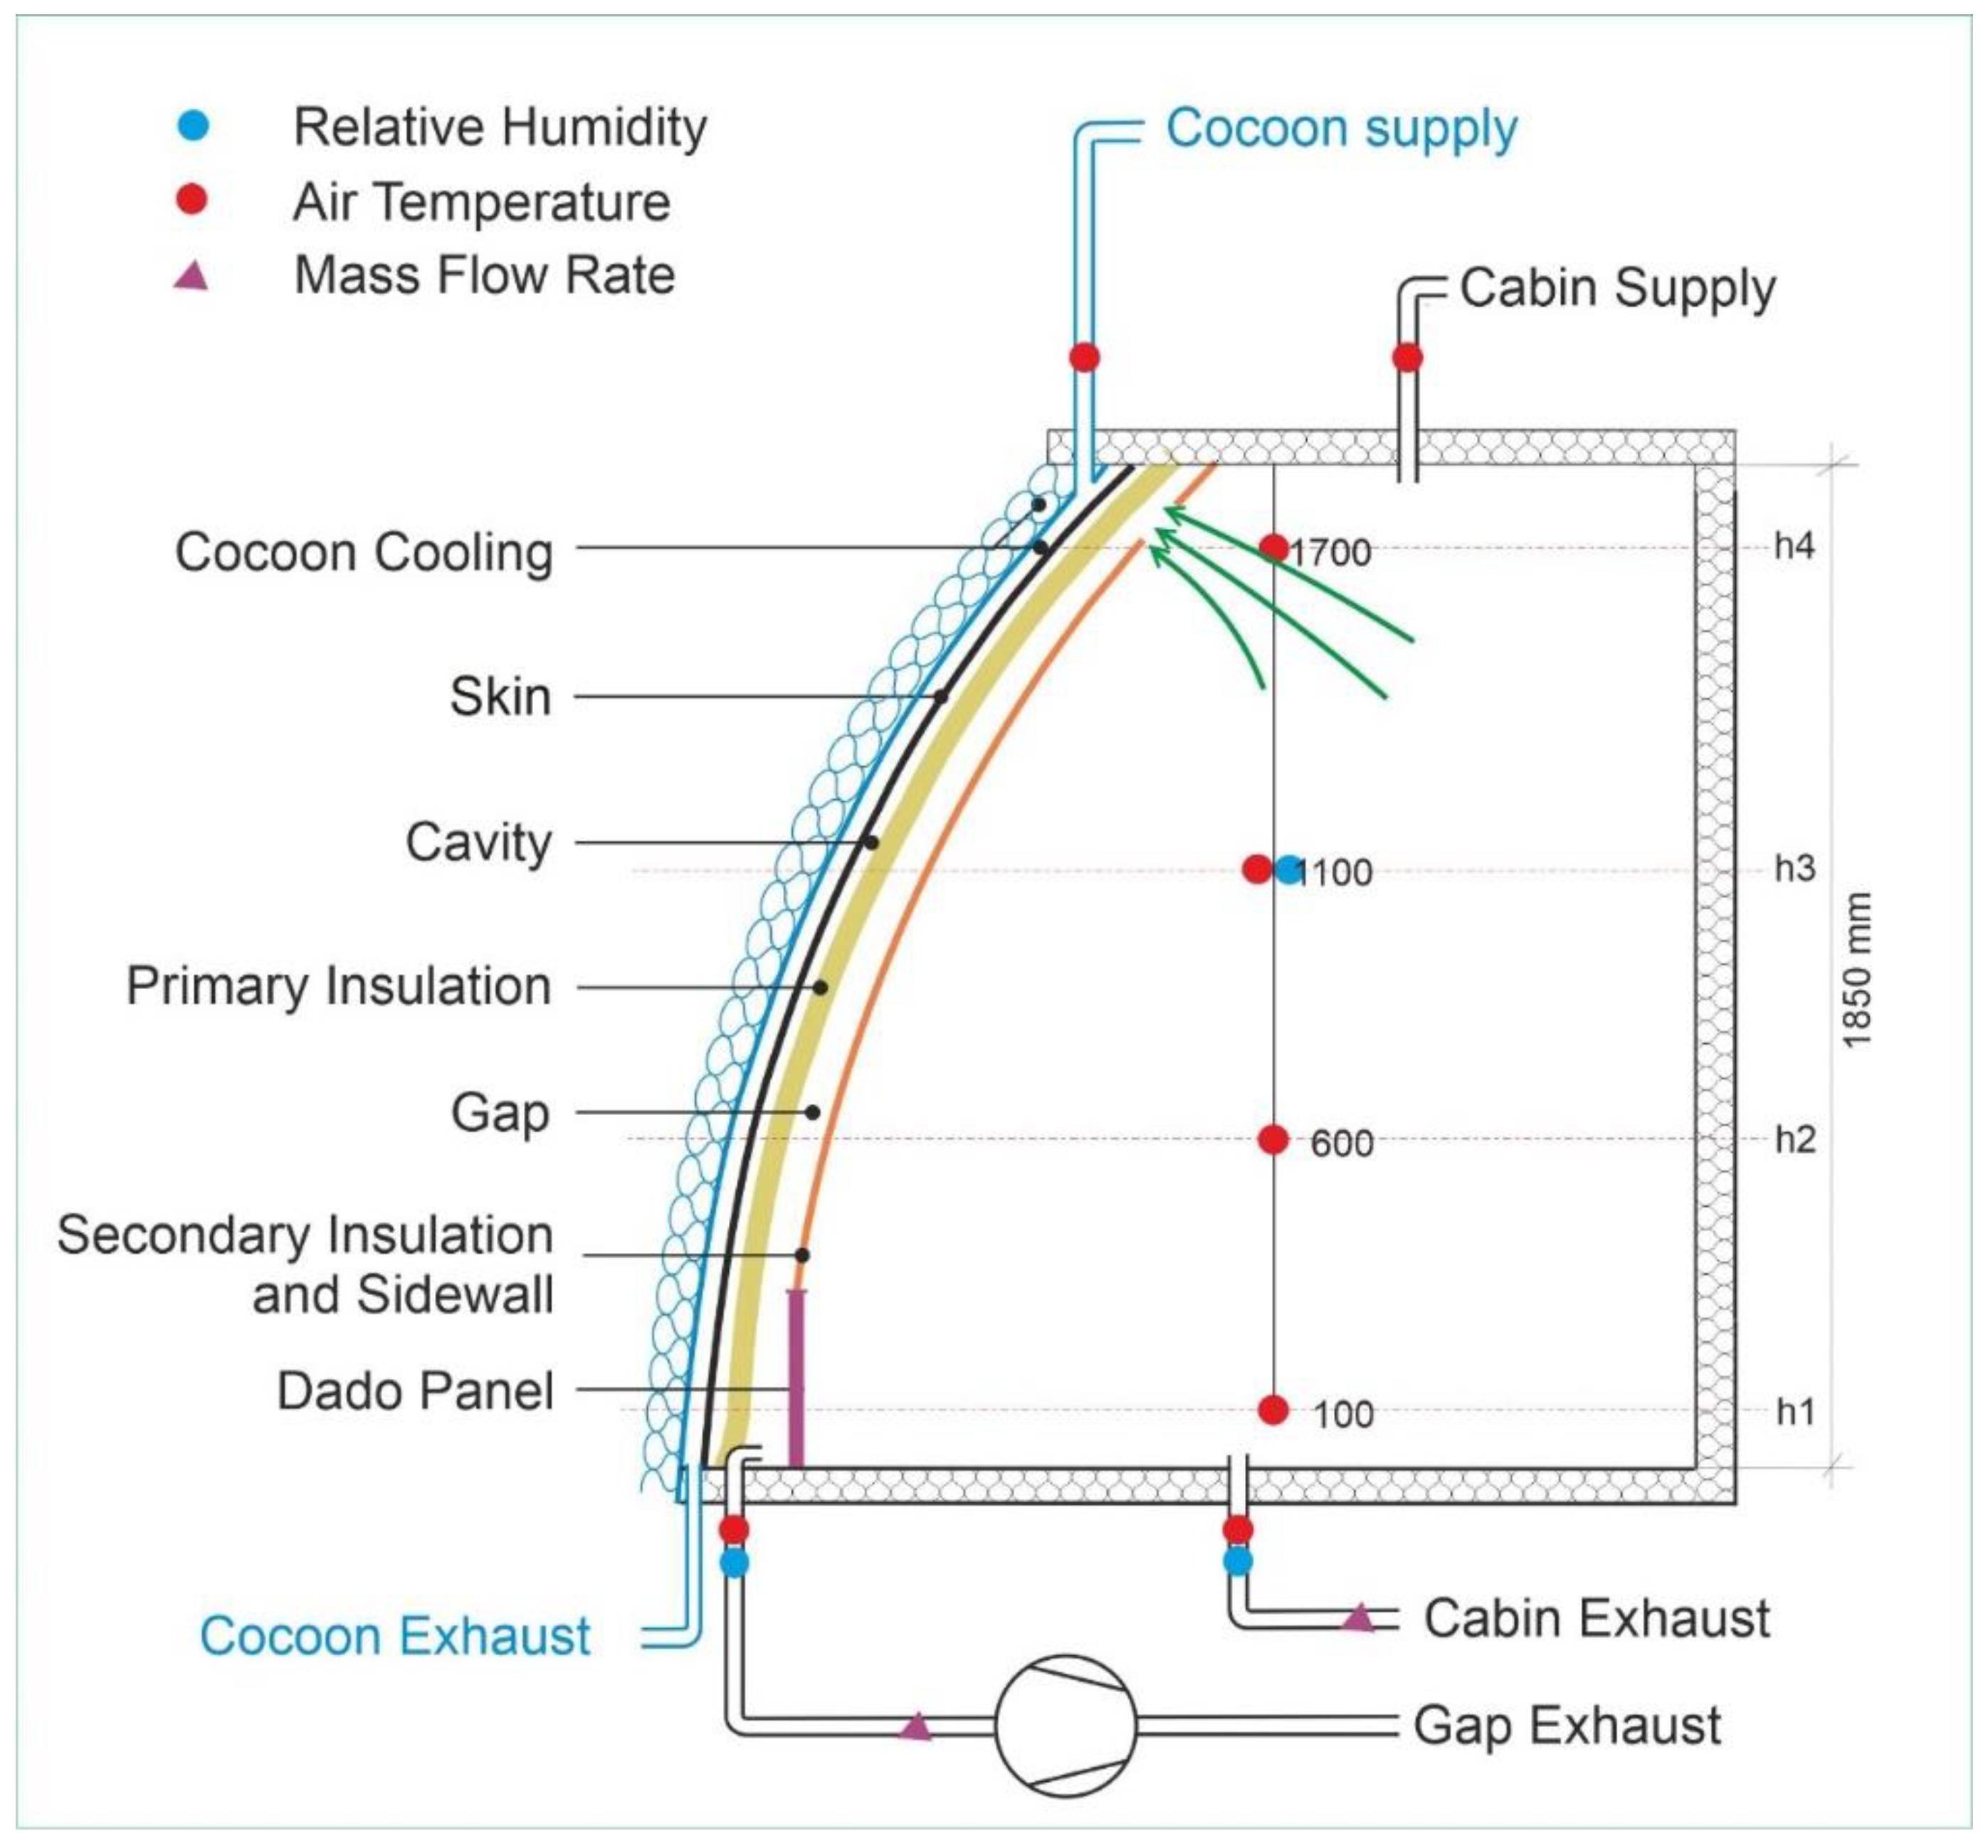
Figure 14 compares the measured extraction flow rate of the gap extraction (between primary insulation and sidewall), and the measured pressure differences between cabin and gap. A negative pressure reflects that pressure is lower in the gap than in the cabin.
The air extraction system behind the sidewall accurately maintains a 4 Pa pressure difference at the reference sensor (0.6 m height in Field 1).
The pressure difference in Field 2 at 1.6 m height shows a lower magnitude as the measurement is closer to the overflow opening above the sidewall. For example, the window structure obstacle has not yet been encountered at this point. The differential pressure magnitude increases with increasing extraction flow rate.
In Field 3 the same position as Field 1 is investigated but for the capstrip arrangement. For the highest extraction flow rate, the differential pressure magnitude noticeably increases to more than 8 Pa.
Field 4 again shows relatively low-pressure magnitude as it is close to the overflow opening.
Measurement reveals that the thickness and installation quality of the frame and field insulation have an impact on the air overflowing from cabin to the gap between primary and secondary insulation. This behavior is explainable by considering the shape of this gap.
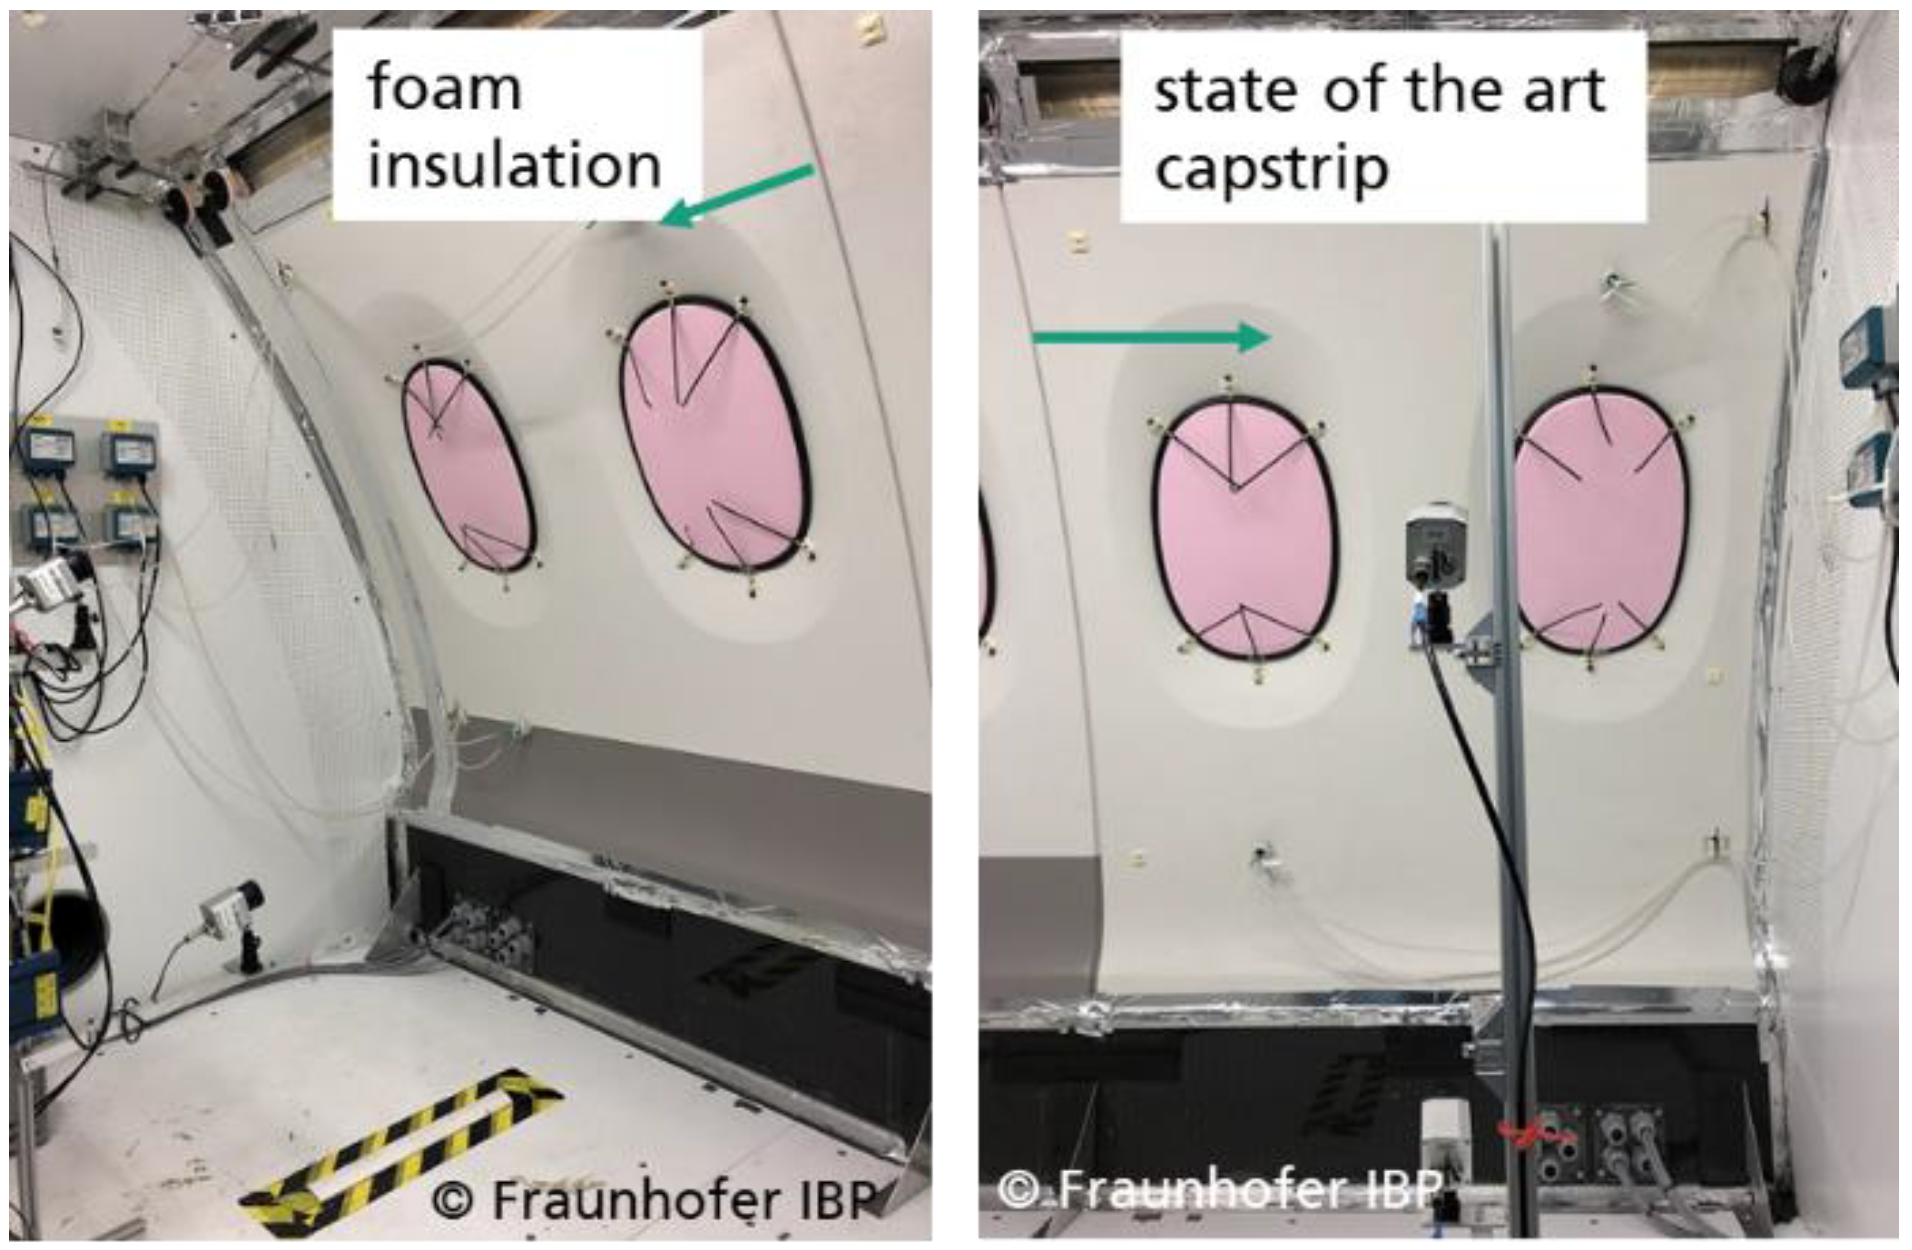
The uncareful installation reflects that first the frame insulation and then the field blanket are installed. Thus, the blanket is not subjected to any specific compression and can buckle behind the sidewall (cf. Figure 9). As a result, the available space for air to overflow becomes smaller, leading to a higher flow resistance and thus lower flow rate when applying the same differential pressure.
The careful installation reflects that first, the field blanket is installed, and then the frame insulation clamps and compresses the edges. As a result, a gap between sidewall and primary insulation emerges that provides a lower flow resistance and thus higher flow rate when applying the same differential pressure.
The same is valid for the 10 mm frame insulation, but the gap becomes narrower than for the 20 mm insulation thickness, and thus flow resistance increases and flow rate decreases.
The gap flow rate amounts to 26 to 46% of the chamber supply airflow rate (368 kg/h). This leakage is a shortcut, and thus negatively affects the cabin ventilation effectiveness. As a result, the demand for the energetically expensive bleed air would increase to meet regulatory requirements [1]. Therefore, for a future integration of such insulation system, the use of horizontal flow blockers between sidewall and primary insulation as, e.g., suggested by [14] should be foreseen. Furthermore, [14] suggests using dry air injection for envelope overpressurization with regard to the cabin. This would inhibit the frost buildup from air leakages to the cold structure and reduce airflow shortcuts, leading to higher cabin ventilation effectiveness.
Even though not tested here, it is considered that the gap flow in aircrafts is lower because the compressibility of the insulation blankets and the capstrip would lead to a smaller and less defined gap than the rigid particle foam insulation does.

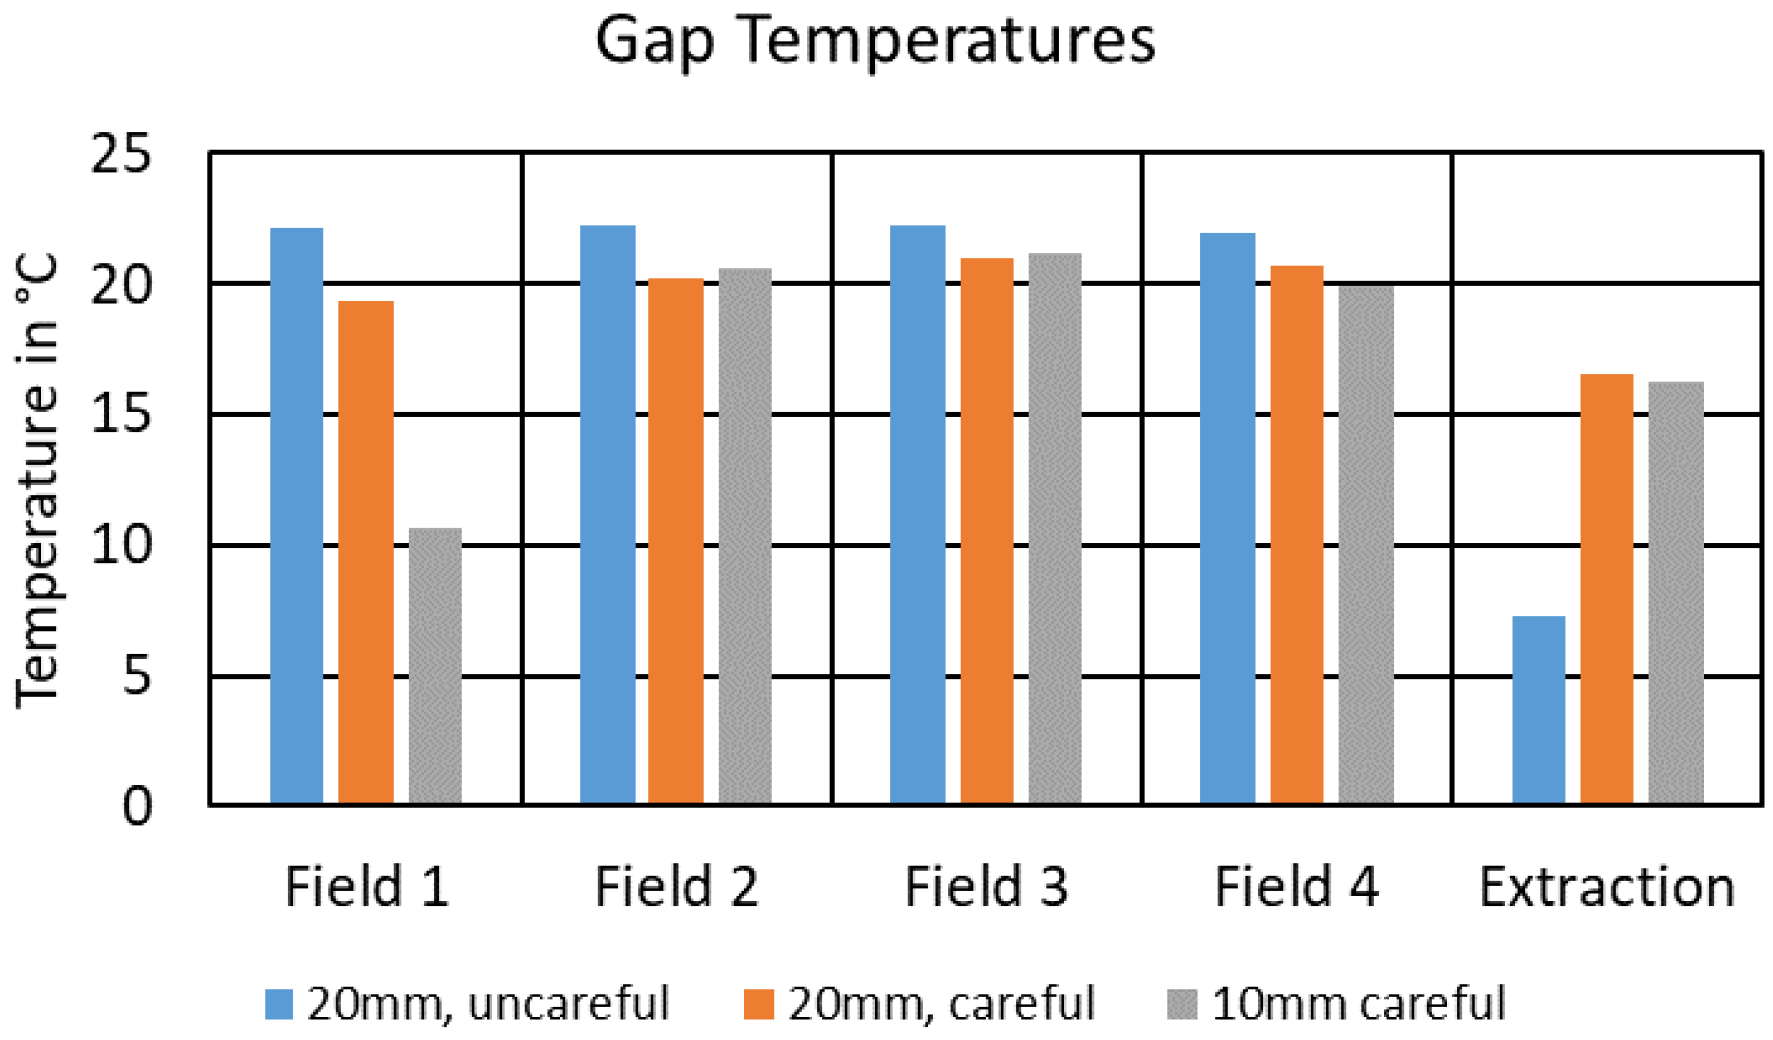
3.6. Gap Air Temperatures

Figure 15 shows the measured air temperatures in the gap between field blanket and sidewall. Overall, it can be concluded that the gap air temperature is close to the cabin air temperature. The reason is that the larger fraction of air flowing behind the sidewall originates from the cabin. The only exception is in the “10 mm, careful” measurement in Field 1. The exact reason for this deviation is not known; it might be a local leakage providing cold air from the cavity close to the sensor.
The extraction air is shown to be colder than the gap air. This air consists of a mixture of the gap air and air that passed the cavity, and thus became noticeably colder.

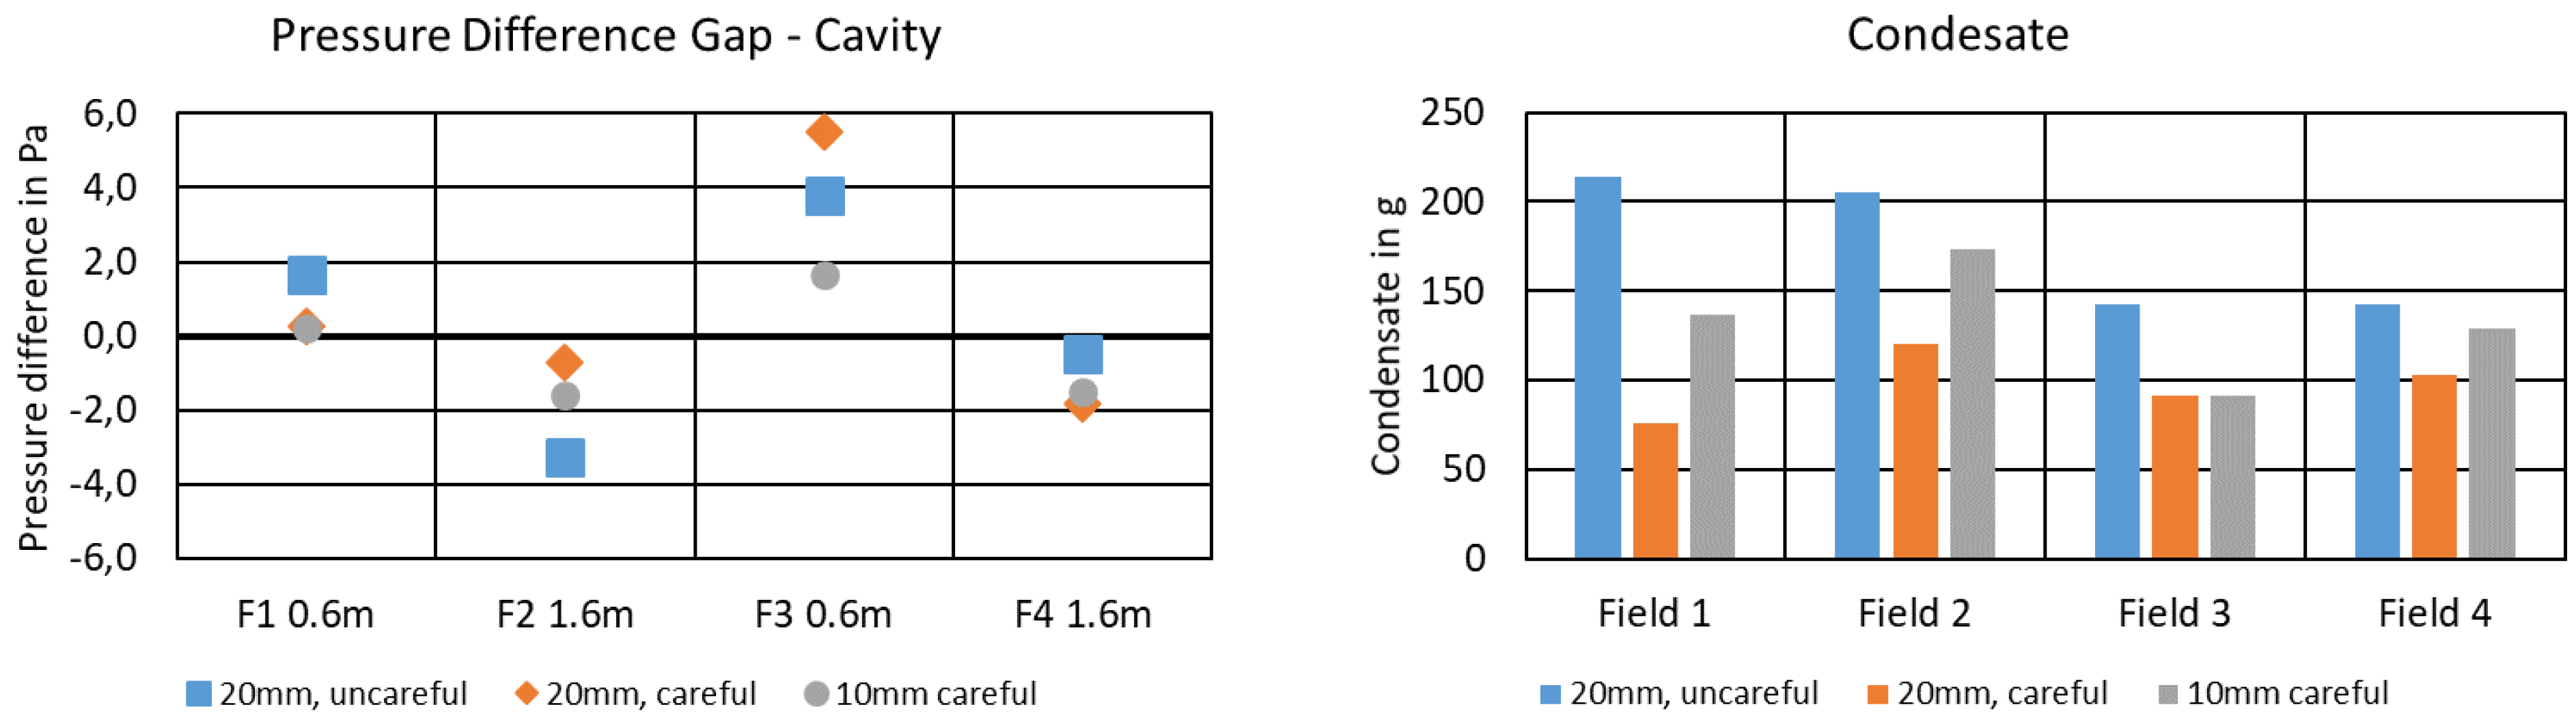
3.7. Differential Pressure between Gap and Skin Cavity and Condensate on the Skin

Figure 16 shows the differential pressure measured between the gap and the skin cavity. This pressure is mainly buoyancy induced and results in an airflow between the two air volumes. In this plot, a positive pressure depicts a gradient from skin cavity to the gap behind the sidewall, whereas a negative pressure results in an ingress of air to the cold structure. Again, pressure is measured in the four fields alternating a low (0.6 m) and high (1.6 m) measurement position. 
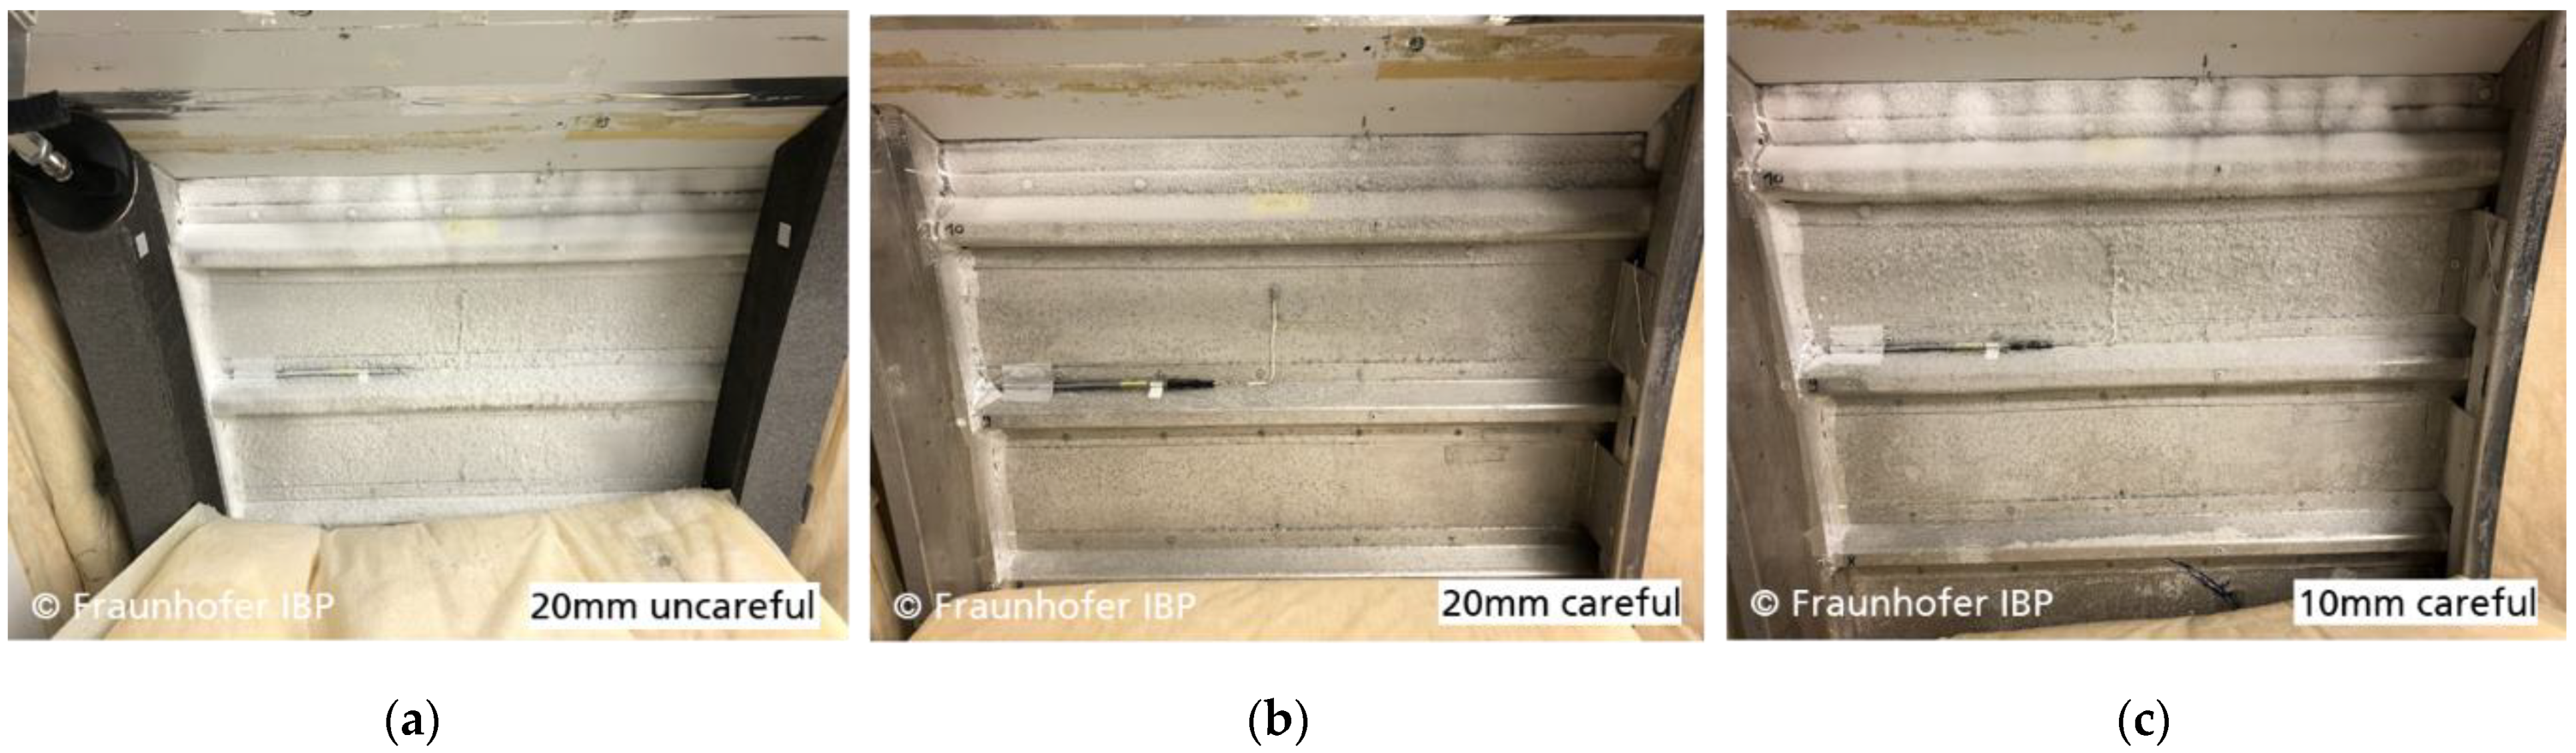
Figure 17 shows a picture of the frost formation pattern directly after removing the insulation on top of Field 1.
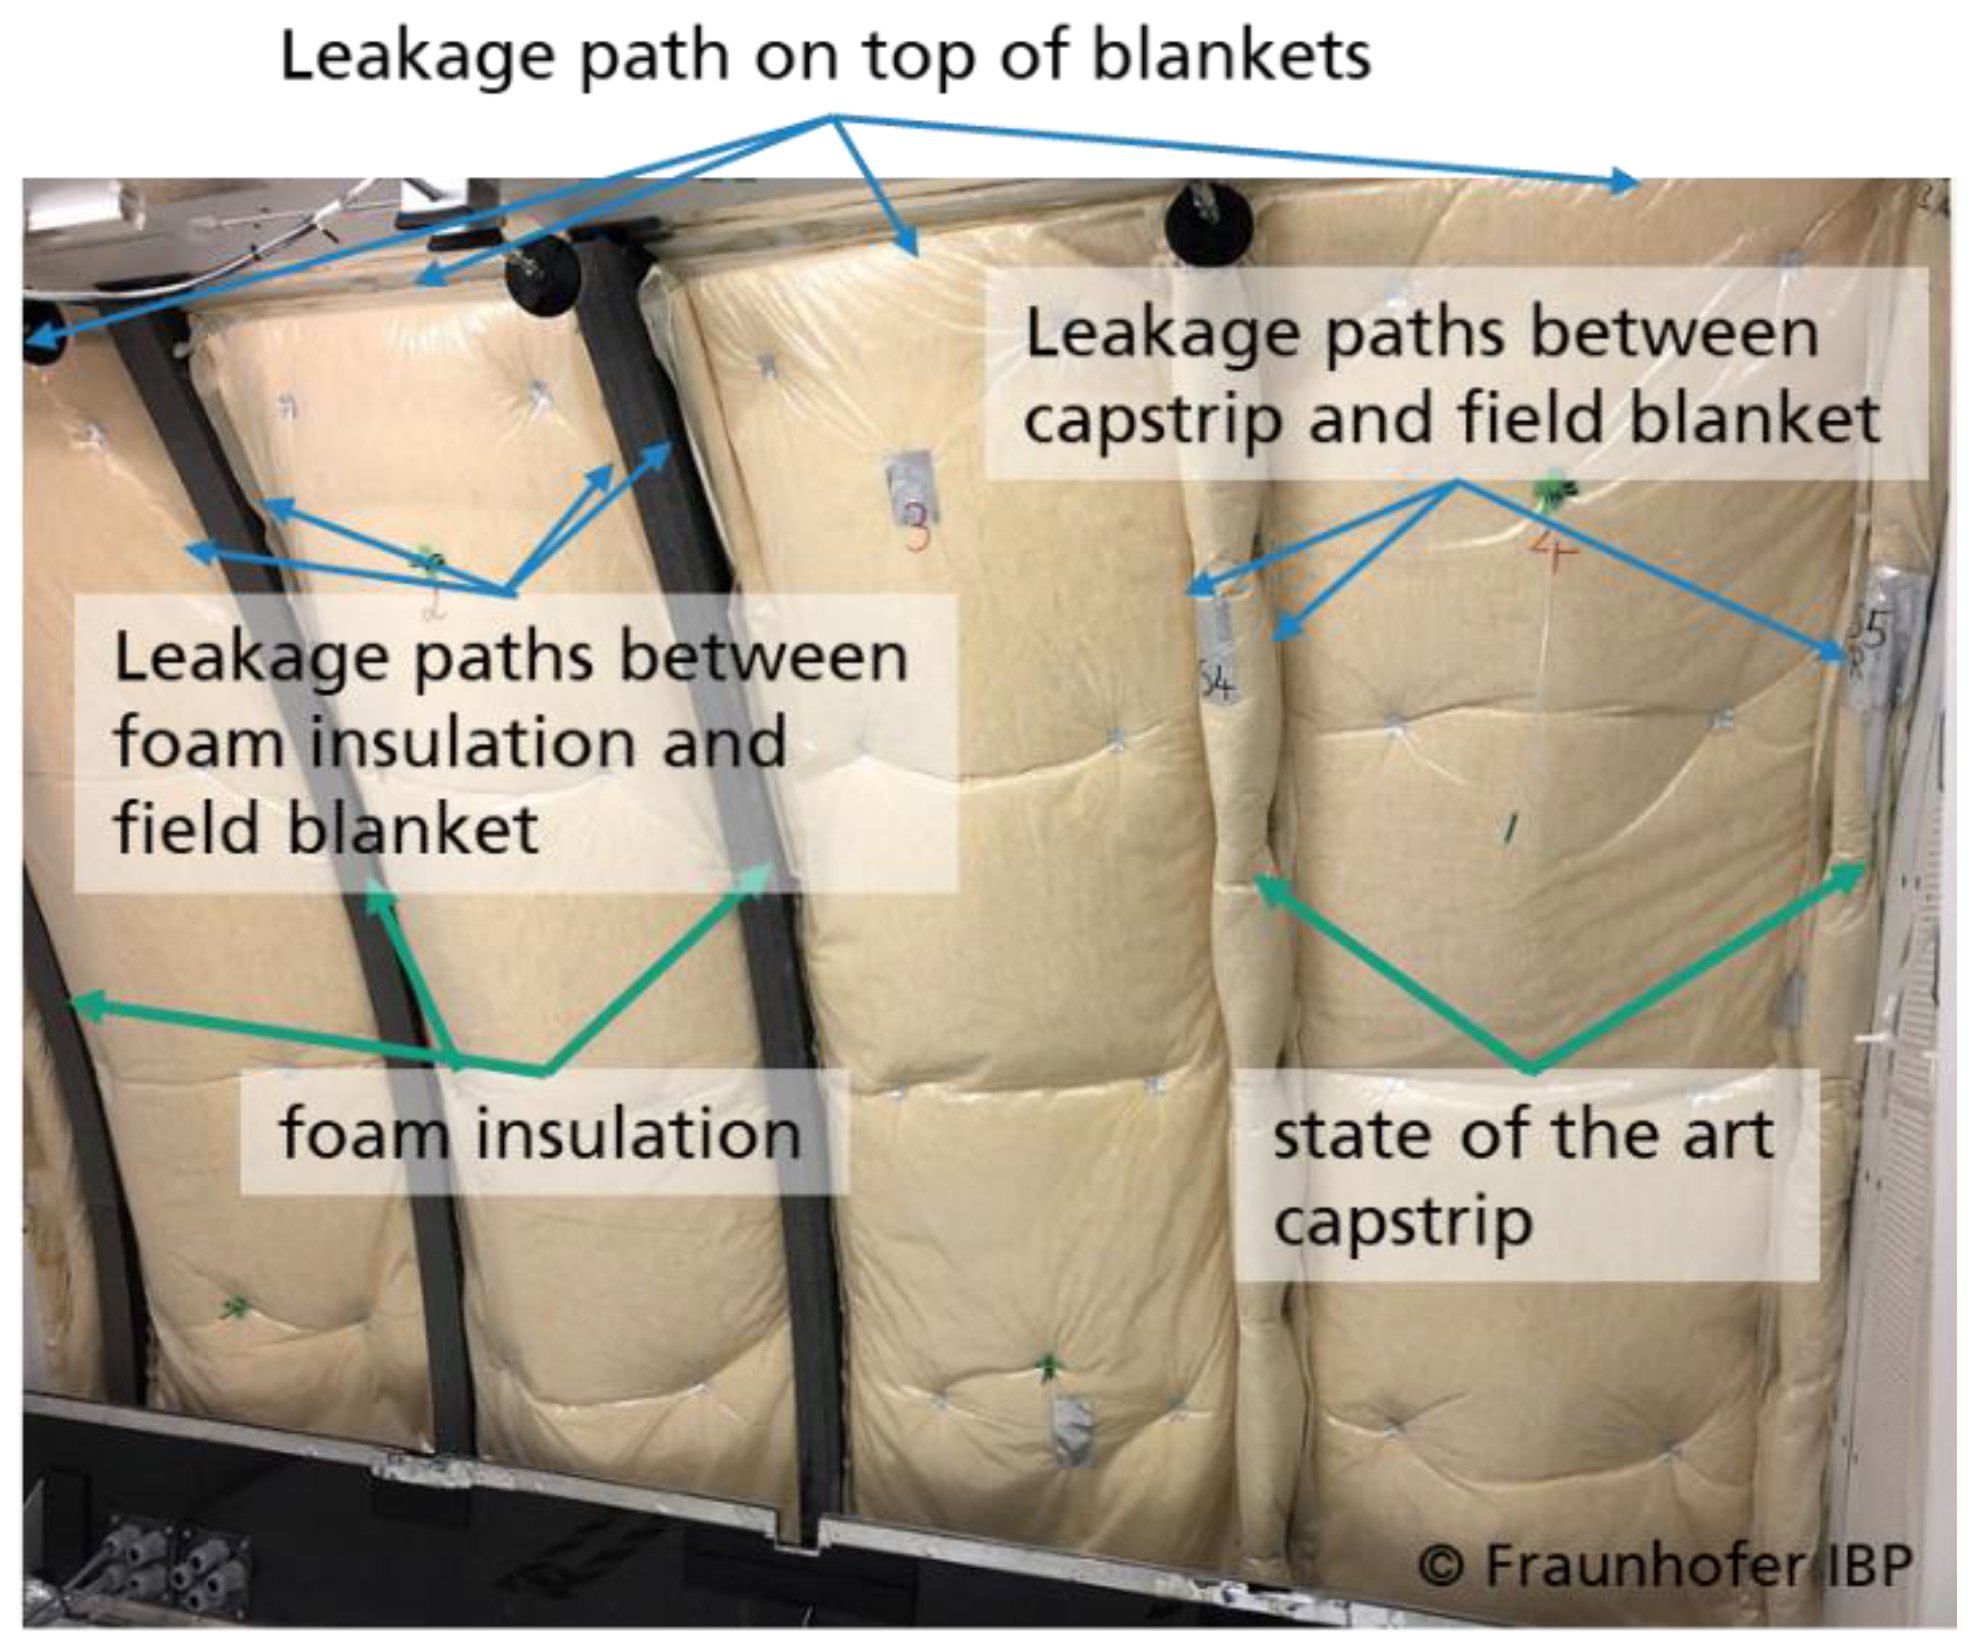
A clear correlation between higher pressure differences and the amount of condensate is not obvious. The reason could be that larger leakage paths result in higher flow rate at lower pressure, whereas well-sealed insulations are able to sustain a higher differential pressure.
On the other hand, the quality of installation is reflected by the amount of condensate. The uncareful installation leads to a larger leakage path between the frame insulation and the field blanket, resulting in a close to doubled amount of condensate compared with the clamped installation, where the major leakage paths is expected to be on the top and bottom edge of the field blanket (cf. Figure 7). Handling shows that the 10 mm thick frame insulation is less rigid and tends to show higher torsion. Hence, its sealing potential is seemingly lower.
On frame 3, located between Field 2 and Field 3, the particle foam frame insulation is applied. As a result, the Field 3 measurement is a mixture of a particle foam frame insulation on the left and the conventional capstrip on the right. Hence, some influence of the specimen is found here, too.
Comparing the amount of condensate with the leakage rate into the gap (Figure 14 vs. 
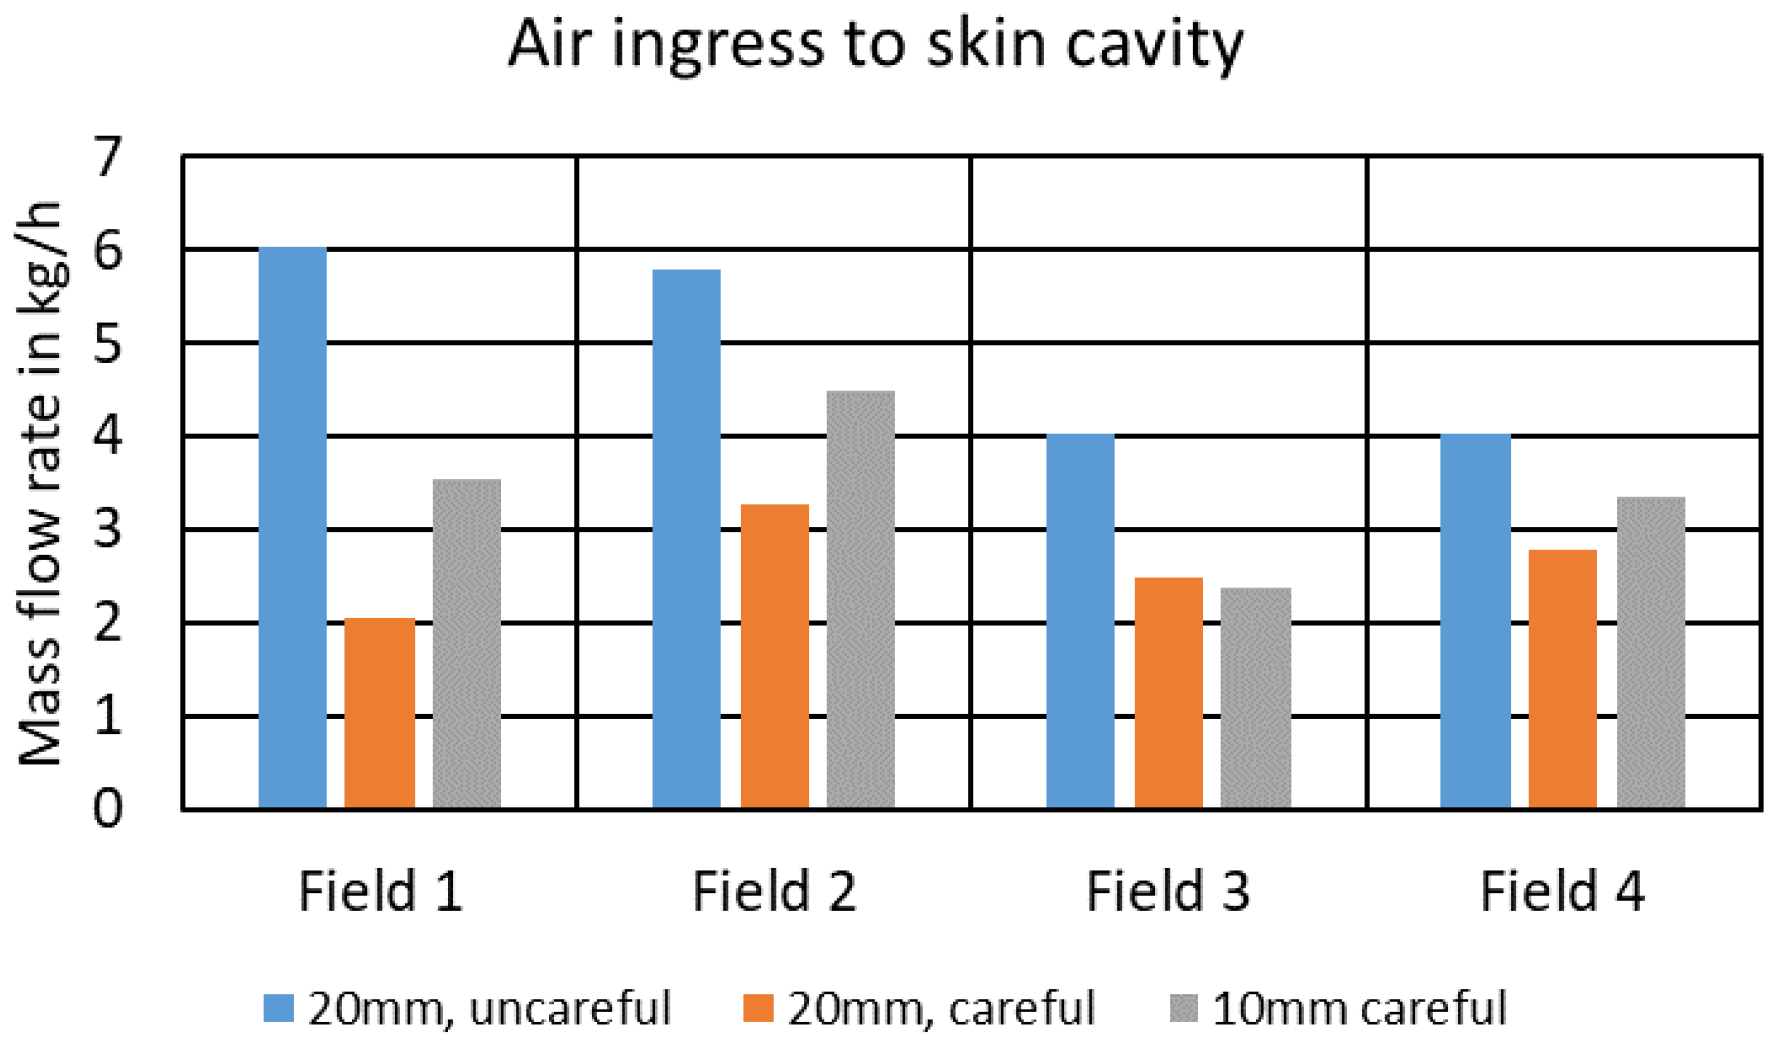
Figure 16) shows that a higher flow rate in the gap inboard the primary insulation does not necessarily result in a higher amount of condensate on the structure. In order to analyze this effect, the flow rate exchanged between the gap and the skin cavity are estimated. For this, the amount of frost is divided by the potential for frost formation (difference between cabin moisture content and skin saturation moisture content) and the exposure duration of 7 h.
V ˙ e s t i m a t e d = ρ a i r · m c o n d e n s a t e ( x c a b i n x s a t , s k i n ) · 7 h
This estimation leads to the flow rate estimation per field shown in Figure 18. In sum, the total airflow to the cavities varies between 10.6 to 19.9 kg/h. This is an order of magnitude smaller than the airflow through the gap behind the sidewall. Hence, the independence of frost buildup from the airflow in the gap becomes comprehensive as only a small fraction of air contributes to condensate formation.

4. Discussion

This research investigates the effect of a particle foam insulation and its installation procedure on the hygrothermal conditions behind the cabin sidewall. The experimental study is conducted in a representative test chamber. Nevertheless, some simplifications compared with the real flight are made. First, the typical cabin cruise pressure is 750 hPa whereas the lab ambient air pressure is approximately 940 hPa (the lab is at 694 m elevation). In a comparison performed by [13], pressure differences are estimated approximately 20% lower in cruise than in ground pressure conditions. On the other hand, typical cruise exterior conditions are −56.5 °C [2], whereas the LITE chamber achieves around −30 °C. Furthermore, the chamber considers a rather undisturbed section of the fuselage, without the presence of, e.g., doors or riser ducts. Additionally, the crown section is not present, potentially reducing the buoyancy effect due to lower elevation. Nevertheless, the chamber tests provide a thorough insight into the driving effects of the airflows behind the sidewall.
Comparing the measured amount of condensate on the frames proves to be in the order of magnitude of the value of 91 g postulated by [11,16]. Measured stack pressure is merely within the estimated 0 to 4.5 Pa of [13].
Therefore, the experiments are considered providing a valuable step to the understanding of the major effects driving the hygrothermal behavior of the sidewall section, and persistent conclusions can be drawn from it. The experiments prove that novel insulation systems can be assessed in this type of chamber.

5. Conclusions

This paper compares three tests with different installation procedures and different material thicknesses of a particle foam frame insulation replacing the state-of-the-art capstrip. These tests are a step forward, and with them, the Lining and Insulation Test Environment has proven very useful in addressing the problem of condensate. The conducted experiments give a valuable insight into the hygrothermal process behind the cabin sidewall and allow the following major conclusions:
  • The quality of the insulation installation is the key parameter to reduce condensate on the cold exterior skin. It is proven that clamping the field blanket below the particle foam frame insulation results in only half the amount of condensate than a loose joint of both insulation pieces.
  • With a 20 mm thick particle foam frame insulation, the same amount of protection against condensate on the structure is achieved as with the conventional capstrip, but less parts are needed for installation.
  • The particle foam insulation leads to slightly higher local sidewall surface temperatures than the capstrip. However, due to the confinement of this area, no comfort relevant effect is expected from this.
  • The leakage of air into the gap between sidewall and primary insulation is one order of magnitude larger than the leakage of air towards the skin cavity. Therefore, the amount of condensate formation is independent from this leakage.
  • Even through the gap behind the sidewall is of undefined shape, measures affecting its size (e.g., thicker frame insulation) influence the amount of air leakage into the gap. This can have an impact on cabin ventilation, as this presents a shortcut of cabin air and thus requires higher bleed air offtake to meet ventilation requirements [1]. A flow blocker located between the sidewall and primary insulation could reduce this shortcut.
Figure 19 summarizes these findings in brief.

Author Contributions

Conceptualization, V.N. and G.R.; methodology, V.N.; formal analysis, V.N.; investigation, G.R.; resources, V.N.; data curation, V.N.; writing—original draft preparation, V.N.; writing—review and editing, G.R.; visualization, V.N.; supervision, V.N.; project administration, V.N.; funding acquisition, V.N. All authors have read and agreed to the published version of the manuscript.

Funding

This research is conducted with financial support from the German Federal Ministry for Economic Affairs and Energy (FKZ: 20X1715B). The authors are responsible for the content of this publication.
Aerospace 08 00359 i001

Data Availability Statement

Some data presented in this study are available upon request from the corresponding author.

Acknowledgments

We thank Diehl Aviation for their support in the SOPHIA project and Neue Materialien Bayreuth for the provision of the rigid foam capstrip material.

Conflicts of Interest

The authors declare no conflict of interest. The funders had no role in the design of the study; in the collection, analyses, or interpretation of data; in the writing of the manuscript; or in the decision to publish the results.

References

  1. ANSI/AHSHRAE. ASHRAE Standarad 161–2007: Air Quality within Commercial Aircraft; American Society of Heating, Refrigerating and Air-Conditioning Engineers: Atlanta, GA, USA, 2007. [Google Scholar]
  2. ICAO. Manual of the ICAO Standard Athmosphere Extended to 80 km, 3rd ed.; Internation Civil Aviation Organization: Montréal, QC, Canada, 1993. [Google Scholar]
  3. Johns Manville. Microlite(R) AA Blankets: Aircraft Thermal and Acoustical Insulation Data Sheet; Johns Manville: Denver, CO, USA, 2020. [Google Scholar]
  4. Lamart Corporation. Orcotek Strip Blankets. Available online: http://www.orcon.com/orcotek_strip_blankets (accessed on 13 September 2021).
  5. U.S. Deportment of Transportation Federal Aviation Administration. Thermal/Acoustical Insulation Flame Propagation Test Method Details; U.S. Department of Transportation: Washington, DC, USA, 2005.
  6. U.S. Deportment of Transportation Federal Aviation Administration. Installation of Thermal/Acoustic Insulation for Burnthrough Protection; U.S. Department of Transportation: Washington, DC, USA, 2008.
  7. Chen, R.; Fang, L.; Liu, J.; Herbig, B.; Norrefeldt, V.; Mayer, F.; Fox, R.; Wargocki, P. Cabin air quality on non-smoking commercial flights: A review of published data on airborne pollutants. Indoor Air 2021, 31, 926–957. [Google Scholar] [CrossRef]
  8. Grün, G.; Trimmel, M.; Holm, A. Low humidity in the aircraft cabin environment and its impact on well-being–Results from a laboratory study. Build. Environ. 2012, 47, 23–31. [Google Scholar] [CrossRef]
  9. Giaconia, C.; Orioli, A.; Di Gangi, A. Air quality and relative humidity in commercial aircrafts: An experimental investigation on short-haul domestic flights. Build. Environ. 2013, 67, 69–81. [Google Scholar] [CrossRef] [Green Version]
  10. Norrefeldt, V.; Mayer, F.; Herbig, B.; Ströhlein, R.; Wargocki, P.; Lei, F. Effect of Increased Cabin Recirculation Airflow Fraction on Relative Humidity, CO2 and TVOC. Aerospace 2021, 8, 15. [Google Scholar] [CrossRef]
  11. Wörner, M. Wärme- und Stofftransport in einer Flugzeugkabine unter Besonderer Berücksichtigung des Feuchtetransports. Ph.D. Thesis, University of Hamburg, Harburg, Germany, 2006. [Google Scholar]
  12. Riedl, G.; Rösler, D.; Stratbücker, S.; Grün, G. Interdisziplinäre Kabinenarchitekturen (INDIKAR); Schlussbericht; Fraunhofer-Institute for Building Physics: Valley, Germany, 2006. [Google Scholar]
  13. Walkinshaw, D.; Preston, K. Controlling Cabin and Envelope Air Flows and Pressure Differentials to Prevent Envelope Condensation, Enable Cabin Humidification, Improve Fire Safety, and Decrease Fuel Use. SAE Int. J. Aerosp. 2011, 4, 1243–1253. [Google Scholar] [CrossRef]
  14. Walkinshaw, D.S.; Horstman, R.H. Stack Pressure-Created Airflows in Insulation Envelopes, Part 2: Passenger Aircraft. ASHRAE J. 2020, 5, 32–46. [Google Scholar]
  15. Westhoff, A.; Wagner, C. Experimental study of moist air flow in the gap between the aircraft’s fuselage and its cabin wall. CEAS Aeronaut J. 2020, 11, 591–607. [Google Scholar] [CrossRef] [Green Version]
  16. Huber, P.; Schuster, K.; Townsend, R. Controlling Nuisance Moisture in Commercial Airplanes. Aero 05 1999. Available online: https://www.boeing.com/commercial/aeromagazine/aero_05/m/m01/index.html (accessed on 13 September 2021).
  17. DIN. Industrial Platinum Resistance Thermometer Sensors; German Version EN 60751:2008; Beuth Verlag: Berlin, Germany, 2009. [Google Scholar]
  18. Kaneka Belgium NV. EPERAN PP MH24/Expanded Propylene, 1st ed.; FR-EPEM-022-E/2, Issue Date: 4 March; Kaneka Belgium NV: Westerlo-Oevel, Belgium, 2016. [Google Scholar]
Figure 1. Pieces of the aircraft insulation.
Aerospace 08 00359 g001
Figure 2. Comparison of different capstrip fixation principles, right picture from Olivier Cleynen, CC BY-SA 3.0, via Wikimedia Commons.
Aerospace 08 00359 g002
Figure 3. LITE chamber.
Aerospace 08 00359 g003
Figure 4. Ventilation system of the LITE chamber.
Aerospace 08 00359 g004
Figure 5. Sensor distribution on the skin.
Aerospace 08 00359 g005
Figure 6. Sensor distribution on primary field blanket insulation.
Aerospace 08 00359 g006
Figure 7. Particle foam insulation and capstrip installed in the LITE test chamber.
Aerospace 08 00359 g007
Figure 8. Fixation of sidewall in front of the primary insulation.
Aerospace 08 00359 g008
Figure 9. Comparison of the low-quality installation (top) with the high-quality installation (bottom).
Aerospace 08 00359 g009
Figure 10. Collection of accumulated frost from the structure.
Aerospace 08 00359 g010
Figure 11. IR image of the lower sidewall.
Aerospace 08 00359 g011
Figure 12. Skin surface temperature and pulldown behavior.
Aerospace 08 00359 g012
Figure 13. Surface temperatures on Frame 2 and Frame 4 (dots mark the measurement data).
Aerospace 08 00359 g013
Figure 14. Extraction flow rate and pressure difference between cabin and gap.
Aerospace 08 00359 g014
Figure 15. Measured gap air temperatures.
Aerospace 08 00359 g015
Figure 16. Driving buoyant pressure between gap and skin cavity and measured amount of condensate on the skin.
Aerospace 08 00359 g016
Figure 17. Frost formation on Field 1 for the 20 mm thick frame insulation uncarefully installed (a), 20 mm thick frame insulation carefully installed (b) and 10 mm thick frame insulation carefully installed (c).
Aerospace 08 00359 g017
Figure 18. Estimated air ingress to skin cavity.
Aerospace 08 00359 g018
Figure 19. Main conclusion on hygrothermal situation behind sidewall.
Aerospace 08 00359 g019
Table 1. Test boundary conditions.
Boundary ConditionValue
Exterior fuselage temperature−30 °C
Cabin ventilation flow rate368 kg/h
Cabin temperature24 °C
Cabin humidity30%
Pressure difference across sidewall4 Pa
Exposure duration7 h
Table 2. Cabin boundary conditions.
Cabin Boundary
Conditions
20 mm, Uncareful20 mm, Careful10 mm, Careful
Temperature in °C22.223.023.7
Absolute humidity in g/m³6.36.46.7
Publisher’s Note: MDPI stays neutral with regard to jurisdictional claims in published maps and institutional affiliations.

