Article

A Case for User-Centered Design in Satellite Command and Control

by
Stephen L. Dorton
1,*,
LeeAnn R. Maryeski
1,
Robert P. Costello
1 and
Blake R. Abrecht
2
1
Human-Autonomy Interaction Laboratory, Sonalysts, Inc., Waterford, CT 06385, USA
2
Systems Engineering Program, United States Air Force Academy, Colorado Springs, CO 80840, USA
*
Author to whom correspondence should be addressed.
Aerospace 2021, 8(10), 303; https://doi.org/10.3390/aerospace8100303
Submission received: 21 September 2021 / Revised: 8 October 2021 / Accepted: 13 October 2021 / Published: 15 October 2021
(This article belongs to the Section Astronautics & Space Science)

Abstract

:
The prevalence of unique, disparate satellite command and control (SATC2) systems in current satellite operations is problematic. As such, the United States Air Force aims to consolidate SATC2 systems into an enterprise solution that utilizes a common Human–Machine Interface (HMI). We employed a User-Centered Design (UCD) approach including a variety of methods from design thinking and human factors engineering to develop a solution that is effective, efficient, and meets operator needs. During a summative test event, we found that users had significantly higher situation awareness, lower workload, and higher subjective usability while using the HMI developed via UCD over the existing, or legacy, HMI. This case study serves as evidence to support the assertion that involving users early and often has positive and tangible effects on the development of aerospace systems.

1. Introduction

There is a large variety of satellite systems employed across the United States Department of Defense (DoD). The Human–Machine Interfaces (HMIs) created to operate these systems are as diverse as the satellites themselves, resulting in many difficulties [1]. The HMIs and associated control software are often proprietary, meaning they cannot share resources or operators without personnel undergoing months of training each time they are assigned to fly a new satellite. This increases program lifecycle costs and decreases agility and operator effectiveness across the space enterprise- a significant challenge to overcome [2,3]. To combat this problem, the US Air Force (USAF) seeks to develop a centralized, common, Satellite Command and Control (SATC2) system, the Enterprise Ground Services (EGS) program, to remove these stovepipes and increase commonality across systems. As the USAF begins the process of transformation from multiple disparate systems into a single enterprise-wide SATC2 solution, there is a need for a common HMI as part of the solution to increase operational effectiveness and training efficiencies [3,4,5].
Further, many of these HMIs were designed by engineers for engineers, and information is presented in a systems-centric view as opposed to an operations-centric view. For example, telemetry and status information is often organized according to the configuration of the different vehicle subsystems (e.g., electrical power, thermal management, or attitude/dynamics control), and not based on what information is needed to conduct a specific operation or maneuver. This can result in operators needing to continuously search for and manage multiple screens of information in order to conduct routine tasks, drastically increasing workload and the potential for operator error. Recent government reports have highlighted these problems and called for increased user engagement in space systems development [6,7]. This manuscript describes one such case study that demonstrates the merits of a common SATC2 HMI, and provides objective quality evidence to support this call for User-Centered Design (UCD) in aerospace systems.

1.1. Specific Design Challenges

This task of developing one SATC2 HMI that is flexible enough to control any existing or future satellite is an exceptionally challenging endeavor due to the complex nature of the task. More specifically, the challenge of developing a single user interface that is capable of effectively controlling satellites under each possible combination of the following factors:
  • Mission: different missions such as communications, surveillance, reconnaissance, or experimental data collection (e.g., meteorology) all affect HMI requirements;
  • Payload: the different payloads on each satellite may each require specific controls and displays to be included in the HMI;
  • Orbit: the orbit of the satellite can greatly affect workflows for operators. Contact times (i.e., the time available to send commands and receive telemetry) can be limited to only minutes, or in theory, have no limit at all;
  • Operational/manning profile: Some organizations or units may fly large constellations where several people are assigned to each vehicle or contact, each performing very specific tasks. Conversely, other organizations may fly fewer satellites and/or have a single operator performing all required tasks from a single HMI;
  • Users: There are multiple user archetypes that are involved in SATC2. The HMI needs to provide capabilities to not only vehicle operators, but also payload operators, supervisors (e.g., mission or crew commanders), and a variety of “backroom” staff (e.g., engineers and orbital analysts).
Another major challenge associated with this effort is that simply developing a common HMI will not suffice. The development of EGS will break down stovepipes, providing new data to operators that have never been available before, paving the way for novel technologies to be developed for SATC2. Further, the increased capacity to communicate and share information both inter- and intra-organizationally will likely change workflows for mission planning, scheduling, and sharing of resources across what was once several separate pools of resources. This has the potential to affect manning and workflows in non-trivial ways. The introduction of novel technologies and the establishment of new lines of communication create an essentially intractable problem space in which this HMI will need to work. As such, we must consider how to design a common HMI that anticipates and adapts to the changes in operator workflows and manning constructs.

1.2. User-Centered Design

The idea that the capabilities and limitations of human operators are critical to the success of space operations predates widespread satellite use [8]. Human- or User-Centered Design (UCD) broadly describes a variety of disciplines and methods that are well-suited for overcoming the challenges discussed in Section 1.1 [9,10]. The majority of the research methods and design techniques we employed towards this effort were from the discipline of Human Factors Engineering (HFE). Sometimes referred to as the science behind good design, HFE is the practice of developing human–machine systems, with an emphasis placed on optimizing performance based on the capabilities and limitations of the human [11]. HFE methods place emphasis on designing systems around the capabilities and limitations of human operators, such that the performance of the human–machine team is maximized. This is accomplished through a variety of analyses, as well as inspection-based and participatory methods to ensure that the HMI meets the needs of operators.
Design thinking is a relatively newer discipline of UCD that is used for not only the development of software and hardware, but also processes or experiences. While HFE can be viewed as placing primacy on human–machine performance, design thinking is built on the principles of focusing on user needs, iterative development and testing, and continuous engagement with users throughout the product lifecycle [12]. Design thinking is espoused for its ability to solve relatively intractable, or “wicked” problems, where a high degree of component interdependency precludes a more linear engineering approach [13]. Recent efforts have shown success in fusing more rough and rapid design thinking methods with methodologically rigorous HFE methods for agile development of DoD systems [14]. As such, we employed a UCD approach that leveraged a blend of both HFE and design thinking methods and best practices.
Recent efforts have employed UCD and associated methods to improve human–system performance in aerospace applications. Various types of task or functional analyses (and other model-based representations of user work) have made impacts on manned flight, air traffic control, and control of unmanned aerial systems [15,16]. Similarly, other recent research has investigated the use of novel HMIs such as speech-to-text capabilities [17] and lighting- or gesture-based communications [18].

1.3. Research Goals

The overarching goal of this effort was to apply UCD early and often throughout the development lifecycle to develop a common SATC2 interface with the needs of the end user in mind. The following are specific research goals that were assessed through user testing with a proof-of-concept HMI:
  • Performance and situation awareness (SA): increase user performance and SA of operators such that they can accomplish more tasks successfully, and perceive and react to anomalies more quickly;
  • Workload: reduce the workload burden on operators so that they can apply cognitive energy to high-level problems that are beyond automation;
  • Usability: create a more intuitive and enjoyable HMI than what operators currently experience;
  • Transferability: develop a system where it is easier to become more proficient with less training.

2. Materials and Methods

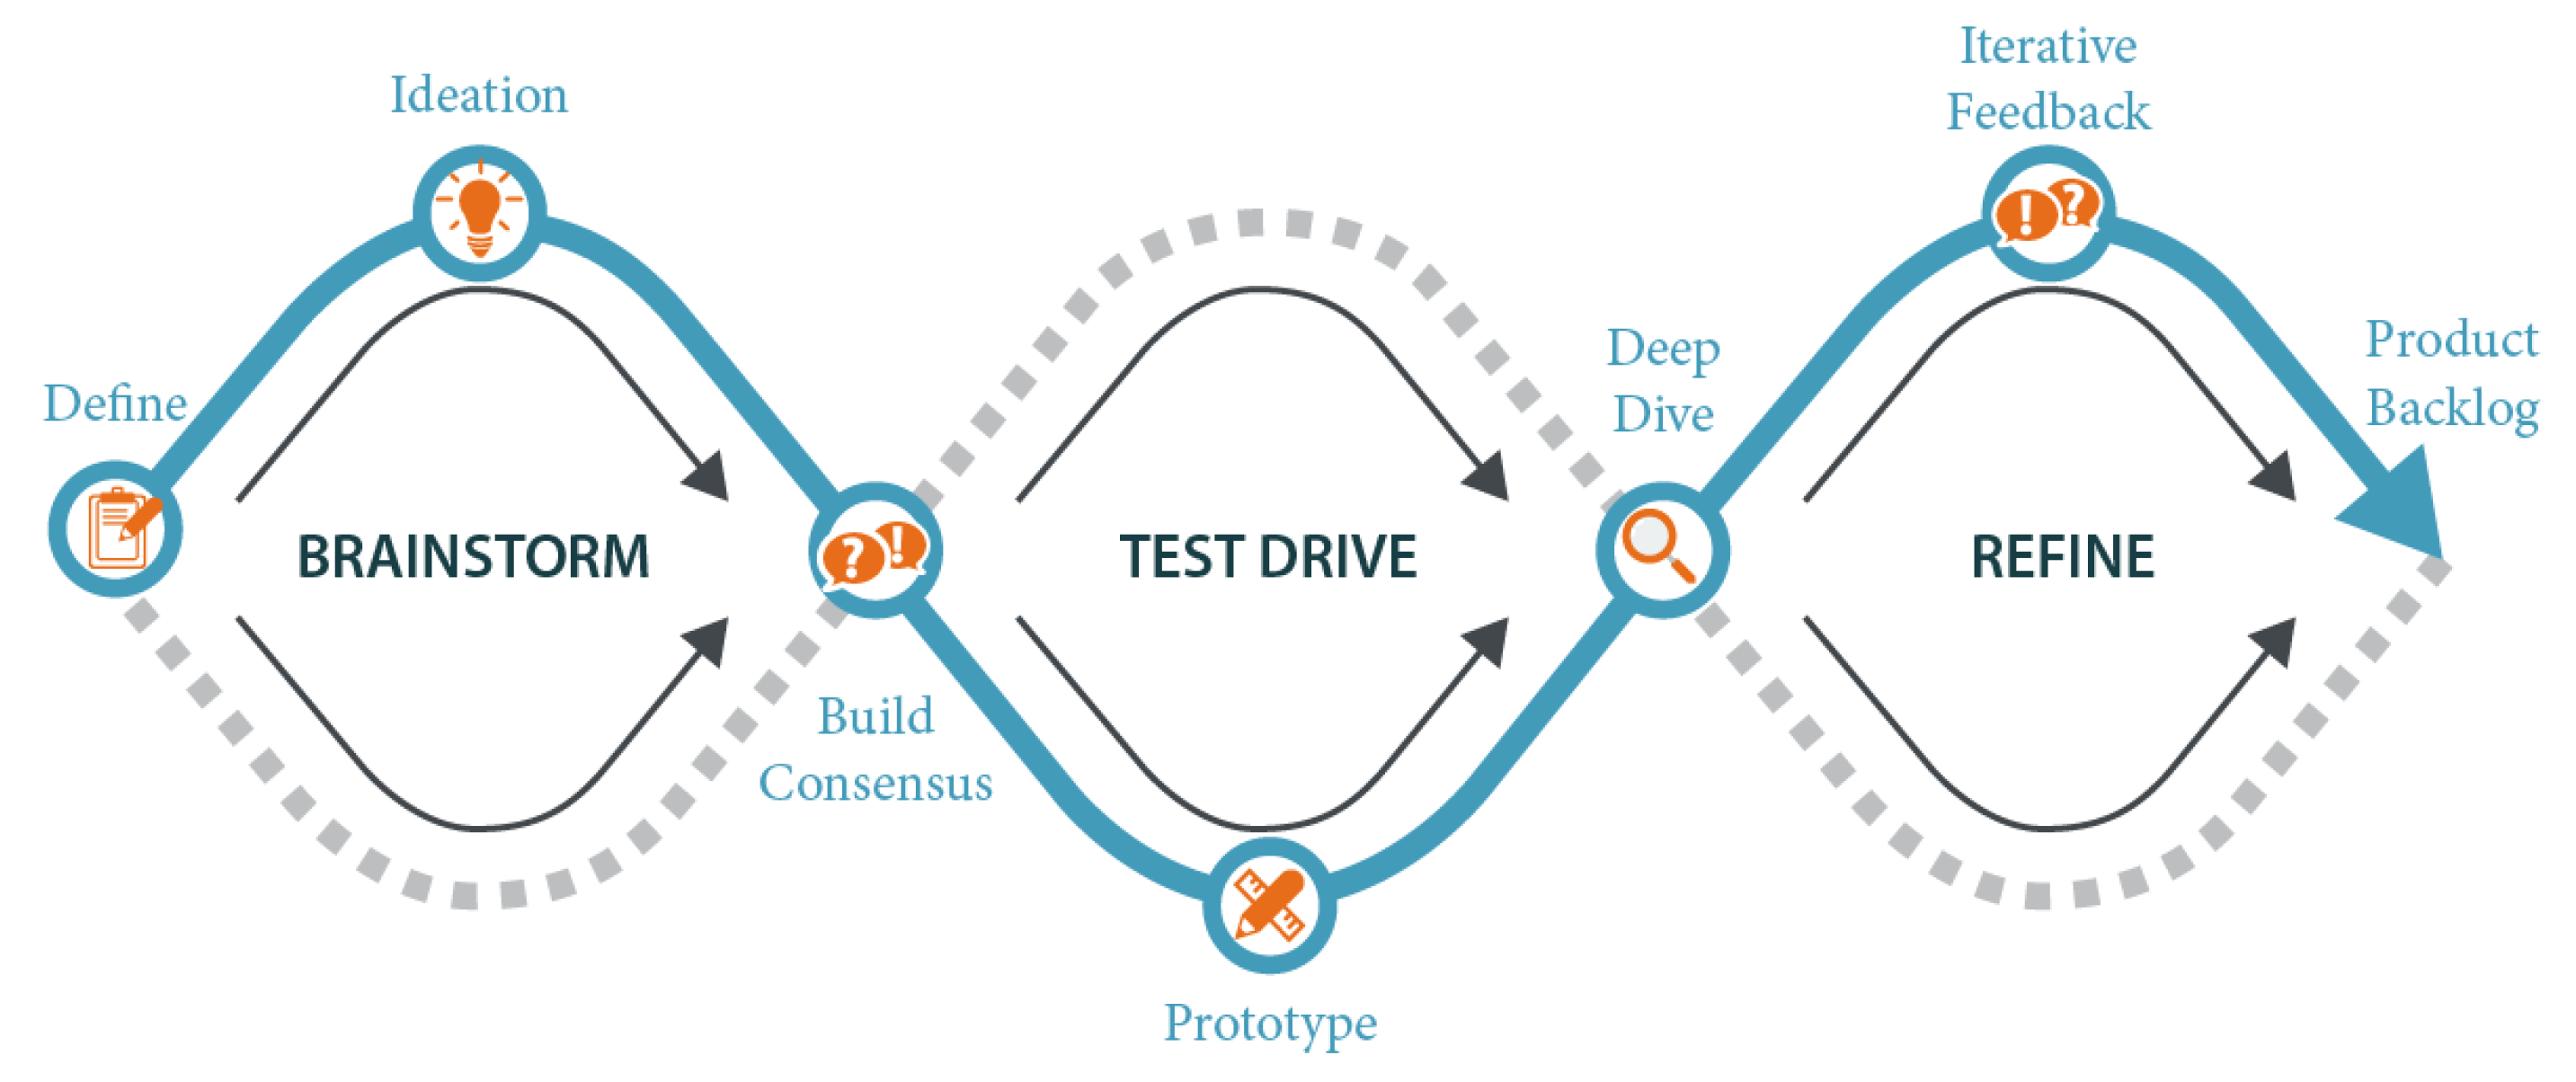
2.1. User-Centered Design

We employed a holistic UCD framework to overcome the challenges discussed in Section 1.1. We will further provide an overview of this framework, discuss specific methods employed within the framework, and provide examples of resultant user-centered requirements elicited through these various activities.

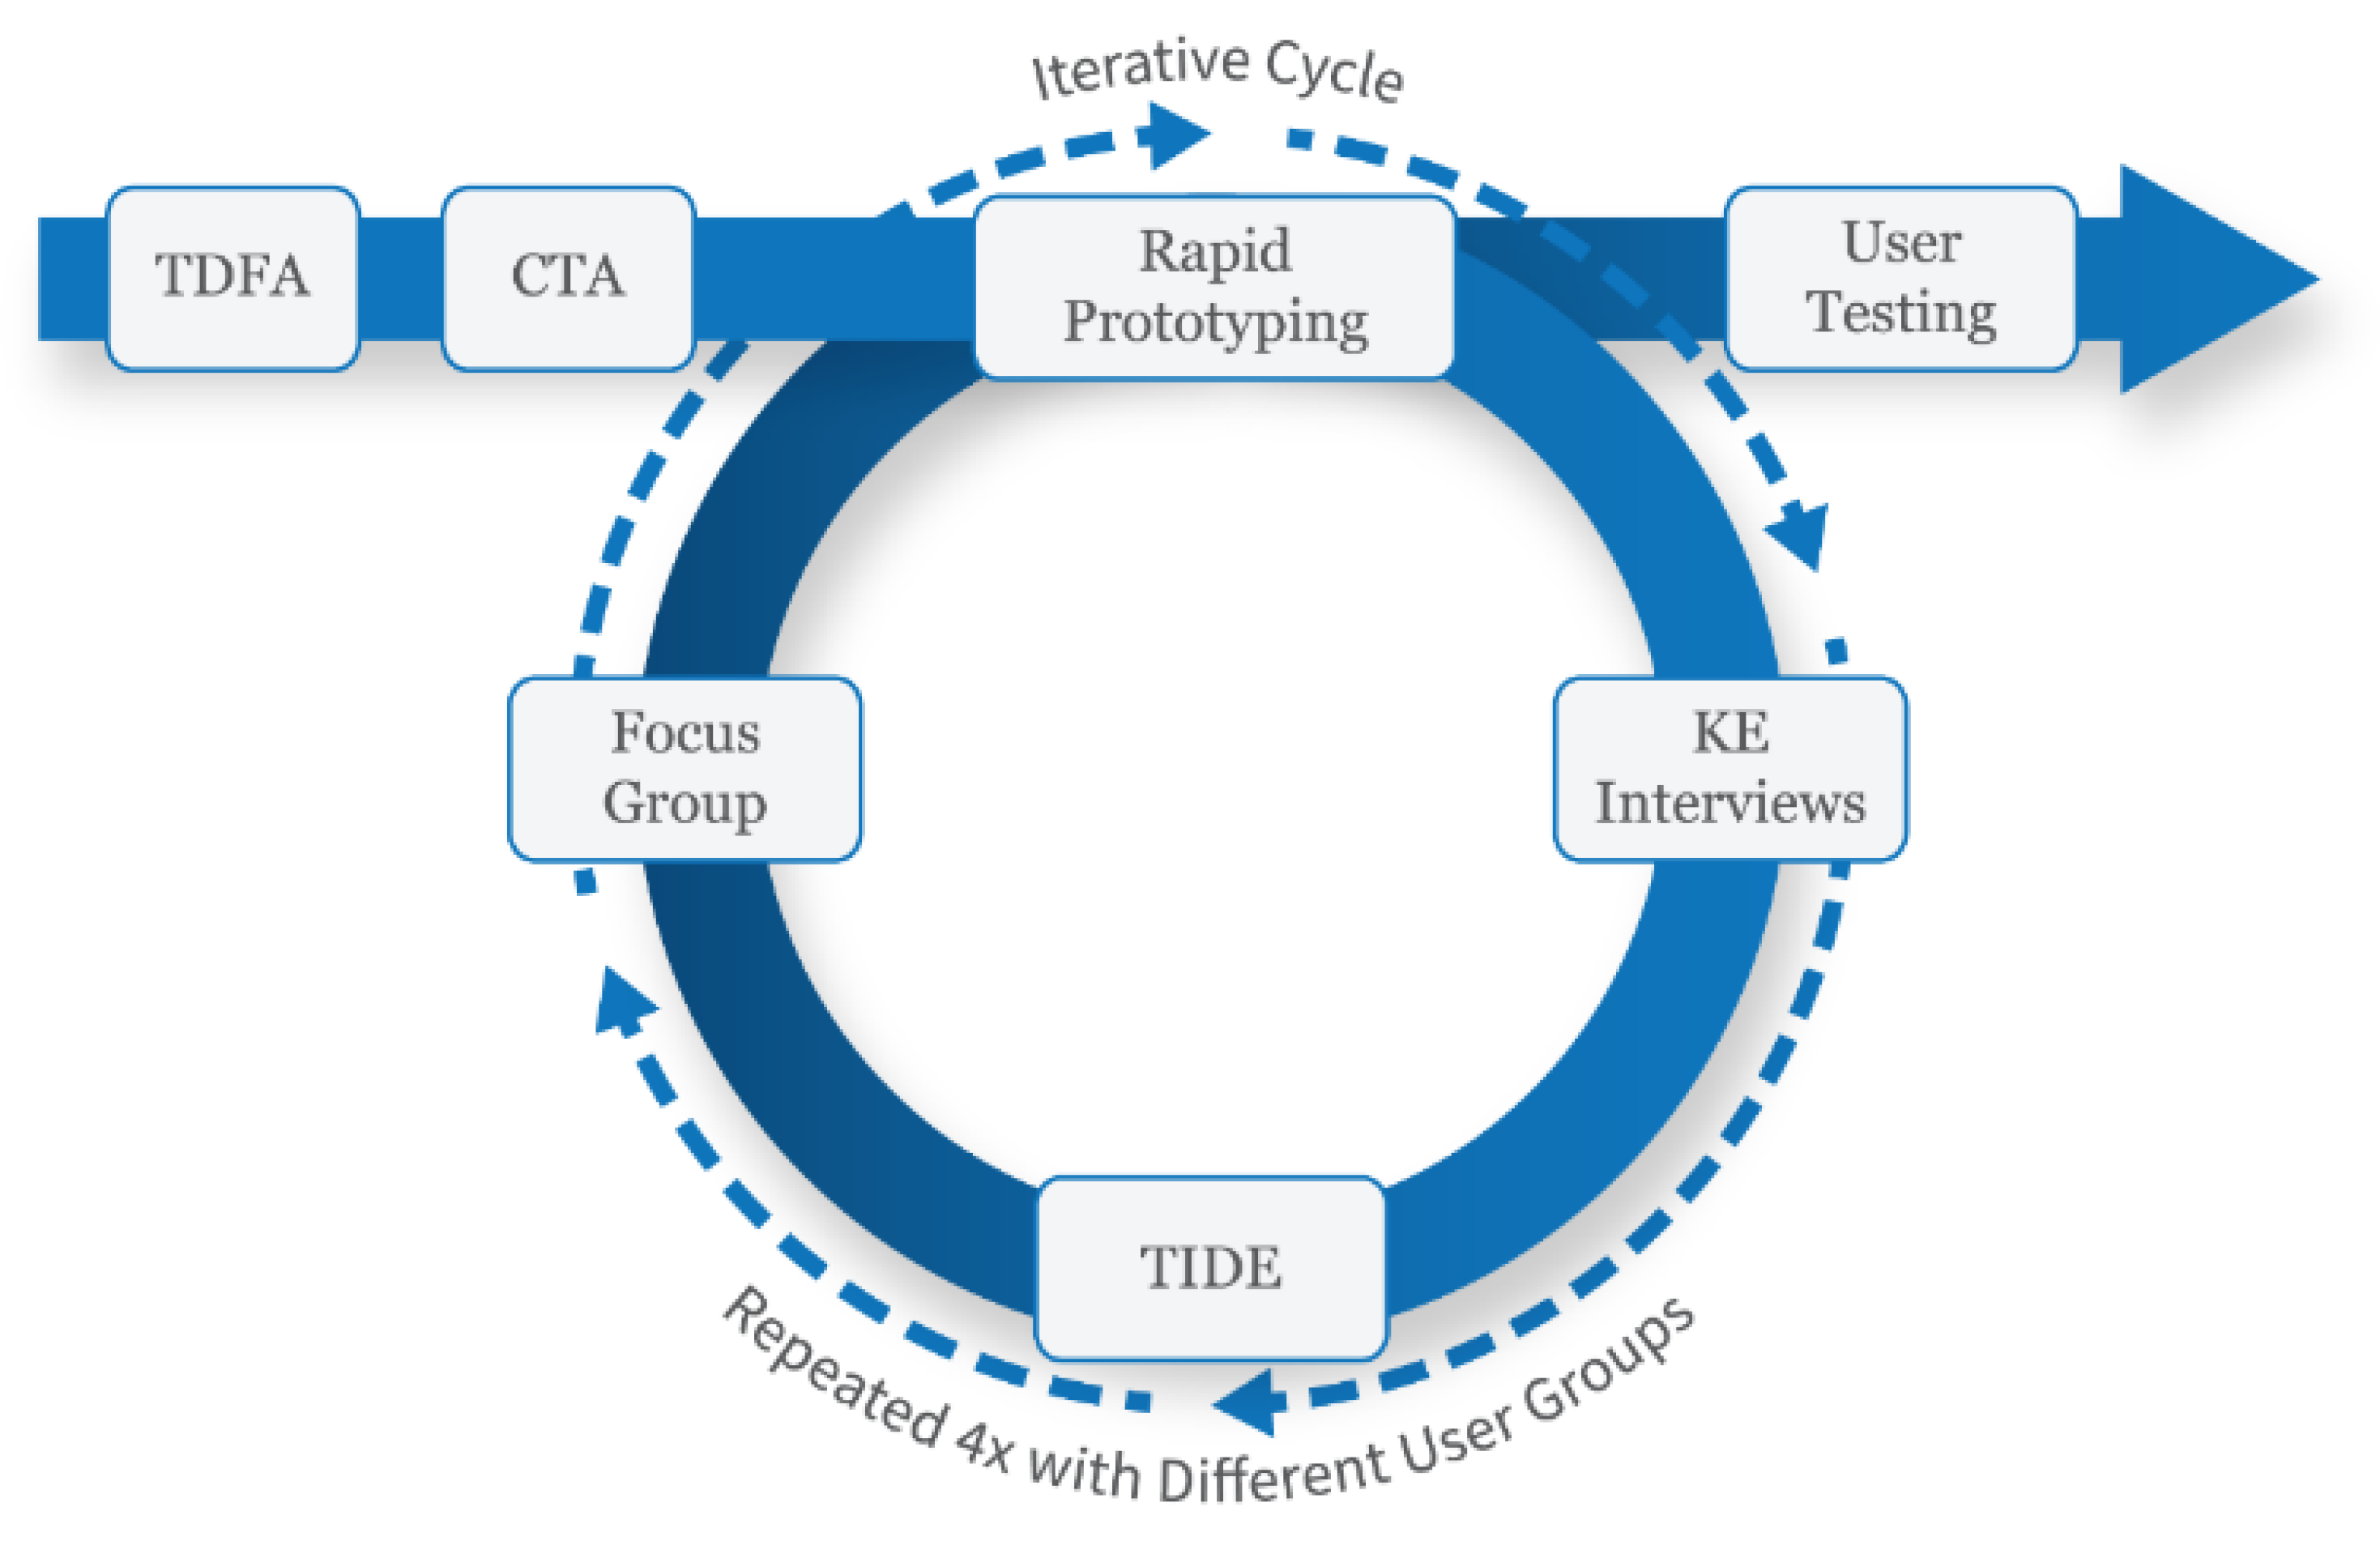
2.1.1. UCD Framework and Components

We employed a combination of different UCD disciplines to afford us the flexibility and responsiveness required to address such a disparate set of missions and enabling technologies across the enterprise. Over the course of nearly three years, we worked with a sample of more than 60 Uniformed and Civilian Air Force personnel who were actively flying more than 20 different satellite missions. By utilizing a blend of methods and best practices from HFE and design thinking (Table 1), we were able to adapt our methods quickly based on our continuously evolving understanding of operator needs and system requirements. This blended approach leveraged the strengths of each UCD method while offsetting their shortcomings.

2.1.2. Functional and Task Analysis

As shown in Figure 1, we began with foundational research methods such as the Top-Down Functional Analysis (TDFA) and the Cognitive Task Analysis (CTA). In general, functional analysis is the process of identifying the core functions of the system, and associated resources required to successfully complete those functions [19]. The TDFA was used to identify high-drivers of workload, and enabled us to conduct an informed functional allocation, or assignment of functions to the human operator or to automation [20,21]. For each function, we collected data on what information, hardware, software, and personnel would be required to successfully execute the function. The CTA is similar to a TDFA, although it focuses on the cognitive processes, knowledge, mental models of operators to achieve their mission and goals [22,23]. For each task, we collected the frequency, difficulty, criticality, and other attributes, which enabled us to glean insights on which areas of operation to focus our research on. We conducted both analyses by making use of a variety of documents such as the Master Training Task List (MTTL) from various satellite systems, and from interviewing end users and subject matter experts on SATC2. The results of these methods enabled us to develop a basic understanding of the SATC2 domain, and develop notional information architectures, task flows, user requirements, and designs of the HMI and decision support capabilities. From this notional understanding, we then engaged in four iterative cycles of user research with different user groups to gain a diverse perspective. Each of the four groups included users from a new or unique set of missions (i.e., satellites) that flew in different orbits, carried different payloads, had different sized crews, and conducted various types of operations (e.g., weather, communications, or intelligence collection).

2.1.3. Rapid Prototyping

We began each cycle with a rapid prototyping effort of a few weeks in length. During the rapid prototyping phase, we would refine the designs for as many system components as possible (e.g., schedule, telemetry, and alarms). Based on available time and resources for prototyping we iteratively advanced designs through the following three levels of maturity, incorporating user feedback at each step to ensure that the system was designed from the onset to meet the needs of end users:
  • Sketches: low-fidelity drawings to demonstrate a concept, usually developed with pen and paper or on a whiteboard;
  • Wireframes: Medium-fidelity black and white layouts to allocate screen space to required controls and displays. Wireframes are usually developed with tools such as Balsamiq Mockups or Microsoft PowerPoint;
  • Mockups: High fidelity renderings of what the implemented system will look like, including colors, iconography, and text hierarchy. Mockups are usually developed with tools such as Adobe Illustrator.

2.1.4. Knowledge Elicitation (KE) Interviews

Following rapid prototyping, we would then conduct a round of Knowledge Elicitation (KE) interviews. We conducted semi-structured interviews using an interview prompt containing questions designed to understand the mental model of users, understanding how they view SATC2, identifying what their biggest challenges are, and what their vision for what an ideal SATC2 HMI would look like. We generated transcripts for each interview, then used a structured technique to conduct thematic analysis of responses [24]. This structured and repeatable method enabled us to glean numerous insights form interviews, while ensuring validity of the findings to the fullest extent possible [25]. This method resulted in not only the verification and validations of our designs as they stood, but a deep contextual understanding of what the challenged end users face—and possible solutions, which enabled us to refine our design thinking approach.

2.1.5. Targeted Ideation Development Events (TIDEs) and Focus Groups

Targeted Ideation Development Events (TIDEs) were used iteratively to engage operators in the innovation process, guiding them through participatory activities to generate novel concepts and operational workflows to accompany the new EGS-enabled HMI. A TIDE is our scalable Design Thinking (DT) framework, where participants from multiple organizations and mission areas are facilitated through a series of alternating divergent and convergent exercises (Figure 2). TIDEs harness the diverse expertise of participants to brainstorm, develop consensus, and refine innovative concepts into implementable solutions. Each TIDE was designed to specifically address high priority topics that would have the greatest impact on system design (e.g., advanced data analytics).
While DT methods are capable of producing a multitude of innovative concepts; the rapidity with which they are developed means they are often shallow in nature. Furthermore, user-generated ideas rarely consider operator performance or decision-making [26]. Therefore, we oriented TIDE outputs around the SA needs of operators, using the information architectures derived from the TDFA and CTA artifacts.
Focus groups were conducted after each TIDE to incorporate the novel concepts from the TIDEs into our design baseline. As a result, the use of these methods helped develop an interface that was not only effective and efficient from a performance standpoint, but also incorporated key features developed by the operators themselves, making it viewed by operators as being enjoyable to use. Serving as a final checksum for developing a design baseline, the focus group was followed by rapid prototyping, kicking off another cycle of UCD methods.

2.1.6. The UCD Framework in Practice

This iterative cycle in Figure 1 enabled us to rapidly adapt system designs (and future user research approaches) based on new insights gleaned from users during each activity. In the following paragraphs we provide a concrete example of how this process worked in action, to supplement the more abstract description of the framework.
We generated an initial set of mockups based on insights from the TDFA and CTA. Operators commented in the first round of KE that SA was highly dependent on the status and telemetry of ground systems (e.g., servers and equipment to process telemetry), something that we had largely overlooked. Based on this insight, we were able to add brainstorming topics about ground equipment to the TIDE that was scheduled for only a few days later. During the TIDE, operators were led through brainstorming and consensus-building activities, where dozens of innovative ideas were generated for enhancing ground-based SA. Per common DT practices, many of these raw ideas (expressed simply on a sticky note) were clustered with other similar ideas, coalescing them into more cogent concepts for implementation. A weakness of this DT approach is that novel ideas that are not easily binned into common categories can become overlooked. To address this shortfall, we transcribed all raw ideas (i.e., individual sticky notes) following the TIDE, and employed HFE methods such as thematic or protocol analysis, where we evaluated each outlier idea to determine their utility and feasibility based on other collected data such as the CTA, TDFA, and KE interviews. Based on this more thorough analysis, some outlier ideas that were overlooked in the TIDE were incorporated into designs for evaluation at a follow-on focus group.
At the follow-on focus group, many operators expressed support for these outliers, such as the ability for operators to add annotations or comments on specific ground system components. We were able to identify this as a pain point in previous KE interviews, where some operators had even suggested similar solutions. Managing ground systems was not identified as a high-driver of workload in the TDFA or CTA. This capability was not one of the more significant findings from the KE interviews, and was not a finding from the TIDE synthesis. Had we not employed a blended approach, this user-driven capability would not have been captured. This structured and iterative combination of UCD disciplines and methods enabled us to be responsive to user inputs and identify critical user requirements that would have otherwise been lost, all while maintaining the traceability and defensibility of our findings.

2.1.7. User-Driven Requirements

The Adaptable Environment for Space Operations (AESOP) was designed to reflect the insights gleaned from the iterative UCD research conducted over the course of nearly three years [26]. We started from user-centered requirements, then designed the system based on the principle of effective variety: That the HMI should be as simple as possible, but as complex as necessitated by the tasks and environment [27].
We elicited hundreds of user-centered requirements through the various methods described in Table 1. In doing so, we had numerous types of operators from different organizations and missions come to consensus and prioritize which requirements or features were the most important. Due to security issues, we cannot provide a detailed overview of these requirements; however, the following is a small sample of high-level user requirements that frequently came up during user research and were subsequently implemented into the AESOP design and proof-of-concept system. These user requirements are also generalizable outside of SATC2 to other supervisory control systems:
  • Window Management: Some legacy systems require dozens of unique panes or windows to conduct basic tasks, which can create clutter and occlude critical information. Users require critical controls and displays to be consolidated into a single window with no modals or floating panes to obscure critical information. We used affordances from web browsers in our designs (e.g., tabs, hyperlinks, drag-and-drop interactions), since users indicated that they were comfortable juggling large amounts of information in browsers;
  • Hyperlink Interactivity: Another browser affordance required by users was the use of hyperlinks to facilitate movement between different pages of information and/or widgets. This enabled more single-click navigation and reduced the time operators spent navigating drop-down context menus;
  • Task-Driven Telemetry: Most legacy systems organize and display telemetry based on system configurations. We incorporated task-driven telemetry pages that were configured for specific tasks or maneuvers and added an ability for users to create and save custom pages of telemetry;
  • Roll-up Status Information: Many legacy systems only flag specific telemetry points with anomalous values; some do not flag them at all. Users require roll-up status information at the subsystem- and vehicle-level, enabling users to “follow the trail” and more rapidly find the applicable detailed telemetry required to resolve anomalies;
  • Proactive Decision Support: Current stove-piped operations often require emails and phone calls to obtain information to support decision making. Acknowledging that there will likely be a central source of data in future operations, users require numerous proactive decision support capabilities (e.g., tool-tips on-hover or on-click actions) to provide operators with additional information to answer the follow-on questions they are most likely to have.

2.2. User Testing Methods

We developed an AESOP prototype based on the UCD methods described in Section 2, and conducted user testing to address the impact of UCD on SATC2. This study was a two-by-three, fully factorial, within-subjects design with multiple objective and subjective measures. All twelve participants used both HMIs (legacy and AESOP) to conduct all three different pass types with varying complexity. This user testing was determined to be not human subjects research by the presiding institutional review board; however, informed consent was obtained from all participants as a best practice.

2.2.1. Participants

Twelve active-duty Air Force SATC2 operators were recruited to participate in user testing. All participants had training and operational experience with the legacy HMI (i.e., the HMI used to fly the satellite being simulated for user testing). Of the 12 participants, half (n = 6) had no experience flying the specific communications satellite that was simulated for user testing (hereafter referred to simply as the “test system”), but were still familiar with the legacy HMI (which is used for SATC2 of the test system. Four operators were current operators of the test system (33%), and two were prior operators (17%) that had not conducted SATC2 of the test system (in real operations or a simulation) for more than a year. Overall, half of the participants (n = 6) had either current or prior experience with the test system, while the other half (n = 6) had no experience with the test system at all. This range of experience levels (current, prior, or no operations) provided a means to better generalize findings, rather than if only one type of operator were involved. Table 2 provides an overview of relevant participant demographics.
None of the participants in user testing had participated in any previous user research. The disjoint sets of participants in formative user research activities and summative user testing mitigated the potential for biases or favorability in subjective measures for AESOP. Further, it should be noted that all twelve participants had at least 18 months of experience using the legacy HMI, providing a considerable advantage for the legacy HMI. That is, participants were already proficient with the legacy HMI, and therefore, were likely to perform better and to experience less workload conducting the same tasks as they would with a new system with which they have less than 90 min of training and experience. This sample size (n = 12) was deemed adequate based on the relatively small the user population for the test system (i.e., it is sufficiently representative); further, the statistical power reported in various results sections supports this sample size being adequate.

2.2.2. Apparatus

User testing was performed with the Standard Space Trainer (SST), a software program that allows for simulation of numerous space systems through the use of Mission-Specific Vendor Plugins (MSVPs). To conduct user testing, the SST was equipped with both the MSVP for the test system, and with an MSVP for the proof-of-concept AESOP HMI. This allowed participants to complete test scenarios using the two different HMIs, where both were powered by the same simulation engine and component models (orbital mechanics, telemetry, etc.) for a valid comparison. The SST includes a data capture ability that time-stamped key events and collected scenario completion and success measures for further analysis. The SST was run on a desktop computer with four 24” monitors (1920 × 1200) arranged in a side-by-side fashion. An opaque paper was placed over the fourth (right-most) monitor to prevent participants from seeing the “instructor’s interface,” which displays the exact chain of simulated events to be conducted and enumerates the specific actions to be completed for a successful scenario.

2.2.3. Dependent Measures

A variety of dependent measures was used to assess the degree to which AESOP achieved our research goals (Section 1.3).

2.2.4. Performance and SA

A primary goal of AESOP is to increase the performance and SA of SATC2 Operators. Performance can be broken down more explicitly, but it generally refers to faster and more error-free operations. Thus, we measure performance by the number of supports successfully completed by operators in each test condition (a binary pass or fail measure).
SA is the construct that describes how humans acquire and interpret information for decision-making in dynamic tasks [28,29]. The SA model is composed of three levels: (1) perception of elements in the environment, (2) comprehension of the current situation, and (3) projection of future status, where each level of SA is a prerequisite for the following level [27,28]. In other words, an operator cannot predict a satellite’s future state (Level 3) if they are unaware of its current state (Level 2), and they cannot be aware of its current state if that have not perceived the various status indicators in the display (Level 1). The most direct method to measure SA at all levels is the Situation Awareness Global Assessment Test (SAGAT), a freeze-probe method, where a scenario is paused and the participant responds to a question about an SA-relevant piece of information that was identified in a task analysis [30]. Although the SAGAT has construct validity for directly assessing the participant’s state of mind rather than relying on inference, a problem with the SAGAT is that it requires interruptions of the scenario, implementation of questions, and the logging of responses.
Because of practical and logistical considerations (e.g., the already compressed schedule of three hours to collect data across three test scenarios for two HMIs), SA was measured by proxy through a time-based measure. More specifically, the time to identify, diagnose, and resolve anomalies and tasking correspond well to SA Levels 1–3. That is, less time to perceive an alert implies better Level 1 SA. Similarly, less time to open the correct Technical Order (TO, a checklist of actions to resolve an anomaly) implies better Level 2 SA. Finally, the time to send the correct command to fix the anomaly (based on predicting its future states if ignored or an alternative course of action was selected) would imply a measure of Level 3 SA. This construct was used as a means to assess operator SA in an already time-constrained test environment without pausing the simulation. Because the command script to resolve the anomaly was automated (i.e., out of the operators control once initiated, and consistently timed), we only assessed the time to identify and diagnose the anomaly (i.e., perceive the alarm, find the correct TO, and initiate the script).

2.2.5. Workload

Workload, or the degree to which participants are taxed (cognitively, physically, or otherwise) to perform work, was captured using the NASA-TLX. The NASA-TLX is a self-report method that enables the capture of an overall or “global” workload score, as well as several workload subscales including mental demand, physical demand, temporal demand, performance, effort, and frustration levels [31]. The TLX generated a global score between 0–100, which was used to assess workload across the HMIs to determine if AESOP decreased workload for operators. It should be noted that a NASA-TLX score is not inherently good or bad, but can be used to make comparisons across conditions. Research has been conducted to provide greater insight towards a more absolute good or bad interpretations in workload scores based on the context of the tasking; however, it is still widely used for comparative purposes [32].

2.2.6. Usability

Usability has been defined as the condition where an end user can do what they want with a system, in the way they expect to be able to do it, without hindrance or outside support; or more simply put, the absence of frustration [33]. The System Usability Scale (SUS) developed by Brooke [34] utilizes a 10 question, five-point Likert scale with alternating positively and negatively oriented statements on general usability characteristics. A simple function is used to transform responses to a single SUS score between 0 and 100. Because the SUS lacks construct validity at the single question level, only the aggregate score is utilized as a capture of overall subjective usability of the system [35]. Lewis and Sauro [36] have argued that there two content factors in the SUS: learnability and usability, but have done so validly only with sample sizes two orders of magnitude larger (i.e., in the thousands) than the sample size used for this study. Therefore, we only analyze the SUS at the aggregate level.

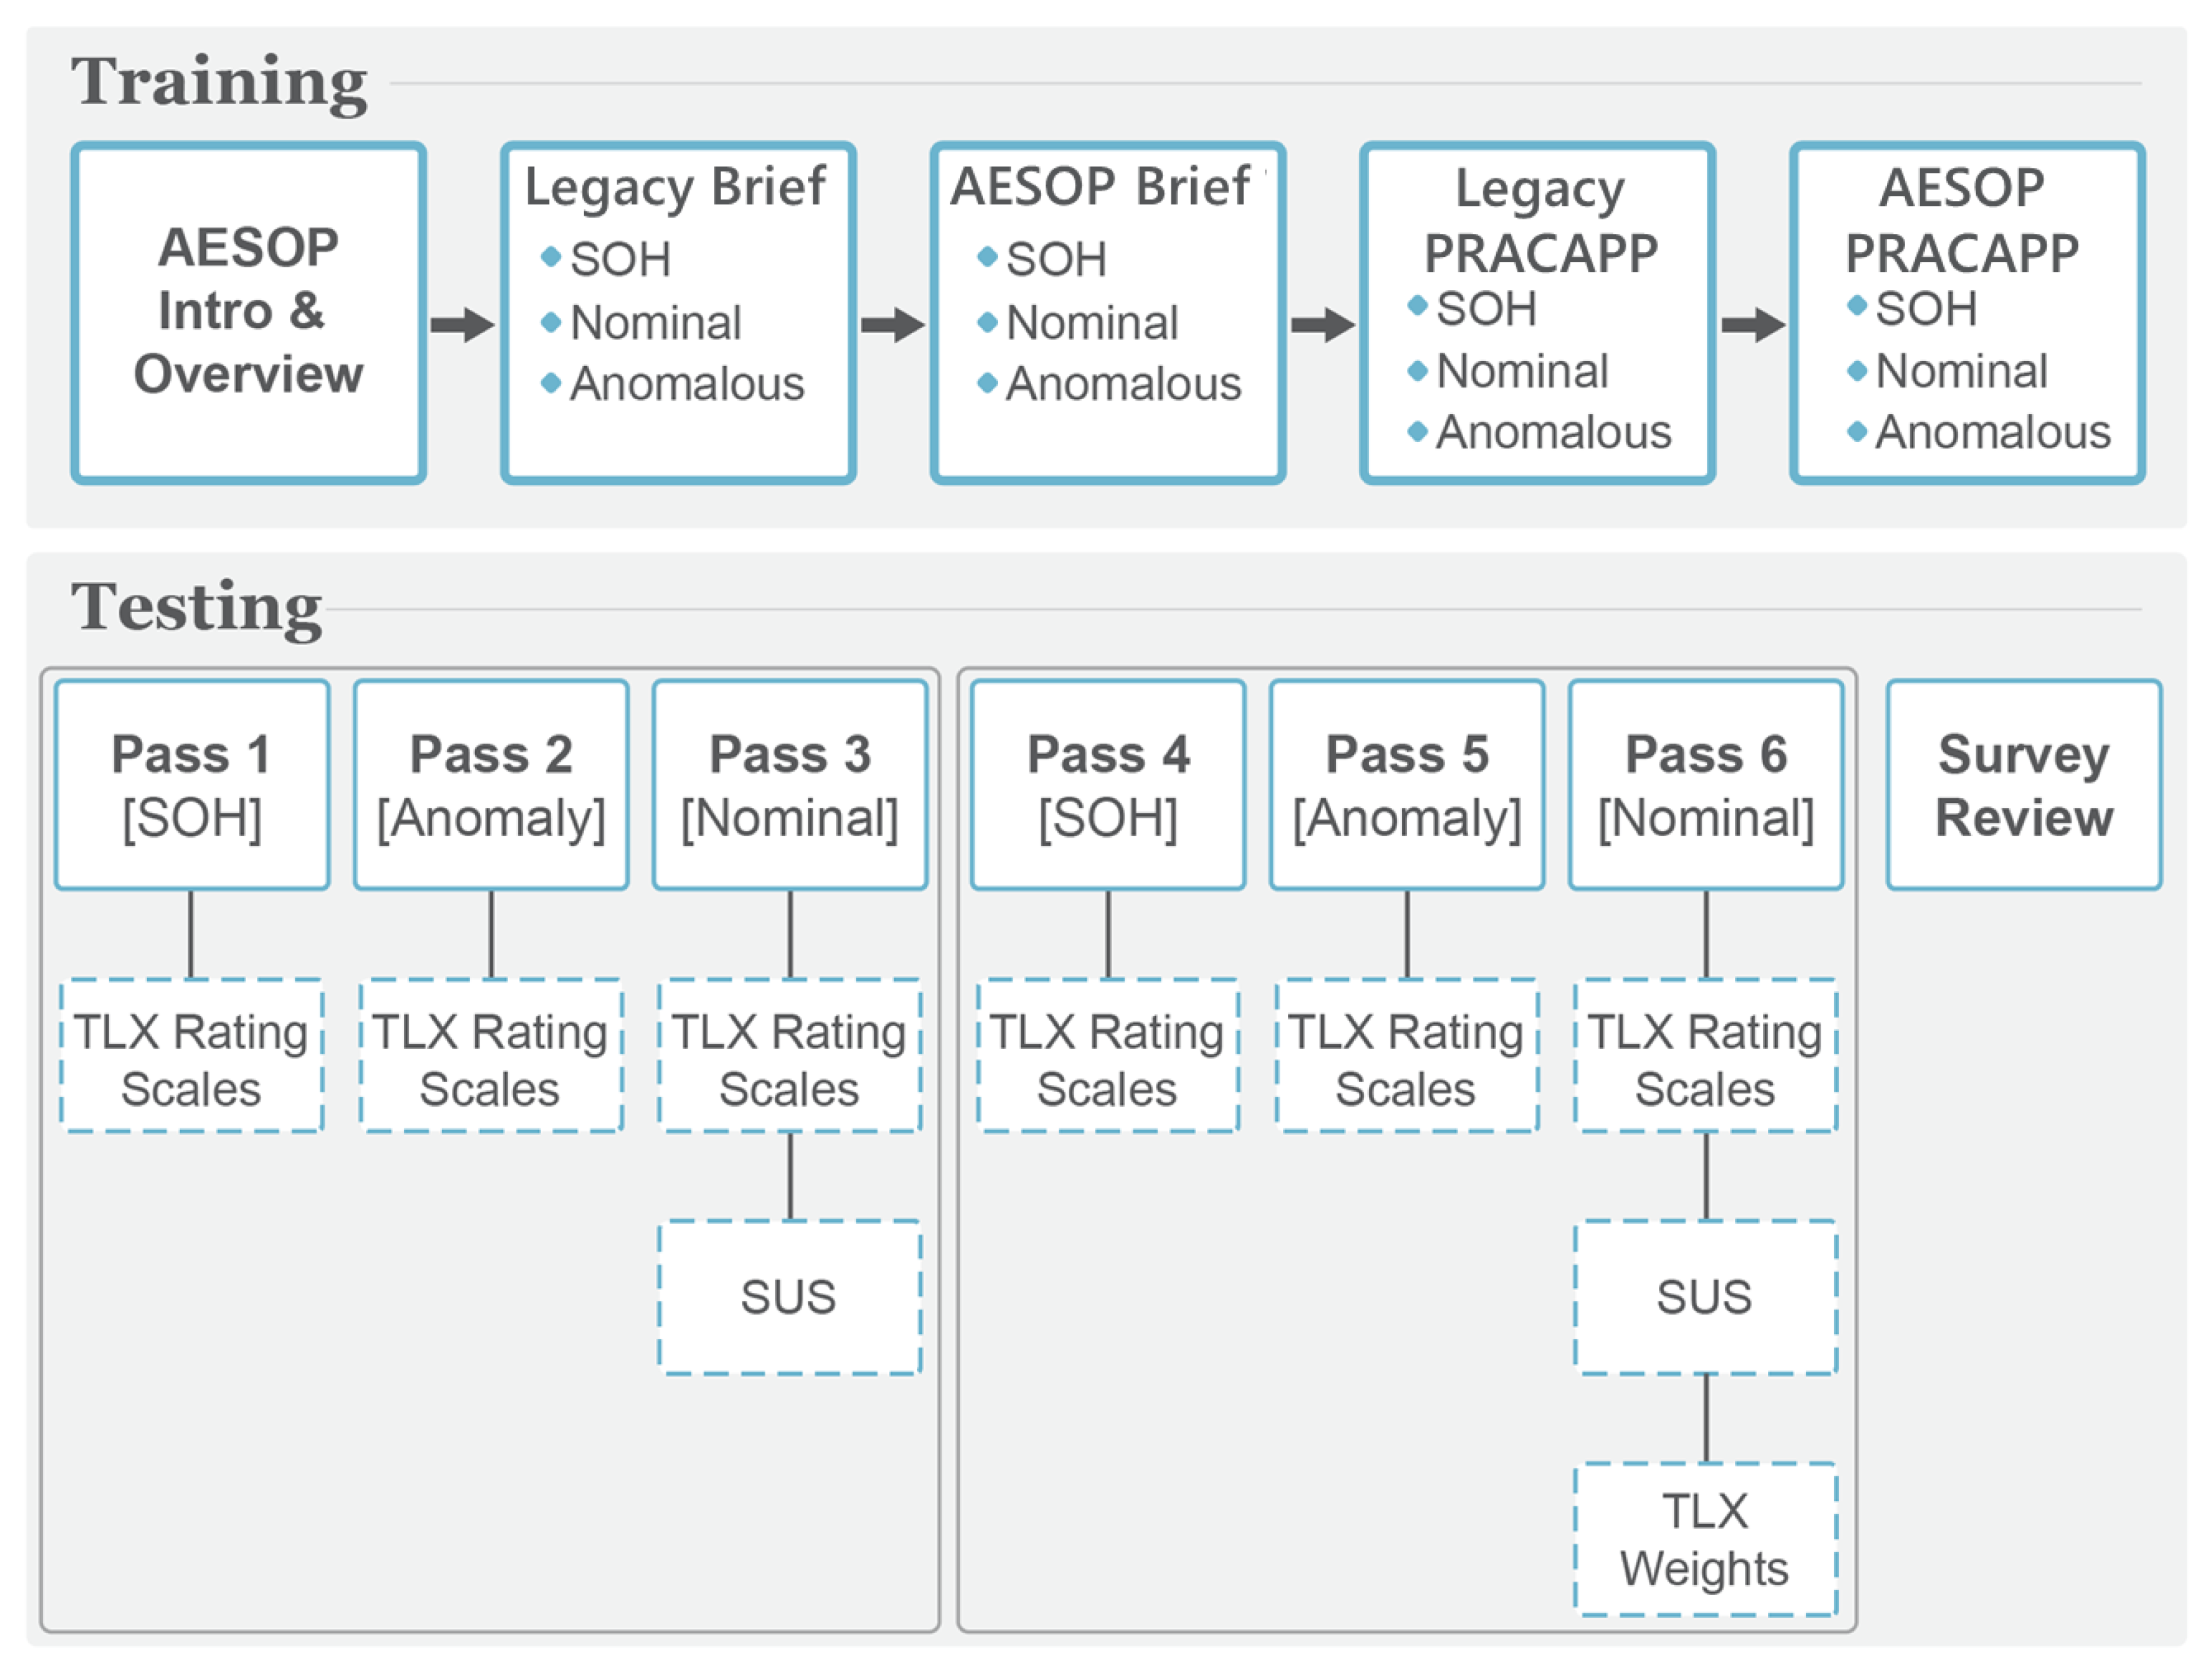
2.2.7. Scenario and Tasks

User testing was conducted in two phases (training and testing) across a single workweek (i.e., Monday through Friday). All participants attended one of two training sessions on the Monday so that they could obtain a baseline of competency across both systems. Training consisted of lecture-based instruction, followed by hand-on practical application training for each of the two HMIs. Participants were trained on how to conduct all three pass types that were included in the test scenario (which are listed here in order of low, medium, and high cognitive difficulty, respectively):
  • State of Health (SOH): the simplest SATC2 scenario, where the participant checks telemetry on the vehicle, and conducts no commanding;
  • Nominal commanding: an intermediate SATC2 scenario, where the participant conducts commanding for a standard task known a priori;
  • Anomalous commanding: the most difficult SATC2 scenario, where the participant must identify and respond to an anomaly that was not known a priori.
Participants flew the anomalous contact second and the SOH third in order to avoid skewing subjective workload ratings [37]. All participants conducted the same three scenarios for both HMIs, where odd-numbered participants used AESOP first, and even-numbered participants used the legacy HMI first, to control for ordering effects. After each of the six passes the participants completed the NASA-TLX, and after the final pass with each HMI the participants completed the SUS survey. This task flow is shown in Figure 3.

3. Results

Because of the small sample size of this experiment (n = 12), care was taken to test various assumptions within the data before conducting inferential statistics. A Kolmogorov–Smirnov (K-S) test was used to check for the assumption of normality. For variables where the K-S test produced a significant result (indicating that the data violated the assumption of normality), nonparametric methods such as the Mann–Whitney U were used, along with the median (Mdn) as the measure of central tendency. For data where the assumption of normality was held, parametric statistics such as the Analysis of Variance (ANOVA) were used along with the mean (M) as the measure of central tendency, in accordance with accepted practices [38].

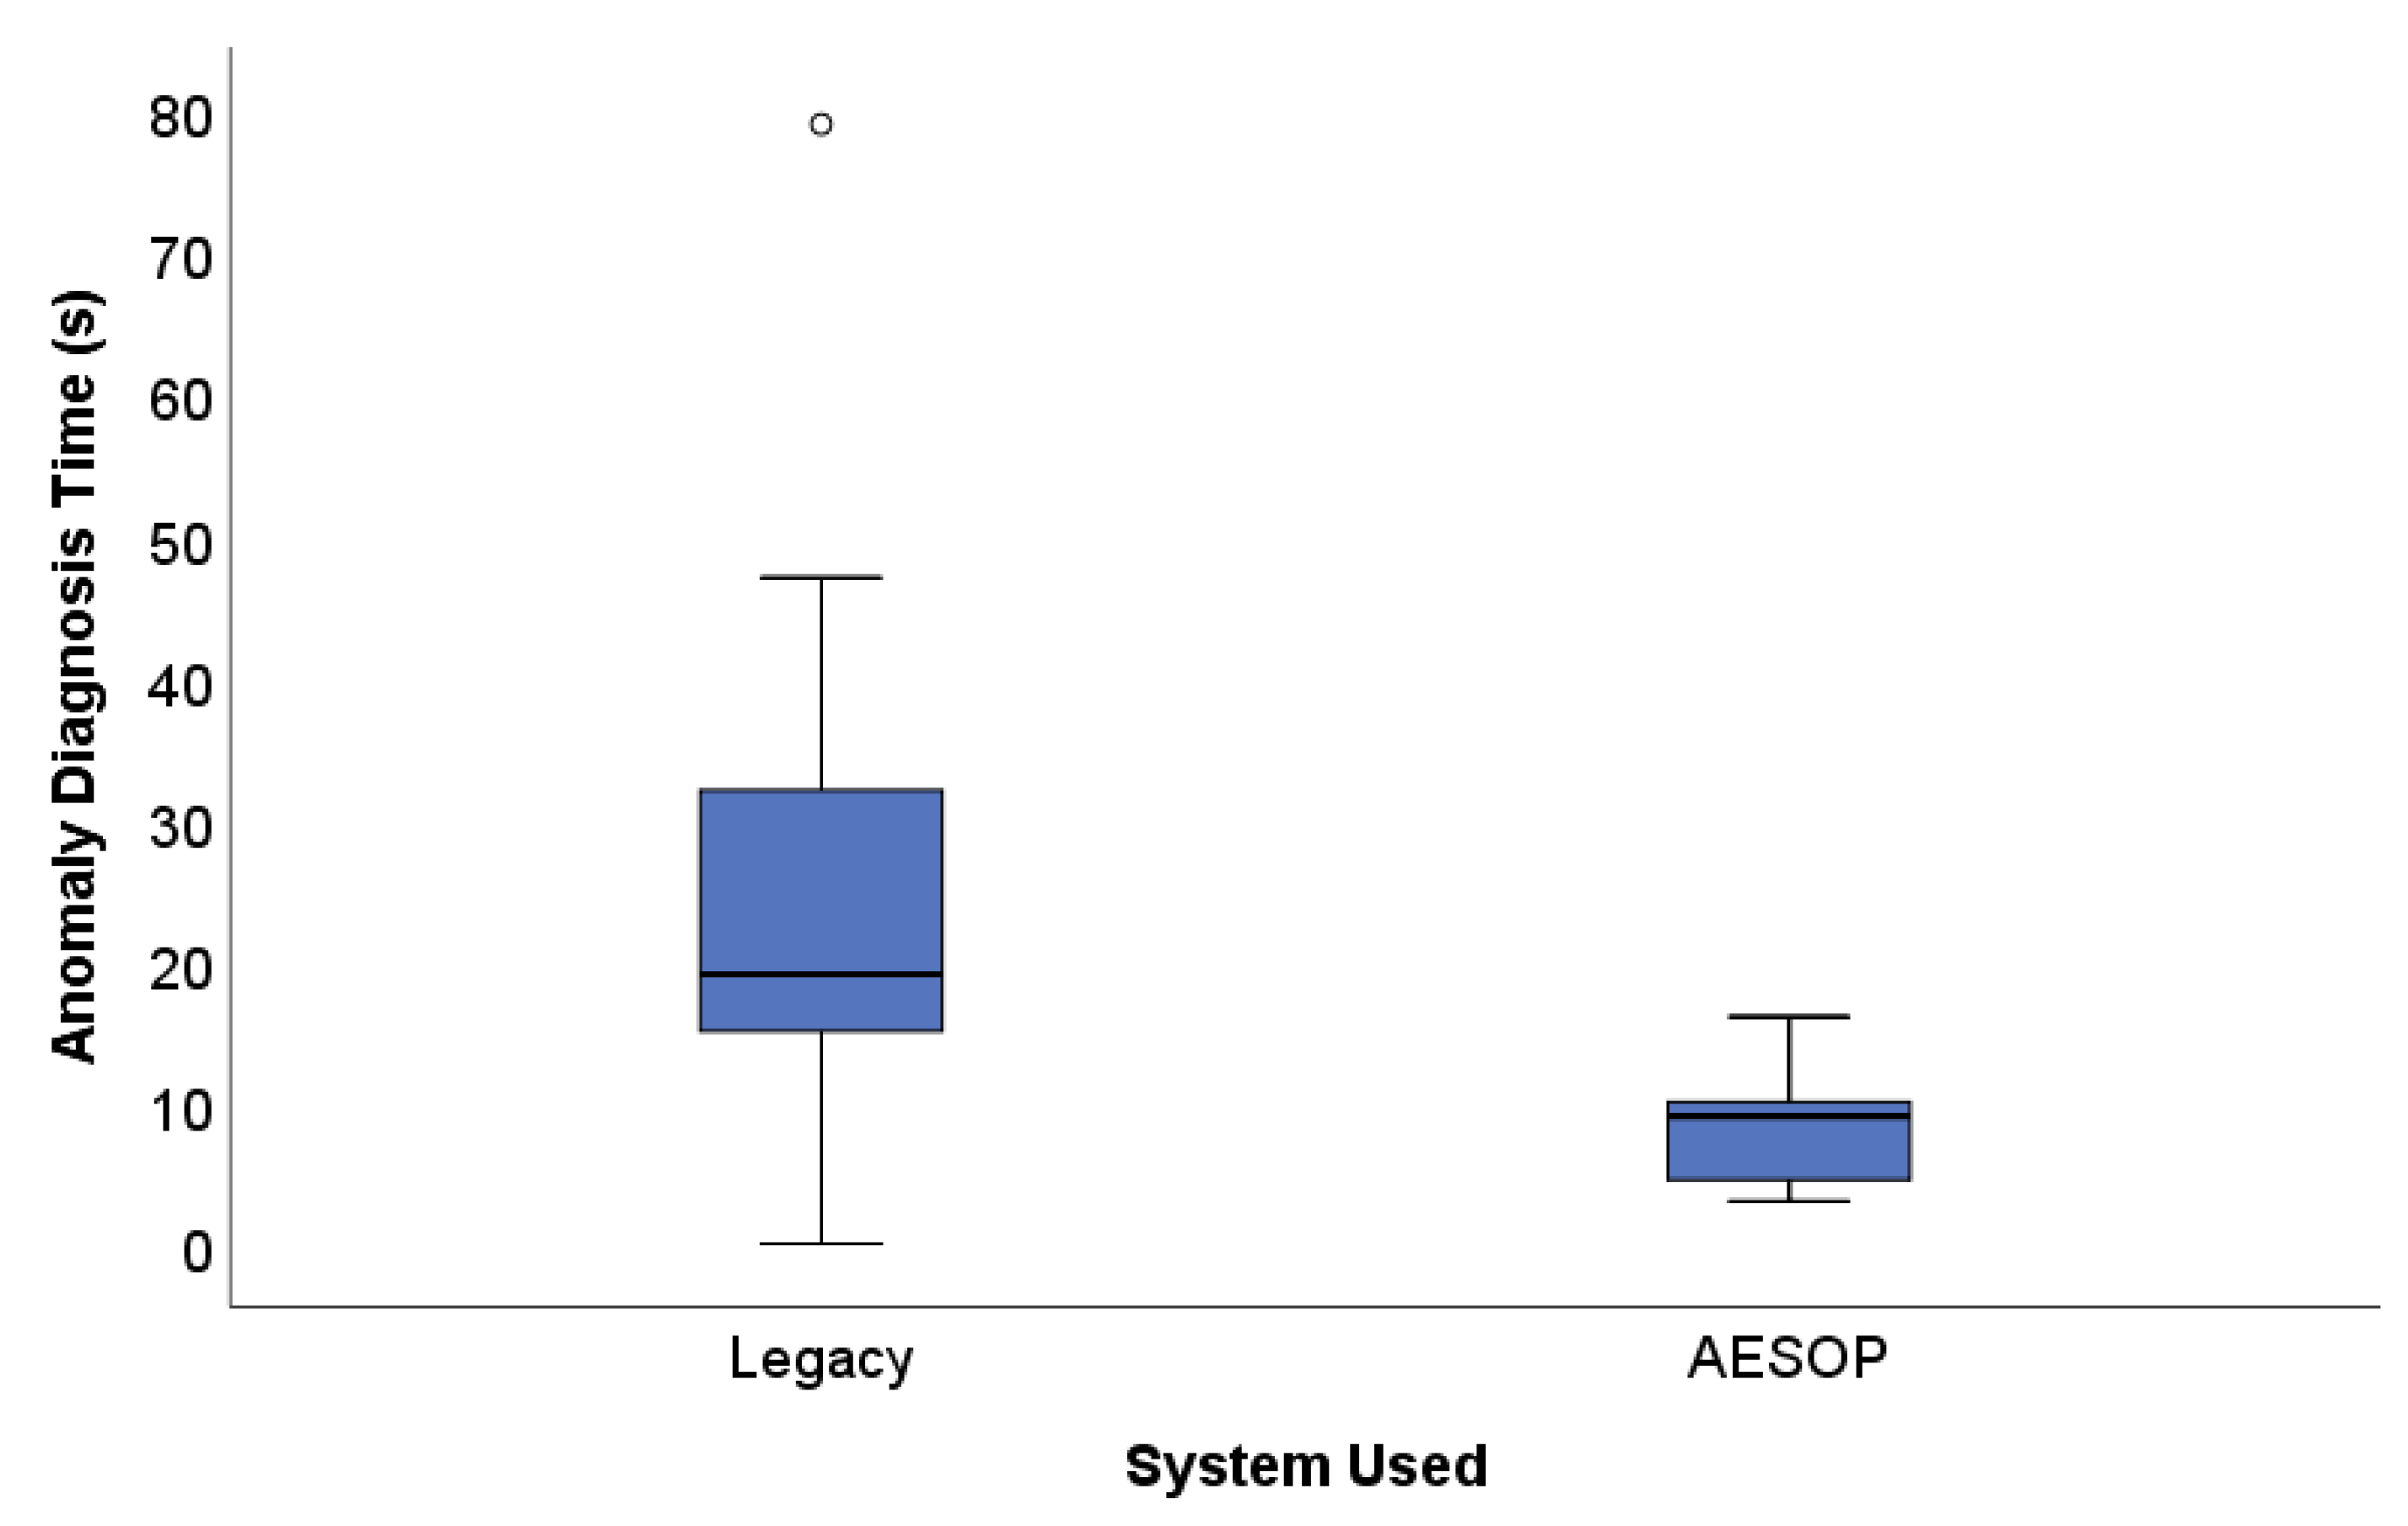
3.1. Performance Results

The most direct MOP is the degree to which operators can successfully complete all necessary tasks with each support/contact/pass. As shown in Table 3, all participants successfully completed all supports with the AESOP HMI; however, some participants failed to successfully complete anomalous commanding supports with the legacy HMI. Both of the participants who failed the anomalous commanding support were operators with no experience on this particular system (although they both had at least two years of SATC2 experience using the legacy HMI). One of the participants failed because they never saw the anomaly, and the other participant acknowledged the anomaly, but never enabled commanding, so all corrective actions taken were never sent to the vehicle, unbeknownst to the participant. Although there is an obvious ceiling effect in the data (i.e., nearly all participants passed all supports with all HMIs), all participants succeeded with AESOP, while less experienced participants failed to successfully resolve anomalies with the legacy HMI.

3.2. SA Results

A primary goal of AESOP is to increase SA. The previously conducted CTA highlighted that anomalous commanding was the most difficult area of SATC2 operations; therefore, we are interested in evaluating the SA of operators in anomalous commanding. More specifically, the reaction time of an Operator perceiving and diagnosing an anomaly (corresponding to Level 1 and Level 2 SA) is a critical performance measure. This value was measured as the difference in time stamps (in seconds) between the anomaly being displayed on the HMI and the time at which the operator opened the correct TO for resolving the anomaly. The anomaly diagnosis time for AESOP (M = 8.42, SD = 5.73) was significantly less than the anomaly diagnosis time for the legacy HMI (M = 24.83, SD = 21.53), F(1,22) = 6.72, p < 0.05, η2 = 0.23. Figure 4 shows a clear difference in anomaly resolution times, as well as the lower variance in anomaly diagnosis times afforded by the AESOP interface (i.e., AESOP provided more consistency in anomaly resolution).

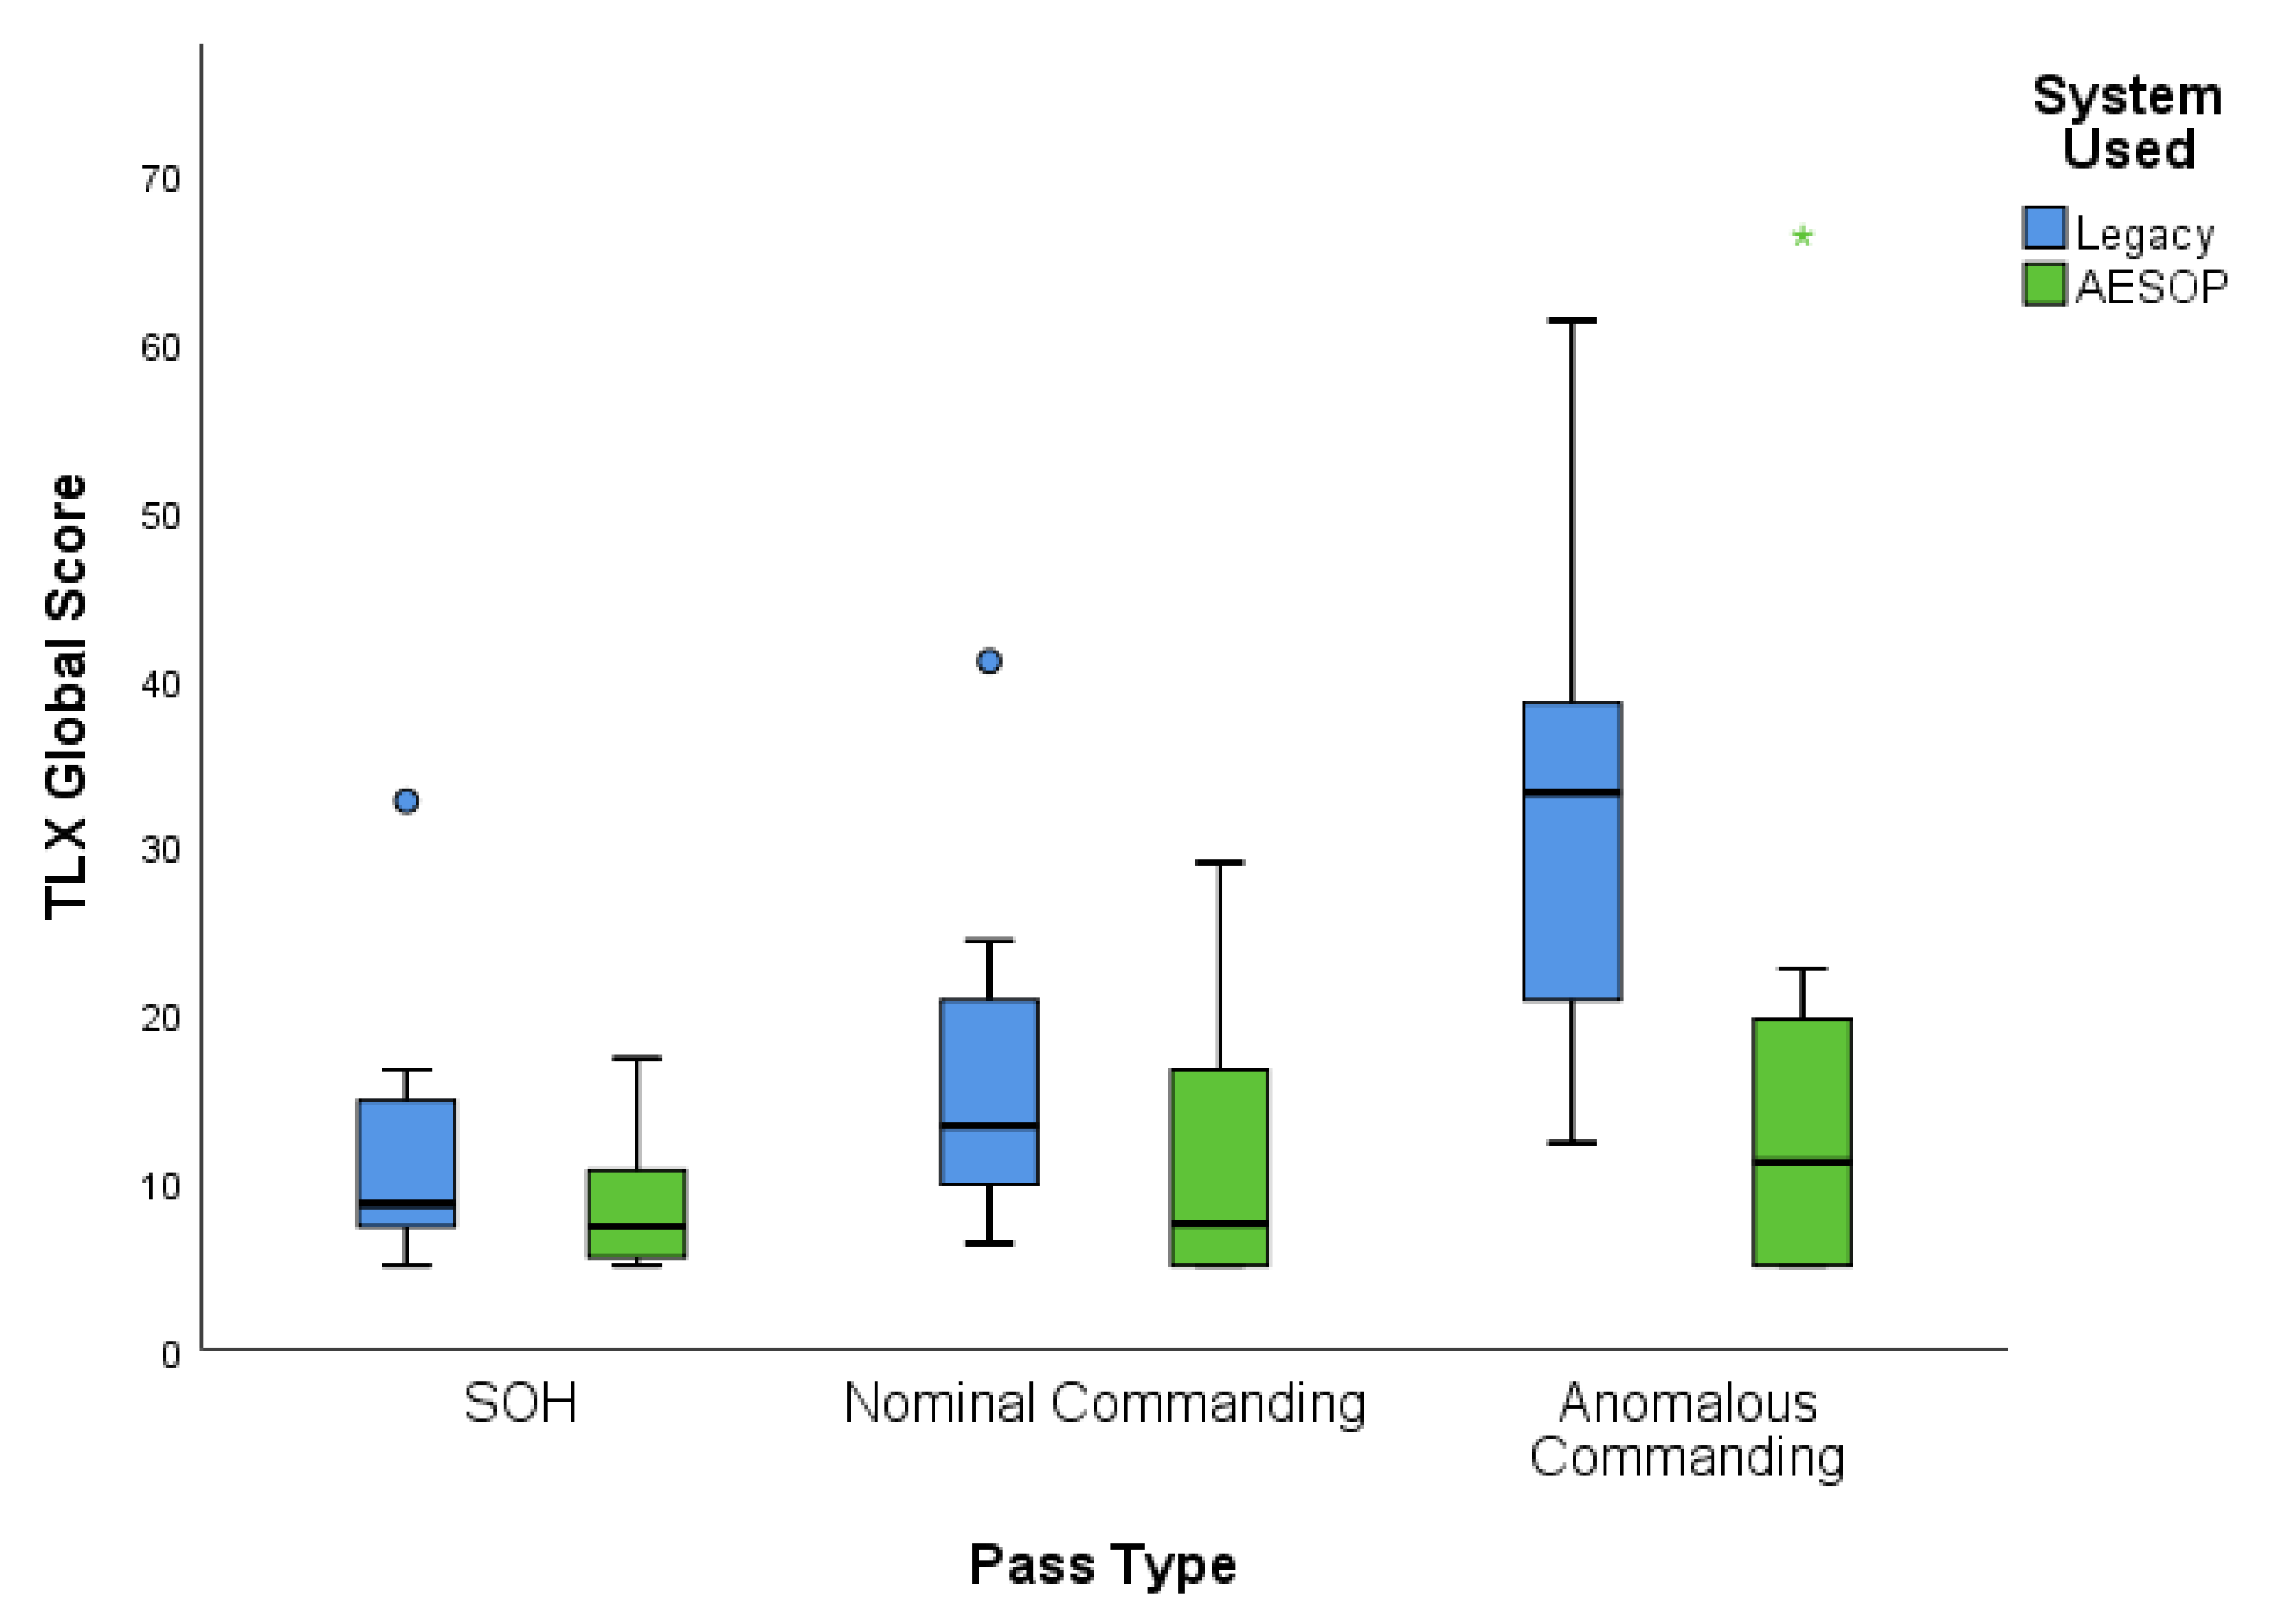
3.3. Workload Results
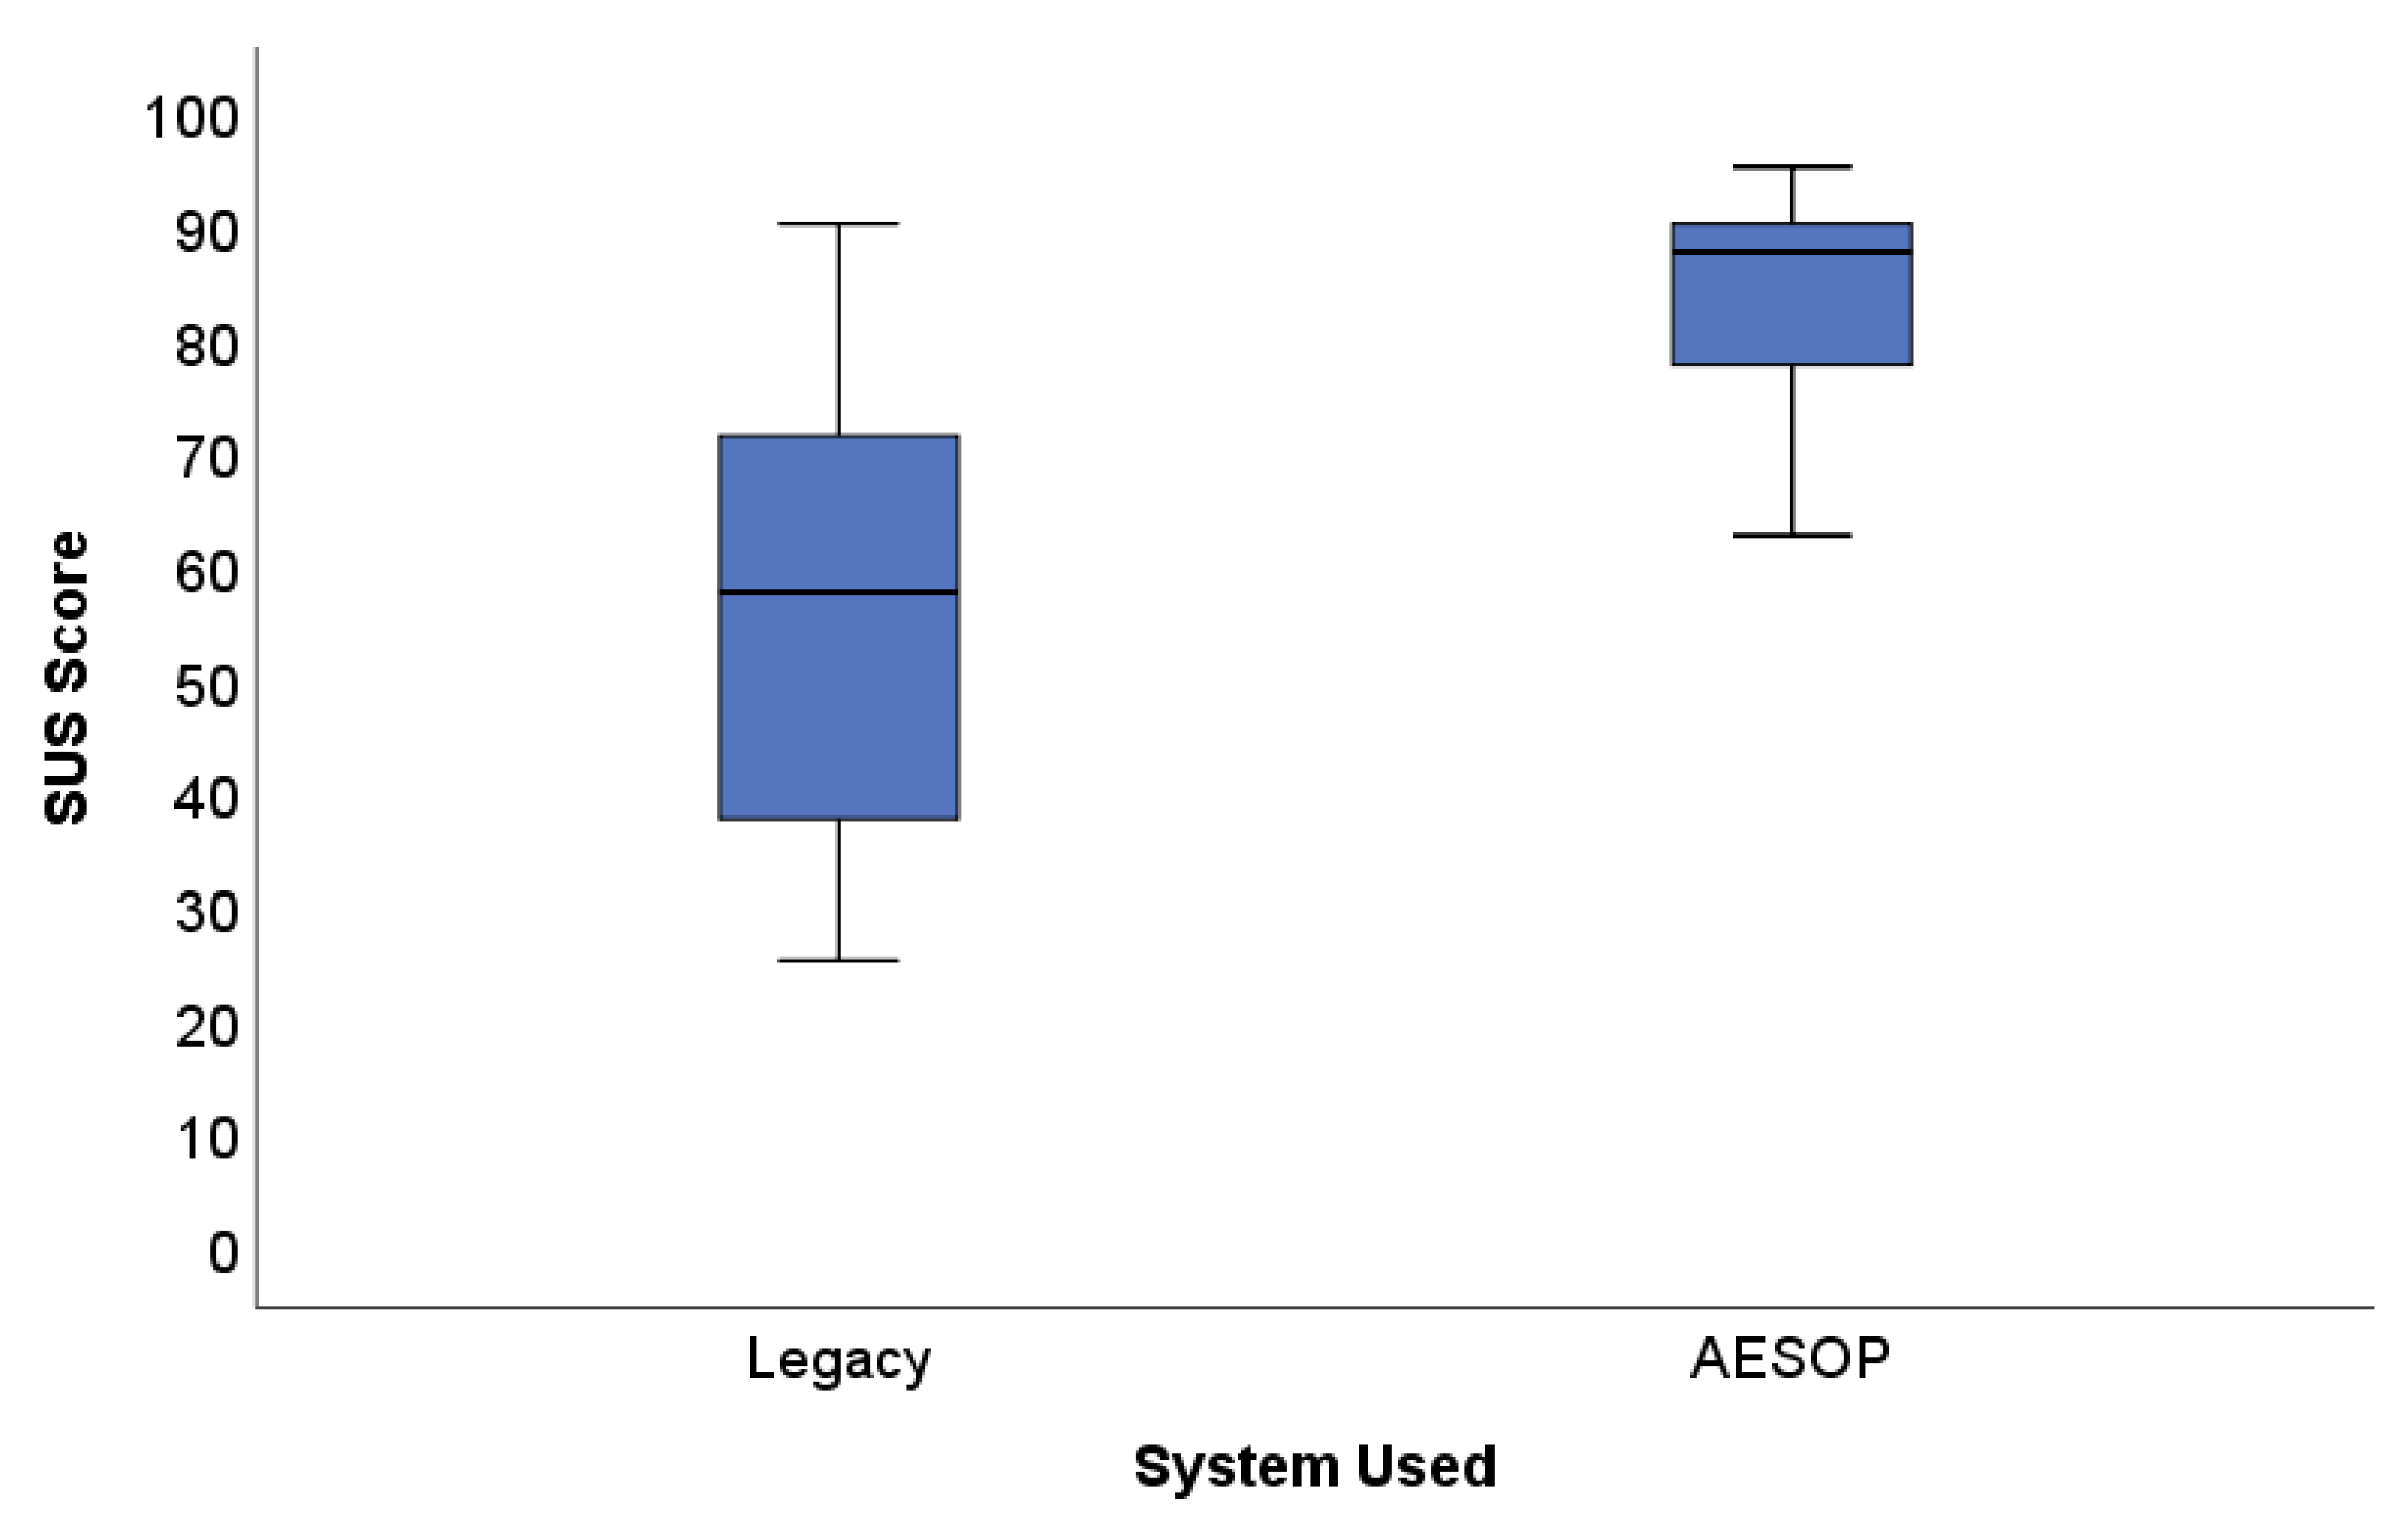
NASA-TLX Global Workload Scores were collected for all passes completed by participants (n = 72), which were split evenly among the three pass types (SOH, nominal commanding, and anomalous commanding). Generally speaking, workload increased with the difficulty of the pass types; however, the workload while using AESOP increased at a more modest rate, while workload with the legacy HMI increased considerably (Figure 5).
For SOH passes, operators were subjected to less workload with AESOP (M = 8.81, SD = 7.58) than they were with the legacy HMI (M = 11.81, SD = 7.58); however, that difference was not significant, F(1,22) = 1.43, p > 0.05, η2 = 0.06. For nominal commanding, operators experienced significantly less workload with AESOP (Mdn = 7.50) than they did with the legacy HMI (Mdn = 13.33), U (one-tailed) = 40.50, p < 0.05. For anomalous commanding, operators experienced significantly less workload with AESOP (Mdn = 11.07) than they did with the legacy HMI (Mdn = 33.17), U (one-tailed) = 21.50, p < 0.01. Additionally, the ‘Overall TLX’ (the mean TLX Global Score across all three passes, per participant) was used as a rough measure of general workload with each HMI. The overall TLX score with AESOP (M = 11.98, SD = 8.48) was significantly lower than the overall TLX score with the legacy HMI (M = 20.17, SD = 8.33), F(1,22) = 5.69, p < 0.01, η2 = 0.21. That is, operators experienced significantly less workload when using AESOP than the legacy HMI at both a higher overall level, and at a more specific level regarding nominal and anomalous commanding, more specifically. Table 4 provides an overview of descriptive statistics and means testing for workload across both HMIs on each pass type.
One aforementioned goal of this effort was to increase transferability, or the ability for operators who have never flown a particular system to rapidly become proficient with it via a standard and more intuitive HMI. In the context of this study, we would like to assess whether operators who have never flown the test system before finding it easier to fly the test system with AESOP or with the legacy HMI.
We filtered workload results to only include those participants who had never flown the test system before (hereafter referred to as “novice operators”), which was half of the entire sample (n = 6). Table 5 provides an overview of results, which shows that there was no significant difference in participant workload across HMIs for SOH commanding, F(2,10) = 1.32, p > 0.05, η2 = 0.28. Although there was no difference in workload for these novice operators on the SOH passes, there was a significant difference for the nominal commanding passes, F(2,10) = 6.93, p < 0.05, η2 = 0.41; the anomalous commanding passes, F(2,10) = 7.80, p < 0.05, η2 = 0.44; and the overall workload across all passes, F(2,10) = 7.53, p < 0.05, η2 = 0.43.

3.4. Usability

A total of 24 SUS scores were generated from the 12 participants (each participant rated each HMI). AESOP (M = 83.54, SD = 10.41), was rated as significantly more usable than the legacy HMI (M = 56.02, SD = 22.40), F(1,22) = 14.87, p < 0.01, η2 = 0.40. One can readily see the difference in SUS scores in Figure 6. Only one participant rated the legacy HMI as more usable than AESOP. During the exit interview the participant stated that they only rated the legacy HMI as more usable because they had years of experience with it and therefore currently felt more comfortable with it.
Additionally, other scales can be used to interpret SUS scores. Using a sample of approximately 3500 SUS questionnaires over 273 studies, Bangor, Kortum, and Miller [39] validated an additional adjective scale to the original SUS tool. The adjective scale had participants rate the interface as either “worst imaginable, poor, ok, good, excellent,” or “best imaginable.” These adjective rating scales have been used to translate the raw SUS scores into a more “plain language” analysis, which is reported for both HMIs in Table 6. One can readily see that AESOP is placed in a higher category than the legacy HMI in each of the rating scales provided to interpret SUS scores.

4. Discussion

We described how the application of UCD was conducted, and demonstrated the benefits of doing so. As a result, we were able to design a SATC2 HMI that performed better, and more consistently, than a legacy HMI. User testing showed that through UCD, we can overcome monumental challenges and develop an enterprise-wide HMI that can decrease stovepipes and greatly reduce retraining operators as they move to new squadrons or missions. We have provided a UCD framework that others can apply, and believe that this case study serves as empirical support for involving users early and often in systems development. In the following sections, we discuss some key takeaways and limitations to this study.

5. Conclusions

As suggested by the GAO, there is considerable merit to applying UCD for the development of space systems [6]. The ability to enhance SA and human–machine teaming will only become more important as space becomes a more contested environment [40]. The following is a list of key findings regarding the impact of employing UCD for the development of aerospace systems. While reviewing these key findings, one should consider that they are within the context of all participants having at least 18 months of operational experience (plus months of formal schoolhouse training) on the legacy HMI, while having zero operational experience and less than 90 min of training with AESOP:
  • Of the 72 test contact supports conducted during user testing, the only two failed supports were anomalous commanding passes (highest difficulty) with the legacy HMI. All passes conducted with AESOP, regardless of participant experiences, were successful;
  • Participants were able to detect, diagnose, and resolve anomalies in a significantly lower time with AESOP than with the legacy HMI. On average, anomaly resolution times were 64% shorter with AESOP than they were with the legacy HMI;
  • On average, participants experienced less workload with AESOP than they did with the legacy HMI. Although SOH passes showed a negligible difference, the difference was statistically significant for nominal commanding, anomalous commanding, and overall workload (the mean workload of all three pass types);
  • AESOP is more transferable to new operators than the legacy HMI. Participants with zero experience with the test system experienced significantly less workload with AESOP than they did with the legacy HMI on nominal commanding, anomalous commanding, and overall workload (the mean workload of all three pass types);
  • Participants rated AESOP as being significantly more usable than the legacy HMI, rating it approximately 30 points higher than the legacy HMI on average (on a 100-point scale).

Limitations and Future Work

Although user testing generated several key insights and generated empirical evidence for UCD in the development of aerospace systems, there were some limitations that should be acknowledged. We discuss these limitations here:
  • Because task flows with AESOP were fundamentally different from those with the legacy HMI, it was infeasible to design and implement the software to track task completion times for all tasks in such a manner that they could be validly compared. In future work we will aim to capture task completion times for more than just anomaly resolution, enabling more detailed assessment of how workload is being reduced.
  • There was a ceiling effect in the task success measures due to the test scenarios being too simple. This ceiling effect resulted in decreased diagnosticity of performance and subjective workload measures. In future studies we will create a more difficult set of scenarios such as multiple concurrent contacts, which could de-clutter several of the measures used in this test event and provide a more valid “stress test” of the HMIs.
  • While we were able to assess transferability by studying novice operators, we could do more to explicitly address this phenomenology. In future work we will seek to test operators on a different satellite system (not just a new HMI) to assess the degree to which AESOP supports transferability across systems.

Author Contributions

Conceptualization, S.L.D., R.P.C., L.R.M. and B.R.A.; methodology, S.L.D. and L.R.M.; software, R.P.C.; validation, S.L.D.; formal analysis, S.L.D. and L.R.M.; investigation, S.L.D., L.R.M., R.P.C. and B.R.A.; resources, S.L.D. and R.P.C.; data curation, R.P.C., S.L.D. and L.R.M.; writing—original draft preparation, S.L.D. and L.R.M.; writing—L.R.M. and S.L.D.; visualization, S.L.D. and L.R.M.; supervision, R.P.C., S.L.D. and L.R.M.; project administration, R.P.C., S.L.D. and L.R.M.; funding acquisition, S.L.D., R.P.C. and B.R.A. All authors have read and agreed to the published version of the manuscript.

Funding

This material is based upon work by the Air Force Research Laboratory under Contract No. FA9453-18-C-0204. Any opinions, findings, conclusions or recommendations expressed in this material are those of the authors and do not necessarily reflect the views of the Air Force Research Laboratory, the Air Force, or the Department of Defense. Approved for Public Release. Case #: AFRL-2021-2687.

Institutional Review Board Statement

Not applicable.

Informed Consent Statement

Not applicable.

Data Availability Statement

The data are not publicly available due to operational security concerns.

Conflicts of Interest

The authors declare no conflict of interest. The funders had no role in the design of the study; in the collection, analyses, or interpretation of data; in the writing of the manuscript, or in the decision to publish the results.

Abbreviations

AESOPAdaptable Environment for Space Operations
ANOVAAnalysis of Variance
CTACognitive Task Analysis
DODDepartment of Defense
DTDesign Thinking
EGSEnterprise Ground Services
FANOVA Test Statistic
HFEHuman Factors Engineering
HMIHuman–Machine Interface
KEKnowledge Elicitation
K-SKolmogorov–Smirnov Test
MMean
MdnMedian
MSVPMission-Specific Vendor Plugin
MTTLMaster Training Task List
NASA-TLXNational Aeronautics and Space Administration Task Load Index
SASituation Awareness
SAGATSituation Awareness Global Assessment Test
SATC2Satellite Command and Control
SDStandard Deviation
SOHState of Health
SSTStandard Space Trainer
SUSSystem Usability Scale
TIDETargeted Ideation Development Event
TDFATop-Down Functional Analysis
TOTechnical Order
UMann–Whitney Test Statistic
UCDUser-Centered Design
USAFUnited States Air Force

References

  1. Henry, C. DOD Prepares for Overhaul of Military Ground Systems. Satellite Today; 2015. Available online: https://www.satellitetoday.com/government-military/2015/09/14/dod-prepares-for-overhaul-of-military-ground-systems/ (accessed on 5 October 2021).
  2. Kolodziejski, P.J.; Bille, M.; Quinonez, E. Enabling the Air Force space enterprise vision through small satellites and rapid acquisition. In Proceedings of the 2018 AIAA SPACE and Astronautics Forum and Exposition, Orlando, FL, USA, 17–19 September 2018. [Google Scholar]
  3. Tadjdeh, Y. Training the space force: How the military will prepare for future battles. Natl. Def. 2018, 103, 30–33. [Google Scholar]
  4. Straight, C.; Manship, A.; Rexach, C.; Abrecht, B.; Garlisi, C.; Rosario, M. User-Defined Operational Picture (UDOP): Development Vision [UNCLASSIFIED//DISTRIBUTION D]. 2017. [Google Scholar]
  5. Emerson, N. US Space Force to Train Space Professionals in Space Warfighting Disciplines. Available online: https://www.spaceforce.mil/News/Article/2198012/us-space-force-to-train-space-professionals-in-space-warfighting-disciplines/ (accessed on 5 October 2021).
  6. United States Government Accountability Office. DoD Space Acquisitions: Including Users Early and Often in Software Development Could Benefit Programs. 2019. Available online: https://www.gao.gov/assets/700/697617.pdf. (accessed on 14 October 2021).
  7. Vollmer, J.; Atkinson, M. The importance of flight operations involvement during the early phases of the systems development lifecycle for enterprise multi-mission ground system upgrades. In Proceedings of the 2018 SpaceOps Conference, Marseille, France, 28 May–1 June 2018. [Google Scholar]
  8. Narva, M.A.; Muckler, F.A. Visual surveillance and reconnaissance from space vehicles. Hum. Factors 1963, 5, 295–315. [Google Scholar] [CrossRef] [PubMed]
  9. Dorton, S.L.; Ganey, H.C.N.; Mintman, E.; Mittu, R.; Smith, M.A.B.; Winters, J. Human-centered alphabet soup: Approaches to systems development from related disciplines. In Proceedings of the 2021 HFES 65th International Annual Meeting, Baltimore, MD, USA, 4–7 October 2021. in press. [Google Scholar]
  10. Ballew, T.; Bartha, M.C.; Harper, C.; Holmes, D.; Kruithof, P.; Meingast, M. UX & HF: The state of the union. In Proceedings of the 2020 HFES 64th International Annual Meeting, Virtual, 5–9 October 2020; Volume 64, pp. 568–576. [Google Scholar] [CrossRef]
  11. Wogalter, M.S.; Hancock, P.A.; Dempsey, P.G. On the description and definition of human factors/ergonomics. In Proceedings of the Human Factors and Ergonomics Society Annual Meeting, Chicago, IL, USA; 1998; Volume 42, pp. 1807–1811. [Google Scholar] [CrossRef]
  12. Brown, T. Change by Design; Harper Business: New York, NY, USA, 2009. [Google Scholar]
  13. Liedtka, J. Evaluating the Impact of Design Thinking in Action; Darden Working Paper Series; University of Virginia: Charlottesville, VA, USA, 2018; pp. 1–48. [Google Scholar]
  14. Dorton, S.L.; Maryeski, L.R.; Ogren, L.; Dykens, I.D.; Main, A. A wargame-augmented knowledge elicitation method for the agile development of novel systems. Systems 2020, 8, 27. [Google Scholar] [CrossRef]
  15. Rott, J.; Weizler, J.; Rabl, A.; Sandl, P.; Wei, M.; Vogel-Heuser, B. Integrating hierarchical task analysis into model-based system design using Airbus XHTA and IBM Rational Rhapsody. In Proceedings of the IEEE International Conference on Industrial Engineering and Engineering Management, Bangkok, Thailand, 16–19 December 2018. [Google Scholar]
  16. Lercel, D.; Andrews, D.H. Cognitive task analysis of unmanned aircraft system pilots. Int. J. Aerosp. Psychol. 2021, 31, 319–342. [Google Scholar]
  17. Wei, L.; He, L.; Liu, Y. Study of artificial intelligence flight co-pilot speech recognition technology. In Proceedings of the 2020 IEEE 2nd ICCASIT, Weihai, China, 14–16 October 2020; pp. 681–685. [Google Scholar]
  18. Doran, H.D.; Reif, M.; Oehler, M.; Stohr, C. Conceptual design of human-drone communication in collaborative environments. In Proceedings of the 50th International Conference on DSN-W, Valencia, Spain, 29 June–2 July 2020; pp. 118–121. [Google Scholar]
  19. Blanchard, B.S.; Fabrycky, W.J. Systems Engineering and Analysis, 4th ed.; Prentice Hall: Hoboken, NJ, USA, 2006. [Google Scholar]
  20. Buede, D. The Engineering Design of Systems Models and Methods, 2nd ed.; John Wiley & Sons: Hoboken, NJ, USA, 2009. [Google Scholar]
  21. Lockett, J.F.; Powers, J. Human Factors Engineering Methods and Tools. In Handbook of Human Systems Integration; Booher, H.R., Ed.; John Wiley & Sons: Hoboken, NJ, USA, 2003. [Google Scholar]
  22. Vicente, K.L. Cognitive Work Analysis: Toward Safe, Productive, and Healthy Computer-Based Work; Lawrence Erlbaum Associates: Hillsdale, NJ, USA, 1999. [Google Scholar]
  23. Schraagen, J.M.; Chipman, S.F.; Shalin, V.L. Introduction to cognitive task analysis. In Cognitive Task Analysis; Shraagen, J.M., Chipman, S.F., Shalin, V.L., Eds.; Lawrence Erlbaum Associates: Mahwah, NJ, USA, 2000. [Google Scholar]
  24. Dorton, S.L.; Frommer, I.D.; Garrison, T.M. A theoretical model for assessing information validity from multiple observers. In Proceedings of the 2019 IEEE Conference on Cognitive and Computational Aspects of Situation Management (CogSIMA), Las Vegas, NV, USA, 8–11 April 2019; pp. 62–68. [Google Scholar] [CrossRef]
  25. Johnson, R.B. Examining the validity structure of qualitative research. Education 1997, 118, 282–292. [Google Scholar]
  26. Sonlaysts, Inc. Adaptable Environment for Space Operations (AESOP) R&D Highlight. 2020. Available online: https://www.youtube.com/watch?v=C4j2I13fKaY. (accessed on 14 October 2021).
  27. Dorton, S.; Thirey, M. Effective variety? For whom (or what)? In Proceedings of the 2017 IEEE Conference on Cognitive and Computational Aspects of Situation Management (CogSIMA), Savannah, GA, USA, 27–31 March 2017. [Google Scholar]
  28. Endsley, M.R. Toward a theory of situation awareness in dynamic systems. Hum. Factors J. HFES 1995, 37, 32–64. [Google Scholar] [CrossRef]
  29. Endsley, M.R.; Jones, D.G. Designing for Situation Awareness: An Approach to User-Centered Design, 2nd ed.; CRC Press: Boca Raton, FL, USA, 2016. [Google Scholar]
  30. Endsley, M.R. Direct measurement of situation awareness: Validity and use of SAGAT. In Situation Awareness Analysis and Measurement; Endlsey, M.R., Garland, D., Eds.; Lawrence Erlbaum: Mahwah, NJ, USA, 2000. [Google Scholar]
  31. Hart, S.; Staveland, L. Development of NASA-TLX (Task Load Index): Results of Empirical and Theoretical Research; Hancock, P., Meshkati, N., Eds.; Human Mental Workload; Elsevier: Amsterdam, The Netherlands, 1988; pp. 139–183. [Google Scholar]
  32. Grier, R.A. How high is high? A meta-analysis of NASA-TLX global workload scores. In Proceedings of the HFES 59th Human Factors and Ergonomics Society Annual Meeting, Los Angeles, CA, USA, 26–30 October 2015; pp. 1727–1731. [Google Scholar]
  33. Rubin, J.; Chisnell, D. Handbook of Usability Testing, 2nd ed.; Wiley: Indianapolis, IN, USA, 2008. [Google Scholar]
  34. Brooke, J. SUS: A “quick and dirty” usability scale. In Usability Evaluation in Industry; Jordan, P.W., Thomas, B., Werdmeester, B.A., McClelland, I.L., Eds.; Taylor & Francis: London, UK, 1996; pp. 189–194. [Google Scholar]
  35. Bangor, A.; Kortum, P.T.; Miller, J.T. An empirical evaluation of the system usability scale. J. Hum. Comput. Interact. 2008, 24, 574–594. [Google Scholar] [CrossRef]
  36. Lewis, J.R.; Sauro, J. The factor structure of the system usability scale. In Human Centered Design; Springer: Berlin/Heidelberg, Germany, 2009; pp. 94–103. [Google Scholar]
  37. Peterson, D.A.; Kozhokar, D. Peak-end effects for subjective mental workload ratings. In Proceedings of the Human Factors and Ergonomics Society 2017 Annual Meeting, Austin, TX, USA, 9–13 October 2017; pp. 2052–2056. [Google Scholar]
  38. Field, A. Discovering Statistics Using SPSS, 3rd ed.; Sage Publications: Los Angeles, CA, USA, 2009. [Google Scholar]
  39. Bangor, A.; Kortum, P.; Miller, J. Determining what individual SUS scores mean: Adding an adjective rating scale. J. Usability Stud. 2009, 4, 114–123. [Google Scholar]
  40. Bell, B.M.; Rogers, E.T. Space resilience and the contested, degraded, and operationally limited environment: The gaps in tactical space operations. Air Space Power J. Nov.-Dec. 2014, 28, 130–147. [Google Scholar]
Figure 1. Iterative UCD Framework.
Aerospace 08 00303 g001
Figure 2. Example Framework of a Generic TIDE.
Aerospace 08 00303 g002
Figure 3. Text Procedure for Participants.
Aerospace 08 00303 g003
Figure 4. Anomaly Diagnosis Time in Both HMIs.
Aerospace 08 00303 g004
Figure 5. Workload Level for both HMIs across Pass Types. Outliers are shown as dots (when in excess of two SDs) or as an asterisk (when in excess of three SDs).
Aerospace 08 00303 g005
Figure 6. Boxplot of SUS Score Distributions for both HMIs.
Aerospace 08 00303 g006
Table 1. Methods Employed in the UCD Framework.
MethodOutcomes
Top-Down Functional Analysis (TDFA) and Cognitive Task Analysis (CTA)
  • Core system functionalities
  • High-drivers of user workload
  • User archetypes/personas
Rapid Prototyping (Wireframes, etc.)
  • HMI designs
Knowledge Elicitation (KE) Interviews
  • Problems faced by users
  • User workflows
  • User requirements and design seeds
Targeted Ideation Development Event (TIDE)
  • Novel concepts
  • Novel workflows
  • User requirements and design seeds
Focus Groups
  • Feedback on HMI designs
  • User requirements
Table 2. Demographic Characteristics of User Testing Participants.
DemographicM1 (SD)MinMax
Total SATC2 Experience (Months)32.75 (17.33)1266
Total Test System Experience (Months) 219.00 (10.71)430
Number of HMIs Used1.25 (0.62)13
1M = mean, SD = standard deviation. 2 For participants with test system experience only (n = 6). Across all 12 participants the mean test system experience level was 9.50 months (SD = 12.27).
Table 3. Number of Successful Supports with Each HMI.
# of Successful Supports 1 (%)
Pass TypeLegacyAESOP
SOH12 (100%)12 (100)
Nominal Commanding12 (100%)12 (100)
Anomalous Commanding10 (83%)12 (100)
1 The maximum number of successful supports possible was 12 (i.e., the entire sample size).
Table 4. Descriptive Statistics and Means Testing for Workload on All HMIs and Pass Types.
LegacyAESOPDifference 1
Pass TypeM (SD)MdnM (SD)MdnStatValuep
SOH11.81 (7.58)8.678.81 (4.28)7.34F1.430.25
Nominal16.44 (9.65)13.3311.03 (7.99)7.50U40.500.03
Anomalous32.25 (13.79)33.1716.05 (17.11)11.17U21.500.00
Overall TLX20.17 (8.33)17.6111.98 (8.48)9.00F5.690.01
1 Significant results are shown in bold. All tests are one-tailed.
Table 5. Comparison of Workload across HMIs for Novice Operators.
Mean (SD)ANOVA (One-Way) 1
MeasureLegacyAESOPF(2,10)pη2
SOH Workload11.56 (10.46)6.61 (1.42)1.320.280.12
Nominal Workload19.50 (11.97)6.50 (1.76)6.930.030.41
Anomalous Workload31.94 (17.79)10.33 (6.56)7.800.020.44
Overall Workload21.00 (11.45)7.82 (2.72)7.530.020.43
1 Significant results are highlighted in bold.
Table 6. SUS Numerical and Adjective Rating Scales for Both HMIs.
Numerical SUS RatingAdjective SUS Ratings
HMIMMdnSDMinMaxAcceptabilityGradeAdjective
Legacy56.0257.5022.4025.0090.00Marginal (Low)FOK
AESOP83.5487.5010.4162.5095.00AcceptableBExcellent
Publisher’s Note: MDPI stays neutral with regard to jurisdictional claims in published maps and institutional affiliations.

