1. Introduction
Different airports in Europe and around the world are working under the Airport Collaborative Decision Making (A-CDM or CDM) principles due to its benefits; this aims to improve operational
efficiency,
predictability and
punctuality to the Air Traffic Management (ATM) network and airport stakeholders’ operations by working under an ATM network [
1]. A-CDM aims to improve network operations through quality and timely information exchange, procedural improvements, collaborative decision support tools, and common situational awareness. A-CDM is based on a change of mind-set and working process involving the main stakeholders of an airport. It is an approach that allows airlines, airport operators (AO), ground handlers (GH), air-traffic control (ATC) and other stakeholders to exchange operational information and work together to manage airport operations by optimizing the use of resources and improving
predictability of key events of the flight [
2].
A-CDM brings significant benefits to all partners establishing the mechanisms to improve the quality of information on which decisions are made which lead to enhanced operational efficiency and facilitate optimum use of available capacity [
1]. It is not hard to see that different partners will have different views on what are their success factors and needs, nevertheless, there are some success factors of A-CDM, regardless the airport or the partner specific interest:
- ▪
Develop common situational awareness by sharing accurate and on-time information;
- ▪
Develop standardized vocabulary, definitions and processes;
- ▪
Use one shared airport information platform feed by standardized data of operations;
- ▪
Develop tools and procedures for normal and non-normal operations that are acceptable to all partners.
To achieve these goals, it is necessary to define clear and achievable objectives and follow and manage the course of their results, i.e., to monitoring and manage the performance on certain key areas such as predictability. Therefore, this work aims to provide an understandable and practical approach to monitoring capacity as one of the main strategic objectives set collaborative by the airport partners. This framework is in line with the A-CDM principles and Total Airport Management (TAM) principles ones. CDM provides the foundation to build an airport’s operational communication protocol to show the performance of operations to the partners; it enables the use of data across the entire airspace, airport’s airside and landside operations, both in real-time operations but also as post analysis tool for reviewing performance of operations and a tool for proposing or follow controlling actions. The possibilities for gains on performance knowledge by analyzing these data information, not just at the airport but across aviation partners is crucial.
In addition, this work presents a brief review on performance metrics and indicators for capacity which are the baseline for the selection of the key performance indicators (KPIs) to monitor capacity on pre-tactical phase both at macro and micro level using six main reference points on the landing and take-off cycle (LTOC). The six reference points use the milestone approach and its associated data sets as input parameters for traffic movements, both the actual and the forecasted or estimated demand.
To illustrate our approach, Amsterdam Airport Schiphol (ICAO code EHAM) is used as case study. It is the main airport of the Netherlands and the 3rd busiest airport in Europe moving on 2017 about 68.5 million passengers. The CDM program at Schiphol (CDM@SPL) has been an initiative between the airport, the Dutch Air Navigation Service Provider (LVNL), their operating airlines and ground handlers, see [
3]. CDM@SPL has been implemented in two phases. In the first phase, Schiphol started local operations according to the CDM method, basing its operational decisions on shared information concerning the flight and aircraft handling process that it receives from the airport, air traffic control, airlines and ground handling. In the second phase, Schiphol started to share its operational information with Eurocontrol in real time, being the 28th full A-CDM airport connected to the network manger’s system aiming to ensure more efficiently scheduled time slots for flights to and from Schiphol, which will in turn promote more efficient management of the Dutch and European airspace.
The organization of this work is as follows,
Section 2 introduces background information about capacity and the performance indicators to address it.
Section 3 address briefly the CDM concept elements as part of the background of the problem, together with the milestone approach address in
Section 3.
Section 4 presents describes the indicator about accuracy of declared capacity, providing deeper information about the case study of CDM program at Schiphol, explaining the generalities of the operations on the different phases of the flights; meanwhile,
Section 5 describes the proposed approach for analyzing with more detail the accuracy of operations by analyzing diverse time reference and events on the Milestone approach. Finally, conclusions and further research is presented.
2. The Basics about Capacity and Its Performance
Performance measurement and management helps organizations all around the world, whether they are multinationals, government departments, or small local charities to recognize the organization’s performance by measuring the key success factors according to the strategic objectives. In the last two decades,
performance has been one of the major keywords for aviation as well as for many organizations.
Performance-based management (PBM) places attention on results, responsibilities, and targets;
performance indicators (PI)s are used by managers to allocate assets or to establish which strategy to implement to achieve the desired goals, these indicators can also be used as communication protocol to show the performance of operations to the outside world. PBM integrates existing financial, operations and other data into eye-opening and actionable facts for enlightened decisions. It is able to consistently track cost and performance over time and improve predictability. In [
4], PBM is defined as a systematic approach to performance improvement through an ongoing process of
establishing strategic performance objectives; measuring performance; collecting, analyzing, reviewing, and reporting performance data; and using that data to drive improvement.
Similar to PBM, other proposals can be found in the performance management area, such as the
performance measurement systems which are responsible for coordinating indicators across the various functions, and for aligning the indicators from the strategic (top management) to the operational levels. For every activity/product/function, multiple indicators can be developed and implemented. The challenge is to design a structure for the indicators (i.e., grouping them together) and extracting an overall sense of performance from them [
5]. A helpful review of performance measurement systems can be found in [
6] where it is presented different PMSs which have been developed to be used in companies.
Regarding the ICAO, the concept of performance management system [
7,
8] is to provide managers with real-time information on the degree of fulfilment of the set objectives, and hence with reliable support in decision-making process; this system includes three basic functions:
performance measurement, performance monitoring and
performance review. This applies to the ATM system which has to meet strict performance criteria, particularly in the area of safety. The main advantages of PBA are the orientation to results and meeting customer expectations; promotion of greater accountability among managers; the adoption of business strategies becomes much more transparent, because the goals to be achieved are clearly defined and quantified. Other benefits which are worthy to mention are the greater freedom and flexibility in the choice of solutions, leading to greater cost-efficiency; better allocation of resources; and better predictability.
Although there are some variations of this process, they are all based on a similar philosophy and principles [
7,
8]. Step 1—Define/review scope, context and general ambitions and expectations; Step 2—Identify opportunities, issues and set (new) objectives to decide which specific performance aspects are essential for meeting the general expectations; Step 3—Quantify objectives to ensure that the set objectives are specific, measurable, achievable, relevant and time-bound (SMART); Step 4—Select solutions to exploit opportunities and resolve issues, this step can be divided into three sub-steps: selection of the decisive factors to reach the target performance, identification of solutions to exploit opportunities and mitigate the effects of the selected drivers and blocking factors and selection of sufficient set of solutions; Step 5—Implement solutions and Step 6—Assess achievement of objectives.
The total airport management (TAM) principles enabling airport partners to maintain a joint plan—the airport operations plan—thus working towards dynamically agreed goals in order to get full CDM benefits. This implies the extension of the tactical time horizon to pre-tactical and strategic phases. The scope of TAM is the entire airport, monitoring and guiding airside and landside operations while taking into account additional information available [
9,
10]. TAM is a performance-based airport operations approach enabling performance-based air traffic management; it is aligned with existing concepts and systems but integrates them into one holistic architecture, and it provides a platform whereby operational decisions taken by partners may be made in the full knowledge of the other partners in key moments.
Along these lines, the work presents by [
11,
12], introduces an advanced approach of performance-based airport management (PBAM), developed by combining the existing concepts of TAM and performance-based management. The Performance-Based Airport Management is introduced to close the gap between performance target and day-to-day operations. The general idea behind is a collaborative coordination and control of airport operations based on defined performance targets. In this work, CDM and Total Airport Management principles are included. PBAM is achieved by five steps: (1)
identifying long-term Targets, per partner and on system bases on a collaborative manner, (2)
identification of the key performance indicators (KPIs) and metrics, (3)
continuous measurement monitoring and prediction of operations, (4)
Aggregated KPI results from the lower levels provide the basis for the KPI value determination of the higher level. (5)
Actions needed after evaluating the performance from project team, senior management, external project facilitators, and team coordinators whose role it is to help the strategy to success
Therefore, in this work it is proposed to use the PBM incorporating PBAM and TAM principles to define a systematic approach to monitor the performance through the following steps:
Identifying strategic performance objectives and long-termtargets in line with the European, regional and local principles;
Measuring performance of operations, by the identification of the proper roadmap and goals to achieve strategic objectives and targets;
Identifying Timeframe, KPIsand Metrics suitable to represent and regulate a specific process function and goal;
Define set of actions needed after evaluating the performance as a management tool to encourage timely action in the right direction;
Continuously monitoring and managing of performance using that data to drive improvement.
Performance indicators (PIs) provide a means of “distilling” the larger volume of data collected and can be used both to judge outcome performance and to predict future performance, KPIs are current- or future-oriented measures; they should be monitored 24/7, daily, or perhaps weekly for some, mainly because they are key to the business. The terminology used in this context is not completely and univocally defined, hence, special attention is placed on the terminology proposed by the TAM and CDM principles. Often, similar concepts are classified using different terms, depending on the technical area of interest, hence, in this work, some definitions are stated.
It is possible that one of the most difficult activities in PBM is making systems “tangible” by means of their performances indicator. Process managers try to do this, translating organization goals into different metrics (indicators), which are also visible from the outside. Hence, a specific literature review was conducted to identify the proposed KPIs and metrics regarding Capacity.
According to ICAO [
7,
8,
13],
Capacity can be measured either
system-wide, airspace and/or
airport.
On
system-wide or
network bases, measuring capacity can be performed by monitoring diverse KPIs such as the number of flights, flight hours and flight distance that can be accommodated on certain period of time; or by the number of flights, available plane miles, etc. For the
airspace, the identified capacity KPIs are the number of IFR flights able to enter an airspace volume, or by the number of IFR flights able to be present in sectors at any one time (airspace capacity rates). It has been highlighted that it is key to monitor the ability to objectively determine the number of flights able to enter an airspace volume. Finally, the
airport KPIs mentioned are by ICAO are the hourly number of IFR movements (departures plus arrivals) as possible during low visibility conditions, daily number of IFR movements (departures plus arrivals) as possible during a 15-h day between 7:00 and 22:00 local time during low visibility conditions [
13,
14].
The KPIs defined by the Single European Sky ATM Research (SESAR) 2020 Performance Framework, regarding capacity are divided into three areas of performance:
Airspace Capacity, Airport Capacity and
Capacity Resilience [
14].
Airspace Capacity’s KPIs proposed are two: Terminal Maneuvering Area (
TMA) throughput in challenging airspace, per unit time and
En-route throughput in challenging airspace, per unit time
. Airport Capacity is mainly measure by the
Peak Runway Throughput (Mixed mode). The
Capacity Resilience has two main KPIs,
loss of airport capacity avoided, and
loss of airspace capacity avoided (represented on percentage). In [
12], it can be found a very interesting review of the current KPIs and PIs used by different partners and agencies; several Key Performance Areas are covered and their specific KPIs and PIs used in Europe are described.
The Civil Air Navigation Services Organization published 21 operational KPIs that allow Air Navigation Service Providers (ANSPs) to track targeted areas of their systems, regarding ATM
Capacity, three main KPIs are suggested: the
Declared Capacity defined as the target acceptance rate for a facility or sector; the
Capacity Efficiency represented by the percentage of demand accommodated by facility’s capacity and actual demand; and the
Delay Attributed to Capacity Limits or Total or Average Delay by Airport [
14,
15].
To successfully capture a trade-off between partners objectives the identification of airport performance objectives and stakeholder drivers or incentives over the course of the flights’ LTOC is required. Therefore, and due to its nature, CDM proposes both
system/network and partners’ common objectives and performance metrics between all A-CDM stakeholders, based on mutually agreed targets. Under the CDM principles the four main objectives are
Efficiency, Capacity, Safety and,
Environment [
1]. A wide variety of information about the CDM concept, benefits, implementation, management and more can be found on the CDM at Eurocontrol, the Civil Air Navigation Services Organisation (CANSO) [
16] and the ICAO website [
9].
The Airport Capacity Assessment Methodology guidance material, [
17] proposes metrics, its main pros and cons, and measures regarding
Airside Capacity, together with the interfaces between the runway and TMA where the approach flows of aircraft elapses with other activities on the ground such as those in the gates and stands. In this manual, some interdependencies between the
Airspace Capacity and
Landside Capacity are mentioned particularly for those areas that overlap between the domains. Three main types of capacity are identified: the
Structural Capacity which provides input to early Air Traffic Flow and Capacity Management (ATFCM) processes and its time frame starts years before day of operations and until some months; depending on the business model and size of an airport this can range every 2 to 5 years to an annual basis. This capacity provides the airport management with its first input for both business case decision making and to identify the requirements for further detailed planned capacity analysis. The
Planned Capacity is used by all airports for coordination on airline’s schedule (with or without the worldwide slot guidelines process) and also as input to the strategic flow management processes with the Network Manager. It is calculated at least 18 months prior to the season (summer and winter) for coordinated airports and closer to the season as identified by the local stakeholders for the other group of airports. And the
Operational Capacity which is used as part of the Network Strategic, Pre-Tactical and Tactical processes up to the day of operations. Furthermore, for addressing the influencing factors and assumptions, more detail types of capacity are mentioned: the
Runway Operations Capacity, Taxi Operations Capacity, and the
Apron/Gate Operations Capacity. Hence, the
Structural Capacity, Planned Capacity and
Operational Capacity mainly are mainly used to indicate that each airport element (i.e., runway, taxi system, aprons and gates) has different input parameters depending on the timeframe, the closes to the day of operations, the more detail input on different parameter is required for planning purposes.
It can be concluded that numerous approaches in the literature frequently estimate capacity as the maximum number of aircraft an Air Traffic Control (ATC) unit can handle at a given time, referring to airspace capacity. This work does not aim to provide an extensive overview of those definitions but rather point out the complex nature of capacity, its drivers and characteristics. Capacity is dynamic and interactively influenced by many factors or drivers. In addition, the selection of KPIs should consider not only technical drivers, but other important ones, such as the social factors and the business model of airlines and airports among other stakeholders.
3. The Airport Collaborative Decision Making (A-CDM) Principles
The CDM principles are performing successfully collaborative processes including standardized communication protocols, procedures, tools, and information sharing to move operations into a collaborative management process that improves overall system performance and benefits the individual stakeholders. To accomplish the above-mentioned goals, a solid base on transparency and information sharing is needed to the establishment of collaborative working methods and practices which will be used for monitoring purposes. The A-CDM proposes five basic elements, specially the
Information Sharing and
the Milestone Approach, as a key to improve
efficiency and predictability. Information Sharing is implemented using a shared airport information platform among partners. Once in place the information sharing mechanism, the Milestone Approach can take place helping an early and accurate prediction for ATC, AO, and GH operations and hence, to anticipate resources needed to cope with the situation. For this, specific milestone events are monitored, and trigger alerts to prompt awareness if a problem occurs, helping partners on the decision-making process for downstream events which influence the further progress of the flight [
1,
18].
The milestones represent significant events that occur during the LTOC that occur during the planning or operation of a flight. The milestone approach is based on 16 general processes that describe the progress of a flight on three main phases called, inbound, turn round normally called (
turnaround) and outbound. Monitoring these milestones both in a strategic, pre-tactical and tactical level, allows partners to anticipate problems quickly when there is any deviation from the plan. In pre-tactical level, monitoring the performance of certain indicators help to develop tools and procedures that are acceptable to all partners on how to act on normal and disruptive situations to achieve strategic objectives. The following information is mainly taken from [
1,
2,
16,
18].
3.1. CDM Concept Elements
To begin with, the element that triggers the cycle of the Airport CDM concept elements is
Information Sharing. CDM is successful when all airport partners (airport operators, aircraft operators, ground handlers, Air Traffic Control and Network Manager Operations Center (NMOC)) are transparent and share their available information accurately and on time. Information sharing is essential for the other elements and must be implemented first; it is the key to creating a common awareness of each individual flight and the overall situation at the airport. Once the information is available for all stakeholders, the cycle of the CDM concept elements can be implemented, as it can be seen in
Figure 1:
the milestone approach, variable taxi time, (collaborative) pre-departure sequence, CDM in adverse conditions and
collaborative management of flight updates.
The milestone approach is recommended to be implemented as a baseline on new processes and procedures where collaboration between people of all partners is the central concept. Due to its importance, further description will be provided in this work. The second element of the cycle is about the variable taxi time (VTT) which helps to gain more accurate estimates of in/off-blocks and take-off operations. With VTT in place, the link between off-block time and take off time becomes transparent to all partiers and network operations, and a proper prediction of the take-off time can be communicated towards the network function represented by network operations.
The third element is about building a (collaborative) pre-departure sequence; its aim is to regulate the order for departing aircraft based on the off-block time and considers operational constraints and preferences of the operators. With the Pre-Departure Sequence Planning, the order in which a flight may push-back or start the engines is regulated with the expected start-up approval time issue by ATC. The given start-up approval time is based on the CDM principle of “best planned, best served” which overrules the “first come, first served” principle which was more common before CDM was implemented. The benefits of Pre-Departure Sequence Planning are to increase the punctuality and improves the slot-adherence while considering the preferences of the airport partners.
The fourth element is about CDM in adverse conditions which are defined as “Adverse conditions consist of collaborative management of the capacity of an airport during periods of predicted or unpredicted reduction of capacity”. To make collaborative decisions during adverse conditions, an CDM cell is introduced. In adverse conditions, the goal is to create a common situational awareness for each of the airport partners, better information could be shared as all communication lines are short. With better information, passengers could be informed correctly, and the disruption could be better anticipated and, therefore, better planning of resources.
The fifth element is about the collaborative management of flight updates which helps to have better quality of information regarding arrival and departure information. The information is exchanged by the network operations, with all CDM airports to have a better predictability for airspace capacity, and hence, to plan required resources in an efficient way. One feature element is the execution of the ground delay program, this is performed by the network manager and issue through a departure time stamp calculated by the appropriate central management unit, as a result of tactical slot allocation, at which a flight is expected to become airborne.
3.2. The Milestone Approach
The Milestone Approach can be divided into three main phases (see
Figure 2) which are:
- -
“Inbound or arrival”, including the milestones: M1 until M6;
- -
the second phase is called “Turn round” and it includes M7 until M14; and
- -
the “Outbound” phase, including M15 and M16.
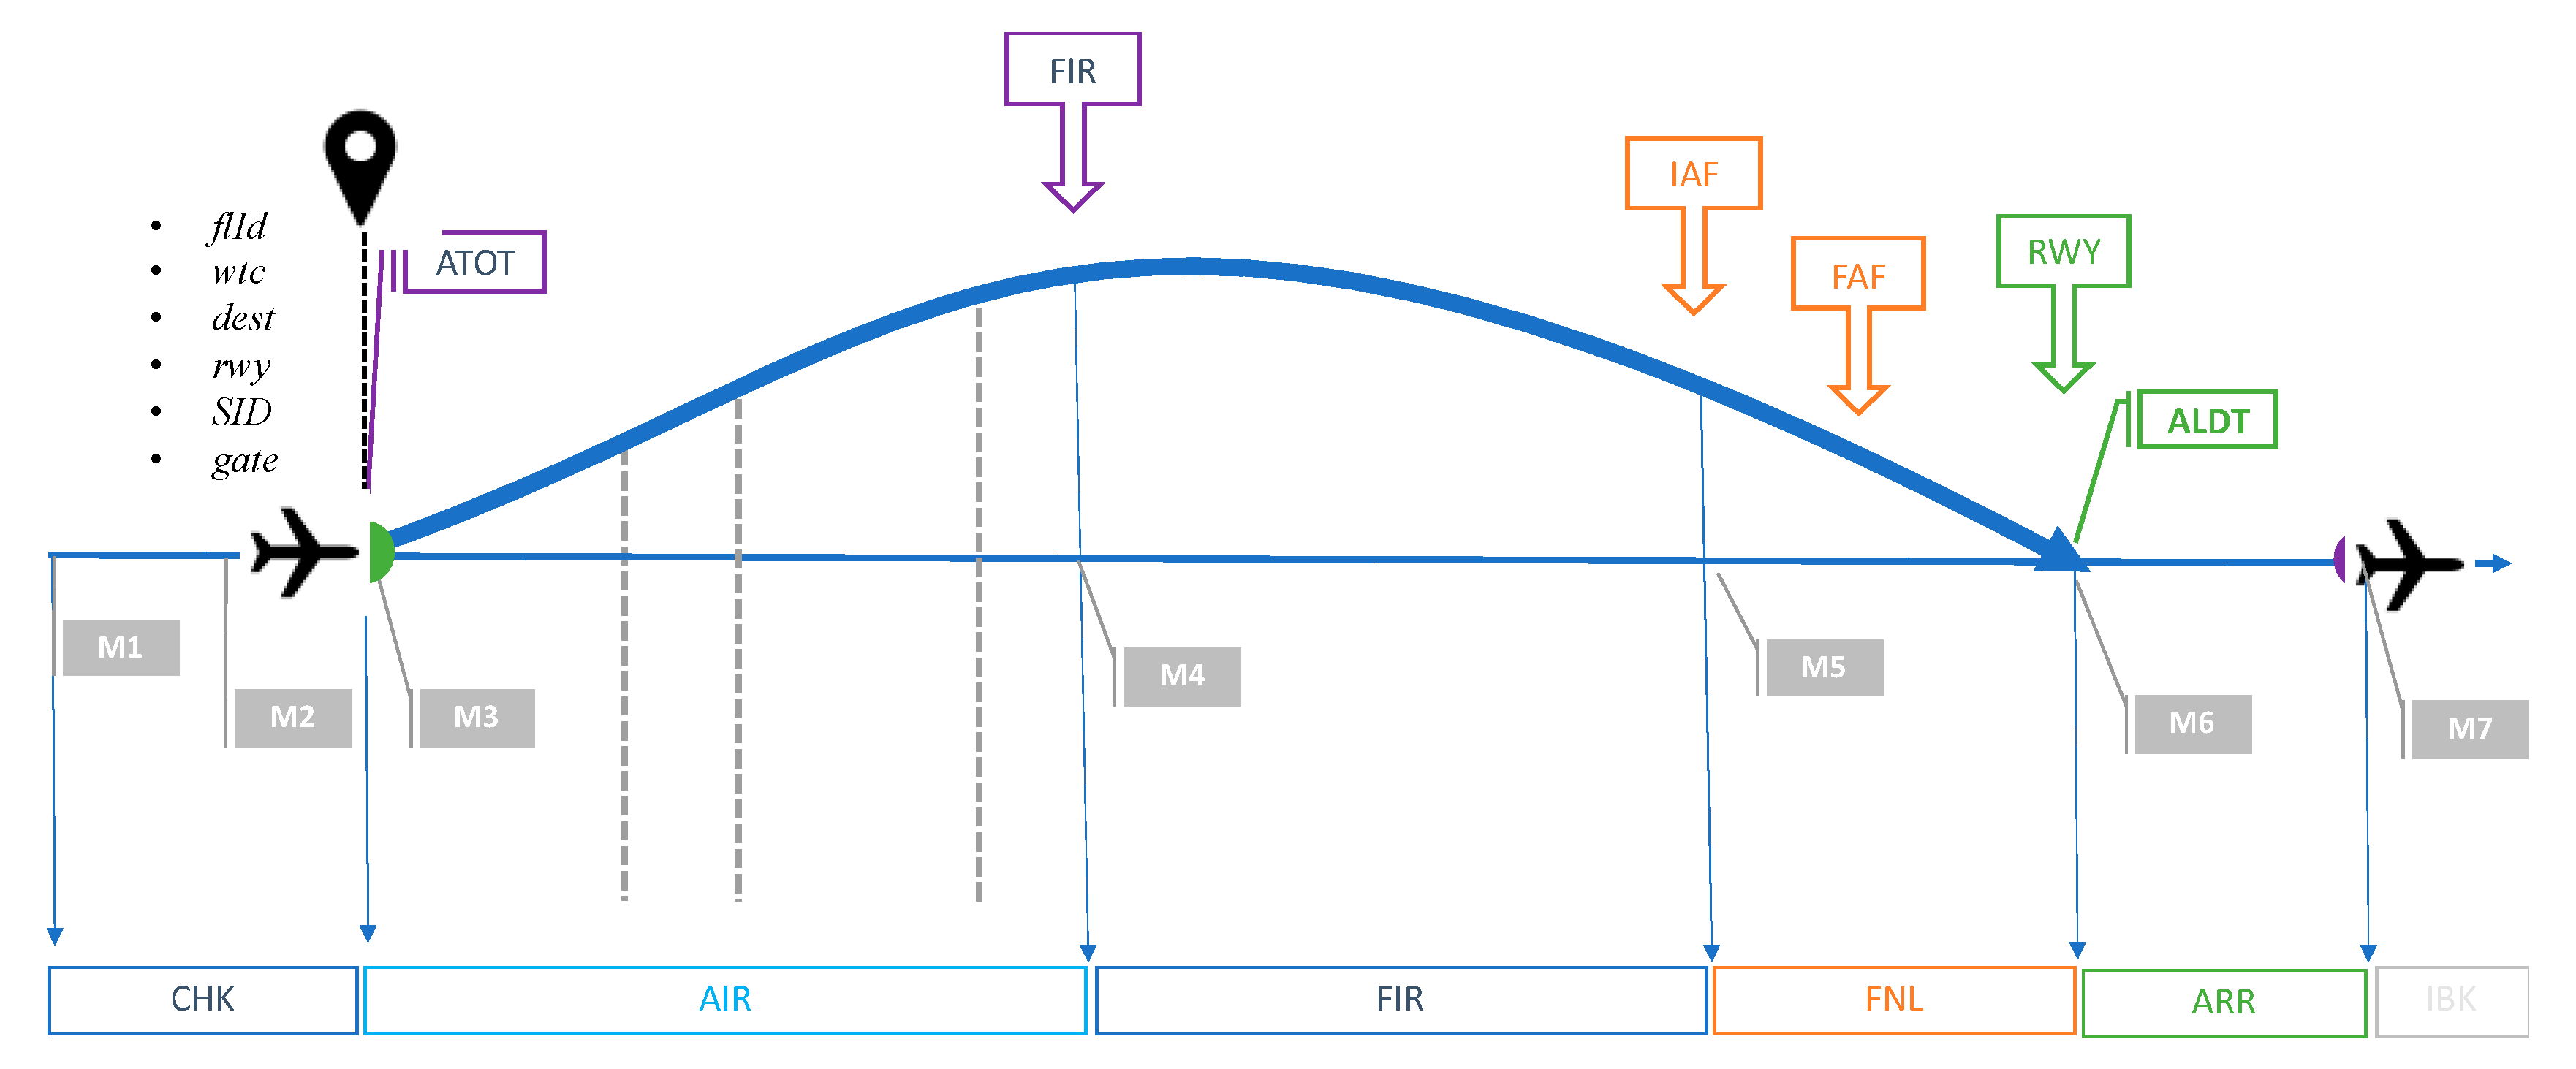
The inbound phase covers all the activities from the moment the flight plan is activated until the aircraft passes the red line at the destination airport’s apron, which is equal to the operational status ‘On-Blocks’, see
Figure 3. The first two milestones (Milestone 1 and 2) are mainly aiming to initiate CDM platform for each flight and check consistency on flight data for planning purposes. Since this moment different time reference estimations are performed related to
landing, in/off-block and take-off time, in addition to issue some regulations through the Calculated Take-Off Time. The milestone 3 is called “Take-Off from Outstation” and it is achieved at a time reference called
Actual Take Off Time (ATOT). From the moment the flight is within on average 40 min and even 3 h flying time of the destination airport the Network Operations monitors progress of the flight sending a Flight Update Message (FUM) that provides updates of the flight’s progress until the flight enters the FIR (Flight Information Region) or the local airspace of the destination airport, mark with the Milestone 4.
In Milestone 4 and 5, important updates on the Estimated Landing Time (ELDT) and Target Off-Block Time (TOBT) are performed; hence, different updates on information of the progress of the flight are needed to update the estimated landing and off-block moments. The accuracy of ELDT is quite important at this stage since downstream decisions are taken based on this two key moments; these decisions concern all partners, such as stand or gate utilization, aircraft changes, preparation of arrival sequence, preparation of ground-handling operations, or decisions for connecting passengers, to mention some.
The TOBT is defined as the time that an AO or GH estimates that an aircraft will be ready, all doors closed, boarding bridge removed, push back vehicle available and ready to start up and push back immediately upon reception of clearance from the TWR for next flight. A key requirement for TOBT assignment is accuracy because a reliable TOBT allows us to calculate air-traffic flow management (ATFM) slot delay and issues a Target Start-up Approval Time (TSAT) to inform the flight crew and all partners about the time when the aircraft can expect start up and/or pushback approval. Finally, as part of the arrival phase Milestone 6, where an aircraft touches down on a runway at the so called Actual Off-block time (AOBT); equivalent to ATC Actual Time of Arrival (ATA). The actual landing of the aircraft also triggers several updates, but it can be highlighted, the moment of off-blocks and take-off, represented by TOBT and Target Take Off Time (TTOT) which are updated by the Aircraft Operator/Ground Handler, calculated on the basis of the defined turn-round period and estimated taxi-out for the departing flight.
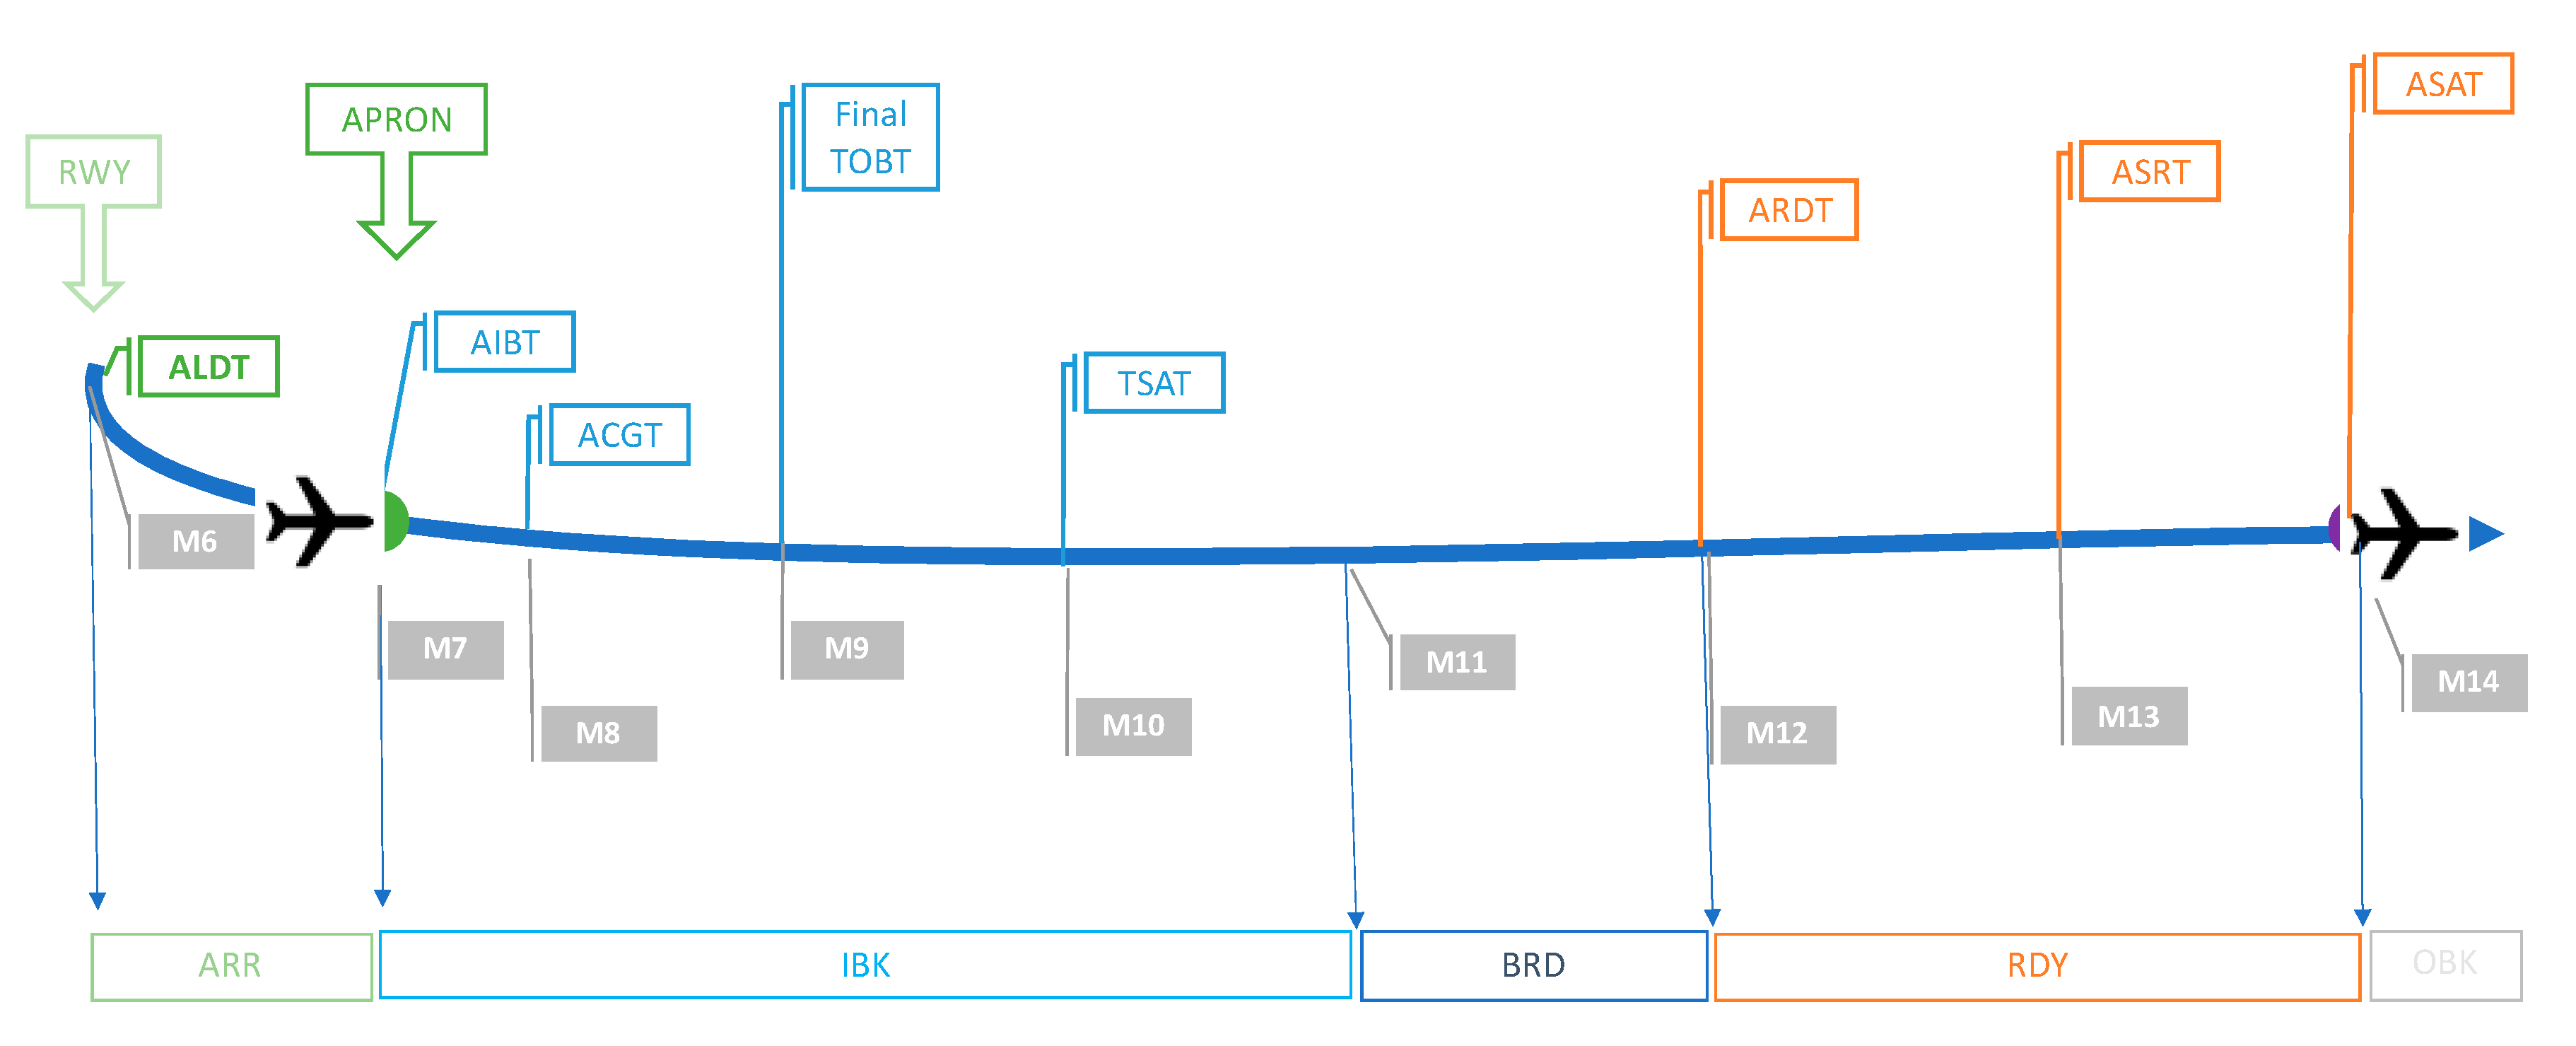
As shown in
Figure 4, the
Turn-Round phase is determined when the aircraft is in-block until it is off-block, represented by the
Actual In-Block Time (AIBT) and the AOBT, respectively. Once the aircraft is in-block (Milestone 7), the ground-handling operations start (Milestone 8). The process that takes place during this turnaround time comprises of the planning and handling of tasks to ensure the cleanliness, safety and efficiency of the next flight. Therefore, the turnaround time is one of the most important milestones for airport operators, directly affecting whether or not passengers will enjoy a timely optimal experience.
To achieve these different reference times the TOBT and the TSAT are updated, on Milestone 9. As previously mentioned, the TOBT represents the time that an airline or handling agent estimates that an aircraft will be ready, all doors closed, boarding bridge removed, push back vehicle available, ready to start up/push back immediately upon reception of clearance from the tower; TSAT is the time ATC issues the TSAT taking into account TOBT, CTOT and/or the traffic situation that an aircraft can expect start-up/push back approval.
Once the boarding process is completed at the so-called time reference Actual Ready Time (ARDT) defined as the moment when the aircraft is ready for start-up/push back or taxi immediately after clearance delivery, meeting the requirements set by the TOBT definition; the pilot can request for clearance to ATC. Therefore, it is the responsibility of ATC to inform the flight crew and other partners when an aircraft can expect to receive start-up and/or pushback approval which takes into account the TOBT as well as the allocated ATFM slot and the traffic situation, this will happen at the Actual Start-Up Approval Time (ASAT).
The outbound phase starts when the aircraft is pushed back from the apron or vacates its parking position at the so called
Actual Off-Block Time (time reference at AOBT), see
Figure 5. The aircraft starts rolling from the standpoint (or detachment point) using certain taxiways that Ground ATC instructs the aircraft to go through until its assigned runway. This phase will be call
taxi-out phase and it involves all activities from the moment the aircraft is actually off-block such as de-icing, waiting on crossing hot spots or taxi-routes, but also the aircraft holding at runways or lining up. The aircraft rolls until the “holding point” entering the runway. Normally, ground controls change here to tower control. Depending on the traffic conditions both on the ground and on the air, the aircraft can continue to line-up or wait at holding point until getting clearance from controllers. This process called “multiple line-up”, can be done in parallel with other aircraft if the local procedures allows. Once the aircraft enters the runway to line-up, it is ready for rolling to departure. This subprocess finishes at
Actual Take-Off Time (marked by the time reference ATOT); which is the time that an aircraft takes off from the runway time, equivalent to airline/handlers’
Actual Time of Departure (ATD). After that, the aircraft departs climbing until certain point (typically 30,000 ft or 10 km) before it can cruise at this altitude in a safe and economic way to continue its en-route phase.
4. Measuring the Capacity of Operations
This work aims to propose the use of the KPI called
Accuracy of declared capacity found in [
1] as a baseline to generalize the KPI for pre-tactical purposes and referring to a different simple and standard manner to address capacity in an organize and efficient manner. Monitoring the LTOC by each phase of flight, allow us to gain a deeper understanding of key success factors affecting capacity, not only at the airport or airspace level, but at network level. The propose framework aims to monitor capacity in such a way that the success factor, drivers and business models per each of the flight are identified.
The definition of accuracy is essentially having results (data) that is centered on a target value. Statistically speaking, it is how correct the mean value is of your estimations with respect to the actual operations. Therefore, the performance indicator known as
Accuracy of declared capacity should be measure by comparing the actual number of movements (realization) to the declared capacity, see (Equation (1)):
where,
is the accuracy of declared capacity;
is the actual traffic movements (realization) at certain time interval; and,
is the declared capacity.
The declared capacity at Schiphol Airport is determined in a cooperation [
19]; they specify the declared capacity as “the highest substantiated capacity per hour during a “mode” of the ATM system which can be achieved depending on the runway combination” (see
Table 1). The declared Capacity is defined as the “capacity number independent of the runway combination that can be delivered with a certain reliability under normal circumstances. This number is determined by the sector and is used for slot allocation”.
The capacity declaration describes the coordination parameters per season and per airport with a maximum of 500,000 aircraft movements in commercial aviation during an operational year, of which no more than 32,000 are night movements (movements with a runway time in the period 23:00–6:59 LT)”. In addition, the environmental and operational capacity restricts the number of operations using other parameters such as the nominal operational runway capacity for both, general and commercial aviation. Schiphol airport functions as a hub meaning that at certain times of the day there are peaks of a large amount of incoming traffic and somewhat less outbound traffic and at other times, there is more outbound than incoming traffic. It can be noted that the inbound and outbound declared capacity at Schiphol Airport presents five inbound peaks and five outbound peaks.
When Equation (1) is used for strategic purposes, many factors that affect capacity are not taken into account due to the nature of the
declare capacity definition. Hence, in line with partners objective it is proposed to use Equation (1) to monitor accuracy on other expected moments on time or event, lead us to Equation (2):
where,
is the accuracy on an expected moment on time or event;
is the actual traffic movements in certain time interval; and,
is the forecasted demand in a specific moment on time (t), such as entering to local airspace, flying by/through a waypoint, and produced or calculated by a given IT system (s).
It should be pointed out that, the time reference proposed by the milestone approach, both for the actual or expected demand are normally information share by all partners; depending on the implementation characteristics, big data sets can be obtained for post-operational analysis, as the one suggested on this work.
It is not hard to see that accuracy is a metric which is dependent on two terms, the actual traffic movements and the forecasted demand, being both dependent on several drivers of factors such as time, concept of operations and decision support tool or IT system used, among many. Hence, our approach defines a set of performance indicators to address the accuracy of operations as indicators at entering Dutch airspace, approaching, landing, in-block, off-block and take-off events.
For airports which have implemented CDM, especially the milestone approach, different data sets can be identify and used as historical data set of performance; furthermore, these data sets can be used by different decision support tools or IT systems used to trigger those time references.
6. Schiphol Efforts to Monitor Operations
As previously introduced, at Schiphol the Milestone 1, 2, and 3 aim to check consistency on flight data for planning purposes related to landing, in/on-block and take-off time; and some regulations can be issued due to network restrictions/requirements (CTOTs). In this regard, research has been carried out in [
20,
21] to address the operational benefits related to the connection of Schiphol with the network manager and the local A-CDM implementation. In [
20] an analysis on procedures changes, human factors issues and operational performance. CDM effectiveness is one of the key indicator’s analysis in this work; it considers take-off time predictability and non-compliance of Schiphol to take-off slots imposed by the network manager as the two primary KPIs. The research stresses that CDM has been more effective in relation to local CDM. Meanwhile in [
21], local CDM analysis to improve the stakeholders’ operational efficiency was performed by improving the predictability and decision making. The aim of this study is researching how local CDM has exactly improved the operation’s efficiency for each involved CDM stakeholder at Mainport Schiphol, and what the exact benefits are.
According to [
22], it is worth looking at some key factors influencing the performance of the flight: aircraft entering the Flight Information Region (FIR) boundary earlier than expected, resulting in changes in the inbound, turn round and outbound expected times; an average taxi-in time is used for planning purposes with a low accuracy resulting in inaccurate estimations of in/off-block and take-off moments, in this regard, it is worth mentioning that the
variable taxi time element is not yet in place at Schiphol; a significant amount on key events, such as in-block and off-block moments, updating the TOBT and turning it into a highly dynamic parameter; there is no common understanding on some terminology, definitions and meaning of vocabulary, such as the term On-time performance (OTP) is used in different ways, confusing partners’ objectives.
Focusing on other aspects of the accuracy of the inbound phase, the work found in [
23], based on the development a capacity management project called D-1 launched in 2018, presents an analysis of operational capacity planned before the day of operations was performed. The work aims to
monitor the accuracy of the predicted traffic demand (for the departures and arrivals at Schiphol), by a comparative analysis on the expected demand forecasted a day in advance vs. the actual demand on the day of operations using data from January 2019 to March 2019. The demand is compared to different moments in time-space; when entering to the Amsterdam Flight Information Region by a specific sector; when passing by/through to its correspondent
Initial Approach Fix (IAF); and, at the expected landing time calculated by
Advanced Schiphol Arrival Planner (ASAP).
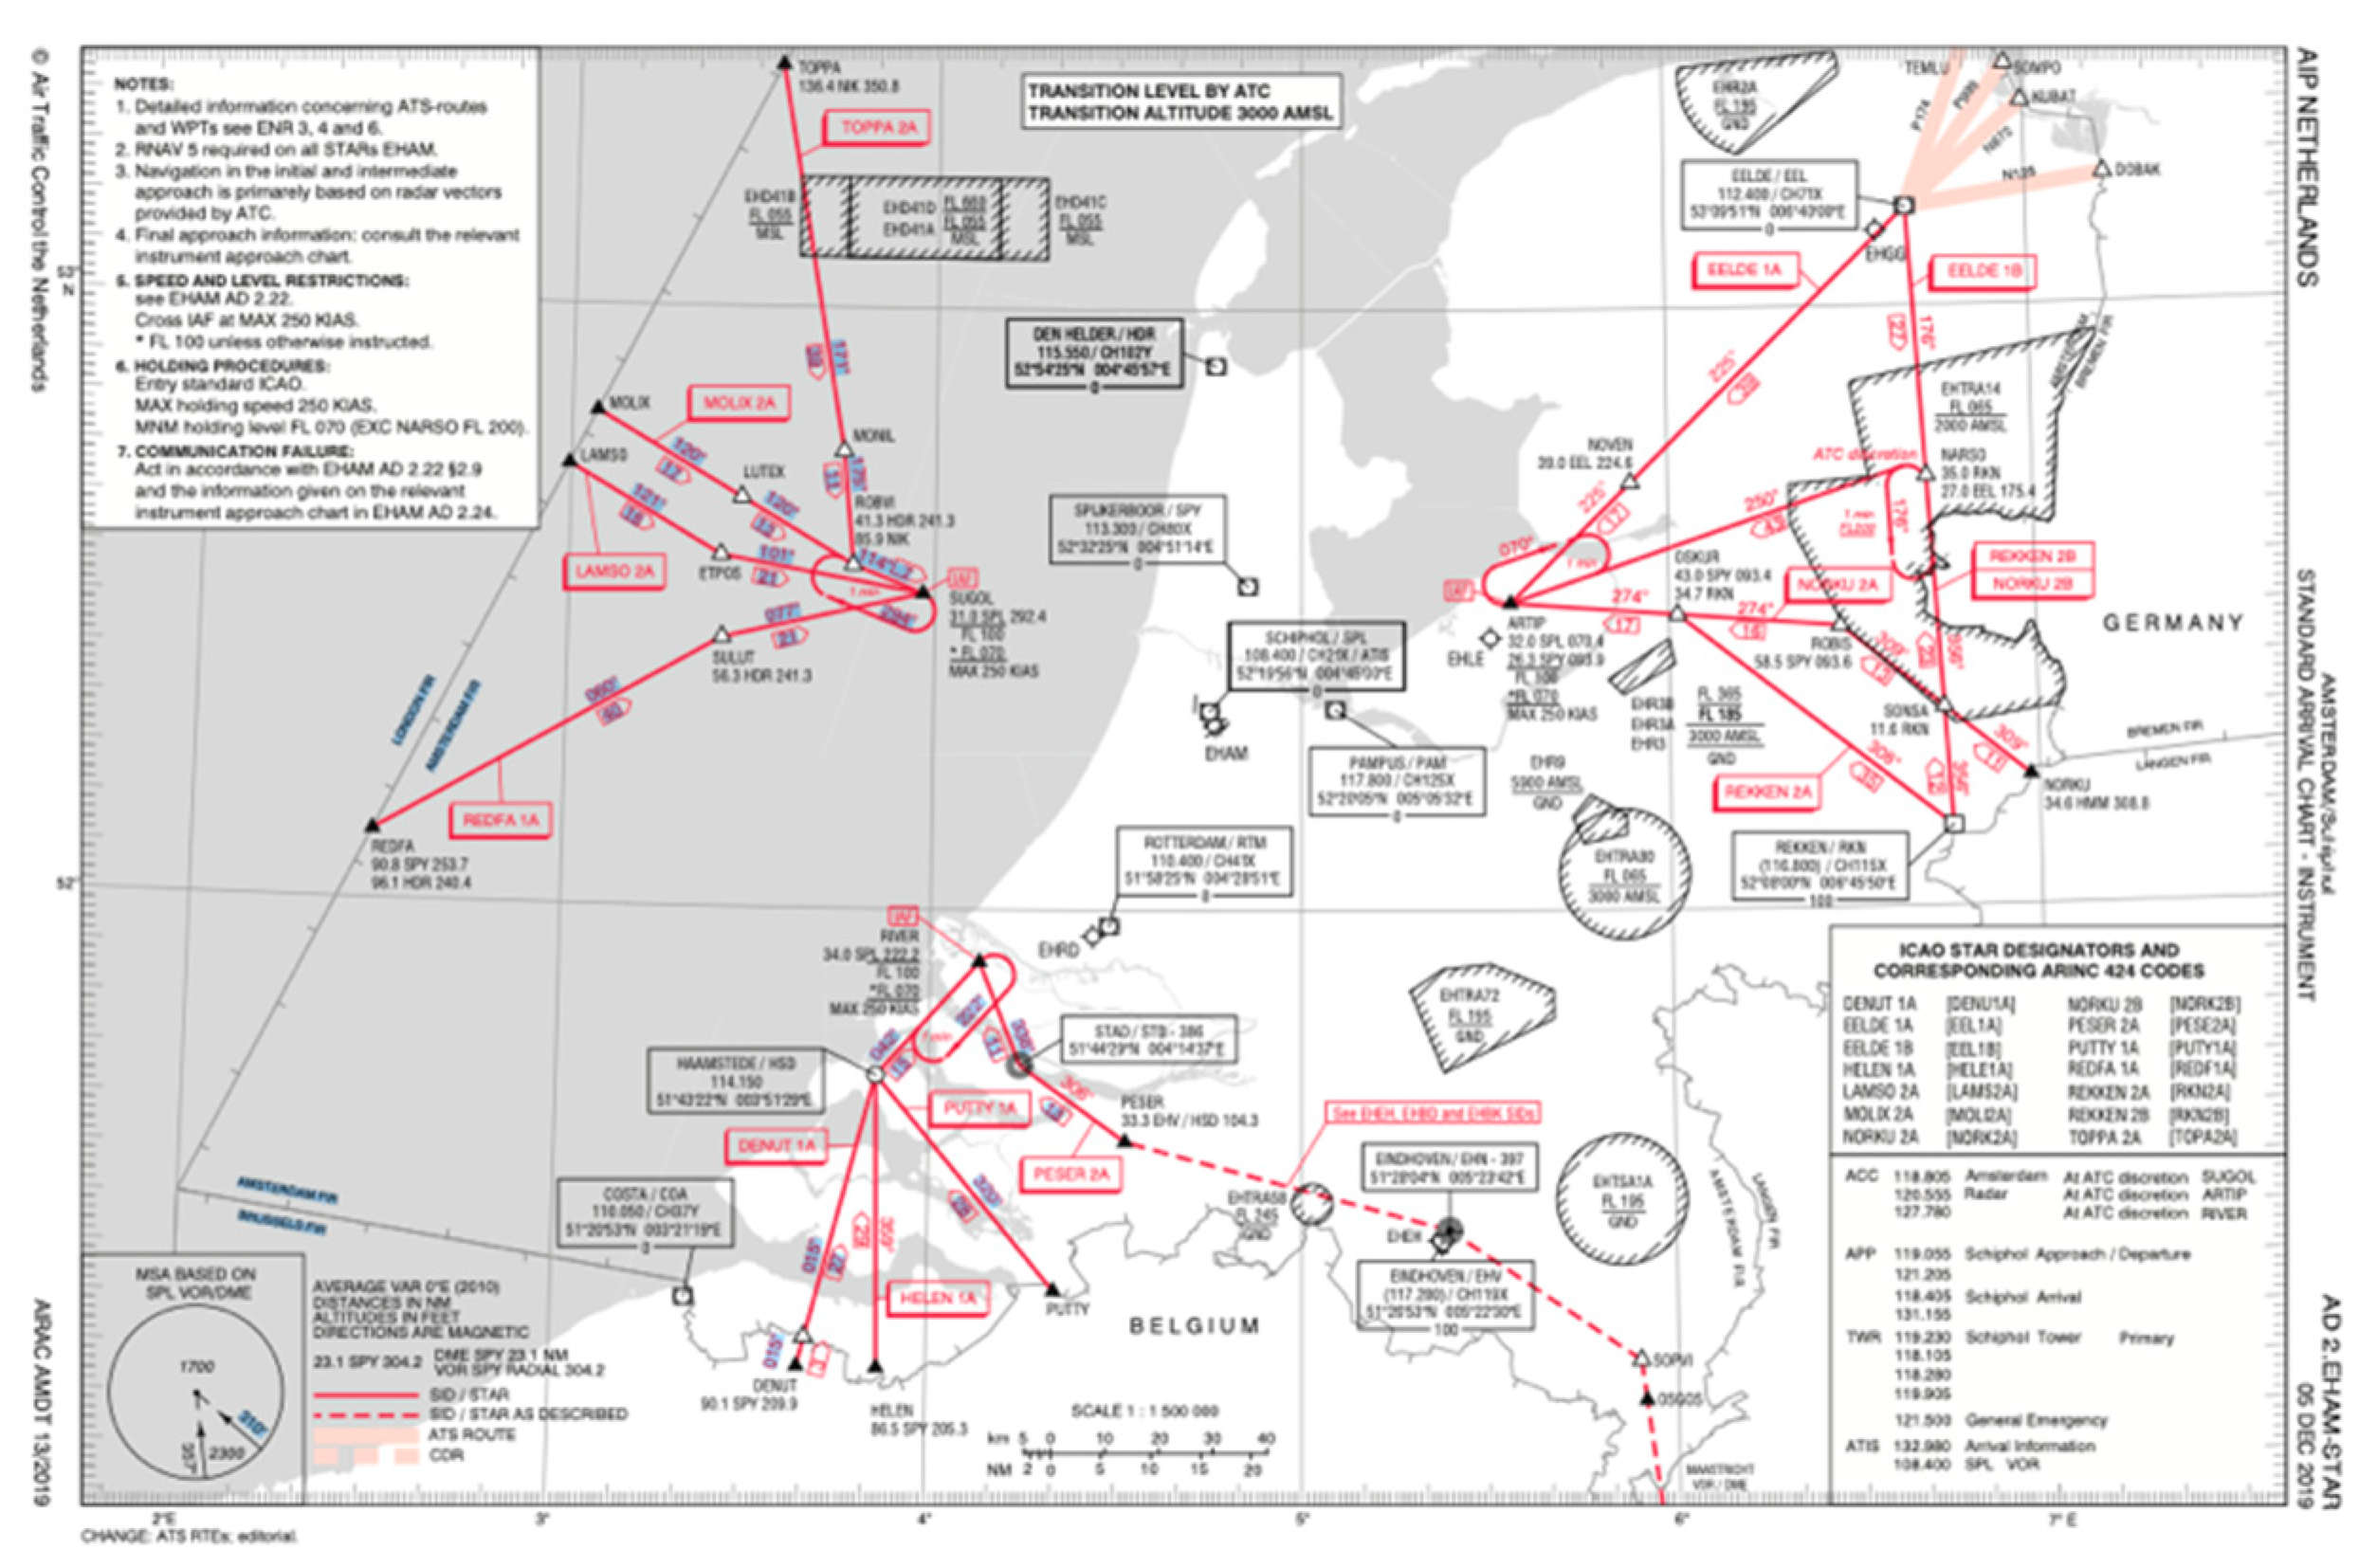
As can be seen on
Figure 6, at approaching to EHFIRAM, the inbound flight will use five sectors to approach depending on its origin merging into three points aiming to land at a specific runway, A flight approaching the terminal maneuvering area (TMA) typically follows standard arrival routes (STARs) providing the transition from the en-route structure to terminal airspace; analogous, a flight departing will use standard instrument departure routes (SID). Depending on the airspace topology, the arrival routes merge at the initial approach fix (IAF) where the initial approach segment begins; in Schiphol, the IAFs are called SUGOL, RIVER and ARTIP, see
Figure 6. To avoid potential conflicts at airspace, ATCs issues a set of vectoring instructions to pilot to overcome merging and sequencing of arrival flights. Delay in the landing times is induced if an aircraft is required to either slow down, hold, or change route to avoid potential conflicts. These manual interventions are out of the scope of [
23].
Once approaching and inside Dutch airspace (Milestones 4 and 5), an intense transition of information takes place to update different inbound time references, this data is transmitted mainly in forms of dome messages such as FUM, OLDI-messages, radar and, ACARS data. This information is constantly received and used to trigger a diverse time reference estimation as described in the previous section. In addition to the ELDT, the so-called Estimated In-Block time (EIBT), equivalent to the airline/handler Estimated Time of Arrival (ETA) is also updated. These estimations are performed by different IT systems and decision support tools of controllers such as the arrival manager at Schiphol called ASAP and the Amsterdam Advanced Air traffic control system (AAA) is the LVNL radar data and flight data processing system; its primary purpose is to support the air-traffic controllers (ATC) to efficiently and safely manage air traffic. The ELDT at Schiphol is mainly triggered by AAA and ASAP and share through CIISS following selection rules based on the accuracy of the ELDT produced.
In this regard, the aim of a research work found in [
25] is to improve both the turn round and outbound planning process at Schiphol mainly based on the fact that the stability of those planning processes depends heavily on the accuracy of the inbound flight information. It has been found that the ELDTs depend on the following main factors: origin of the flight (i.e., initial approach segment used to land), business rules applied to prioritize inbound source of information, and availability of inbound data, the logic implemented on AAA and ASAP to calculate it, ATC manual intervention and procedures used, pop-up flights, and other adverse un-predicted factors such as adverse weather conditions or overloaded surrounding airspace.
Other research regarding the inbound phase can be found in [
26] where the new arrival management system at Schiphol called the Advanced Schiphol Arrival Planner (ASAP) was evaluates after being implemented in 2018. To validate the implementation of ASAP diverse analysis have been run. This work describes some recent insights and findings regarding the performance and interaction between users (ATCs) and ASAP. Particular attention is given to establishing the moment and type of interaction between the different users. The performance of the tool was evaluated using four main performance indicators; Expected Approach Time (EAT) adherence, slot adherence, holding ratio, influence of APLN.
7. Conclusions and Further Work
This work centers its attention on describing the main elements of A-CDM as a baseline for understanding how common agreed benefits can be monitor. Special attention is placed on the Milestone approach to show the benefits of a standardizing process and vocabulary. This standardization allows us to harmonize operations and vocabulary across Europe and even worldwide and, in addition, to leverage experience gained and lessons learned from airports with similar capacity constraints or infrastructure working under the CDM principles. Moreover, enhancing the use of this terminology will help to develop a common protocol of communication which can be easily extended internationally, allowing benchmark studies among the airports systems as a network of the European network to be performed.
To properly select the main indicators to monitor capacity, a literature review was conducted on two main topics, performance-based approaches and capacity indicators, this is the baseline for the proposed KPIs and performance approach.
It has been emphasised that the milestone approach and information-sharing elements on the CDM principles, set proper a mechanism to evaluate strategic objective agreed by partners in a straightforward and transparent manner. Hence a detail description of the main time reference used on the landing and take-off cycle are presented as part of the background required to monitor operations. In addition, a framework was presented on how to monitor the accuracy of expected capacity on six main moments on time: at entering Terminal Maneuvering Area (TMA) and En-route, at landing and take-off and at in-block and off-block. The expected benefits of the monitoring framework are gaining understanding of the performance of operations on key moments represented by the milestones and time references.
Analyzing the Accuracy of operations will allow mangers and decision makers to take efficient decisions in order to improve overall system capacity by addressing key moments on the LTOC, as in the Milestone Approach. Using the same vocabulary, parameters, principles, and system’s conditions, it can be generated a standardized framework to monitor strategic objectives on different time horizons. Schiphol was used as a case study to show how a full A-CDM airport can monitor capacity in the different phases of the flight and at different planning horizons (strategic and pre-tactical). It was also selected due to the different efforts which have been performed by its partners. Hence, the proposed framework is intended to be generic, and appropriate for any airport which had implemented CDM principles.
As future work, a more detailed literature review together with interviewing the partners involved in order to properly select the most suitable indicators for their purposes is proposed when selecting the KPIs. Furthermore, a set of actions has to be proposed to control the course of actions during the monitoring process, hence, further analysis has to be performed to propose and select the most appropriate control actions which will be used by decisions makers. Other indicators can also be developed following the same premises presented on this work related to the other strategic objectives.


