Technical Note

Investigation of a CubeSat in Orbit Anomaly through Verification on Ground

Department of Mechanical and Aerospace Engineering (DIMEAS), Politecnico di Torino, 10129 Torino, Italy
*
Author to whom correspondence should be addressed.
Aerospace 2020, 7(4), 38; https://doi.org/10.3390/aerospace7040038
Submission received: 2 March 2020 / Revised: 18 March 2020 / Accepted: 23 March 2020 / Published: 1 April 2020

Abstract

:
Given the role of Cubesats in the new space economy, a statistically relevant number of CubeSats have flown, and considering the high percentage of failed missions, the investigation of in-orbit anomalies becomes of paramount importance. It is rare to find data about mission failures, probably because the partial or total absence of telemetry does not encourage any analysis. The lack of data from the spacecraft in orbit can be mitigated through ad-hoc verification campaigns on satellite models when in-orbit anomalies are experienced. This paper shows an effective testing activity conducted on models of the spacecraft to understand the root cause of a severe anomaly that occurred during mission operations. The tests are part of a comprehensive methodology for root causes analysis. The paper aims at sharing the experience built upon a practical case of interest. More importantly, this work has the ambition of fostering the research on key topics of reliability, mission operations and assembly, and integration and verification/test processes, which have shown to be critical. The activity presented in this paper demonstrates that investigating the anomalies can help recover the mission of interest but can also support building a heritage that is still missing for CubeSat missions today.

1. Introduction

In the first years of this century, universities around the world, sometimes supported by space agencies [1,2], started educational program based on the development of CubeSats, which represent an effective hands-on experience for a new generation of engineers [3]. CubeSats are becoming systems of interest for the scientific community, the industry and government agencies to support a broad set of mission goals for Earth observation [4], telecommunications [5], in-orbit technology demonstration [6], science [7], and space exploration [8,9]. Small satellites are pillars of the new space economy with some commercial initiatives in place and many likely to come in the near future [10].
The “low cost and fast delivery” paradigm describes the success of CubeSats. However, today, CubeSats present two main points that should be addressed in order to exploit the full potential of these platforms: enhancing onboard capabilities and increasing reliability, while preserving the low-cost/fast-delivery approach. CubeSat technology is newborn [11]: advanced communication systems with high data rate [12,13], precise sensors and algorithms for attitude determination [14,15] and navigation [16,17], and effective thermal [18,19] and propulsion systems [20,21] are very recent and the technology readiness level of most developments is quite low. The lack of maturity, associated often with ultra-cheap materials and processes of manufacturing and verification, determine the high risk of failures of CubeSat missions. In [22], the authors show that about 50% of launched CubeSats did not complete their intended mission. Most faulty CubeSats did not ever transmit signals, while many operating CubeSats performed with degradation in terms of mission objectives reached due to the loss of operational capabilities.
It is rare to find data about mission failures. This is probably because few or no thorough investigations have been done because the partial or total absence of telemetry prevents and/or does not encourage any analysis. Often, CubeSat owners tend to declare a failure of the entire system or of the communication system [22], even if the lack of communication might be just the effect of other failures, but, also when the communication works partially or properly, it is difficult to analyze onboard failures because often poor or no Failure Detection Isolation and Recovery (FDIR) functions are implemented. This implies that usually very few data from orbit are available regarding the health status of the system, especially in case a failure occurs.
Furthermore, anomaly analysis is complicated by the absence of a statistic database for Commercial Off-the-Shelf (COTS) items limiting the reliability analysis to a qualitative exercise without effective quantitative estimations. Moreover, sometimes the usual light approach to documentation in CubeSat projects can lead to a lack of knowledge about the design steps and the changes and the choices made during the development. However, the approach to any phase of the lifecycle is changing and novel disciplines, such as Model-Based Systems Engineering (MBSE), are opening new perspectives in terms of effectiveness of the projects. The implementation of the model-based approach seems to be very promising for supporting CubeSat projects, as shown in [23]. Using models throughout the product lifecycle facilitates the exchange of information among the projects participants, reduces the loss of information, increases shared knowledge about the systems across the project phases, and allows reuse across projects. MBSE is particularly suitable for CubeSat projects, as the modeling effort (which is the main drawback of this approach) is reduced thanks to the simplicity of the systems involved in the mission. However, few efforts have been done about standardization and quality assurance considering these new processes, and the most applied approach remains document-centric.
Given the role that CubeSats are taking on in the Space Economy, and given the fact that a statistically relevant number of CubeSats have flown, it is of paramount importance to understand the causes of failures and anomalies detected so far to build upon the lessons learned for the development of future missions. The lack of data from the spacecraft in orbit can be partially mitigated with a methodical and precise approach [24] and by planning [25,26] and implementing ad-hoc verification campaigns on the engineering and/or qualification models of the satellite [27,28,29,30] or of specific equipment [30,31]. The verification campaign can play a decisive role also during operations, when the satellite is already in orbit and it is experiencing abnormal occurrences. In particular, analyses on virtual models and the tests on engineering models (EM) of equipment, sub-systems, and sub-assemblies, up to the complete replica of the satellite can be conducted. This does not necessarily imply that the prototype approach, instead of a proto-flight, must be followed. It rather underlines the importance of having a complete and updated set of virtual and hardware models that can prove crucial not only in the AIT/V phases but can also support the spacecraft operations, especially in case off-nominal conditions apply. During the development of the CubeSat, many models are built for several purposes. The idea is to leverage on these models during all product lifecycle phases, also for tasks other than the original ones. For this reason, it is important to document and maintain the models all along the mission. Models of the spacecraft are usually used during operations of traditional missions for several purposes, e.g., testing nominal tasks before execution on board, or defining new solutions in case an anomaly is detected or new mission needs arise. There is neither literature nor standards to guide CubeSats developers and operators in this respect.
This paper shows how a careful testing activity conducted on models of the spacecraft helped to understand how the root cause of a severe anomaly occurred during mission operations. The tests are part of a comprehensive methodology for Root Causes Analysis (RCA) presented in [32] and briefly summarized in Section 2. The understanding of the root cause of the failure that led to the anomaly brought to light some design flaws and assembly and integration mistakes. The paper aims first at sharing the experience built upon a practical case of interest, but, more importantly, this work has the ambition to fostering the research on key topics of reliability, mission operations and assembly, and integration and verification/test (AIV/T) processes, which have been somehow under-estimated for CubeSats so far.
Section 2 describes the anomaly detected during operations of the e-st@r-II CubeSat, a mission developed within the Fly Your Satellite! Programme of the European Space Agency. Section 3 reports on the test sessions carried out for studying the anomaly and identifying the possible failure causes. Section 4 shows the importance of the analysis in terms of lessons learned for future developments of CubeSats, and Section 5 concludes the article with final remarks.

2. Anomaly Analysis Process

The methodology followed for the e-st@r-II anomaly analysis takes inspiration from [33], tailoring the more general aspects to the case of a small-size space system developed at university level. A system’s failure analysis is an investigation to determine the underlying reasons for non-conformance with the system requirements. A system’s failure analysis is performed to identify anomaly root causes and to recommend appropriate corrective actions. Figure 1 shows the approach for the analysis of the anomalies followed for the present case of study. This analysis begins with the understanding of the failures, the determination of their occurrence and context, and their severity. The second step is to identify all the sources of information, such as data from real-time or post-processed telemetry or from process documentation, that can provide support to the analysis. Once this has been accomplished, all potential failure causes are identified using fault tree analysis. The process then evaluates each of the potential failure causes also using support analyses, including a what is different analysis, pedigree analysis, and special tests and experiments. What is different analysis leads to identifying changes that might have induced the anomaly. The basic premise of this analysis is that the system has been performing satisfactorily until the failure occurred; therefore, something must have changed to induce the failure. The potential changes include system design, manufacturing processes, suppliers, operators, hardware lots, operative environment. Pedigree analysis examines all the documentation related to the components and subassemblies, all the AIV steps and results. Pedigree analysis involves studying this documentation (such as test data, inspection data, raw material data sheets, and other certifications) to determine if the components and subassemblies identified in the fault tree meet the requirements. Special tests and experiments include tests designed to investigate nominal and off-nominal conditions on a representative model of a component, a subsystem, or the whole system. Tests designed in nominal conditions serve to examine in depth the special features not considered during the AIV campaign. Tests designed inducing a failure permit serve to evaluate a hypothesized failure cause. Fault tree analysis and support analyses should rule out the major parts of the identified causes and converge on few root causes for each anomaly. The final step is to review (and sometimes relax) the requirements and/or select and implement corrective actions that eliminate or mitigate the anomaly.

3. In Orbit Anomalies

The analysis has been developed to study a practical case of interest, i.e., the investigation of an anomaly occurred during the mission of the E-st@r-II CubeSat. The project is carried out by the CubeSat Team of Politecnico di Torino and is part of the first Fly Your Satellite! Programme of the European Space Agency. The CubeSat was launched in 2016 with Soyuz VS14 from French Guyana [34]. E-st@r-II is a 1U CubeSat with the objectives of demonstrating new algorithms for attitude determination and testing in orbit miniaturized technologies for communication systems (COMSYS), on board computer (OBC), electrical power systems (EPS) and structure and mechanisms (S&M).
E-st@r-II is still operational now, well beyond the end of the intended mission duration (one year). However, some anomalies have been observed during the mission that required intervention from ground operators with the support of the engineering team. The criticality of one of these anomalies led the engineering team to decide to perform a thorough RCA, including special tests, to understand the causes of the anomaly and try to recover the nominal mission.

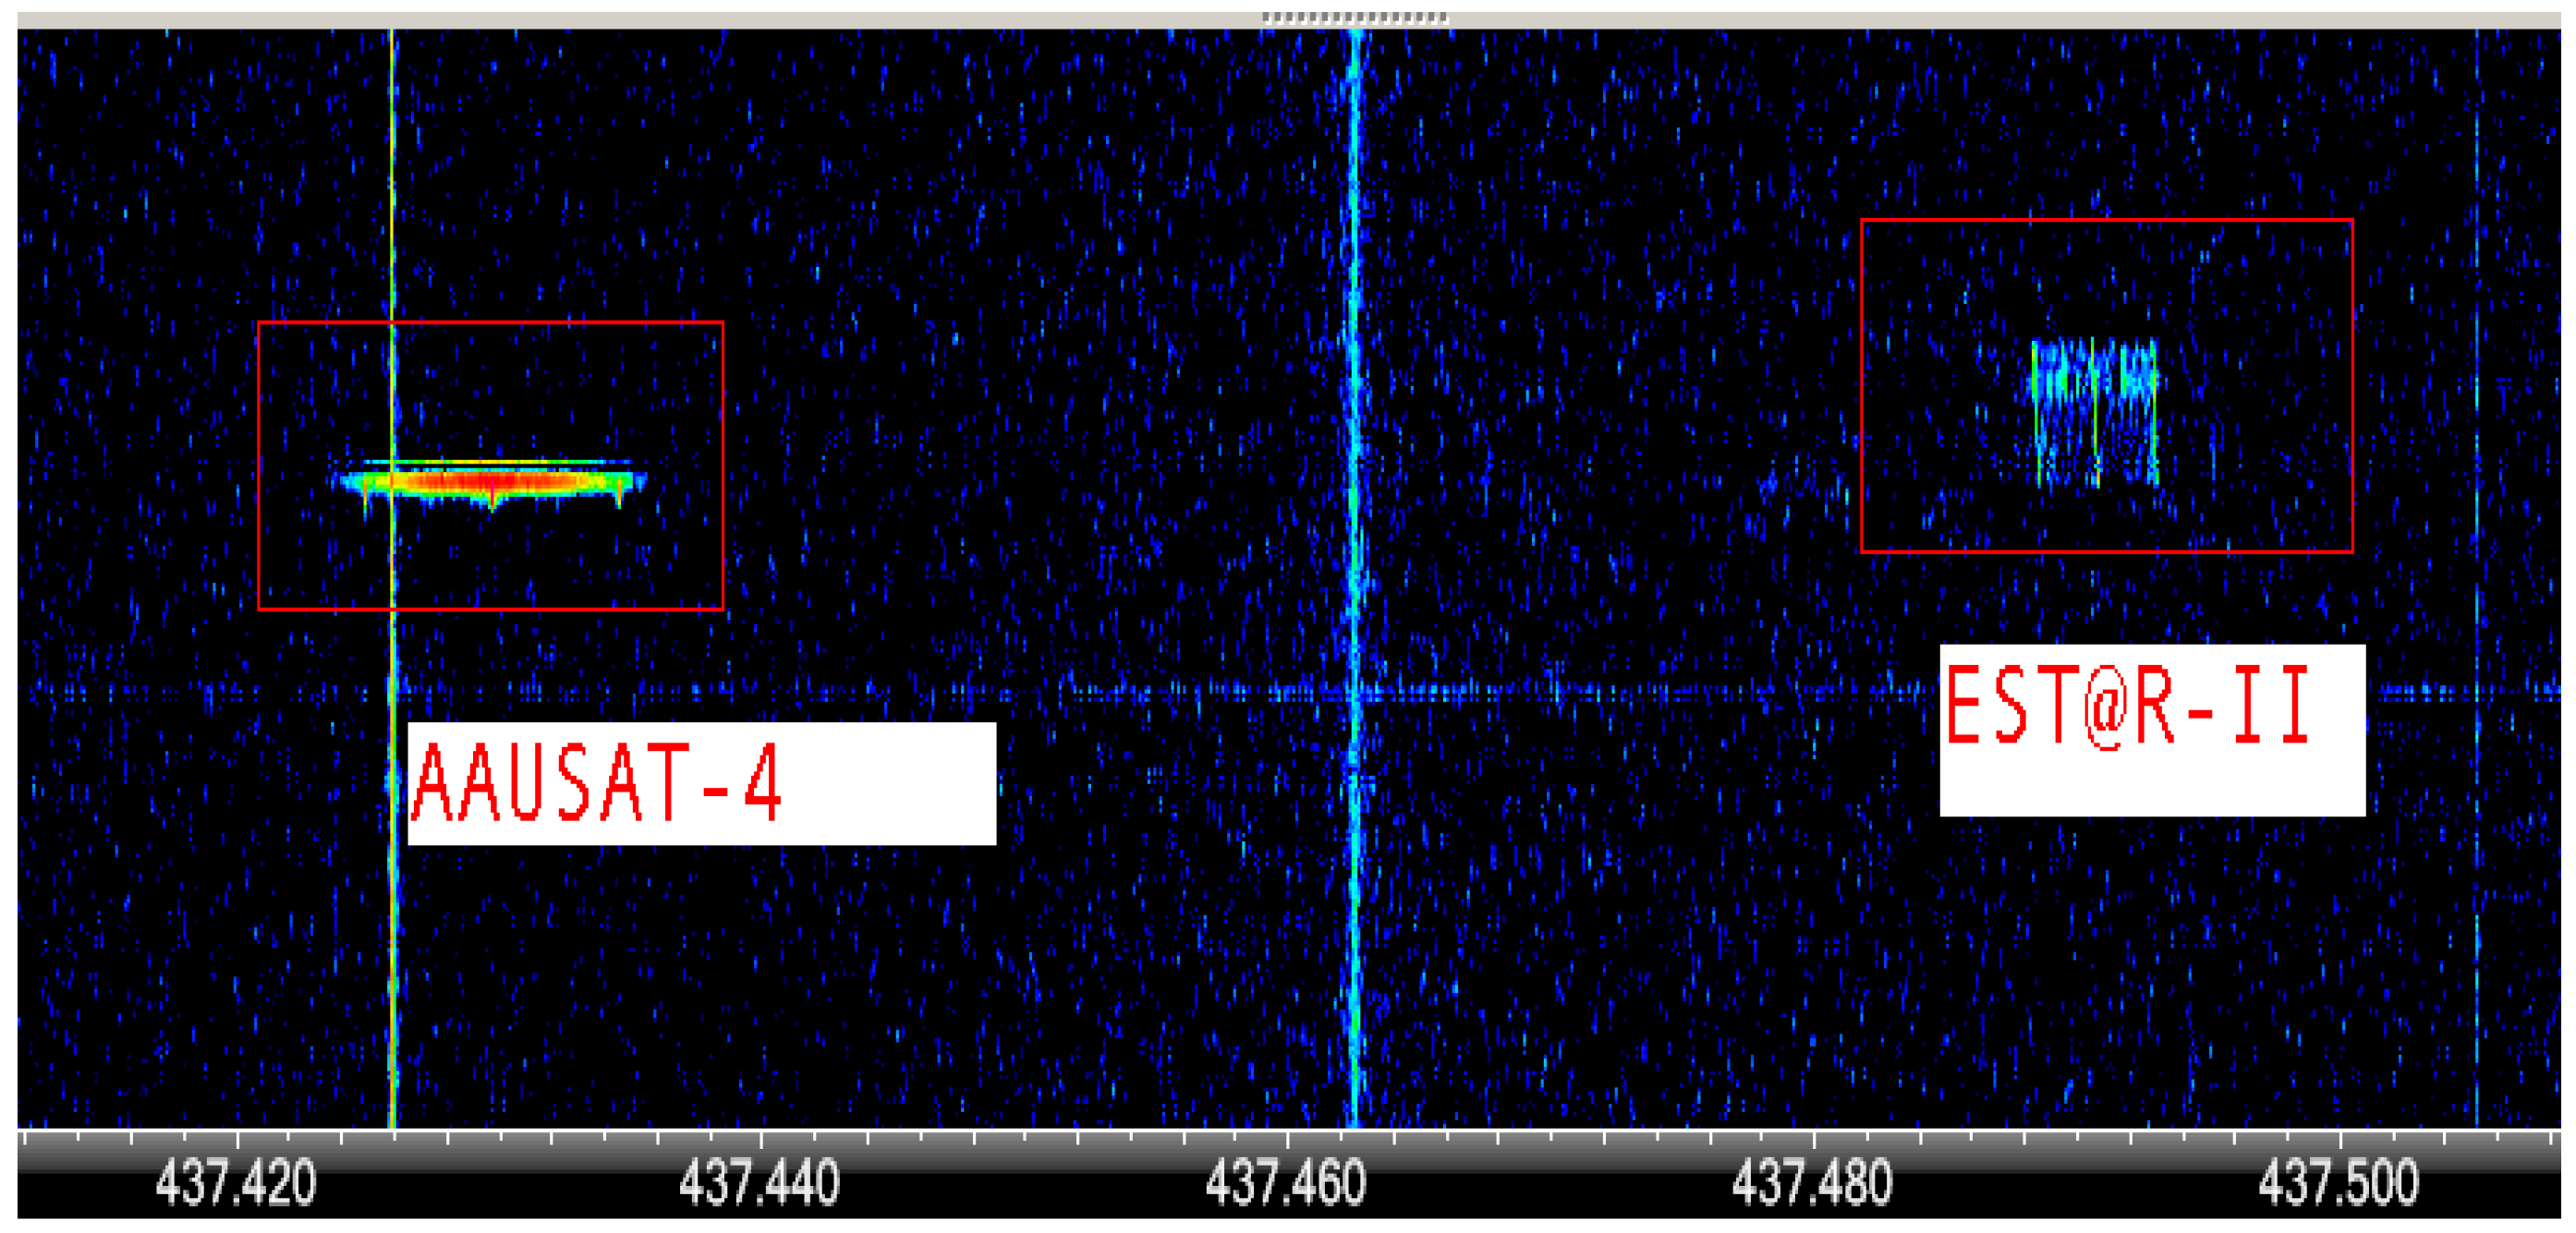
3.1. Anomaly Observation

During the first pass of the satellite over the main ground control station (ARIBRA–IQ1RY), no signal was received from the satellite. Other radio-amateur stations (e.g., PE0SAT—Holland, DK3WN—Germany, IW1DTU—Italy, JA0CAW—Japan, PY4ZBZ—Brazil) received signals but were not able to decode them. In the first days of the mission, other more powerful stations were used to better understand the situation. These stations (Dwingeloo Radio-Telescope in Holland and Morehead University Station in the US) were able to receive and decode the signals transmitted by the satellite.
An estimation of the signal to noise ratio has been computed on various samples of received signals. This was done by measuring the residual carrier amplitude and the noise floor N0 directly on the spectrum plot. The total signal power S was derived from the amplitude of the residual carrier C, considering the expected suppression for the implemented modulation index, computed with the Bessel function of the first kind and of order 0 (about 7.5 dB).
An example of S/N0 measurement is reported in Figure 2. In this case, the residual carrier amplitude C is –23dB and the noise floor N0 is about −60 dBbin, leading to a carrier over noise ratio (C/N0) of 37 dBbin, or 44.7 dBHz, since the resolution of this FFT is 6 Hz/bin. Considering the carrier suppression factor of 7.5 dB, an S/N0 value of 52.2 dBHz is obtained.
The estimated S/N0 values have been compared with those computed in link budget, considering the actual position of the satellite in terms of elevation and slant range at the time of signal acquisition, as provided by the G/S tracking system (e.g., WXTrack software).
As a result of the analysis, a signal-to-noise ratio level of 6 to 15 dB lower than the link budget calculation. A similar level of signal degradation was observed on signals received and recorded by all the above-mentioned ground station, so the possibility of a failure in the reception chain of the main ground station was excluded.
In addition, a comparison between the level of the signal of E-st@r-II and AAUSAT-4, the Danish CubeSat, launched together with E-st@r-II and having communication features and parameters very similar to E-st@r-II [35]. Figure 3 reports the water-fall related to a pass over the main ground station in the third day after the launch (i.e., with the satellite with a very close distance). Red corresponds to a signal strength of about −80 dBm, while dark blue corresponds to a signal strength of about –100 dBm. A difference of about 15 dB between the signals is observable.

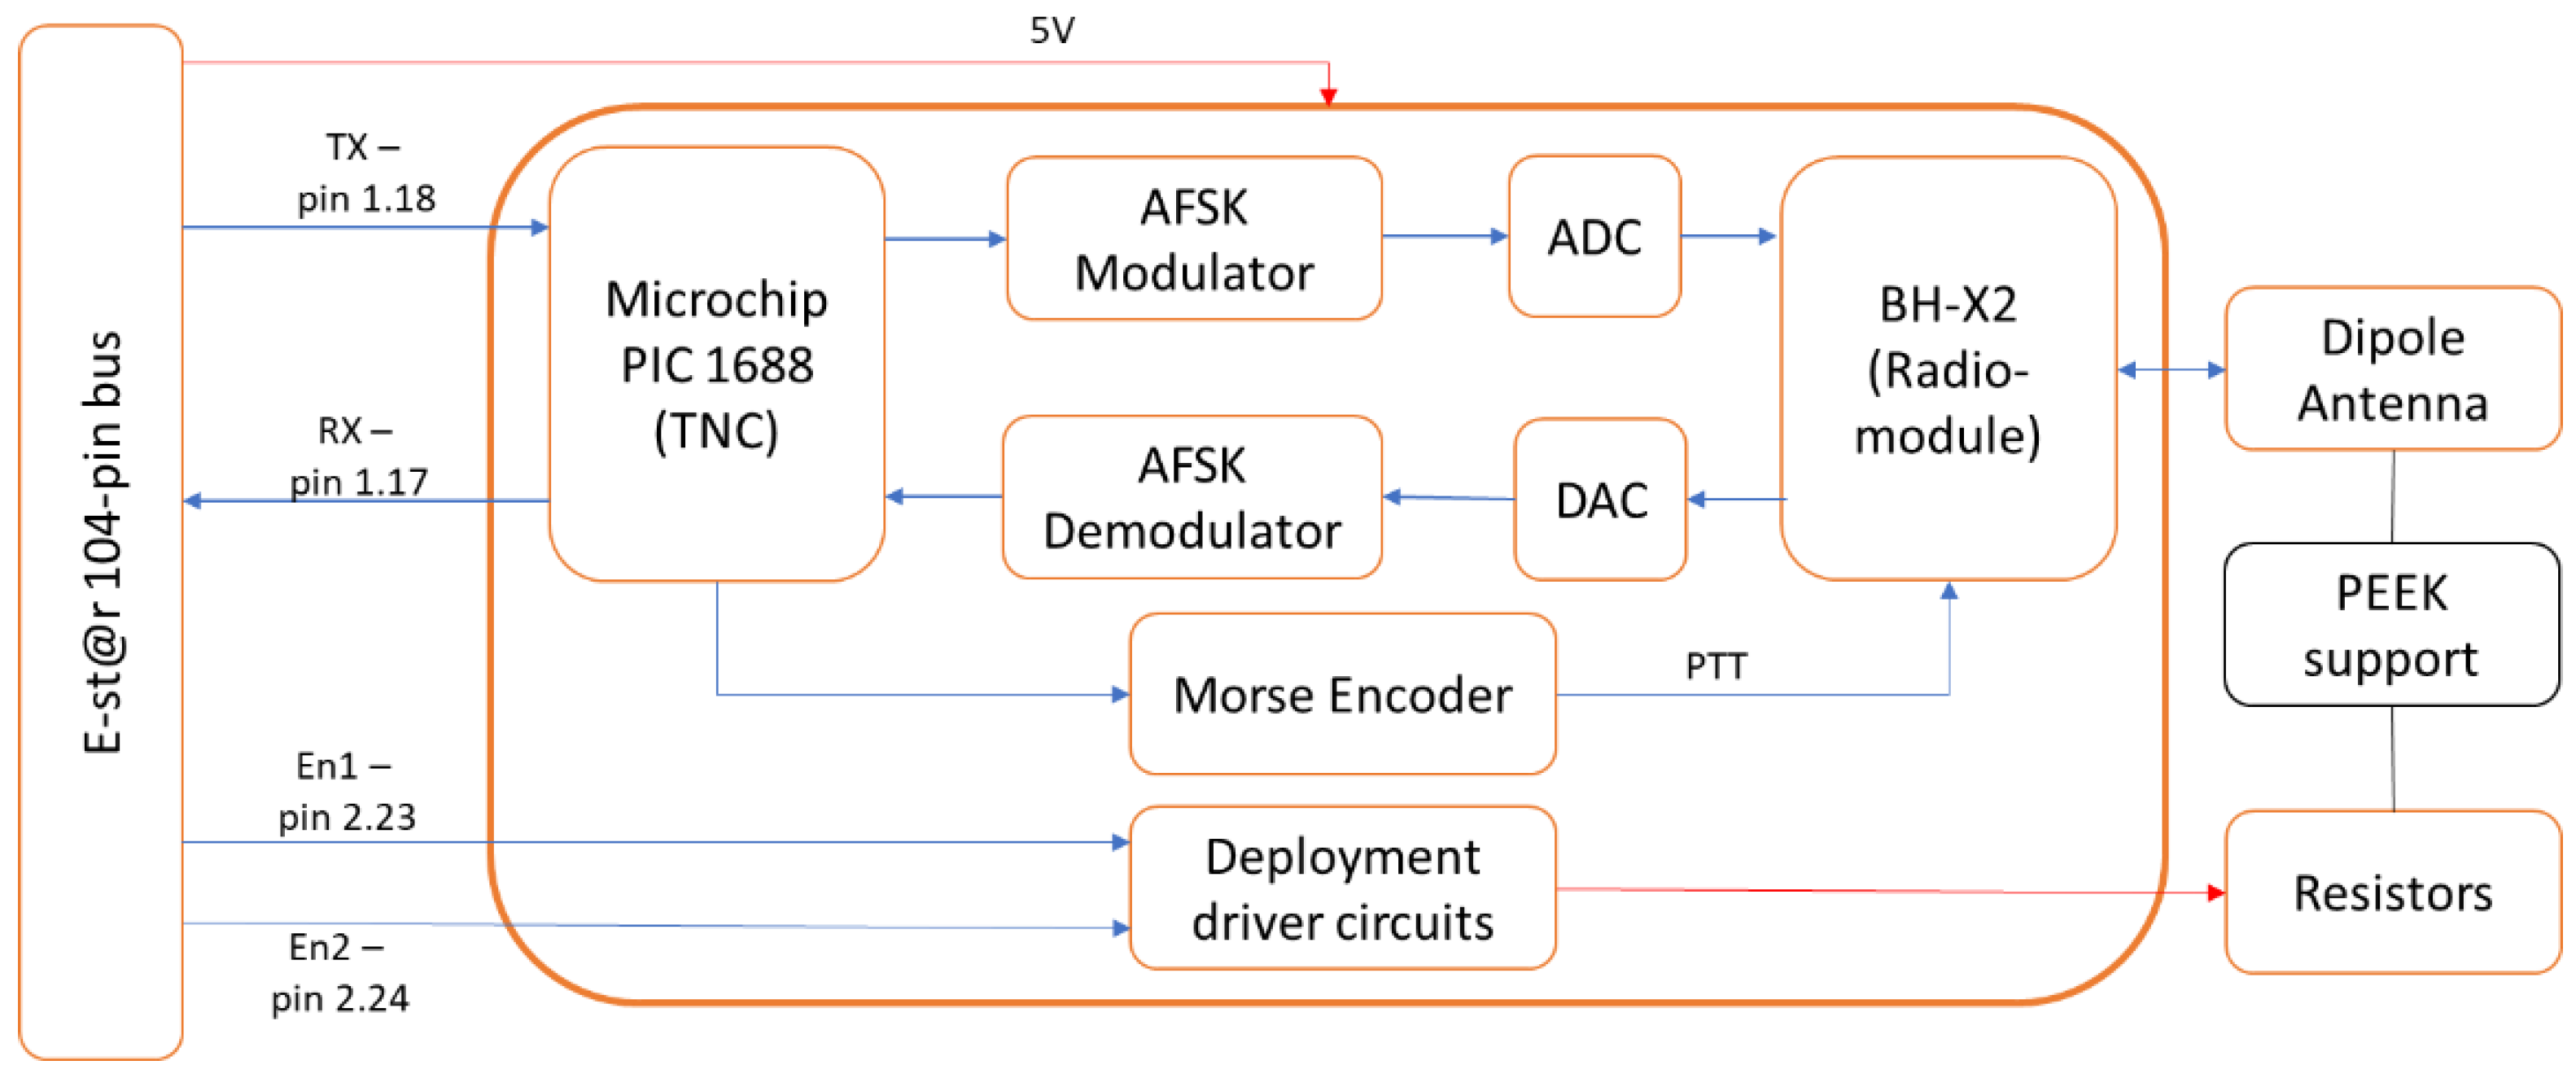
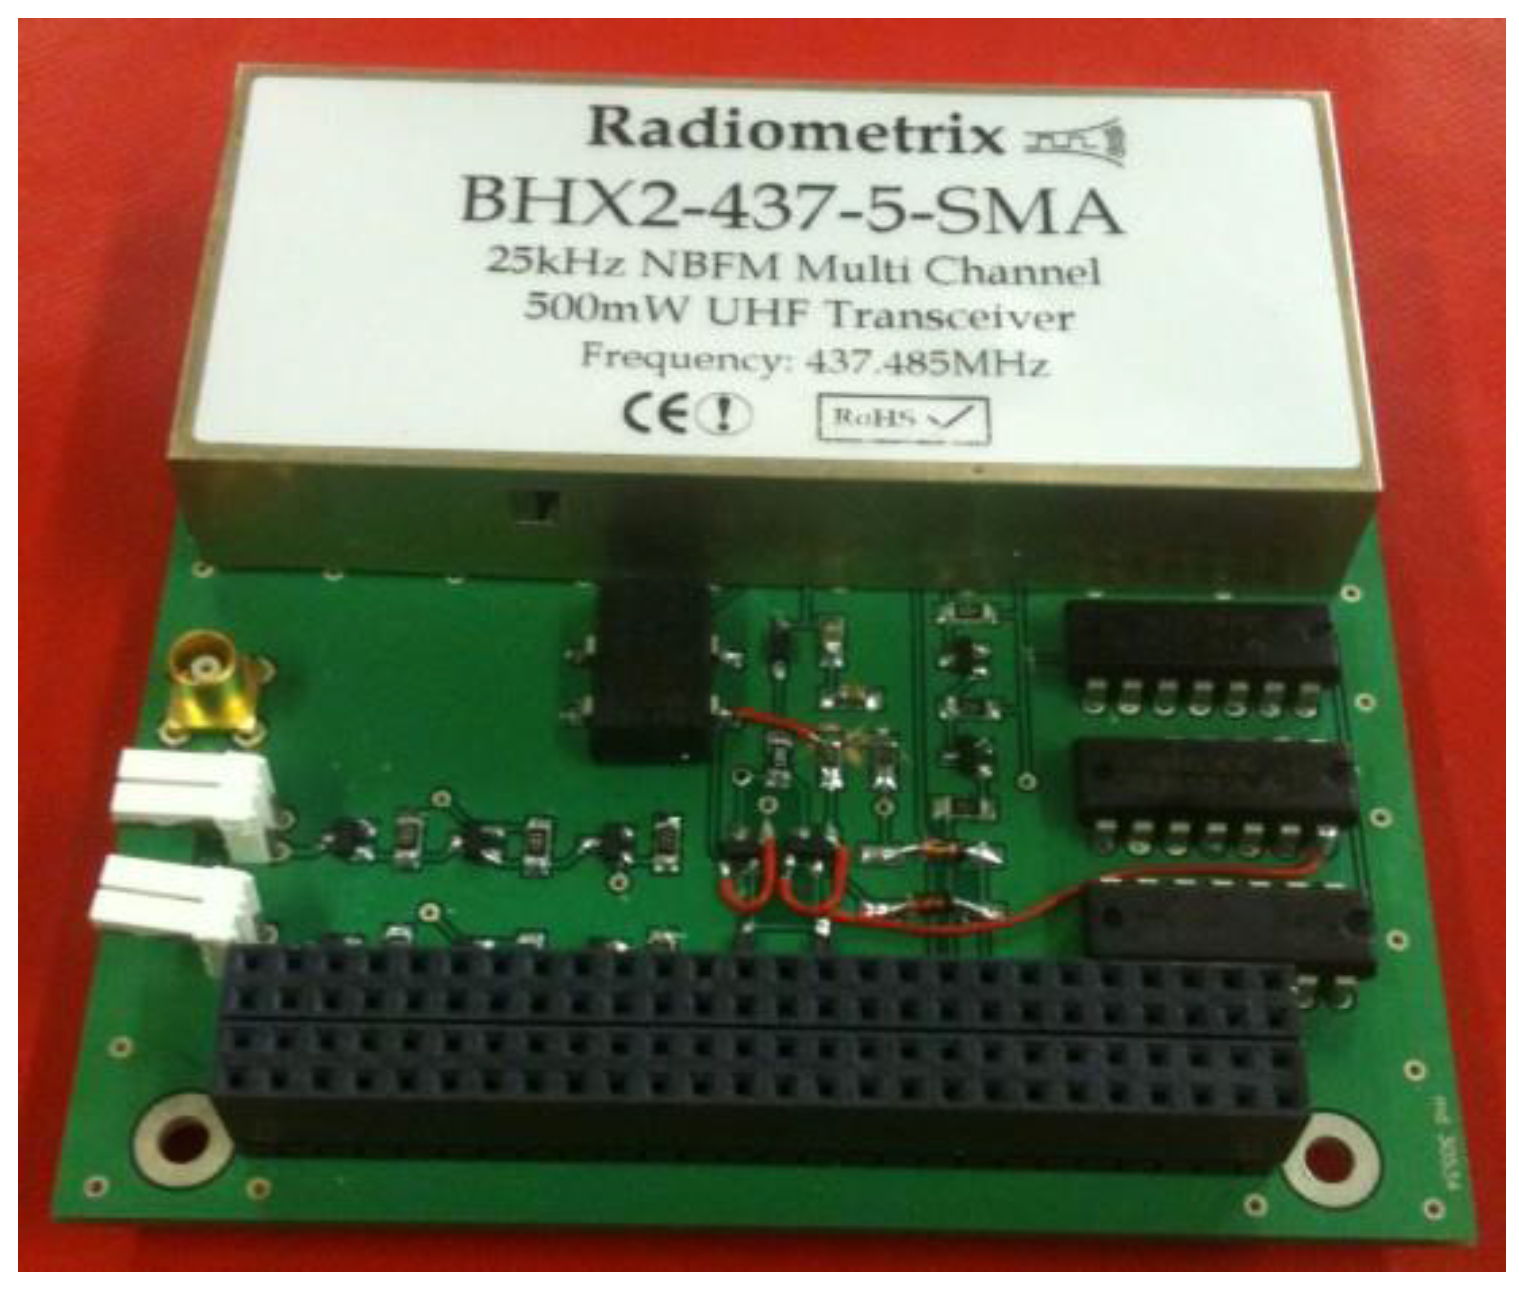
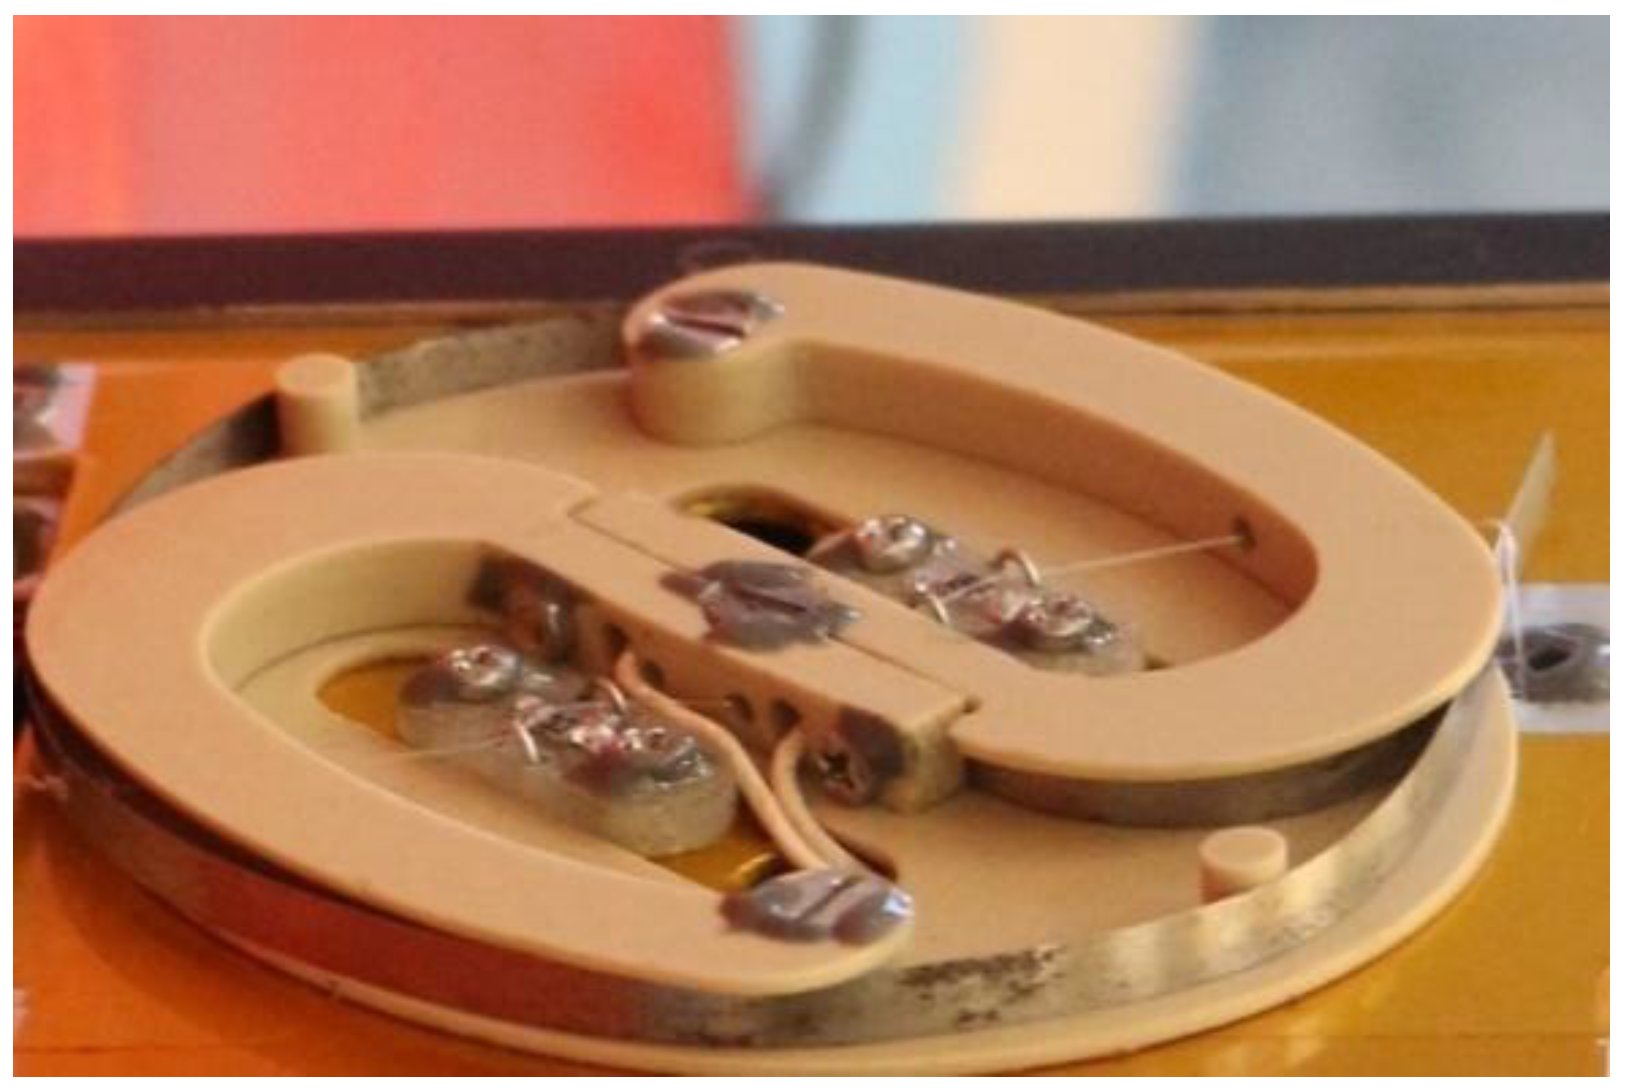
3.2. Description of the System

While the overall satellite description is available in [36], this paragraph is focused on the description of the communication system (COMSYS) since the anomaly is related to communications. In fact, the low level of the signal can be ascribed to one of the components of the communication system, as shown in the next sections. That is also confirmed by the telemetry obtained when the signal is decoded on ground: in fact, all the data about the other subsystems (such as battery status, solar panel status, bus consumptions) are nominal.
The COMSYS provides the interface between the satellite the and ground segment. Payload mission data and satellite housekeeping telemetry pass from the spacecraft through this subsystem to operators and users. Commands from the ground segment pass through the COMSYS for controlling the spacecraft and operating the payload.
The COMSYS (1) receives and demodulates commands, (2) modulates and transmits telemetry, (3) detects own faults and establishes the emergency communications, (4) handles the antenna deployment system, and (5) provides its health and status telemetry to the OBC [36].
The COMSYS operates in UHF at frequency of 437.485 MHz; the signals use AFSK modulation (FSK-FM with 1200 Hz or 2200 Hz subcarrier tones) and at the data rate is 1200 bps for both uplink and downlink. The data link layer protocol is the popular radio amateur AX.25 which has been selected for the compatibility with standard radio amateur stations, whose support to the mission is essential to collect as many data as possible thanks to the worldwide coverage.
Figure 4 reports the block diagram of the subsystem. It includes the AFSK modem, the 500 mW power output transceiver (or radio module), the dipole antenna and its deployment system, and the interfaces to the satellite bus that provide the data interface through a serial line with the On Board Computer (OBC) and the power lines (at 3.3 and 5 V) from the Electrical Power System (EPS). The interconnections are represented in black for mechanical interfaces, blue for digital and analog signals, and red for power lines.
A single electronic board (Figure 5) hosts the following items: the UHF radio-transceiver from Radiometrix Ltd. (model BHX2); the Microchip PIC16F88 microprocessor that acts as a complete Terminal Node Controller (TNC), implementing all the modem functions and protocol adaptation to interface the radio and the OBC; a watch-dog electronics for fault detections; and a crystal oscillator and electrical devices to amplify and filter the signal, and to support the microcontroller operations.
The deployment system is composed by a dipole antenna (made of two 17-cm-long arms) folded on an elliptic support and constrained by means of a fishing line. In detail, the antenna deployment system is composed of two parts: the S-shaped support, manufactured with Peek, that hosts the dipole antenna and two resistors installed on FR4 plates, which acts as cutters (i.e., after its activation they warm up and they cut the wire that folds the antenna. The peek support is fixed with screws to the X face of the structure (see the body frame definition in Figure 6), and two small terminal strip boards hosting the resistors (1 ohm @ 1W) are mounted on the same face of the peek support assembly.
Figure 7 shows the CAD model of the antenna deployment system, and Figure 8 shows the final assembly of the antenna deployment system on the flight module.
In order to command the deployment, an electrical circuit has been designed: the OBC sends a command signal through the e-st@r-II bus on pins H2.23 and H2.24 (alternatively, every 10 seconds, two times for each lines). These signals command a series of MOSFETs that permits the battery current to flow into the resistors (the power is taken directly from the battery bus). The resistor is sized to accept a quantity of electrical power lower than the delivered one and starts to heat up. The heat is used to burn and cut the fishing wire, thereby allowing the antenna to be unrolled and deployed. Figure 9 shows the functional block diagram of the antenna deployment system.
The electrical circuit is physically located on the COMSYS board and is shown in Figure 10. The two circuits are identical. The alternating use of the circuits allows for the alternate activation of each resistor. This solution guarantees a complete deployment of the antenna, even if a circuit suffers a failure.

3.3. Problem Definition

Considering that, given the same orbital conditions, the signal is received and decoded correctly by stations with high-gain antennas and it is received but not decoded by any “standard” station, it is possible that the anomaly is related to a low value of the Effective Isotropic Radiated Power (EIRP) and, more generally, to the power flux density, which is defined in Equation (1) and Equation (2).
W f   [ dB ] = EIRP + L p r + L a + L s
E I R P   [ d B ] = P t + L t + G t
where Pt is the High-Power Amplifier (HPA) output power, Lt is the attenuation of the signal due to cables, filters, and other equipment along the line between HPA and the transmitting antenna, Gt is the antenna gain, Lpr is the signal attenuation due to the incorrect pointing of the antenna, La is the attenuation due to the atmospheric phenomena (e.g., ionospheric scattering and distortion and polarization mismatch), and Ls is the attenuation due to the distance (or slant range) between satellite and the ground station.
Radio-amateur ground stations normally receive signals and decode packets from satellites with EIRP equal or lower than the one expected from E-st@r-II. This supports the hypothesis that the anomaly is generated by the misbehaviors of on-board elements or it is related to environmental conditions.
Considering the terms in Equation (1), the analysis disagrees with the notion that the atmospheric conditions and the slant range can be considered as possible causes because the anomaly occurs both for low and for high elevation passes of the satellite over the ground station and with different condition of clouds and rain, during the night and during the day (i.e., for different ionospheric conditions). On the contrary, other possible causes of the anomaly are identified:
  • Incorrect pointing of the CubeSat antenna: Lpr is higher than the estimated.
  • HPA failure: Pt is lower than 500 mW.
  • Low antenna gain and/or inconsistent beamwidth/radiation pattern: Gt is lower and/or the radiation pattern is not conical (absence of an evident main lobe and presence of more and substantial side/back lobes).
  • Faulty connection between transceiver and antenna: Lt is higher than expected.

4. Verification Campaign

The four possible causes are investigated through dedicated verification campaigns with the objective of identifying the actual root cause of the anomaly. The verification activity includes analysis and tests on engineering models of equipment and subsystems. The strategy is: (1) to quantify the impact of each cause in order to assess the level of attenuation caused with respect to the expected value in the nominal case, (2) to assess the origins of each cause, (3) to identify the most probable cause or combination of causes that led to the anomaly, and (4) to recommend possible actions to recover the anomaly or to mitigate/reduce the effects of the anomaly.

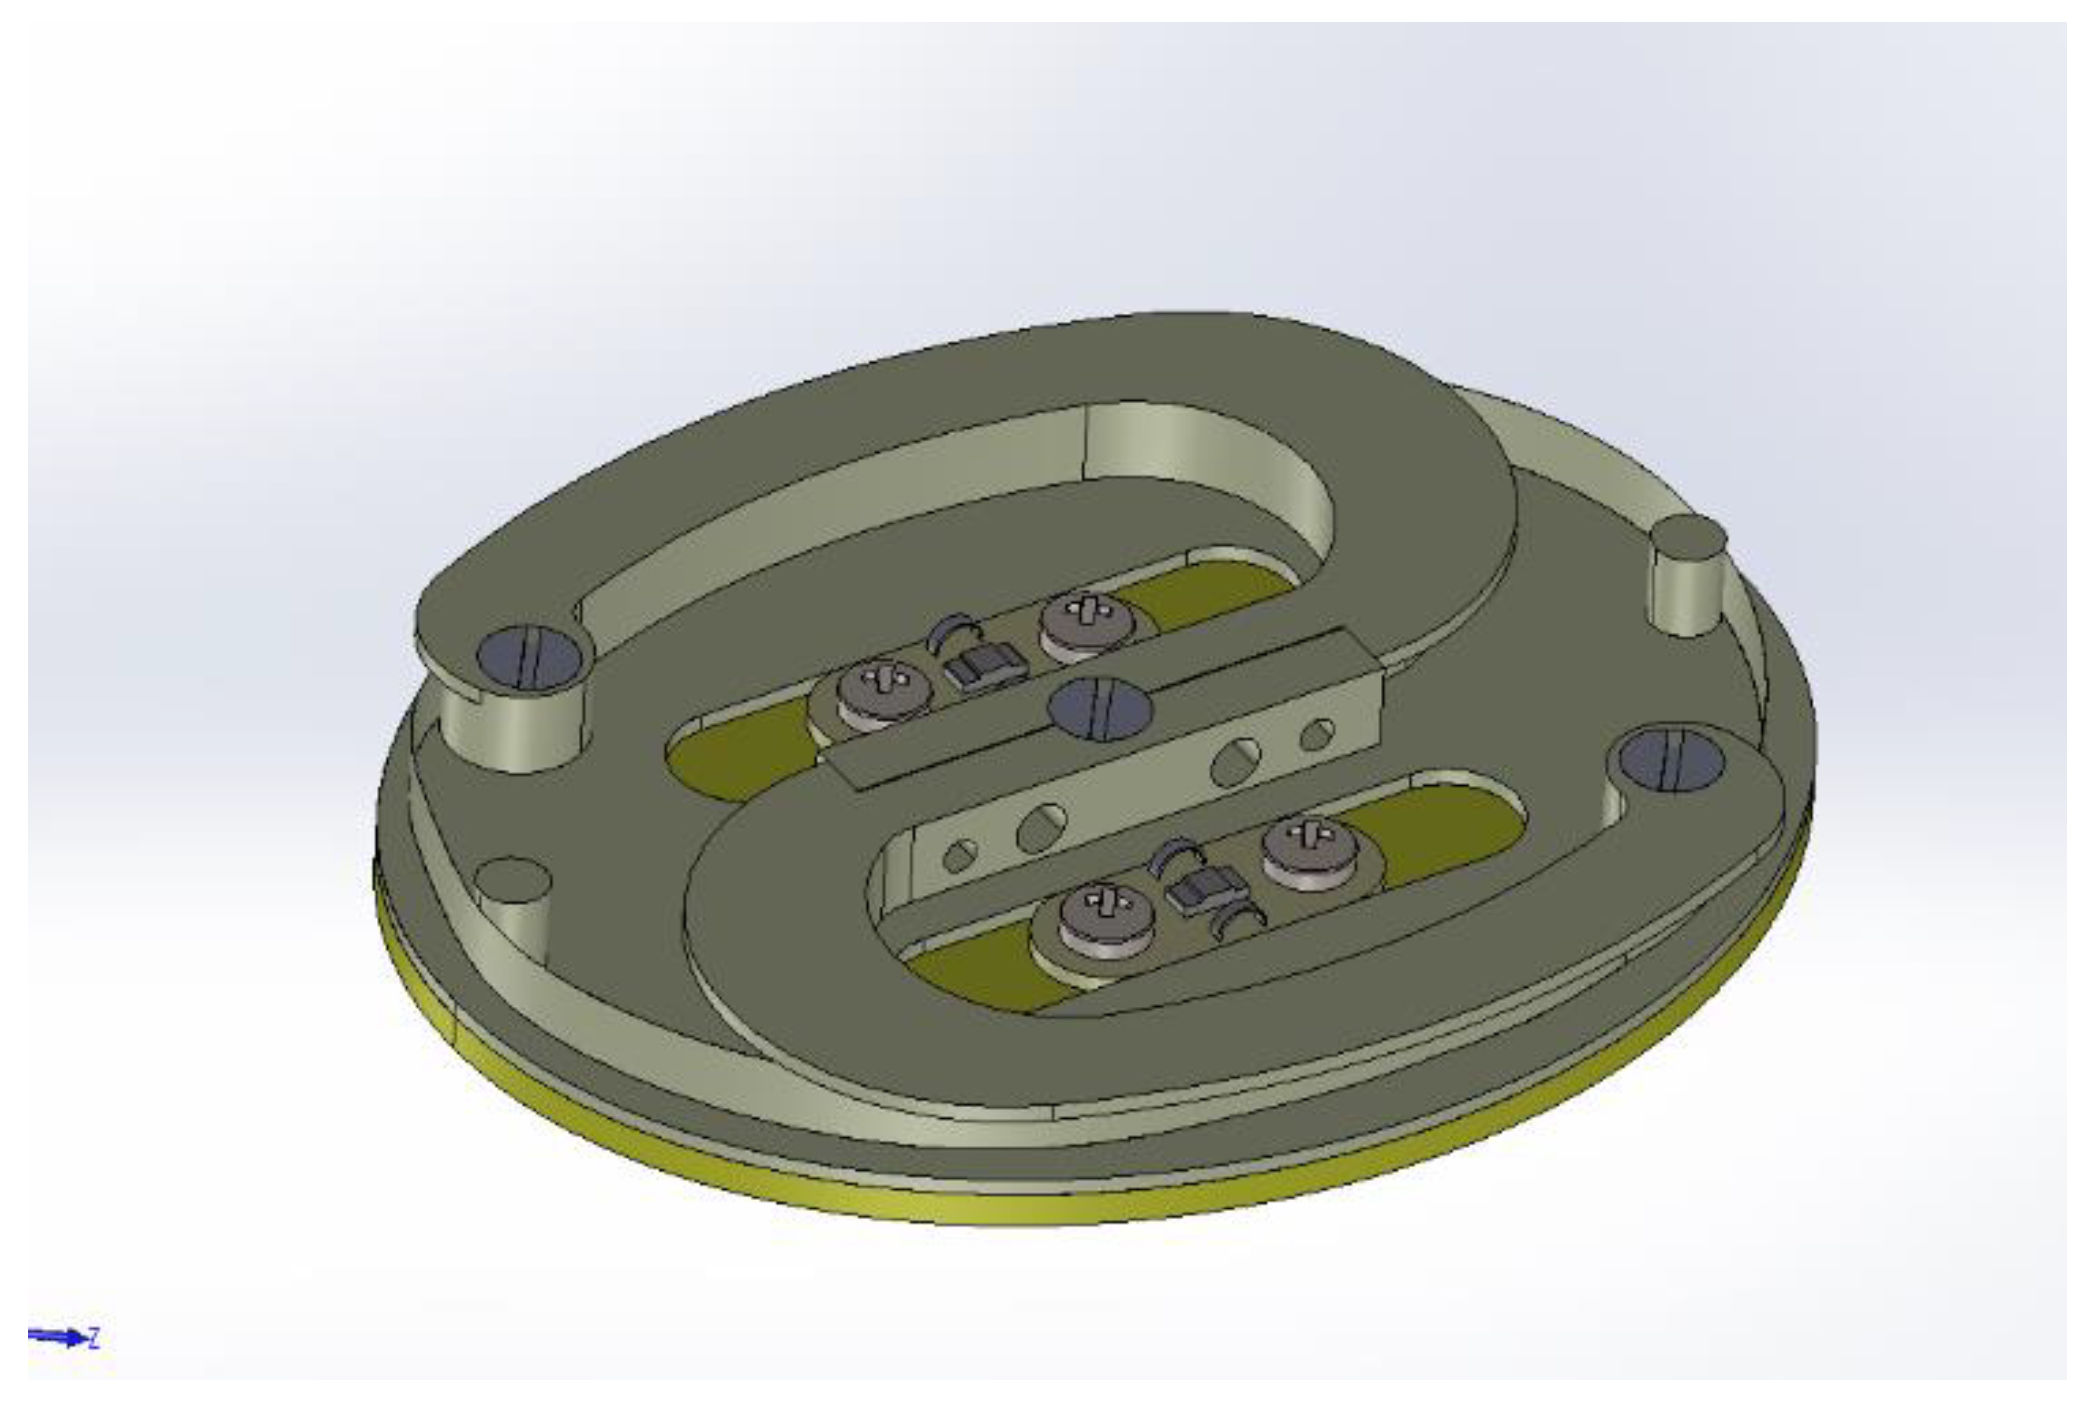
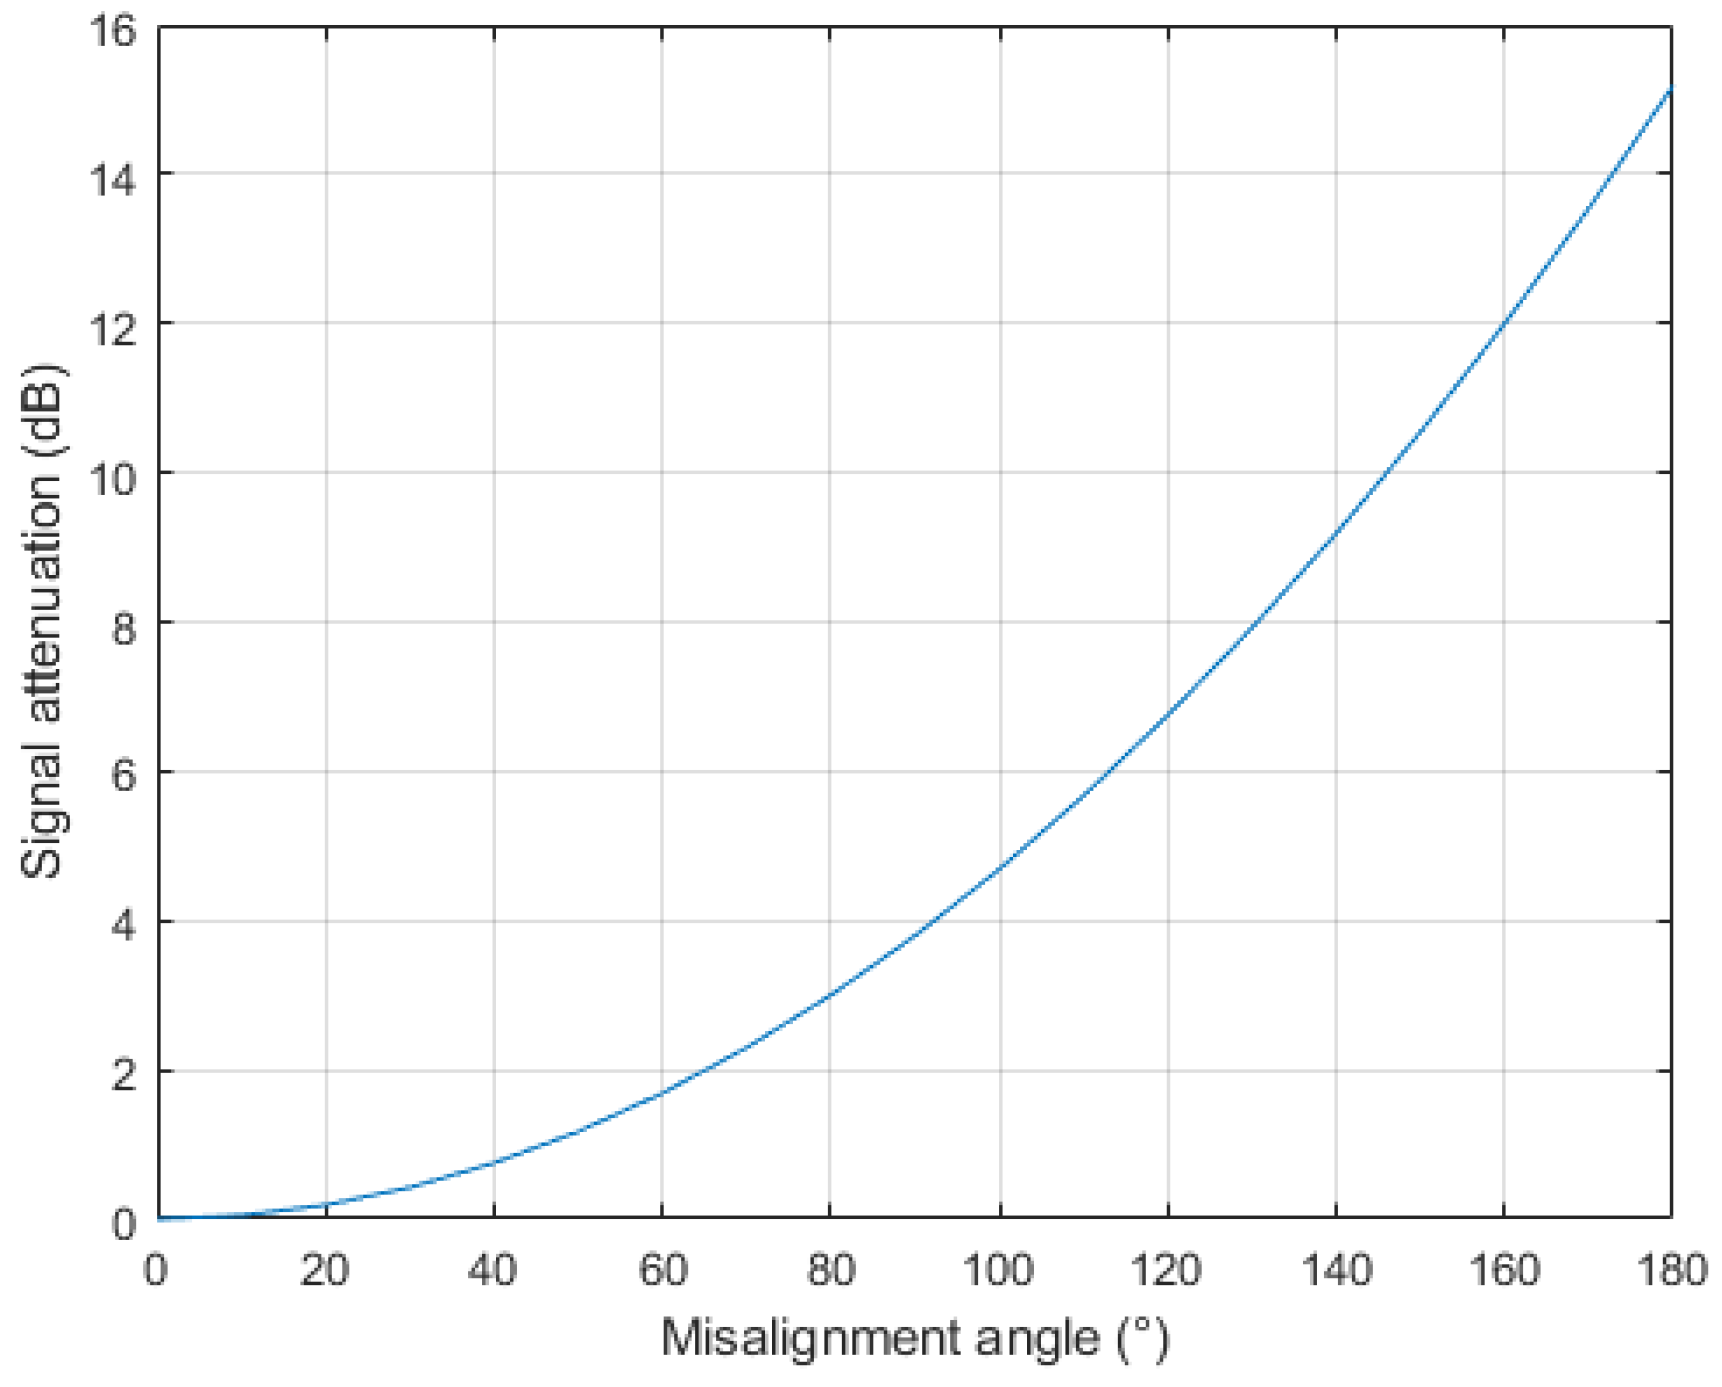
4.1. Incorrect Pointing of the Antenna

The incorrect pointing of the antenna is assessed through the theoretical analysis of the signal attenuation for different pointing error. This attenuation can be estimated using Equation (3).
L p r [ d B ] = 12 · ( p o i n t i n g   e r r o r [ d e g ] b e a m w i d t h [ d e g ] ) 2
Knowing that a dipole beamwidth is about 160 deg, Figure 11 shows how a high misalignment generates an attenuation that can either prevent the reception of the signal on ground (if the antenna has a pointing close to the zenith) or reduce the signal strength which reduces the signal to noise ratio and therefore complicates the decoding process..
The incorrect pointing of the satellite antenna can be related to tumbling motion of the satellite or to the wrong active control of the satellite attitude. The tumbled motion derives from the velocity of release from the deployer, disturbance torques, and the missed activation of the Attitude Determination and Control System (ADCS) or the failure(s) of its components.
The telemetry data from orbit confirm that the satellite has a slow tumbling motion (less than 2 deg/s around each axis, measured by the Inertial Measurement Unit—IMU) if no attitude control is active. Considering that the ADCS is deactivated for long periods of the mission (the ADCS is the experiment on board e-st@r-II), the incorrect pointing of the antenna could be a cause of the anomaly. However, when the satellite angular velocity is dumped by the active ADCS down to 0.05 deg/s, no significant increase in the signal strength was observed. Moreover, it is very unlikely that the satellite never pointed towards the ground antennas during its mission.
To conclude, the incorrect pointing of the satellite antenna (which is a dipole antenna with a wide beamwidth) causes a reduction in the signal strength, but the pointing inaccuracy cannot justify the constant attenuation of the signal.
This conclusion moves to concentrate the investigation efforts on the on-board communication transmission line—it means that the anomaly is more probably caused by a low value of EIRP.

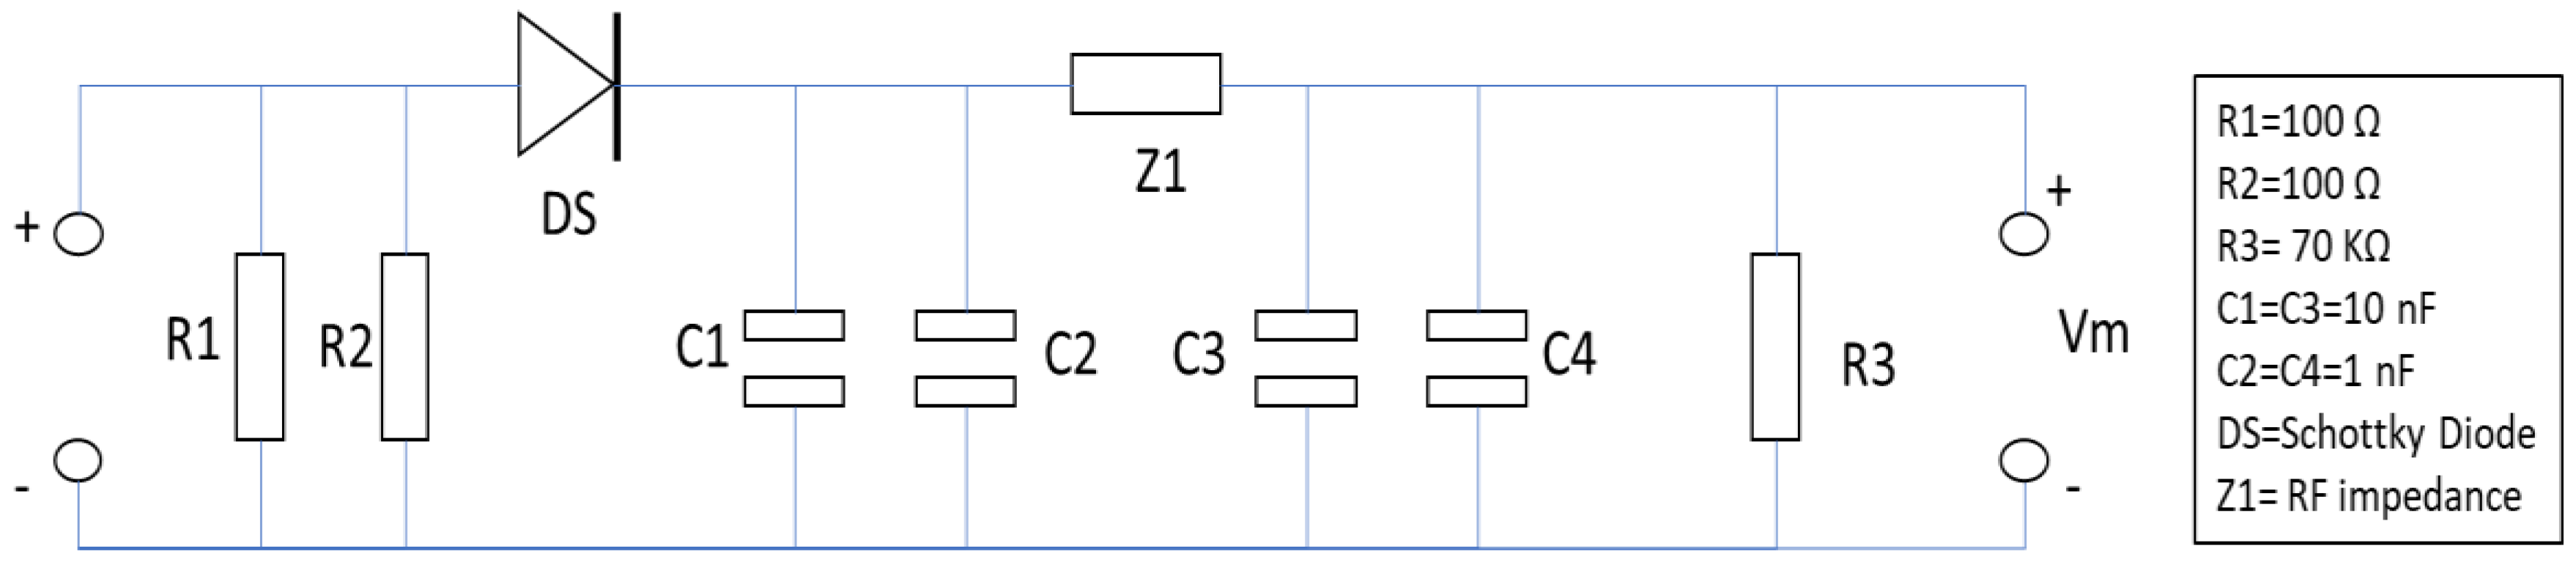
4.2. High-Power Amplifier Failure

The HPA is part of the COTS radiomodule mounted on the COMSYS board. The datasheet of the radiomodule does not report degraded/reduced Radio Frequency (RF) output attenuation due to optional settings, excluding the fact that a reduced output power derives from the specific operative mode.
On the contrary, a fault during the production phase of the radiomodule not identified during the AIV campaign cannot be excluded. For this reason, tests have been conducted on spare radiomodules belonging to the same batch.
Figure 12 shows the test set-up. In order to measure the output power of the transmitter, a load probe is adopted that reports a voltage proportional to the generated power of the generated RF signal. The probe input has two 100-ohm resistors (R1 e R2) in parallel, which provide the 50 ohm of a high-frequency standard load (Rl), the Schottky diode rectifies the output, allowing one to read the d.c. voltage on the output of the probe (Vm). When the transmission is enabled, this voltage is proportional to the output power of the transmitter according to Equation (4).
P t [ mW ] = V m 2 [ mV ] R 1 [ ] + R 2 [ ]
The results in Table 1 confirm that the radiomodule approximately produces the expected 500 mW power signal. However, no test was performed for the verification of the RF output power of the flight unit.
Finally, a single event phenomenon could have permanently compromised the HPA line of the BHX2, but it would mean that the radiation hit the satellite in the first 30 min after the release or during the launch phase. The occurrence of this event is very unlikely, also because the satellite did not pass over the South Atlantic anomaly, nor in the Van Allen belts in the first hours of the mission (orbit analysis has been done to verify this hypothesis). The effect of other environmental factors could be excluded because the satellite successfully passed the extensive environmental test campaign during which the COMSYS showed no issues [37]. To conclude, the possibility of the HPA failure has been excluded from possible root causes of the anomaly.

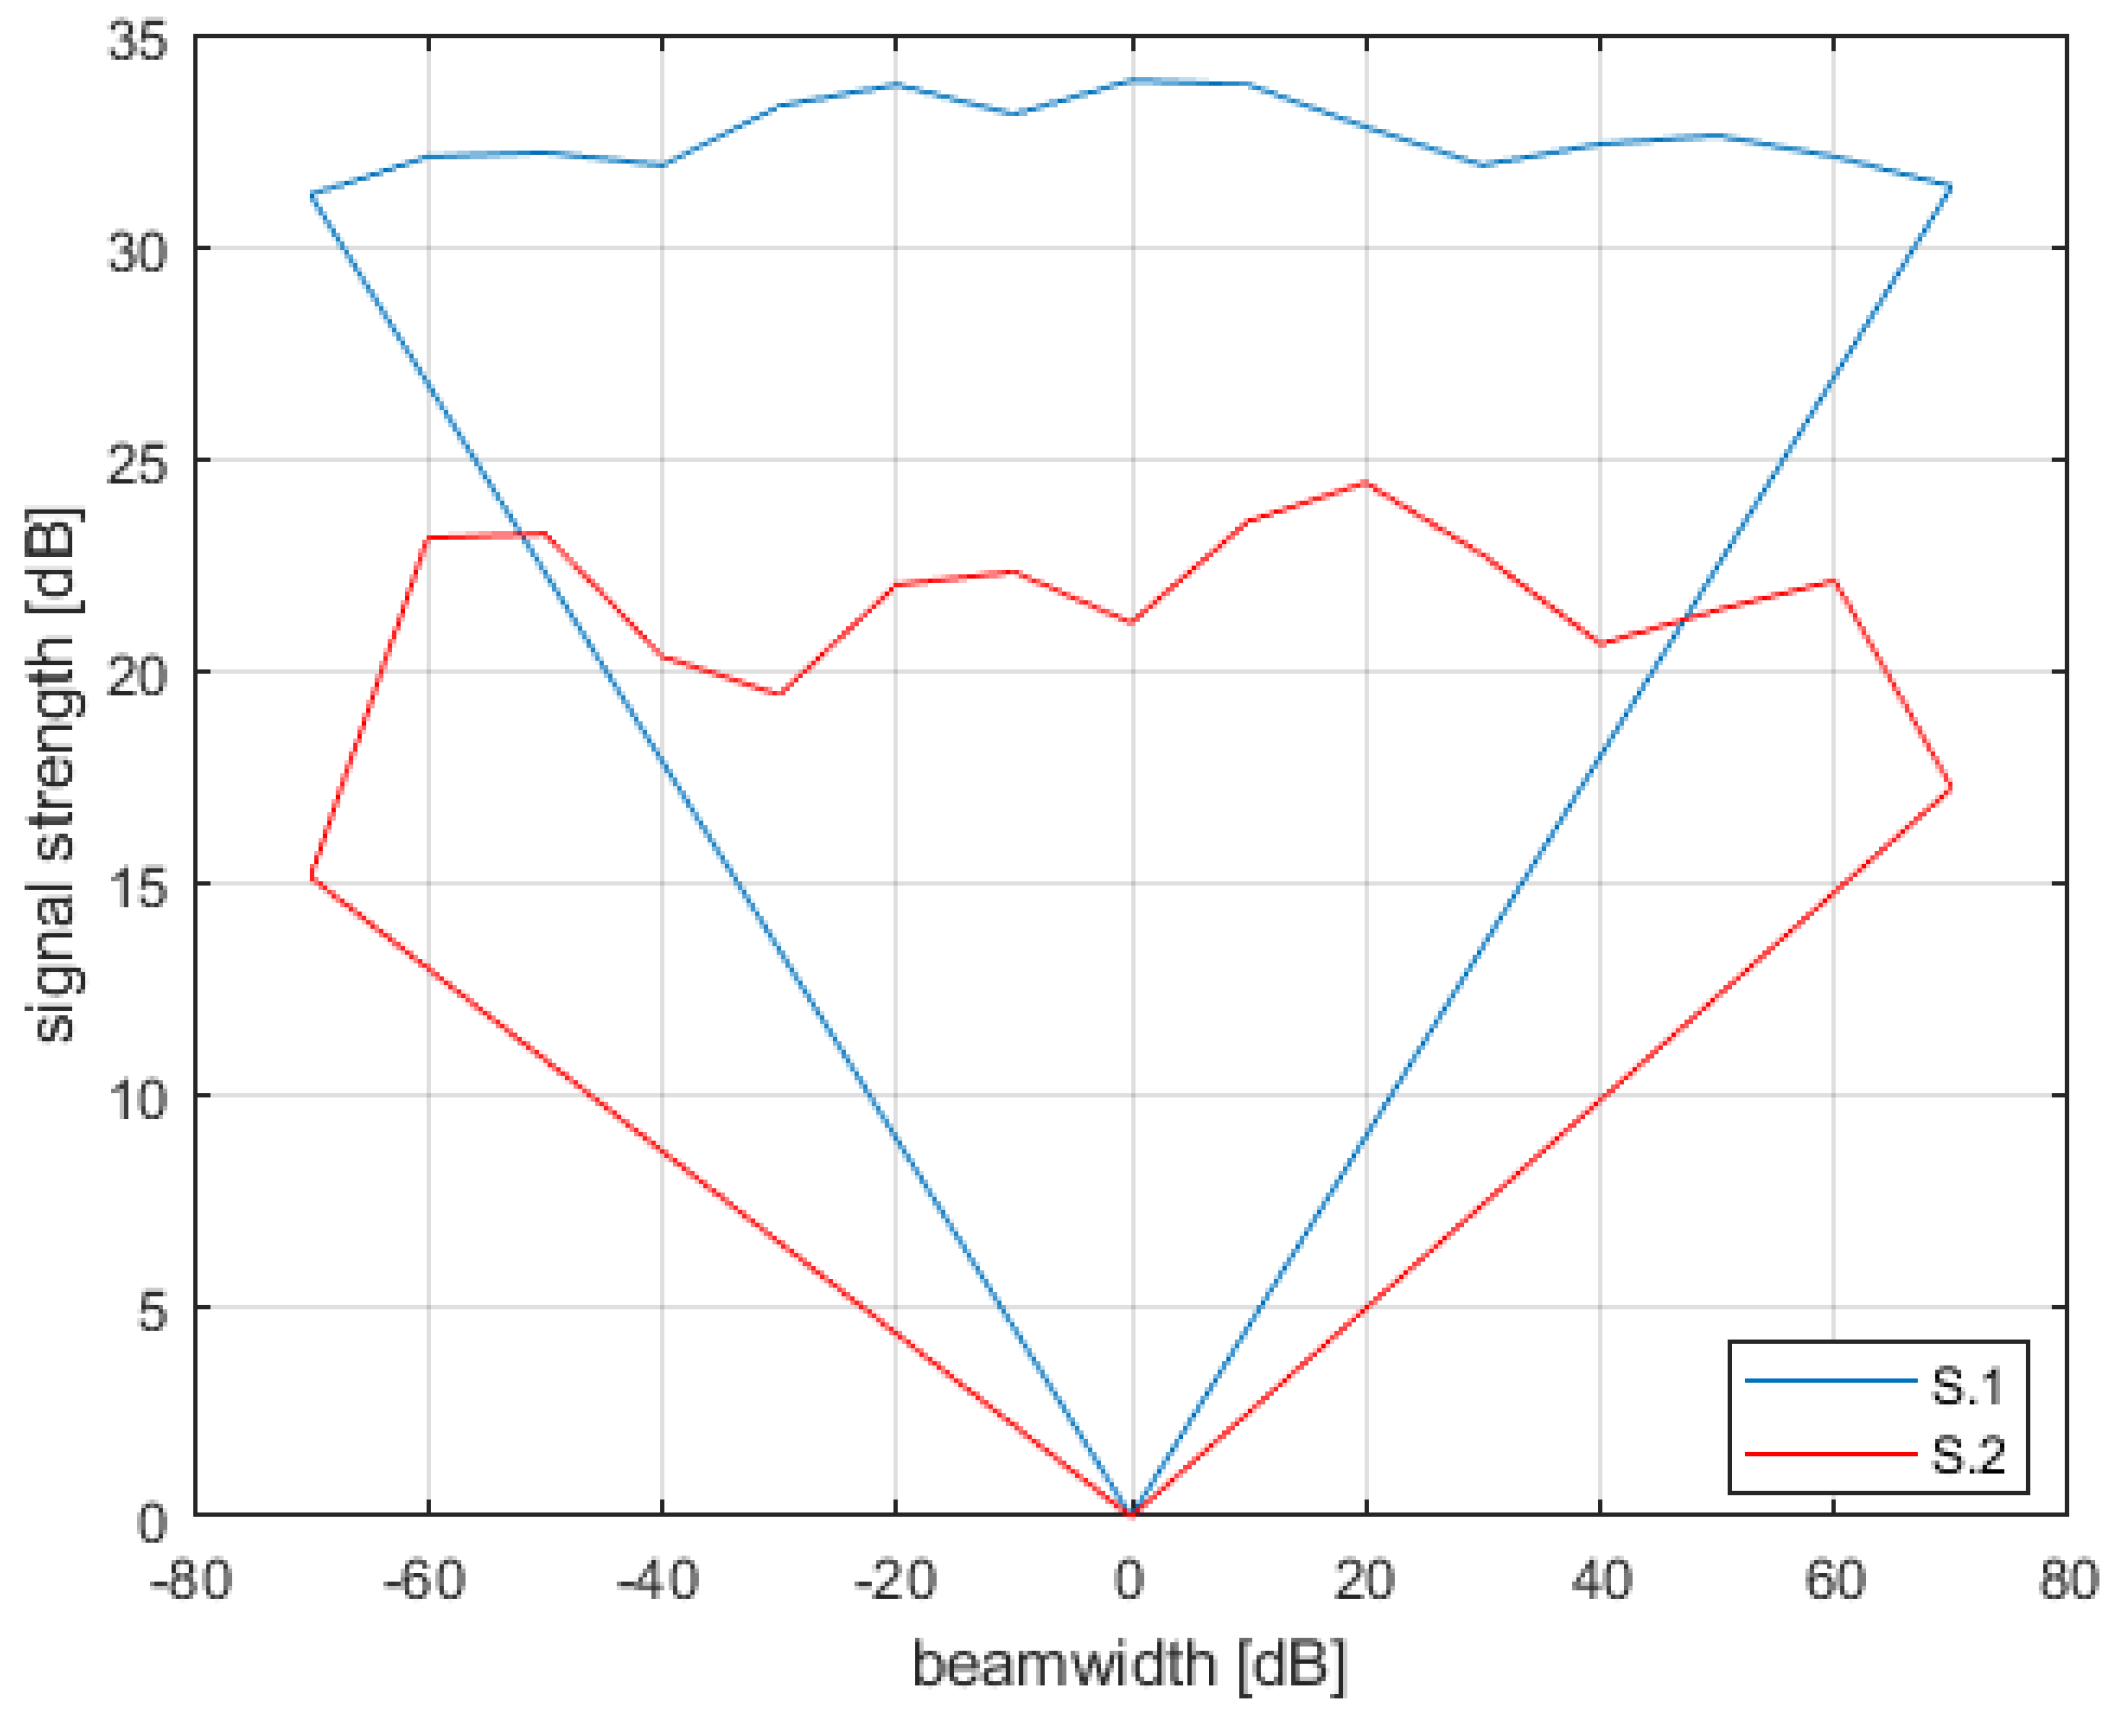
4.3. Low Antenna Gain

The reduction of the antenna gain and/or an inconsistent radiation pattern can be caused by an incorrect deployment of the antenna. A set of tests had been performed to quantify the level of the output signal in different configurations of the antenna.
The first test conducted on the COMSYS EM aimed to verify the signal power in the following configurations: C.1) Nominal Condition: antenna deployed, C.2) Off-nominal: antenna not deployed (i.e., in the stowed condition, rolled on the support), C.3) Off-nominal: no antenna (i.e., antenna is disconnected from transceiver).
The test highlights a difference from 14 to 18 dB between the signal sent with the antenna deployed and the signal with the antenna not deployed. No signal is received without the antenna. While the disconnection of the antenna can be excluded, the missed deployment of the antenna could partially explain the anomaly. The link budget made in Phase C estimates a link margin of 7 dB for downlink communication. The measurements taken in the test cases (C.1. and C.2., reported in Table 2) present a difference that would have led to a complete absence of the received signal and not to a low but existent signal. Beyond this consideration and since the performed tests could give too rough results, further tests have been performed on the antenna deployment system.
The antenna deployment system has been investigated. There are two redundant circuits by design. It means that two independent circuits can cut the fishing wire (see Figure 8). During the qualification and acceptance campaign conducted at ESTEC (European Space Research and Technology Centre), no failures occurred on the antenna deployment system, which means that the antenna was successfully deployed during the test in ESA-MARSIM (MARs SIMulator) thermal vacuum chamber (Figure 13) with the vacuum condition with a pressure of P ≤ 5 × 10⁻⁵ mbar and the coolest conditions (i.e., temperature of −5 °C). The details of the qualification campaign in thermal vacuum chamber are in [38].
However, a test campaign was performed as part of this investigation using spare parts of the satellite: the engineering models of the EPS board with batteries, the OBC board, and the COMSYS board are assembled in the spare 1U structure together with the prototype of the antenna system. The test aims to simulate the first 45 min of the e-st@r-II mission that includes the antenna deployment task.
For the tests in laboratory condition, the procedure foresaw that: (1) the antenna was enrolled on the peek support and blocked and a thermocouple was installed on the peek support to measure the laboratory temperature (TL), (2) the satellite is activated simulating the release from the dispenser (i.e., the mission time is 0 s), (3) after 30 min, the deployment should occur, (4) two minutes after the deployment, the first packet should be received from the ground station, (5) the satellite is switched off and the mission time reset.
A second set of tests was conducted in a relevant environment, using an Electra Challenge 250 thermal chamber located at Politecnico di Torino. The chamber allows one to reach the established hot (+50 °C) and cold (−20 °C) temperatures. The rate of change of temperature are:
  • Upward: 3.9 °C/min. from −40 °C to + 180 °C
  • Downward: 2.5 °C/min. from + 180 °C to −40 °C
Temperature is monitored by means of thermal chamber thermistor (which measures the temperature of the chamber, Tch) and a thermocouple placed on one of the resistor boards and connected to a multimeter (TTC). The procedure foresaw that: (1) the antenna was enrolled on the peek support and blocked, (2) the satellite is placed in the chamber, the chamber door is closed, (3) when the chamber temperature reaches the temperature of −20 °C (or +50 °C), the satellite is activated, (4) after 30 min, the deployment should occur, (5) two minutes after this, the deployment of the first packet should be received from the ground station, (6) the satellite is switched off and chamber is opened, and (7) the mission time reset.
Ten deployment tests have been made in laboratory conditions: in four tests both the lines are connected, in three tests line 1 is disconnected, and in the other three tests line 2 is disconnected, in order to simulate also off-nominal conditions. Then, six tests have been repeated in different thermal conditions (three in cold conditions and three in hot conditions), simulating both nominal and off nominal conditions.
All the attempts are successfully completed, as reported in Table 3.
If the redundant design and the full success of the qualification campaign already ascribed a low probability to the failure of the mechanism, these additional tests increased the confidence level on the probability of the correct deployment of the antenna in orbit.
However, the second cause of failure has been considered on the deployment: the fishing wire could have been in a wrong position so that it did not touch both resistor A and resistor B. This event could have occurred for the wrong closing of the wire or for a displacement of the wire during the launch. However, the picture in Figure 8, taken immediately before the satellite integration in the deployer, leads to the exclusion of this event. Regarding the possible displacement of the wire during launch, the design includes two small rings that limit the movement of the wire up to few millimeters. Moreover, the wire never moved from the correct position during the vibration tests conducted for qualification and acceptance.
The partial deployment of the antenna could also be one of the causes of a low gain. This event has been excluded because it can only occur as a consequence of multiple failures with a low probability of occurrence.

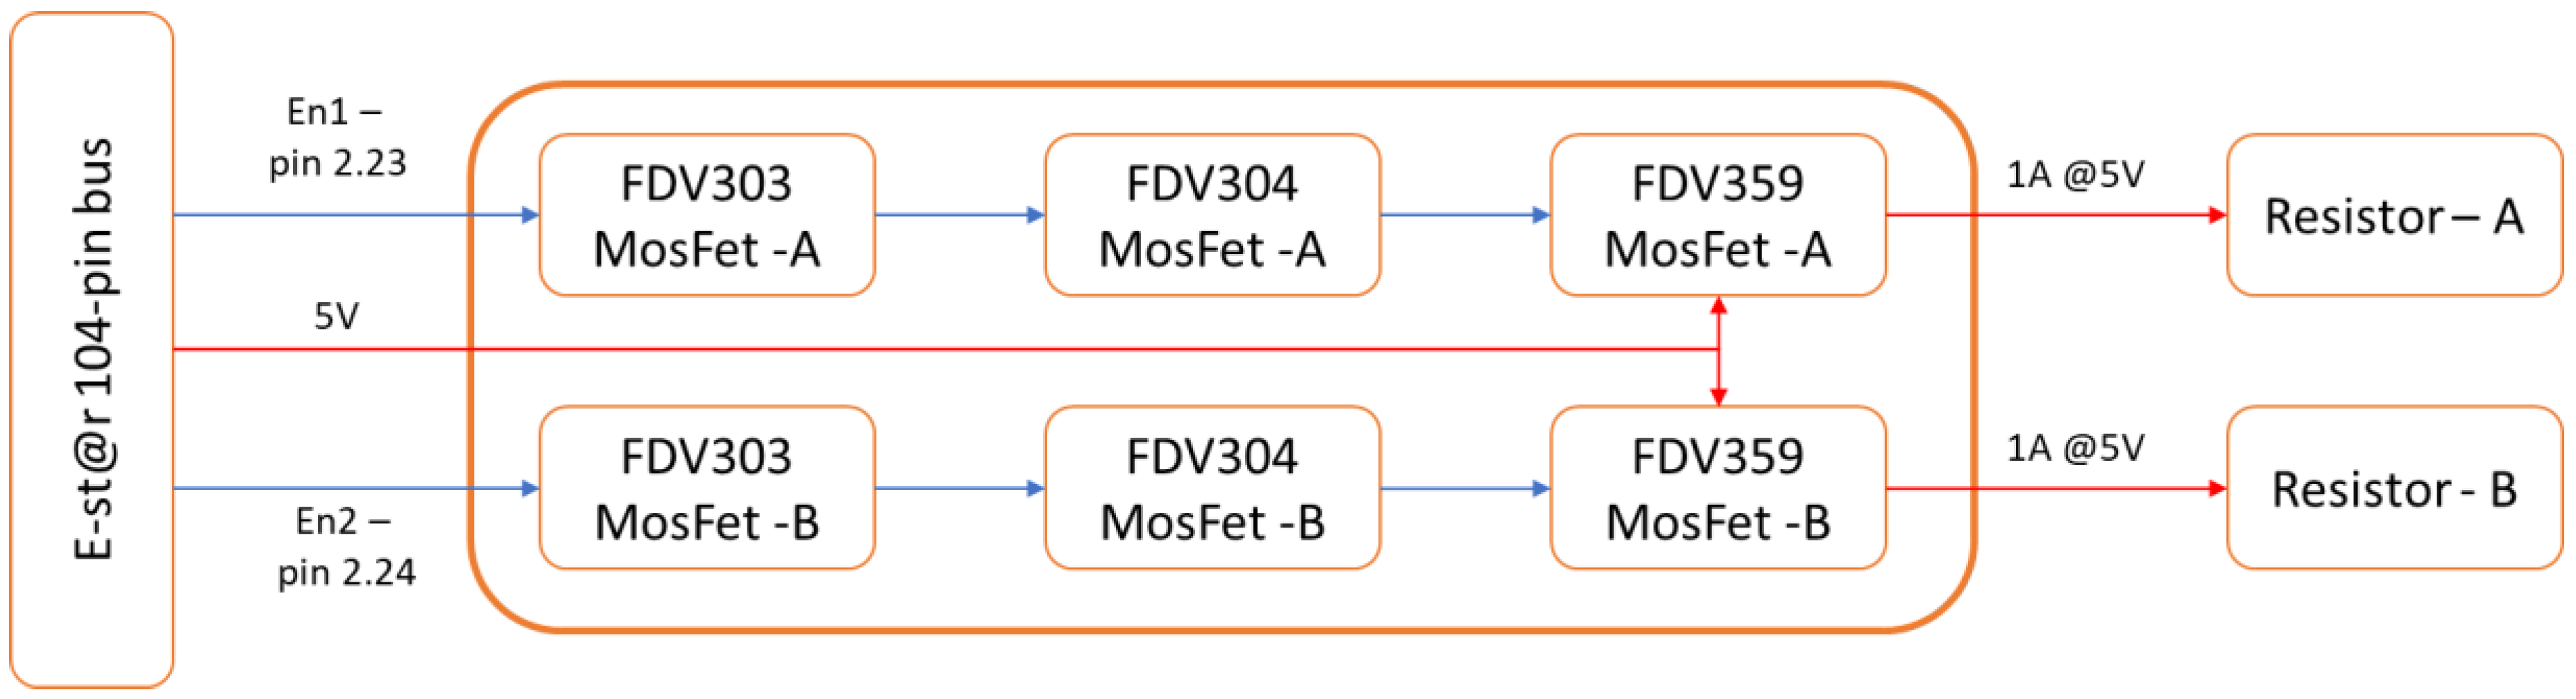
4.4. Incorrect Connection between Transceiver and Antenna

The fourth scenario for completing the investigation about the observed anomaly considers the connection between the antenna and the transceiver. In this scenario, two possible issues can be identified: a wrong connection and an excessive attenuation along the coaxial cable. The investigation starts with the review of the documentation. In particular, the assembly procedures and evidence (e.g., pictures) of the integration process have been analyzed.
The coaxial cable connecting the antenna to the transceiver needed to be lengthened following a problem discovered during the final integration. The picture in Figure 14 shows the joint of the cables.
As it can be seen, the coaxial cable is split into two non-coax wires, which are more flexible and could be bent as needed for soldering to the antenna. Unfortunately, the attenuation caused by these wires is higher than expected. In fact, these cables have poor shielding and, also, they have been twisted during assembly, causing multiple reflections of the signal.
The investigation of the actual consequences of this incorrect connection included both analysis and tests.
The analysis aims at assessing the mismatch of the impedance between the power amplifier and the antenna. The cable length may create a very large impedance mismatch at the UHF frequency, such as forming a quarter-wave transformer to an open or short circuit, which would have a very high reflection loss. Just assuming negligible cable losses, considering a 50 Ohm target impedance for all three components (HPA, cable and antenna) with 50% uncertainty, the maximum impedance mismatch between all elements may lead to 2 dB loss. Adding 10 Ohm for cable impedance, the loss would rise to 6 dB. These values of attenuation justify the observed anomaly.
Moreover, the problem can be emphasized by the lack of a balun to connect the transmission line to the antenna; if the currents on two conductors of a cable are not balanced, the transmission line may radiate and will therefore significantly alter the antenna’s radiation pattern. Considering the sizes of E-st@r-II, the transmission line and the antenna size are comparable with the signal wavelength and can alter the radiation pattern. Furthermore, the ground plane of the antenna may be imperfect, and this also affects the radiation pattern. To support this analysis, a test campaign has been carried out.
The test campaign would have been performed in an anechoic chamber, which, unfortunately, was not available. The simplest way to evaluate all these combined effects is to do an outdoor far-field measurement. The selection of the test location has been driven by the need to reduce the signal reflections given by the external environment as much as possible. For the dipole antenna operating at 437.485 MHz, the Fraunhofer inequality (Equation (5)) shows that the distance (r) between receiver and transmitter should be larger than 2 times the ratio between the square of the antenna aperture (D) and the wavelength of the signal (𝝺).
r 2 D 2 λ
The EM of the satellite and the Portable Ground Station (PGS) have been located at a mutual distance of 50 m, satisfying the Fraunhofer inequality. The radius of the circle and the transmission power level must be chosen so that the maximum instantaneous power that arrives at the SDR is at least 10 dB below its limit of +0 dBm to avoid saturating/blinding it.
The EM of the satellite has been assembled reproducing the following two different setups: S.1) the ideal condition with a direct connection through a coaxial cable from the HPA to the antenna, and S.2) the in-orbit condition with the hypothetic incorrect connection (coaxial cable of 10–12 cm plus 5 cm of non-coaxial wires). The PGS is constituted by an SDR connected to an X700 antenna with a known gain pattern, and a computer with software to analyze the spectrum of the signal (e.g., SDRConsole_v3 power level measurement).
The E-st@r-II prototype is placed at a fixed position emitting continuously at a fixed power level. The PGS is moved along a circumference with the center in the satellite position and a radius of 50 m (as shown in Figure 15).
The measurements are acquired at ten deg steps in the range ±70° considering that the 0° angle is obtained when the hypothetic beamwidth axes of the EM of the satellite and the PGS antenna are aligned. In this way, the PGS moves along an ideal iso–gain curve and the strength of the received signal is measured inside the ideal beamwidth of the satellite antenna. The test is repeated with the X7000 antenna in the vertical and horizontal position to measure both components of the radiated electric field, hence obtaining the antenna’s radiation pattern.
The plots in Figure 16 and Figure 17 confirm that the strength of the signal is different in the two configurations, as expected. The difference between the strength of the signal is consistent with respect to the attenuation observed for e-st@r-II operations and can explain the anomaly. In this configuration (S.2.), it seems that the pattern of the antenna is non conical as expected but it is instead irregular while the conical pattern is approximately reproduced in the configuration with the correct connection (S.1.).

5. Conclusions

The activity presented in this paper moves to important considerations and remarks about the role of the ground segment for supporting CubeSat missions especially in case some anomaly occurs during operations in orbit. In particular, the experience made through the e-st@r project allowed us to draw recommendations that can be applied to CubeSat projects to fill the gap caused by the lack of data for failures’ investigation. Key elements for investigations are the availability of: (1) the models of the orbiting satellites, (2) the adequate supporting documentation, and (3) the effective investigation process. The following set of recommendations are proposed:
(1) Increase the implementation of the model-based approach in CubeSat projects. Models, either physical or digital, are of paramount importance in any phase of the product lifecycle, including operations. In this sense, the model-based and in-the-loop simulation approaches can cross all the phases of a project getting more effective any kind of analysis, study, and investigation from the conceptual design to the in-orbit operations. The definition of the model philosophy shall also consider the operation phase: electro-functional models, dummy models and mock-ups, digital models (such as CAD and the mathematical formulation of algorithms) should be properly designed and preserved with care.
(2) Pursue the lean documentation approach. Documentation favors the review of the design of production/manufacturing and of verification/qualification. Keeping records of any change is a fundamental and non-trivial practice, especially across models (virtual, hardware and software) and project phases. On the other hand, in order to be effective, project documentation should be easy to access and to consult. In this regard, a lean approach to documentation is recommended, e.g., reducing the number of documents while keeping or even enhancing their quality in terms of contents, using new techniques and tools (computer based documents, online tutorials, digital repository) to favor browsing across documentation, avoiding repetitions and statements that are too general, and focusing on detailed and accurate descriptions and results.
(3) Increase the investigation of failure. Based upon the experience gained with the e-st@r program, the authors propose an approach to support the investigation of the anomalies detected during operations of CubeSat missions with a reduced amount of telemetry data. The verifications illustrated in this paper are part of a broader methodology to support the root cause analysis, combining several methods and techniques in order to overcome the main issue of a CubeSat mission—the lack of data for developing any reliability assessment.
Another important consideration is about the application of standards, such as the ECSS (European Cooperation for Space Standardization), to CubeSat projects. E-st@r-II has been developed according to applicable ECSS documents, under the supervision of the ESA (European Space Agency). This approach has demonstrated to be heavy without guaranteeing full mission success. A re-thinking of existing standards or the development of new standards for CubeSats is advised. This problem has been recently addressed by the ESA, by the release of a tailored version of the ECSS for CubeSat. This is a start, but more work is needed in this direction. CubeSat developers and operators could contribute to this effort in order to achieve an important result for the whole community.
The activity presented in this paper demonstrates that investigating the anomalies can help to recover the mission of interest but also can support building a heritage that is today still missing for CubeSat missions.

Author Contributions

Anomaly investigation S.C. and F.S.; methodology, S.C.; verification execution F.S., formal analysis, F.S.; data curation, S.C. and F.S.; writing—original draft preparation, F.S.; writing—review and editing, S.C.; project administration, S.C. All authors have read and agreed to the published version of the manuscript.

Funding

This research received no external funding.

Acknowledgments

The authors thank all the students of the PoliTO CubeSat Team in E-st@r-II program, the friends of the radio amateur community, and, in particular, Ferruccio Paglia (IW1DTU), Marco Mascarello (IW1DGG), and Alberto Busso (IW1FNW).

Conflicts of Interest

The authors declare no conflict of interest.

References

  1. Fly Your Satellite Program ESA. Available online: http://www.esa.int/Education/CubeSats_and_Education_the_Fly_Your_Satellite!_programme (accessed on 30 November 2017).
  2. NASA’s CubeSat Launch Initiative. Available online: https://www.nasa.gov/directorates/heo/home/CubeSats_initiative (accessed on 28 October 2019).
  3. Puig-Suari, J.; Turner, C.; Ahlgren, W. Development of the standard CubeSat deployer and a CubeSat class PicoSatellite. In Proceedings of the 2011 IEEE Aerospace Conference, Big Sky, MT, USA, 10–17 March 2001; pp. 347–355. [Google Scholar]
  4. Selva, D.; Krejci, D. A survey and assessment of the capabilities of Cubesats for Earth observation. Acta Astronaut. 2010, 74, 50–68. [Google Scholar] [CrossRef]
  5. Rodriguez, C.; Boiardt, H.; Bolooki, S. CubeSat to commercial intersatellite communications: Past, present and future. In Proceedings of the IEEE Aerospace Conference, Big Sky, MT, USA, 5–12 March 2016; pp. 1–15. [Google Scholar]
  6. Willis, J.; Walton, P.; Wilde, D.; Long, D. Miniaturized Solutions for CubeSat Servicing and Safety Requirements. IEEE J. Miniat. Air Space Syst. 2019, 1–7. [Google Scholar] [CrossRef]
  7. Poghosyan, A.; Golkar, A. CubeSat evolution: Analyzing CubeSat capabilities for conducting science missions. Prog. Aerosp. Sci. 2017, 88, 59–83. [Google Scholar] [CrossRef]
  8. Zannoni, M.; Tommei, G.; Modenini, D.; Tortora, P.; Mackenzie, R.; Scoubeau, M.; Herfort, U.; Carnelli, I. Radio science investigations with the Asteroid impact mission. Adv. Space Res. 2018, 62, 2273–2289. [Google Scholar] [CrossRef]
  9. Kerner, H.; Hardgrove, C.; Bell, J.; Amzler, R.; Babuscia, A.; Beasley, M.; Brunham, Z.; Cheung, K.M. The Lunar Polar Hydrogen Mapper (LunaH-Map) CubeSat Mission. In Proceedings of the Small Satellite Conference, Logan, UT, USA, 6–11 August 2016. [Google Scholar]
  10. Tsitas, S.R.; Kingston, J. 6U CubeSat commercial applications. Aeronaut. J. 2012, 116, 189–198. [Google Scholar] [CrossRef]
  11. Pelton, J.; Finkleman, D. Overview of Small Satellite Technology and Systems Design. In Handbook of Small Satellites: Technology, Design, Manufacture, Applications, Economics and Regulation; Springer: Cham, Switzerland, 2012; Volume 1, p. 21. [Google Scholar]
  12. Viscio, M.A.; Viola, N.; Corpino, S.; Stesina, F.; Circi, C.; Fineschi, S.; Fumenti, F. Interplanetary, Cubesat mission to earth-sun libration point for space weather evaluation. In Proceedings of the 64th International Astronautical Congress, Beijing, China, 23–27 September 2013; Volume 2, pp. 1324–1332. [Google Scholar]
  13. Leveque, K.; Cuseo, Z.; King, J.; Babb, R.; Carleton, L. Unlocking the Next Generation of Nano-Satellite Missions with 320 Mbps Ka-Band Downlink: On-Orbit Results. In Proceedings of the 33rd Small Satellite Conference, Logan, UT, USA, 3–8 August 2019. [Google Scholar]
  14. Modenini, D. Attitude Determination from Ellipsoid Observations: A Modified Orthogonal Procrustes Problem. J. Guid. Navig. Dyn. 2019, 41, 2324–2326. [Google Scholar] [CrossRef]
  15. Ofodile, I.; Kütt, J.; Kivastik, J.; Nigol, M.K.; Parelo, A.; Ilbis, E.; Ehrpais, H.; Slavinskis, A. ESTCube-2 Attitude Determination and Control: Step Towards Interplanetary CubeSats. In Proceedings of the 2019 IEEE Aerospace Conference, Big Sky, MT, USA, 2–9 March 2019; pp. 1–12. [Google Scholar]
  16. Bowen, J.; Villa, M.; Williams, A. CubeSat based Rendezvous, Proximity Operations, and Docking in the CPOD Mission. In Proceedings of the 29th AIAA/USU Conference on Small Satellites, Logan, UT, USA, 8–13 August 2015. [Google Scholar]
  17. Wang, J.; Zhang, R.; Yuan, J.; Luo, J. Multi-CubeSat Relative Position and Attitude Determination Based on Array Signal Detection in Formation Flying. IEEE Trans. Aerosp. Electron. Syst. 2019, 55, 3378–3393. [Google Scholar] [CrossRef]
  18. Conigliaro, C.; Calvi, D.; Franchi, L.; Stesina, F.; Corpino, S. Design and analysis of an innovative cubesat thermal control system for biological experiment in lunar environment. In Proceedings of the 69th International Astronautical Congress, Bremen, Germany, 1–5 October 2018. [Google Scholar]
  19. Claricoats, J.; Dakka, S.M. Design of Power, Propulsion, and Thermal Sub-Systems for a 3U CubeSat Measuring Earth’s Radiation Imbalance. Aerospace 2018, 5, 63. [Google Scholar] [CrossRef] [Green Version]
  20. Lemmer, K. Propulsion for CubeSats. Acta Astronaut. 2017, 134, 231–243. [Google Scholar] [CrossRef]
  21. Tummala, A.R.; Dutta, A. An Overview of Cube-Satellite Propulsion Technologies and Trends. Aerospace 2017, 4, 58. [Google Scholar] [CrossRef] [Green Version]
  22. Dubos, G.F.; Castet, J.F.; Saleh, J.H. Statistical reliability analysis of satellites by mass category: Does spacecraft size matter? Acta Astronaut. 2016, 67, 584–595. [Google Scholar] [CrossRef]
  23. Spangelo, S.C.; Kaslow, D.; Delp, C.; Cole, B.; Anderson, L.; Fosse, E.; Gilbert, B.S.; Hartman, L.; Kahn, T.; Cutler, J. Applying model based systems engineering (MBSE) to a standard CubeSat. In Proceedings of the IEEE Aerospace Conference, Big Sky, MT, USA, 3–10 March 2012. [Google Scholar]
  24. Menchinelli, A.; Ingiosi, F.; Pamphili, L.; Marzioli, P.; Patriarca, R.; Costantino, F.; Piergentili, F. A Reliability Engineering Approach for Managing Risks in CubeSats. Aerospace 2018, 5, 121. [Google Scholar] [CrossRef] [Green Version]
  25. Tiseo, B.; Quaranta, V.; Bruno, G.; Sisinni, G. Tailoring of ECSS Standard for Space Qualification Test of CubeSat Nano-Satellite. Int. J. Aerosp. Mech. Eng. 2019, 13, 295–302. [Google Scholar]
  26. Venturini, C.; Braun, B.; Hinkley, D.; Berg, G. Improving Mission Success of CubeSats. In Proceedings of the 32rd Small Satellite Conference, Logan, UT, USA, 3–8 August 2018. [Google Scholar]
  27. Stesina, F.; Corpino, S.; Feruglio, L. An in-the-loop simulator for the verification of small space platforms. Int. Rev. Aerosp. Eng. 2017, 10, 50–60. [Google Scholar] [CrossRef]
  28. Kiesbye, J.; Messmann, D.; Preisinger, M.; Reina, G.; Nagy, D.; Schummer, F.; Mostad, M.; Kale, T.; Langer, M. Hardware-In-The-Loop and Software-In-The-Loop Testing of the MOVE-II CubeSat. Aerospace 2019, 6, 130. [Google Scholar] [CrossRef] [Green Version]
  29. Farissi, M.S.; Carletta, S.; Nascetti, A.; Teofilatto, P. Implementation and Hardware-In-The-Loop Simulation of a Magnetic Detumbling and Pointing Control Based on Three-Axis Magnetometer Data. Aerospace 2019, 6, 133. [Google Scholar] [CrossRef] [Green Version]
  30. Bonsu, B.; Masui, H.; Cho, M. Demonstration of Lean Satellite (1U CubeSat) Testing Using PeTT Vacuum Chamber. In Proceedings of the 2019 9th International Conference on Recent Advances in Space Technologies (RAST), Istanbul, Turkey, 11–14 June 2019; pp. 959–966. [Google Scholar]
  31. Lovascio, A.; D’Orazio, A.; Centonze, V. Characterization of a COTS-Based RF Receiver for Cubesat Applications. Sensors 2020, 20, 776. [Google Scholar] [CrossRef] [PubMed] [Green Version]
  32. Stesina, F. Validation of a Test Platform to Qualify Miniaturized Electric Propulsion Systems. Aerospace 2019, 6, 99. [Google Scholar] [CrossRef] [Green Version]
  33. Available online: http://www.jhberkandassociates.com/systems_failure_analysis.htm (accessed on 11 March 2020).
  34. Stesina, F.; Corpino, S. Analysis of the communication anomaly during e-st@r-II mission operations. In Proceedings of the 68th International Astronautical Congress, Adelaide, Australia, 25–29 September 2017. [Google Scholar]
  35. Berthoud, L.; Swartwout, M.; Cutler, J.; Klumpar, D.; Larsen, J.A.; Nielsen, J.D. University CubeSat Project Management for Success 33rd Conference on Small Satellites. In Proceedings of the Conference on Small Satellites, Logan, UT, USA, 3–8 August 2019. [Google Scholar]
  36. Stesina, F.; Corpino, S.; Mozzillo, R.; Obiols Rabasa, G. Design of the active attitude determination and control system for the E-st@r CUBESAT. In Proceedings of the 63rd International Astronautical Congress, Naples, Italy, 1–5 October 2012. [Google Scholar]
  37. Busso, A.; Mascarello, M.; Corpino, S.; Stesina, F.; Mozzillo, R. The communication module on board e-st@r-II Cubesat. In Proceedings of the 7th ESA International Workshop on Tracking, Telemetry and Command Systems for Space Applications, Noordwijk, The Netherlands, 13–16 September 2016. [Google Scholar]
  38. Obiols-Rabasa, G.; Corpino, S.; Mozzillo, R.; Stesina, F. Lessons learned of a systematic approach for the E-ST@R-II CUBESAT environmental test campaign. In Proceedings of the 66th International Astronautical Congress, Jerusalem, Israel, 1–5 October 2015. [Google Scholar]
Figure 1. Anomaly analysis process.
Aerospace 07 00038 g001
Figure 2. S/N0 measurement example.
Aerospace 07 00038 g002
Figure 3. Comparison between AAUSAT-4 and E-st@r-II signal strength.
Aerospace 07 00038 g003
Figure 4. Communication systems (COMSYS) block diagram.
Aerospace 07 00038 g004
Figure 5. COMSYS board.
Aerospace 07 00038 g005
Figure 6. E-st@r-II body frame.
Aerospace 07 00038 g006
Figure 7. CAD model of the antenna deployment system.
Aerospace 07 00038 g007
Figure 8. Antenna deployment mechanism with the antenna folded around.
Aerospace 07 00038 g008
Figure 9. Deployment mechanism block diagram.
Aerospace 07 00038 g009
Figure 10. Antenna deployment system (electrical scheme).
Aerospace 07 00038 g010
Figure 11. Signal attenuation for misalignment error of the satellite antenna.
Aerospace 07 00038 g011
Figure 12. Probe circuit for the High-Power Amplifier (HPA) output measurement.
Aerospace 07 00038 g012
Figure 13. E-st@r-II installed in MARSIM.
Aerospace 07 00038 g013
Figure 14. Picture from the final integration of E-st@r-II.
Aerospace 07 00038 g014
Figure 15. Test set-up.
Aerospace 07 00038 g015
Figure 16. Comparison between the signal strength in S.1. (blue) and S.2. (red) setup with the Portable Ground Station (PGS) in vertical.
Aerospace 07 00038 g016
Figure 17. Comparison between the signal strength in S.1. (blue) and S.2. (red) setup with the PGS in horizontal.
Aerospace 07 00038 g017
Table 1. Radio-module tests results—RF power output.
ModuleMeasured Voltage (Vm) (mW) Estimated Power (Pt) (mW)
BHX2 - Spare-1223.0497.3
BHX2 - Spare-2223.2498.2
BHX2 - Spare-3222.8496.4
Table 2. Results of the special experiment on different configurations of the radiomodule and antenna.
Config.Meas. 1Meas. 2Meas. 3
C.145.4 dB47.1 dB46.4 dB
C.230.1 dB29.5 dB31.5 dB
C.3No signalNo signalNo signal
Table 3. Results of the test campaign on the antenna deployment system.
Test #.Conditions (°C)Time of the Deployment (min)Time of the First Packet Reception (min)
L.1
Both line connected
TL = 27.20:30:120:32:45
L.2
Both line connected
TL = 28.50:30:120:32:45
L.3
Both line connected
TL = 27.60:30:130:32:45
L.4
Both line connected
TL = 27.2 0:30:120:32:46
L.5
Line2 disconnected
TL= 27.40:30:120:32:45
L.6
Line2 disconnected
TL = 28.40:30:120:32:46
L.7
Line2 disconnected
TL = 27.50:30:120:32:46
L.8
Line1 disconnected
TL = 28.80:30:220:32:45
L.9
Line1 disconnected
TL = 27.70:30:230:32:46
L.10
Line1 disconnected
TL = 27.00:30:220:32:45
C.1
Both line connected
TTC = –26.1
Tch = −31.33
0:30:130:32:46
C.2
Line2 disconnected
TTC = −25.8
Tch = –30.76
0:30:130:32:45
C.3
Line1 disconnected
TTC = –26.5
Tch = –31.12
0:30:230:32:46
H.1
Both line connected
TTC = 56.0
Tch = 61.49
0:30:120:32:46
H.2
Line2 disconnected
TTC = 55.7
Tch = 60.41
0:30:120:32:46
H.3
Line1 disconnected
TTC = 56.5
Tch = 62.11
0:30:210:32:45

