Article

Modelling Flexibility and Qualification Ability to Assess Electric Propulsion Architectures for Satellite Megaconstellations

Department of Industrial and Materials Science, Chalmers University of Technology, Chalmersplatsen 4, 412 96 Gothenburg, Sweden
*
Author to whom correspondence should be addressed.
Aerospace 2020, 7(12), 176; https://doi.org/10.3390/aerospace7120176
Submission received: 19 October 2020 / Revised: 7 December 2020 / Accepted: 9 December 2020 / Published: 11 December 2020
(This article belongs to the Special Issue Advances in Aerospace Sciences and Technology)

Abstract

:
The higher satellite production rates expected in new megaconstellation scenarios involve radical changes in the way design trade-offs need to be considered by electric propulsion companies. In relative comparison, flexibility and qualification ability will have a higher impact in megaconstellations compared to traditional businesses. For these reasons, this paper proposes a methodology for assessing flexible propulsion architectures by taking into account variations in market behavior and qualification activities. Through the methodology, flexibility and qualification ability can be traded against traditional engineering attributes (such as functional performances) in a quantitative way. The use of the methodology is illustrated through an industrial case related to the study of xenon vs. krypton architectures for megaconstellation businesses. This paper provides insights on how to apply the methodology in other case studies, in order to enable engineering teams to present and communicate the impact of alternative architectural concepts to program managers and decision-makers.

1. Introduction

For decades, manufacturers of electric propulsion (EP) systems for satellites have had a strong focus on increasing the performance and reliability of their products, with governmental programs as unique buyers. This led to a strong focus on increasing the functional requirements of an EP system—such as thrust (T) and specific impulse (Isp). This resulted in new technologies produced at a rate of a few units a year. During the development, the unit cost of the product could often be traded in favour of functional performance enhancements [1] (point A in Figure 1). This scenario is going to change in the next few years.
The emergence of more entrepreneurial actors is driving new business scenarios in the space industry—such as the development of megaconstellations for worldwide internet coverage [2,3]. These new scenarios—often referred to as “new space” [4,5,6]—involve radical changes in the way design trade-offs need to be considered (point B and point C in Figure 1).
Such business scenarios expect the production rates to be about 10 to 100 times higher than those typically met for satellites used in more traditional applications (telecommunication, science). As a consequence, manufacturers need to adhere to ambitious cost reduction targets, which imposes changes on the product design approach and compromises functional requirements in favor of unit cost reduction (point B in Figure 1). Also, expectations on reliability at component level can be under-emphasized since a malfunctioning satellite could be replaced by another one in the same constellation [7], while mitigating the risk of collision using dedicated transportation satellites.
Nevertheless, such cost rationalization approaches impose new challenges for manufacturers of electric propulsion systems. In relative comparison, constraints related to the manufacturing, testing and operation of the product (e.g., manufacturability, flexibility, qualification ability) play a higher role in these new applications compared to traditional businesses based on low production volumes ([8], point C in Figure 1). These constraints are often labelled as non-functional requirements. While functional requirements specify “what the product must do” [9] (e.g., thrust), non-functional requirements constrain “how” the system must accomplish the “what” [10]. They are often referred to as “-ilities” (e.g., manufacturability and flexibility) or “-ities” (e.g., integrity and security) [11]. Due to their tacit and articulated nature [10,12,13], non-functional requirements represent hidden sources of cost and increases in lead time. As a consequence, the difference between the target cost and the real cost of these products once produced in large volumes can be large (point B and C in Figure 1).
These considerations drive the need to analyse and mitigate non-functional requirements already from the preliminary design stages. Emerging from a study in a real space development project, this paper demonstrates how two key non-functional requirements—flexibility and qualification ability—can be modelled and traded against functional requirements. A methodology for assessing flexible propulsion architectures has been proposed—which puts strong emphasis on including variations in market behavior and qualification activities during architecture trade studies. The use of the methodology is illustrated through an industrial case related to the study of xenon vs. krypton architectures for megaconstellation businesses.
The following sections review more in detail the current research related to the modelling of non-functional requirements, emphasizing specifically research on flexibility and qualification ability. The need for a deeper focus on these two attributes of a design has been stressed by the industrial partners involved in the empirical study (and described in chapter 2).

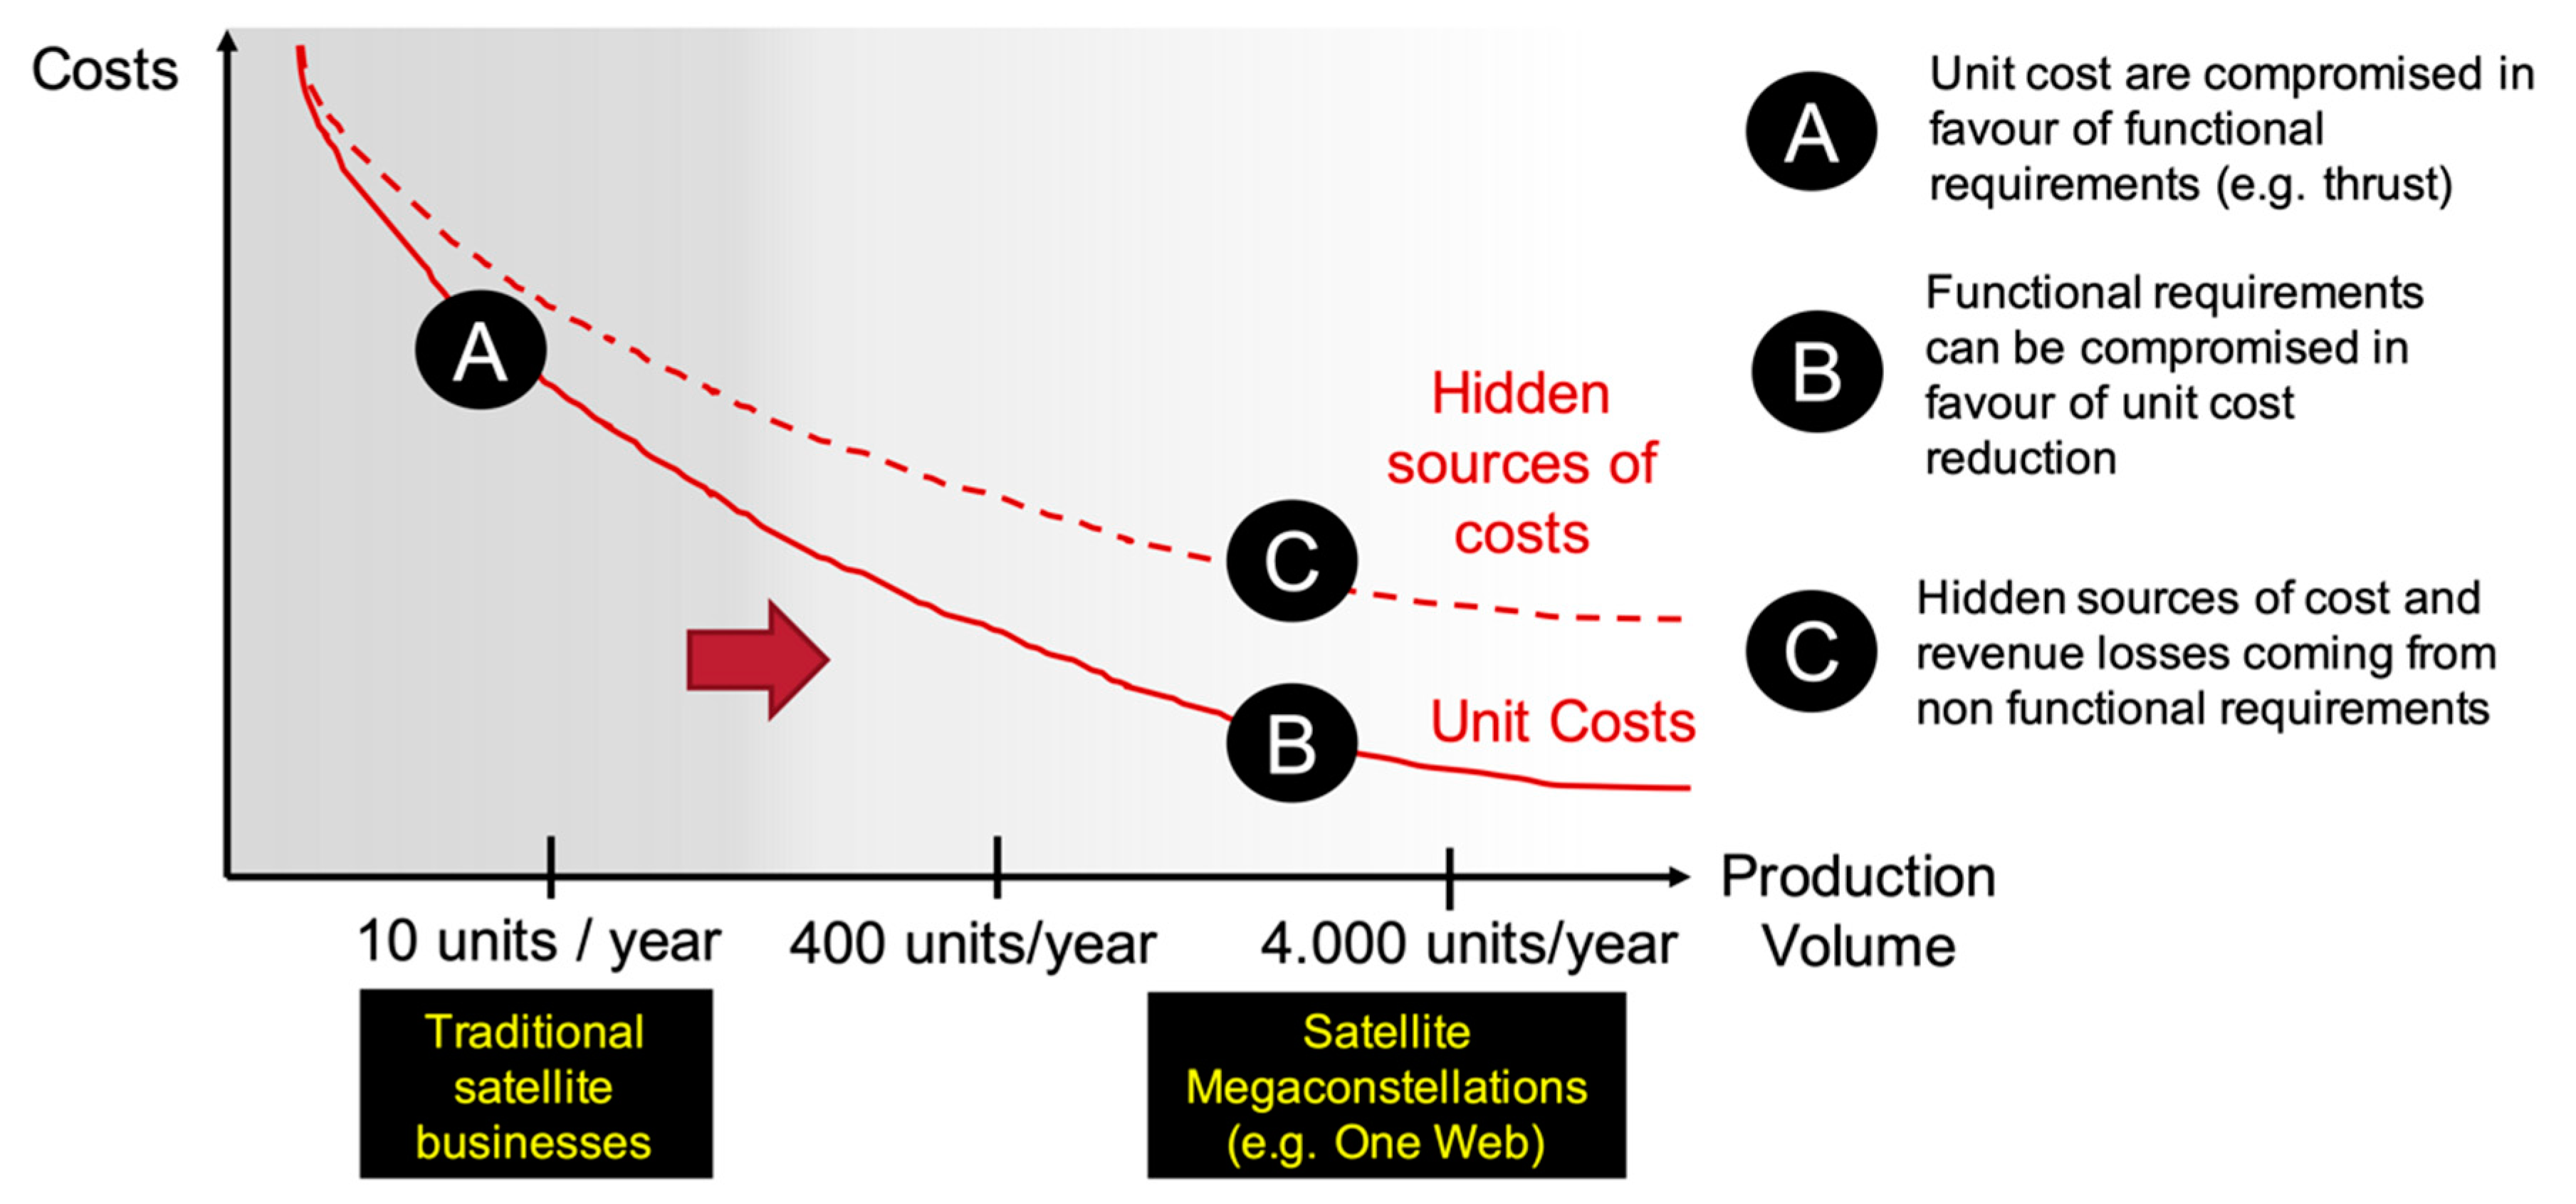
1.1. The Rising Importance of Including Non-Functional Requirements in Preliminary Design

Studies within aerospace [12,14], space [15] and construction equipment [16,17] observed how functional requirements (e.g., thrust) often represent the concerns of external stakeholders (such as satellite operators), who typically have expectations of the product once in use. Internal stakeholders such as company owners and top management have also specific expectations, usually related to cost, risk of development, strategy and production. Internal stakeholder needs are often leading to ‘non-functional requirements’ or ‘ilities’, which are difficult to capture and explicitly expressed (compared to functional requirements and unit cost). As a result, non-functional requirements and ‘ilities’ are often considered in later phases of the project, which leads to technical solutions that are costlier for the manufacturers, as well as prone to scheduling delays [14].
The need to trade functional and non-functional requirements simultaneously has resulted in a number of methodological approaches. Tradespace exploration (TE; [13]) models such characteristics as the utility of a system—aggregated adopting multi-attribute utility theory [18]—against lifecycle costs. In TE, design options are assessed in terms of utility and lifecycle costs, which also allow us to compare alternatives in terms of ‘ilities’ (e.g., flexibility, changeability and scalability). Value-driven design (VDD), [19] stresses the benefit of aggregating lifecycle costs and utility within the same monetary metric of value, because it provides a practical and convenient means to compare alternatives on targeted business cases. At the same time, VDD recognized the difficulty of computing such a metric since many industry structures are complex, with competing customers, competing manufacturers, and competing lower-tier suppliers. For these reasons, VDD proposed the use of a financial metric—surplus value (SV) [14]—to provide a simplified equation to a net present value analysis (NPV) [20], typically used by economists a basis for businesses investment decisions.

1.2. Modelling Flexiblity in Preliminary Design Trade-Off Studies

Flexibility is a notion that describes “a design concept that provides an engineering system with the ability to adapt, change and be reconfigured, if needed, in light of uncertainty” [21]. It is different conceptually from a robust design concept, which makes systems functions invariant to changes [22]. Design for flexibility literature (e.g., [23]) suggests conceiving a system architecture with relatively low capability initially, but that allows for expansion if changes occur. To achieve this, the notion of ‘real options’ [24] is used to identify means to embed flexibility in technical systems. A real option is a technical element embedded initially into a design that gives the right but not the obligation to react to uncertain conditions. One example of real option in the satellite business is given by de Weck et al. [25] who show that under high uncertainty in demand it is better to launch a set of small, lightweight, affordable satellites and to add more of them as needed, rather than deploying a constellation with few, high-powered, heavy satellites.
The main challenge when designing flexibility in a product is that flexibility has to be traded against other dimensions (e.g., [22]). For example, highly flexible and modular products could result in systems that are heavier with the risk of degrading performance [26]. For this reason, engineers need more quantitative and information-rich models in order to make confident decisions and to justify more flexible products to the project stakeholders. However, assessing the impact of flexibility is challenged by the need to take into account the likelihood of future events to occur. At present, few, if any, design teams include formally the dynamics of the business scenarios for the future early on in the development process—which leave the decisions on what architecture, or what technology principles to deploy—to tacit and experience-based judgement.
Works on flexibility quantification use tradespace exploration in combination with scenario planning [13]. To quantify flexibility, Viscito and Ross [27] suggest applying a metric called value weighted filtered outdegree, which is defined as the number of concepts (represented by both physical and operational parameters) a particular design can be changed into, given an acceptability cost threshold selected by the decision makers.

1.3. Modelling Testing and Qualification Ability in Preliminary Design Trade-Off Studies

Test activities are performed, from early concept development to detailed design [28]. In the space domain, qualification activities are test activities performed to demonstrate that a product meets the specified requirements, such as those regarding performance, safety, legislation, quality or reliability [29]. Outside the space domain, similar purposes can be attributed to the verification, validation and testing (VVT) [30]. Verification most often aims to test the fulfilment of requirements, while validation activities test the fulfilment of stakeholders’ needs. The ISO standard 15288 draws a clear parallel between VVT activities and qualification [31]. Data from testing is utilized to improve a product design, however, acquiring data from test activities can be expensive in terms of cost and schedule delays. According to Engel and Barad [32], these activities make up to 40% to 60% of the total cost of a product development project; however, they are still not actively considered in early stages of a product architecture design. Modelling the duration and cost of qualification activities in relation to a product design can support the design of product architectures with affordable test and qualification phases.
Previous research on modelling and simulation of product development activities (in terms of duration and costs) has been conducted using a discrete-event simulation approach [33], in which ‘cost drivers’ are used. In literature, drivers are often used for describing the causes that affect the output of a system. The term is widely implemented when referring to the factors that cause a change in a cost, in this case, cost drivers (e.g., [34]). However, at present there is no systematic way of modelling how design alternatives impact test and qualification activities (e.g., [35]).

2. Materials and Methods

This article demonstrates how two key non-functional requirements for next-generation electric propulsion systems—flexibility and qualification ability—have been modelled and traded against functional requirements (e.g., thrust, Isp) in an electric propulsion development programme over a period of three years. The research context is introduced in the next session.

2.1. Research Context

Nine manufacturers are involved in the development of three different EP systems based on Hall effect thruster (HET) technology [36]. Among the electric propulsion technologies [37,38], the HET is a technology positioned in a “sweet spot”, since it combines a high thrust to power ratio (around 50–60 mN per kW) and high propellant efficiency (Isp around 1500–2500s). A HET EP is composed of three main parts (Figure 2):
-
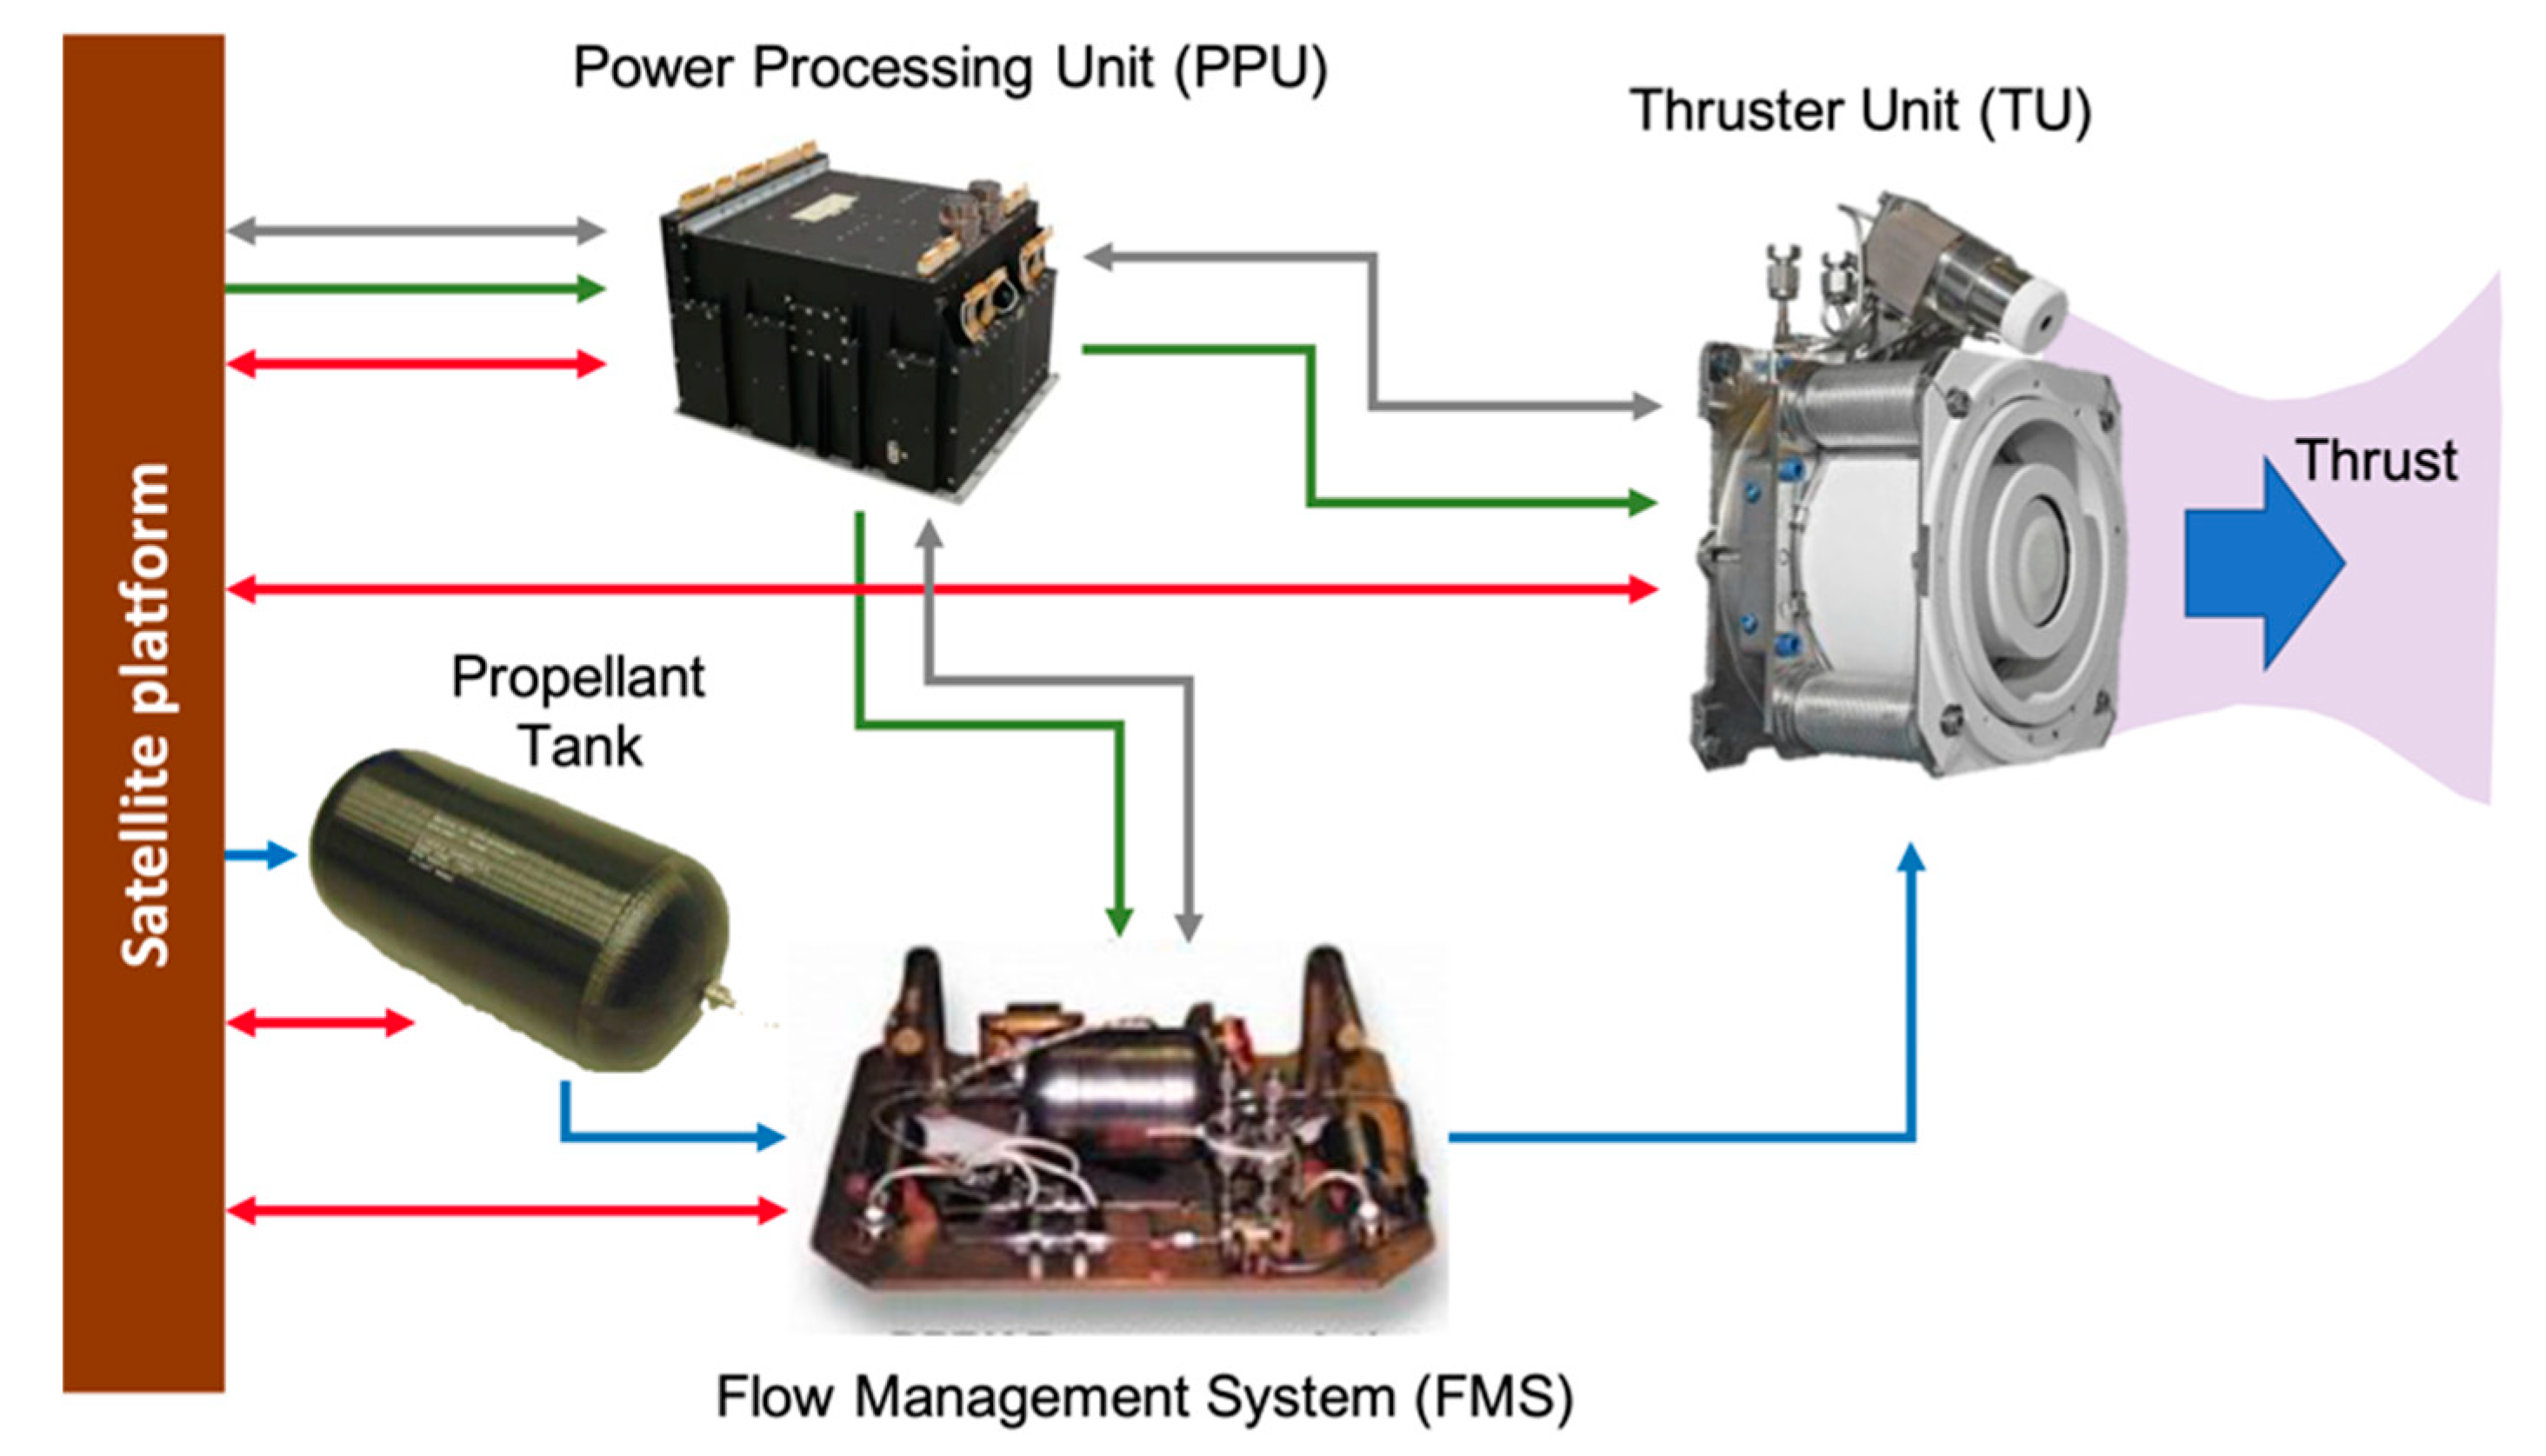
The thruster unit (TU), which transforms electric energy and propellant into thrust,
-
The power processing unit (PPU), which feeds the thruster with electric power from the satellite bus and manages it,
-
The flow management system (FMS), which feeds the thruster with propellant from a propellant tank and manages it.
Figure 2 shows the main parts of an EP in a simplified schematic, highlighting the main interactions and interfaces: mechanical (red), electrical (green), software (grey) and fluidic (blue). The figure shows how these interactions and dependencies can be one- or bi-directional, in terms of input and output. The figure highlights how an EP is a multi-technological system, presenting a mix of mechanical, electronic, fluidic and software elements.
The partners involved in the project are working at system (satellite), sub-system (EP) and component levels (developing PPUs and FMSs). The project is organized around three different groups of engineering teams, each tasked to develop a HET EP in order to serve different applications and orbits. The need for the research presented in this paper is motivated by the operative conditions that determine the value of satellite propulsion technologies for “new space” business scenarios, which are introduced in the next session.

2.2. ‘New Space’ Market Conditions that Determine the Value of Next-Generation Satellite Propulsion Systems

Historically, the main application areas for satellite constellations have been telecommunications and Earth observation. The size of these constellations depends on the trade-off between the need for coverage and the launch cost incurred to introduce the satellites in orbit [40]. The lower the altitude the more satellites have to be built to provide coverage. On the other hand, the higher the altitude, the higher each launch cost.
For a couple of decades, the biggest satellite constellation has been the Iridium constellation—residing in low Earth orbit (LEO) with 76 satellites and a mass of around 700 kg each [41]. However, the satellite constellation business has rapidly evolved due to the emergence of more entrepreneurial actors, which is now resulting in new business models. For example, OneWeb announced a partnership to produce a constellation of 648 LEO satellites to deliver broadband Internet globally [40]. SpaceX announced a similar ambition for a constellation of more than 4000 LEO satellites (called Starlink), and 895 satellites have already been launched at the end of 2020 [42]. Telesat has announced the plan to launch a constellation of 298 satellites [43]. The magnitude of the space infrastructure being proposed in these ‘megaconstellation’ scenarios is unprecedented. For example, SpaceX’s constellation is almost twice the total number of operational satellites in orbit today [44].
Despite the growing interest in developing megaconstellations, the market is at present very uncertain. For example, in 2018 Telesat reported that their ideal LEO constellation size is 292 satellites, but it could be 512 [45], emphasizing the need for the flexibility and scalability of the constellation from an economical standpoint. Also, in March 2020 OneWeb filed for bankruptcy protection because of the financial impact and market turbulence related to the spread of coronavirus disease 2019 (COVID-19) [46], with already 74 satellites launched and half of the 44 planned ground stations completed or in development. These uncertainties have profound implications on the requirements that need to be taken into account for next generation satellite propulsion technologies. In particular, the empirical study in the development project has emphasized the greater need to systematically consider flexibility and qualification ability already from the preliminary design phases. The next section will highlight the method proposed for model flexibility and qualification ability.

3. Results

From the interactions with the industrial stakeholders in the space development programme, it was decided that the most interesting application in which to model flexibility and qualification ability against functional requirements was the development of low power and low-cost electric propulsion systems for LEO megaconstellations. This was due to the high uncertainties in both markets and operative conditions that characterize these future applications. The method proposed for model flexibility and qualification ability is shown in Figure 3.
The process starts with the generation of alternatives to embed flexibility in an architecture, which is conducted concurrently with the identification of possible sources of uncertainty for a system. For this step, ‘real options’ principles [24] can be applied. This step is followed by the calculation of performances (i.e., functional requirements) and unit costs of the different elements of the system. Based on the empirical study, this paper assumes that the EP manufacturers possess available and mature performance models—such as [47]—as well as unit cost and mass models [48], and reliability models [49].
The next step is to model the flexibility of the alternatives by running a value model with uncertainty introduced in key market parameters. For this purpose, a surplus value model [18] is adopted. The surplus value model is a means to aggregate both functional requirements (e.g., thrust) and non-functional requirements (e.g., flexibility, qualification ability) onto the same financial metric. Also, the surplus value model aggregates the cost and duration of the qualification activities, modelled using a discrete-event qualification technique. The final steps include the visualization of the results, where decisions are made. The following sections present the application of the method on an industrial case. As stated in the introduction, the purpose of this case study is to demonstrate the methodology in an industrially relevant set-up, rather than a detailed comparison between alternative propellant systems.

3.1. Identify Sources of Uncertainty and Generate Alternatives in Satellite Megaconstellation Scenarios

From interviews with industrial practitioners, it emerged that one of the biggest sources of uncertainty in megaconstellation businesses is the type of propellant that will be most convenient to use in the future. While the existing electric propulsion market is mostly based on xenon (Xe) propellant, the development of megaconstellation projects requires to evaluate alternatives propellants that are either cheaper or compatible with the higher volumes required. Xenon is an expensive substance and is not produced in high quantity. Furthermore, the need for xenon in other industrial sectors is likely to increase its price in the future. For example, the automotive industry’s increased use of xenon for headlights has resulted in a higher demand for xenon. There is a need to investigate the benefits and constraints that could be obtained from cheaper alternative propellants such as krypton (Kr) obtained from non-traditional supply sources [50].
After applying ‘real options’ principles [24], the following alternatives were identified in order to accommodate changes in the use of propellant. The alternatives are visualized in Figure 4 together with their performances (Power, Thrust, Isp) and reliability levels. This input data is shown in a qualitative fashion to protect company sensitive information. However, the data is within “assumable” ranges than can be extrapolated from literature (e.g., [51,52,53]) and publicly available material ([40,41,42,43]). Also, the values for performances, masses, reliability and costs can be estimated using already published models (e.g., [47,48,49]).
The authors believe that the lack of disclosure of this input data (while undermining the complete transparency of the results) is still relevant to fulfill the purpose of the case study. As stated in the introduction, the purpose of this case study is to demonstrate the methodology in an industrially relevant set-up, rather than a detailed comparison between alternative propellant systems. The novelty of the methodology (compared to previous studies) is the ability to include variations in market behavior, beyond variations of ‘traditional’ attributes such as masses and performances. Therefore, this paper has focused more on providing the input data regarding the variation of the market parameters, which are introduced in the next sections (e.g., Table 1).
The alternatives are summarized as follows. Option 1 is labelled as Single development, Xe optimized design: in this option, the possible use of alternative propellants is disregarded, and the manufacturers follow the cost-efficient strategy of developing and optimizing only an existing design compatible with xenon. This strategy exploits the current know-how of the company and ensures to provide an EP in a cost-efficient manner with good power and reliability levels.
Option 2 is labelled as Double development, Xe and Kr optimized: in this option, the possibility to use both xenon and krypton is enabled by the parallel development, test and qualification of two separated systems. While this strategy ensures the flexibility of offering customers both a xenon and a krypton option (with performance and reliability levels equal to existing xenon options available today), it impacts substantially the development, test and qualification activities since extensive simulation [51] and physical testing [52] needs to be performed.
Option 3 is labelled as Flexible design (single system compatible with either Xe or Kr): in in this option, the possibility to use either xenon or krypton in the same system is enabled by the design a single product compatible for both propellants. Please note that Option 3 represents a single string propulsion system (same as Option 1 and Option 2) that is compatible with either xenon or krypton. This means that the single string propulsion system can be sold by either mounting a xenon tank or by mounting a krypton tank. This is symbolized by a red rhombus in Figure 4. The actual technical means to include this possibility are omitted in this paper to protect company-sensitive information. However, a way of achieving flexibility is to emphasize modularity with standardized interfaces (e.g., [53]). The downside of this option is that it features lower performances and reliability levels lower than the previous options, since it requires “sub-optimized” components to be compatible with both propellants. Such sub-optimization of components (e.g., reduced efficiency) is indicated in Figure 4 by an asterisk (*). At the same time, test and qualification activities are also impacted since the compatibility of the hardware with both propellants needs to be tested and qualified.
Option 4 is labelled as Flexible design, reliability improved: this option allows the use of both propellants, with the additional benefit that the reliability of the system is increased. Reliability is increased by the addition of a redundant thruster and of a thruster switching unit (TSU) which is used to switch the power lines in case of a malfunction in the main thruster. This option requires additional test and qualification of the TSU, as well as additional costs to integrate the redundant thruster and the TSU in the system.

3.2. Develop Surplus Value Model

The surplus value model adopted in this case study is shown in Equation (1):
S u r p l u s   V a l u e   =   D i s c p   ×   M a r k e t S i z e   ×   { D i s c c   ×   ( R e v e n u e   p e r   y e a r     S K   c o s t   O R   c o t s     p r o p e l l a n t   c o s t s     l a u n c h   c o s t     s a t e l l i t e   c o s t s   w i t h o u t   E P     E P S   p r o d u c t   c o s t     i n t e r e s t   c o s t     i n s u r a n c e   c o s t ) ×   t e s t   a n d   q u a l i f i c a t i o n   c o s t s ,
where:
  • D i s c p and D i s c c are multipliers on a single year’s revenue and costs based on the discount rate and mission life for the producers/manufacturers and customer (operator) respectively.
  • Market size is the number of satellites sold every year.
  • Revenue per year generated from satellite operations.
  • SK costs refer to the ground operations necessary to manoeuvre the satellite during station keeping (SK).
  • OR costs refer to the ground operations necessary to manoeuvre the satellite during orbit raising (OR).
  • Propellant costs refer to cost of propellant used to propel the satellite during OR and SK.
  • Launch costs refers to the costs incurred during launch.
  • Satellite costs without EP refers to the cost sustained during the production and integration of the satellite.
  • The total capital investment is the sum of Launch costs, Satellite costs without EP and EP product costs.
  • Interest costs refers to the costs incurred by the interest on capital.
  • Insurance costs refers to the costs incurred by the insurance paid for the satellite in orbit.
  • Test and qualification costs refers to the development costs for satellite and EP. These costs derive from the test and qualification model that will be described in the next section. Often, these costs are also defined in the space sector as non-recurring costs.
The surplus value model described in Equation (1) has been programmed using a discrete event simulation (DES) technique. DES models the operation of a system as a (discrete) sequence of events in time [54]. This means that the whole lifecycle of a megaconstellation business has been divided into discrete events. One of these critical events is the test and qualification activity, which has been modelled using the method described in the next section.

3.3. Calculate Test and Qualification Costs through a Discrete-Event Qualification Model

In this phase, the duration and cost of each of the test and qualification (T&Q) activities are modelled with a Beta probability distribution function (or PDF) and estimated by a triangular distribution using three values for activity duration: best, most likely, and worse-case scenario durations. To model each T&Q activity, a cost and activity break-down is performed to include information about the number of test activities performed and their duration, and the resources used in the tests such as number of engineers/technicians, equipment implemented, or consumables used. This estimation has been extensively implemented by authors such as Browning and Eppinger [33] or Wu [55].
Compared to previous studies, the qualification model presented in this paper puts a stronger emphasis on integrating design variables that affect the T&Q costs and duration. This is done by defining ‘test and qualification drivers’ for each activity, and activity driver rates for each driver. This process in similar to that adopted by Ben-Arieh and Qian [34] in the manufacturing domain. In their work, the authors identified activity cost drivers (ACD) for manufacturing processes. Then, dividing the total activity cost by the number of cost drivers, they defined activity cost driver rates (ACDR) for each ACD. In the T&Q model presented in this paper, the duration and cost of such activities can be modeled in relation to a product’s architectural features by implementing the identified T&Q drivers and driver rates. For example, a qualification driver for the TSU is ‘components with firmware’. Defining the value of such qualification driver for the TSU and multiplying it by the corresponding driver rate (e.g., 8 days/component with firmware), it is possible to identify the time and the cost to test and qualify the TSU alone. This process is repeated for each EP sub-system. After identifying the T&Q driver and driver rates for each activity, a discrete-event simulation model is built from an activity-based diagram (e.g., Program Evaluation and Review Technique, PERT [33]) to calculate the total duration of the T&Q phase. The motivation for a discrete-event simulation model is that the test and qualification activities may be performed in parallel and in series. This means that the total duration depends on the completion of the precedent activities. For example, the testing of the TSU in Option 4 can be conducted in series or in parallel to the testing of other activities. However, the coupling test with the other parts of the systems needs to wait for the input from the sub-systems that are coupled to the TSU. The results of the T&Q model are used to populate the test and qualification cost in Equation (1).

3.4. Generate Market Scenarios and Run First Surplus Value Assessment

From Equation (1) it can be noted that assessing the surplus value of the design options requires to make assumptions regarding the markets and missions of megaconstellation business scenarios. As presented in Section 2.2, the size of a megaconstellation is likely to depend on the trade-off between the need for coverage and the launch cost incurred to introduce the satellites in orbit [40]. The lower the altitude the more satellites have to be built to provide coverage. On the other hand, the higher the altitude, the higher each launch cost. For this reason, the industrial partners were interested to apply the surplus value model on three market scenarios, each distinguished by different mission and economical characteristics:
  • Market 1: this market considers the case of a more ‘conservative’ megaconstellation with a relatively small number (300) of heavy satellites to be operated in “high-LEO” orbits (1500 km).
  • Market 2: this market represents the case of a megaconstellation with high number (900) of medium-sized satellites that operate in “medium-LEO” orbits (1200 km).
  • Market 3: this scenario features a more advanced business scenario in which a very high number (4000) of small satellites operate in “low-LEO” orbits (800 km). Also, this market features the case of more favorable conditions in terms of launch cost (e.g., considering the case of a cheaper launcher being developed) and a more aggressive launch strategy with a higher number of satellites that can fit in a single launch.
The input data characterizing each of these market scenarios are detailed in Table 1.
For the first run of the surplus value model, the different options have been analyzed considering only Market 1. Figure 5 displays the surplus value over the lifecycle. The actual values for the surplus value have been omitted. For the first run of the surplus value model, six options have been considered. The reason for this is that in the flexible options (Option 3 and Option 4 in Figure 4) the xenon or krypton have been simulated separately. The model has been run for 30 years. In Figure 5, only the results for the first 15 years are visualized. The data regarding SV has been normalized to preserve company sensitive information. The value of each SV has been normalized based on the highest value (i.e., the highest SV corresponds to 1 in the normalized scale).
To further comprehend the results of the surplus value model, the tradespace between lifecycle costs (LCC) and SV is shown in Figure 6. The data regarding SV and LCC have been normalized. The values of each SV and LCC have been normalized based on the highest value (i.e., the highest SV and LCC corresponds to 1 in the normalized scale).
The results indicate:
  • Option 1 (single development xenon) presents highest surplus value and lowest LCC.
  • The high test and qualification costs (i.e., non-recurring costs) involved in the development a high-performance and reliable krypton option (equal to a mature xenon option available today) does not overweight its benefits.
  • Developing a flexible option (compatible with both xenon and krypton) in an efficient way (with lower test and qualification costs than a high-performance xenon and krypton option, Figure 6) does not overweight its benefits, due to the lower performance levels and lower reliability levels involved in this option.
  • Increasing the reliability levels on the flexible option by adding a redundant thruster and TSU does not overcome its benefits, as additional costs and weight are introduced due to the addition of these new components. Also, the test and qualification are increased with this alternative, as the TSU needs to be developed, tested and qualified.
The results of Figure 6 indicate how there is no incentive to increase reliability in megaconstellations (i.e., the propulsion systems will be provided with single-string failure and zero redundancy). Also, the results of this first run of the surplus value model indicate how—for Market 1 (Table 1)—Option 1 presents highest surplus value. However, the results of the first run do not account for fluctuations and uncertainties of the market parameters. Such fluctuations have an impact on the customers’ preferences for a xenon-based EP or a krypton-based EP. The next section will describe how such uncertainties have been implemented in the model.

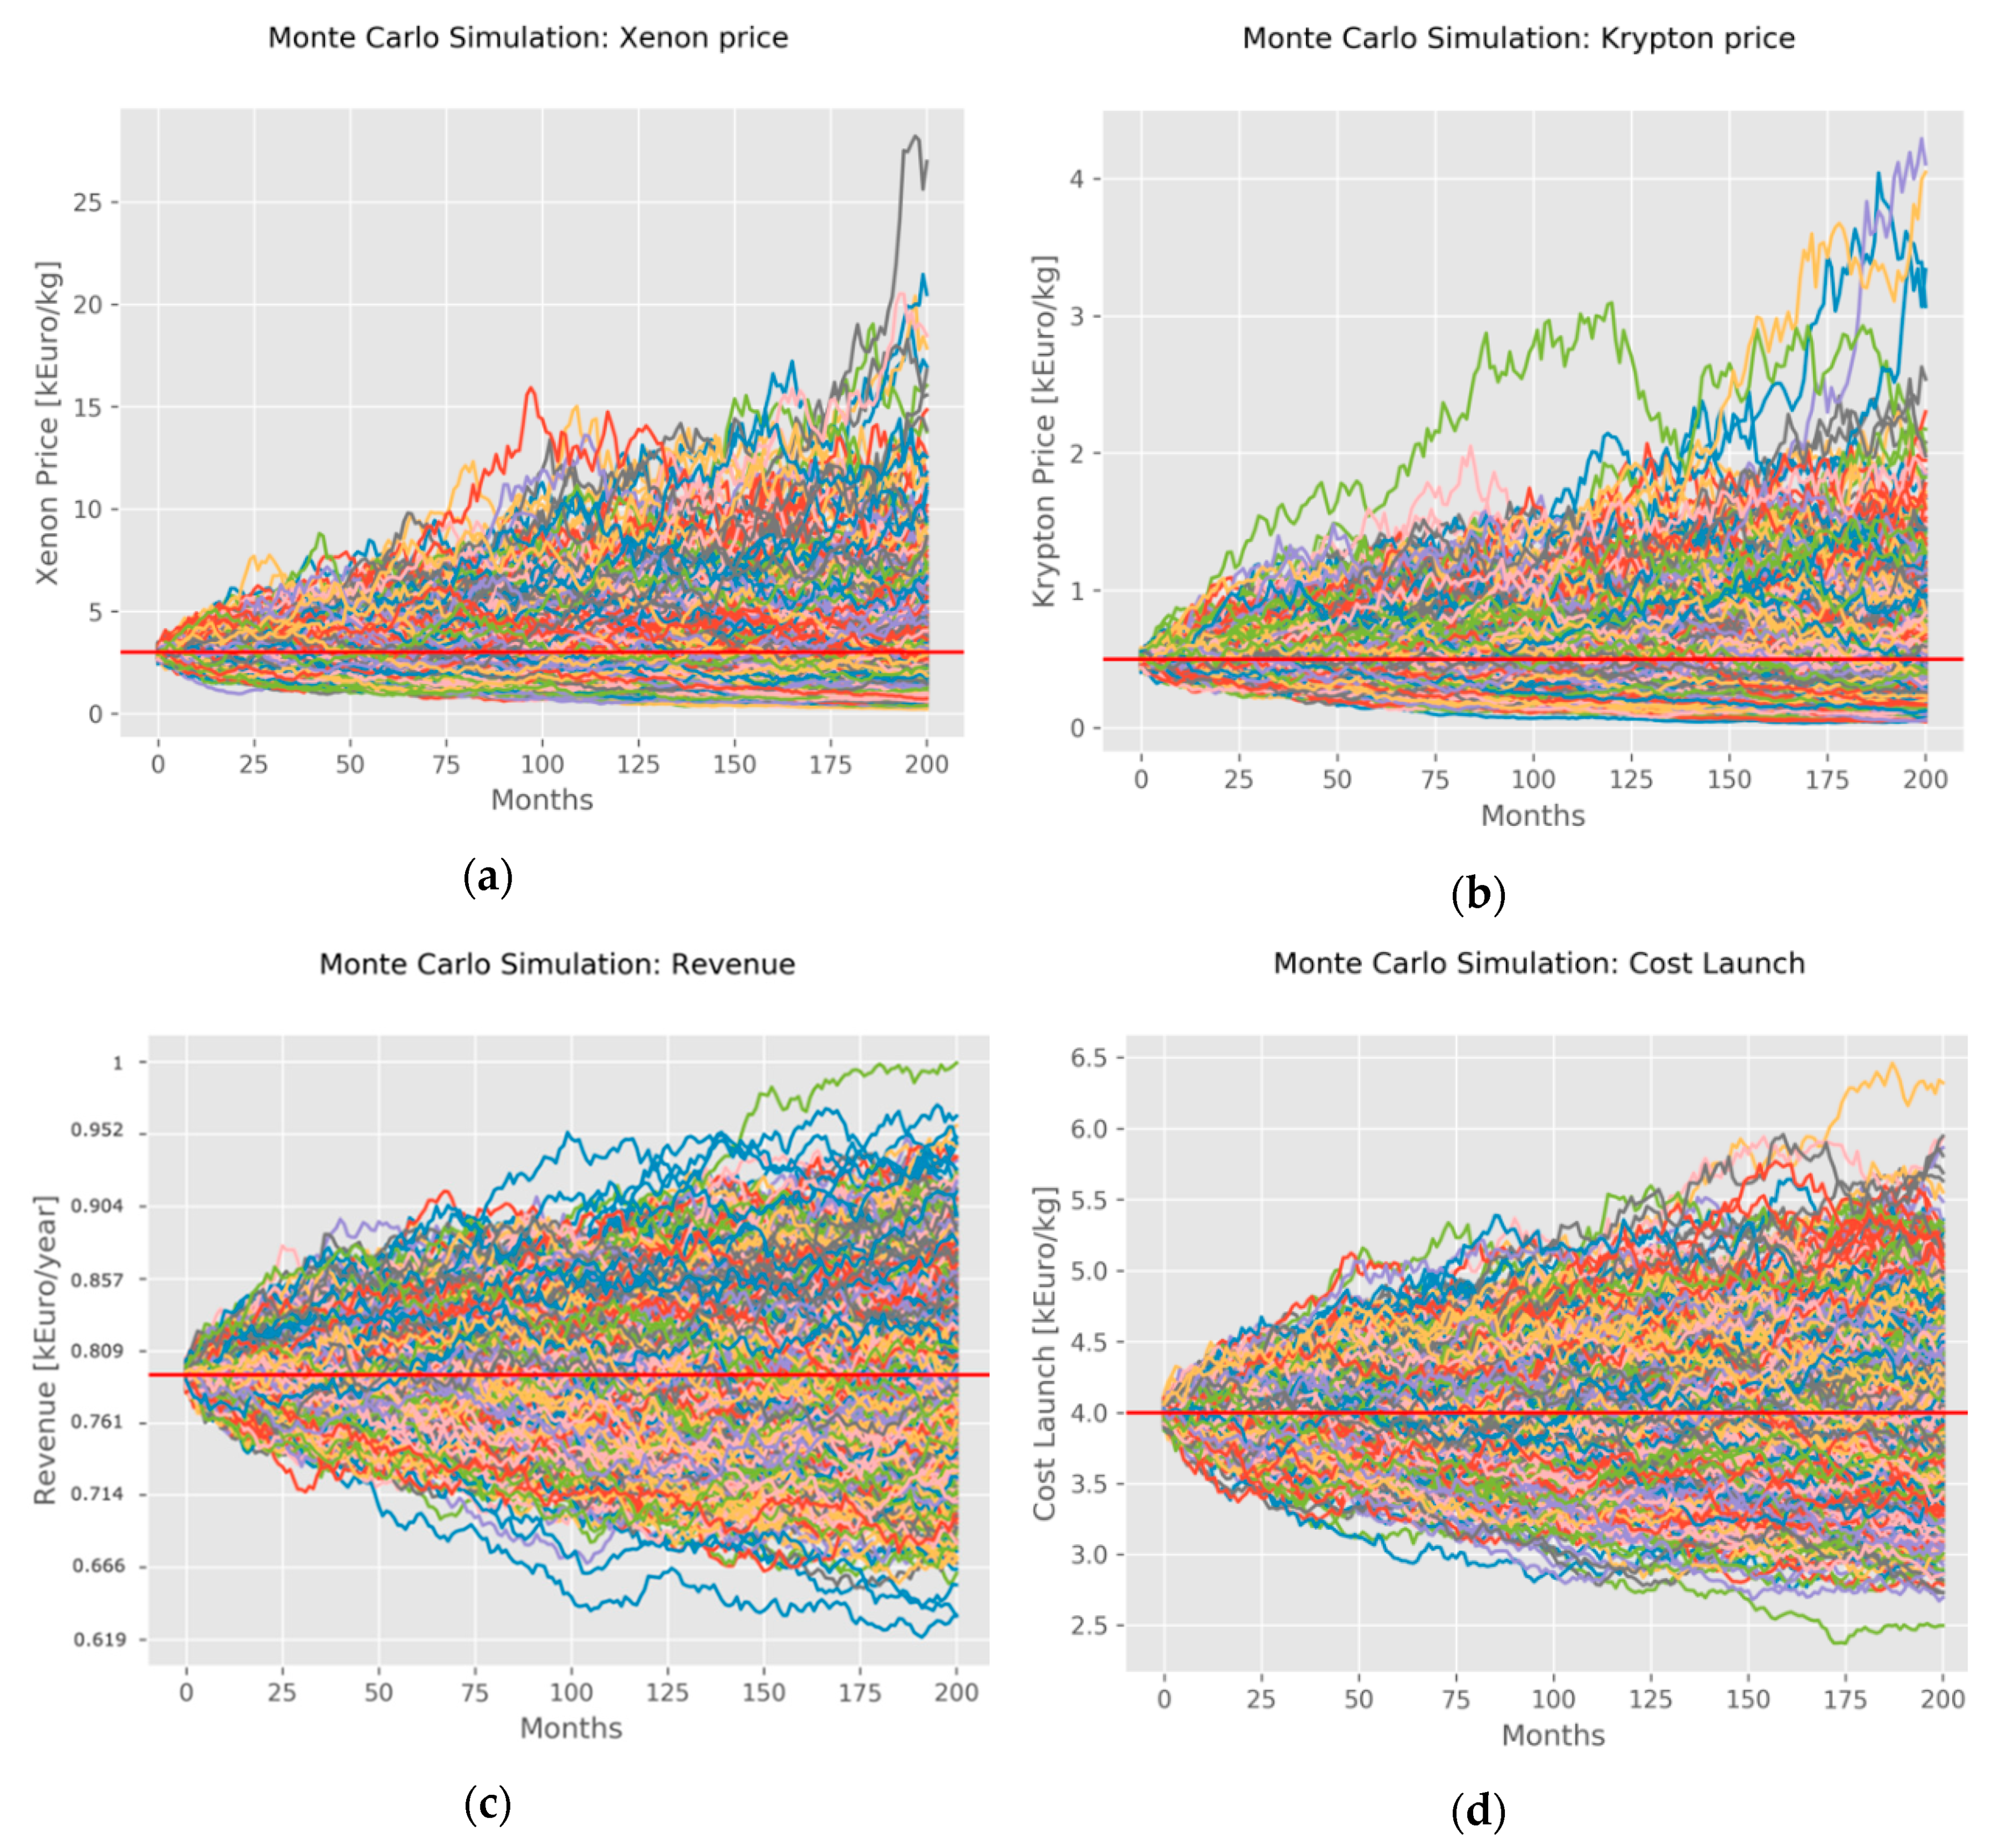
3.5. Introduce Uncertainty of Input Market Data in the Surplus Value Model

The input data for the three markets displayed in Table 1 are based on nominal values and assumptions. These parameters are highly uncertain and impact the choice of customers and stakeholders. The sources of uncertainty in future megaconstellation applications are represented by:
  • The future prices of xenon and krypton. These parameters impact the cost of the propellant required to enter the operational orbit.
  • The revenue that the operators will generate from megaconstellation businesses. This parameter impacts the benefit of higher thrust, as the operator can enter in operation earlier and thus start to generate revenues earlier. At the same time, this parameter also impacts the benefit of higher reliability, since there is less probability of losing the mission during operation.
  • The cost of launch per kilogram. This parameter impacts the overall launch cost for the satellite constellations, which is a decisive factor to determine the impact of the wet mass of the EP.
To represent the uncertainty of these parameters in the surplus value model, a Wiener model was adopted. The Wierner model assumes that a parameter varies over time following a Brownian motion. This assumption is commonly used in the financial domain to model the price of a stock [25].
The Wiener model assumes that the price of a stock is depending on the price at the previous time interval and a parameter which represents the volatility of the stock price. The volatility parameter “scales” the uncertainty in future prices. The Wiener model involves random variables, in which the volatility is varied randomly over time. A common method to run a Wiener model is based on Monte Carlo simulation, in which a very high number of price variations scenarios are considered. Figure 7 shows the Monte Carlo simulation of 1000 scenarios, in which the four critical parameters (xenon price; krypton price; revenue per year; cost launch per kg) are varied. The data regarding the Revenue per year (Figure 7c) is normalized to preserve company sensitive information. The value of each revenue per year has been normalized based on the highest value (i.e., the highest value corresponds to 1 in the normalized scale). However, the normalized data are still within “assumable” ranges for a practitioner working in the electric propulsion business. Based on the partners’ assumptions, the volatility of the krypton price has been considered lower than the fluctuation of the xenon price (due to the reasons given in Section 3.1). How the variation of these parameters impacts the way of looking at the 4 alternatives (Figure 4) is presented in the next section.

3.6. Calculate Surplus Value of Alternatives, Visualize Results and Make Decisions

The value assessment under uncertainty of the four options (single development—Xe, double development—Xe Kr, flexible development—Xe Kr, flexible development—reliability improved) was conducted by to establishing ‘transition rules’ [25] to simulate the customers’ preferences for a xenon-based EP or a krypton-based EP. The assumption made in this study is that customers possess a financial model such as the surplus value to make such a decision. If the surplus value of a xenon-based EP is higher than the krypton alternative, the xenon alternative is preferred. Conversely, if the surplus value of a krypton-based EP is higher than the xenon alternative, the krypton alternative is preferred instead. This means that for Option 1 (single development—Xe) when the customers select a krypton option a business opportunity is lost for the manufacture (as customers purchase a krypton option from a competitor). Therefore, the model assumes that another manufacturer has developed a competing krypton option. Table 2 shows the number of chosen xenon-based EP and krypton-based EP after 500 runs of the Surplus Value model, considering the variations in parameters shown in Figure 7. In these new runs of the Surplus Value model, all the three markets in Table 1 are taken into account.
Since the manufacturer does not exactly know when a certain market will take off, this uncertainty was also included. The assumption made is that Market 1 will take off between 0 and 5 years from today, while Market 2 will take off between 5 and 10 years. Market 3, which represents a more advanced megaconstellation scenario (Table 1) will take off between 10 and 15 years from today. This means that at every run of the surplus value model the starting point of the business is changed. For every run, the parameters in Figure 7 are changing depending on the time of the business start. Another assumption made is that the test and qualification costs are removed from the surplus values of options sold in Market 2 and Market 3. The motivation is that are already developed to respond to the sales demanded in Market 1.
From the results of Table 2, it is visible how Option 1 represents a source of missed opportunities for the manufacturer, and that these missed opportunities increase for future markets. For example, in Market 2 in 6 cases (out of 500) the customers have chosen a Krypton option. For Market 3, these missed opportunities increase (336 out of 500). This is due to the fact that in Market 3 the differences in fluctuations in prices between xenon and krypton are higher than the other markets (Figure 7a,b).
In Option 2 these opportunities are instead exploited by the manufacturer. The impact of Option 2 can be further understood in Figure 8, which shows the tradespace between surplus value and lifecycle costs for the different options, considering the transitions between the different markets (after 500 simulations). The data regarding SV and LCC have been normalized. In Figure 8, the higher uncertainties in prices can be seen by the larger “spread” of SV and LCC for Market 2 and Market 3, compared to Market 1. Please note that ‘0–5 years’ for Market 1 means that the model considers the start of the business in a stochastic way (i.e., Market 1 starts randomly between 0 and 5 years from today). The same goes for Market 2 and Market 3.
Figure 9 only shows the average surplus value and lifecycle costs point after the 500 simulation runs. The figures show how Option 2 becomes more beneficial than Option 1 considering different and uncertain markets. This is because the manufacturers can offer both a xenon-based EP and a krypton-based EP. At the same time, the higher test and qualification costs involved in Option 2 have been “depreciated” and not taken into account, since the system has already been developed to respond to the needs of Market 1.
Figure 9 shows how the costs involved for the test and qualification of two optimized systems for xenon and krypton do not overweight the benefit of a flexible approach strategy (Option 3, flexible development—Xe Kr) in which a system compatible with both xenon and krypton is developed accepting lower performance and reliability levels than Option 2. This is also due to the fact that in Market 2 and Market 3 performance aspects can be down emphasized, as the operational orbits are lower. In this scenario, production and integration aspects become more prominent. Figure 10 summarizes all the scenarios by presenting the average surplus value and lifecycle costs for the different options in all the markets. The data regarding SV and LCC have been normalized by taking into account the maximum values of SV and LCC after 500 runs for all the different markets.
In Figure 10, it can be seen that Option 3 presents the highest surplus value. At the same time, increasing the reliability levels in Option 4 by adding a redundant thruster and TSU does not overcome its benefits, as additional costs and weight are introduced due to the integration of these new components in production. Also, the test and qualification are increased with this alternative, as the TSU needs to be developed, tested and qualified. These results indicate how there is not an incentive to increase reliability in megaconstellations (i.e., the propulsion systems will be provided with single-string failure and zero redundancy). A single-string failure propulsion system with zero redundancy (Option 3) has higher value than the same option with a redundant thruster (Option 4). This resonates with the notion that unless there are strict de-orbit regulations worldwide, all constellations will have “bare minimum” EP capability. In Figure 10, the redundant option is, however, superior than a single-string failure propulsion system optimized for performances, but with substantial non-recurring costs for developing such an optimized system.

4. Discussion

This paper has presented situations from an ongoing development initiative that demonstrates how the satellite business is becoming a very innovative and dynamic business environment. This requires designing highly flexible architectures to cope with such dynamicity. However, the flexibility enabled in the architecture needs to be quantified and traded off with other attributes of a design (such as performances and qualification ability) in order to make robust decisions [22].
Previous studies (e.g., [56]) have discussed the flexibility implications of space propulsion architectures by varying design parameters (e.g., required/targeted Isp vs. Mass). Compared to these previous studies, this paper focused more on the difficulty of including uncertainty in market behavior during architecture trade studies—which have a profound impact on which architecture is preferred [22,23,25]). To support these decisions, this paper has adapted and refined existing techniques (e.g., surplus value, discrete-event simulation, tradespace exploration) in a methodology (Figure 3). The use of the methodology is illustrated through an industrial case related to the study of xenon vs. krypton architectures for megaconstellation businesses. The purpose of the proposed case study is to demonstrate the methodology in an industrially relevant set-up, rather than a detailed comparison between alternative propellant systems. For the industrial partners, the use of the methodology has contributed to quantify the ‘thought process’ of satellite and propulsion engineers into value-based models [57]. This has been considered beneficial in order to promote monetary value assessment during the component and sub-system design and development activities. One program manager reported: “we often do these calculations at the beginning of a project or program, but not when we are doing design work at sub-system or component level”. This was considered very important for engineering teams to be able to present and communicate the impact of alternative technological concepts to program managers and decision-makers. Therefore, the objective of this paper is to provide insights into how to apply the proposed methodology in other case studies, for example multimode space propulsion [56].
Regarding the results of the case study, some aspects require further attention and future work. The analysis of the xenon vs. krypton choice presented in this paper has a layer missing, which is the storage density. Xenon stores are about three times denser than those of krypton, so for a given mission/deltaV requirement, a krypton tank would be almost three times as big as the xenon tank. This can become a problem for “small spacecraft” constellations where the propellant system is the major volume driver (conversely, less of a problem for bigger satellites). Therefore, there actually exists a scenario that, despite xenon costing six times more than krypton, “smaller” xenon-fueled spacecraft would enable more satellites per launch and thus save the total amount of needed launches. The authors reserve the analysis of the impact of satellite size at system level (considering the different tank volumes required by xenon and krypton) for future publications. The reason for this is that the contributions of the paper (described in the paragraph above) are mainly on the real-life applications of value-based methodologies, rather than a detailed analysis of the xenon vs. krypton choice.
To quantify flexibility and qualification ability, this paper has adapted and refined existing techniques (e.g., surplus value, discrete-event simulation, tradespace exploration). While such refinements can be considered incremental from a methodological standpoint, the real contributions of the paper are twofold. From a research perspective, this paper has contributed by applying the surplus value equation—as formulated originally in VDD [19]—in a long industrial project with many iterations and partners involved. Such a consistent and systematic use of surplus value has not yet been studied [58,59]. Therefore, the paper has extended the research on the use of value-based approaches, working with real-life examples. Also, the methodology has adopted a Monte-Carlo simulation approach to introduce uncertainty in the model. The model however seeks to optimize surplus value, which is the ultimate objective function. This means that optimization techniques, such as genetic algorithms (GA) could be applied. Combinations of Monte-Carlo simulation with GA are present in literature [60]. Future work will focus on the application of such optimization techniques.

5. Conclusions

This paper has demonstrated that (1) the business dynamics are likely to have a significant impact on early design decisions and (2) the presented methodology (Figure 3) enables such business factors to be included in the tradespace. Designers, together with program management, can thus make more informed decisions already during design.
The use of the methodology is illustrated through an industrial case related to the study of xenon vs. krypton architectures for megaconstellation businesses. The purpose of the proposed case study was to demonstrate the use of the methodology in a relevant industrial case, rather than a detailed comparison between alternative propellant systems. The novelty of the methodology (compared to previous studies) is the ability to include variations in market behavior, beyond variations of ‘traditional’ attributes such as masses and performance. Therefore, this paper has focused more on providing the input data regarding the variation of the market parameters, while deliberately avoiding disclosing input values of the architectures (e.g., performances, masses) to protect company sensitive information.
Some aspects of the proposed methodology (Figure 3) require further attention and future work. The underlying modelling approach needs training and a dedicated effort that necessitates a time investment. Moreover, the quality of the models used—as any model—depends on how well they have been created and what data are actually used. The findings provided in this paper suggest that when working with design teams, quantifying relationships may be a useful exercise since it was found to be beneficial to systematically question the assumptions made.

Author Contributions

Conceptualization: M.P.; Formal analysis: M.P.; Investigation: M.P. and O.B.; Methodology, M.P. and O.B.; Resources: O.B.; Writing—original draft: M.P.; Writing—review & editing, M.P., O.B. and O.I. All authors have read and agreed to the published version of the manuscript.

Funding

This work was supported by the CHEOPS project (Consortium for Hall Effect Orbital Propulsion System) which has received funding from the European Union’s Horizon 2020 research and innovation programme under Grant 730135.

Conflicts of Interest

The authors declare no conflict of interest.

References

  1. Öhrwall Rönnbäck, A.B.; Isaksson, O. Product development challenges for space sub-system manufacturers. In Proceedings of the DESIGN 2018 15th International Design Conference, Dubrovnik, Croatia, 21–24 May 2018; pp. 1937–1944. [Google Scholar]
  2. Reid, T.G.; Neish, A.M.; Walter, T.F.; Enge, P.K. Leveraging commercial broadband LEO constellations for navigation. In Proceedings of the 29th International Technical Meeting of the Satellite Division of the Institute of Navigation (ION GNSS+ 2016), Portland, ON, USA, 12–16 September 2016. [Google Scholar]
  3. Alvarez, J.; Walls, B. Constellations, clusters, and communication technology: Expanding small satellite access to space. In Proceedings of the 2016 IEEE Aerospace Conference, Big Sky, MT, USA, 5–12 March 2016; pp. 1–11. [Google Scholar]
  4. Golkar, A.; Cruz, I.L. The Federated Satellite Systems paradigm: Concept and business case evaluation. Acta Astronaut. 2015, 111, 230–248. [Google Scholar] [CrossRef]
  5. Kishi, N. Management analysis for the space industry. Space Policy 2017, 39, 1–6. [Google Scholar] [CrossRef]
  6. Malyy, M.; Tekic, Z.; Golkar, A. What Drives Technology Innovation in New Space? A Preliminary Analysis of Venture Capital Investments in Earth Observation Start-Ups. IEEE Geosci. Remote Sens. Mag. 2019, 7, 59–73. [Google Scholar] [CrossRef]
  7. Köchel, S.; Langer, M. New Space: Impacts of Innovative Concepts in Satellite Development on the Space Industry. In Proceedings of the 69th International Astronautical Congress, Bremen, Germany, 1–5 October 2018. [Google Scholar]
  8. Curzi, G.; Modenini, D.; Tortora, P. Large Constellations of Small Satellites: A Survey of Near Future Challenges and Missions. Aerospace 2020, 7, 133. [Google Scholar] [CrossRef]
  9. Pahl, G.; Beitz, W. Engineering Design: A Systematic Approach; Springer Science & Business Media: Berlin/Heidelberg, Germany, 2013. [Google Scholar]
  10. Worinkeng, E.; Joshi, S.; Summers, J.D. An experimental study: Analyzing requirement type influence on novelty and variety of generated solutions. Int. J. Des. Creat. Innov. 2015, 3, 61–77. [Google Scholar] [CrossRef]
  11. Ebert, C. Dealing with nonfunctional requirements in large software systems. Ann. Softw. Eng. 1997, 3, 367–395. [Google Scholar] [CrossRef]
  12. Raudberget, D.; Levandowski, C.; Isaksson, O.; Kipouros, T.; Johannesson, H.; Clarkson, J. Modelling and assessing platform architectures in pre-embodiment phases through set-based evaluation and change propagation. J. Aerosp. Oper. 2015, 3, 203–221. [Google Scholar] [CrossRef]
  13. Ross, A.M.; Rhodes, D.H.; Hastings, D.E. Defining changeability: Reconciling flexibility, adaptability, scalability, modifiability, and robustness for maintaining system lifecycle value. Syst. Eng. 2008, 11, 246–262. [Google Scholar] [CrossRef] [Green Version]
  14. Collopy, P.D. A System for Values, Communication and Leadership in Product Design. In Proceedings of the International Powered Lift, Conference Proceedings, Jupiter, FL, USA, 18–20 November 1997; pp. 95–98. [Google Scholar]
  15. Brown, O.C.; Eremenko, P.; Collopy, P.D. Value-centric design methodologies for fractionated spacecraft: Progress summary from phase 1 of the DARPA System F6 program. In Proceedings of the AIAA SPACE 2009 Conference & Exposition, Pasadena, CA, USA, 14−17 September 2009. [Google Scholar] [CrossRef] [Green Version]
  16. Panarotto, M. A Model-Based Methodology for Value Assessment in Conceptual Design. Ph.D. Thesis, Blekinge Institute of Technology, Karlskrona, Sweden, 2015. [Google Scholar]
  17. Panarotto, M.; Wall, J.; Bertoni, M.; Larsson, T.; Jonsson, P. Value-driven simulation: Thinking together through simulation in early engineering design. In Proceedings of the 21st International Conference on Engineering Design (ICED), Vancouver, BC, Canada, 21–25 August 2017. [Google Scholar]
  18. Huber, G.P. Multi-attribute utility models: A review of field and field-like studies. Manag. Sci. 1974, 20, 1393–1402. [Google Scholar] [CrossRef]
  19. Collopy, P.D.; Hollingsworth, P.M. Value-Driven Design. J. Aircr. 2011, 48, 749–759. [Google Scholar] [CrossRef]
  20. Vanhoucke, M.; Demeulemeester, E.; Herroelen, W. On maximizing the net present value of a project under renewable resource constraints. Manag. Sci. 2001, 47, 1113–1121. [Google Scholar] [CrossRef]
  21. Jugulum, R.; Frey, D.D. Toward a taxonomy of concept designs for improved robustness. J. Eng. Des. 2007, 18, 139–156. [Google Scholar] [CrossRef]
  22. Cardin, M.A. Enabling flexibility in engineering systems: A taxonomy of procedures and a design framework. J. Mech. Des. 2014, 136. [Google Scholar] [CrossRef] [Green Version]
  23. De Neufville, R.; Scholtes, S. Flexibility in Engineering Design; MIT Press: Cambridge, MA, USA, 2011. [Google Scholar]
  24. Huchzermeier, A.; Loch, C.H. Project management under risk: Using the real options approach to evaluate flexibility in R… D. Manag. Sci. 2001, 47, 85–101. [Google Scholar] [CrossRef]
  25. De Weck, O.; de Neufville, R.; Chaize, M. Enhancing the economics of communication satellites via orbital reconfigurations and staged deployment. In Proceedings of the AIAA Space 2003 Conference & Exposition, Long Beach, CA, USA, 23−25 September 2003; p. 6317. [Google Scholar]
  26. Kamrad, B.; Schmidt, G.M.; Ülkü, S. Analyzing product architecture under technological change: Modular upgradeability tradeoffs. IEEE Trans. Eng. Manag. 2013, 60, 289–300. [Google Scholar] [CrossRef]
  27. Viscito, L.; Ross, A. Quantifying flexibility in tradespace exploration: Value-weighted filtered outdegree. In Proceedings of the AIAA SPACE 2009 Conference & Exposition, Pasadena, CA, USA, 14−17 September 2009; p. 6561. [Google Scholar]
  28. Tahera, K.; Earl, C. Testing and PLM: Connecting Process and Product Models in Product Development. In Product Lifecycle Management-Terminology and Applications; IntechOpen: London, UK, 2018. [Google Scholar]
  29. ISO. ISO/IEC 12207:2008 [ISO/IEC 12207:2008]. Systems and Software Engineering—Software Life Cycle Processes ISO/IEC 12207:2008. 2008. Available online: https://www.iso.org/standard/43447.html (accessed on 5 September 2020).
  30. Shabi, J.; Reich, Y.; Diamant, R. Planning the verification, validation, and testing process: A case study demonstrating a decision support model. J. Eng. Des. 2017, 28, 171–204. [Google Scholar] [CrossRef]
  31. ISO. ISO/IEC/IEEE 15288:2015. Systems and Software Engineering—System Life Cycle Processes. 2015. Available online: https://www.iso.org/standard/63711.html (accessed on 5 September 2020).
  32. Engel, A.; Barad, M. A methodology for modeling VVT risks and costs. Syst. Eng. 2003, 6, 135–151. [Google Scholar] [CrossRef]
  33. Browning, T.R.; Eppinger, S.D. Modeling impacts of process architecture on cost and schedule risk in product development. IEEE Trans. Eng. Manag. 2002, 49, 428–442. [Google Scholar] [CrossRef] [Green Version]
  34. Ben-Arieh, D.; Qian, L. Activity-based cost management for design and development stage. Int. J. Prod. Econ. 2003, 83, 169–183. [Google Scholar] [CrossRef]
  35. Tahera, K.; Wynn, D.C.; Earl, C.; Eckert, C.M. Testing in the incremental design and development of complex products. Res. Eng. Des. 2019, 30, 291–316. [Google Scholar] [CrossRef] [Green Version]
  36. Taccogna, F.; Garrigues, L. Latest Progress in Hall Thrusters Plasma Modelling. Rev. Mod. Plasma Phys. 2019, 3, 12. [Google Scholar] [CrossRef]
  37. Mazouffre, S. Electric propulsion for satellites and spacecraft: Established technologies and novel approaches. Plasma Sources Sci. Technol. 2016, 25, 033002. [Google Scholar] [CrossRef]
  38. Lev, D.R.; Mikellides, I.G.; Pedrini, D.; Goebel, D.M.; Jorns, B.A.; McDonald, M.S. Recent progress in research and development of hollow cathodes for electric propulsion. Rev. Mod. Plasma Phys. 2019, 3, 6. [Google Scholar] [CrossRef]
  39. Lorand, A.; Duchemin, O.; Cornu, N. Next Generation of Thruster Module Assembly. In Proceedings of the 32nd International Electric Propulsion Conference, Wiesbaden, Germany, 11–15 September 2011. [Google Scholar]
  40. Massey, R.; Lucatello, S.; Benvenuti, P. The challenge of satellite megaconstellations. Nat. Astron. 2020, 4, 1022–1023. [Google Scholar] [CrossRef]
  41. OneWeb Satellite Constellation. In Wikipedia. Available online: https://en.wikipedia.org/wiki/OneWeb_satellite_constellation (accessed on 10 November 2020).
  42. Starlink. In Wikipedia. Available online: https://en.wikipedia.org/wiki/Starlink (accessed on 10 November 2020).
  43. SpaceNews. Telesat Preparing for Mid-2020 Constellation Manufacturer Selection. 2020. Available online: https://spacenews.com/telesat-preparing-for-mid-2020-constellation-manufacturer-selection/ (accessed on 10 November 2020).
  44. Geospatial World. How Many Satellites Orbit Earth and Why Space Traffic Management is Crucial. 2020. Available online: https://www.geospatialworld.net/blogs/how-many-satellites-orbit-earth-and-why-space-traffic-management-is-crucial/ (accessed on 10 November 2020).
  45. SpaceNews. Telesat Says Ideal LEO Constellation is 292 Satellites, But Could Be 512. 2020. Available online: https://spacenews.com/telesat-says-ideal-leo-constellation-is-292-satellites-but-could-be-512/ (accessed on 10 November 2020).
  46. OneWeb. 2020. Available online: https://www.oneweb.world/media-center/oneweb-files-for-chapter-11-restructuring-to-execute-sale-process (accessed on 5 April 2020).
  47. Goebel, D.M.; Katz, I. Fundamentals of Electric Propulsion: Ion and Hall Thrusters; John Wiley & Sons: Hoboken, NJ, USA, 2008; Volume 1. [Google Scholar]
  48. Hofer, R.R.; Randolph, T.M. Mass and cost model for selecting thruster size in electric propulsion systems. J. Propuls. Power 2012, 29, 166–177. [Google Scholar] [CrossRef]
  49. Castet, J.F.; Saleh, J.H. Satellite and satellite subsystems reliability: Statistical data analysis and modeling. Reliab. Eng. Syst. Saf. 2009, 94, 1718–1728. [Google Scholar] [CrossRef]
  50. Croes, V.; Tavant, A.; Lucken, R.; Martorelli, R.; Lafleur, T.; Bourdon, A.; Chabert, P. The effect of alternative propellants on the electron drift instability in Hall-effect thrusters: Insight from 2D particle-in-cell simulations. Phys. Plasmas 2018, 25, 063522. [Google Scholar] [CrossRef]
  51. Dragnea, H.C.; Ortega, A.L.; Kamhawi, H.; Boyd, I.D. Simulation of a Hall Effect Thruster Using Krypton Propellant. J. Propuls. Power 2020, 36, 335–345. [Google Scholar] [CrossRef]
  52. Andreussi, T.; Giannetti, V.; Leporini, A.; Ducci, C.; Estublier, D.; Edwards, C.; Rossodivita, A.; Andrenucci, M. Temporal evolution of the performance and channel erosion of a 5 kW-class Hall effect thruster operating with alternative propellants. In Proceedings of the 5th Space Propulsion Conference, Rome, Italy, 2–6 May 2016. [Google Scholar]
  53. Lev, D.; Misuri, T.; Albertoni, R.; Ducci, C.; Waldvogel, B.; Appel, L.; Eytan, R.; Dannemayer, K.; Di Cara, D. MEPS: A low power electric propulsion system for small satellites. In Proceedings of the 10th IAA Symposium on Small Satellites for Earth Observation, Berlin, Germany, 20–24 April 2015; pp. 20–24. [Google Scholar]
  54. Robinson, S. Simulation: The Practice of Model Development and Use; Wiley: Chichester, UK, 2004; Volume 50. [Google Scholar]
  55. Wu, C.L. Airline Operations and Delay Management: Insights from Airline Economics, Networks and Strategic Schedule Planning; Routledge: Abingdon-on-Thames, UK, 2016. [Google Scholar]
  56. Rovey, J.L.; Lyne, C.T.; Mundahl, A.J.; Rasmont, N.; Glascock, M.S.; Wainwright, M.J.; Berg, S.P. Review of multimode space propulsion. Prog. Aerosp. Sci. 2020, 118, 100627. [Google Scholar] [CrossRef]
  57. Panarotto, M.; Isaksson, O.; Habbassi, I.; Cornu, N. Value-Based Development Connecting Engineering and Business: A Case on Electric Space Propulsion. IEEE Trans. Eng. Manag. 2020. [Google Scholar] [CrossRef]
  58. Bertoni, M.; Bertoni, A.; Eres, M.H. Value Driven Design Revisited: Emerging Modelling Concepts and Applications. In Proceedings of the Design Society: International Conference on Engineering Design, Delft, The Netherlands, 5–8 August 2019; Cambridge University Press: Cambridge, UK, 2019; Volume 1, pp. 2407–2416. [Google Scholar]
  59. Soban, D.S.; Price, M.A.; Hollingsworth, P. Defining a research agenda in Value Driven Design: Questions that need to be asked. J. Aerosp. Oper. 2012, 1, 329–342. [Google Scholar] [CrossRef]
  60. Cantoni, M.; Marseguerra, M.; Zio, E. Genetic algorithms and Monte Carlo simulation for optimal plant design. Reliab. Eng. Syst. Saf. 2000, 68, 29–38. [Google Scholar] [CrossRef]
Figure 1. The increased production volumes expected for new space business scenarios is changing the way design trade-offs have to be considered.
Aerospace 07 00176 g001
Figure 2. Simplified schematic of a typical electric propulsion (EP) configuration and connection between main elements (figure adapted from Lorand et al. [39]).
Aerospace 07 00176 g002
Figure 3. Proposed method to trade flexibility and qualification ability against functional performances and unit costs.
Aerospace 07 00176 g003
Figure 4. Alternatives to embed flexibility in an EP architecture, in the case of change of type of propellant. Please note that Option 3 represents the case of a single string propulsion system that could mount a xenon tank or a krypton tank. This is symbolized by a red rhombus. Also, the asterisk (*) represents components that are sub-optimized (e.g., reduced efficiency) in order to enable flexibility.
Aerospace 07 00176 g004
Figure 5. Surplus value (SV) for the different options, considering Market 1. The data regarding surplus value have been normalized to preserve company sensitive information.
Aerospace 07 00176 g005
Figure 6. Tradespace between lifecycle costs (LCC) and SV for the different options, considering Market 1. The data regarding SV and LCC have been normalized to preserve company sensitive information.
Aerospace 07 00176 g006
Figure 7. 1000 scenario variations of market input data based on the Wiener stochastic model: (a) xenon price; (b) krypton price; (c) revenue per year; (d) cost launch per kg. The data regarding the revenue per year (c) are normalized to preserve company sensitive information. Each color line represents a single scenario (1000 scenario variations in total).
Aerospace 07 00176 g007
Figure 8. Tradespace between surplus value and lifecycle costs for the different options, considering the transitions between the different markets (500 simulations). The data regarding SV and LCC have been normalized. The positions of the satellites in the lower part of the figure are only demonstrative. Please note that ‘0–5 years’ for Market 1 means that the model considers the start of the business in a stochastic way (i.e., Market 1 starts randomly between 0 and 5 years from today).
Aerospace 07 00176 g008
Figure 9. Average surplus value for the different options, considering the transitions between the different markets. The positions of the satellites in the lower part of the figure are taken randomly. Please note that ‘0–5 years’ for Market 1 means that the model considers the start of the business in a stochastic way (i.e., Market 1 starts randomly between 0 and 5 years from today).
Aerospace 07 00176 g009
Figure 10. Average surplus value and lifecycle costs for the different options in all the markets.
Aerospace 07 00176 g010
Table 1. Input data for the market scenarios considered in the present study.
ParametersMarket 1Market 2Market 3
Final Orbit (km)15001200800
Constellation Size (Number of Satellites)3009004000
Min Constellation Size (Number of Satellites)100300500
Number of Satellites per Launch204060
Cost Xenon (k€/kg)333
Cost Krypton (k€/kg)0.50.50.5
Satellite Mass without EP (kg)800600400
Launch Cost per Kilo (k€/kg)431.9
Table 2. Number of chosen xenon-based EP and krypton-based EP after 500 runs of the surplus value model.
Market 1 (0–5 Years)Market 2 (5–10 Years)Market 3 (10–15 Years)
Opt 1Opt 2Opt 3Opt 4Opt 1Opt 2Opt 3Opt 4Opt 1Opt 2Opt 3Opt 4
Number xenon500500438269494494325481641641120
Number krypton00622310 (6)61754520 (336)336388500
Publisher’s Note: MDPI stays neutral with regard to jurisdictional claims in published maps and institutional affiliations.

