1. Introduction
The hybrid-electric propulsion is rather innovative technology used to combine the mechanical power generated by one (or more) electric drives with a thermal engine. It can be safely considered a mature and widely used solution in the automotive field, where it is emerging due to environmental concerns and he associated with the reduction of the operating costs due to the lower fuel consumption [
1]. Similar advantages are expected in the aeronautics field, where the application are still few and mostly limited to UAVs. In recent years a number of studies on the subject have been published, including several theoretical studies [
2,
3,
4,
5,
6,
7], definition of test benches [
8,
9,
10] and aircraft prototypes [
11,
12]. So far, the majority of the available literature is focused on the design and the performance analysis of one of two alternative architectures: the serial hybrid configuration and the parallel one. The serial hybrid solution is peculiar of the Diamond DA36 E-Star, the first aircraft equipped with a hybrid-electric propulsion system. In this solution, the thermal engine provides the mechanical power to an electrical generator, which hence supplies the electrical drive and its batteries [
11]. This architecture might be however not suitable for short haul airplanes, since it can excessively increase the mass of the propulsion system due to the several power conversion steps [
5]. The use of a parallel architecture, in which the two power sources are independently generated and combined through a gearbox, is then particularly attractive as it might entail a lighter propulsion system. Moreover it would allow to exploit different combinations of the two power sources to achieve the most efficient solution as a function of the operating conditions. In example, it could be possible to add the contribution of both the electric motor and the thermal engine during the maximum power demand, allowing a procedure known as powerboost, or using only the electric motor during less demanding mission segments, like the taxi mode.
The development of a hybrid propulsion system usually starts from a conceptual design of a hybrid aircraft given a set of high-level requirements. A rigorous methodology aimed at this conceptual design, starting from trade-off studies [
6], is provided in [
7]. The preliminary results of these analyses are then employed for the initial assessment of the components installed within the hybrid propulsion system, namely the propeller, the mechanical transmission, the internal combustion engine (ICE), the electrical machine, the batteries and the system controller. This assessment is preliminarily done through virtual models of the real components, which are aimed at investigating the transient and steady states. Furthermore, the integration of the components is evaluated through these virtual models, determining the connection and the exchange of parameters—e.g., torques, electric currents and gear ratios—and simulating the entire system. The development process can then proceed with the manufacture of a first system prototype or test bench, which is required for the performance assessment and then the certification of the new product.
Although a significant number of test bench architectures have been presented in the automotive field [
13,
14], only a handful of prototypes of aeronautical hybrid propulsion systems have been proposed. Flight Design’s test prototype presented in [
10] is a 1:1 mock-up version of a real hybrid parallel system. In this test bench, a 4-cylinder 1200 cm
3 Rotax 914 thermal engine is connected through a Poly-V belt with a synchronous permanent magnet electric motor. As the ICE reaches 85.8 kW and the peak power of the electrical machine (EM) amounts to 30 kW, the system is designed to generate a surplus of propulsive power during the simulation of certain phases of the mission profile, as the take-off (powerboost functionality). In this condition, the EM is supplied by a 21 Ah lithium-iron-phosphate (LiFePO
4) battery pack characterized by an electric voltage of 130 V. The hybrid system test bench is eventually completed by an electronic controller, aimed at monitoring and managing the power demand of each component. Although extremely useful as technological demonstrators, 1:1 prototypes are usually too expensive and too complex to manage during the early phase of the development activities. As such, scale-down benches have also been proposed. In [
8], for instance, the hybrid drive is obtained connecting a 1.18 kW gasoline engine with a nearly 0.7kW DC brushless EM. The ICE and the EM both move a variable speed propeller through a fixed 1:1 gear ratio. This test bench allows the simulation of the powerboost and the traditional flight—i.e., the EM operating as generator–functionalities. Furthermore, for safety and economic reasons, the behavior of certain components might be simulated installing other kinds of equipment, for instance replacing the thermal engine with an EM, or simulating the behavior of a component by means of a virtual model. A similar approach is presented also in [
9] for a UAV application.
The virtualization of part of the test bench is pretty common in the automotive field, as reported in [
14], where the electric energy storage has been replaced with a software-in-the-loop. The same procedure is usually applied in complex aeronautic test benches and Iron Birds, where aerodynamic forces acting on flight control surfaces are often reproduced by an hydraulic servo-actuator suitably controlled by a dedicated software [
15,
16], while it is still rather uncommon for propulsion systems.
Aim of the presented study is the definition of an original methodology for the development of a virtual test bench for a hybrid propulsion system working close to 0.4 MW to be applied to a new UAV under development. After presenting the architecture of the real propulsion system, consisting essentially of an ICE, an EM, a gearbox (G), a propeller (P), a battery (B), the virtual test bench composed by three electric servomotors (EM1, EM2 and EM3) and by the battery simulator is described. The dynamic relationships expressing the transmission of torque between the components, and the method of down-sizing the power delivered are highlighted. Particular attention is given to the real inertia actions that must be simulated on the virtual test bench. The simulation of the take-off flight phase is then proposed, and the obtained results are used to verify the corresponding time histories expected in the real architecture. In the conclusive section, limitations and possible future developments of the proposed work are presented.
2. General Overview of the Virtual Test Bench
A virtual test bench is a simulation environment developed before the real test bench to support its design according to a model-based philosophy and to verify its results once it is made available.
Like real test benches, virtual test benches might be scaled down for different reasons such as space management and cost. An important parameter is the scale factor, which is the ratio between the power installed on the test bench—virtual or physical—and the power installed on the real propulsion system. Being defined and supported by analytical relationship, it allows one to emulate the real system behavior under both static and dynamic conditions. To this end, not only the installed power shall be scaled, but also the physical inertia of each component. This last aspect is particularly important during the study of transitory behaviors such as the startup of the thermal engine, sometime performed by exploiting the inertia of the propeller without adopting a dedicated starter equipment.
Moreover, according to the specifications of the aircraft, a virtual bench may be used for the verification of the degree of hybridization, which is meant as the ratio among the propulsive power generated by the electric drive over the total propulsive power. Therefore, the best solution in terms of fuel consumption, weight and energy management might be defined. More generically, the architecture of the test bench meant as the integration and the interconnection of all the system components might be more appropriately assessed through a virtual model.
Starting from a set of initial specifications of the aircraft, a virtual test bench provides a reliable environment for predicting the impact of changes and perform upgrades. It can represent a useful and cheap tool not only for preliminary design of a physical test bench but also for the definition of the validation tests plans by simulating several test scenarios in advance. In example, the virtual test bench can be exploited to easily simulate different operative modes reported in
Table 1.
It is also true that the virtual test bench cannot replace the physical test bench in terms of certification of the test bench itself or of the results obtained, so the virtual test bench can represent only a preliminary step of the development process. In this preliminary phase, the results obtained can be considered acceptable when the behavior of the quantities derived from the simulation, is compatible with those expected in the associated flight phase.
3. Reference Architecture and Scaling Methodology
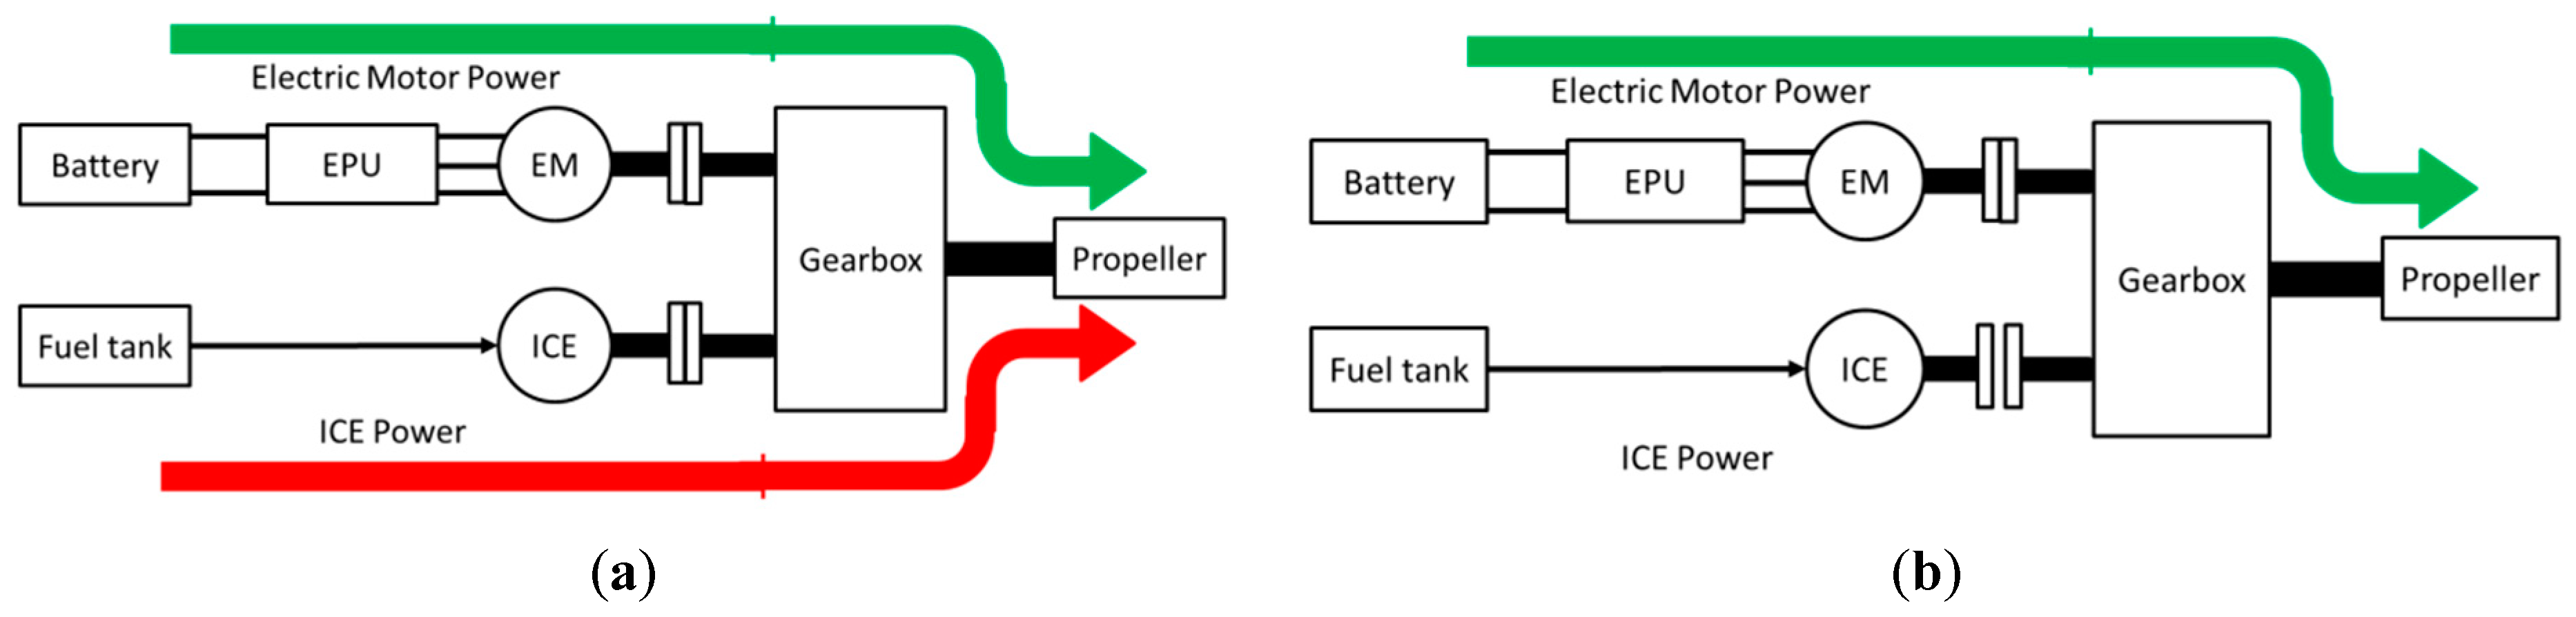
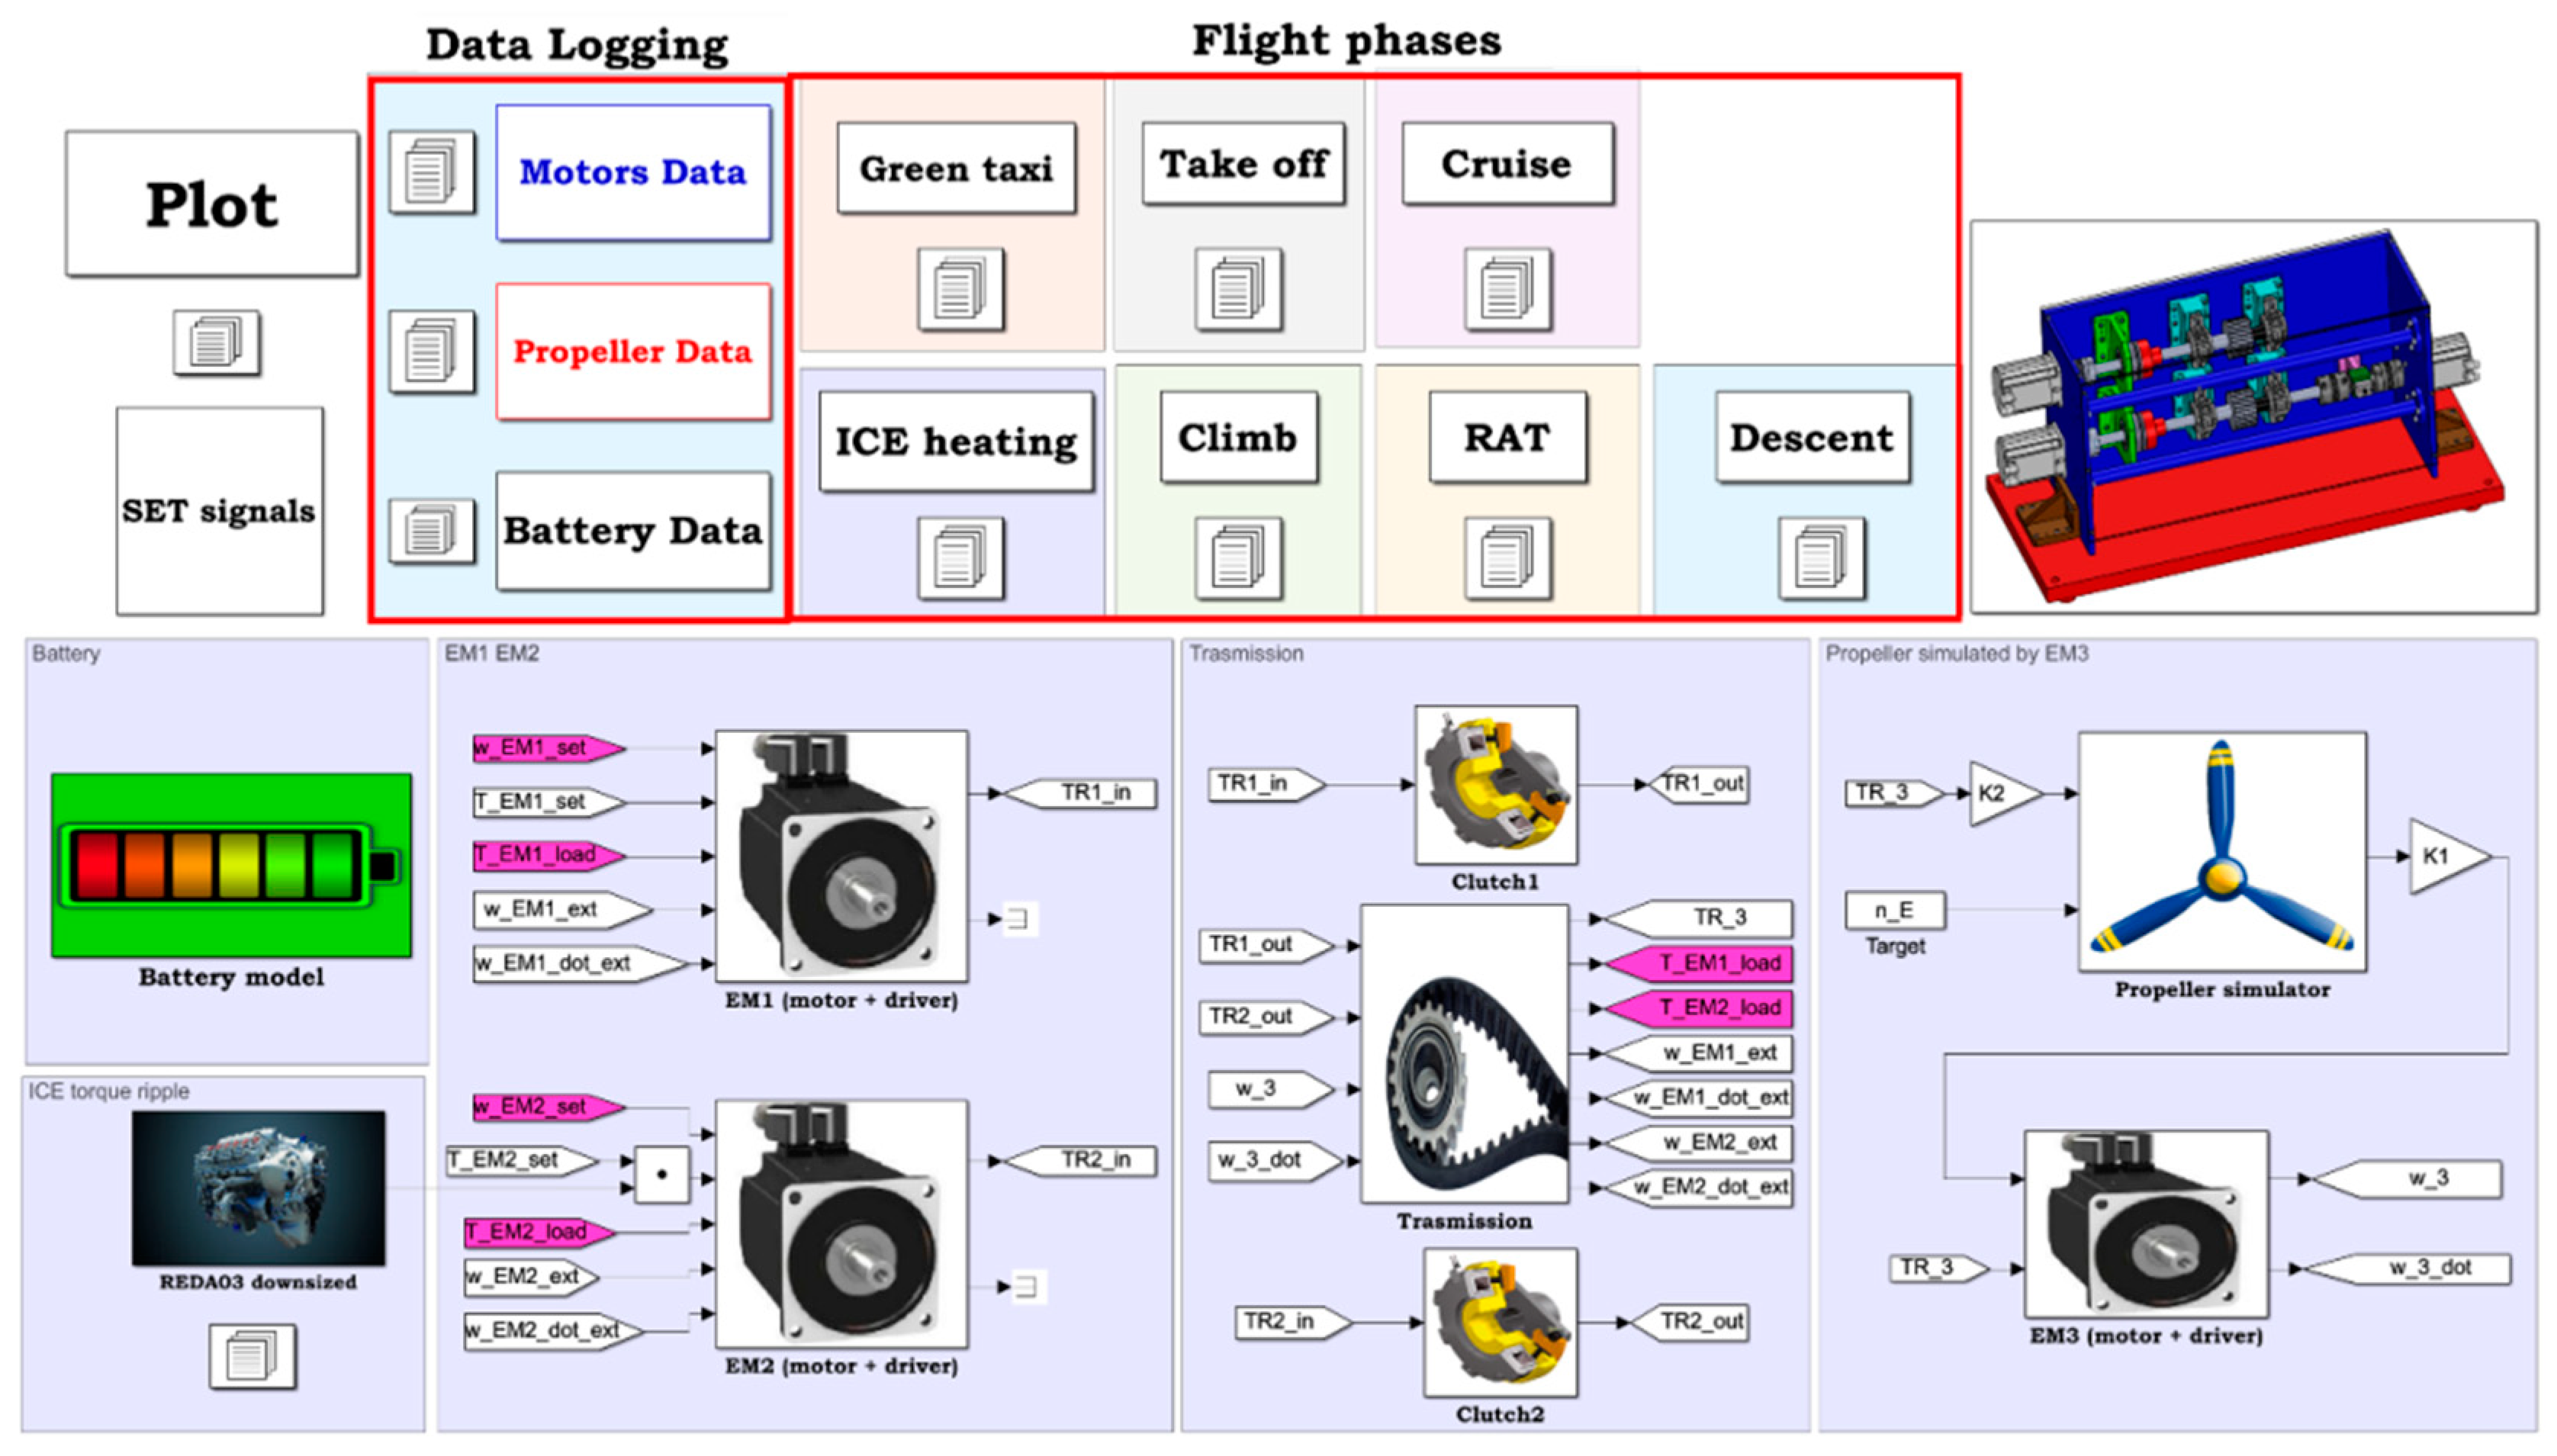
The test bench is designed to mirror the architecture of the real parallel hybrid propulsion system, which functional scheme is shown in
Figure 1. The electric drive is up made of a battery, the electronic power unit (EPU) controlling the EM and a clutch used to disconnect the drive from the rest of the system if needed. The ICE is instead supplied from a fuel tank and provides power to the gearbox through another electro-mechanical clutch which can be disengaged during the green taxi operations. In the test bench, the installed power of approximately 400 kW is appropriately scaled to allow for a realistic representation of the flight conditions for different operative modes both for static and dynamic cases.
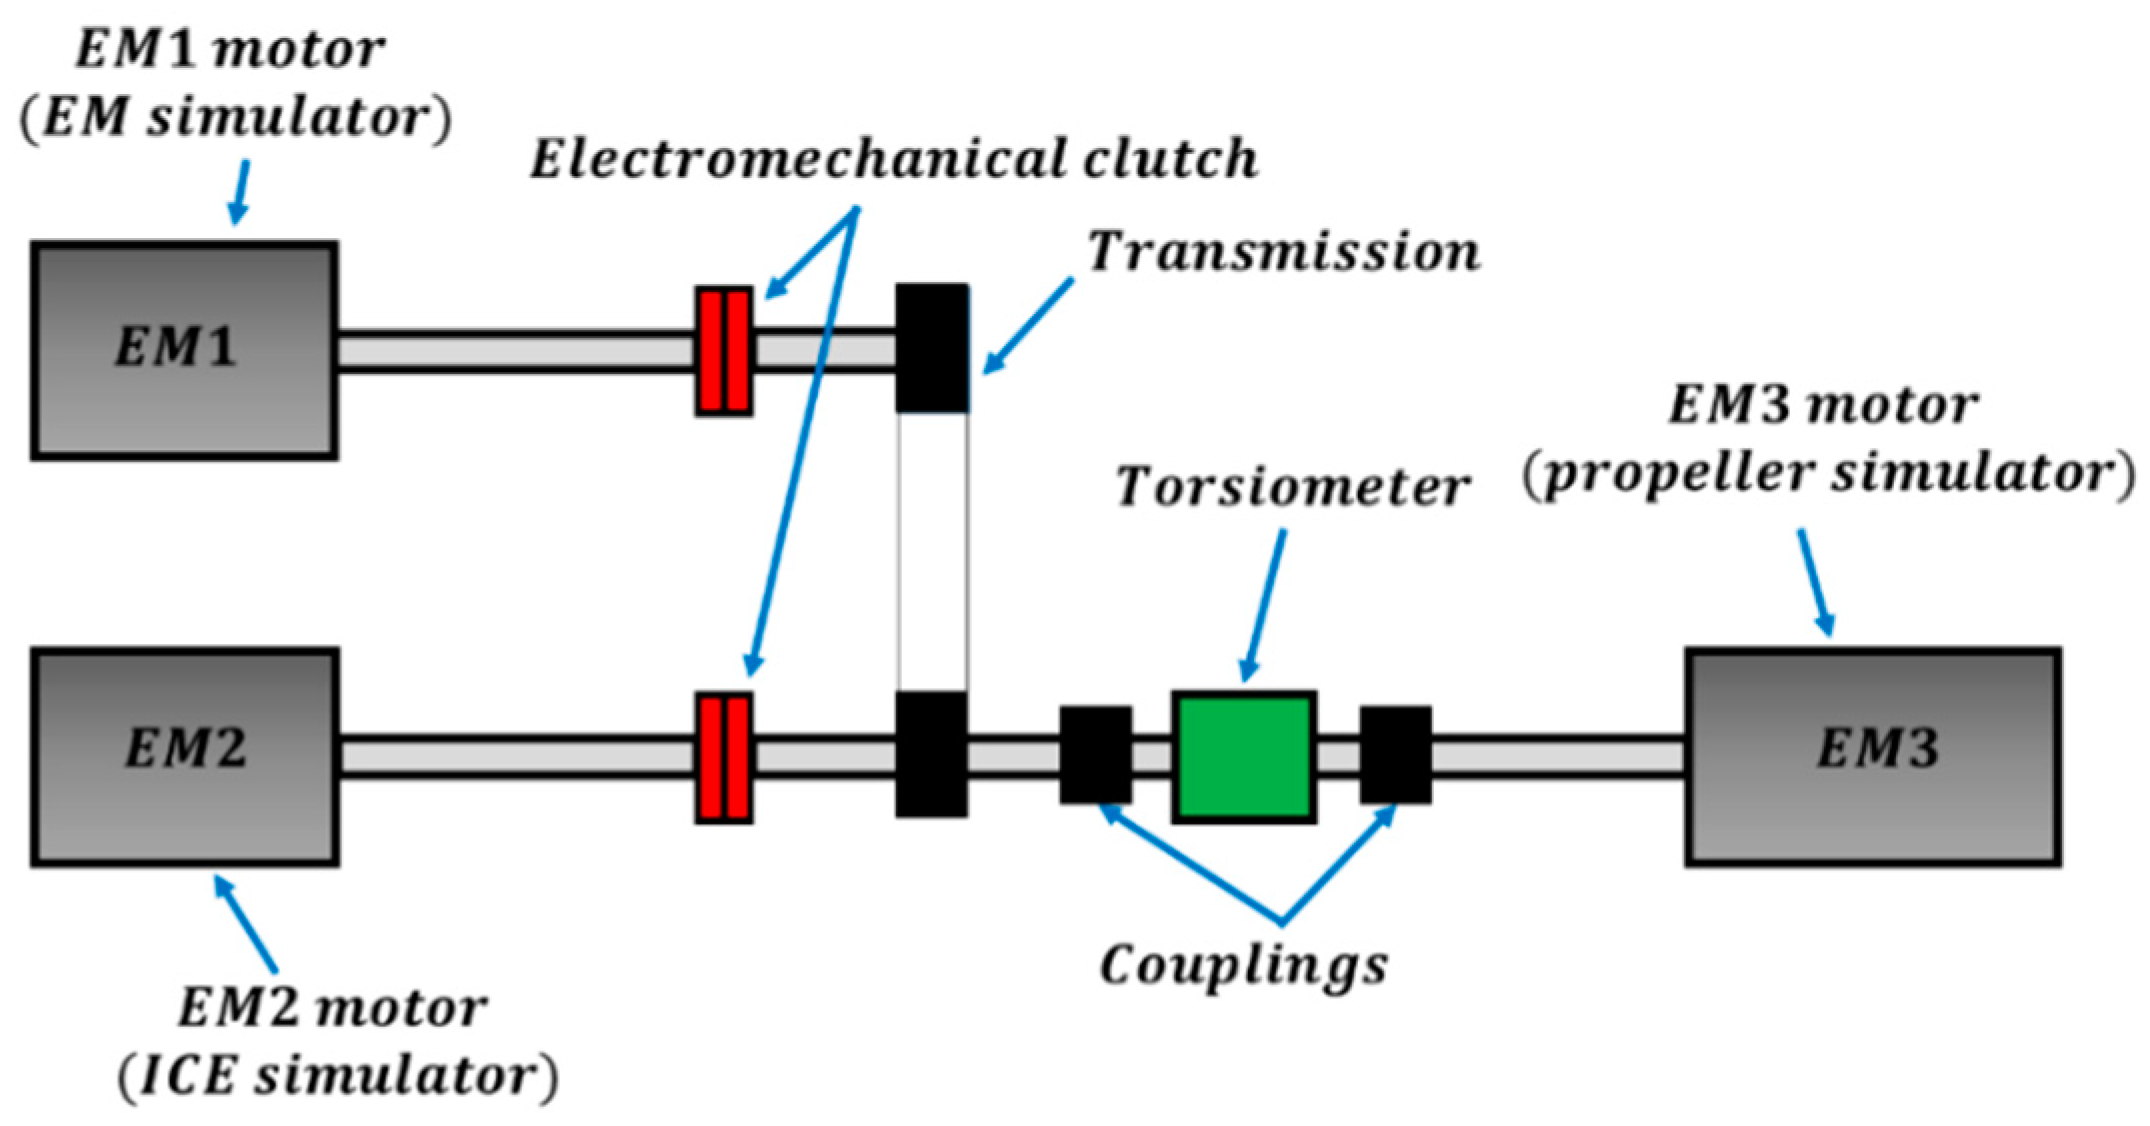
All the power sources acting on the system are replaced by electric motors, as shown in
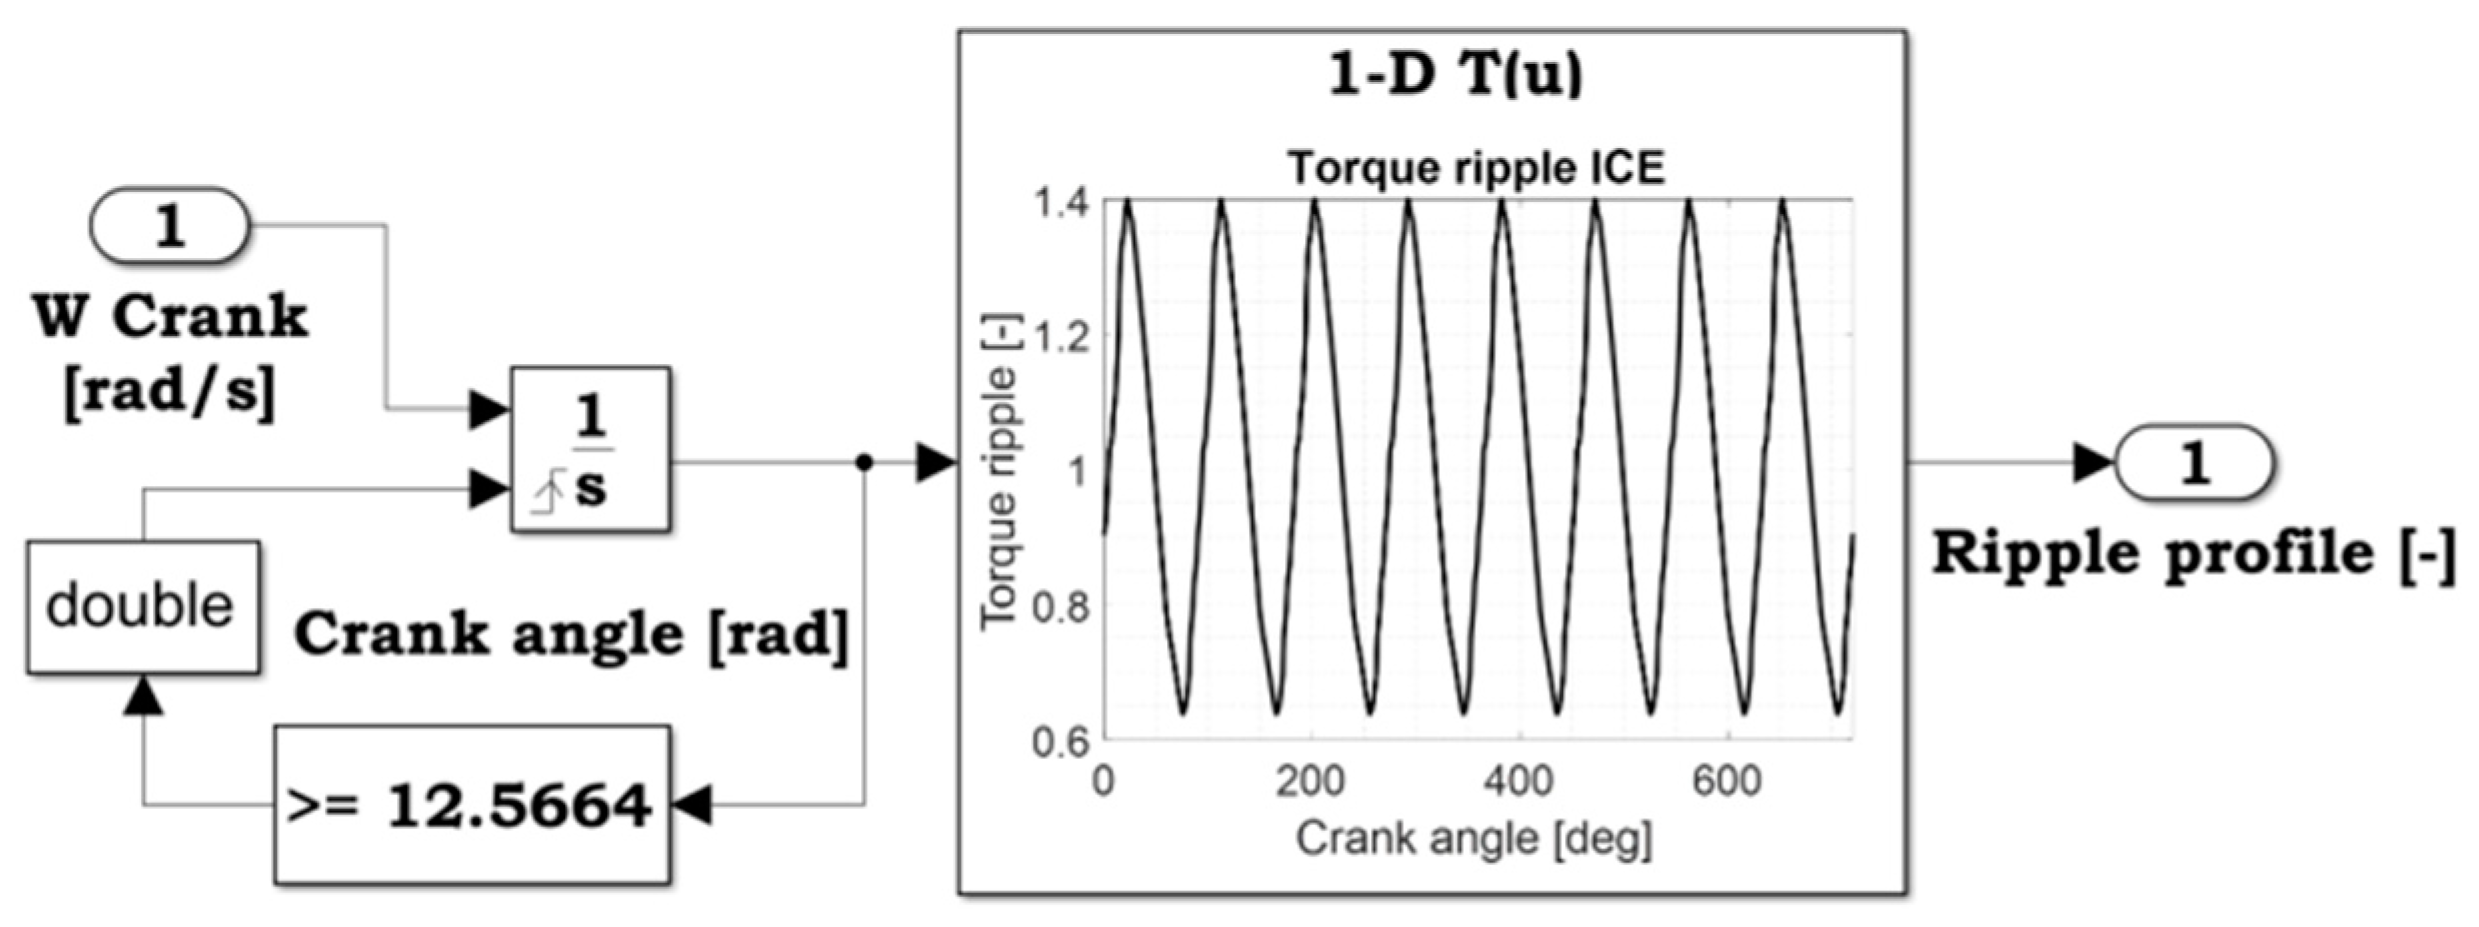
Figure 2, the torques provided by the ICE and by the aerodynamic load acting on the propeller are simulated by brushless motors. The use of an electric motor for the ICE simulation allows to significantly simplify the test bench installation and avoid pollution management during the tests. Although the behavior of an EM is significantly different from that of an ICE, some features such as the inertia, the typical torque ripple of the ICE and its mechanical characteristic can be effectively taken in to account via software and acting on the electric motor control.
A synchronous belt transmission for the mechanical connection of the output shafts EM1 and EM2 completes the proposed architecture. Two electromechanical clutches are installed on the EM1 and EM2 output shafts. The placement of the clutch on EM1 motor shaft is justified by an easier installation, the need to measure the torque on each axis separately and to interrupt the power transmission in case of an emergency.
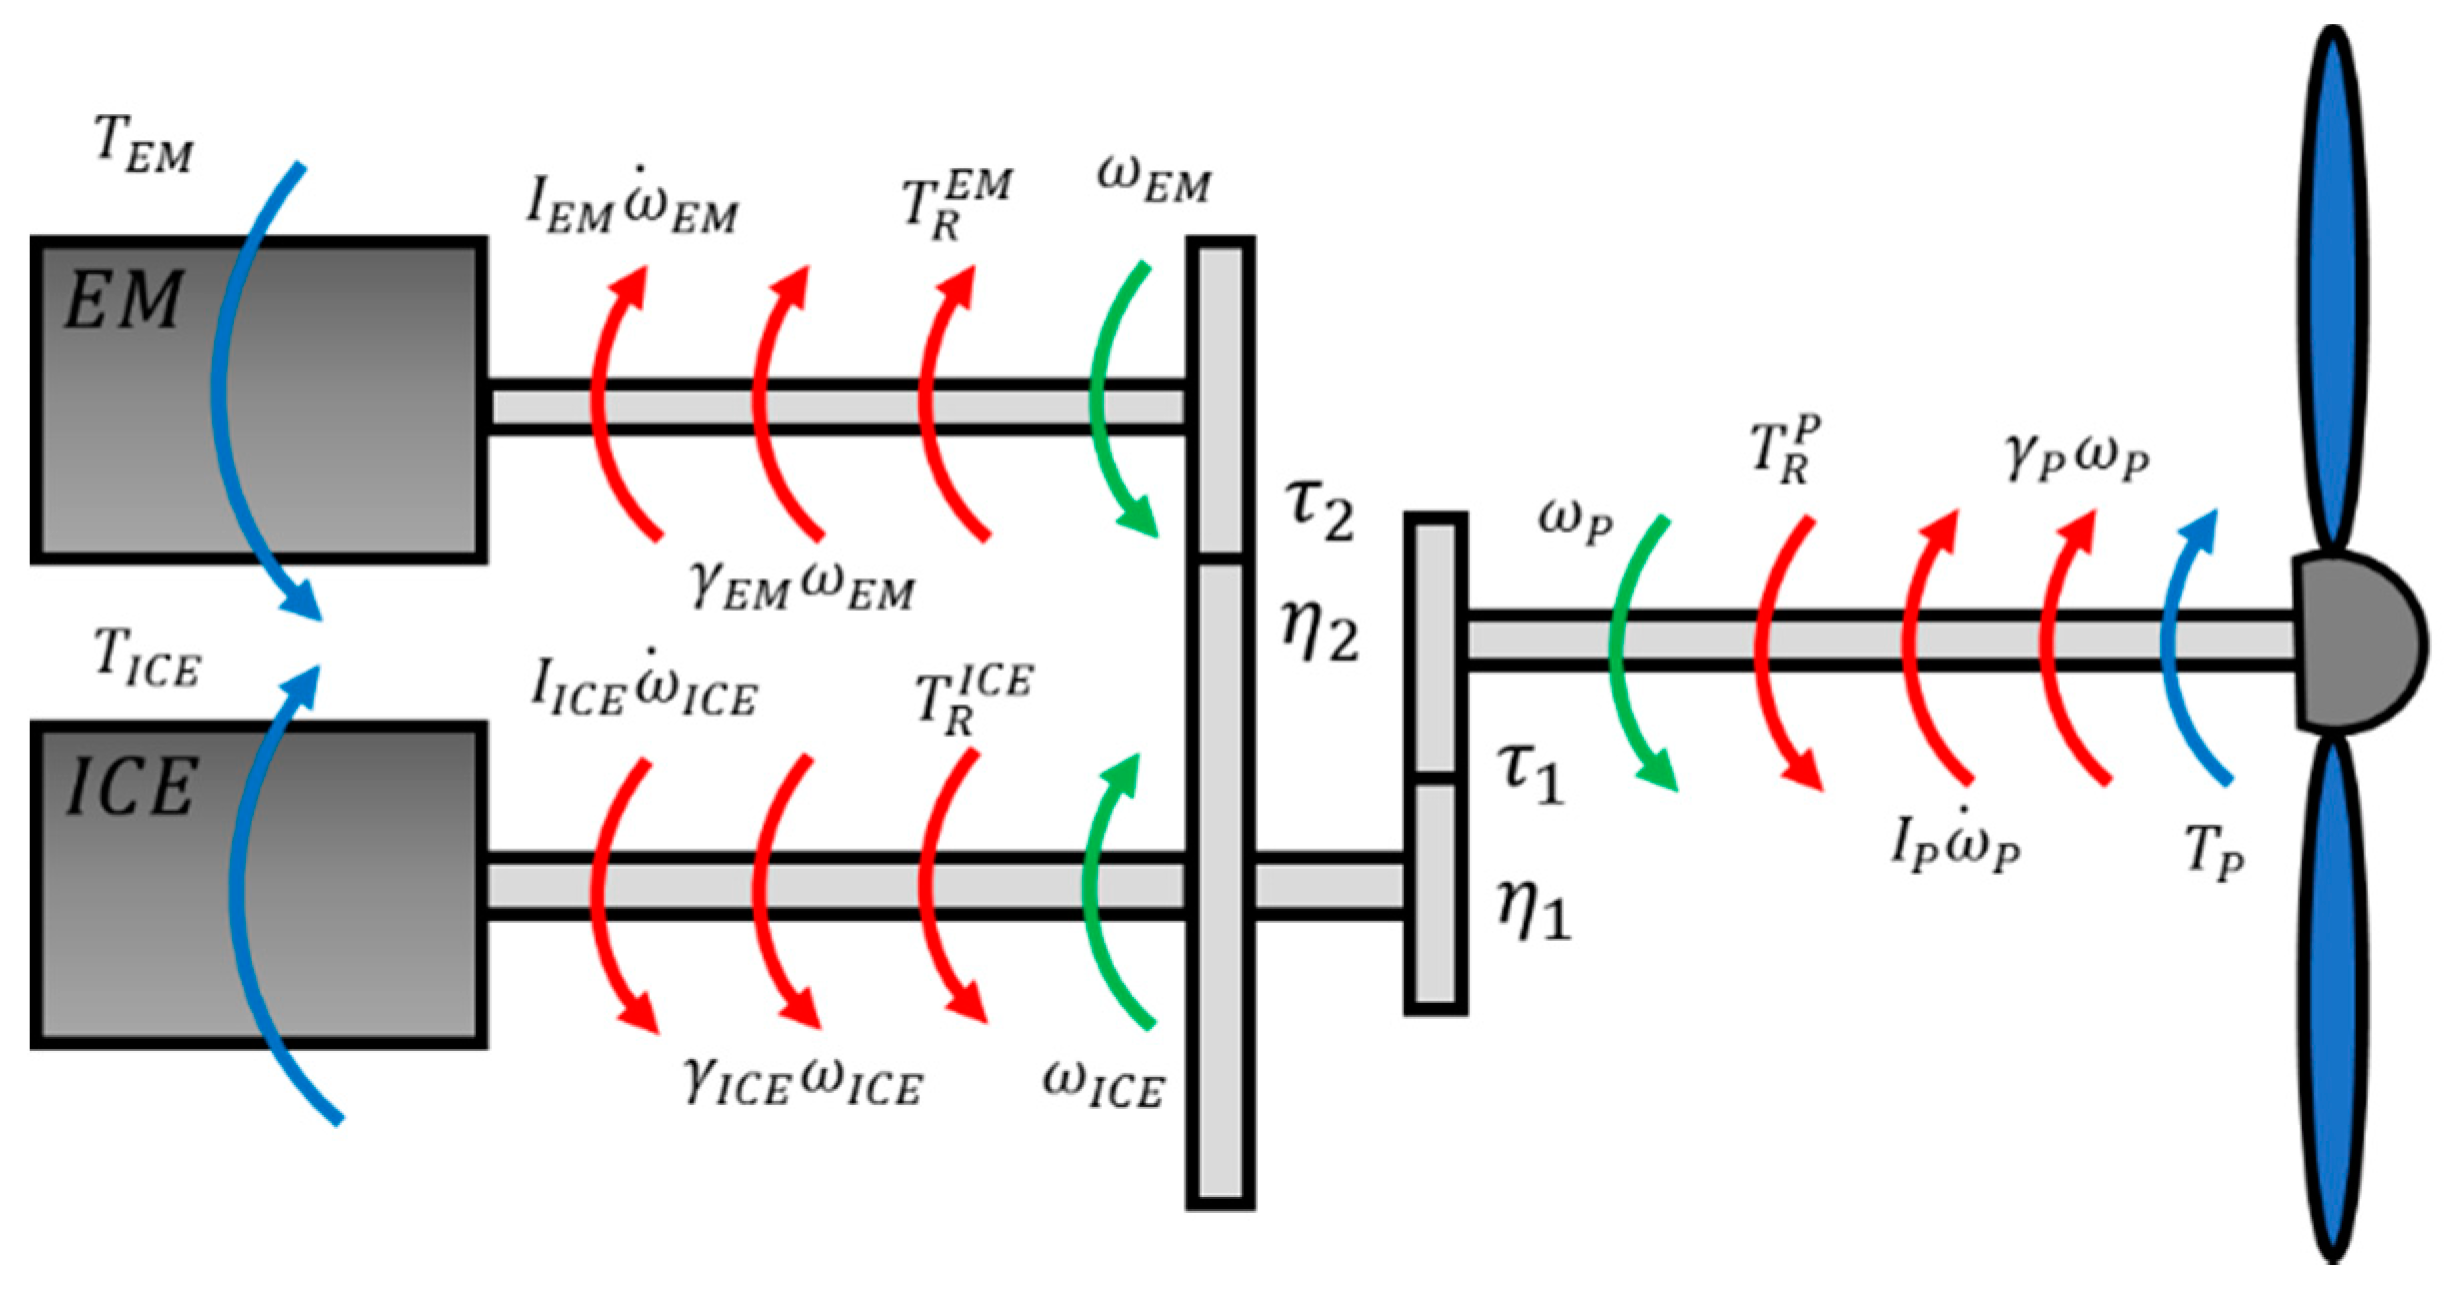
The clutch on the EM2 shaft allows to simulate missions when the ICE is not in operation (e.g., during taxi mode), or during simulations of the ICE startup. Defined the test bench architecture, it is possible to determine a scale factor for its components starting from the real system dimensions. For this purpose, the dynamic behavior of of the real propulsion system is mathematically described for the different operating conditions. Making reference to the diagram reported in
Figure 3 for power boost conditions and translating the torque contributions to the ICE axis, the dynamic equilibrium of the system can be described as:
where
is the ICE torque,
is the EM torque and
is the propeller torque.
,
and
are the inertias of the electric motor, ICE and propeller respectively, while
,
and
are the viscous damping coefficients.
,
and
are the angular speeds;
is the transmission ratio of the mechanical transmission between propeller and ICE, defined in Equation (2), while
is the transmission ratio between EM and ICE defined in Equation (3). Finally, we define the transmission efficiencies
and
(from the electric motor to the propeller):
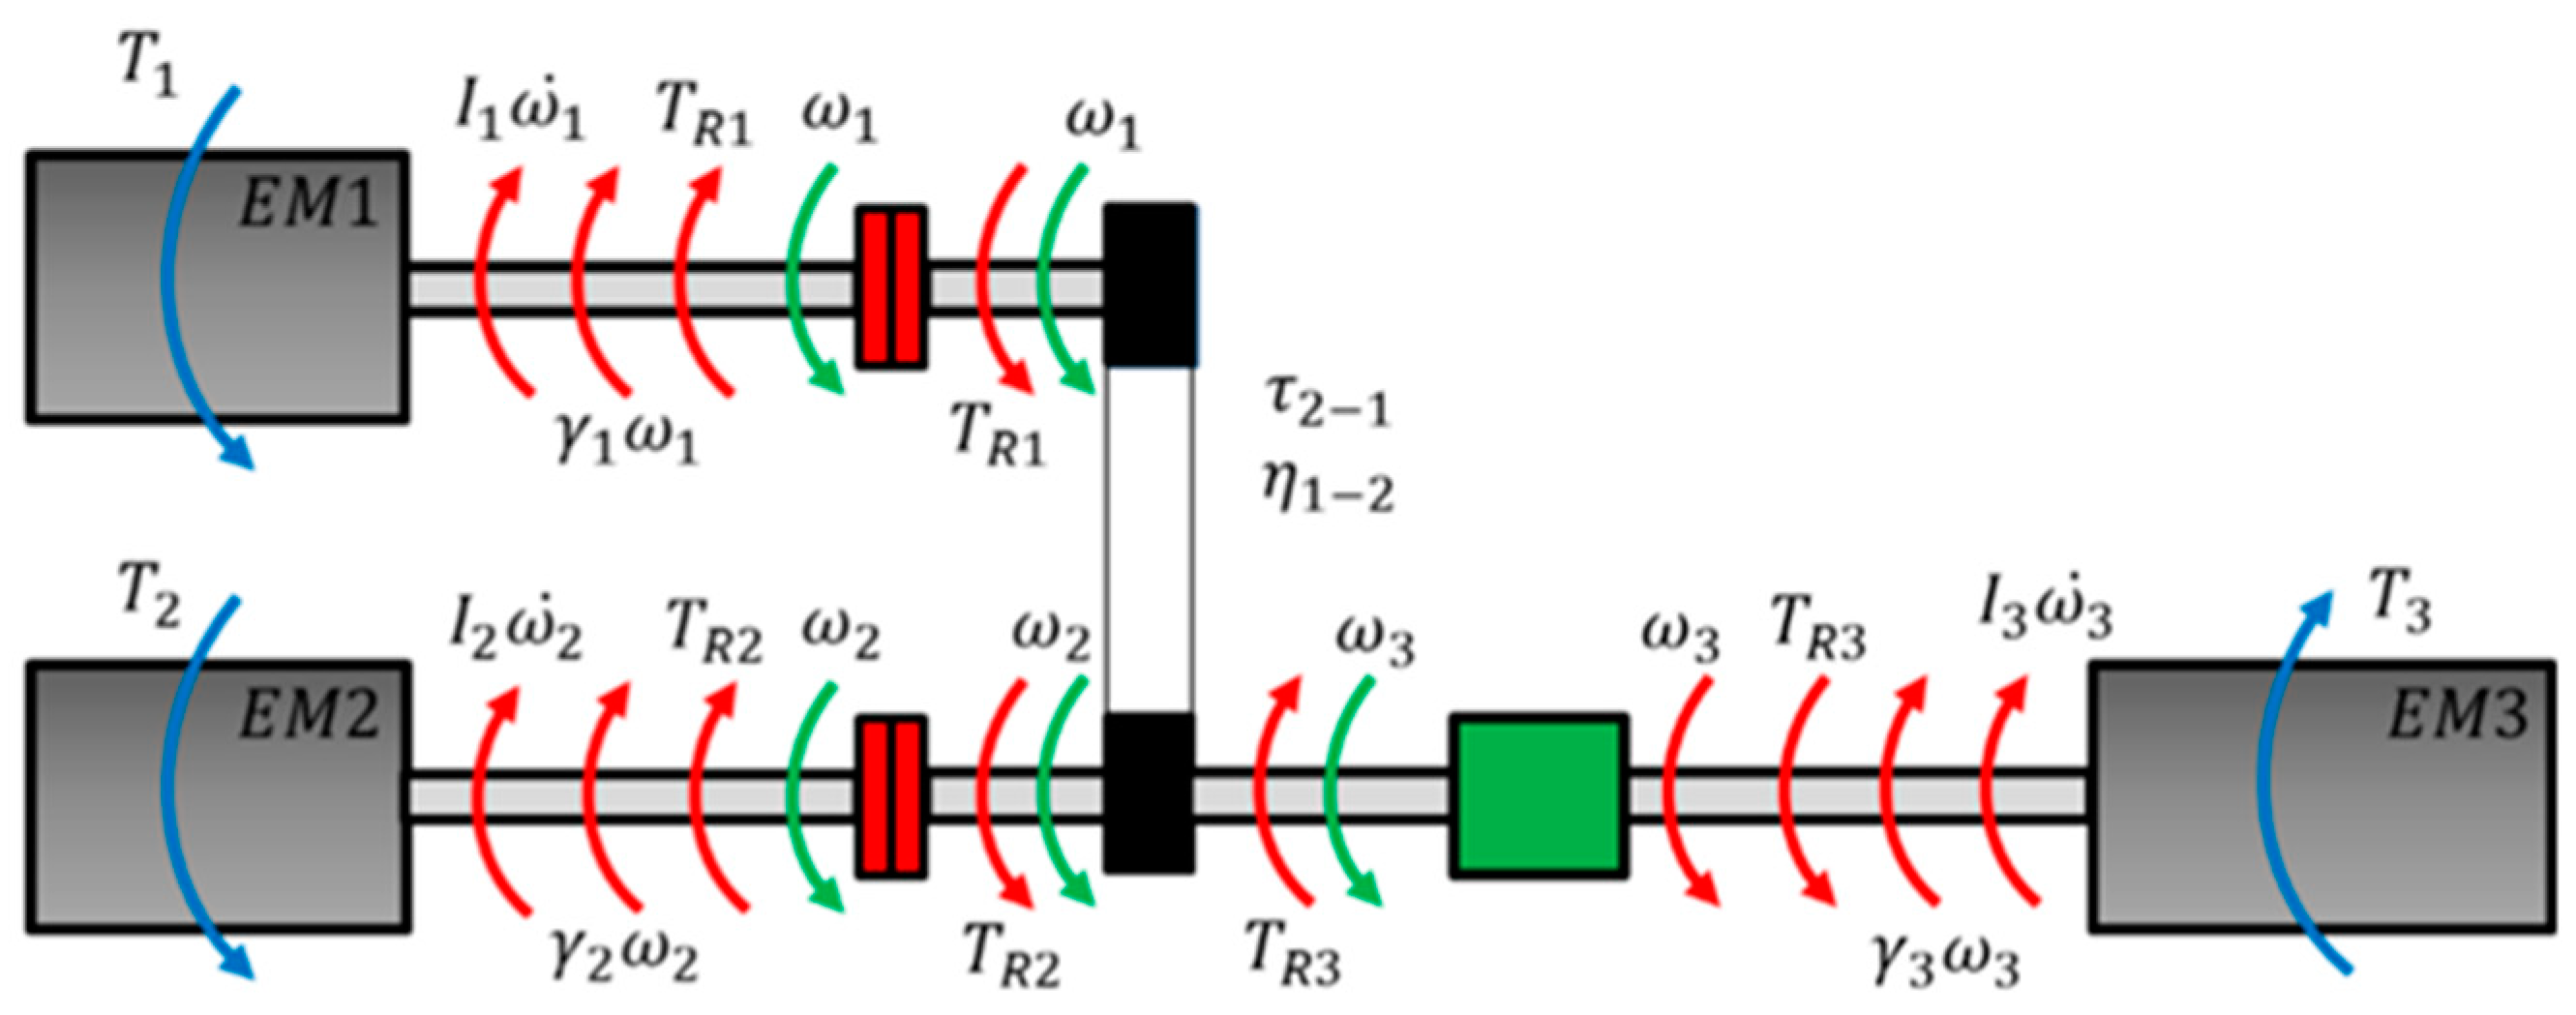
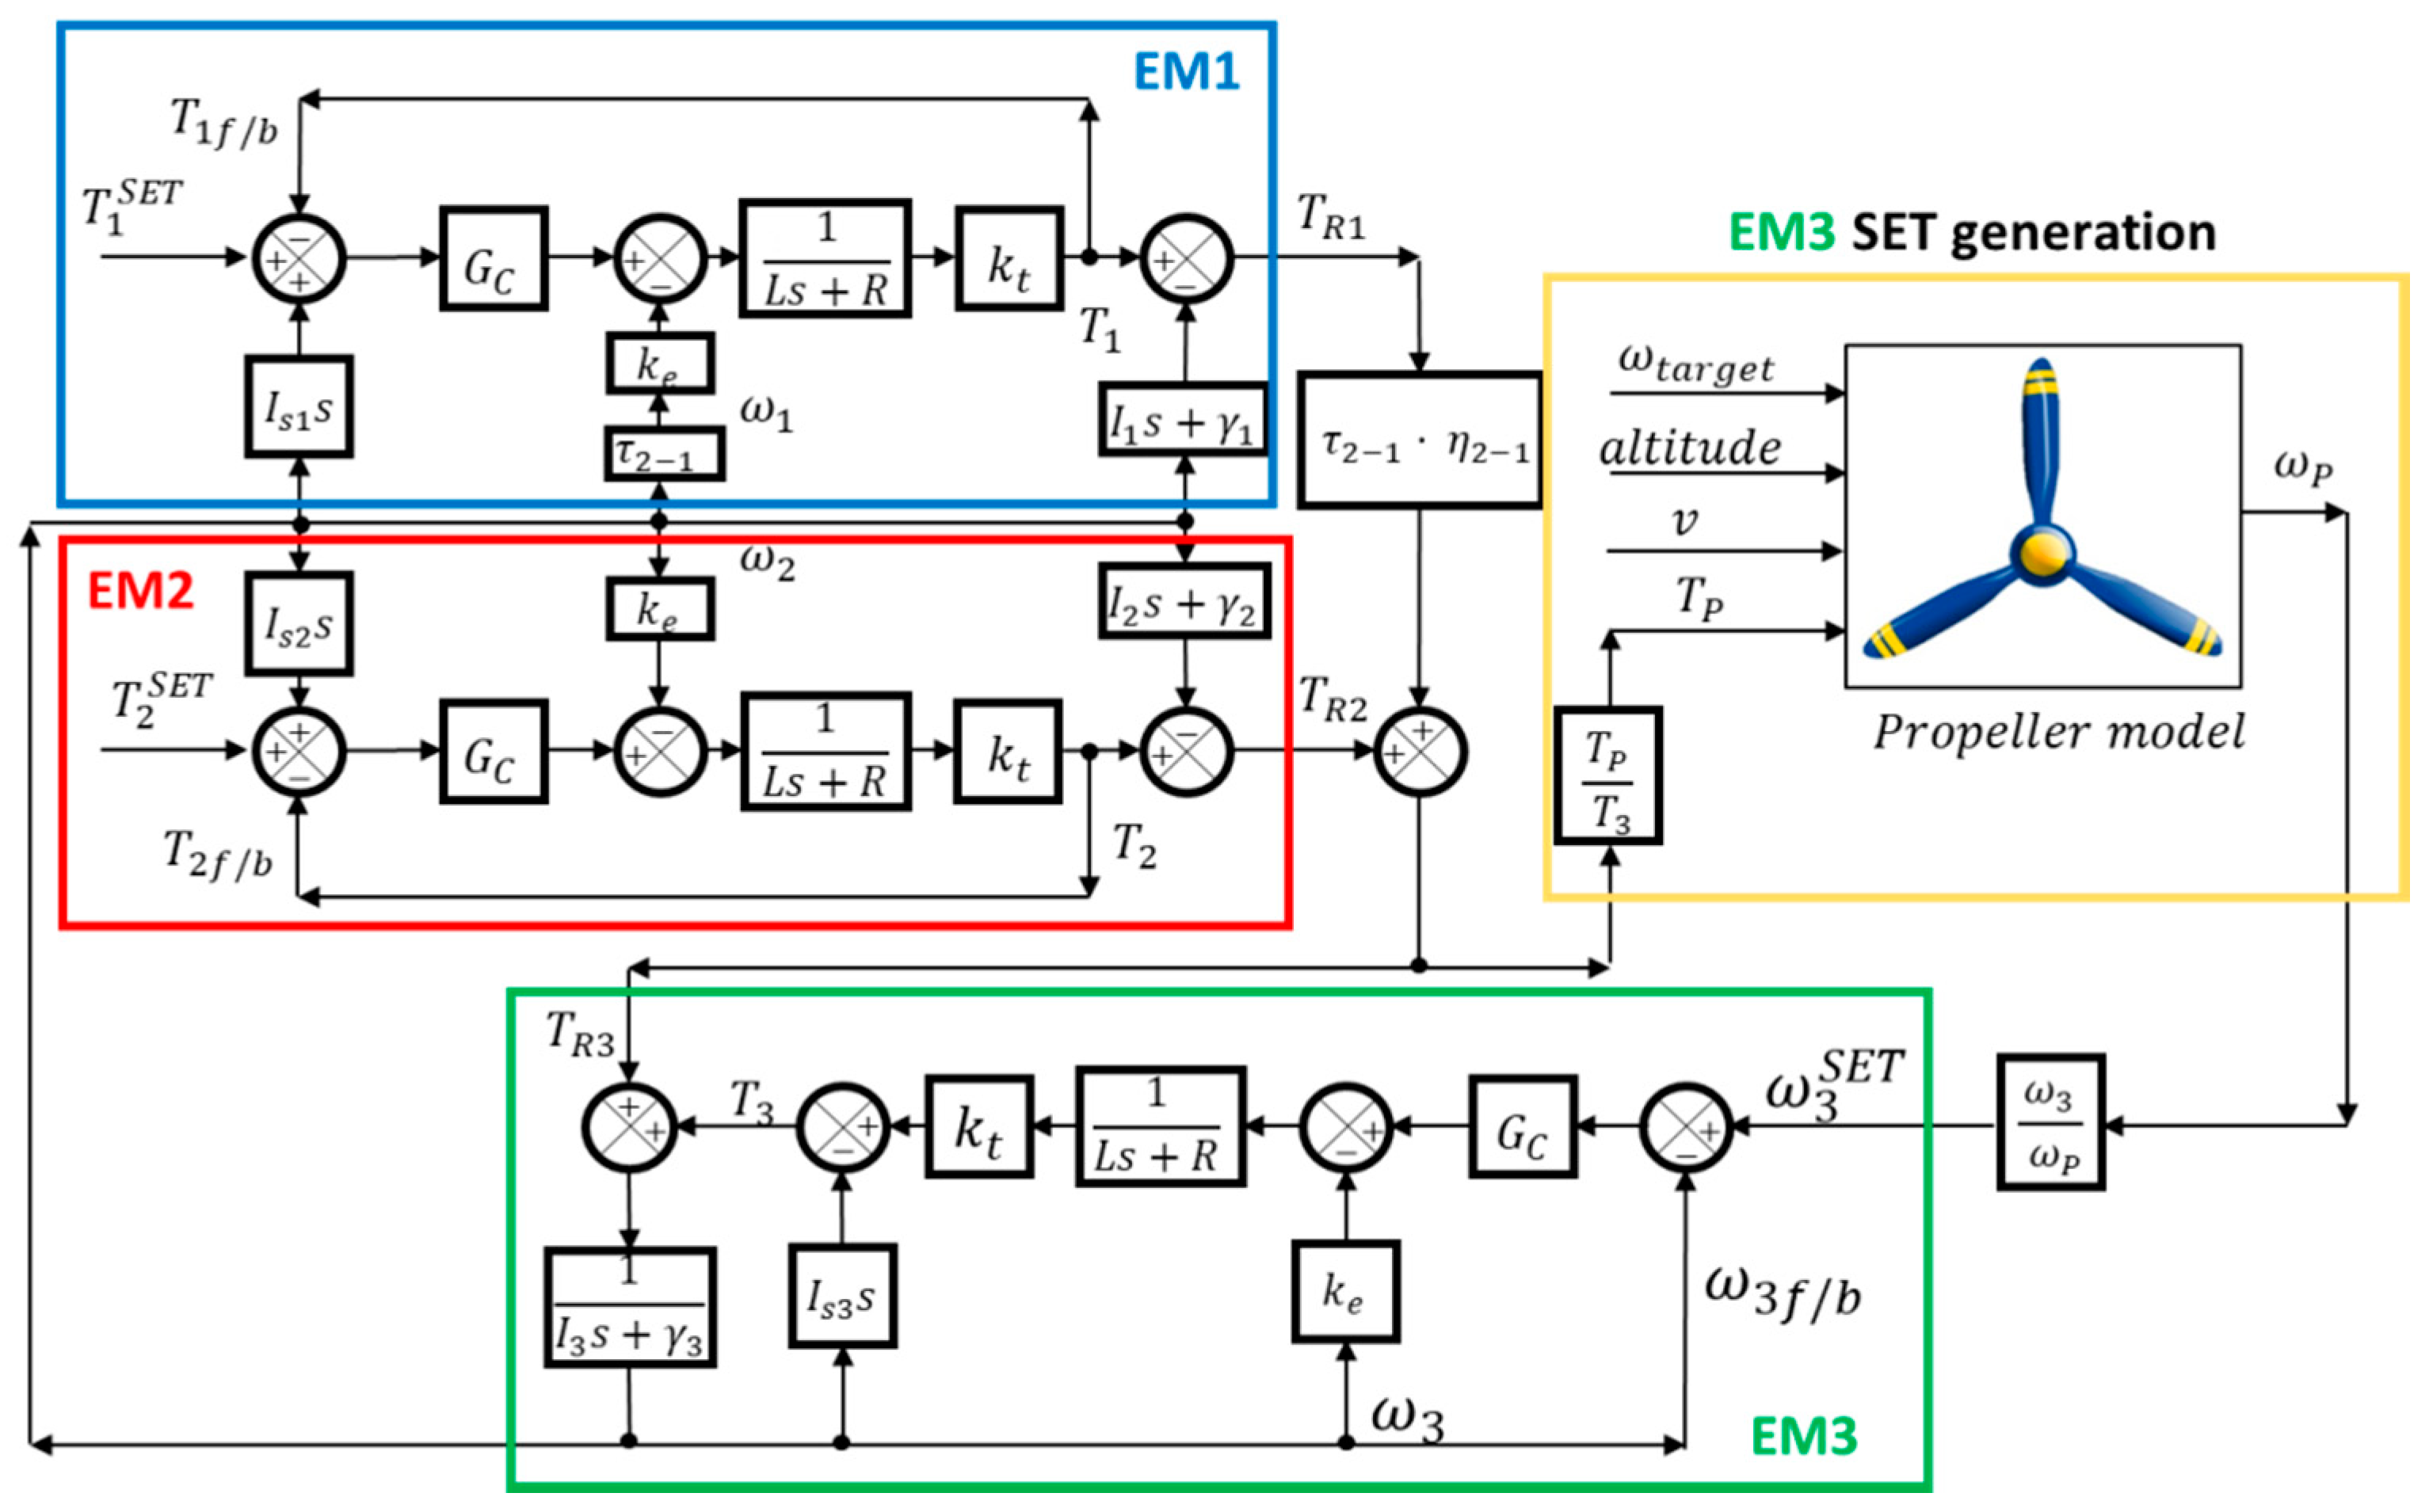
Similar considerations can be performed on the test bench, as depicted in
Figure 4. By reporting all of the torque contributions to the EM2 axis, the equilibrium equation of the test bench can be written as:
where
,
and
are the torque outputs of the three electric motors,
,
and
are the inertias on the axis EM1, EM2 and EM3 and
,
,
are the viscous damping coefficients.
,
and
are the angular speeds, while
is the belt transmission efficiency from EM1 to EM2 and
is the transmission ratio between EM1 and EM2, described by Equations (5) and (6).
Defining the power scale factor
, the servomotors power can be written as:
The value of the power scale factor can be freely defined and used to the down-size the real and the virtual test bench compared to real system dimensions. Since the scaling process is supported by analytical equations, it can be easily updated according to specific contextual needs.
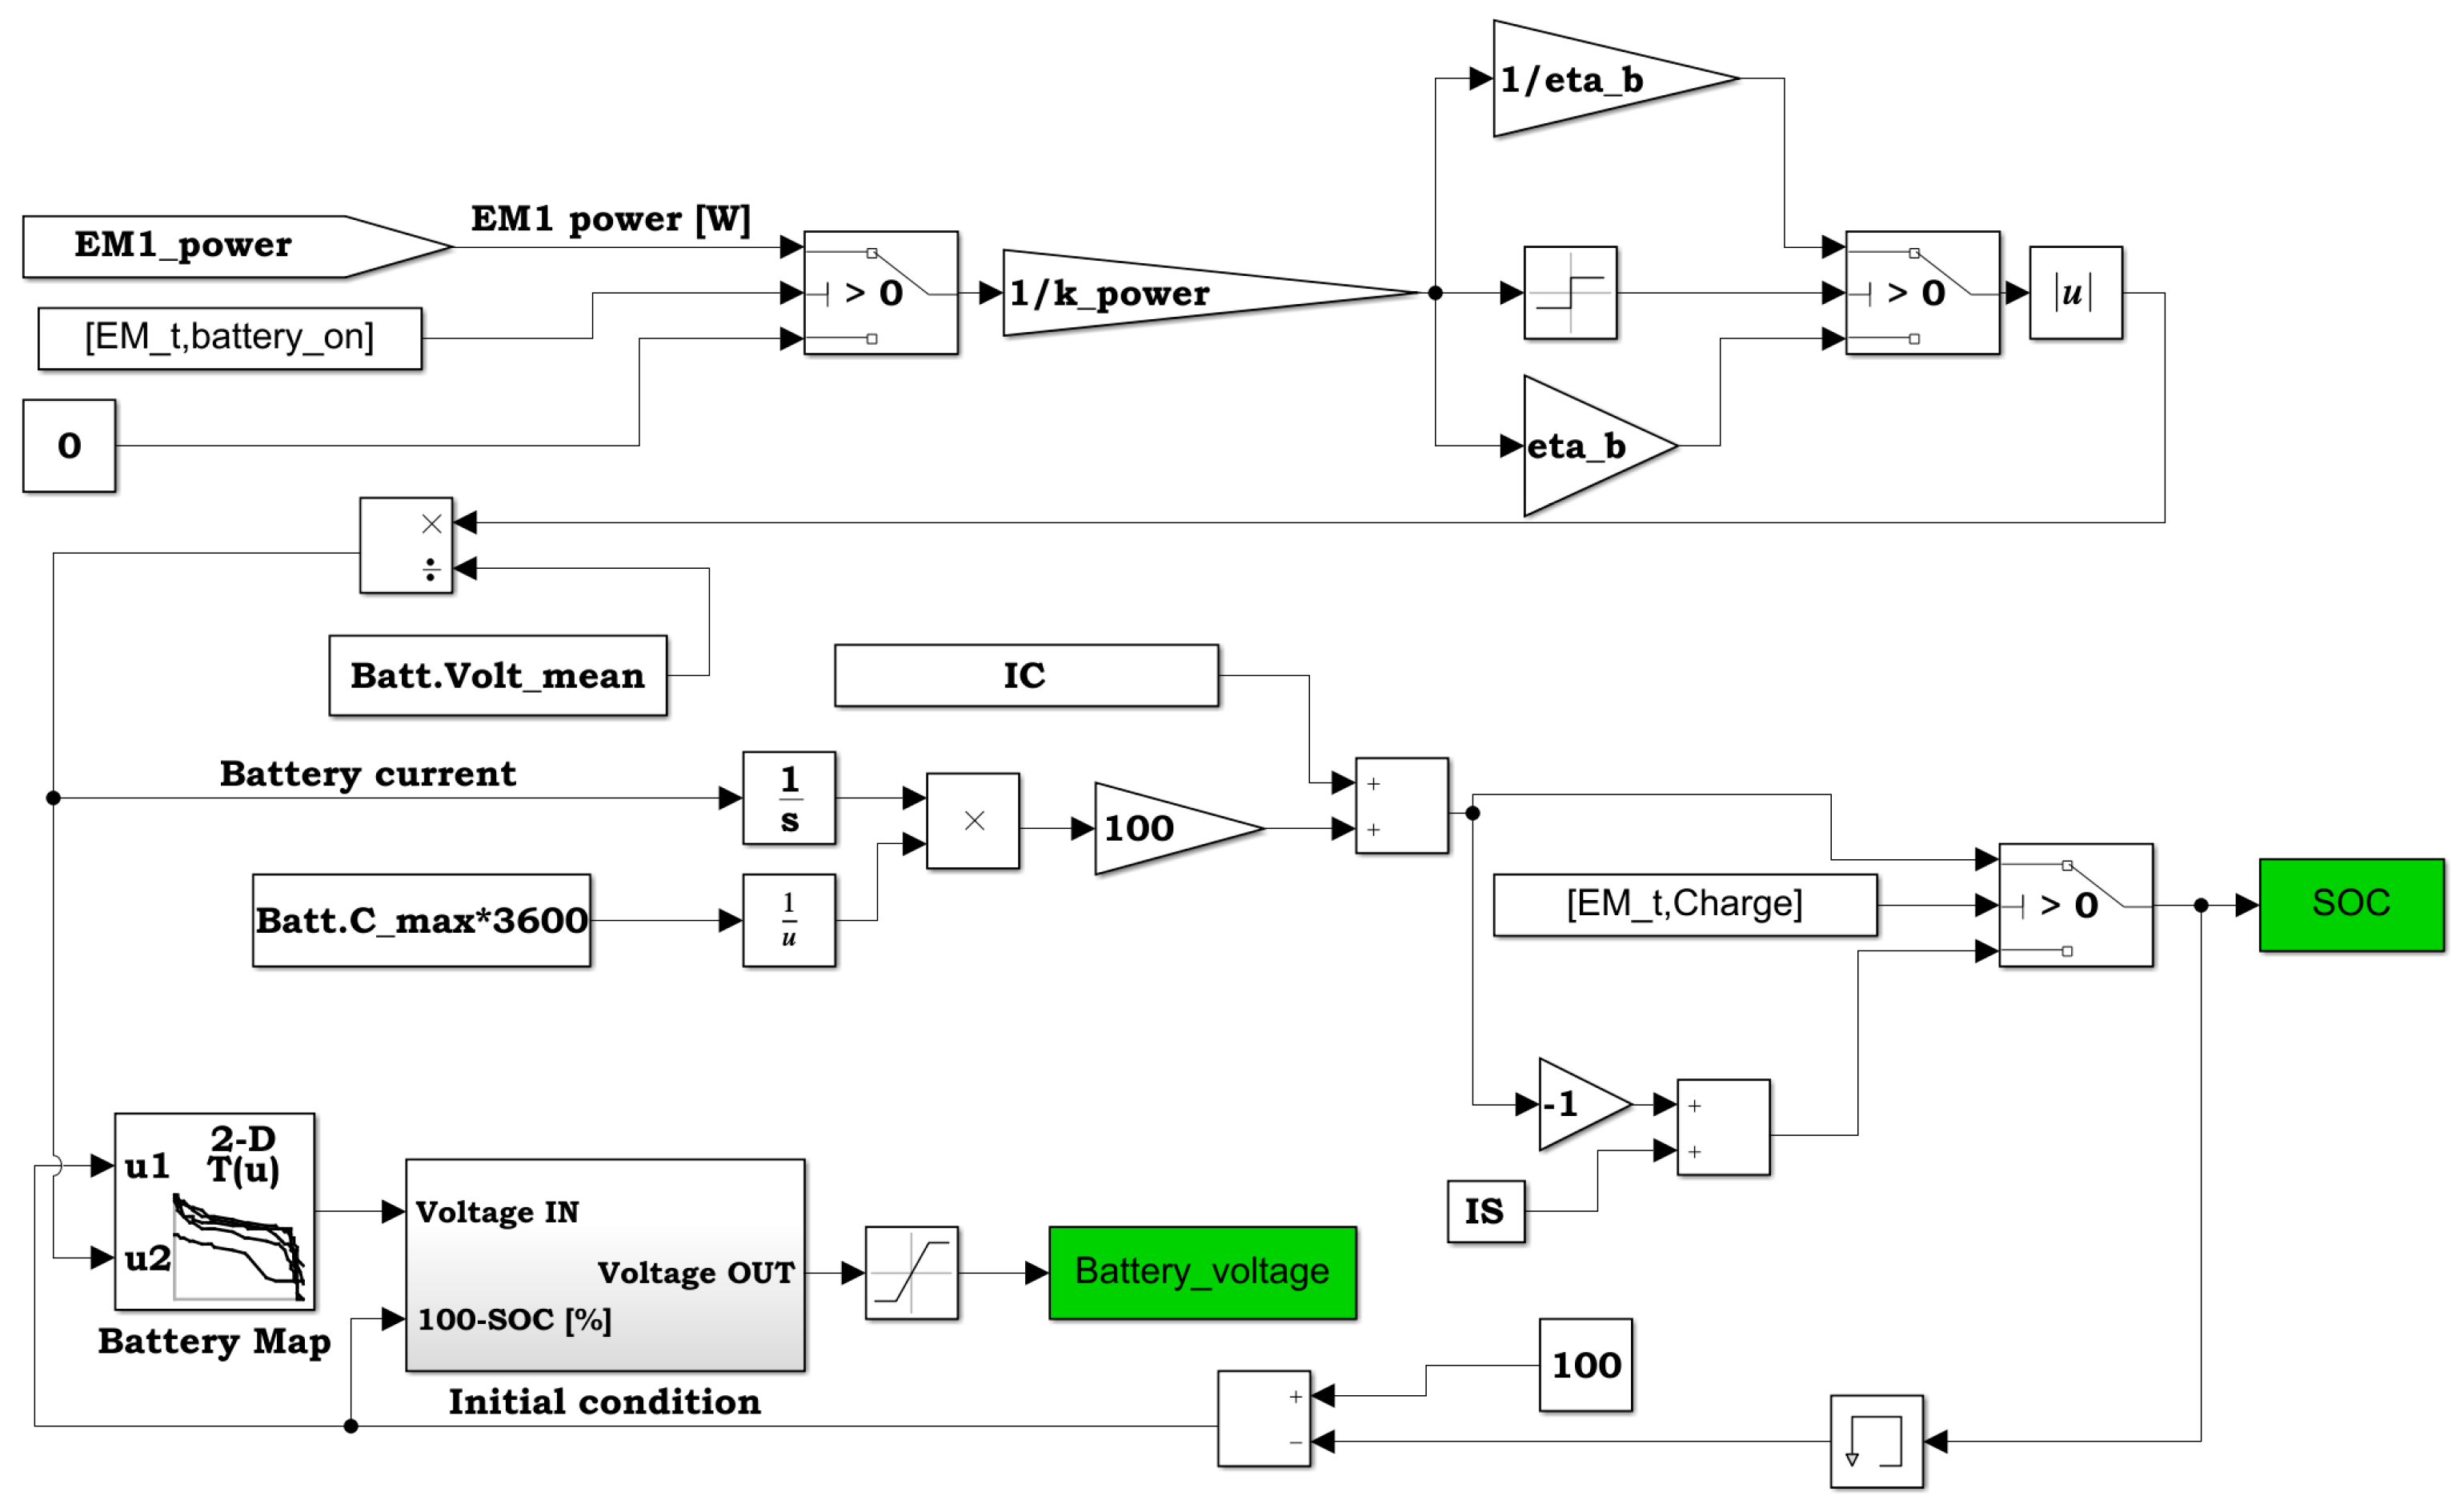
In order to reproduce the dynamic behavior of the real propulsion system, the contribution of inertia must be scaled as well. This is done by equating the mechanical power associated with the acceleration of each movable axis on the real system with the scaled power associated with each correspondent axis on the test bench. The equivalent moments of inertia at the three axis of the real test bench, and hence the values to be used for its virtualization, can be computed as:
where
,
and
represent the moments of inertia that the virtual rig should have to ensure the dynamic equivalence. Each of these terms can be considered as the sum of the servomotors inertia
,
and
and of the additional inertias
,
and
:
The additional inertias can be introduced in the test bench in two different ways. The first one is to mount physical inertias equal to
,
and
on the motor axis EM1, EM2 and EM3. This approach is commonly used in test benches of flight servo-actuators, where the inertia of the flight control surface is simulated by an adjustable mass, but has the drawback of needing additional space on the real test bench [
16].
The second solution is to embed the influence of these additional inertias within the command system by modifying the reference signals provided to the electric motors. This approach however requires high-performing torque control of the motors and increase the complexity of the test bench software and is as such discarded.
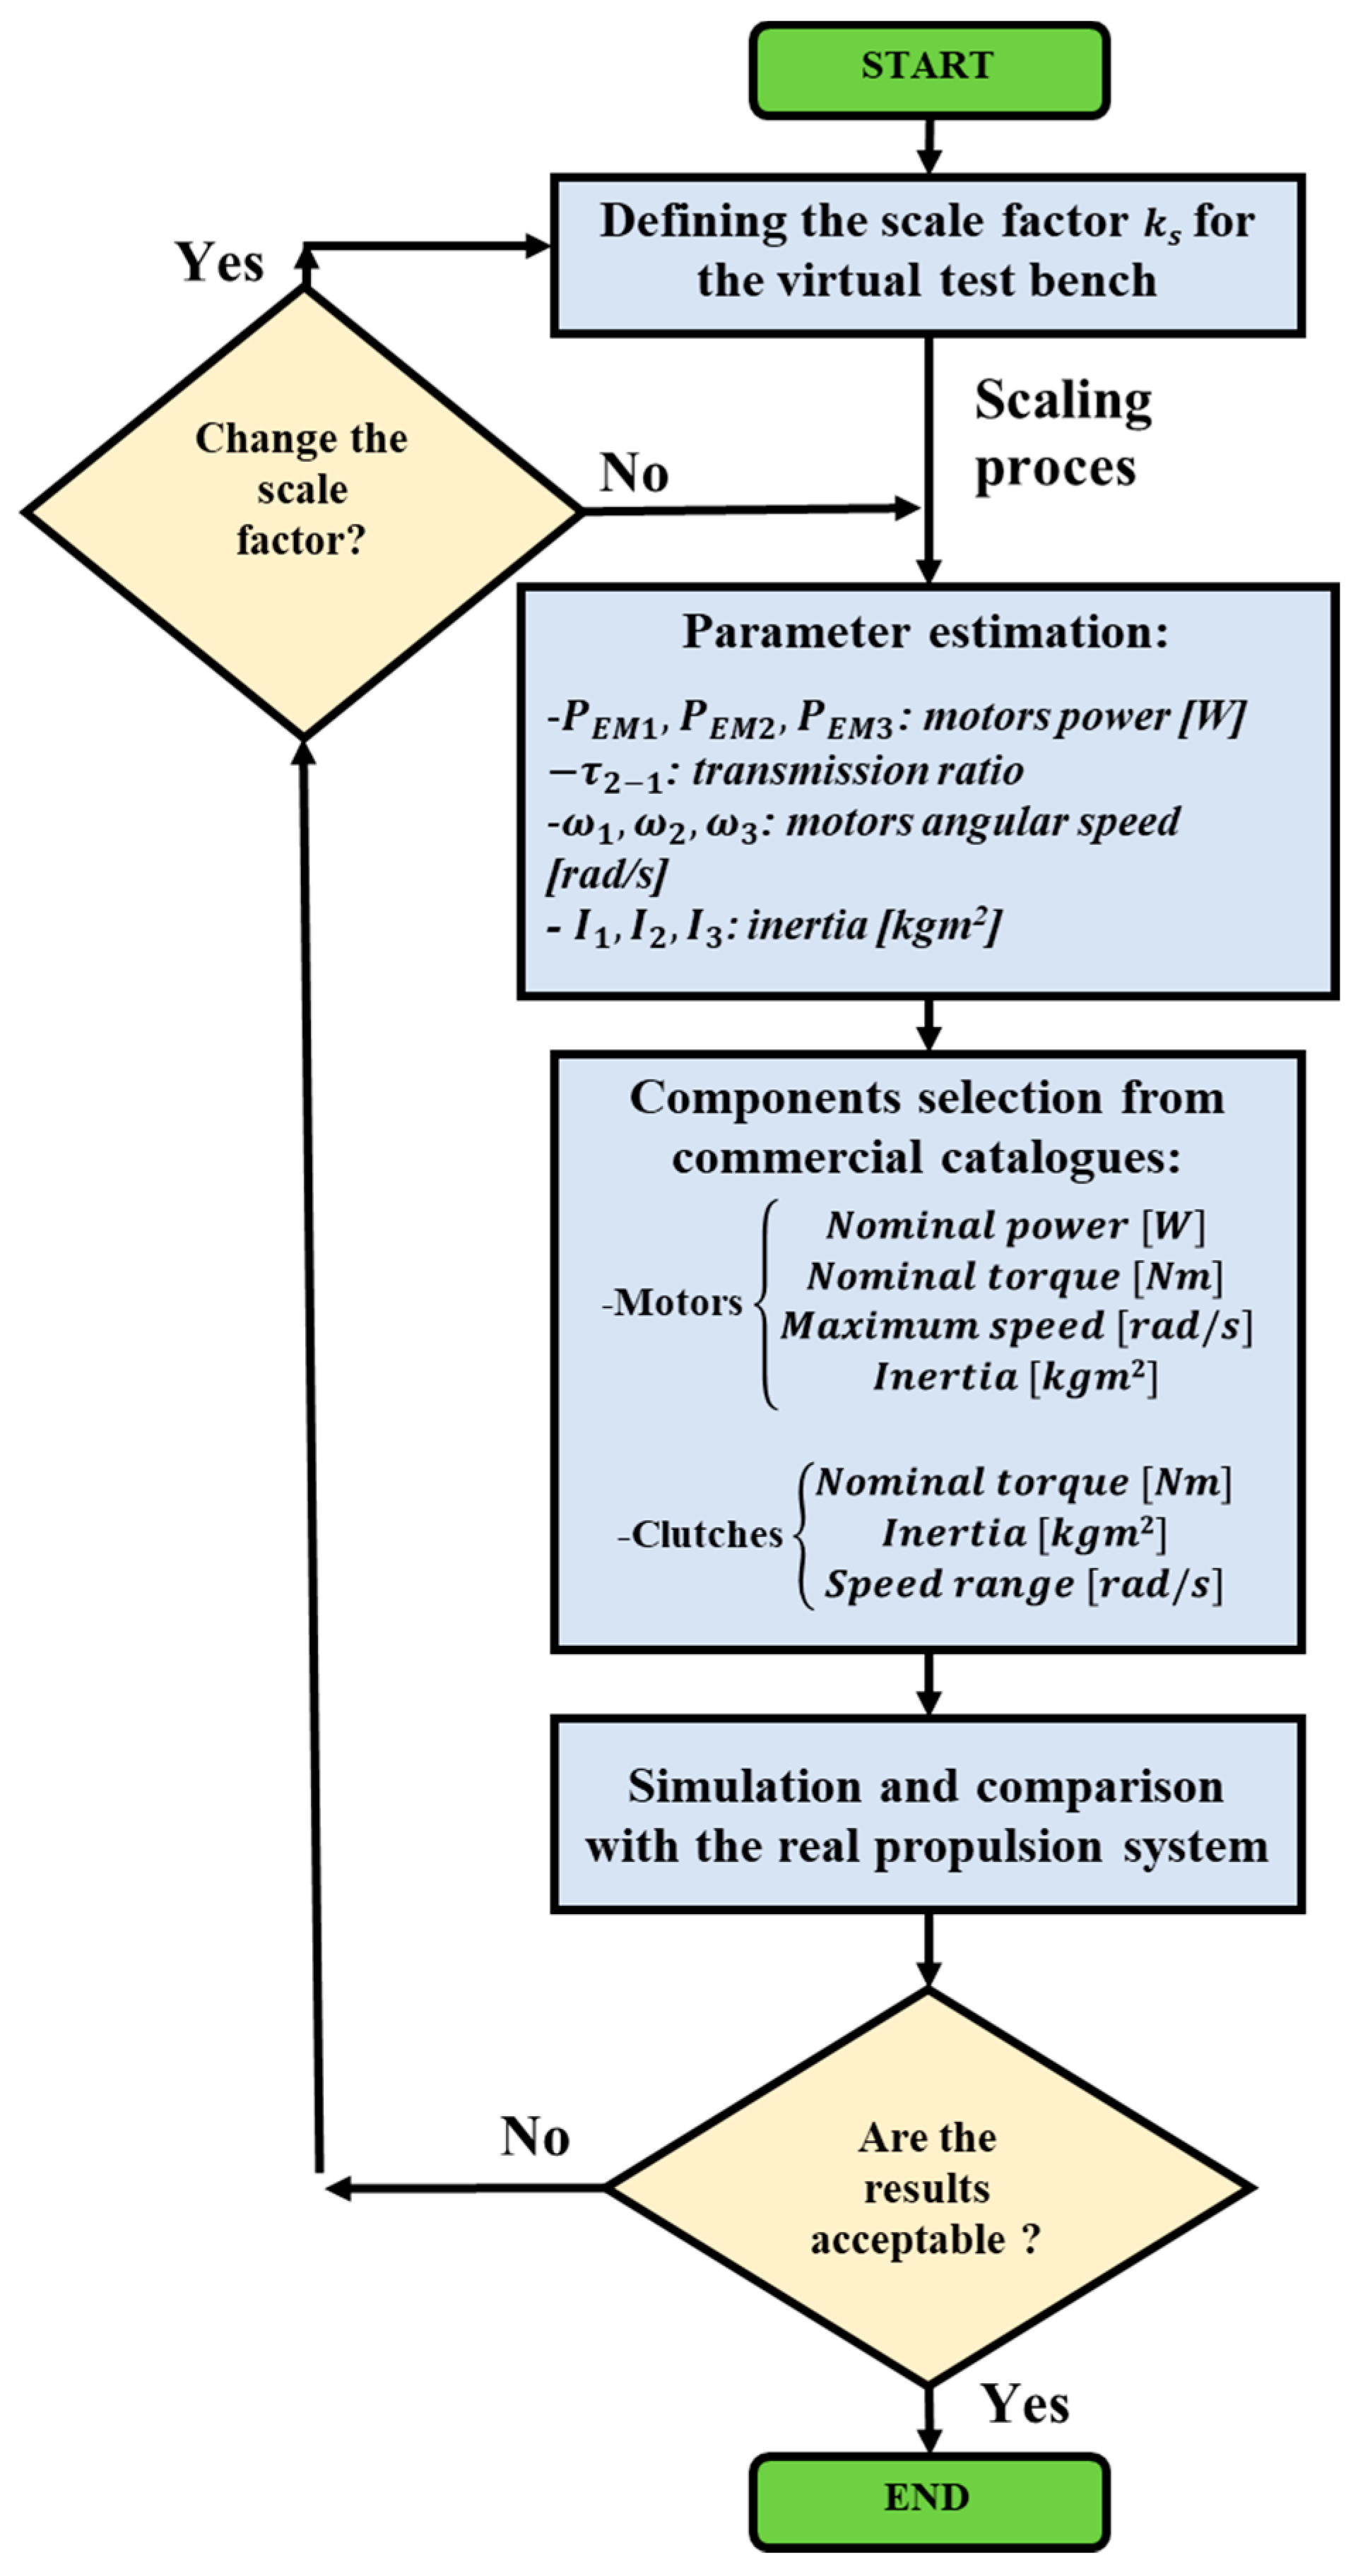
The procedure to properly scale the real test bench is then an iterative process, as shown in
Figure 5; once that a certain scaling factor is selected, the bench components and their inertia must be chosen properly and their behavior compared to the expected characteristics of the real propulsion system. The iterative nature is due to the selection of commercial components, which characteristics are inevitably slightly different from the ones demanded by the scaling procedure.
5. Application of the Virtual Test Bench
The simulation environment, depicted in
Figure 11, is applied to a real propulsion system which requirements, dependent on the flight segment, are reported in
Table 2. Six flight phases representative of the UAV application under analysis are considered: green taxi, take-off, climb, ICE heating, cruise and descent. The most demanding condition is the take-off, for which both the electric motor and the ICE operate at nominal power. The ICE is instead excluded during taxi and descent, while it drags the electric drive during climb and cruise segments allowing for battery recharge. The duration of the ICE heating has been shortened with respect to the real case scenario by generating high torque values to reduce the simulations length. At first, these requirements must be converted into the scaled-down values used in the real (and hence the virtual) test bench, applying the methodology reported in
Section 3 for
. Results are reported in
Table 3.
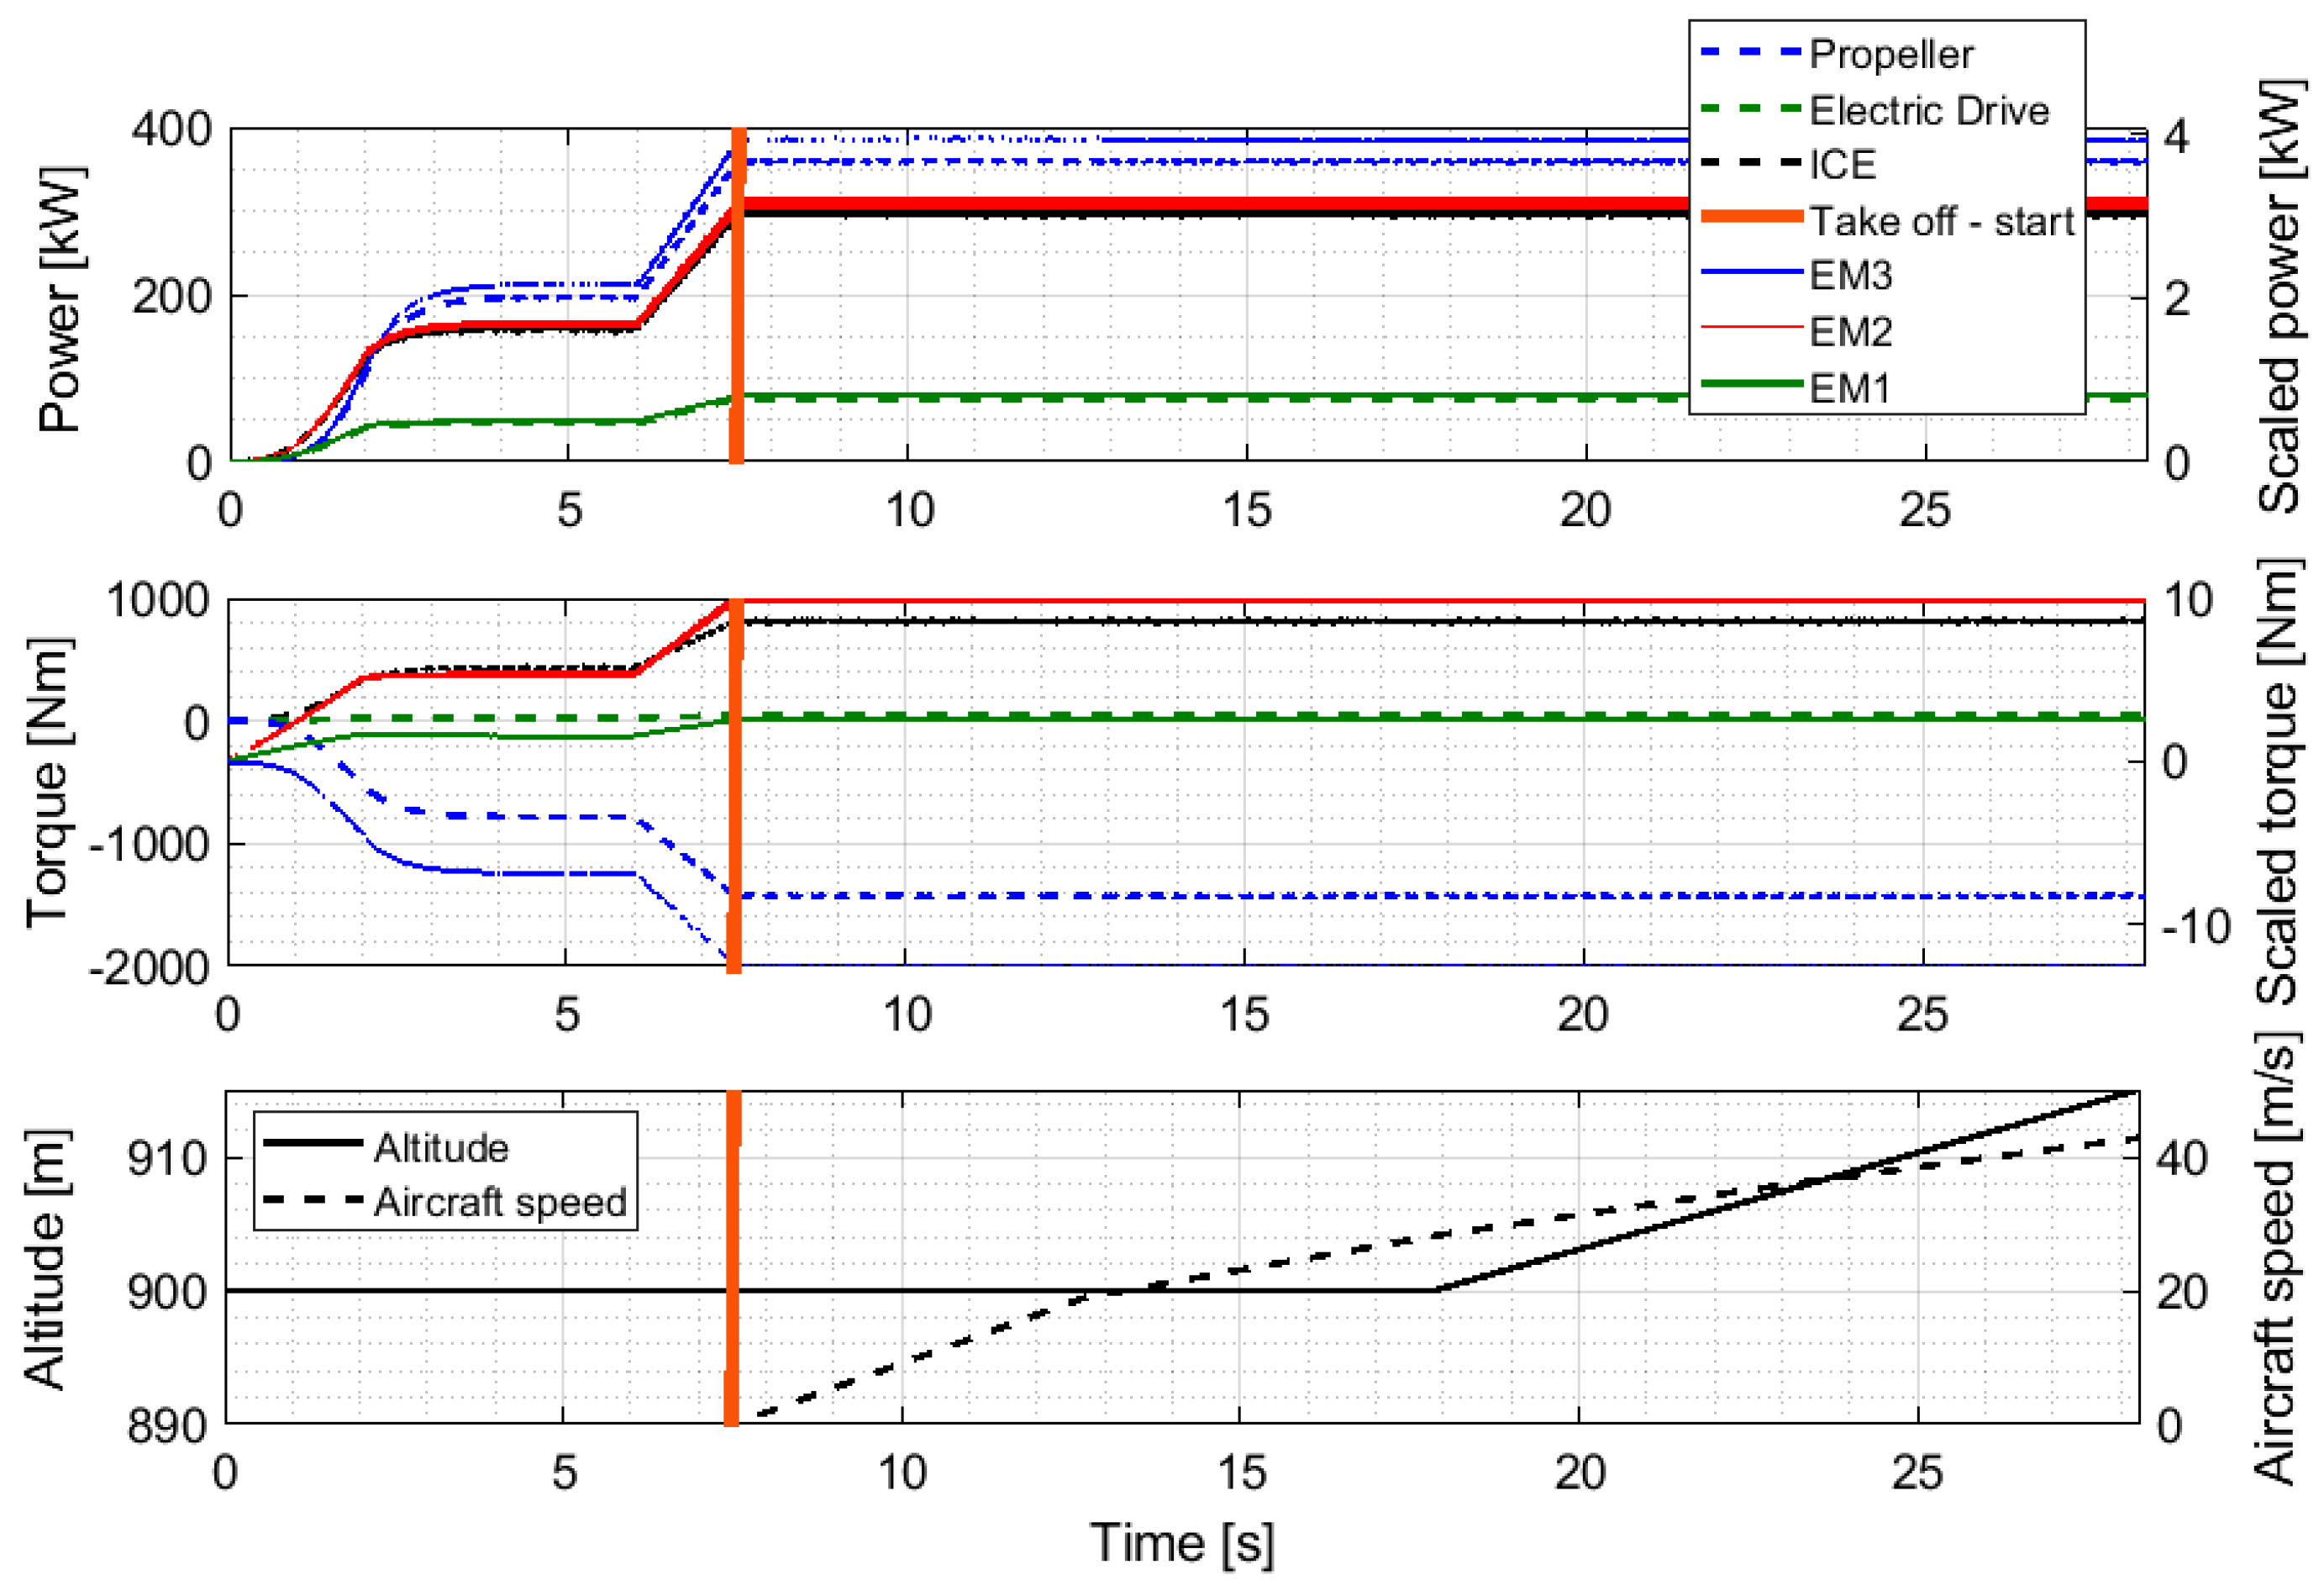
To evaluate the proposed design methodology we compared the expected behavior of a high-fidelity dynamic model of the hybrid propulsion system with the results of the simulated scaled test bench, taking the take-off scenario as the reference case. Both the electric motor and the ICE are active during this phase, hence providing the most amount of information on the virtual test bench behavior.
During the first stages of the simulation, as shown in
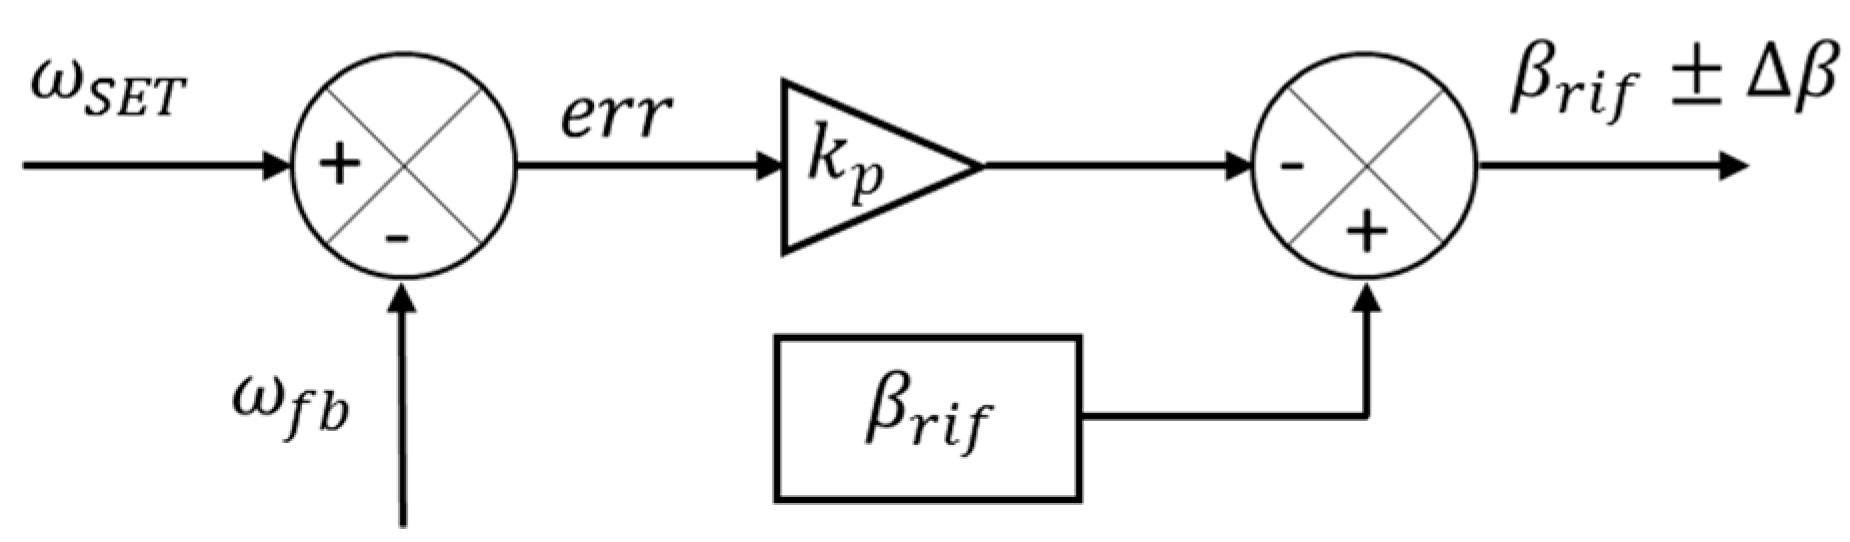
Figure 12, the propeller is rotated to the target angular speed of 2400 rpm by the combined effort of the ICE and the electric motor. Hence, around the 6 s mark, both the electric motor and the ICE are brought to maximum exerted power conditions and the take-off maneuver is started.
Eventually the variation of some parameters at aircraft level, i.e., the airplane altitude and speed, is generated. It is worth noting that the speed profile and altitude are external inputs, as an aircraft mathematical model is not implemented within the virtual test bench.
The signals associated with the three electric motor simulated on the scaled-down virtual test bench closely follow the behavior of the real components of the propulsion system; where present, small variations are caused by the difference between the efficiency of the component employed in the real propulsion system and those defined for the test bench. The scaling process is quite successful for the electric motors used to simulate the electric drive and the ICE, while small deviations can be observed for the propeller. These deviations are mostly due to the control system and the differences between the mechanical characteristics of the propeller and of the electric motor. Although the test-bench makes use of a model of the propeller to define the speed command imposed on EM3, the torque effectively exerted by the electric motor is not directly controlled and hence depends only on the physical properties of the device. This behavior is expected and does not represent an issue for the test-bench, which purpose is to test the propulsion system and the feasibility of its architecture, not the propeller aerodynamics. On the subject of the propulsion system, the scaling process is able to successfully reproduce both the static and the dynamic behavior of the electrical drive and of the ICE; the capability to recreate the dynamic behavior of the real components after the scale-down is of particular interest, since it allows to use the test-bench to study the coupling between the electric drive and the ICE, providing additional information useful for the definition of the mechanical transmission.
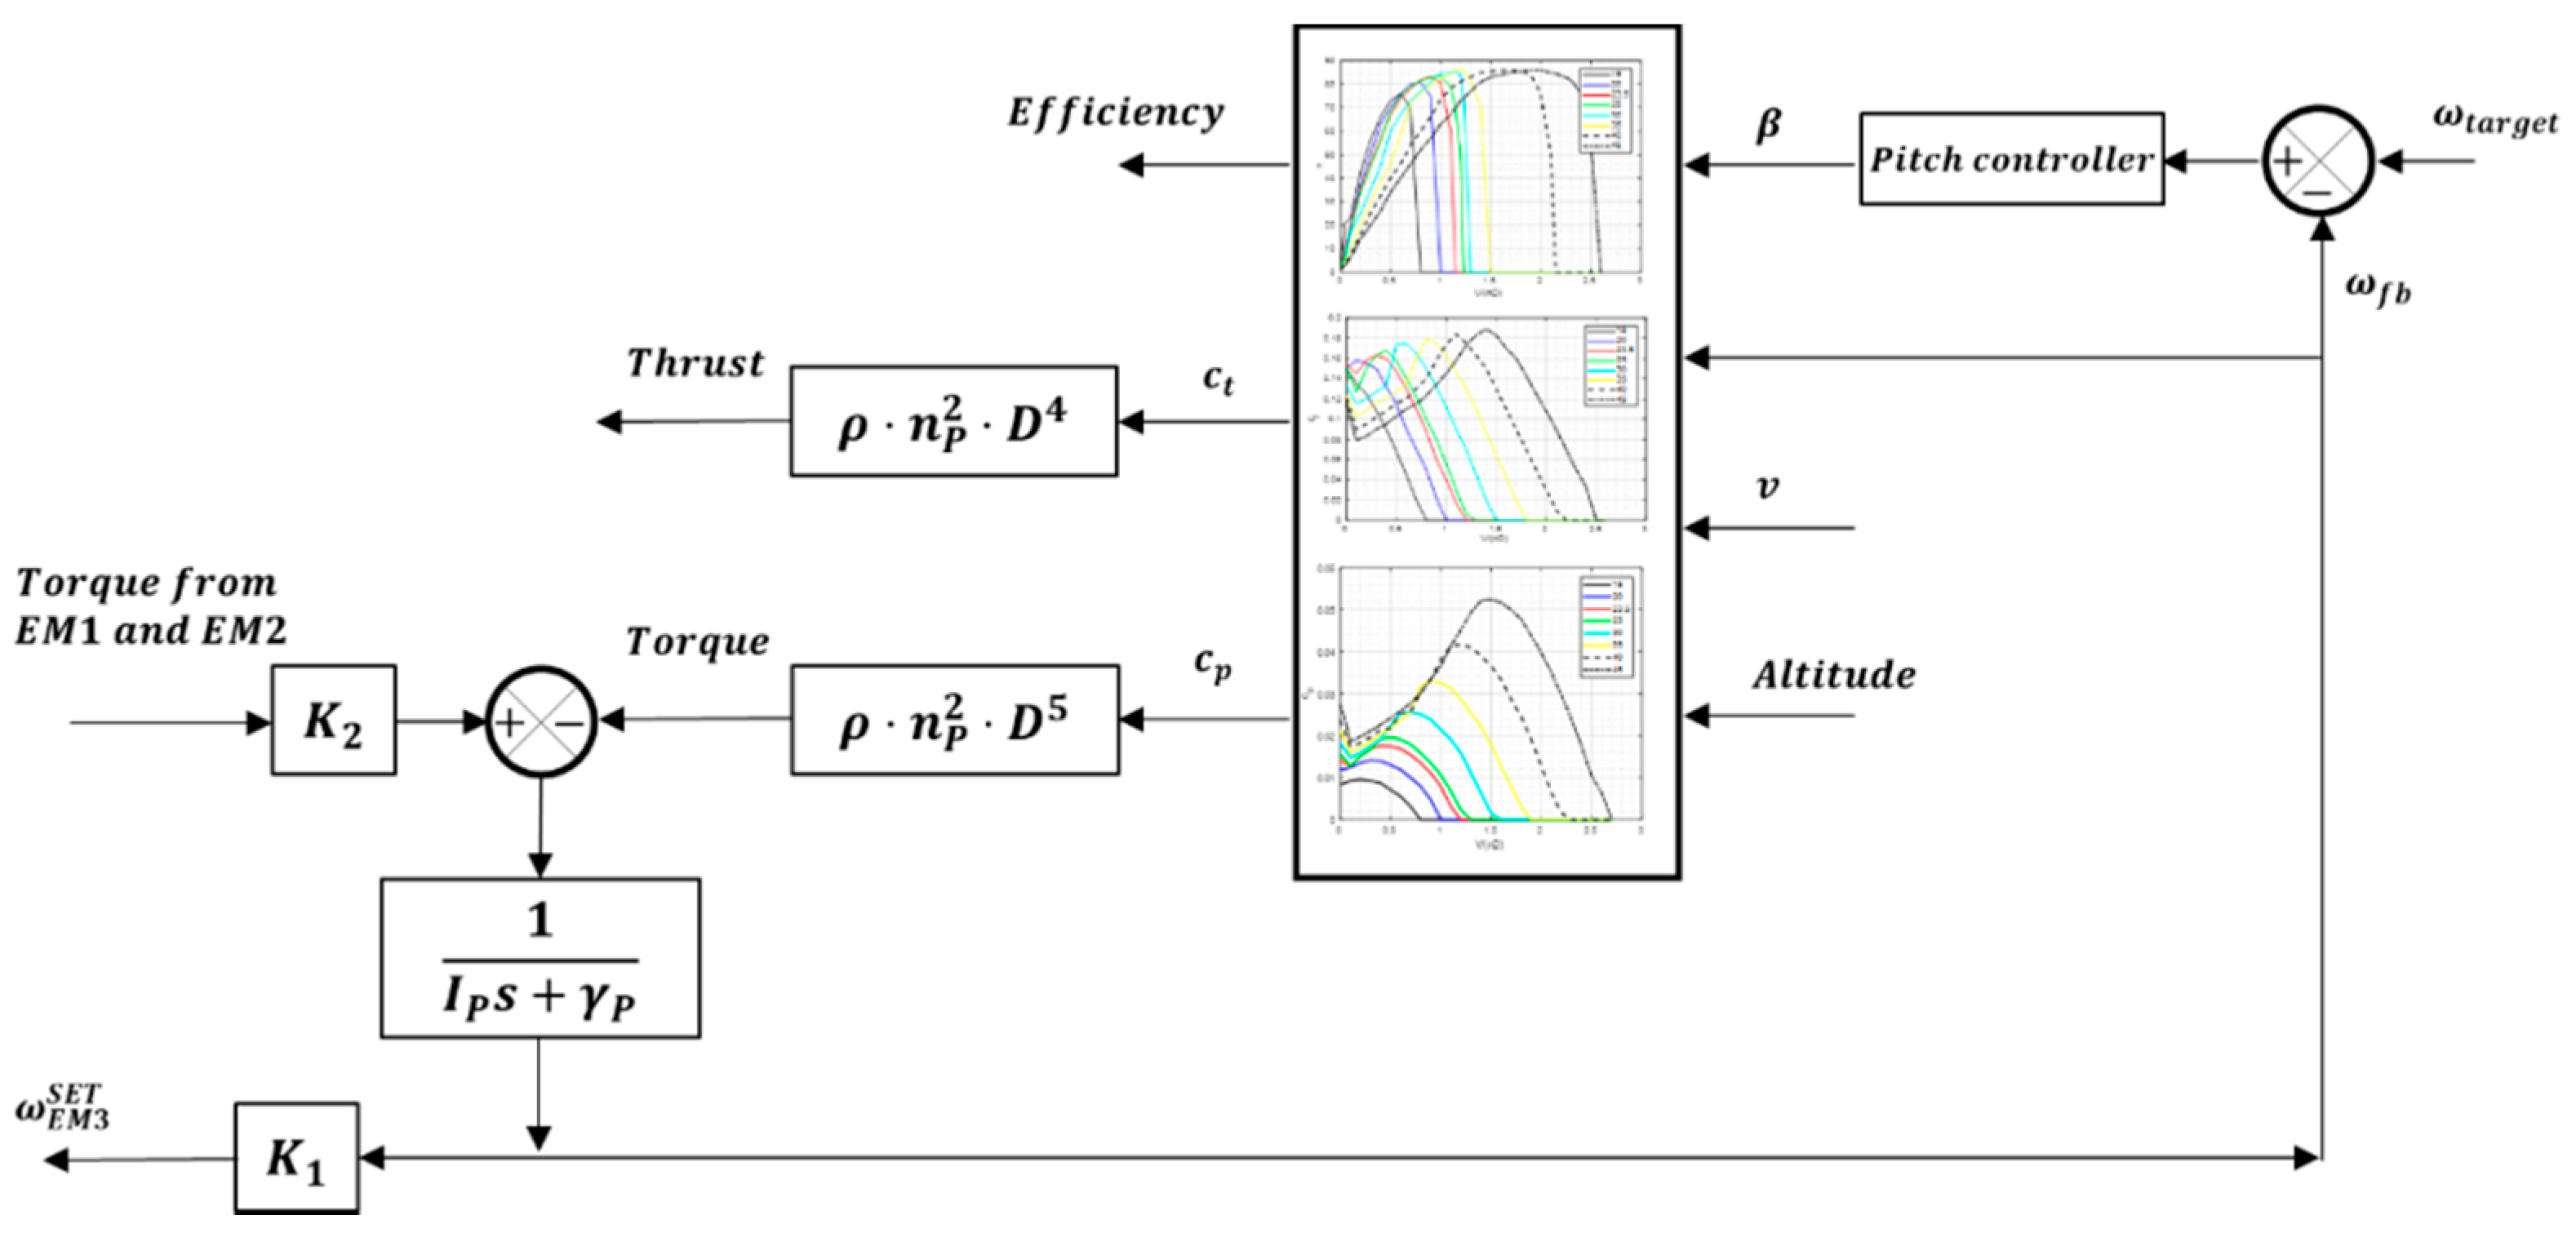
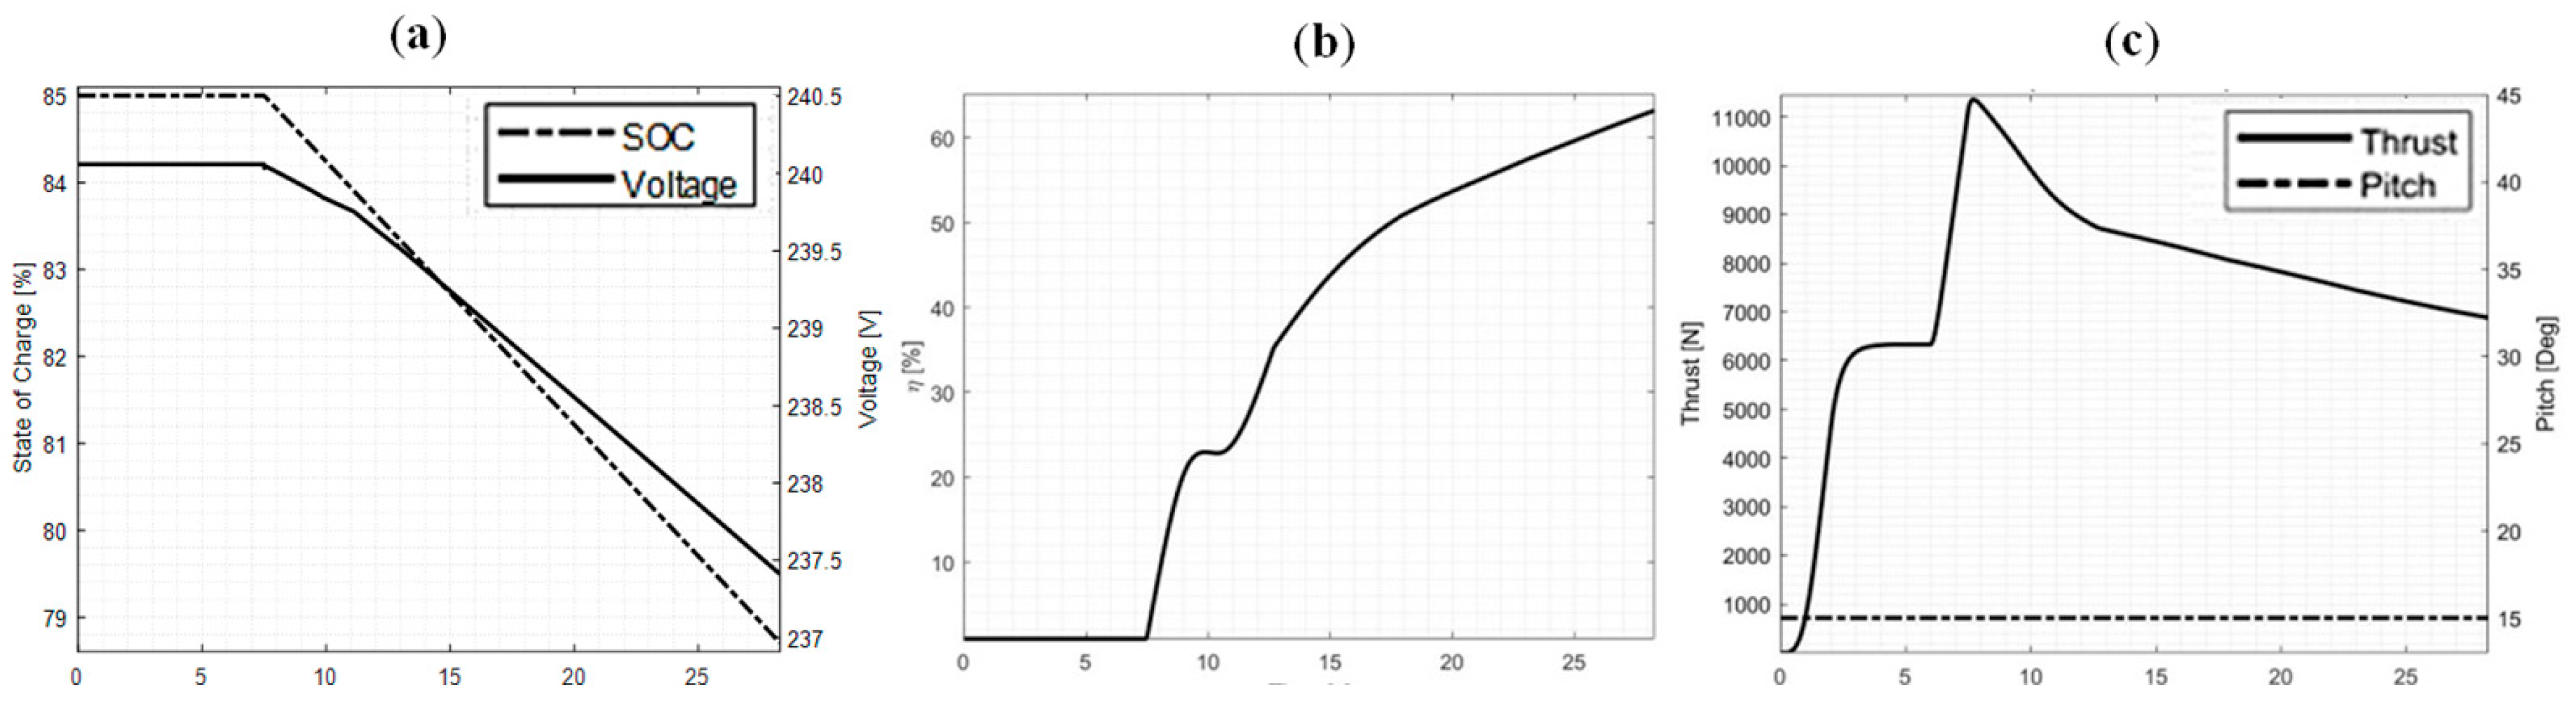
Figure 13 depicts the behavior of other simulated components, such as the battery (
Figure 13a) and the propeller (
Figure 13b,c) which output is used to control the EM3.
6. Conclusions
This paper proposes a new methodology for the architectural definition and the design of a virtual test bench for an aeronautical hybrid propulsion system, with the aim of supporting the test bench design and, when validated, generate additional synthetic data. The results of the scaling procedure have been compared with those coming from a high-fidelity simulation of the propulsion system under development. Results shows that the scaling of the inertial parameters of the different moving parts allows one to successfully replicate not only scaled-down steady state conditions, but also to closely mirror the expected dynamic behavior of the propulsion system.
The parametrization of the scale factor allows to easily prototype virtual test benches and test their behavior depending on the contextual need of the facility in which the real test bench is going to be installed (i.e., available electrical power, supply voltage...) hence providing a flexible tool for the preliminary design of the real test bench and the choice of its components. Further activities directed at the automatization of the scaling process and the optimization of the scale factor are underway.

 ,
, 


