1. Introduction
Supersonic combustion ramjet (scramjet) propulsion systems have been developed for the future air-breathing hypersonic vehicle. The scramjet flowpath consists of four parts: inlet, isolator, combustor, and nozzle. The inlet is used to capture and compress the incoming hypersonic air flow. For a highly efficient hypersonic airbreathing propulsion system, the inlet should provide high-performance compression with minimum aerodynamic losses produced by shock waves and fluid viscosity. Meanwhile, the inlet should be operated in a started mode [
1,
2,
3,
4,
5,
6,
7,
8,
9,
10]. From the view of flow structure [
6], the hypersonic inlet unstart is defined as the disgorging of the shock train system in the scramjet engine inlet and isolator. From the point of the inlet performance, if the internal flow changes the flow capturing characteristics of the inlet, the operation condition can be defined as inlet unstart [
2,
6].
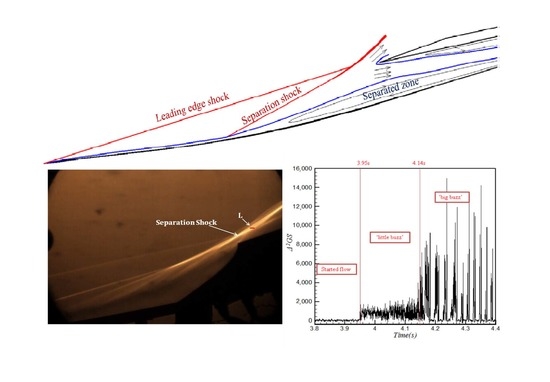
When the inlet is operating under the unstart condition, the internal flow in the scramjet isolator will change the flow capturing characteristics of the inlet according to the above two criteria, and the separation shock in the external-compression flow field will oscillate (
Figure 1) around the inlet cowl. Unstart induces severe flow fluctuations and the transient flow structures that characterize the process of unstart are shock oscillations and wall pressure fluctuations. Unstart can lead to unsteady and higher aerodynamic and thermal loads on the vehicle structure. Several flight tests failed due to the unstarted inlet flow, such as the X-51A in its second flight test [
11,
12].
The downstream backpressure increases as the result of the thermal choking that is triggered by the excessive heat that is released in the combustor, which has been considered as a leading cause of unstart [
4,
5,
6]. The rising backpressure chokes the inlet flow and forms upstream propagating disturbances as an unstart shock train system [
13,
14,
15]. The unstart shock train system, which involves an interaction between the duct’s peripheral boundary layer and the central shock wave field, usually appears in constant or nearly constant cross-sectional area supersonic/hypersonic duct flows [
15,
16,
17]. To contain the unstart shock train system caused by the downstream pressure rise from combustion, an isolator portion of a scramjet engine is a constant-area duct located between the engine inlet and the combustor section. When the pressure increase is large enough, the unstart shock train system can be pushed out of the cowl lip, and unstart occurs. Consequently, the severe oscillation of the oblique shocks in the external-compression flow field and the fluctuation of the wall surface pressure are observed.
Flow behavior during the hypersonic inlet unstart process has been extensively investigated in low-enthalpy hypersonic flow conditions. In these studies, researchers usually use mechanical throttling of the flow to simulate combustion-driven high-backpressure. The results of these studies prove the effectiveness of the experimental method based on the mechanical throttling system, and reproduce the flow characteristics during the unstart process well [
14,
15,
16]. These studies revealed that the downstream backpressure increase from the flow-throttling device choked the flow in the inlet-isolator. Several flow visualization techniques and parameter measurements, such as Schlieren visualization, fast-response pressure measurements, and particle image velocimetry (PIV), were employed to investigate the unstarted flow characteristics. Wagner et al. produced an unstart shock train system in an inlet/isolator model in a Mach 5 flow using the downstream movement of a mechanical flap. They captured the flow characteristic of shock-boundary layer interactions during the inlet unstart process using PIV and high-speed Schlieren photography and displayed the formation and dynamics of the unstart shock train system [
14]. Do H. et al. [
13] improved the understanding of the shock-boundary layer interaction in the unstart dynamics. They used planar laser Rayleigh scattering imaging to characterize the unstart flow features and found that the diagnostic technique is capable of highlighting detailed flow features, such as shocks, boundary layers, and slip lines. Their experimental results suggest that inlet unstart can be delayed or avoided by controlling the boundary layer on the inlet walls. The fine flow structures of the unstart shock train in an isolator flow were also revealed by Chen et al. [
18,
19] by performing nano-tracer planar laser scattering (NPLS), which makes it well-suited for studying the flow mechanism.
The oscillatory flows in hypersonic inlet unstart process can be classified into two types: relatively mild “little buzz” and highly violent “big buzz.” [
9] During the little buzz process, a separation bubble appears on the bottom wall near the cowl (
Figure 1), shrinks and expands periodically, resulting in a small-amplitude oscillatory motion of the induced separation shock wave. During the big buzz process, the external-compression shock system is circularly destroyed and reestablished, and the induced separation shock exhibits a large-amplitude oscillatory motion. The downstream throttling device can be used to initiate the unstart of the hypersonic inlet [
20] and keep the flow mode in the starting condition, little buzz cycle, and big buzz cycle at low, moderate, and high throttling ratios, respectively. Numerous studies [
4] have demonstrated the ability to capture the flow field dynamics in unstarted hypersonic inlets and the importance of alleviating the negative effects in hypersonic vehicle design. Most of the experimental studies were focused on two aspects: shock structures analysis by flow visualization and data time history/frequency analysis by dynamic wall pressures. However, only a few studies have tried to establish the link of the latter two aspects using experimental data quantization.
To date, nearly all the unstart detection techniques are based on high-frequency pressure measurements [
20,
21,
22,
23]. However, the term “unstart” is used to denote operation under conditions where flow phenomena in the internal portion of the inlet alter its capture characteristics [
23]. As a result, the hypersonic inlet unstart is accompanied by the induced separation shock (
Figure 1) with airflow spillage above the cowl. Therefore, the unstart detection technique based on time-resolved high-speed Schlieren images of separation shock is important to characterize unsteadiness. As part of the study presented in this paper, an image processing algorithm that tracks unsteady separation shock motion in time-resolved high-speed Schlieren images has been developed. This diagnostic method shows the spatial observation of separation shock location rather than that inferred from wall pressure fluctuation.
A hypersonic inlet model has been tested in a hypersonic wind tunnel to study the unstarted hypersonic inlet flow in this paper. The downstream backpressure was controlled by regulating the flow with a plug device, which would switch the inlet between the start and unstart states. High-speed Schlieren flow visualization was used to capture the transient shock structure around the cowl. High-frequency pressure transducers were installed on the wall around both the cowl and isolator areas. Through the combined analysis of the shock oscillation and pressure fluctuation characteristics in the unstarted inlet flow, the correlation of the separation shock motion in the unstarted inlet flow with the pressure fluctuations in the separated region has been addressed. The simultaneous measurements of wall pressure signals near the region of the separation shock motion and in the separated downstream flow region have been made. The objective is to explore whether pressure fluctuations in the separated flow correlate with separation shock motions during the unstart process and whether these pressure fluctuations induce shock motions and vice versa using time-resolved high-speed Schlieren visualization. Furthermore, we clarify the unsteady flow pattern of the “little buzz” and “big buzz” modes in hypersonic unstarted inlet based on time-resolved high-speed Schlieren images of separation shock. Meanwhile, the most suitable location to place the transducers is determined on the basis of the combined analysis of fluctuating wall-pressure and oscillating separation shock data.
2. Experimental Apparatus and Procedures
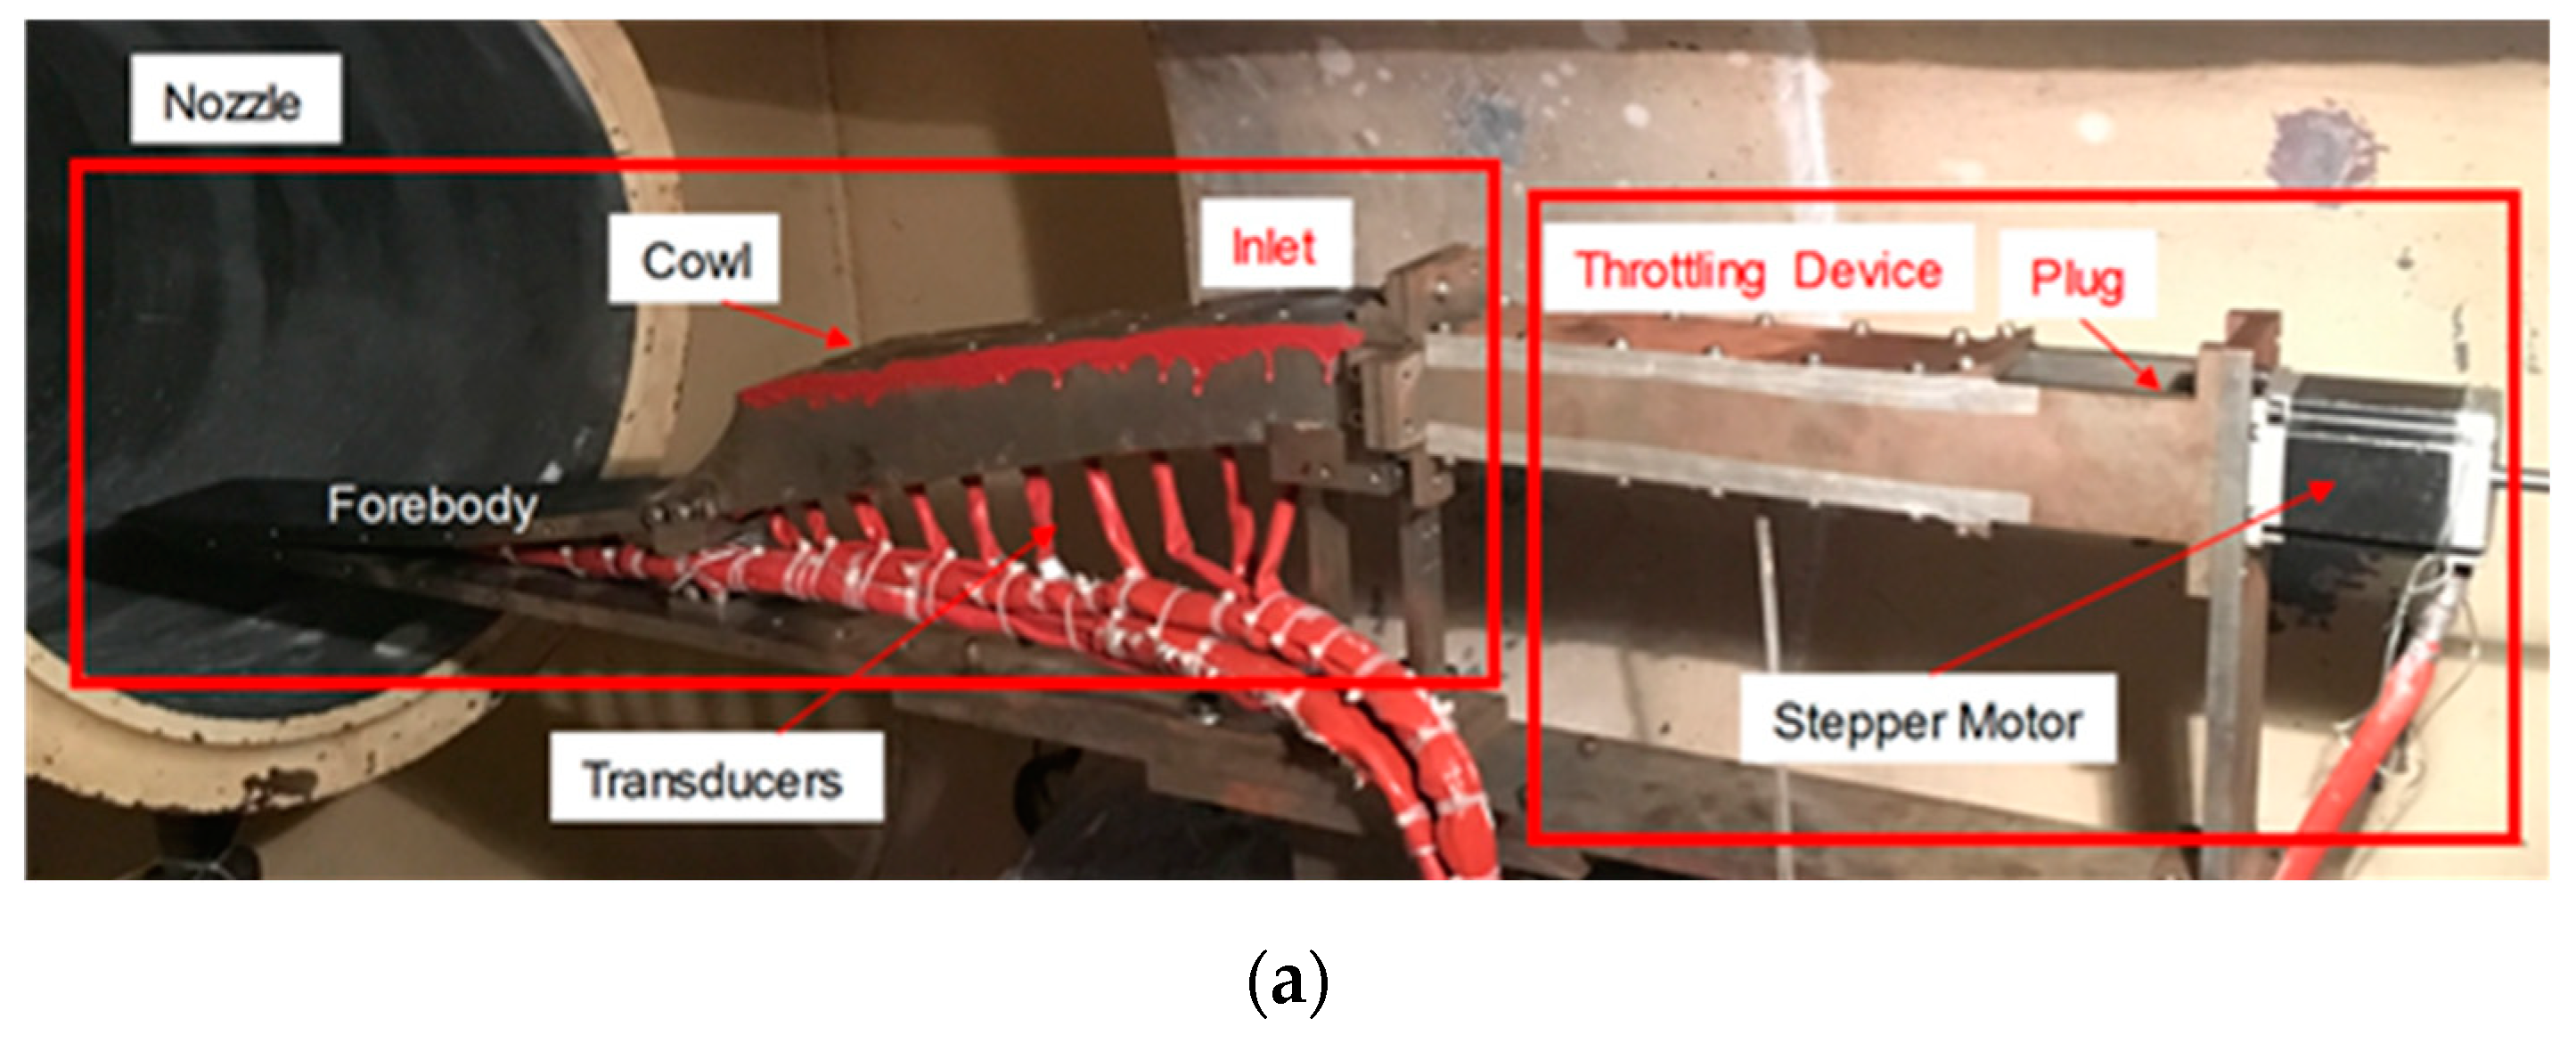
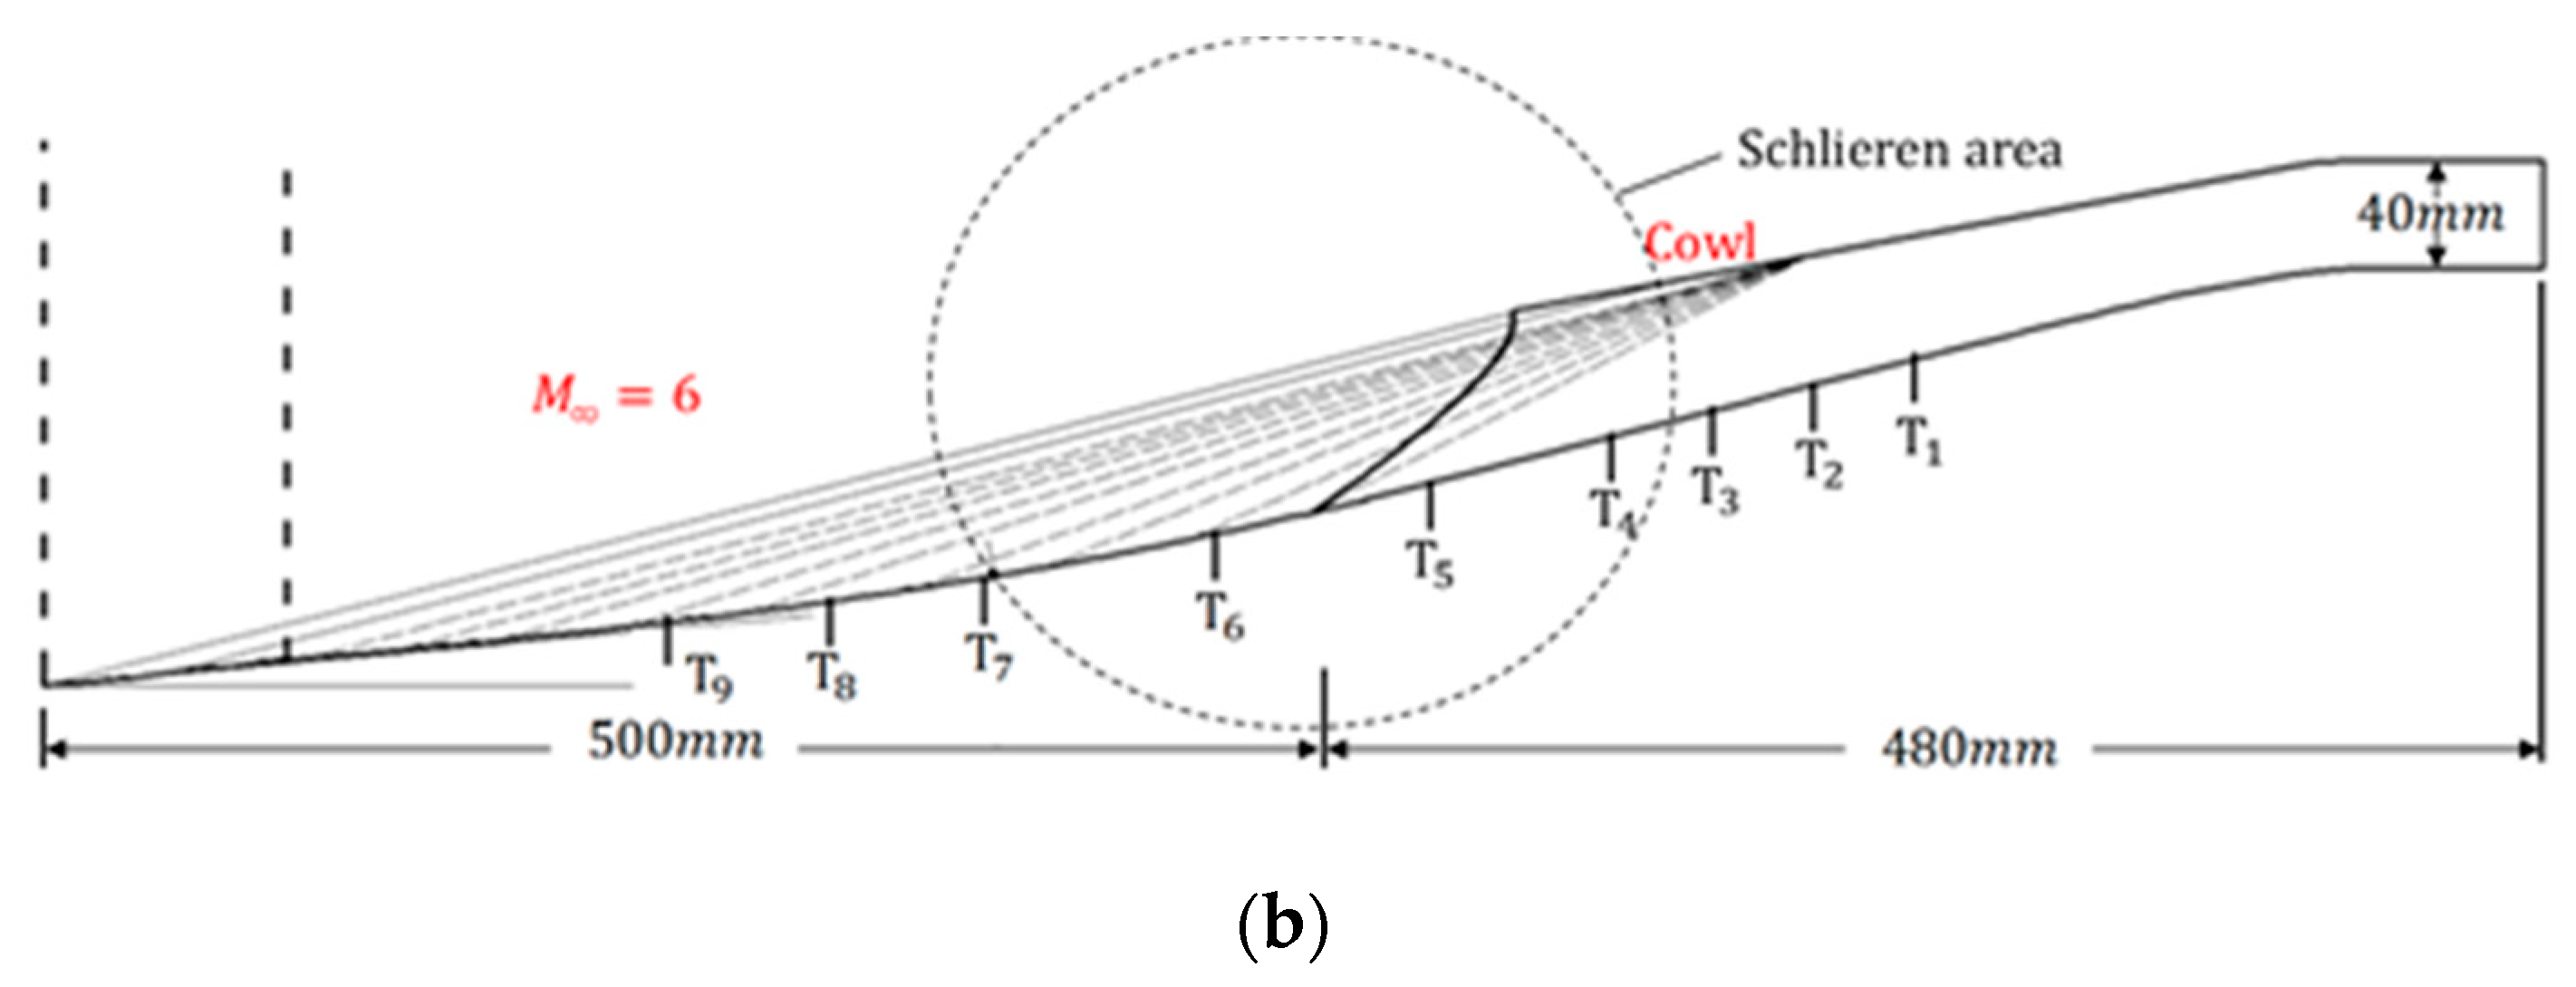
The test model is a Busemann-type [
24] hypersonic inlet [
25] (
Figure 2) that is 980 mm in length with a rectangular exit, which is 40 mm in height and 44 mm in width. The inlet unstart state is generated by a throttling device with a plug (half-apex angle of 20°) driven by a stepper motor.
The on-design Mach number,
M, is 6 based on a combined flow field. According to a study conducted by You et al. [
26], the basic flow field ICFC (internal conical flow C), which is a combination of ICFA (internal conical flow A) and the Busemann flow [
24], presents a better compression performance with a limited inlet length. A streamline tracing method [
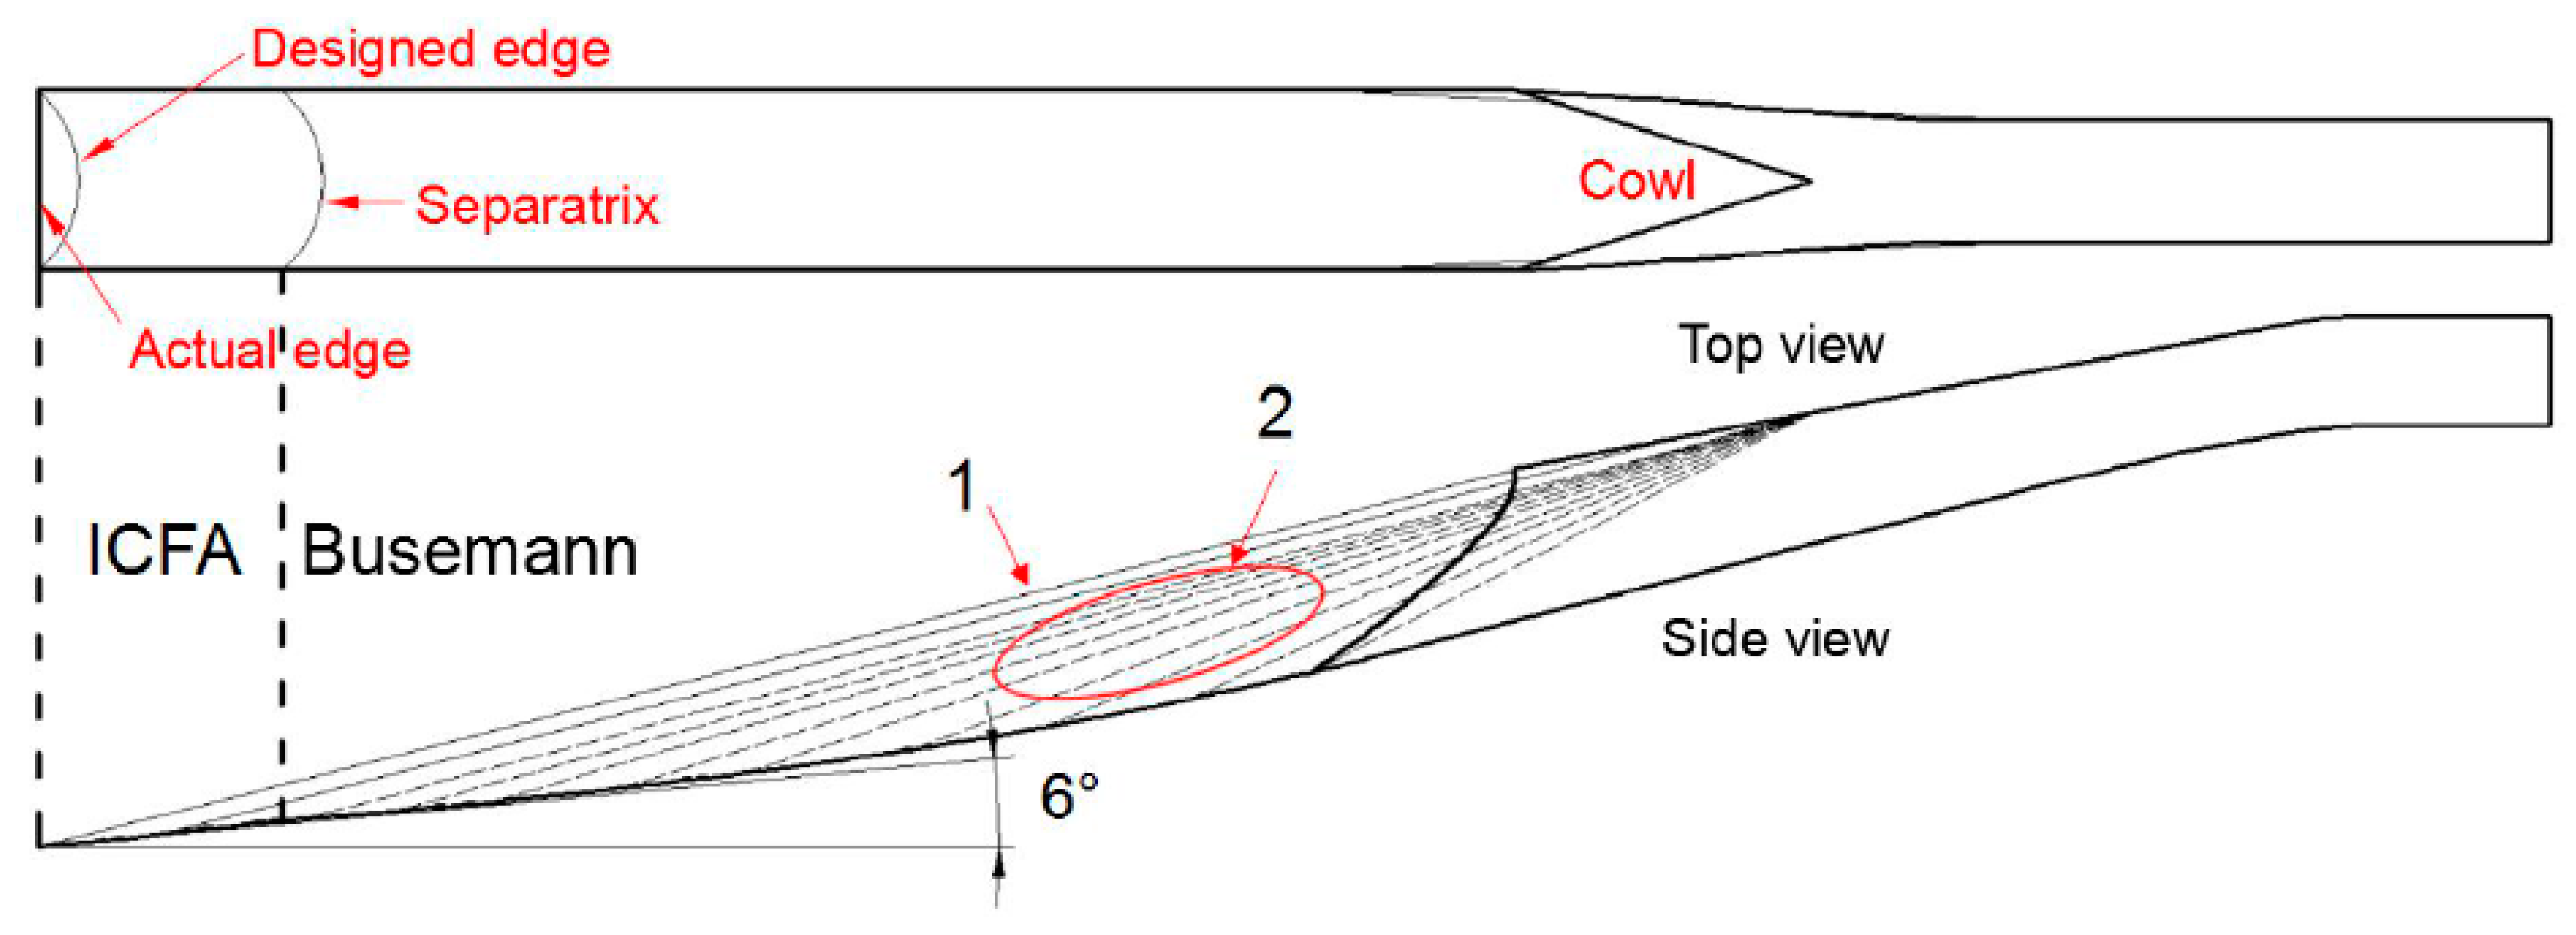
27] is used to shape the inlet walls, and a “V”-shaped cowl is formed in the roof. As indicated in
Figure 3, the ICFA flow section, whose edge wedge angle is 6°, provides the leading-edge shock 1 (shock angle β = 13.98°), whereas the Busemann flow section generates the isentropic compression shock 2 (the shocks in the side view of
Figure 3 are on the symmetrical plane of the inlet). Both the designed leading edge and the separatrix between the ICFA and the Busemann flow fields are curved; however, to match the vehicle’s body design, the curved leading edge is replaced by a straight edge in the actual test model. The total contraction ratio of this model is 5.095, and that of the internal contraction ratio is 2.171.
A non-dimensional variable Δ is defined to measure the effect of the back pressure. The Δ is calculated using the following equation.
Atx is the area size where the flow can effectively cross the outlet,
A0 is the total area of the exit of the isolator,
b is the width of the rectangular exit of the inlet (
b = 44 mm),
h is the distance between the slider and the wall, and
x is the displacement of the slider,
Figure 2. Therefore, a high Δ corresponds to a high throttling level. The plug is driven by a stepper motor, which can move 0.01 mm per step, and ensures accurate control of the system.
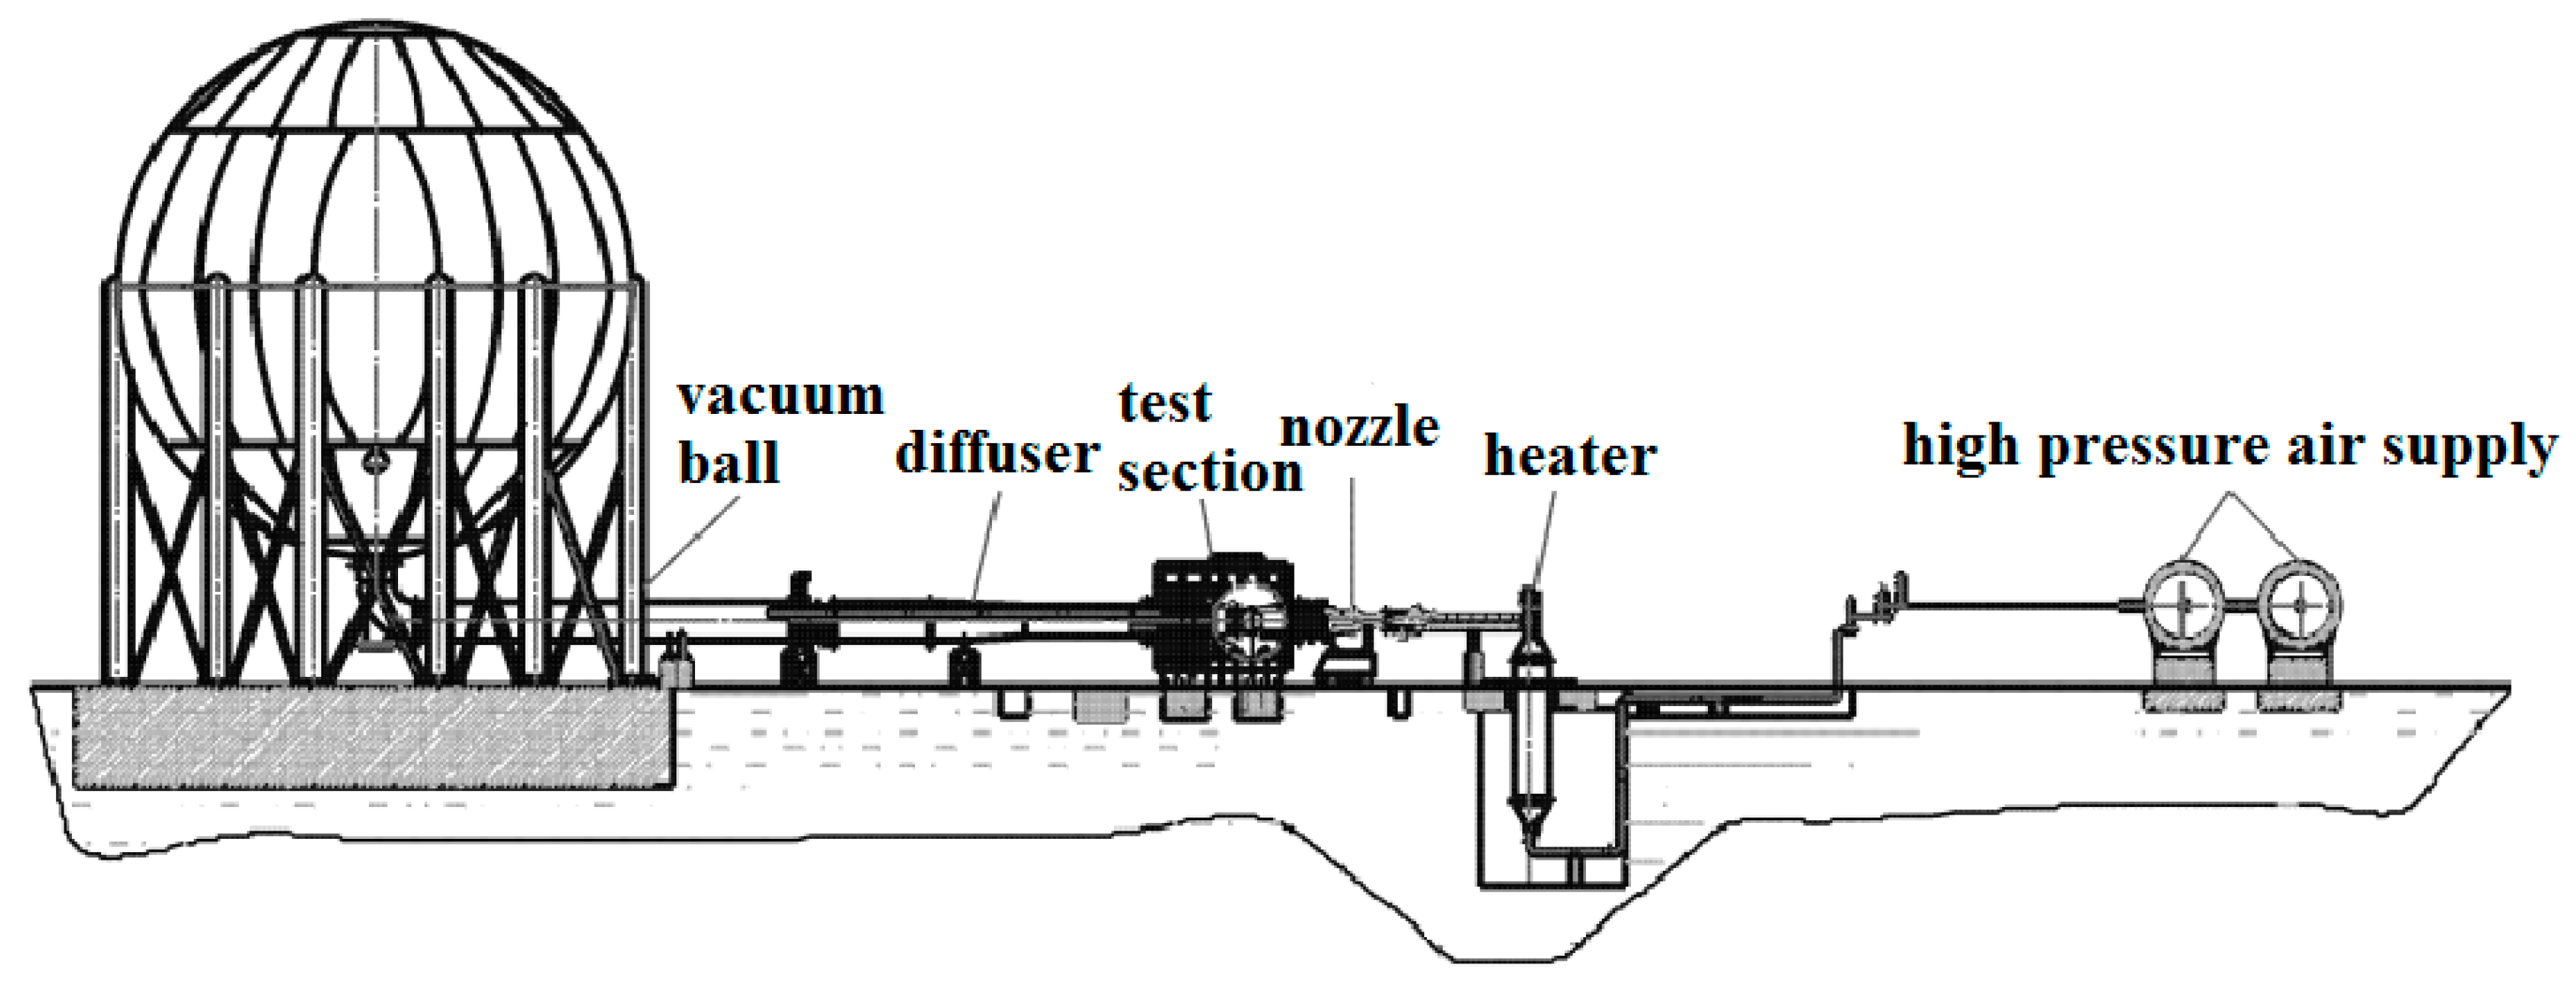
The experiments were conducted in the hypersonic wind tunnel of Nanjing University of Aeronautics and Astronautics [
16] (NHW,
Figure 4) with a freestream Mach number
M∞ = 6. The wind tunnel is a blow-down facility. Air is supplied by storage tanks with a volume of 32 m
3 at a pressure of 23 MPa. The converging–diverging nozzle (exit diameter of 500 mm) mounted in the test section is interchangeable and provides nominal freestream Mach numbers from 4.0 to 8.0. The wind tunnel’s run time, which depends on the Mach number, is 7–10 s. A glass window (diameter of 300 mm) is embedded in two of the test section walls for optical access. The air is discharged into a ball-shape vacuum vessel (volume of 650 m
3) downstream from the test section and diffuser. The experiments can be conducted with 0.04–1.0 MPa total pressures, 288–685 K plenum temperatures, and 6.47 × 10
5–2.24 × 10
7 m
−1 unit Reynolds numbers.
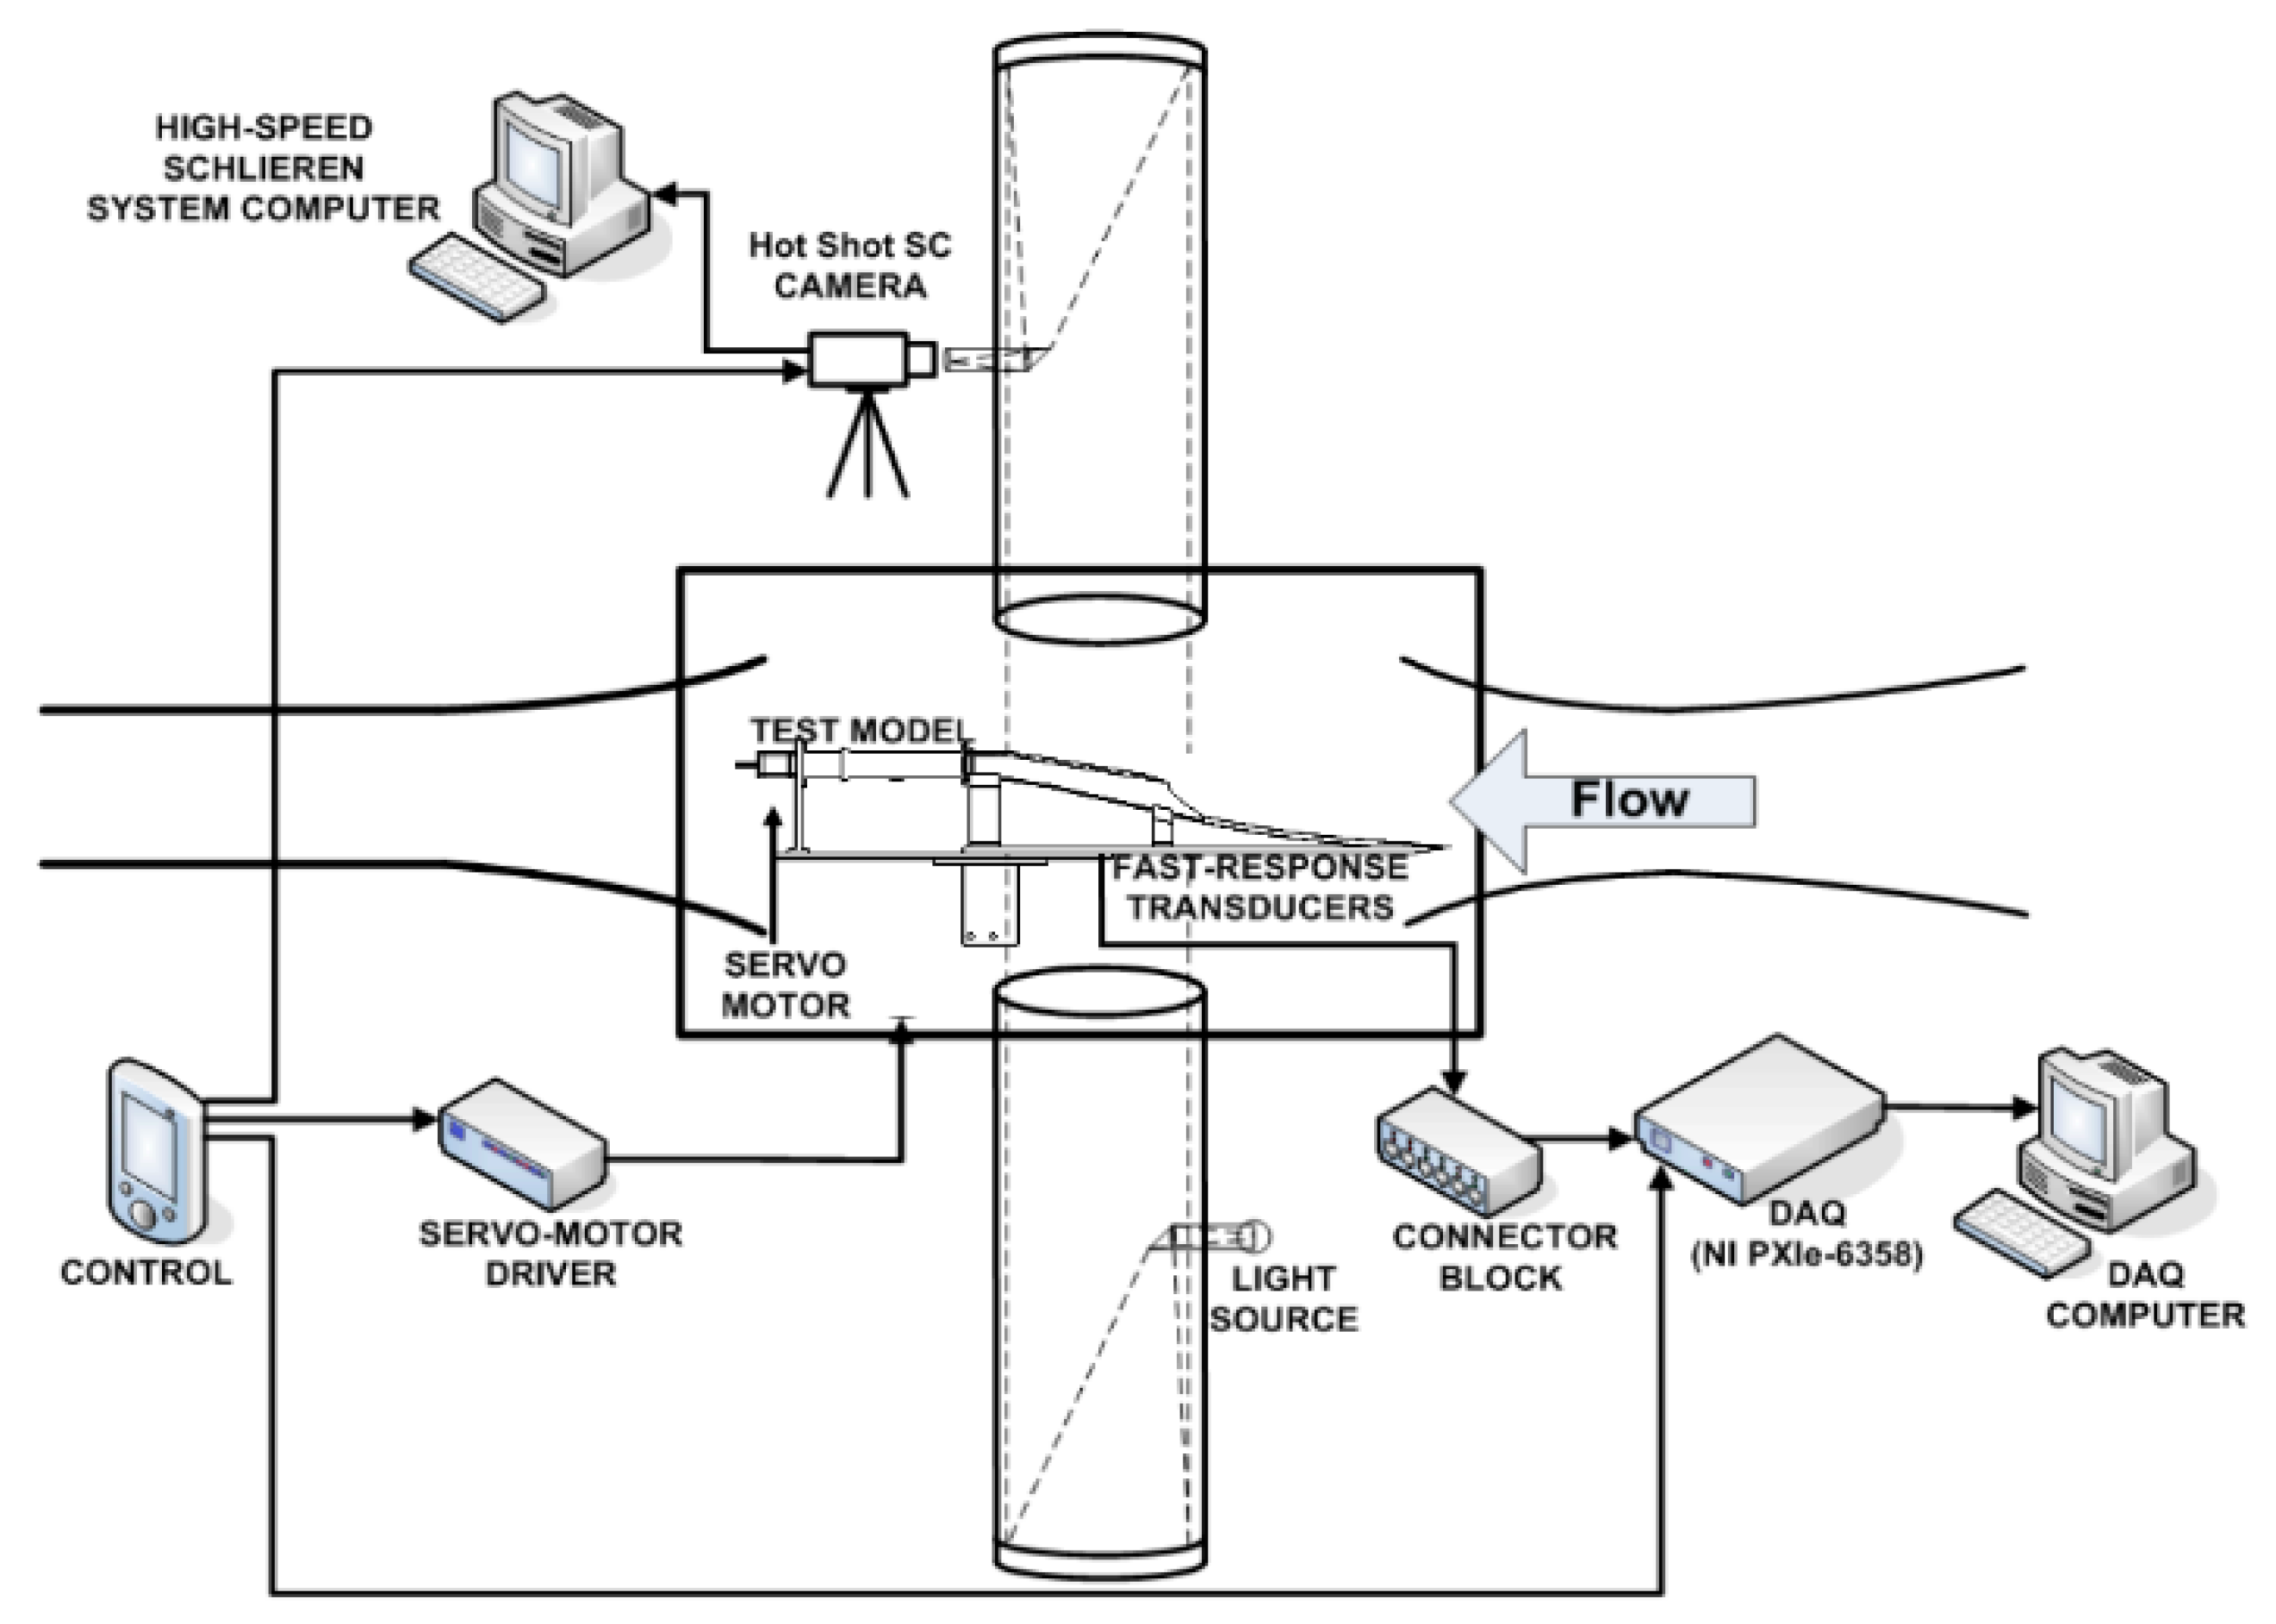
Figure 5 shows the schematic of the measurement system setup. The pressure measurement system consists of 9 fast-response transducers and data acquisition (DAQ) cards (National Instruments PXIe 6358). The transducers (Kulite, XTEL-190M, 0–50psi) were mounted along the centerline of the lower wall (
Figure 2, T1–T9). The signals were acquired at a sampling rate of 10 kHz using data acquisition cards with a sampling time of 10 s, which covers the entire run time of the wind tunnel. Along with pressure measurement, a Schlieren visualization system was used to obtain the flow characteristics. The Schlieren system used a combination of a light source, optical devices and a camera in a typical Z-type set-up. A NAC (NAC Image Technology, Minato-ku, Tokyo, Japan) Hotshot High Speed Camera operated at a frame rate of 5 kHz and a resolution of 600×438 pixels was employed.
Figure 5 shows the measurement system setup. To keep the Schlieren visualization system synchronized with the pressure signals, a synchronizer was used to trigger the camera and the DAQ pressure acquisition system simultaneously. A 2.6 s delay was imposed on the motor operation.
3. Results and Discussions
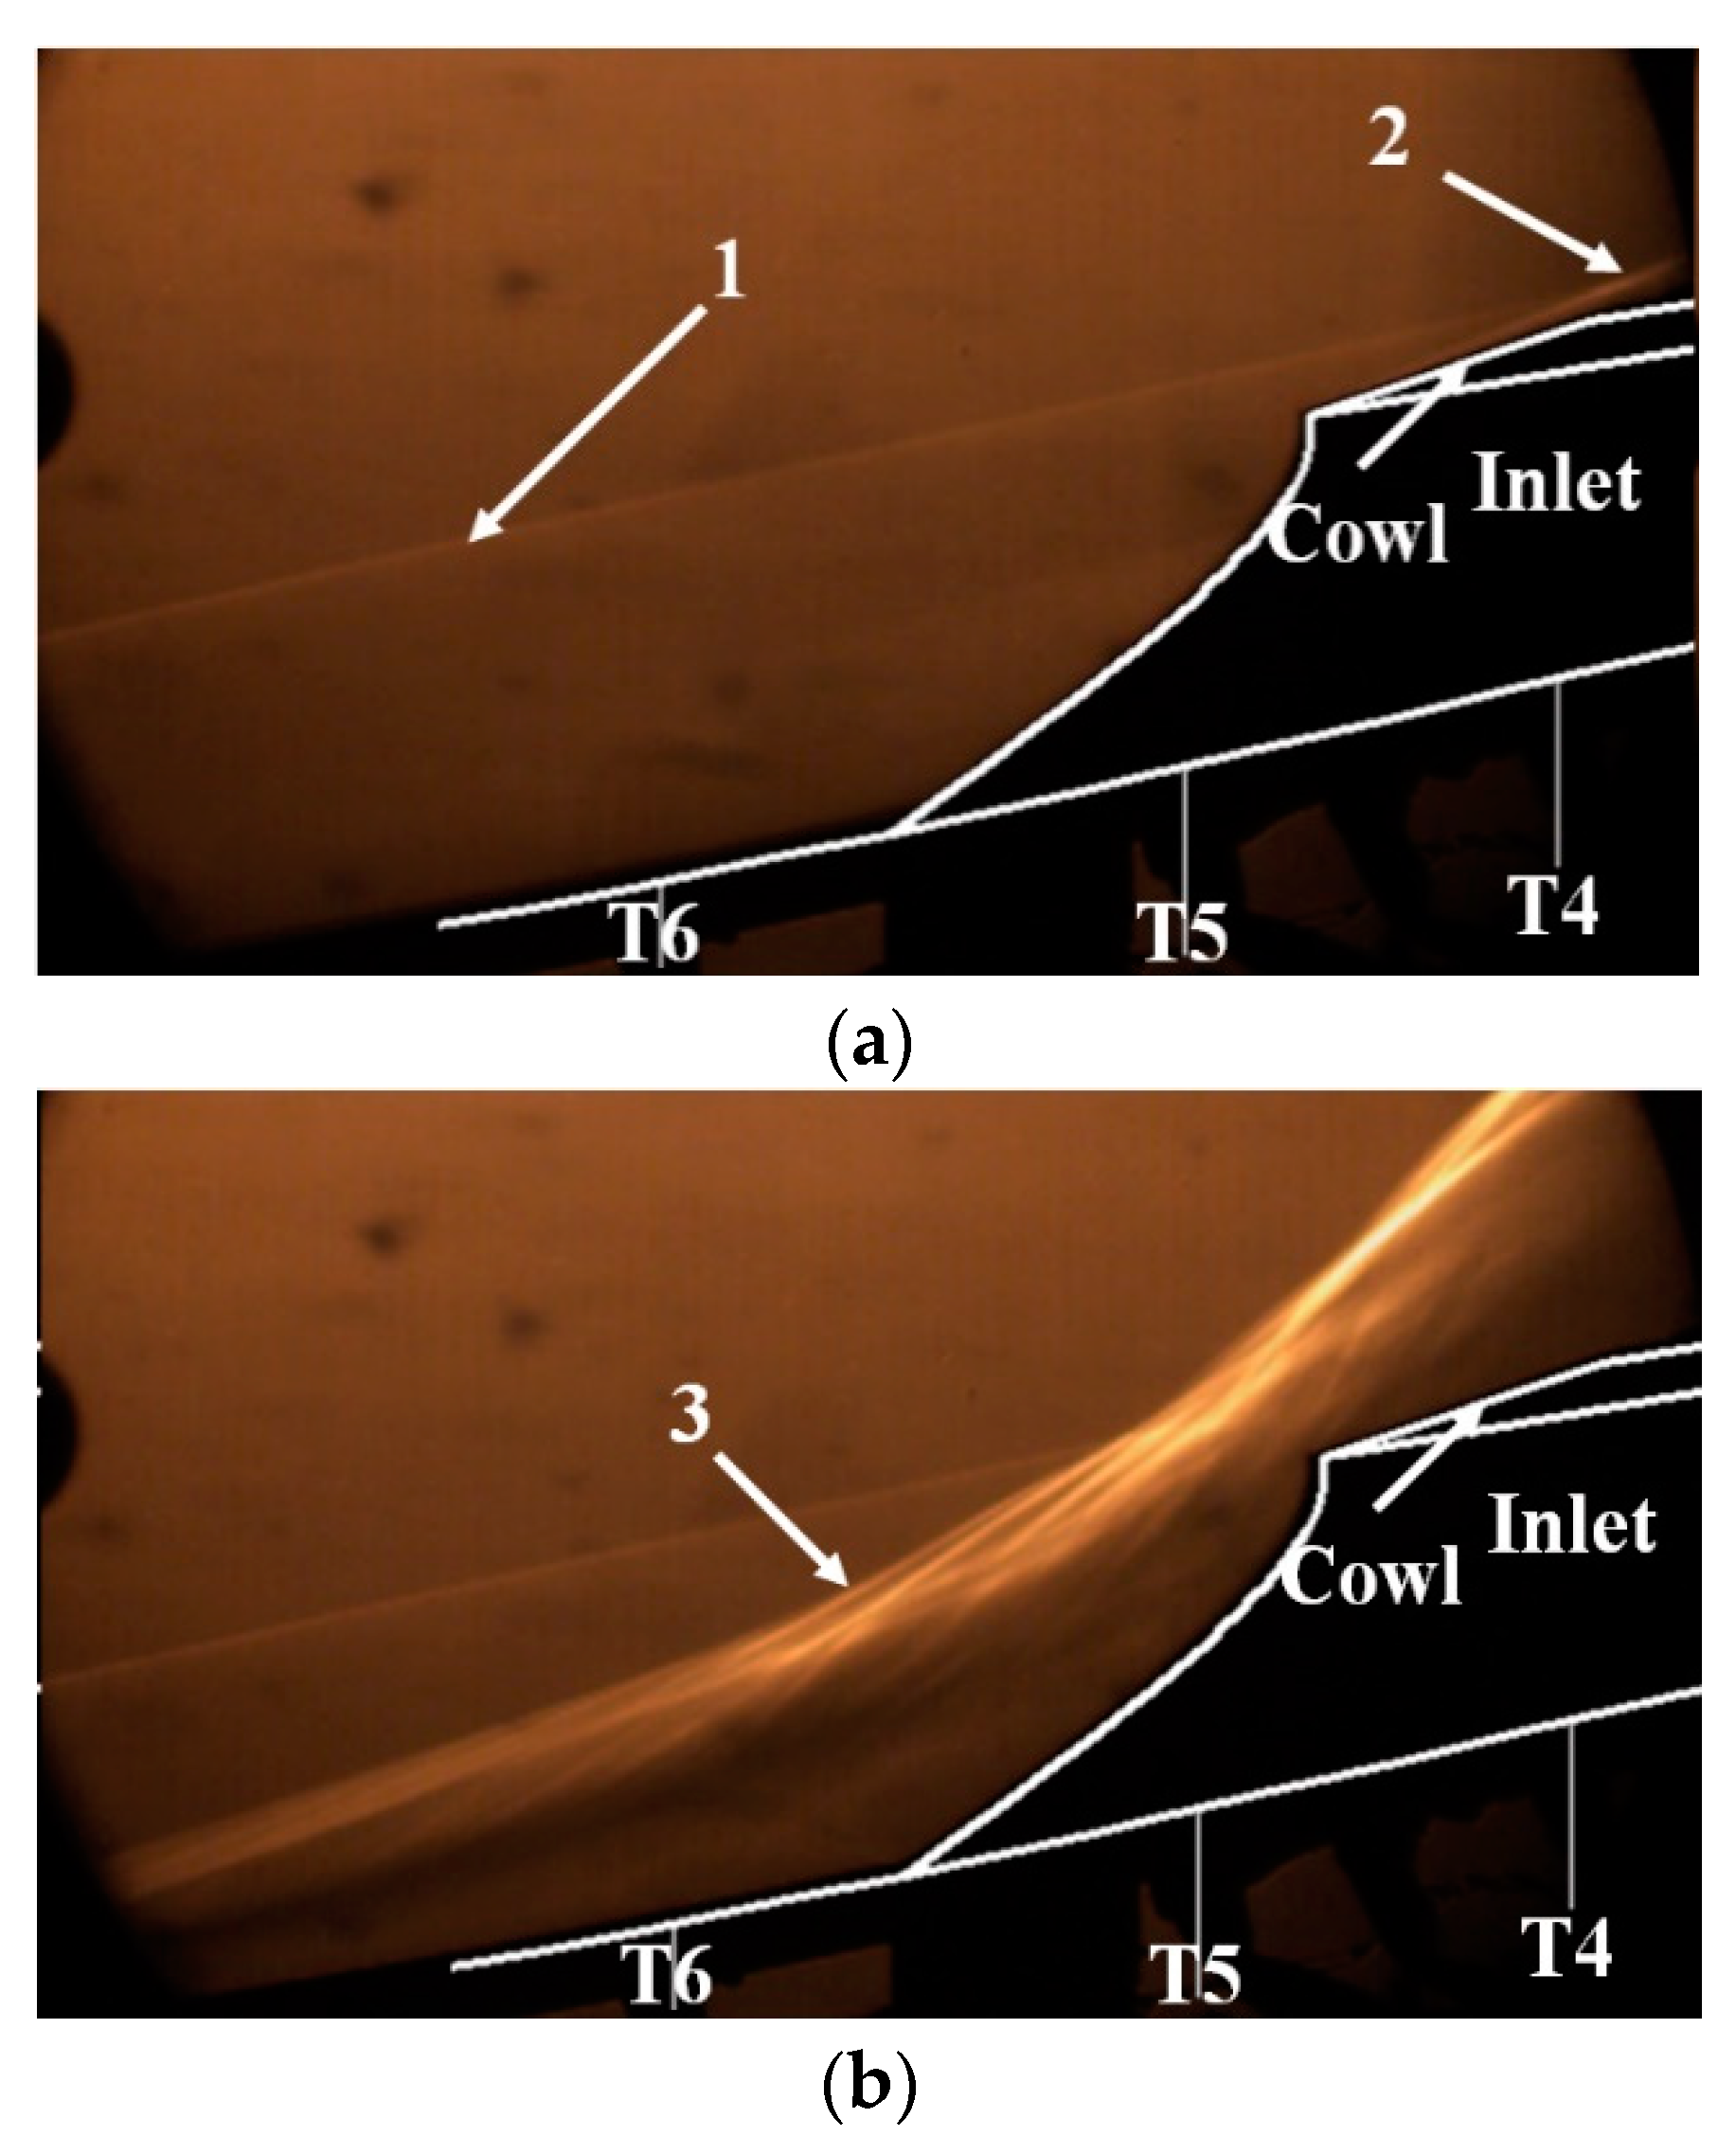
The free stream flow conditions are shown in
Table 1. The Schlieren pictures were acquired around the cowl area as shown in
Figure 6. There are significant differences between the started and unstarted flow field. In the started state, the leading-edge shock 1 was straight and close to the cowl; the cowl shock 2 was visible and steady. When the state switched to unstarted from the high throttling level (
Figure 6b), shock oscillation occurred around the cowl of the inlet with a strong separated shock 3 with the flow experiencing a periodic separation and reattachment of the boundary layer.
To establish the connection between the separation shock motion and wall pressures, a combined analysis is necessary. However, it is difficult to analyze the characteristics of the separation shock from the large number of Schlieren images, which means an image quantization method is necessary.
3.1. Schlieren Image Analysis and Quantization Method
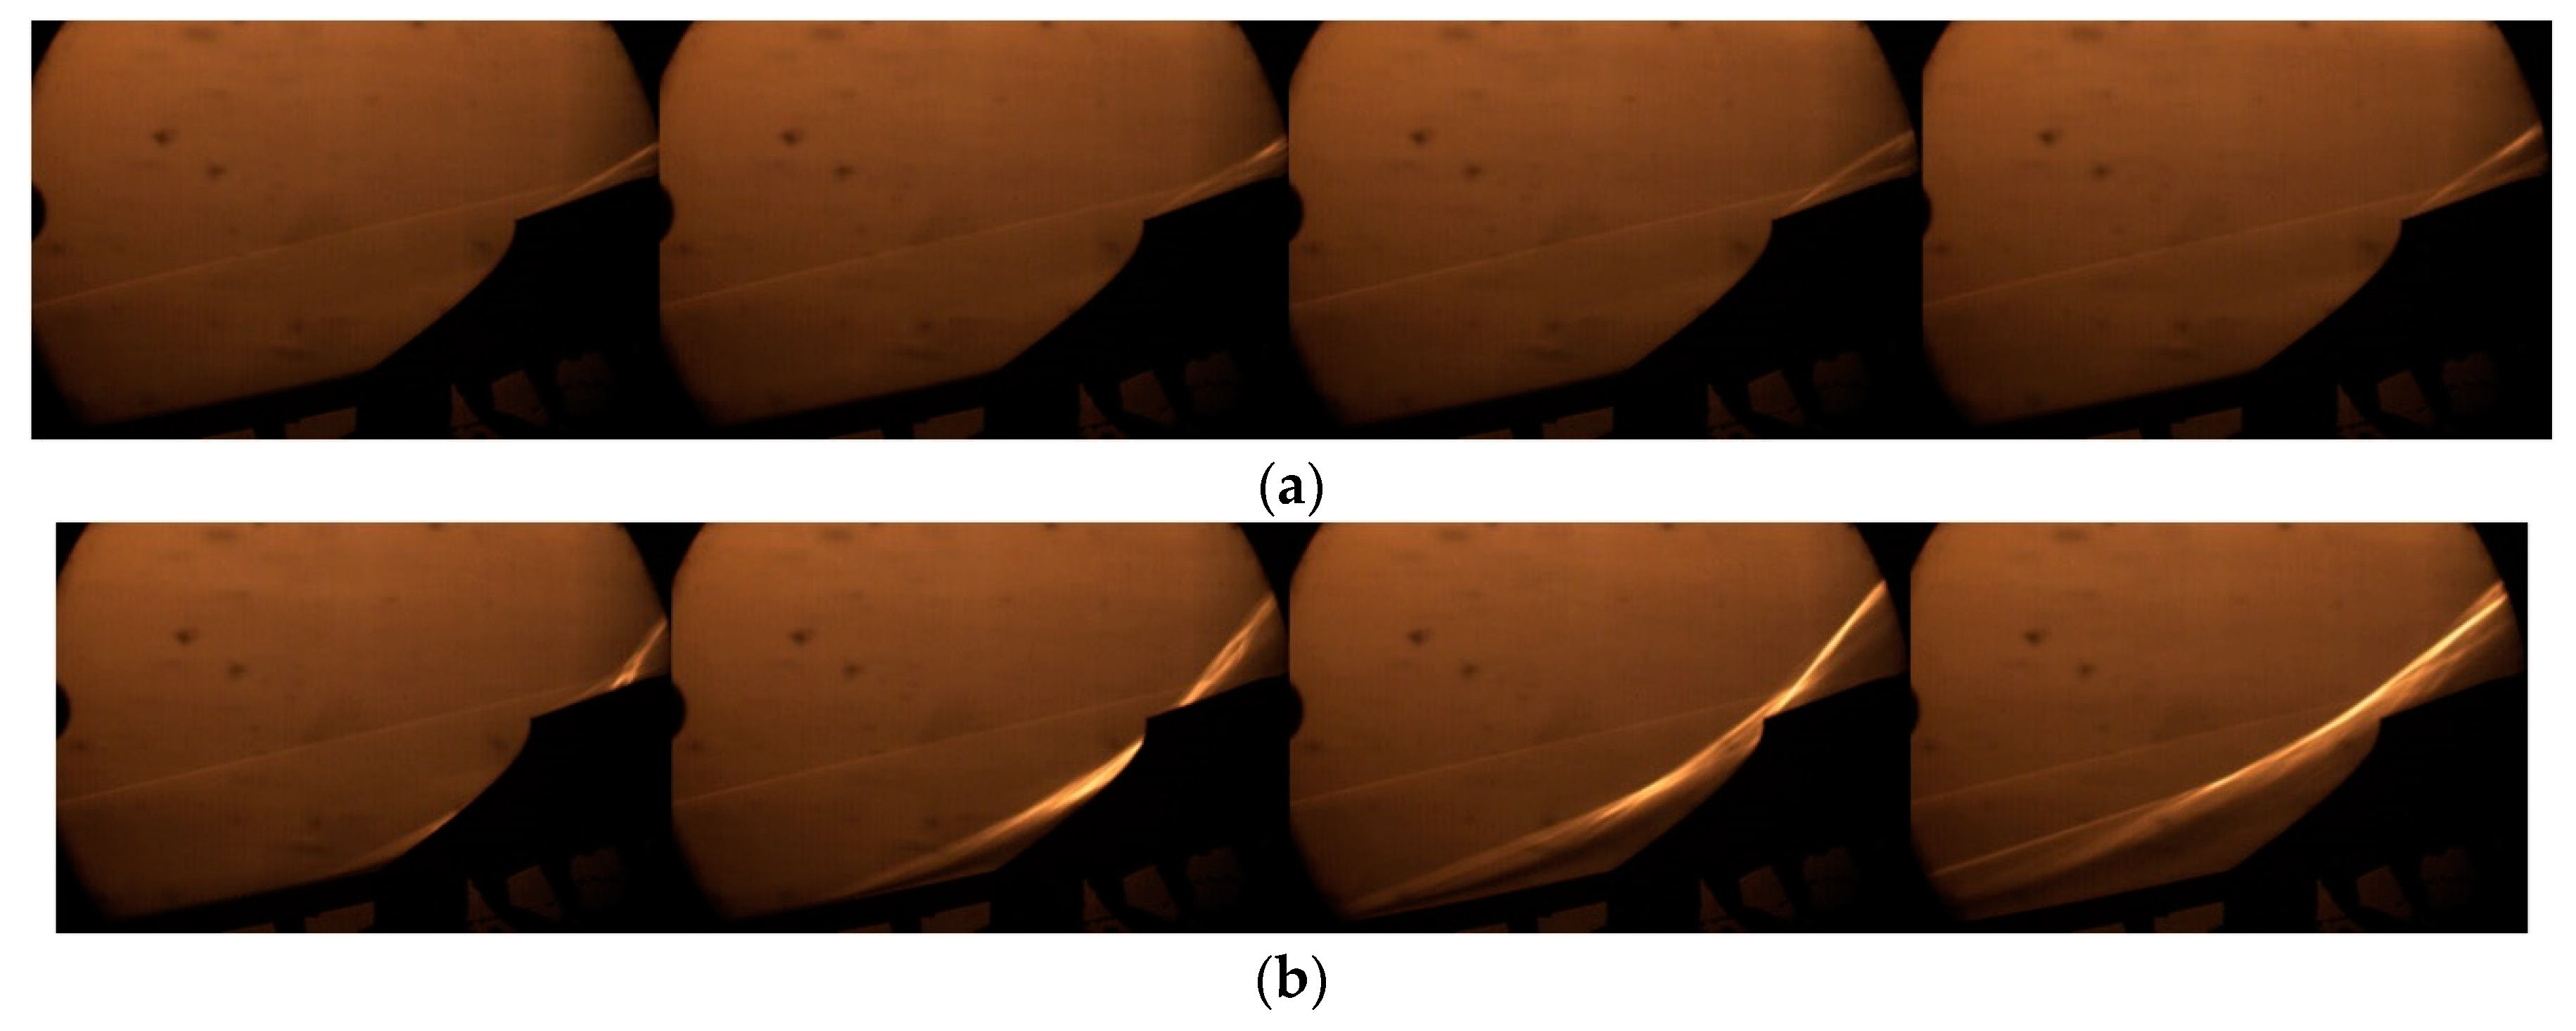
The characteristics of the unstarted flow can be analyzed using Schlieren images. When the throttling level Δ is increased to 34.5%, intermittent airflow spillage occurs and hypersonic inlet unstart appears according to Schlieren images. At that moment, the unstarted flow patterns demonstrate relatively mild unsteadiness called ‘little buzz’.
Figure 7a depicts the pictures of the ‘little buzz’, the cowl shock oscillates at a small amplitude. When the throttling level Δ is increased to 35.38%, the violent ‘big buzz’ occurs.
Figure 7b shows the pictures of ‘big buzz’ during one cycle, and the structure of the flow field changing dramatically with an obvious periodic characteristic. Although the inner portion of the inlet flow field cannot be seen due to the restricted size of optical access, the characteristics of the unstarted separation shock oscillation can be analyzed using image quantization.
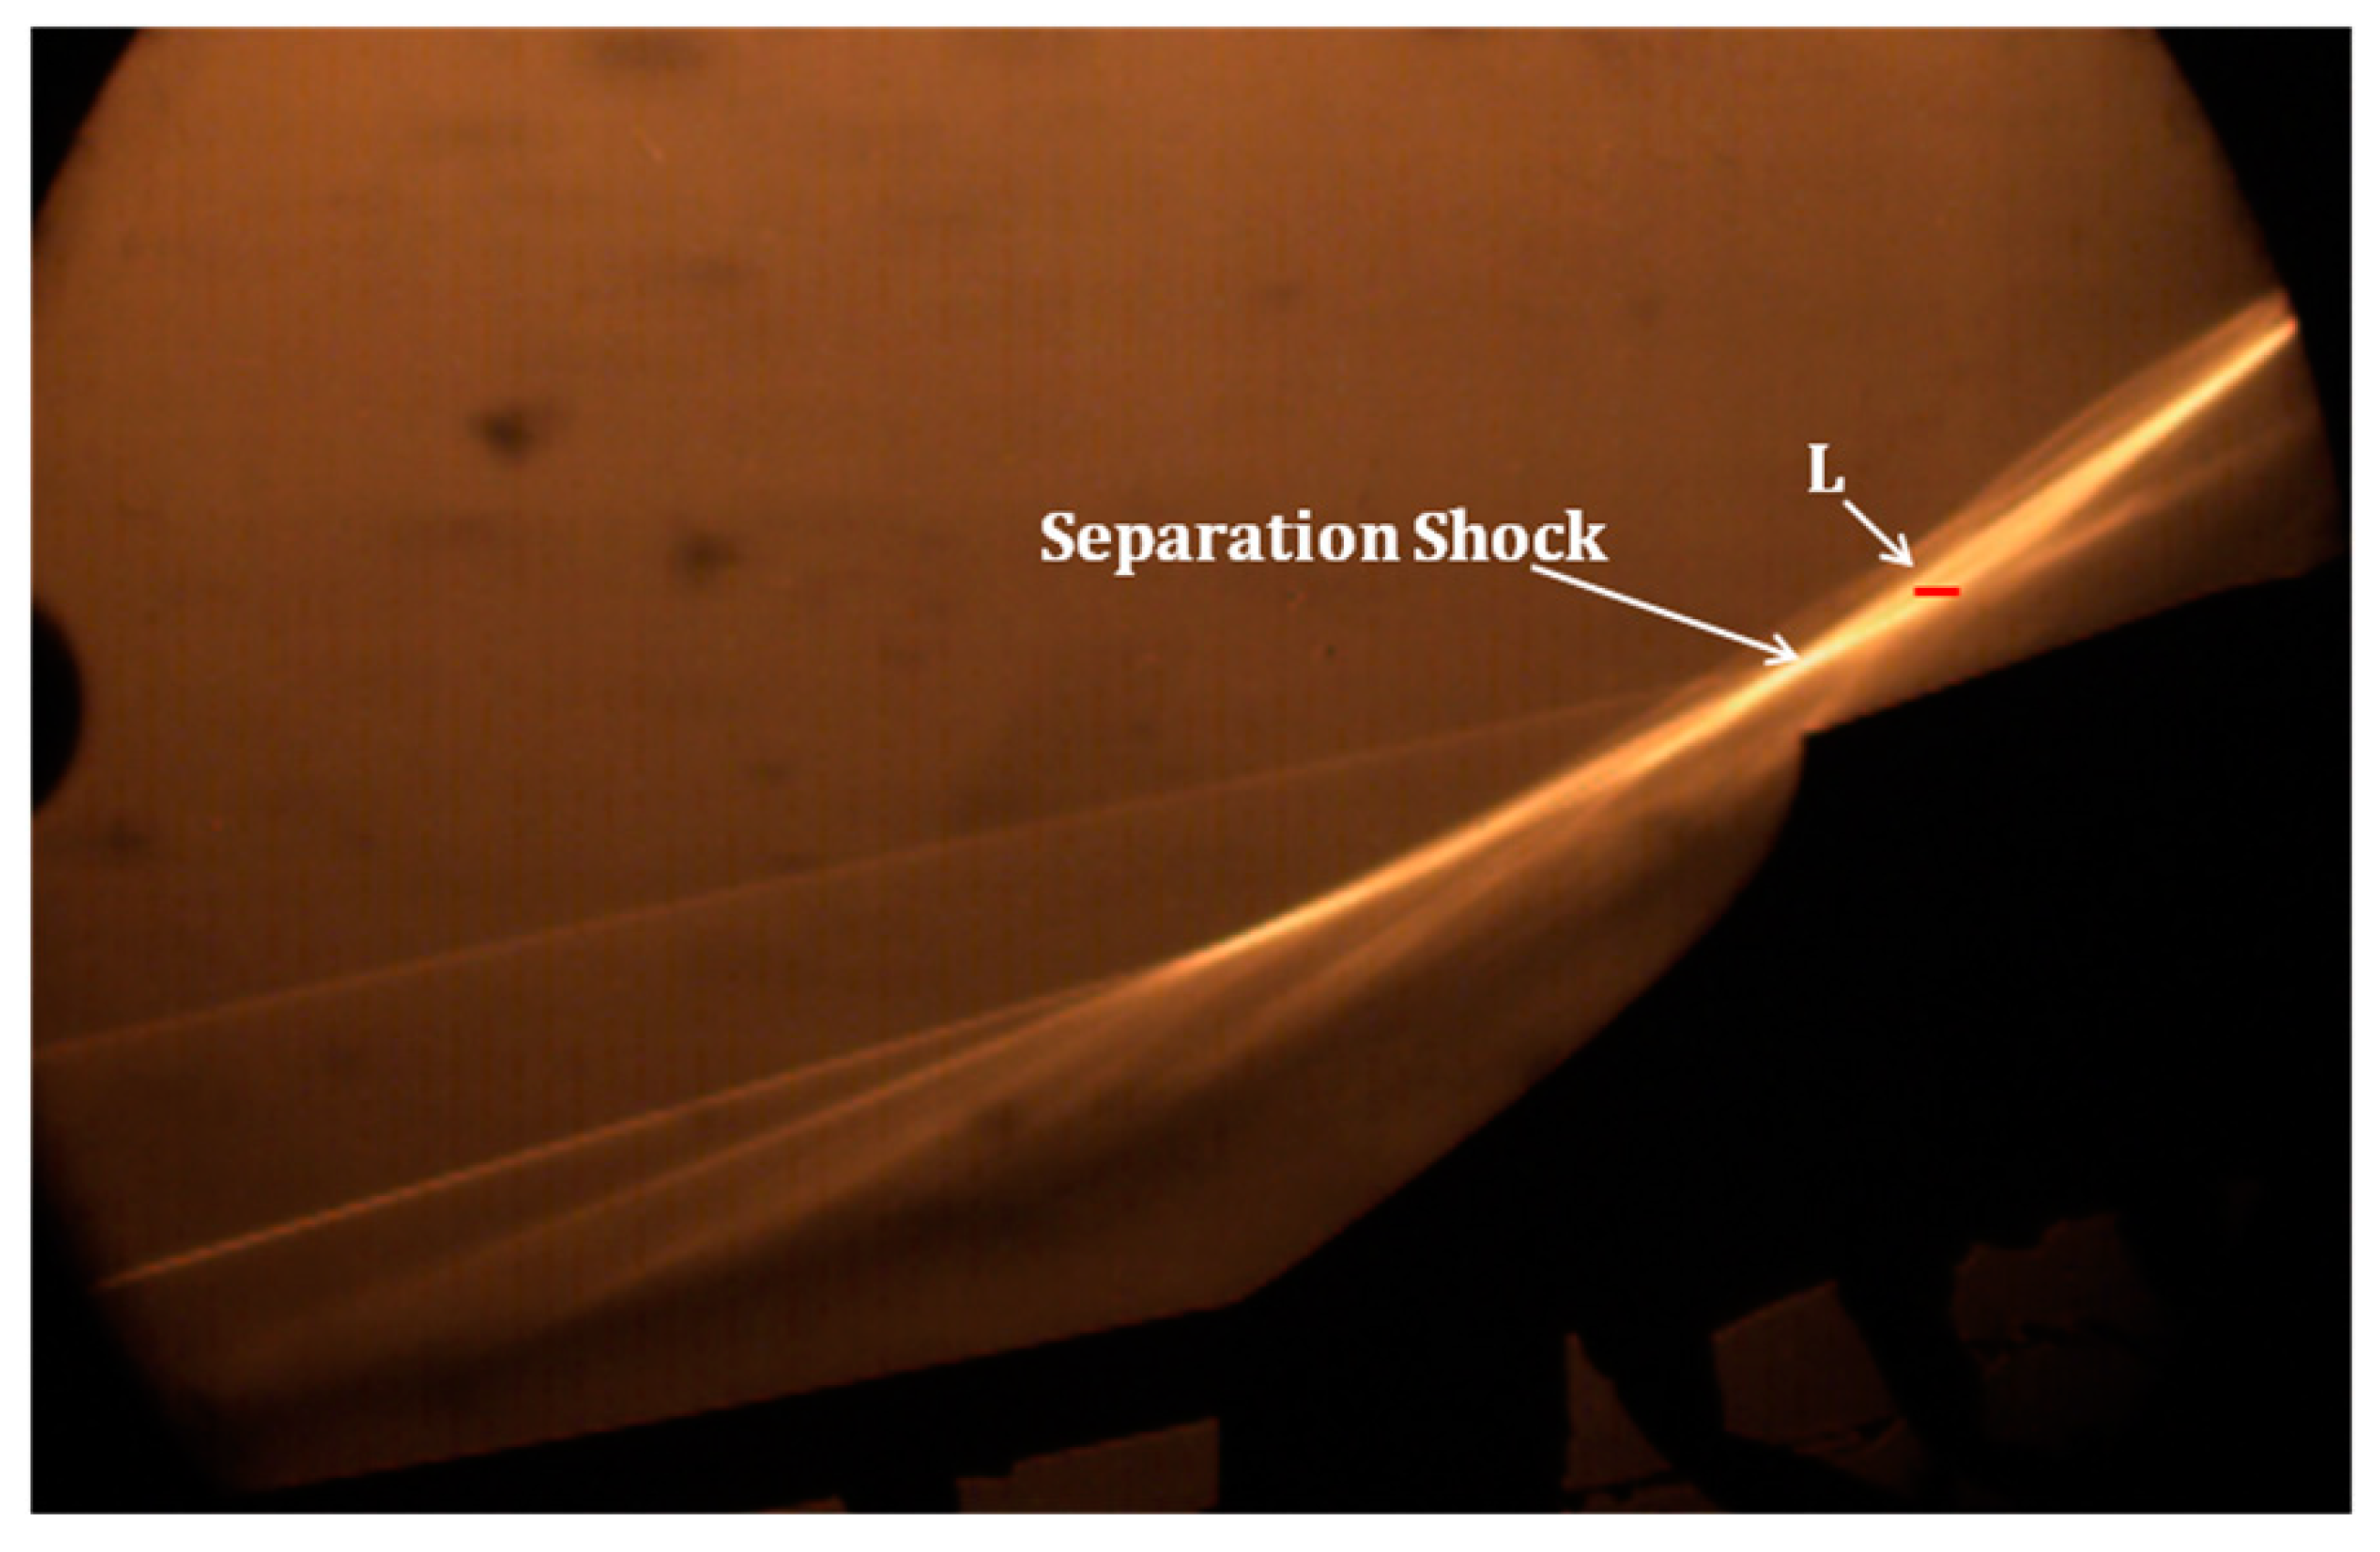
Once the separation shock sweeps the cowl area of the inlet, the grayscale picture would experience a significant change. To make full use of all of the Schlieren images and improve the grayscale detection (by decreasing the noise content), a method of selecting grayscales from a short line was adopted. As shown in
Figure 8, the short line L, which could experience the separation shock, was chosen to monitor the shock oscillation. Because the short line L consisted of 30 pixels, a non-dimensional variable Δ
2GS was defined to measure the change of the grayscale. The Δ
2GS was calculated using the following equation:
where
N represents the number of pixels that are contained in the short line L,
g[
n] is the grayscale of point
n when the shock oscillation occurred, and
g0[
n] is the grayscale of point
n without a separation shock. The Δ
2GS could record the changing characteristics of local grayscales and amplify the value of the change. Therefore, the Δ
2GS reflected the effect of a shock oscillation in the flow field around the cowl area of the inlet.
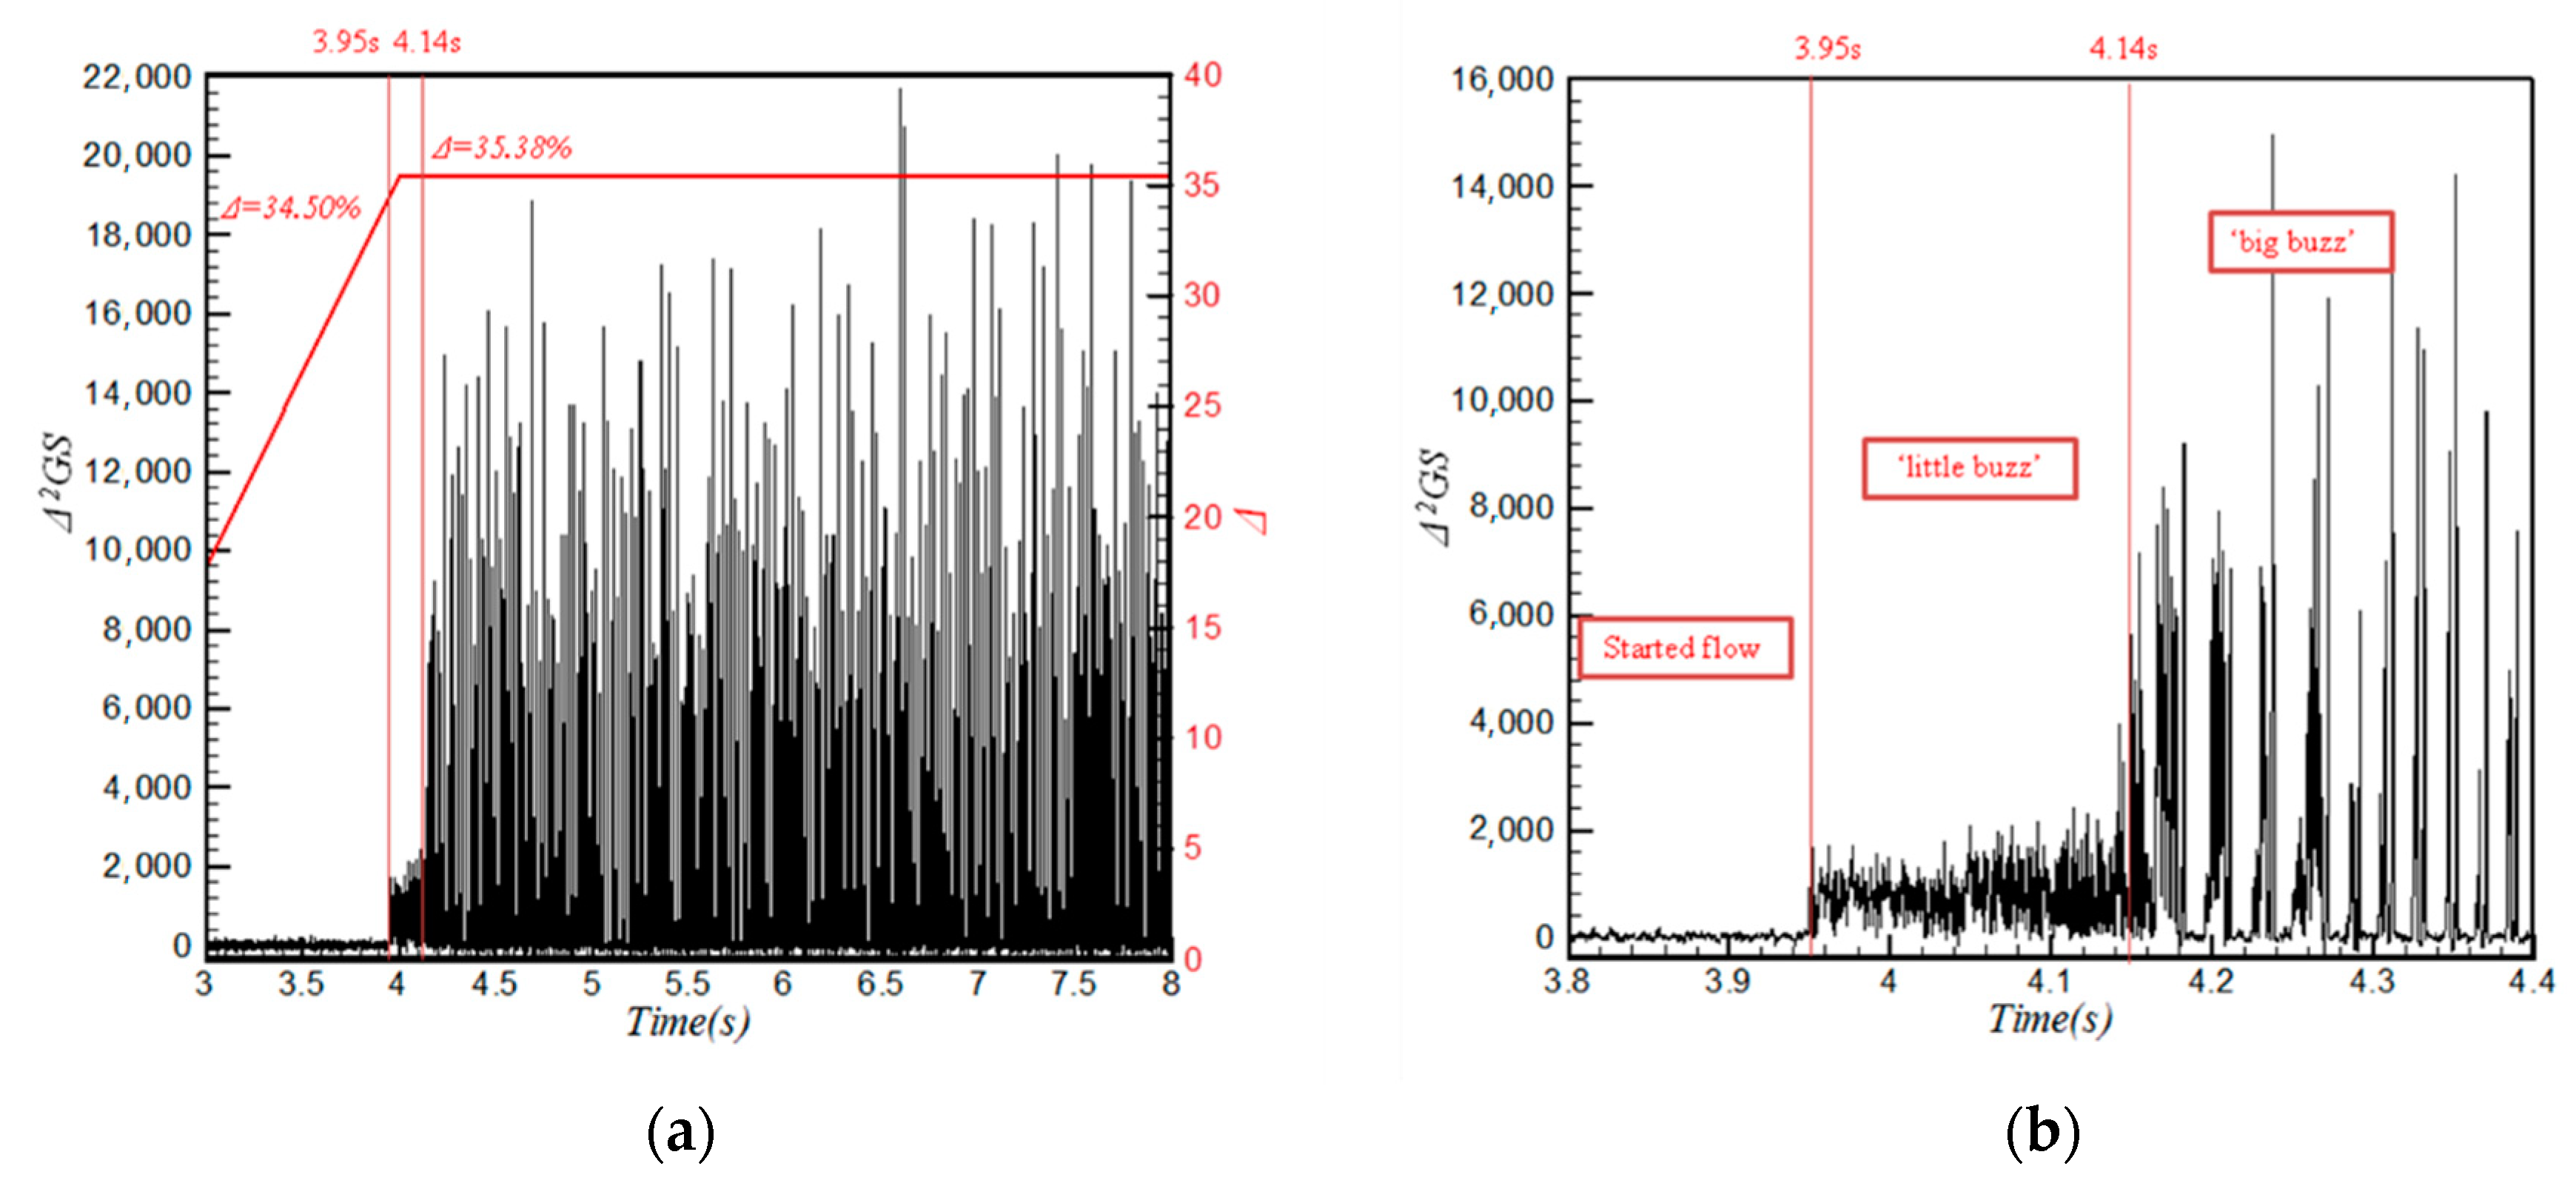
Figure 9 shows the Δ
2GS time history, which is related to the change of Δ. The plug initiated downstream flow choking at
t = 3 s with Δ = 17.69%, and the Δ increased gradually to 35.38% at
t = 4 s, then stayed constant until 8 s, during which the inlet was totally unstarted. As seen in
Figure 9, the gray-level changed in a limited range before
t = 3.95 s, which indicated a started flow field. Then, a secondary amplitude appeared between 3.95 s and 4.14 s, in this stage, and the flow field turned into ‘little buzz’. After 4.14 s, the ‘big buzz’ appeared and the grayscale sharply became unsteady when the flow field was switched to the unstarted state. Although the value of the grayscale is not a physical quantity of the flow field, it could reflect the characteristics of shock oscillations and time histories.
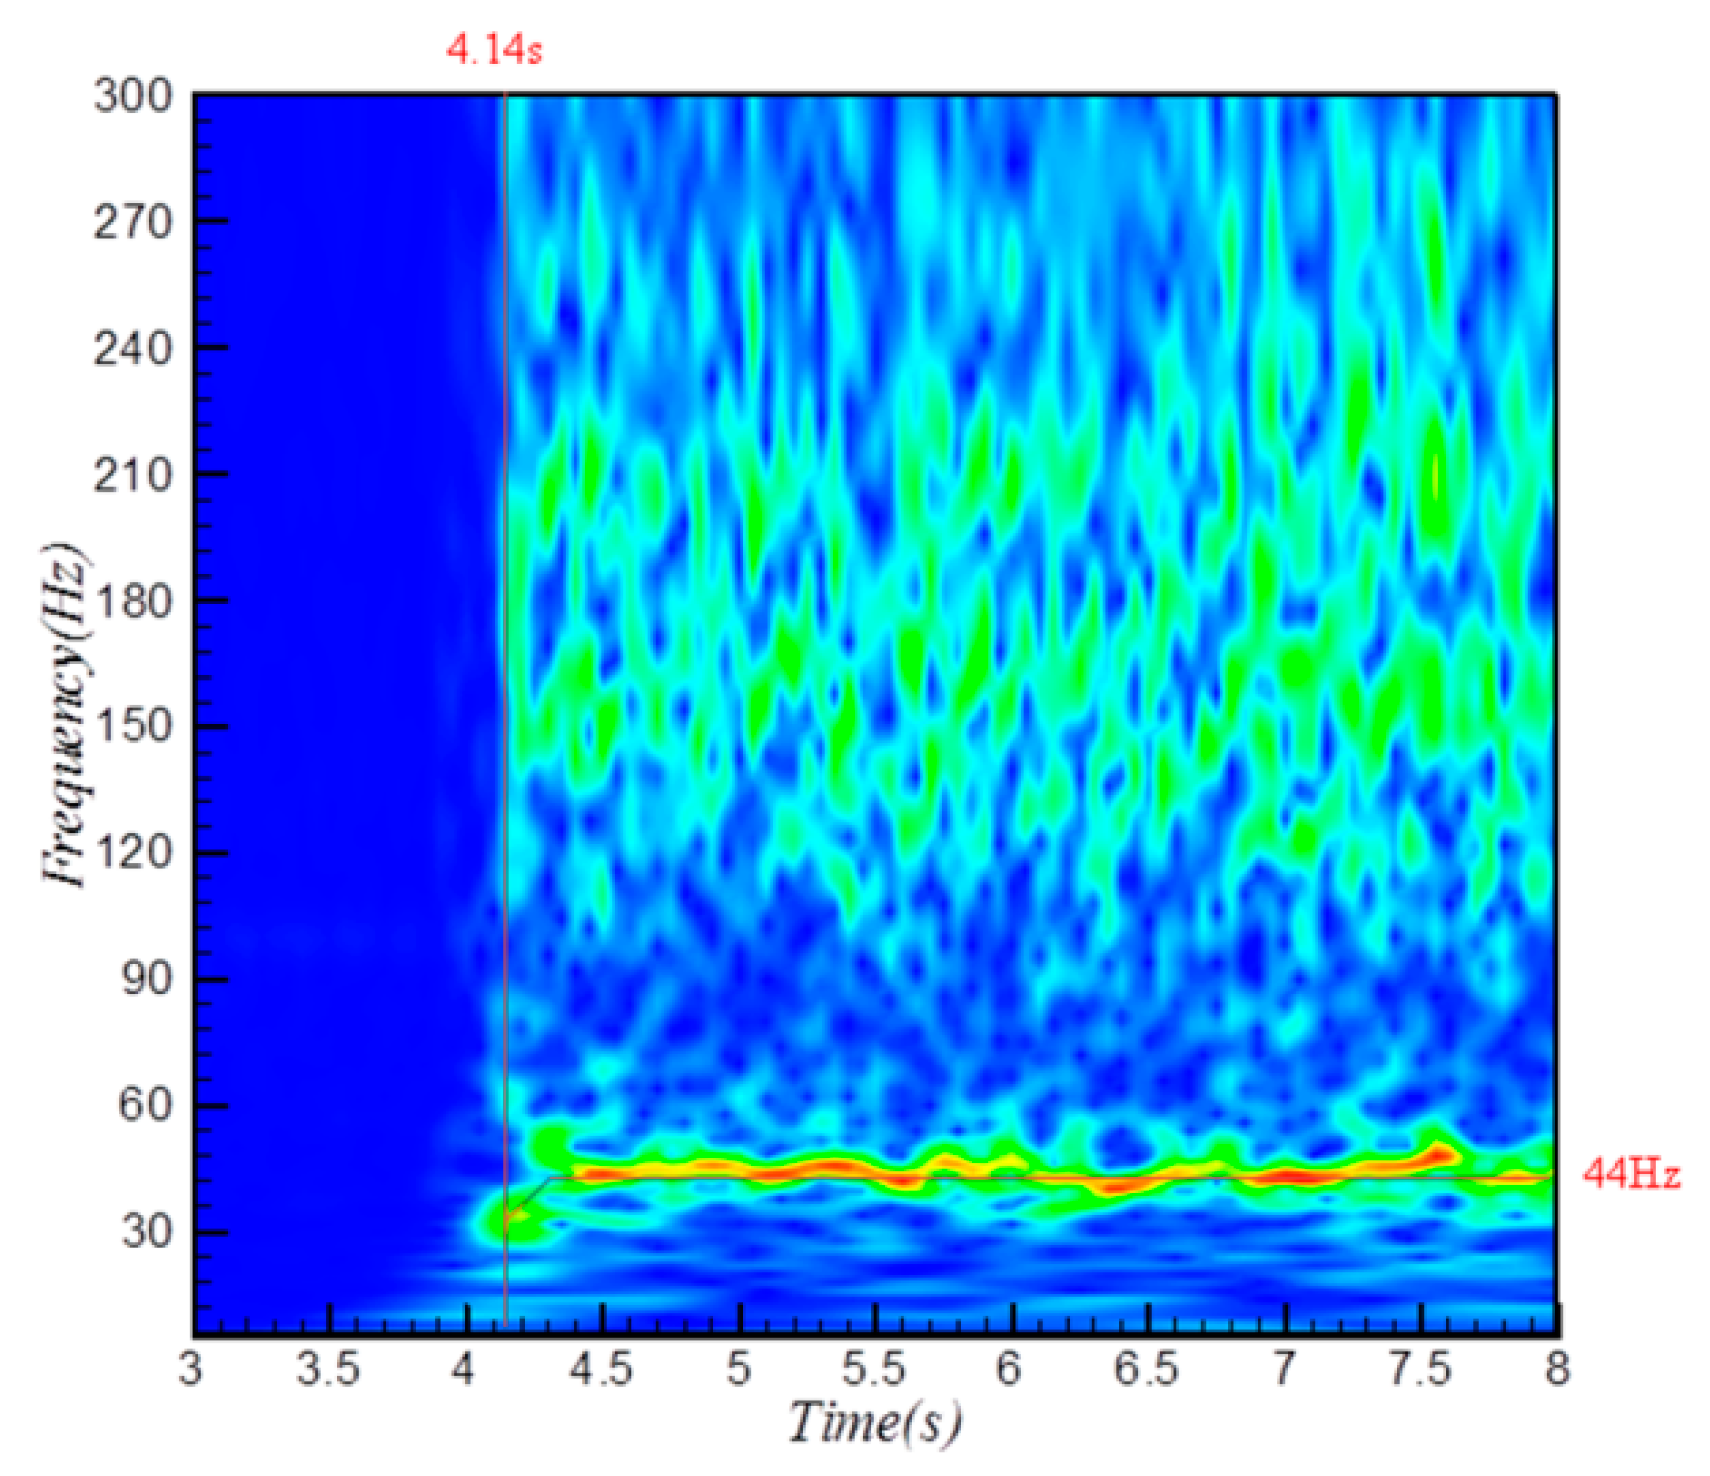
To thoroughly research flow characteristics in time and frequency, and address the strong periodicity of the shock oscillation, WT (Wavelet Transform) analysis was adopted and produced the power spectral density (PSD) contours in
Figure 10. The varying tendencies of the frequencies of the unstarted shock oscillation are visible in this figure. The dominant frequency whose energy is concentrated at about 34 Hz at
t = 4.14 s, corresponds to the occurrence of the shock oscillation. Then, a small increase to 44 Hz of the frequency can be seen, while it remains stable after
t = 4.25 s with the Δ kept constant. This is a demonstration that the back pressure has an effect on the frequency of the shock oscillation. This demonstrates that the grayscale detection from the short line is a good representation of the shock oscillation.
The key point of validity of the method is that the localization of shock by calculation must match the real boundary of shock. To detect the accuracy, a function to dye the localization is added to the C++ code and once the program runs, the separation shock boundary is marked; thus, the validity of quantization results can be observed directly. The number of the Schlieren images, which are dyed with the wrong boundary, is less than 0.1% [
25].
3.2. Wall-Pressure Analysis
Figure 11 shows the pressure time history of T1 to T5 (
Figure 2) during t = 3.7–4.3 s. T1 first senses the back pressure, and the others lag behind in turn when the shock train moves upstream. The pressure fluctuation with a large amplitude appearing at t = 4.14 s corresponds to the ‘big buzz’.
Figure 12 depicts the pressure time history of four typical survey points (T2–T5). The pressure time history of T2 (
Figure 12a) was analyzed, and it was found that it can be divided into three consecutive stages. In stage 1, before t = 3.88 s, the pressure data remained nearly stable, indicating a started flow field. In stage 2, between3.88 s and 3.99 s, a secondary amplitude appeared, which was caused by the shock train in the internal portion of the inlet sweeping along the transducers. In stage 3, from 3.99 to 4.14 s, the pressure changed in a fluctuation with a larger amplitude, which indicates a ‘little buzz’. In this stage, the flow field was switched to the unstarted state. In stage 4, after 4.14 s, the pressure fluctuation becomes more intense and periodic with larger amplitude. The pressure is now unsteady indicating the appearance of a ‘big buzz’. The pressure time history of T3 (
Figure 12b) has similar features. The time history of T4 (
Figure 12c) shows only the ‘little buzz’ (from 3.97 s to 4.14 s) and ‘big buzz’ (after 4.14 s) corresponding to unstarted flow field. As shown in
Figure 12d, T5 senses the ‘big buzz’ after t = 4.14 s but without capturing the ‘little buzz’. From the above analysis, the transducers located before T4, which is closer to the cowl, can be used to predict the unstarted flow field.
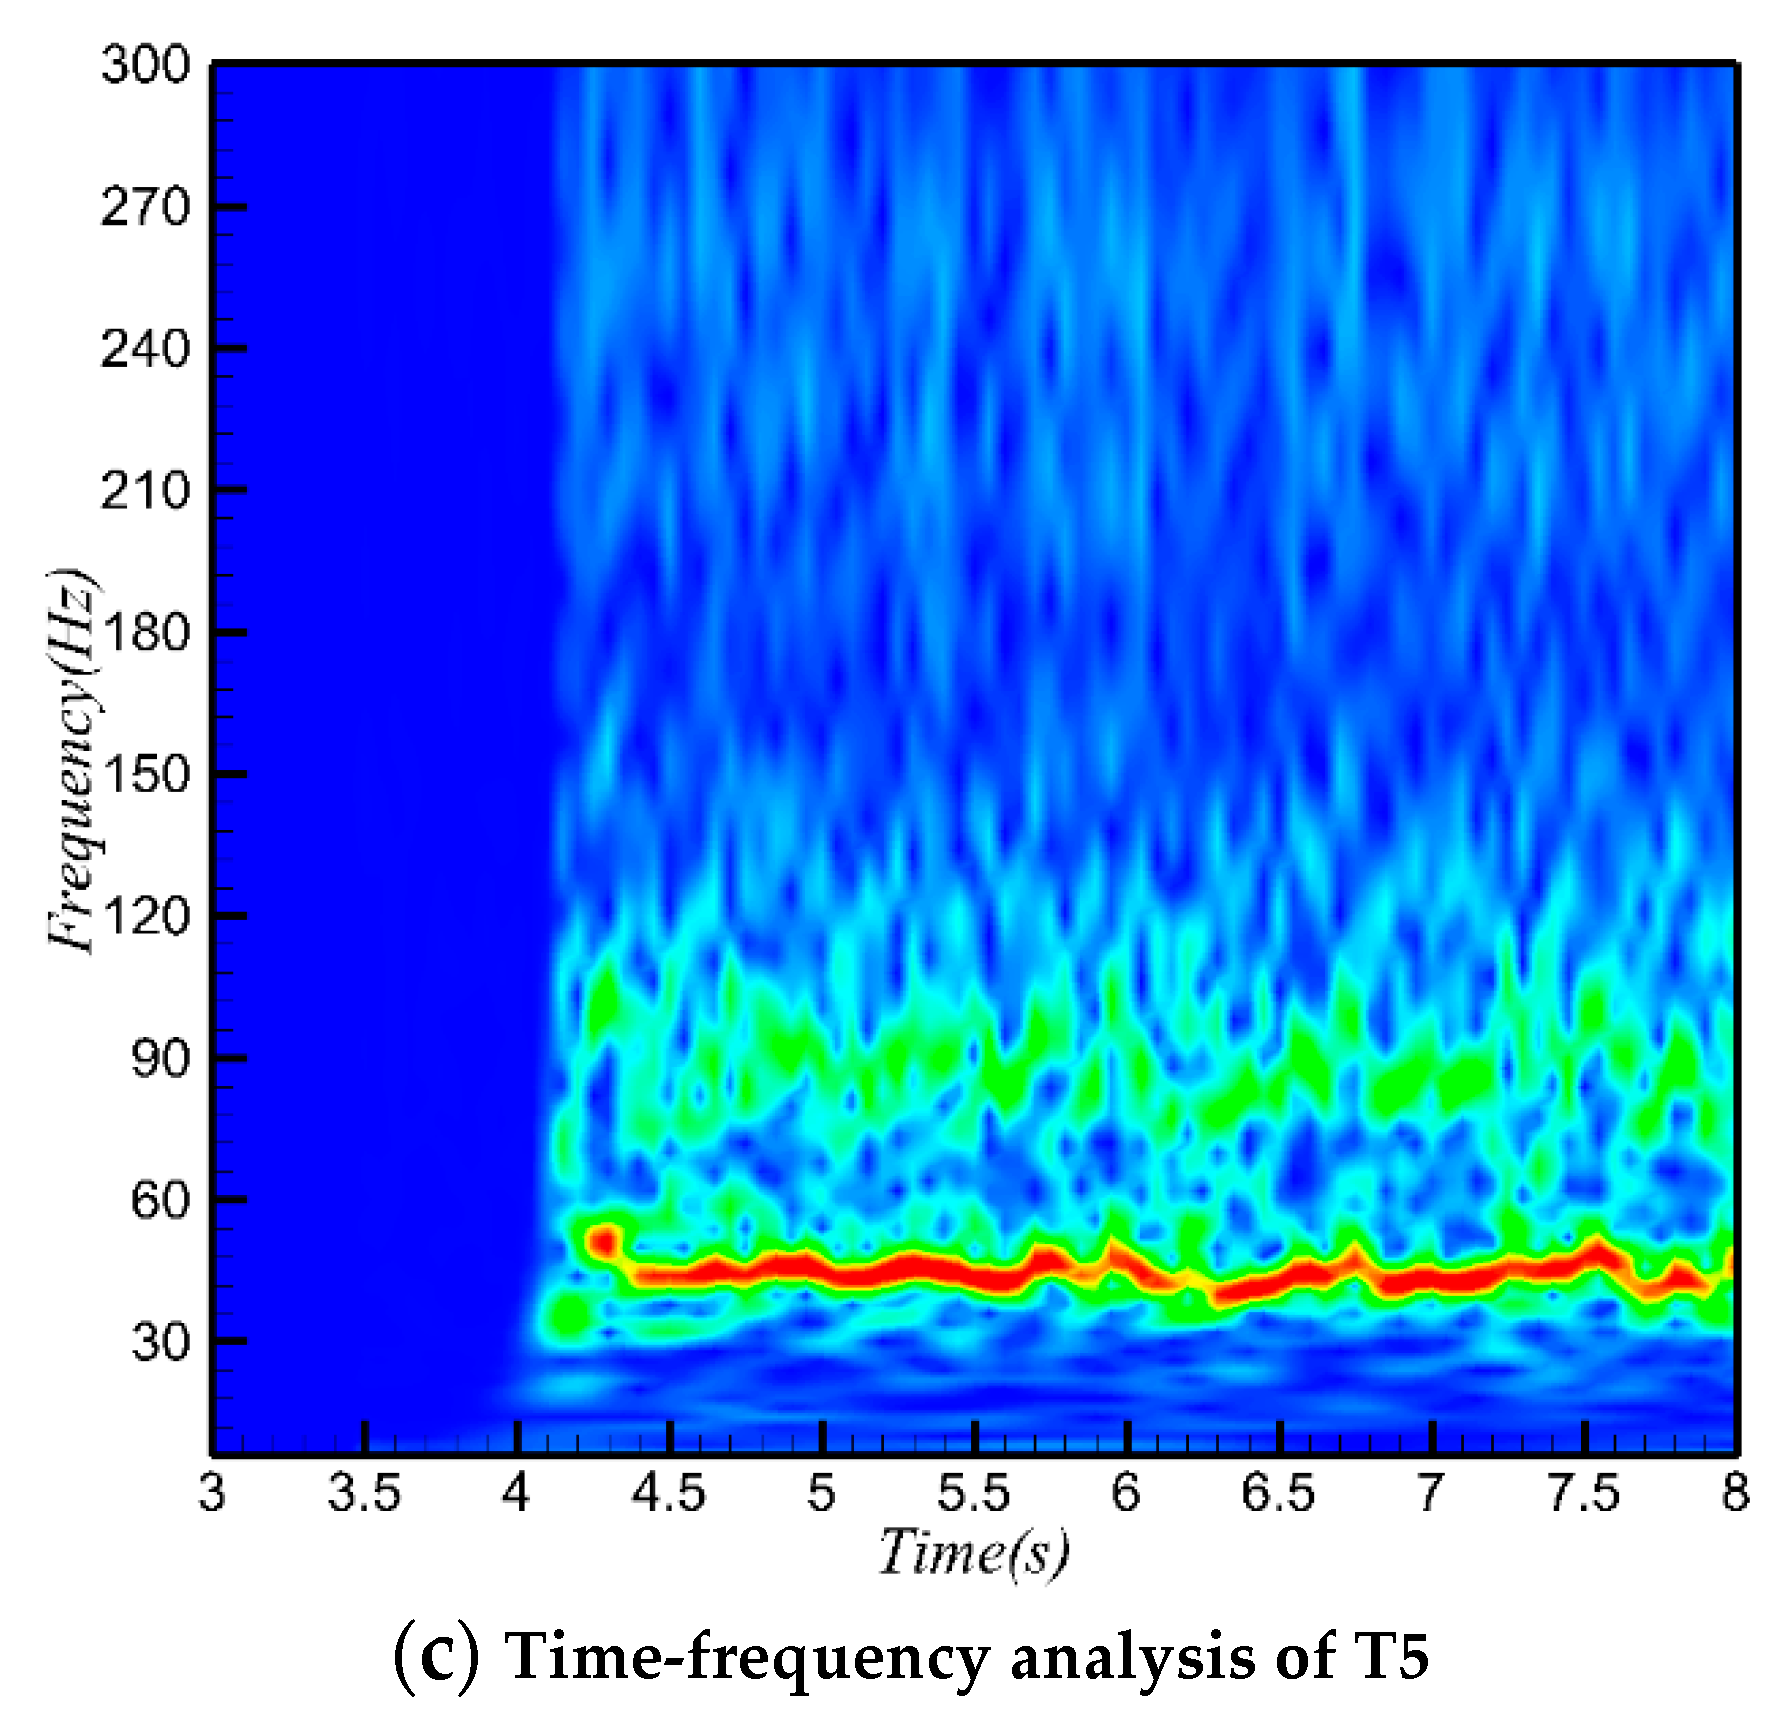
The results of WT analysis for T3, T4, and T5 are shown in
Figure 13. The signals of T3, T4, and T5 have the same dominant frequency characteristic of approximately 43 Hz. Only the T4 and T5 transducers measured a weak second harmonic generation, which indicates that the pressure fluctuation in the cowl area has a wider range of frequencies, which differ from the downstream region. Both the data of the grayscales (
Figure 10) of the unstarted separation shock in the Schlieren image and the wall-pressure (
Figure 13) indicate the similar trends in the dominant frequency. These results demonstrate that shock oscillations and pressure fluctuations are highly correlated showing the validity and rationale of the grayscale detection method.
By comparing the results in
Figure 13, it was found that although the three signals of the transducers showed some consistent features, the pressure fluctuations occurred at different times. T3 sensed the shock train earlier than T4 and T5, because T3 is mounted downstream.
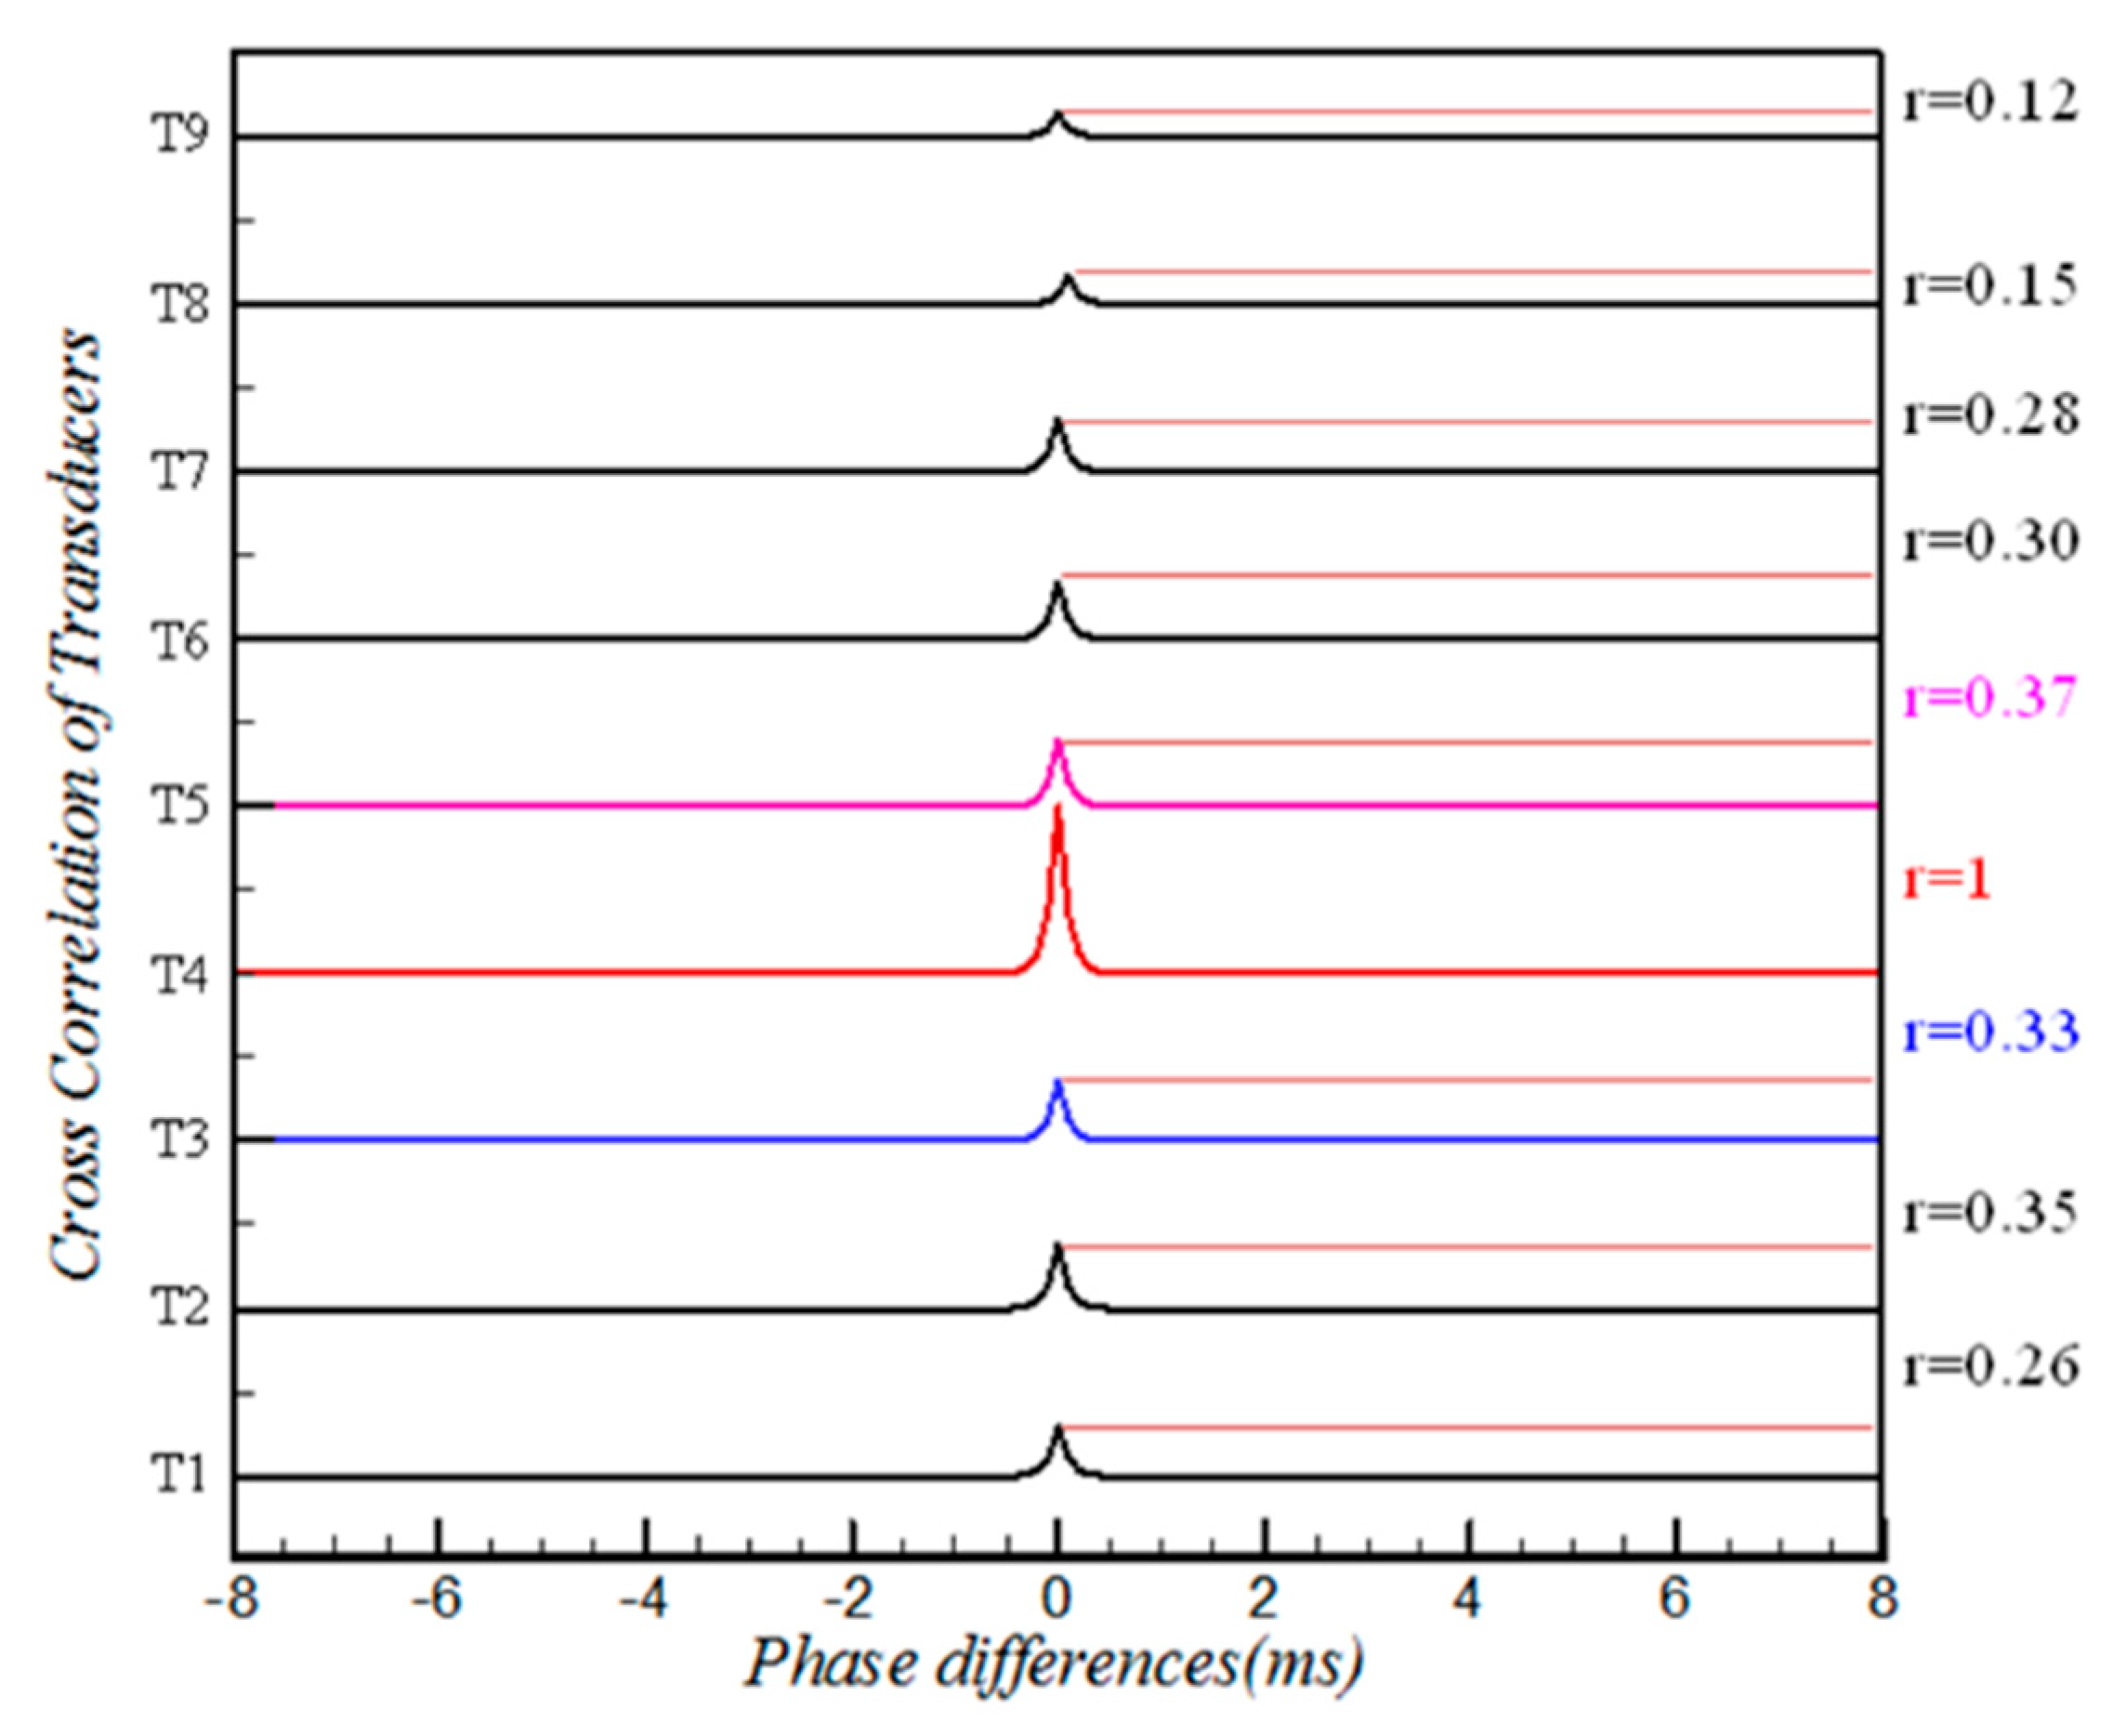
Figure 14 shows the time-phase analysis of the nine transducers based on the T4 signal; there were no phase differences at
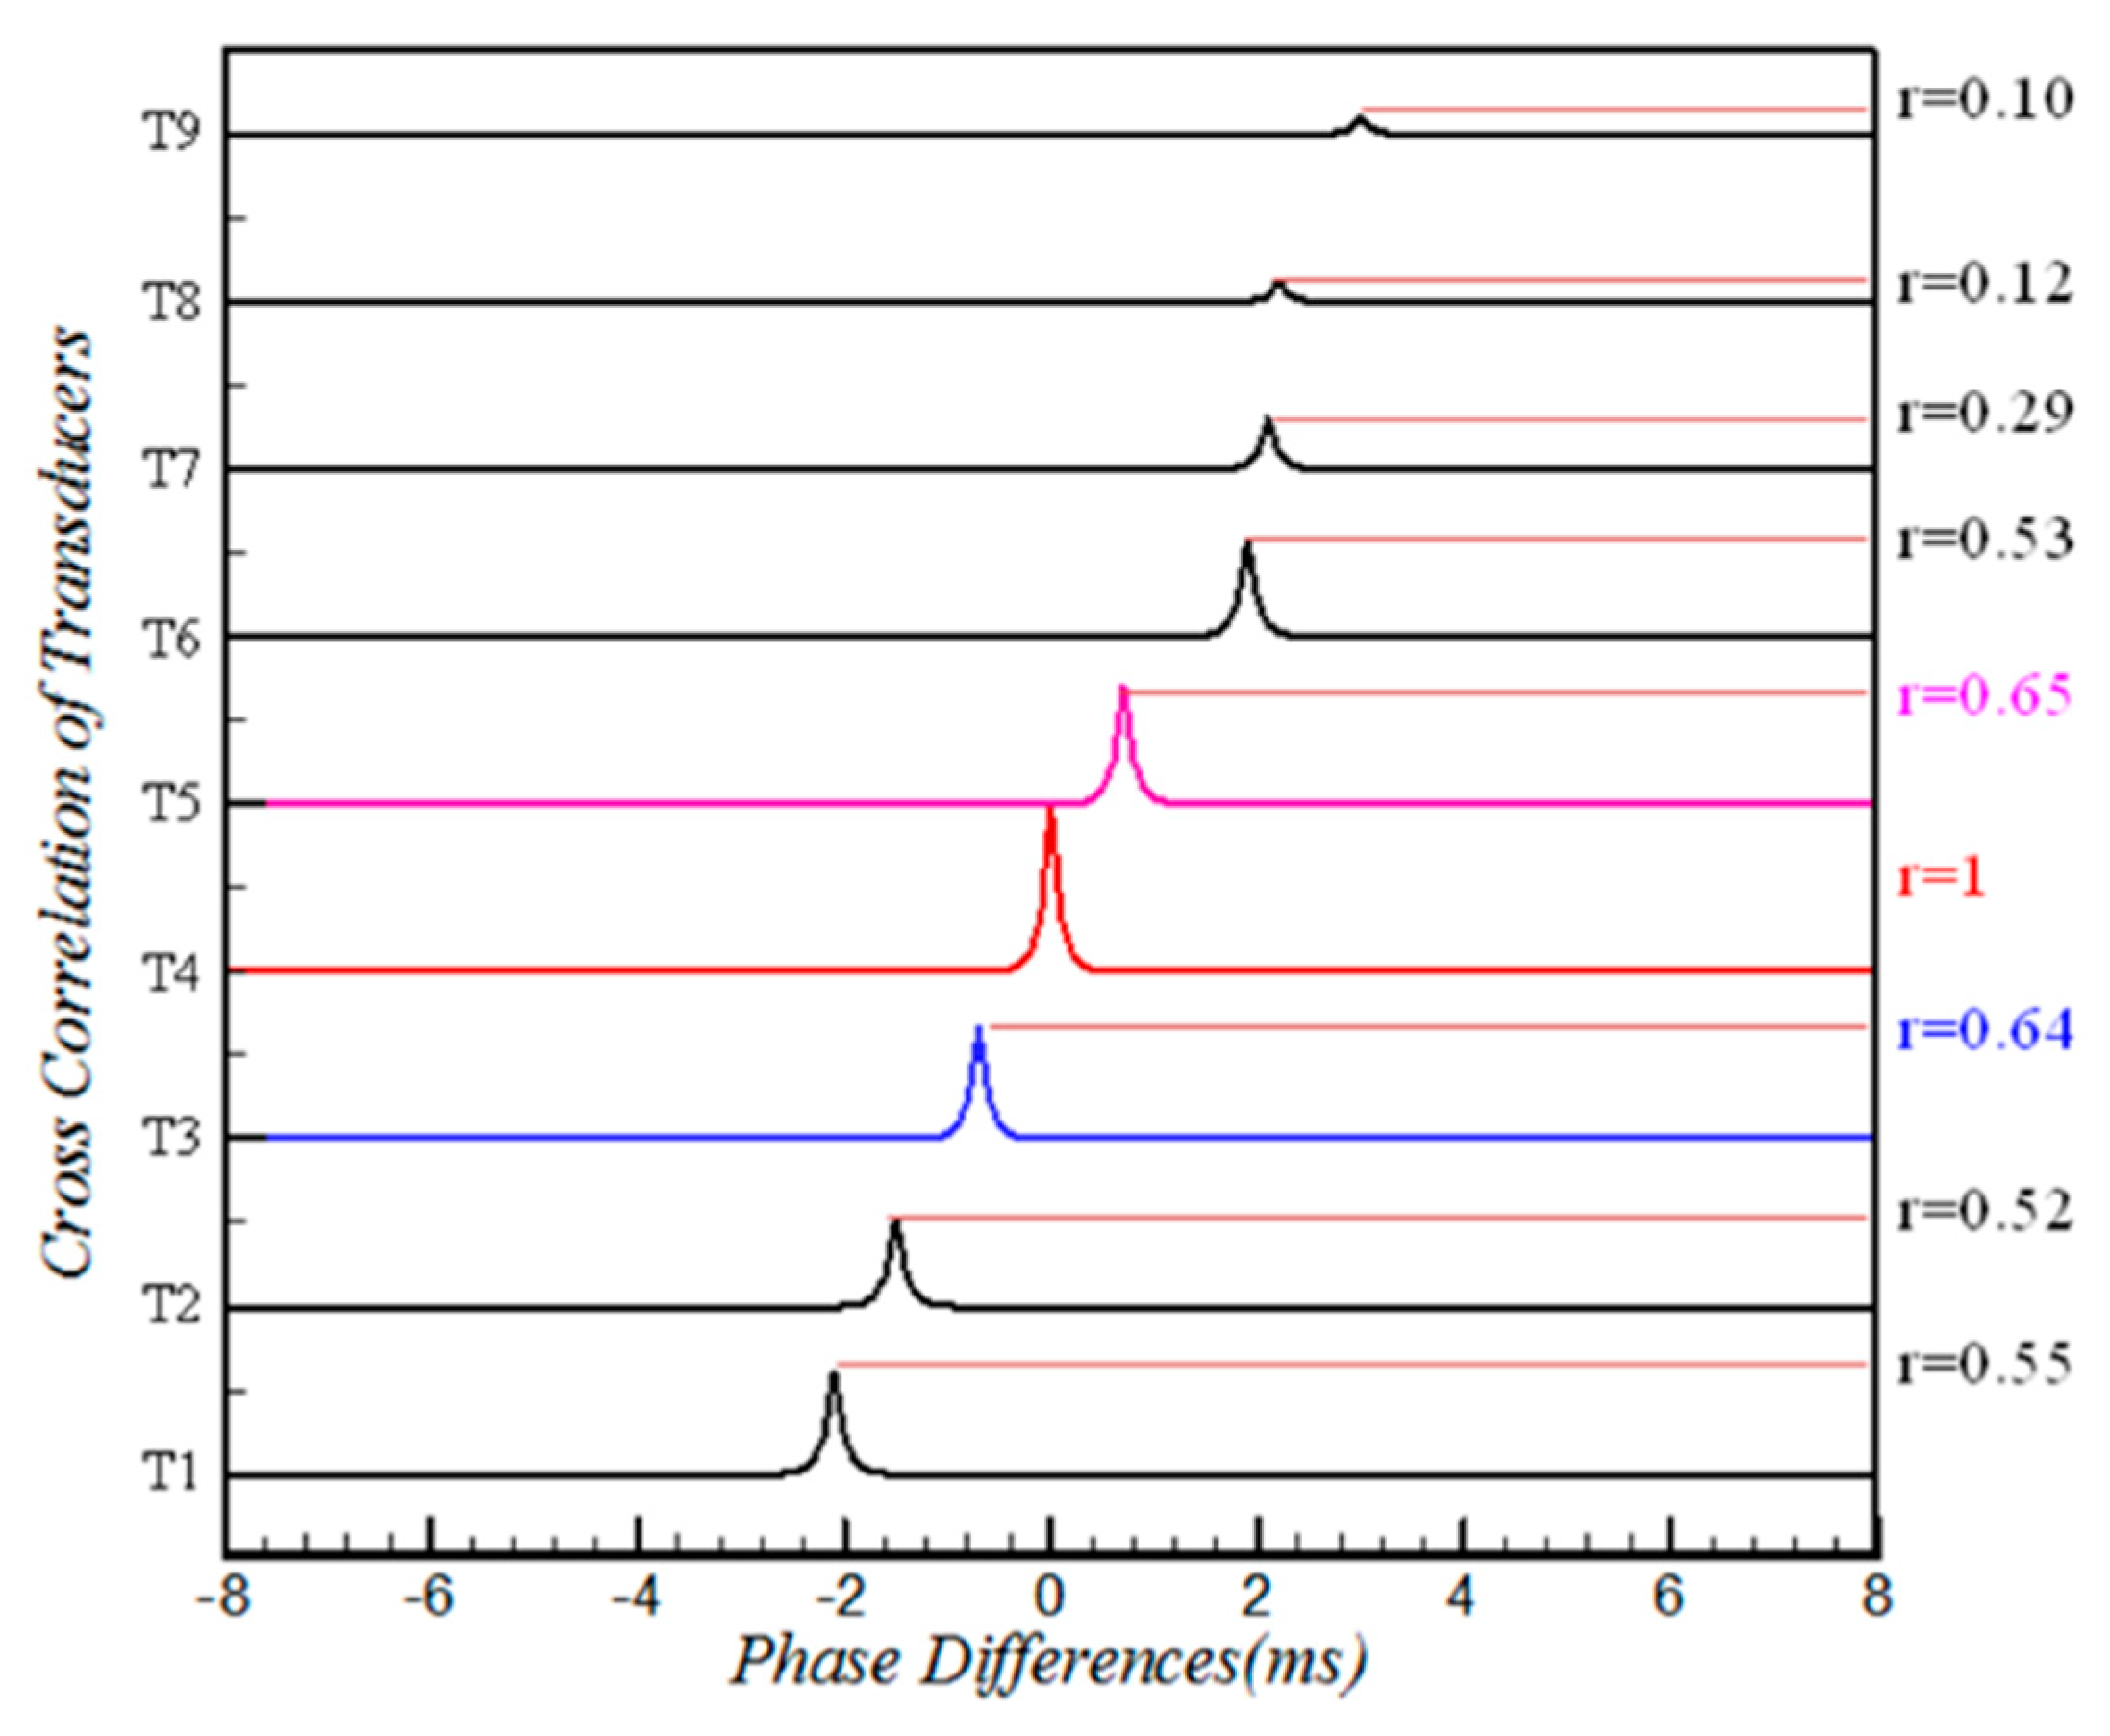
t = 3 s, which indicates that there were no mutual interferences among signals of the transducers when the inlet was in the started state. The correlations of the 9 signals were below 0.37. The phase differences at
t = 4.5 s are shown in
Figure 15 when the inlet was in the unstarted state. The phases of the nine signals have obvious differences, which are due to the different times that the transducers sensed the motion of the unstarted shock train with the propagation of the downstream back pressure disturbance. The phases lagged in turn from the T1 to T9 signals, demonstrating that unstarted shock train moved from downstream to upstream. T7 to T9 presented weaker associations (below 0.29), suggesting a disturbance between T6 and T7 suppressed the motion of the unstarted shock train. These facts demonstrate that the rate of the unstarted shock train oscillation, which was generated by the propagation of a downstream back pressure disturbance from T1 to T3 (inner flow field), was faster than that from T4 to T6 (cowl region), and the disturbance was suppressed in the T7 to T9 region.
3.3. Connection between a Shock Oscillation and the Pressure Fluctuation
By comparing results of the WT analysis in
Figure 10 and
Figure 13b , the short line L and location of T4 were both in the cowl area and had the same features of dominant frequency, which indicates an obvious correlation between the shock oscillation and pressure fluctuation.
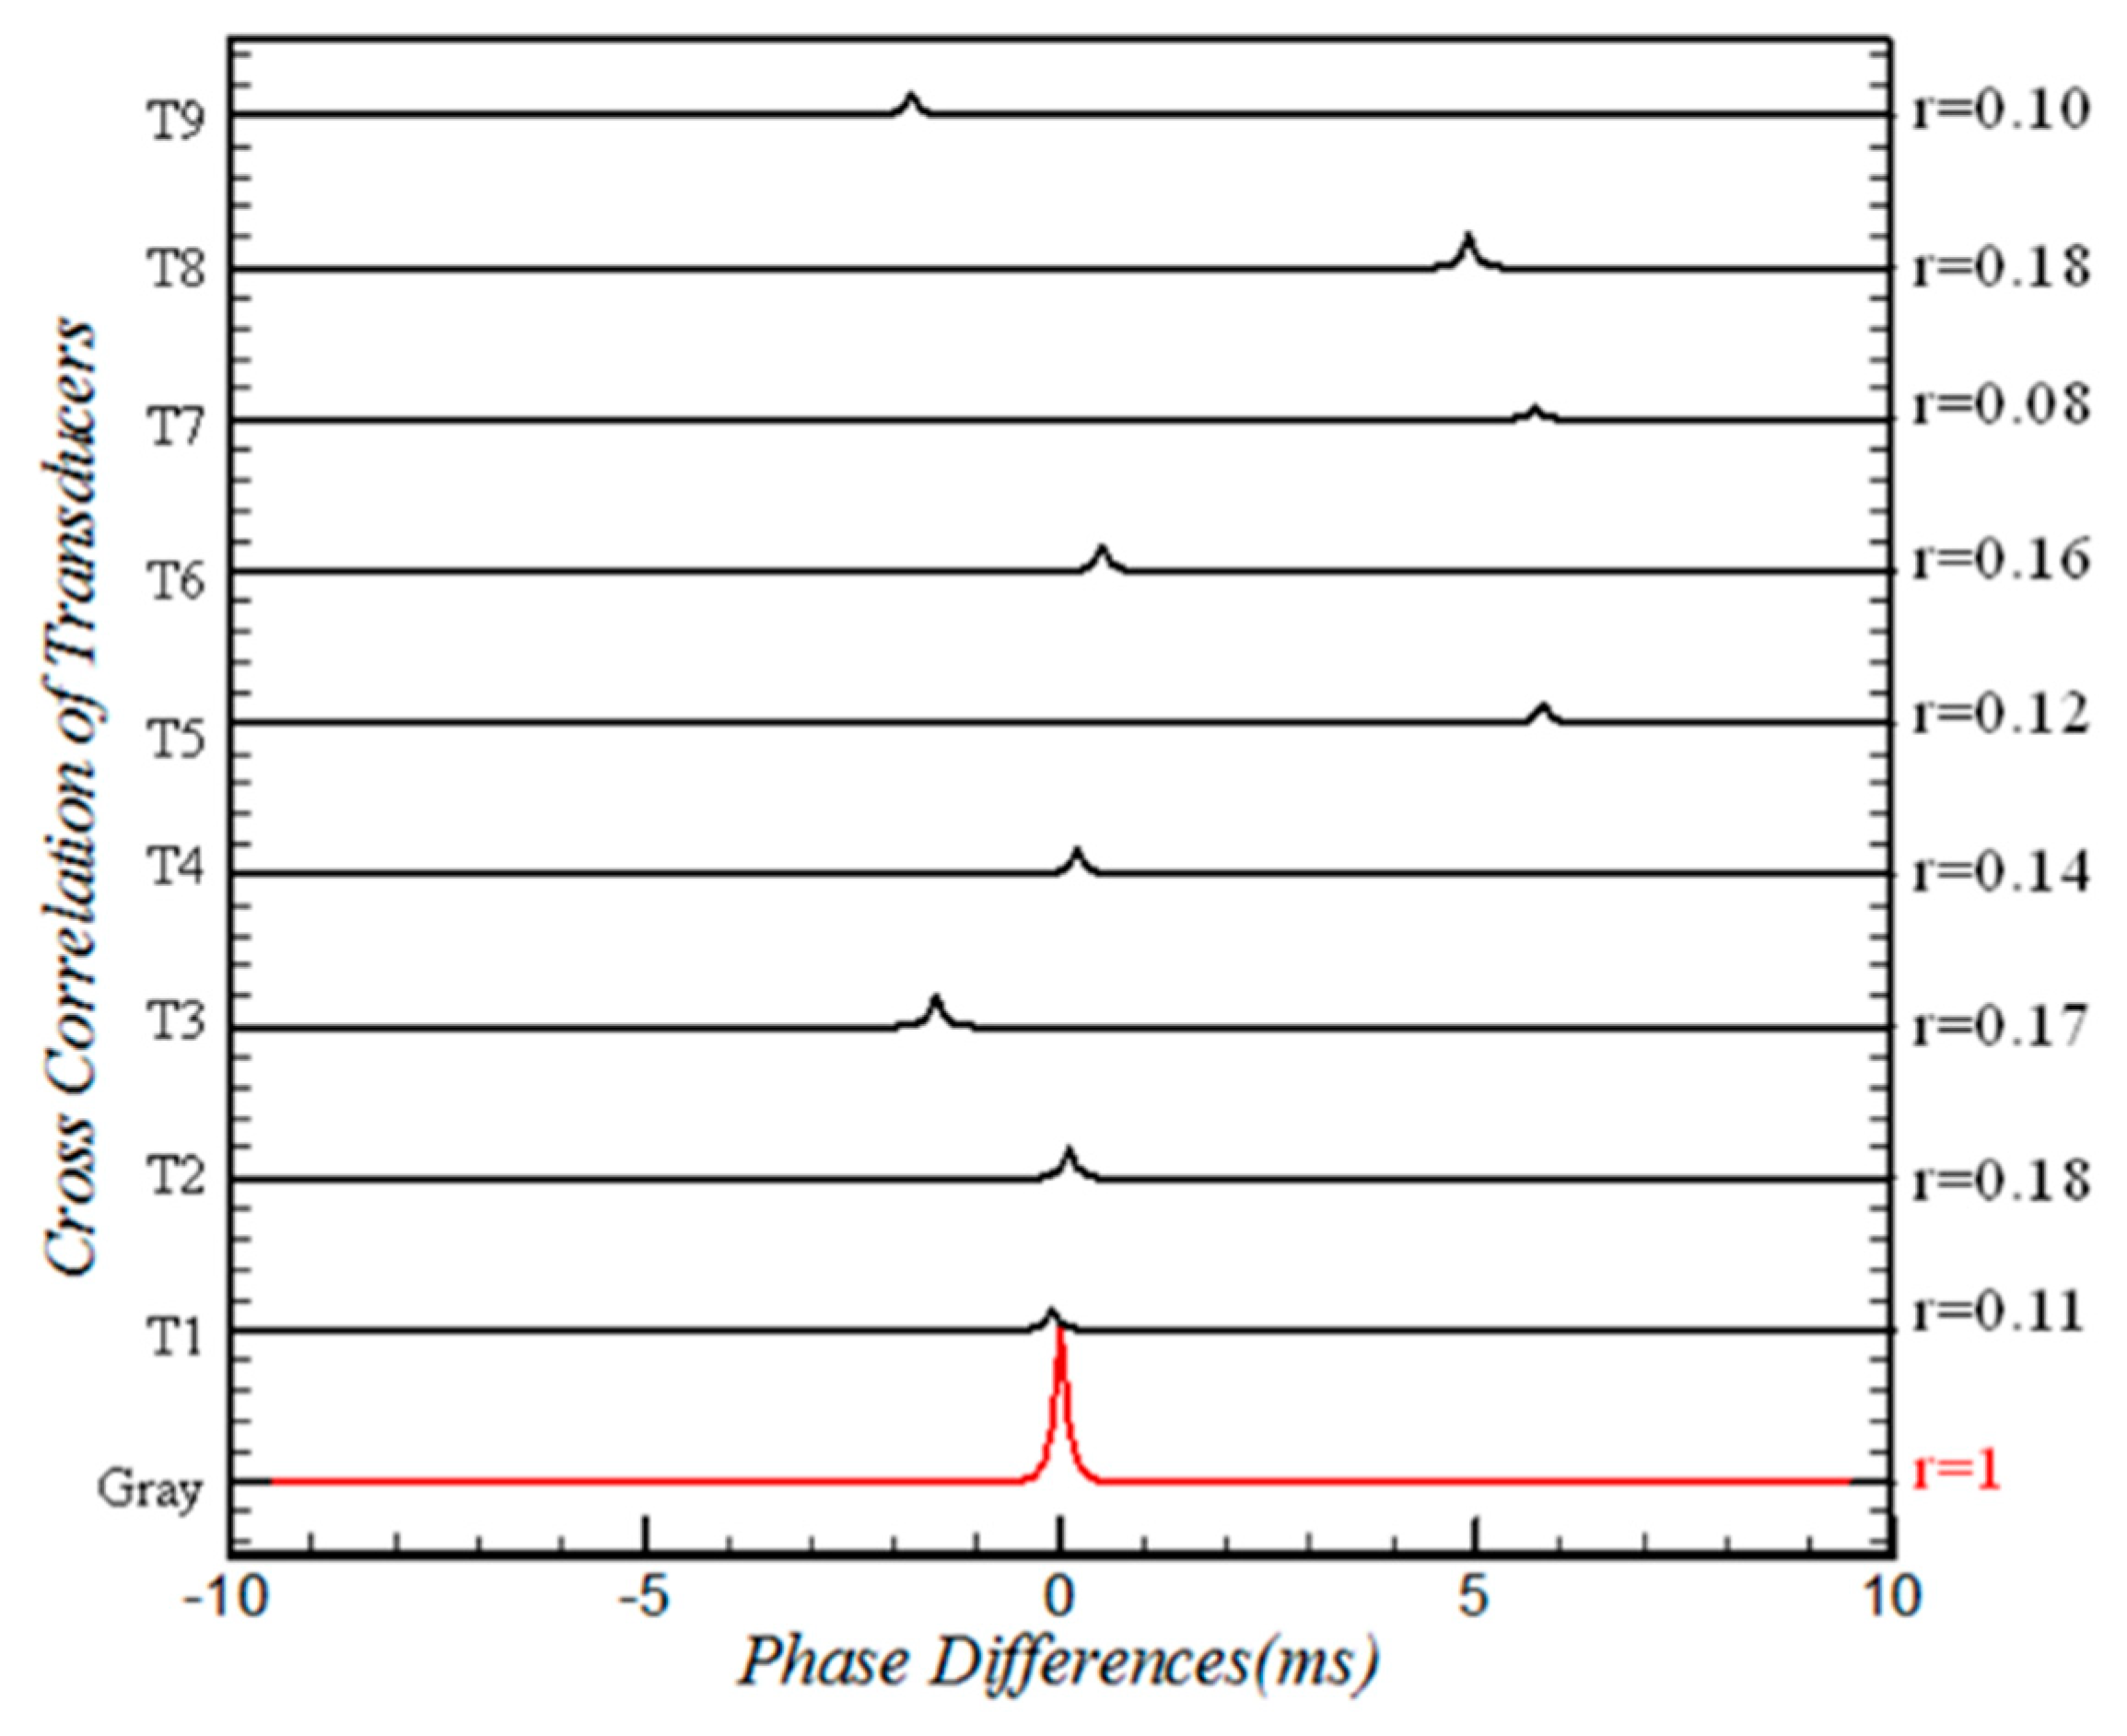
Figure 16 and
Figure 17 give the phase analysis at
t = 3 s and
t = 5 s based on the Gray signal. As shown in
Figure 16, the correlations of the 9 signals were below 0.18, which indicates that the flow field around the cowl area had nothing to do with the wall pressures when the inlet was in the started state. When the inlet was in the unstarted state,
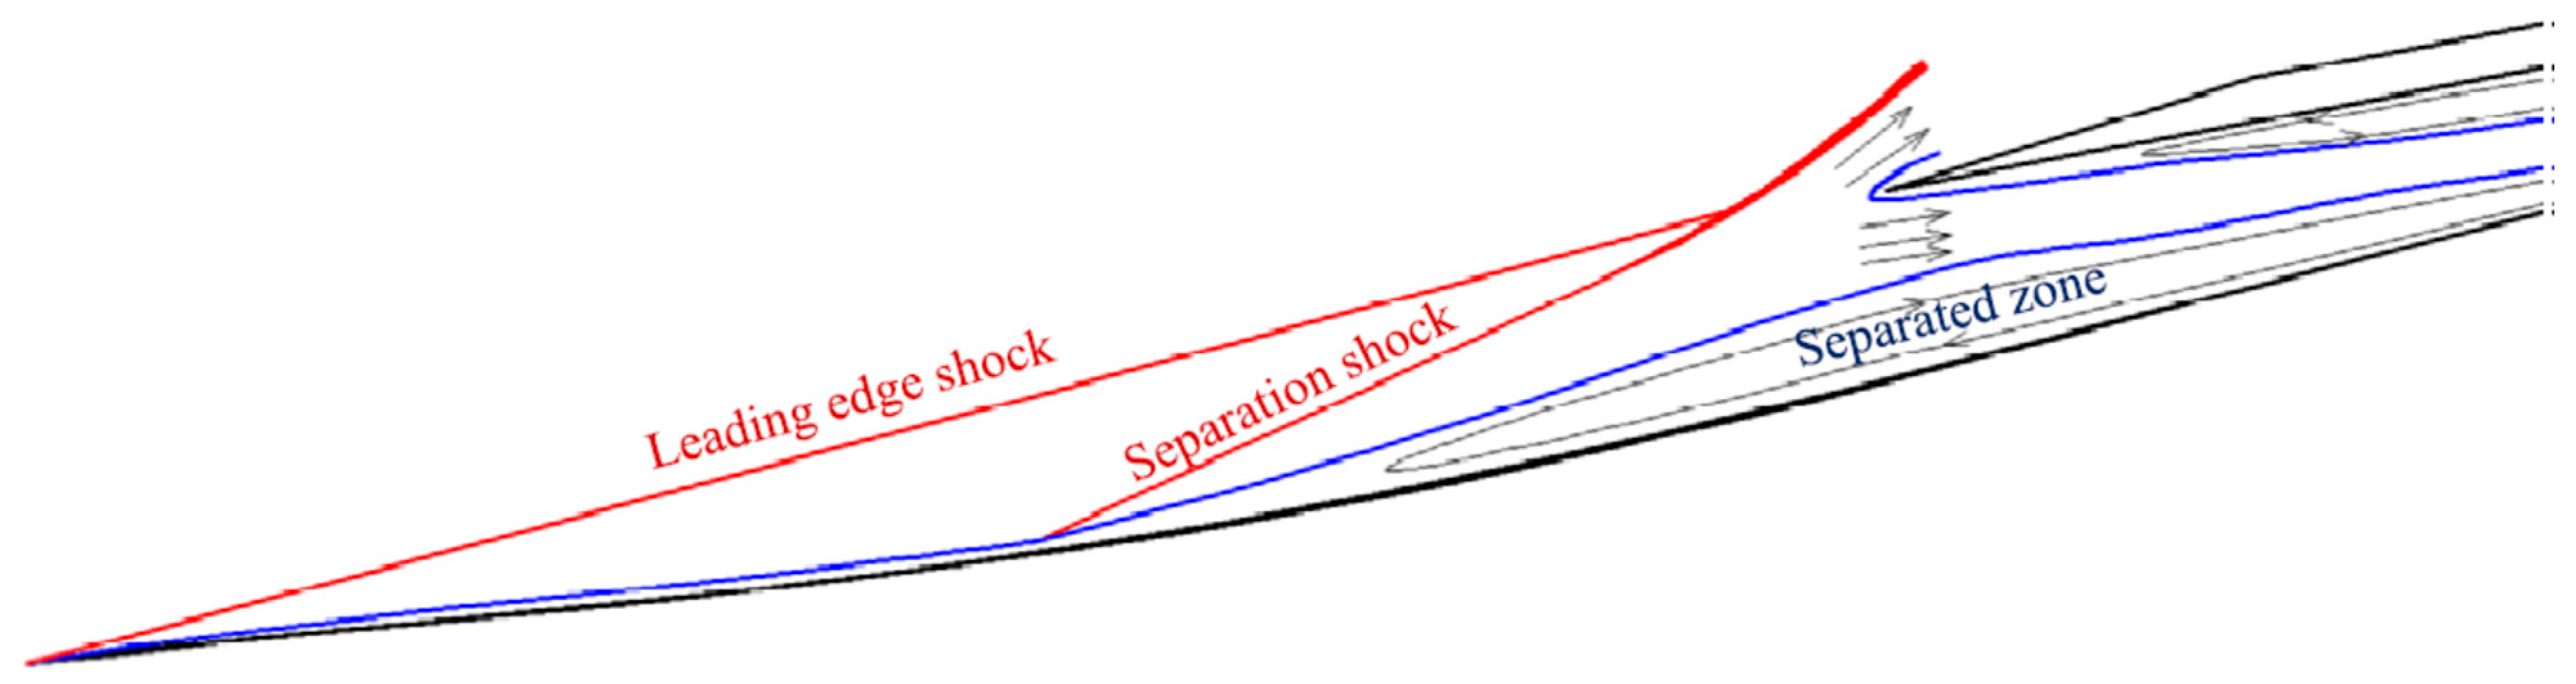
Figure 17 shows a strong correlation between the shock oscillation and the pressure fluctuation of T4 signal. Therefore, the location of T4 was more sensitive to the leading edge of separation shock when the little buzz appeared. The schematic of the flow pattern, shown in
Figure 18, indicates a suitable location to predict inlet unstart.


