1. Introduction
On 17 April 2016, it was alleged that a “drone” struck a British Airways, Airbus A320 landing at Heathrow Airport at around 12:50 GMT [
1]. Clothier and Walker [
2] identified “drone” risks to human life as (1) collisions with other aircraft and (2) to people on the ground (not involved in the operation); the alleged incident at Heathrow illustrates the former of these two risks. These unmanned aircraft, commonly referred to as “drones”, usually conger up thoughts of Predator aircraft firing Hellfire missiles [
3]; a premise recently popularized by “Hollywood” in the movies Good Kill [
4] and Eye in the Sky [
5]. Known by many terms (“drones”, Unmanned Aerial Vehicle (UAV), Unmanned Aircraft/Aerial System (UAS), etc.), the International Civil Aviation Organization (ICAO) [
6] has recently adopted the term Remotely Piloted Aircraft Systems (RPAS). Civil RPAS is a rapidly growing market space, and is in no way limited to hobbyists flying radio controlled aircraft. Applications of RPAS include [
7]: traffic monitoring, volcanography, firefighting, maritime observation, and wildlife monitoring, summed up by English, Kraus and Pillar [
8] as the 3-D environments that are dull, dangerous, and dirty.
One of the most anticipated RPAS applications discussed extensively in news media, trade publications, and academic journals, is the advent of package delivery, such as Amazon Prime Air [
9], and even for general mail delivery [
10]. As such, the volume of RPAS traffic in a dense cityscape and in other urban areas can be expected to grow rapidly in the coming years. This requires an understanding of risks associated with the industry (RPAS operations), such that safety can be improved. Unfortunately, the extensive research into military use of RPAS has not been matched by research into civilian use of RPAS, despite the growth and has “remained widely unnoticed in academic research” [
11].
The aim of this research is to help ensure that civil RPAS operations can be as safe as possible for those involved in the industry and for the general public, since RPAS operation occur in and around civilian populations. By understanding the difference between accident and incident events in RPAS and commercial air transportation (CAT), the industry can reduce the number of RPAS events. The primary research question posed in this work is: “how does the distribution of common factors in civil RPAS accident and incident events over a 10-year period compare to CAT, in terms of occurrence types, phases of flight, and safety issues?”
2. Materials and Methods
2.1. Post Accident Analysis
Previous research undertaken has highlighted the effectiveness of reactive approaches to help improve safety in the Aviation Industry. Clothier and Walker [
12] identified a sample of military RPAS accidents and classifications from Tvaryanas, et al. [
13]. Their work found that of the 221 cases, 60.2% involved human factors [
13]. The goal of their work was to identify risks so they can be mitigated before they eventuate [
12].
Similarly, post-accident explorative research was also utilized by Boyd [
14], investigating “causes and risk factors for fatal accidents in non-commercial twin engine piston general aviation aircraft”. Boyd, through post-accident analysis, identified a potential deficiency in key training areas concerning multi-engine rating training syllabi. As a result of the work, regulatory authorities are able to disseminate safety bulletins so that flight training providers can review their approaches and materials [
14].
In general, the aviation industry has many reporting bodies that collect and report accident data for different sectors and for various categories and classifications. The peak global airline body (International Air Transport Association (IATA)), the United Nations specialized agency (ICAO), airline manufacturers (Boeing and Airbus), as well as regional agencies, such as the European Aviation Safety Agency (EASA) or the US Federal Aviation Administration (FAA), all report safety statistics. This data facilitates reporting of findings such as 70%–80% of accidents being related to human factors [
12].
The rules and regulations governing aviation activities are “as fundamental and rudimentary to the aviation industry as civil order is to modern society” [
15]. Australia became one of the first countries to regulate the operation of RPAS in civil airspace with the introduction in 2002 of rules specifically for unmanned aerial activities [
16]. Since then, significant progress has been made in the promulgation of rules for RPAS operations. For example, in 2007 the U.S. Federal Aviation Administration instigated policies allowing the integration of RPAS into non segregated airspace [
17]. Work has continued to progress in Europe to assure harmonization of regulations across the countries [
18]. ICAO is in the process of developing Standards And Recommended Practices (SARPs) for RPAS operations and the RPAS Manual (RPASM) was published in 2015 to provide guidance for member States on RPAS integration into non-segregated airspace [
15].
2.2. Research Design
An exploratory design was undertaken to investigate the distribution of factors involved in civil RPAS accident and incident events. This mixed-method approach commenced with a qualitative phase to collect documentation for civil RPAS accidents and incidents. The reports were then evaluated using content analysis. The content analysis facilitated the identification and examination of information within the case studies to identify common trends and themes [
19]. The final stage of the qualitative phase was the coding of data to categorize each of the factors of interest; specifically, occurrence types, phases of flight, and safety issues. The cases were selected through convenience sampling, where publically accessible information was available. Note, available cases were limited, as reporting of RPAS accidents and incidents are not mandatory. To be specific, no random sub-sampling was conducted; as such, all of the cases found were included. Following this, the categorized data was then quantified and analyzed to identify common causal factors and to determine if any statistical significance existed.
2.3. Data Collection and Coding
The 152 cases analyzed and evaluated in this work were collected from a number of publically available accident investigation databases and safety reporting systems. These included:
NASA’s Aviation Safety Reporting System (ASRS)—a voluntary reporting system,
National Transport Safety Board Aviation Accident Database—contains those occurrences that have been formally investigated,
U.S. General Services Administration Federal Aviation Interactive Reporting System (FAIRS),
U.S. Geological Survey Aviation Safety Communiqué (SAFECOM),
FAA’s Aviation Safety Information Analysis and Sharing (ASIAS),
FAA’s Accident and Incident Data System (AIDS),
FAA’s Near Mid-Air Collision System (NMACS)—voluntary reporting system,
FAA Preliminary Accident and Incident Data,
Australian Transport Safety Bureau (ATSB) Short Investigation Bulletins,
ATSB Aviation Weekly Summaries (ATSB National Aviation Occurrence Database),
Air Accident Investigation Branch (UK),
Transportation Safety Board of Canada’s Aviation Investigation Reports,
The Aviation Safety and Security Archives Database,
Aircraft Owners and Pilot Association Air Safety Institute’s Accident Database,
Aviation Safety Network (ASN),
PlaneCrashInfo.com,
FAA Runway Safety Office—Runway Incursions (RWS),
European Coordination Centre for Accident and Incident Reporting Systems (ECCAIRS),
UK Civil Aviation Authority Mandatory Reporting Scheme.
The data collected focused specifically on civil RPAS accidents and incidents, during the period 2006 to 2015.
Each accident/incident event was categorized based on occurrence classification, phase of flight, and safety issue. The occurrence classifications used were those of the Global Safety Information Exchange (GSIE), as detailed by IATA [
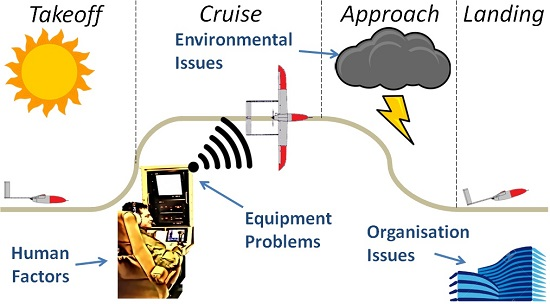
20]. The classifications included in this work were: Controlled Flight Into Terrain (CFIT), Loss Of Control–In-flight (LOC–I), Runway Safety (RS), Ground Safety (GS), Operational Damage (OD), Medical (MED), Unknown (UNK) (used when there is insufficient information), and Other (a catchall for other types, not utilized in the analysis herein). The phases of flight investigated in this work included:
Takeoff (including climb out),
En-route, or cruise,
Approach (including descent),
Landing.
It should be noted that other typical phases of flight with considerable accidents/incidents events for CAT (standing and taxiing), were omitted from this study. This is justifiable as there were no RPAS accidents/incidents in these categories, and it is common for an RPAS to be hand launched (or otherwise), without ground movements. The safety issues were grouped into four categories, each comprising several EASA specific safety issues. The resultant list of safety issues was: Human Factors (HF), Organizational Issues (OI), Equipment Problems (EP), and Environmental Issues (EI).
In addition to occurrence classification, phase of flight, and safety issue, demographics of each event were also collected. Of particular significance was the year of the event, the time of day, the country of occurrence, and specific details of the aircraft/system. Due to the limited data set, the analysis of events broken down by both “demographics” and categories could not be undertaken.
2.4. Data Analysis
The quantitative data analysis involved Pearson’s chi squared tests for Goodness of Fit. The RPAS data represented the observed data (
O), and data for CAT from EASA was used as the expected data (
E) [
21]. The EASA CAT data set was selected as it also covered a 10-year period (albeit from 2005 to 2014), and had information concerning occurrence, phase of flight, and safety issues. Using the EASA data enabled a direct comparison between what is observed in RPAS accidents and incidents, and how this compares to CAT. The statistical hypotheses are given as:
where P is in reference to the proportions of the
n-th category, for RPAS and for CAT. The null hypothesis (H
0) can therefore be expressed as, “the proportions of RPAS accident and incident events are equal to the proportions for CAT events, for the different categories”. Conversely, the alternative hypothesis (H
A) is that “the proportions are not equal”. The chi square statistic, or
χ2, is given by [
22],
where there are
n categories (7 for occurrence types, 4 for phases of flight, or 4 for safety issues). The number of degrees of freedom,
ν, is given as
n – 1 for each test. The critical value was then determined from the degrees of freedom using the
χ2 table, with a 95% confidence level. Finally, if
χ2 was less than the critical value H
0 was accepted, otherwise H
0 was rejected.
For each of the subsets of observed and expected data, relative percentage differences, deltas (Δ), were calculated, using,
To determine the percentage of the
i-th category, the observed data point would be divided by the sum of all observed values, multiplied by 100%. Hence, the delta value gives a direct error for the observed percentage. This then facilitated a direct comparison between what is observed for RPAS for each of the categories, and what would be expected if the data was a random sample of the CAT data. That is, a positive delta infers that an RPAS event is more probable than a CAT event in that category, while a negative delta infers that an RPAS event is less probable than a CAT event in that category.
3. Results
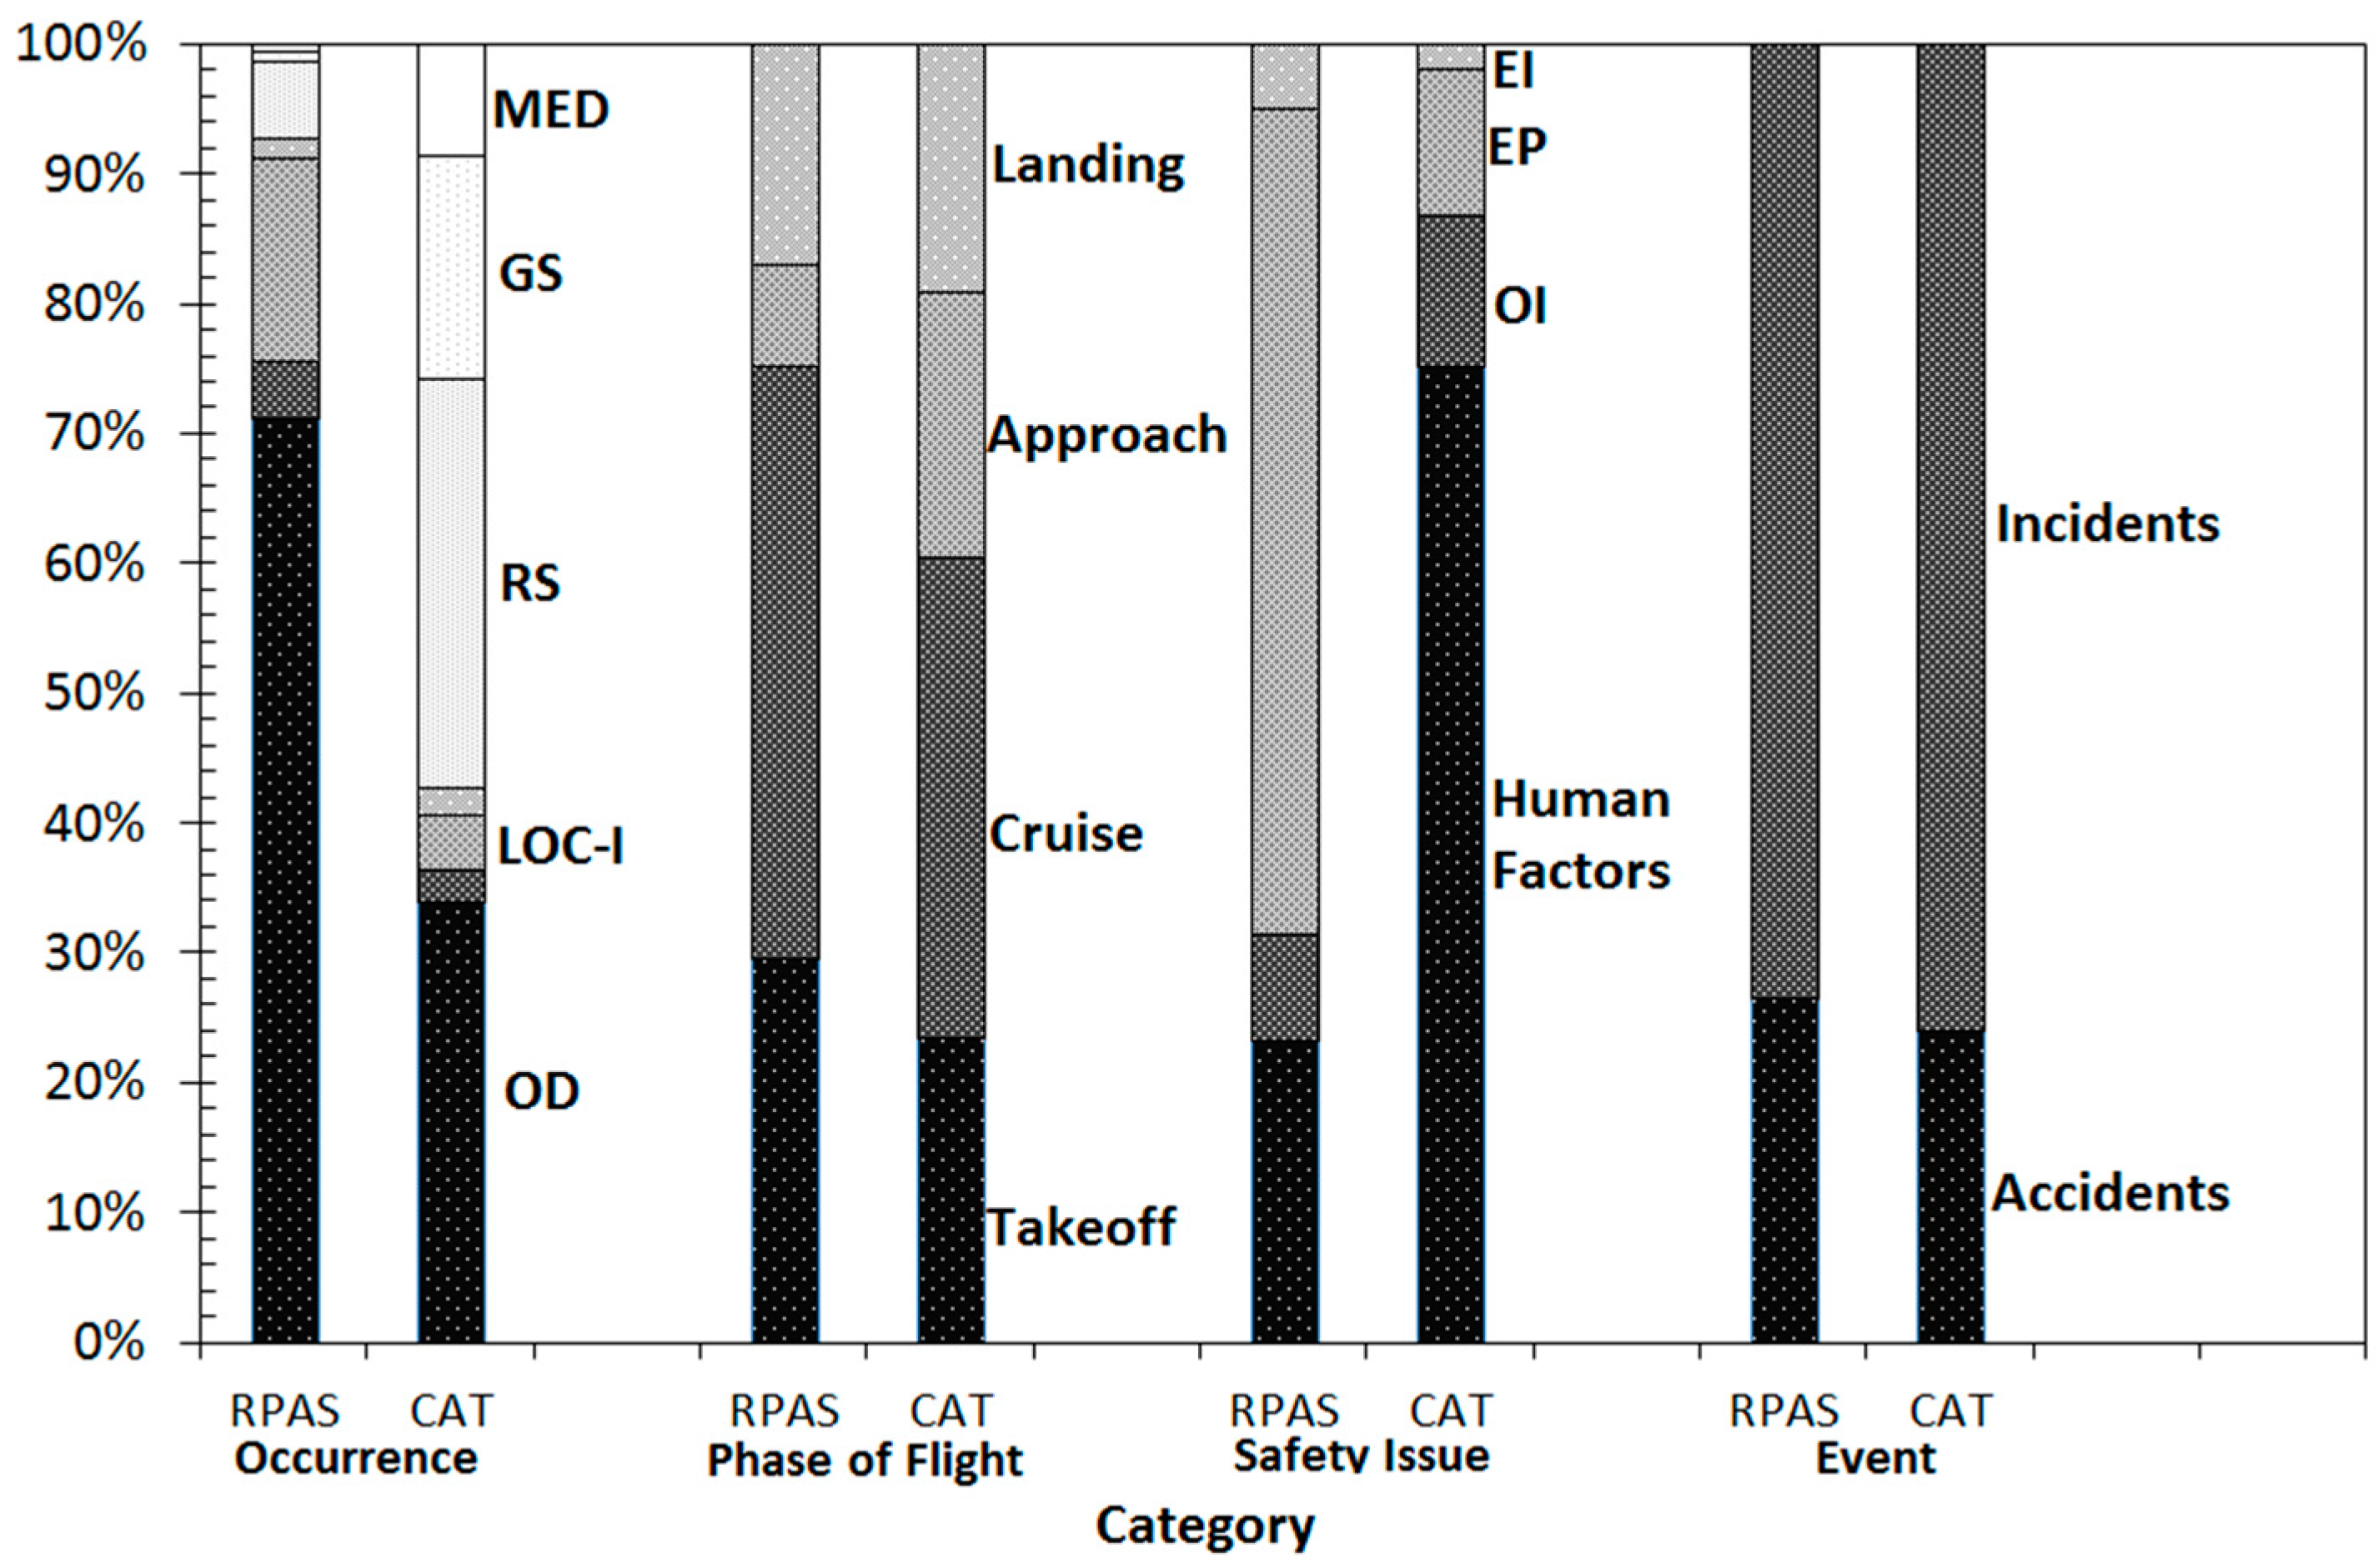
The breakdown of the 152 cases collected is presented in
Figure 1. In terms of accidents versus incidents for RPAS it can be seen that 74% were incidents and 26% were accidents, which is very similar to the breakdown for the CAT events, as reported by EASA [
21]. For both safety issues and occurrence, a considerable difference can be seen between the RPAS and CAT proportions. For phase of flight, a slight increase in events associated with takeoff and cruise can be seen for RPAS events.
In total, 10 chi squared tests were undertaken. The first was to compare the proportion of accident and incident events in RPAS to those of CAT. The corresponding χ2 value was calculated as 0.52, with two categories this gives a single degree of freedom, and a critical value of 3.841. Therefore, at the 95% significance level, the null hypothesis is accepted. That is, the proportion of accidents and incidents for RPAS is equivalent to that for CAT.
A further nine chi squared tests used subsets of the data, grouped into:
Incident,
Accident, and
Combined Total.
The categories subsequently examined were,
Occurrence,
Phase of Flight, and
Safety Factor.
Table 1 shows the results for the nine statistical tests. The calculated chi squared test statistics are given, along with the degrees of freedom, and corresponding critical values. A conclusion is also included to facilitate easy comparison. Looking at the table vertically, it can be seen that for occurrence type, each of the test statistics is greater than the critical value. Hence, the null hypothesis is rejected and it is concluded that for occurrence type, the proportions of RPAS accidents and incidents is different to the proportions of CAT, at the 95% significance level. For phase of flight, the test statistics for incidents is less that the critical value. As such, it is accepted that the proportions of incidents across phases of flight for RPAS are similar to the proportions for CAT, at the 95% significance level. In contrast, the test statistics for accidents and the combined total are both greater than the critical value. Hence, it can be concluded that for accidents and all events combined, the proportions of events across phases of flight for RPAS is different to CAT, at the 95% significance level. Finally, for safety issues, each of the test statistics is greater than the critical value; hence, the null hypothesis is rejected and it can be concluded that for safety issues, the proportions of RPAS accidents and incidents is different to the proportions of CAT, at the 95% significance level.
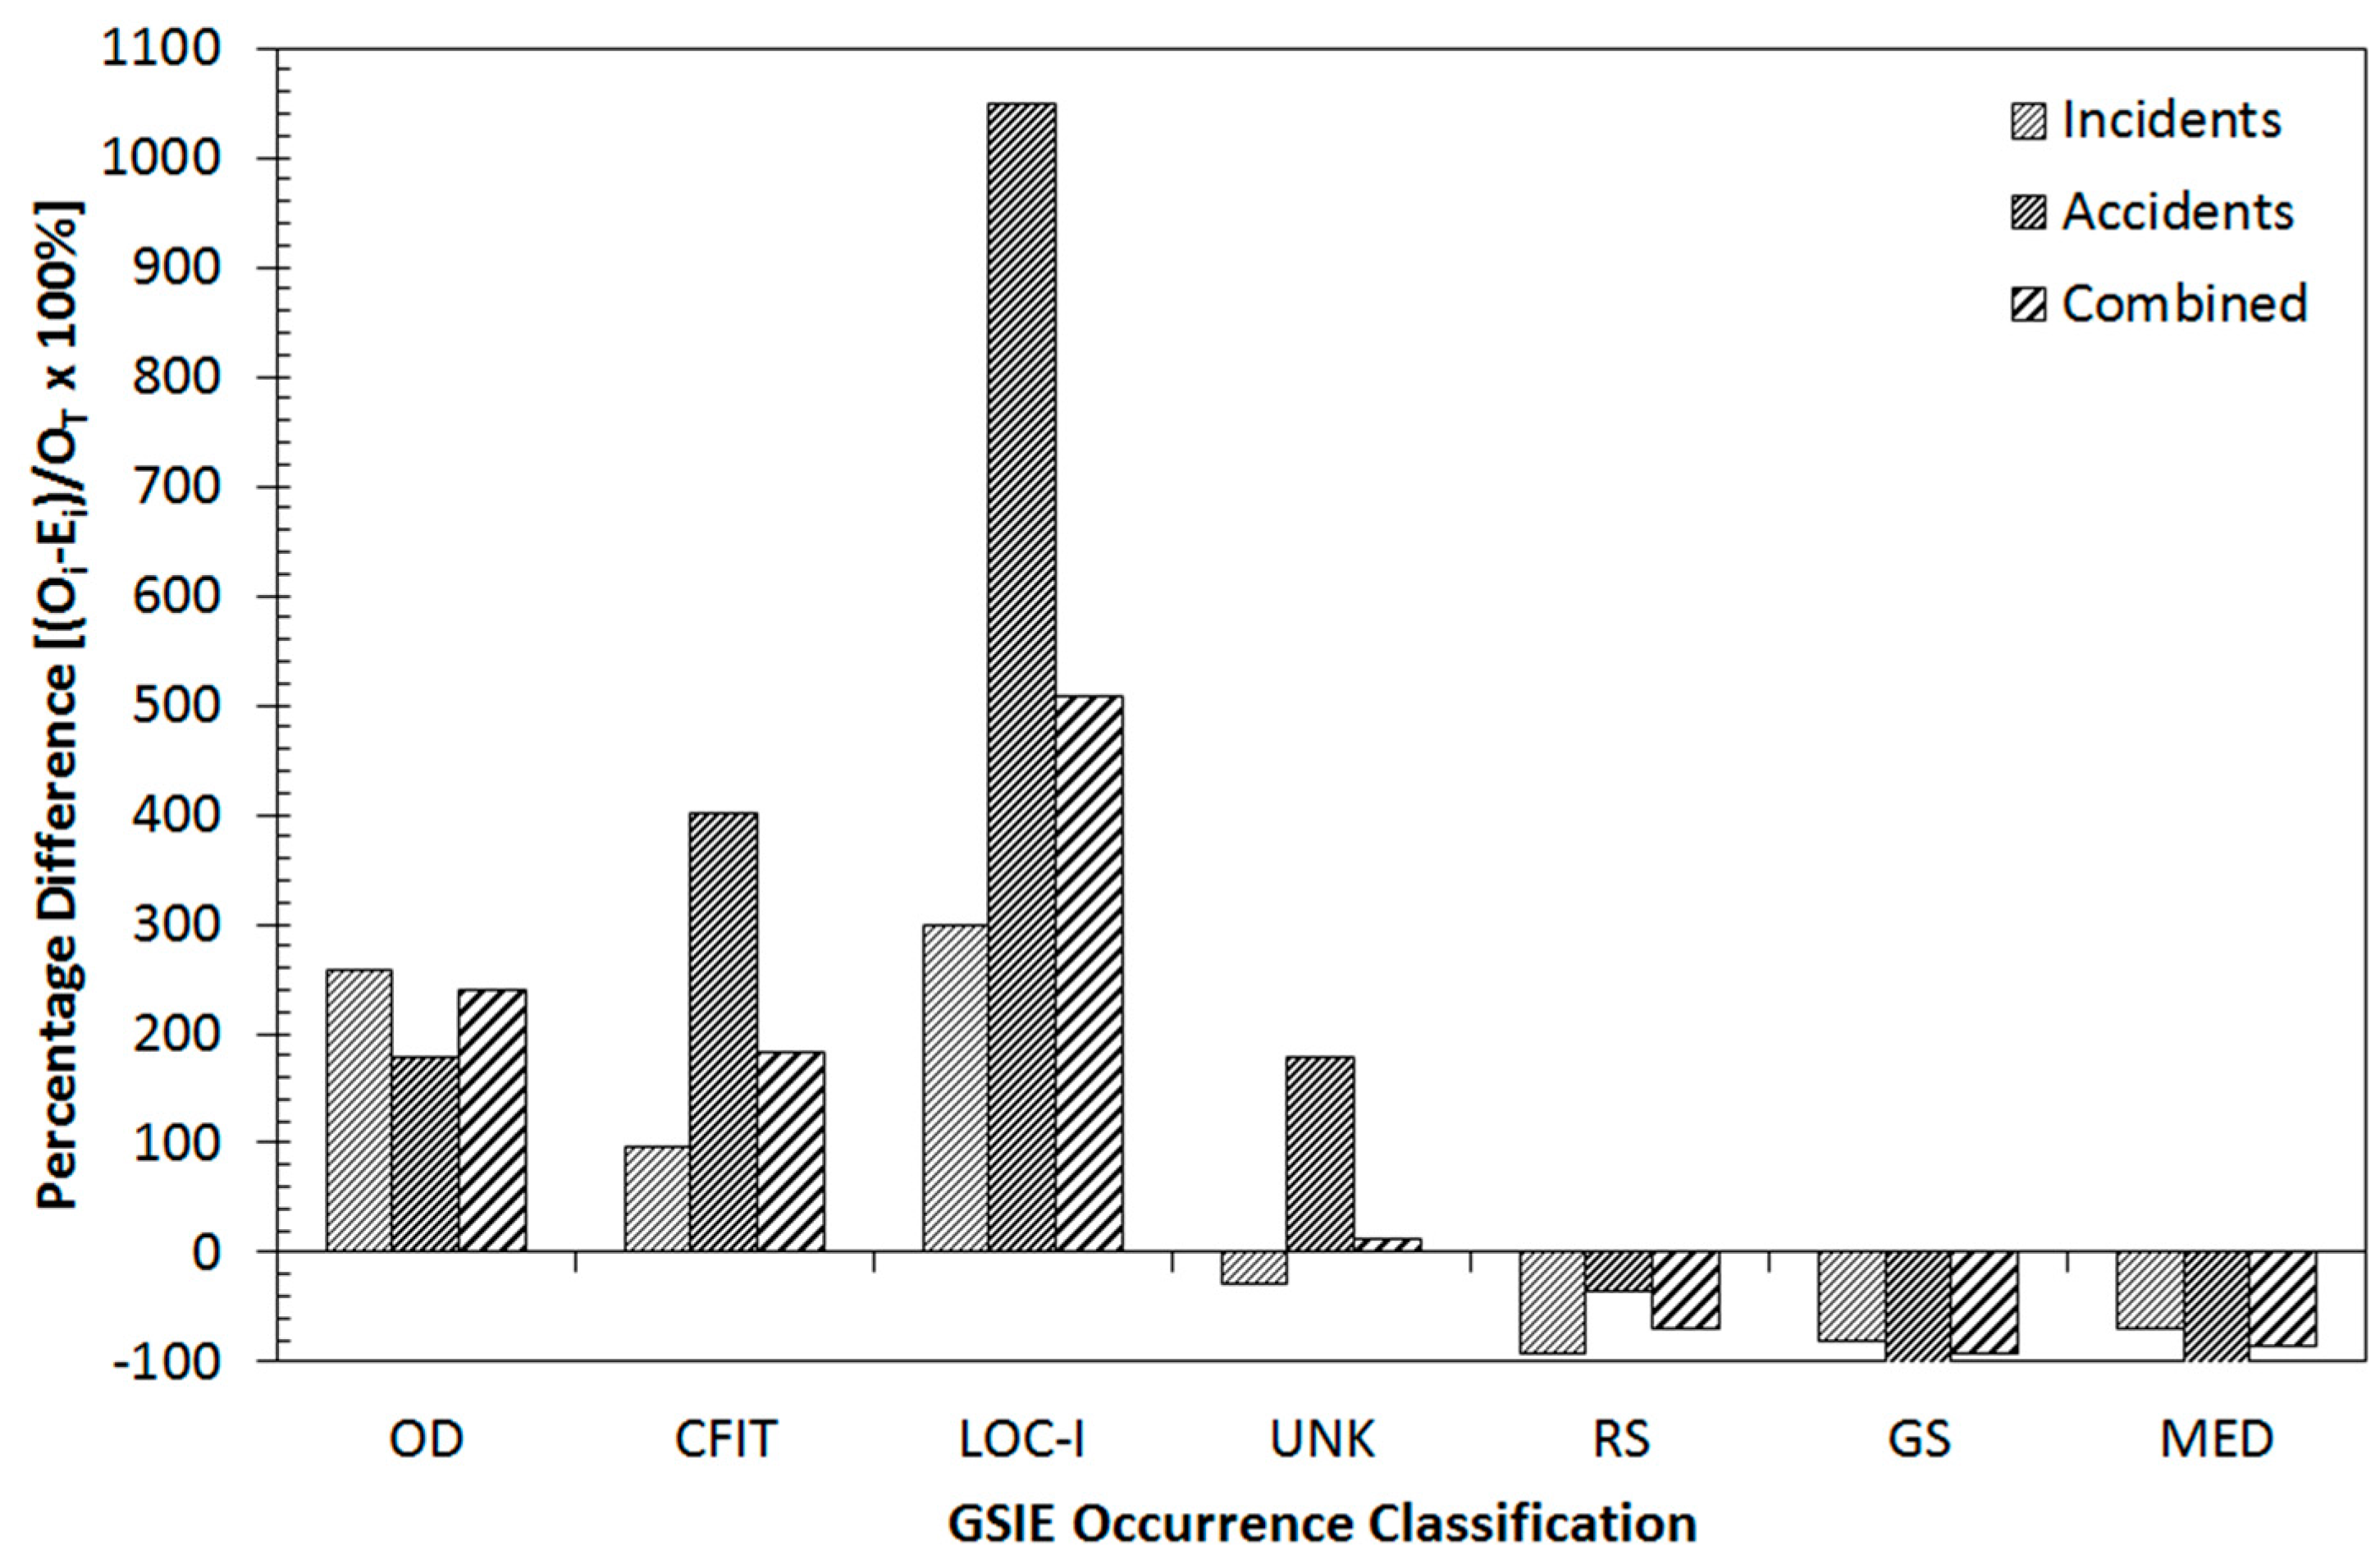
Figure 2 shows the results for the occurrence types, specifically using the GSIE classifications.
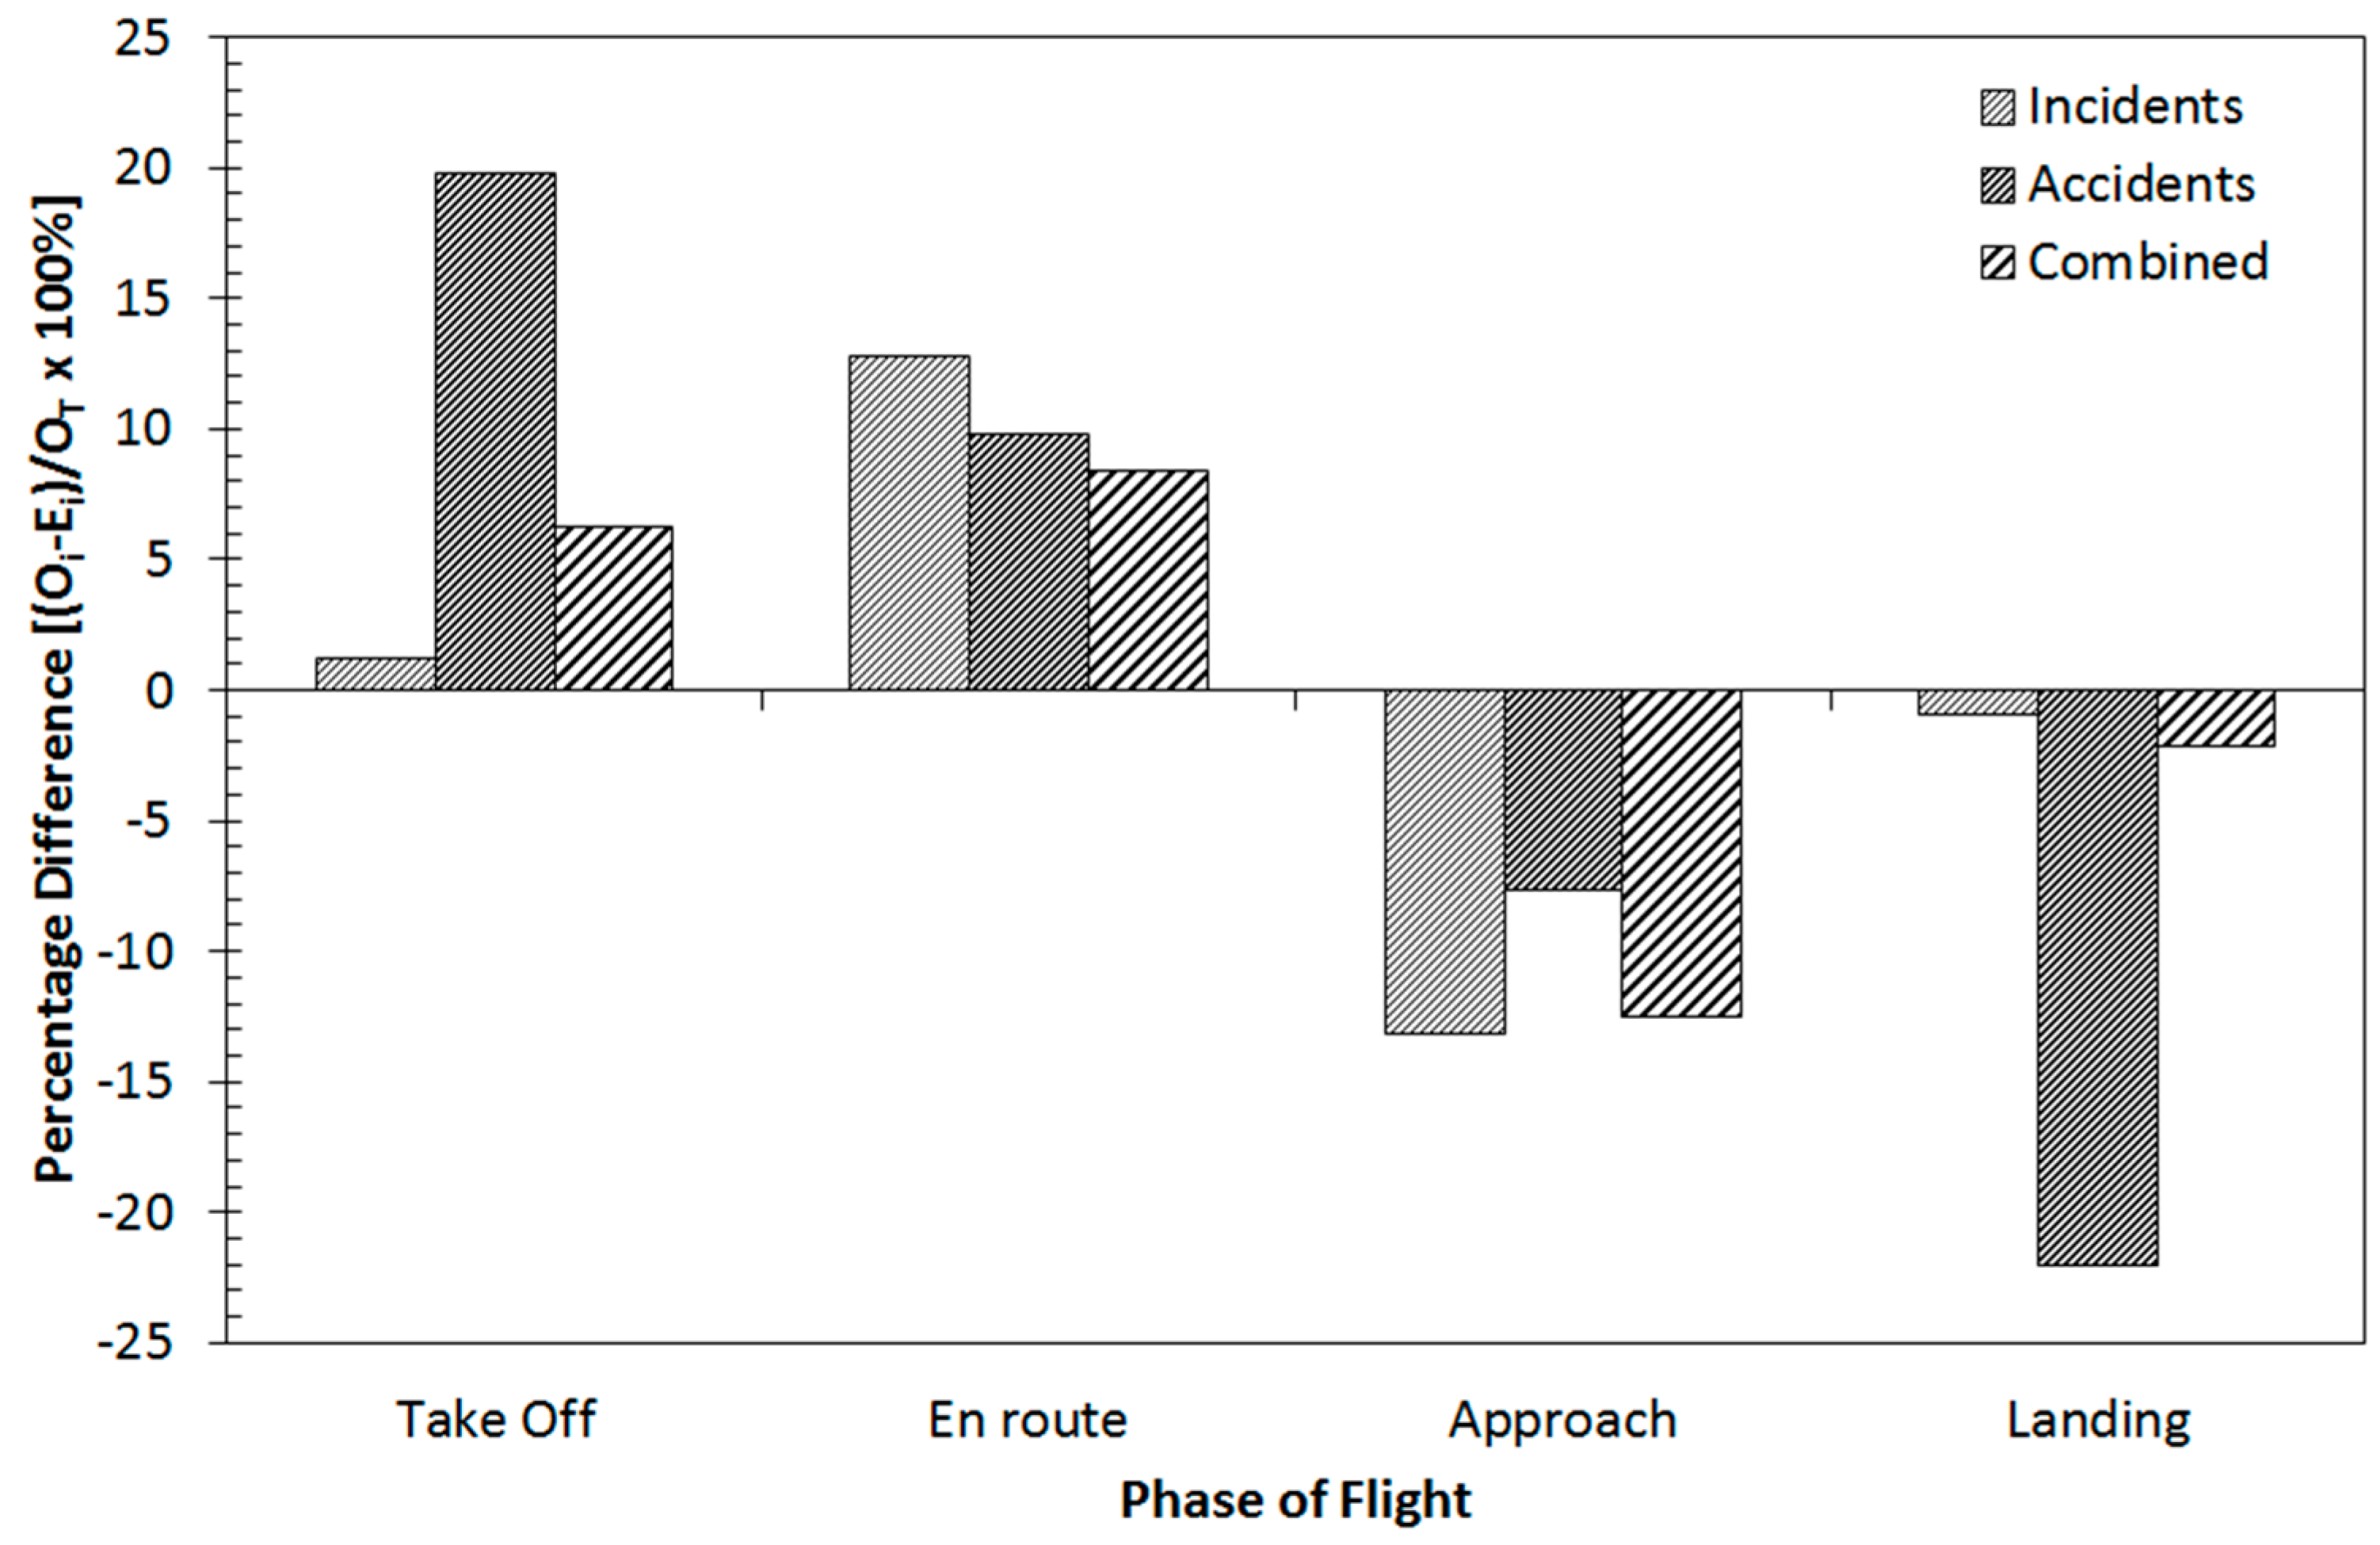
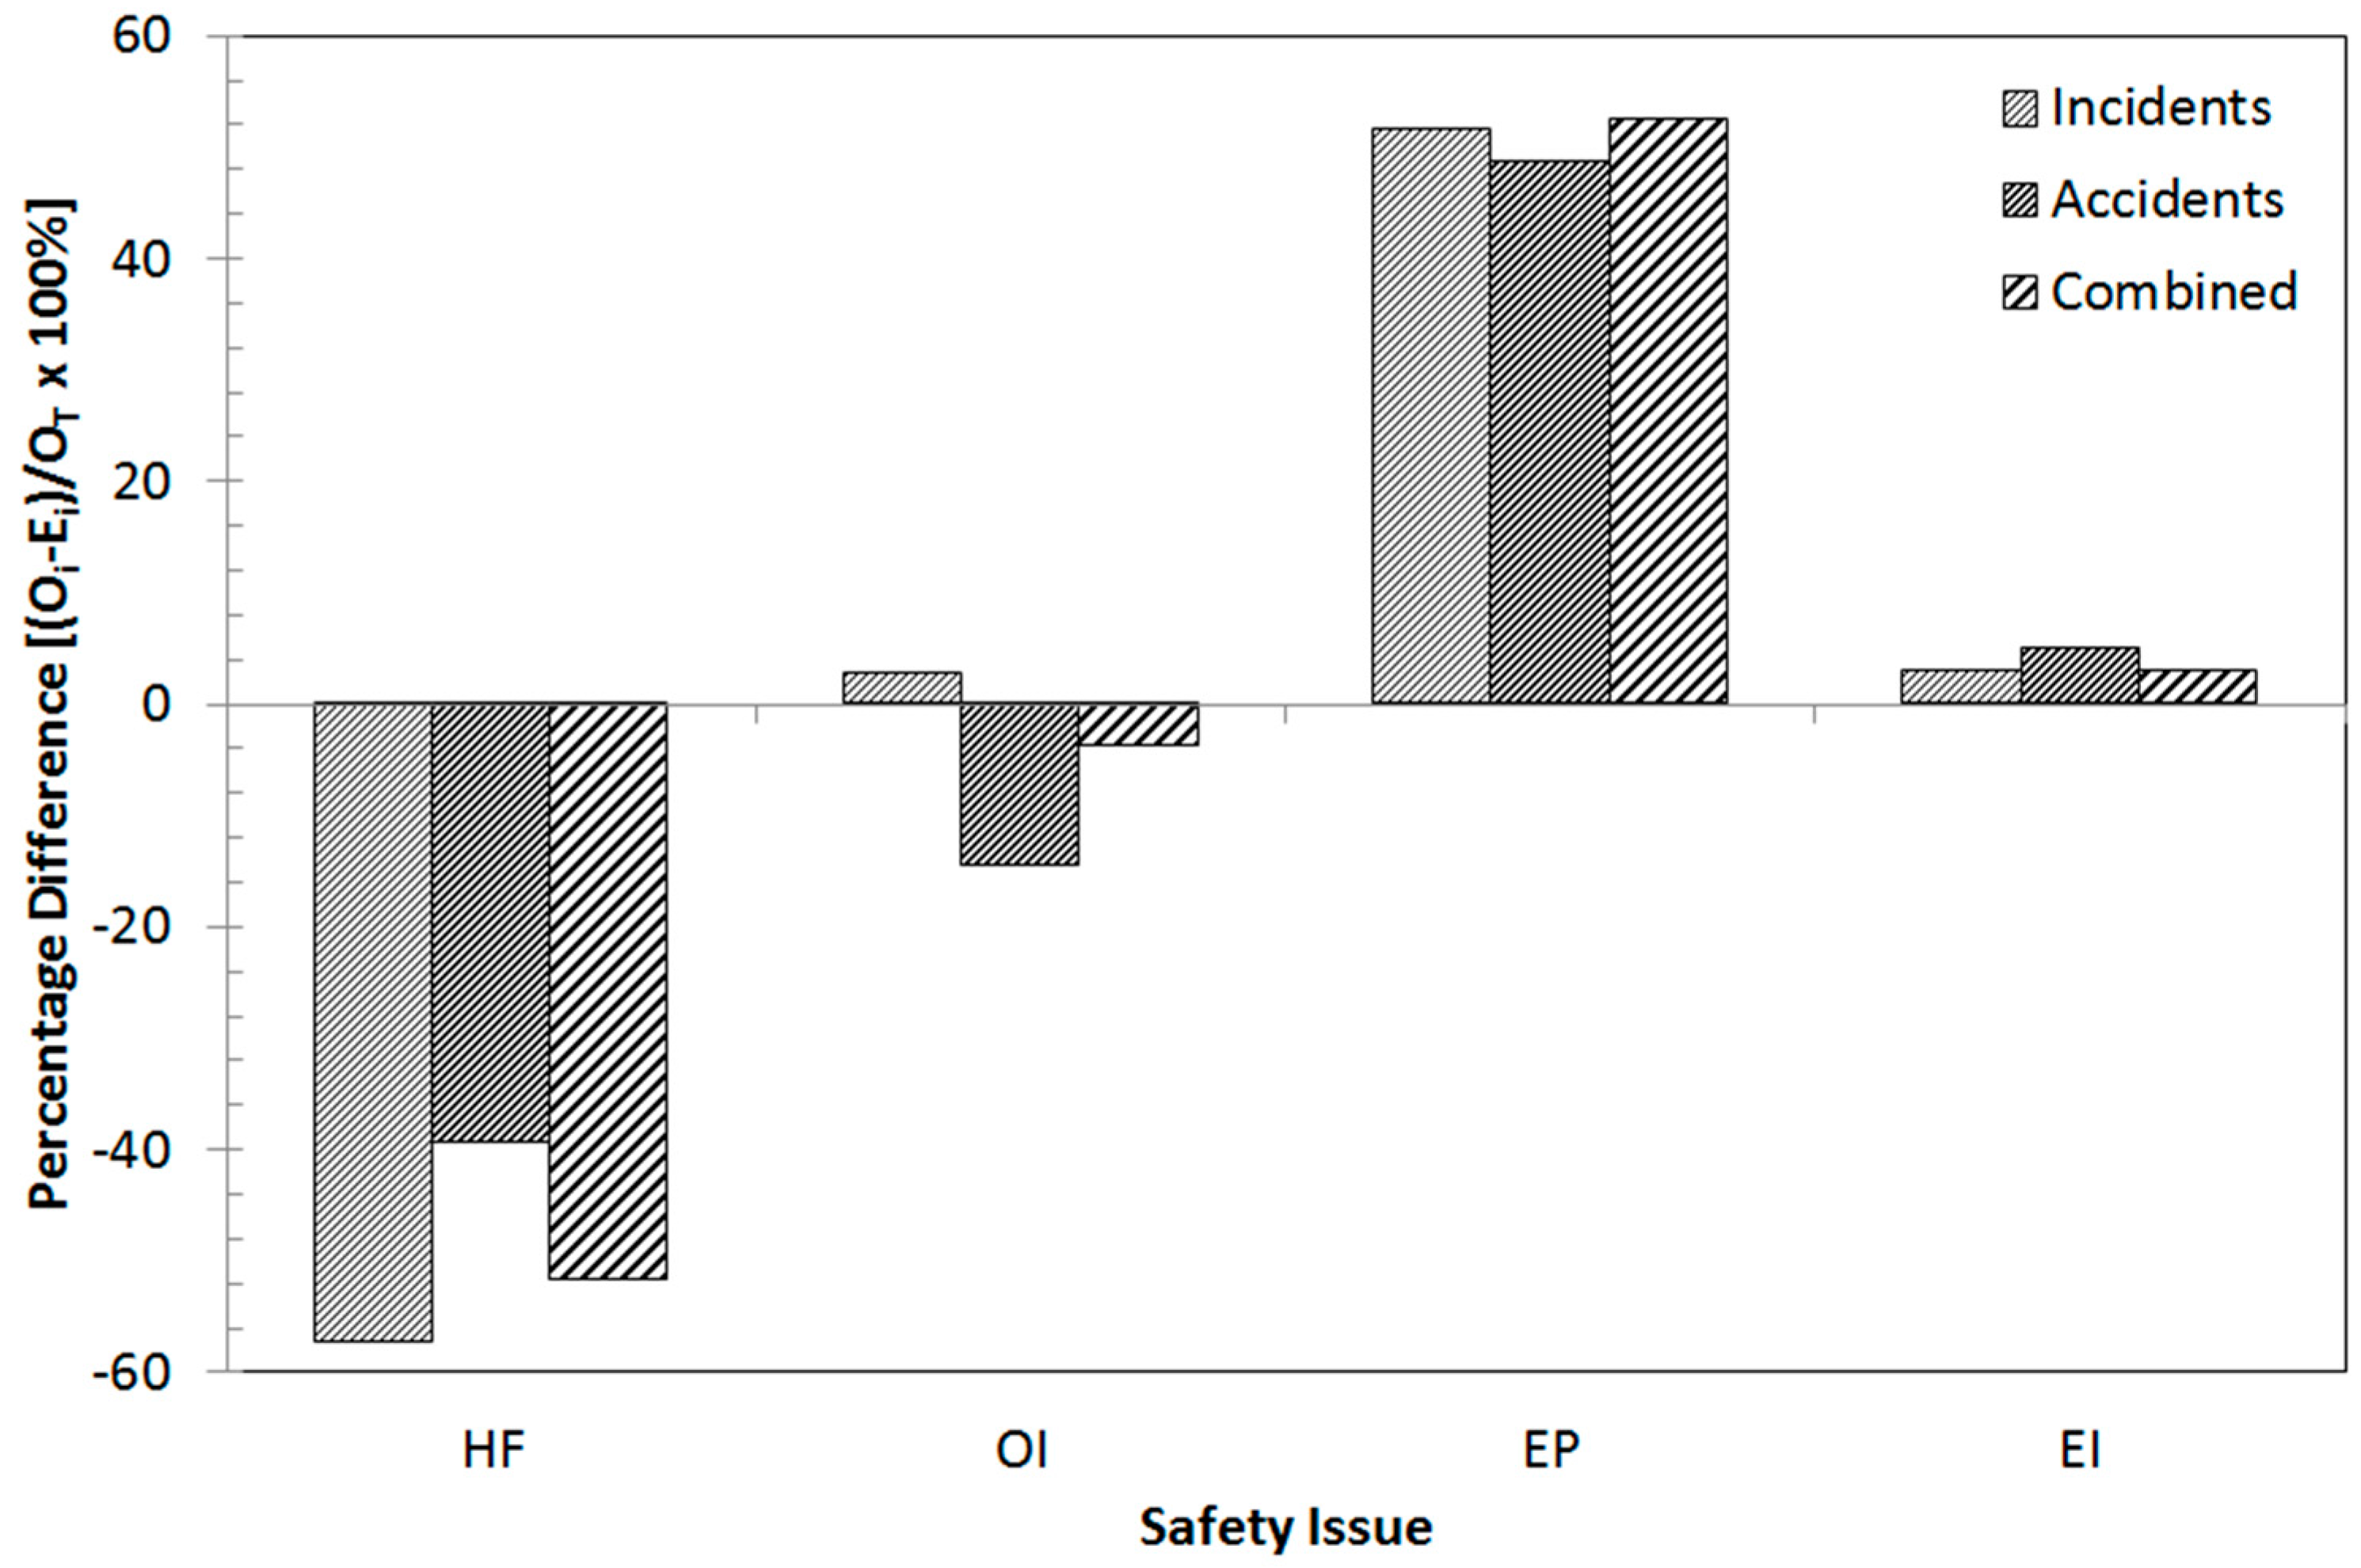
Figure 3 shows the results for the phases of flight. Finally,
Figure 4 shows safety issues. There are three bars side-by-side for the accidents, incidents, and combined events, respectively. These three subsets are presented for each of the categories across the horizontal axes.
4. Discussion
The proportion of events for accidents and incidents in the sample of 152 RPAS events is almost identical to the proportions for the events recorded by EASA for CAT, as illustrated in
Figure 1. This is further confirmed by the results of the chi squared test (χ
2 = 0.52 < 3.841, accept H
0). This is a good indication that the sample of RPAS accidents collected is in fact random, even though they were sampled conveniently. That is, no difference is expected for the proportions of accidents and incidents, and the sample agrees with this. This adds additional confidence to the results from the further nine chi squared tests.
For occurrence type, in
Figure 2, the first three categories (OD, CFIT, and LOC–I) show a positive delta, which indicates that RPAS occurrences are more probable relative to CAT. Conversely, the last three categories (RS, GS, and MED) show a negative delta, indicating RPAS occurrences are less probable relative to CAT. The most significant difference between RPAS and CAT is in terms of LOC–I. In 2014, NASA published results from their loss of control study [
23]; their study indicated that the majority of loss-of-control events include some form of equipment problem.
Figure 1 shows that, for RPAS events, equipment problems account for 64% of all events.
Figure 4 shows that equipment problems have the most positive delta, indicating that they are more likely to occur for RPAS operations. The prevalence of equipment problems then has a compounding effect resulting in a larger number of loss-of-control events for RPAS.
Figure 4 also indicates a relatively large negative delta for human factors. Previous studies have highlighted that human factors are attributed to over two thirds of aviation accidents and incidents [
12,
24]. In fact,
Figure 1 shows that human factors accounted for 75% of events over the past 10 years for CAT as reported by EASA. However, the results of
Figure 4 indicate that human factors are not as significant as equipment problems. In a similar way, a study of military RPAS showed that failure of aircraft components (66%) also had more significance over that of human error (34%) [
25]. This finding needs to be considered very carefully. The incorrect conclusion to draw is that human factors are not significant for RPAS. Over time, the CAT sector has applied significant effort to control risk factors. This has led to a reduction in CAT events that are the result of equipment problems, such that the human element is now far more significant. For example, large transport category aircrafts, such as those from a Boeing or Airbus, are required to have triple redundant systems [
26]. The same is not true for remotely piloted aircraft. In addition to this, some improvements that have resulted in reducing human factors risks in manned aviation are applicable to unmanned aviation. This further increased the divide between the safety issues of human factors and equipment problems in RPAS.
Skrzypietz [
24], suggested that RPAS operations will result in fewer accidents and incidents caused by human factors. This is due to the removal of an on-board pilot from the aircraft leading to a reduced risk. This is supported by the Office of the Under Secretary of Defence for Acquisition, Technology and Logistics which identified that only 17% of military RPAS mishaps were ascertained as being of a Human Factors origin [
12]. However, Tvarynas, Thompson, and Constable [
13] oppose this point. They attribute a lack of human factors involvement in RPAS accidents to the reduced involvement of the human in their operation. They also conclude that RPAS are still in their infancy, and as such suffer a larger number of equipment failures than manned flight systems. The latter is reminiscent of the early history of manned flight where mechanical failure was the largest contributor to accident rates [
27].
Figure 3 shows the smallest delta values. This is highlighted by the fact that when incidents are categorized by phase of flight, the conclusion from the chi squared test is to accept the null hypothesis. That is, the spread of RPAS incidents are similar to the spread of CAT incidents. That said, the chi squared tests are more prone to type two errors (failure to reject the null hypothesis), and the values here are, χ
2 = 7.016 < 7.815, therefore, we accept H
0. If the probability is calculated, a
p-value of 0.07 is obtained. That is, at a statistical significance of 90% the null hypothesis would be rejected. As such, it is best to describe the distribution of incidents by phase of flight as a borderline case. Looking at accidents and all events in
Figure 3, with the results from
Table 1, it can be seen that both have a different distribution over the different phases of flight which are statistically significant. Looking at just accidents, we see a strong positive delta for takeoff (more accidents relative to CAT) and a strong negative delta for landing (fewer accidents relative to CAT). The incorrect conclusion to draw here is that RPAS have more accidents during takeoff or fewer accidents during landing. In fact, if we consider takeoff, en-route and approach, and landing (three categories), there is a flat distribution with approximately one third corresponding to each. As such, the safety procedures and improved equipment reliability in CAT accounts for the reduction of accidents at takeoff relative to landing. For incidents, and for the total number of events, there is a positive delta for en-route, or cruise. The initial content analysis indicated that just under a third of cases investigated involved a loss of the communication link. The frequent occurrence of this specific equipment problem can be related to phase of flight because different types of communication links are utilized [
28]. In critical phases of flight, including takeoff and landing, line of sight links are utilized, whereas phases such as cruise, and to some degree approach, tend to rely on satellite based links which are more susceptible to problems, such as signal latency [
28].
5. Conclusions
This study was designed to explore the accidents and incidents that are occurring in the civil RPAS sector of the aviation industry. This was motivated by a goal to improve safety in civil RPAS operations and thus provide reassurance for the general and flying public in light of the alleged collision between a “drone” and a British Airways Airbus A320 on 17 April 2016. The primary research question posed by this work was “how does the distribution of common factors in civil RPAS accident and incident events over a 10-year period compare to CAT, in terms of occurrence types, phases of flight, and safety issues?” The content analysis of 152 case reports of RPAS accidents and incidents provided rich data concerning the occurrence type and causal safety issues. Further quantitative analysis compared the distribution of RPAS accident and incident events for each category and compared them to the expected distribution, as given by accident and incident events for CAT. It was found that all categories for RPAS were statistically significantly different for occurrence type, phase of flight, and safety issue in terms of the total number of events, and for accidents alone. For RPAS incidents, occurrence type and safety issue were statistically significant, while phase of flight was a borderline case.
With the proportion of events confirmed to be statistically significant, and hence different to what is seen in CAT, key differences can be noted. Specifically, it was found that operational damage and loss of control in-flight events were more common in RPAS. These events were the result of a greater number of equipment problems in RPAS in contrast to CAT where human factors were a more common factor in accidents and incidents. For phase of flight, it was found that more events occurred at takeoff and in cruise for RPAS events relative to CAT.
The most significant conclusion is in regards to the directions taken by regulatory authorities. The alleged British Airways incident possibly involving a collision with a “drone” has highlighted calls to license RPAS operators, in all forms. However, licensing of operators effectively improves knowledge, skills, and attributes that influence human factors related causations. In an industry that has been conditioned to see human factors as the way to improve safety, reducing human factors risks can be an appealing and obvious solution. However, this is in contrast to the findings herein. Greater emphasis on technical issues such as the airworthiness of aircraft and the integrity of the communication links may produce greater safety dividends as against a narrowing of focus onto human operator issues. It is thus recommended that regulatory authorities continue to consider RPAS airworthiness requirements and other technical issues in addition to RPAS operator licensing when drafting new RPAS regulations, if not considering them first.


