Review

The Flight of Birds and Other Animals

by
Colin J. Pennycuick
School of Biological Sciences, University of Bristol, Bristol BS8 1TQ, UK
Aerospace 2015, 2(3), 505-523; https://doi.org/10.3390/aerospace2030505
Submission received: 9 July 2015 / Revised: 24 August 2015 / Accepted: 26 August 2015 / Published: 1 September 2015
(This article belongs to the Special Issue Feature Papers in Aerospace)

Abstract

:
Methods of observing birds in flight now include training them to fly under known conditions in wind tunnels, and fitting free-flying birds with data loggers, that are either retrieved or read remotely via satellite links. The performance that comes to light depends on the known limitations of the materials from which they are made, and the conditions in which the birds live. Bird glide polars can be obtained by training birds to glide in a tilting wind tunnel. Translating these curves to power required from the flight muscles in level flight requires drag coefficients to be measured, which unfortunately does not work with bird bodies, because the flow is always fully detached. The drag of bodies in level flight can be determined by observing wingbeat frequency, and shows CD values around 0.08 in small birds, down to 0.06 in small waders specialised for efficient migration. Lift coefficients are up to 1.6 in gliding, or 1.8 for short, temporary glides. In-flight measurements can be used to calculate power curves for birds in level flight, and this has been applied to migrating geese in detail. These typically achieve lift:drag ratios around 15, including allowances for stops, as against 19 for continuous powered flight. The same calculations, applied to Pacific Black-tailed Godwits which start with fat fractions up to 0.55 at departure, show that such birds not only cross the Pacific to New Zealand, but have enough fuel in hand to reach the South Pole if that were necessary. This performance depends on the “dual fuel” arrangements of these migrants, whereby they use fat as their main fuel, and supplement this by extra fuel from burning the engine (flight muscles), as less power is needed later in the flight. The accuracy of these power curves has never been checked, although provision for stopping the bird, and making these checks at regular intervals during a simulated flight was built into the original design of the Lund wind tunnel. The Flight programme, which does these comparisons, also had provision for including contributions due to extracting energy from the atmosphere (soaring), or intermittent bounding flight in small birds (Passerines). It has been known for some time that the feathered surface allows the bird to delay or reverse detachment of the boundary layer, although exactly how this works remains a mystery, which might have practical applications. The bird wing was in use in past times, when birds were still competing with pterosaurs, although these had less efficient wings. The birds that survived the extinction that killed the pterosaurs and dinosaurs have (today) an automatic spherical navigator, which enables them to cross the Pacific and find New Zealand on the other side. Bats have never had such a device, and pterosaurs probably did not either. Animals, when seen from a zoological point of view, are adapted to whatever problems they had to deal with in earlier times.

Graphical Abstract

1. The Biologist as Reverse Engineer

Biologists look at birds as creatures that do things that we cannot. In the 21st century we can see what they are doing with their wings, but until the 20th century that was unimaginable. We know that birds can fly, but we are not engineers, and do not try to modify them to fly better. We biologists are, in effect, reverse engineers. We know nothing about the niches that birds fit into or about the constraints that limit what is possible, with biological material. In the light of engineering, we begin to see what can be done, and start to look in detail at how birds do things that we did not originally expect, like leaving Alaska and spending a week flying non-stop to New Zealand, or using natural thermal convection to fly from Europe to Africa and back, for no cost at all. We can use satellite tracking to see what birds do when they migrate, but as to what they are “designed” to do, then we are biologists, and we have to find out what they do first, before asking how they do it. We do not initially know what limits their performance, what pushes them so hard to do better, what their starting points were, or what pushes them so hard to do things that no animal has done before. Animals have been flying for 200 million years, and birds are not the first to succeed, or the only ones to try. However, we know now how to build a wind tunnel, so we built one, taught pigeons to fly in it, and carry on from there.

2. Animals in the Wind Tunnel

2.1. Layout Limitations

Wind tunnel engineers are used to working with models of reduced size, flown in conditions that are not the same as in the real world. Those problems do not arise when testing birds, because if you select a bird like a pigeon, you can fit the whole of it in the test section, and set the conditions as they are out of doors. That is a great convenience, because the pigeon does not have an anatomy in the way than an engineer can understand it. If you hold a pigeon in the hand, its wings are folded up, and if you unfold them, they can be set at dihedral angles from −60 to +90 degrees, and a span between one-third and the whole span, with all kinds of angles that can be set by muscles to a wide range of values. A pigeon wing cannot be set by hand into a position that is meaningful for flight. On the other hand, the whole pigeon can be trained to fly in a wind tunnel, and will set itself into a posture for whatever kind of flight it has to perform. You do not measure forces in a bird wind tunnel. You let the bird set itself up, and infer the forces from the geometry of its situation.
Bird wind tunnels are designed to achieve given levels of performance without being too expensive. Engineers, when consulted about this, often say that the best way is an open-circuit suction tunnel, with the fan at the downstream end. This type of design works very well when used in the wind tunnel laboratory, where the test section (containing air below ambient pressure) is carefully sealed. However, the ornithologist cannot leave his bird unattended. He needs access to it, and consequently leaves holes and doors open, which allows outside air to rush invisibly in, and disturb the flow in the test section. A suction tunnel does not work correctly, if air can get into the test section by routes not noticed in the design. In practice, blower and recirculating tunnels can be used [1,2] but suction tunnels are not practical for any form of quantitative work on live birds.
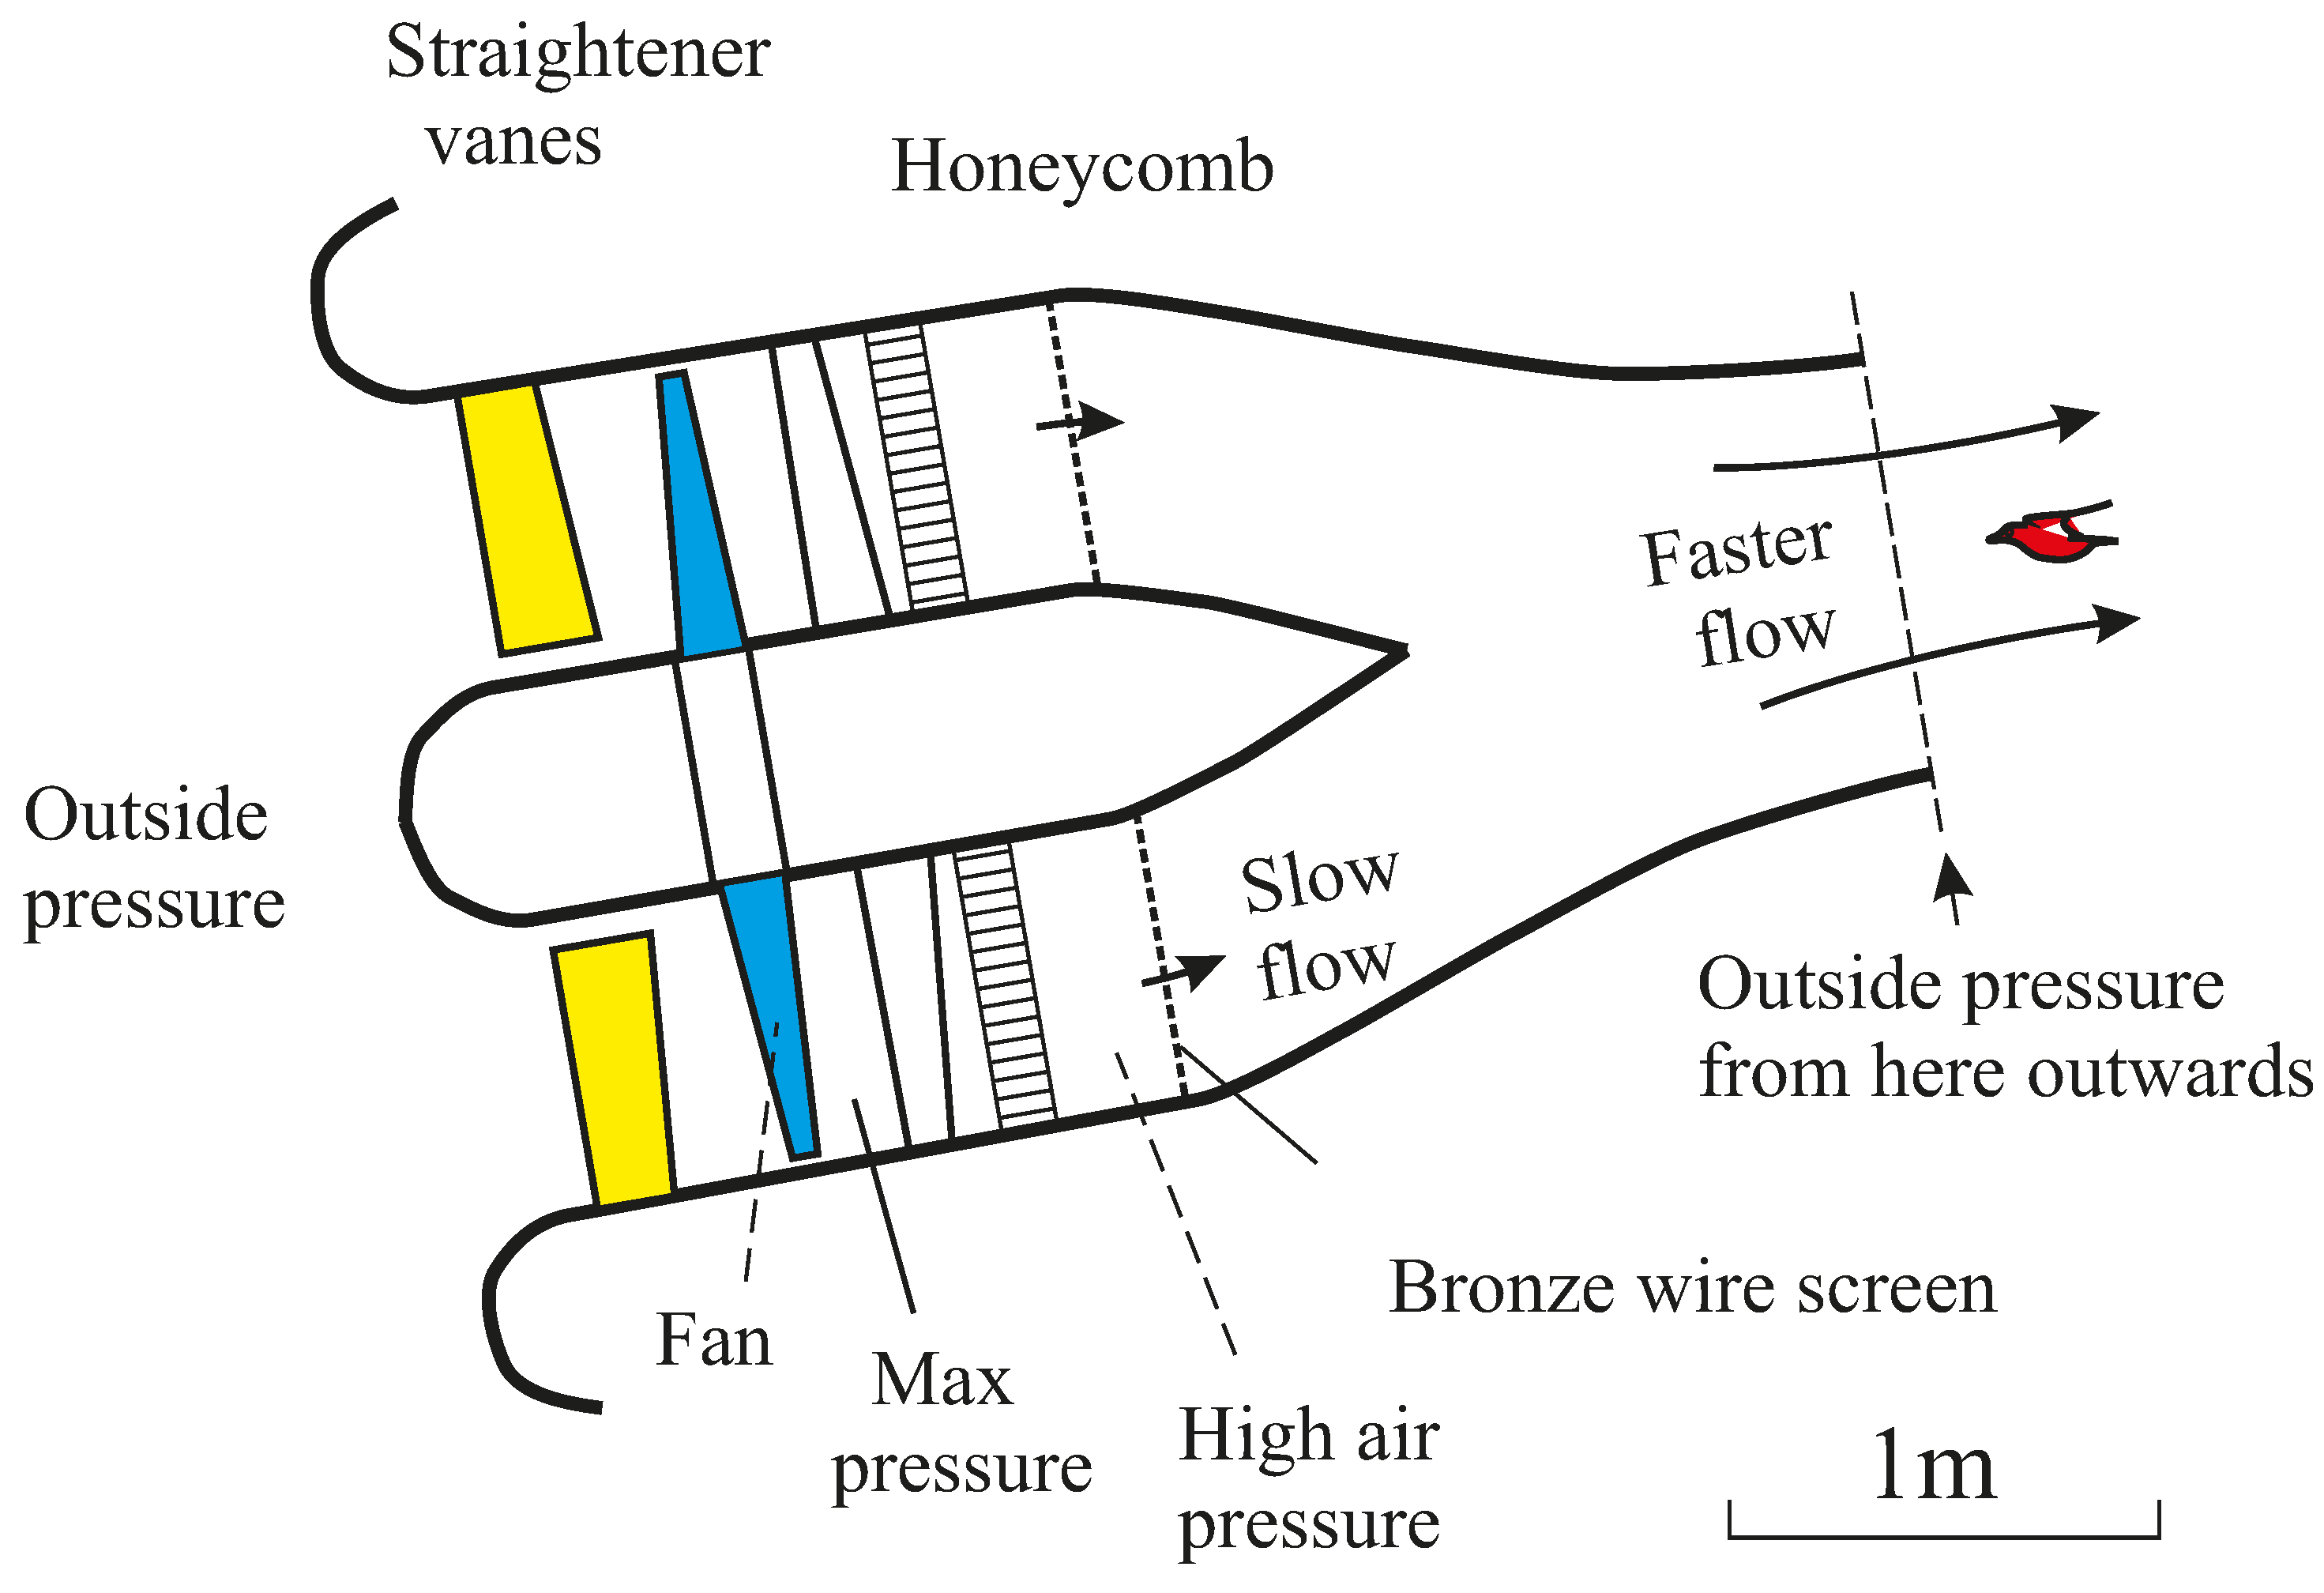
Figure 1 shows an open-circuit blower tunnel used in Bristol in the 1960s and later moved to Nairobi. The bird flies in the open air, at the exit from the contraction, which is at the current environmental static pressure, and allows the experimenter direct access to the bird or bat, without interfering with the air flow. This tunnel may have had some shortcomings, but it worked very well to get glide polars of pigeons, and allowed the range of lift and drag coefficients in the normal flight of birds to be determined. This tunnel was designed to allow forces and work to be scaled, in a set of similar animals in the manner pioneered by the physiologist A.V. Hill in the 1930s [3], although his approach was not followed by later physiologists after the war.
Figure 1. Hydraulic-powered wind tunnel at Bristol in 1966, moved to Nairobi in 1970. This tunnel was powered by a Woods ventilating fan, with a contraction ratio of about 4. Fixed stator vanes before and after the fan straightened the flow, and there was a honeycomb and a fine mesh screen before the contraction. The pigeon flew outside the end of the contraction, where it could be photographed and measured at will. Maximum speed 22.1 m/s.
Aerospace 02 00505 g001
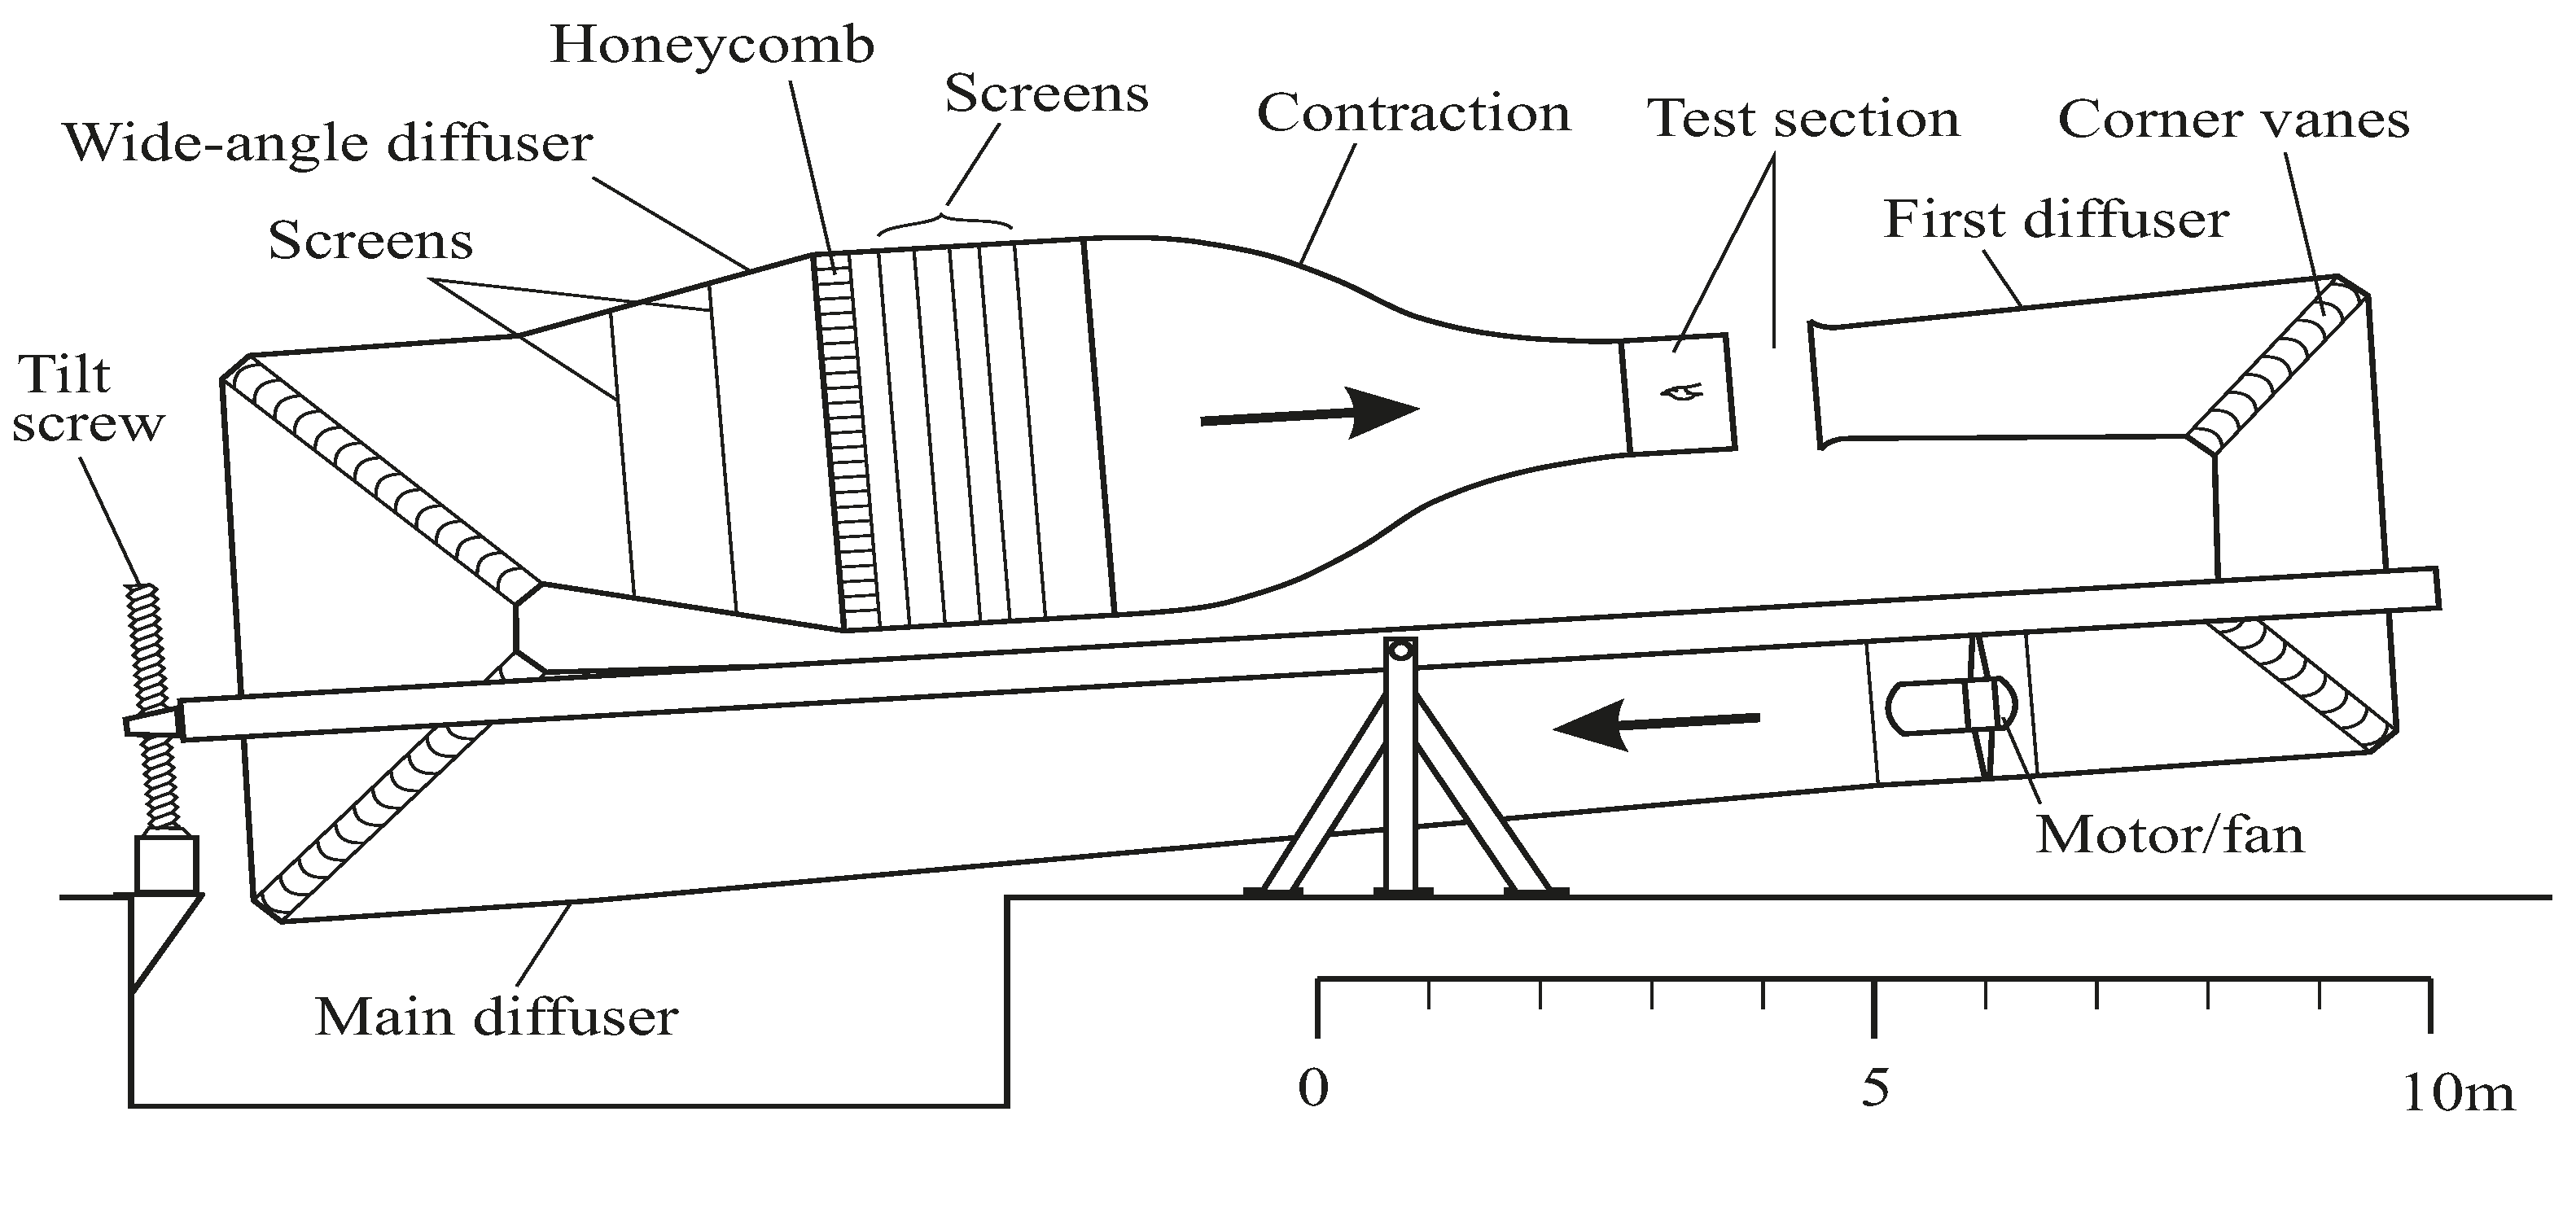
A better (but more expensive) solution was built by AB Rollab of Solna, Sweden, and installed in the Biology Department of Lund University in 1994 (Figure 2) [4]. This is a closed-circuit wind tunnel with a test section measuring 1.20 m across by 1.08 m vertically, and a contraction ratio of 12.25:1, rigged in such a way that the entire machine, return flow and all, can be tilted from 8° descent to 6° climb. The first 1.20 m of the test section is enclosed by walls, then there is an open 0.5 m gap before the line to the motor begins. The rest of the tunnel is entirely enclosed, so that the lowest pressure is at the test section, and air in the rest of the circuit is at higher pressure. This means that the experimenter can move equipment in and out of the gap in the test section, or reward the bird for its performance, without disturbing the flow where the bird is. Another version of this tunnel was installed by the same Swedish manufacturers later at the Max Planck Institute for Ornithology at Seewiesen in Germany, but this one has a horizontal circulation, and omits some of the original features, notably the tilting facility.
Figure 2. The Lund wind tunnel, installed in 1994, has a test section measuring 1.20 × 1.08 m and a contraction ratio of 12.25. There is a honeycomb, 5 screens and a fine wire screen. The tilting arrangement allows for 8° climb to 6° descent. The closed-circuit arrangement is open at the test section, but closed everywhere else. Maximum speed 50 m/s.
Aerospace 02 00505 g002

2.2. Gliding Flight

The simplest way to use a bird to make its own measurements is to train it to hold a constant position in a wind tunnel, in which the air flow has been set by the experimenter. For example, just about any bird can be trained to fly in a wind tunnel, in a body of air that is moving slightly upward relative to horizontal, at a speed that is within its normal range [5]. By doing this over a range of speeds, and finding the minimum descent angle at which the bird can fly without flapping its wings, the basic “glide polar” can be found for the bird. This curve can be generalised, and used for gliding calculations in a wide range of birds. Unlike an engineer, you do not have to worry about small amounts of drag caused by poor wing-to-body junctions, because all birds are constantly modified by natural selection to deal with small performance defects, caused by minor variations of anatomy. Once the shape and size of wing are set to suit the bird’s life style (also by natural selection) the bird is optimised as well as it can be, to maximise performance. This type of optimisation only optimises species that already exist, and works over a period of many generations, but that is, of course, what biologists have to deal with.
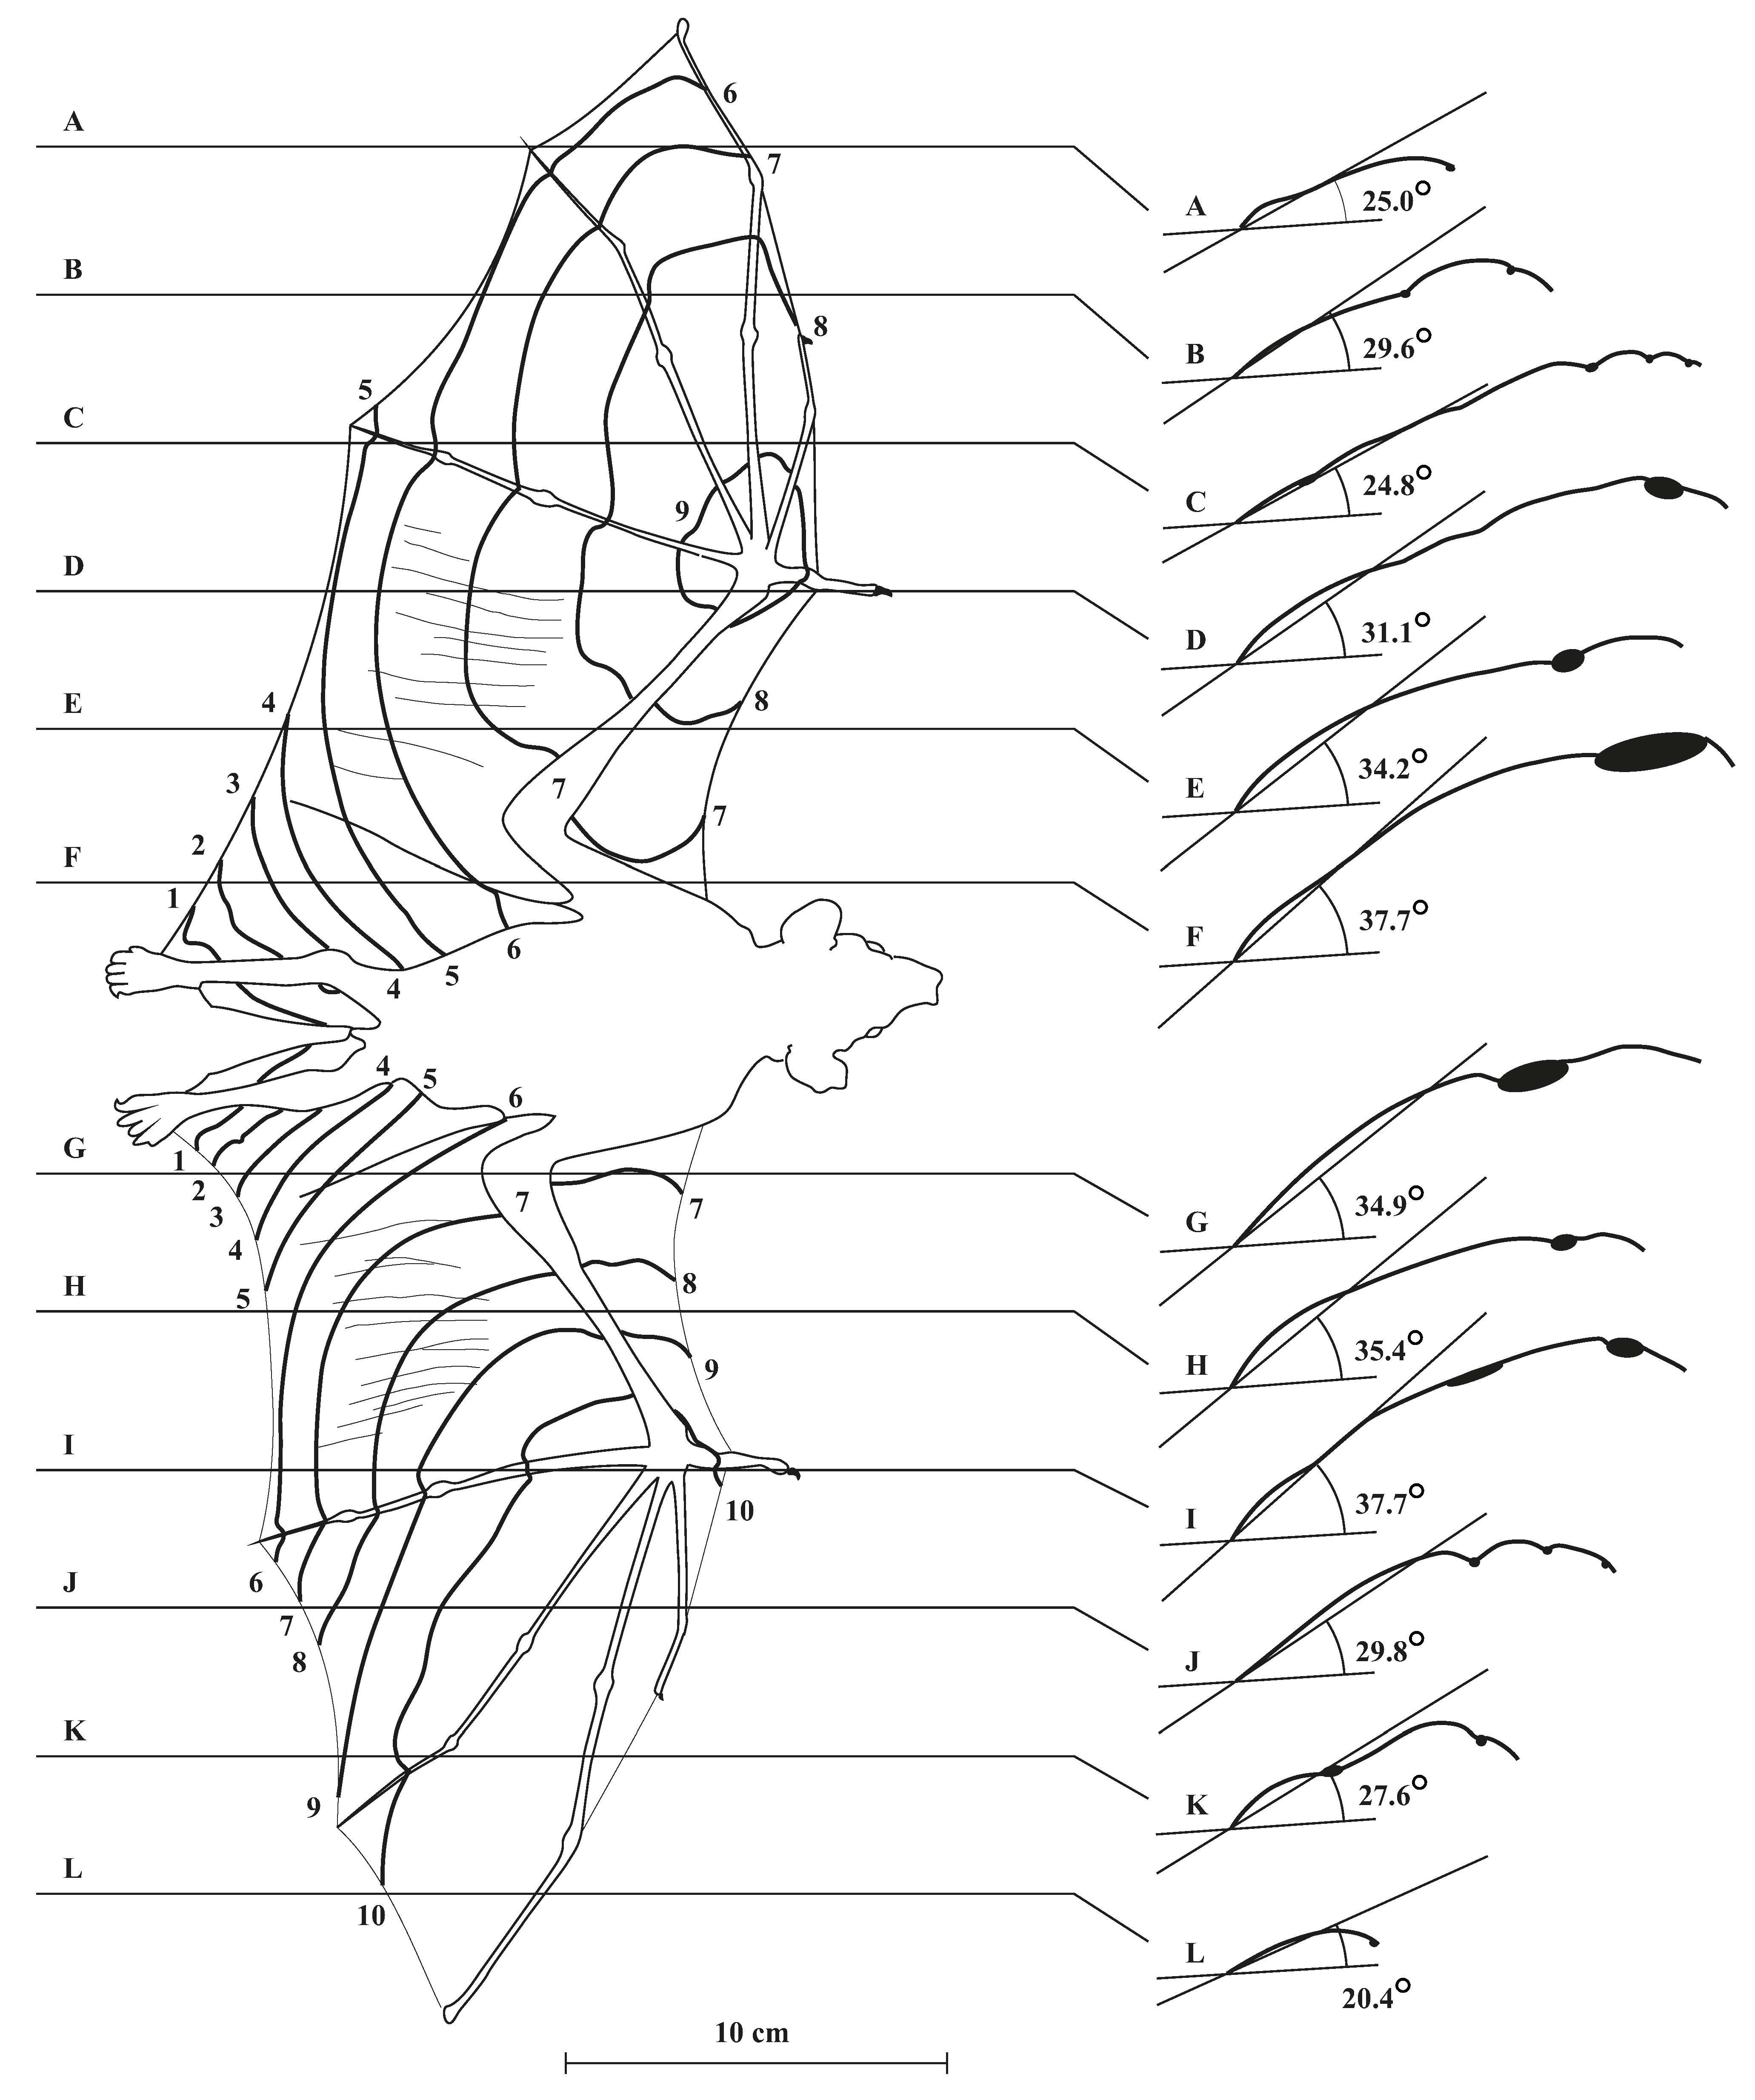
Figure 3. 
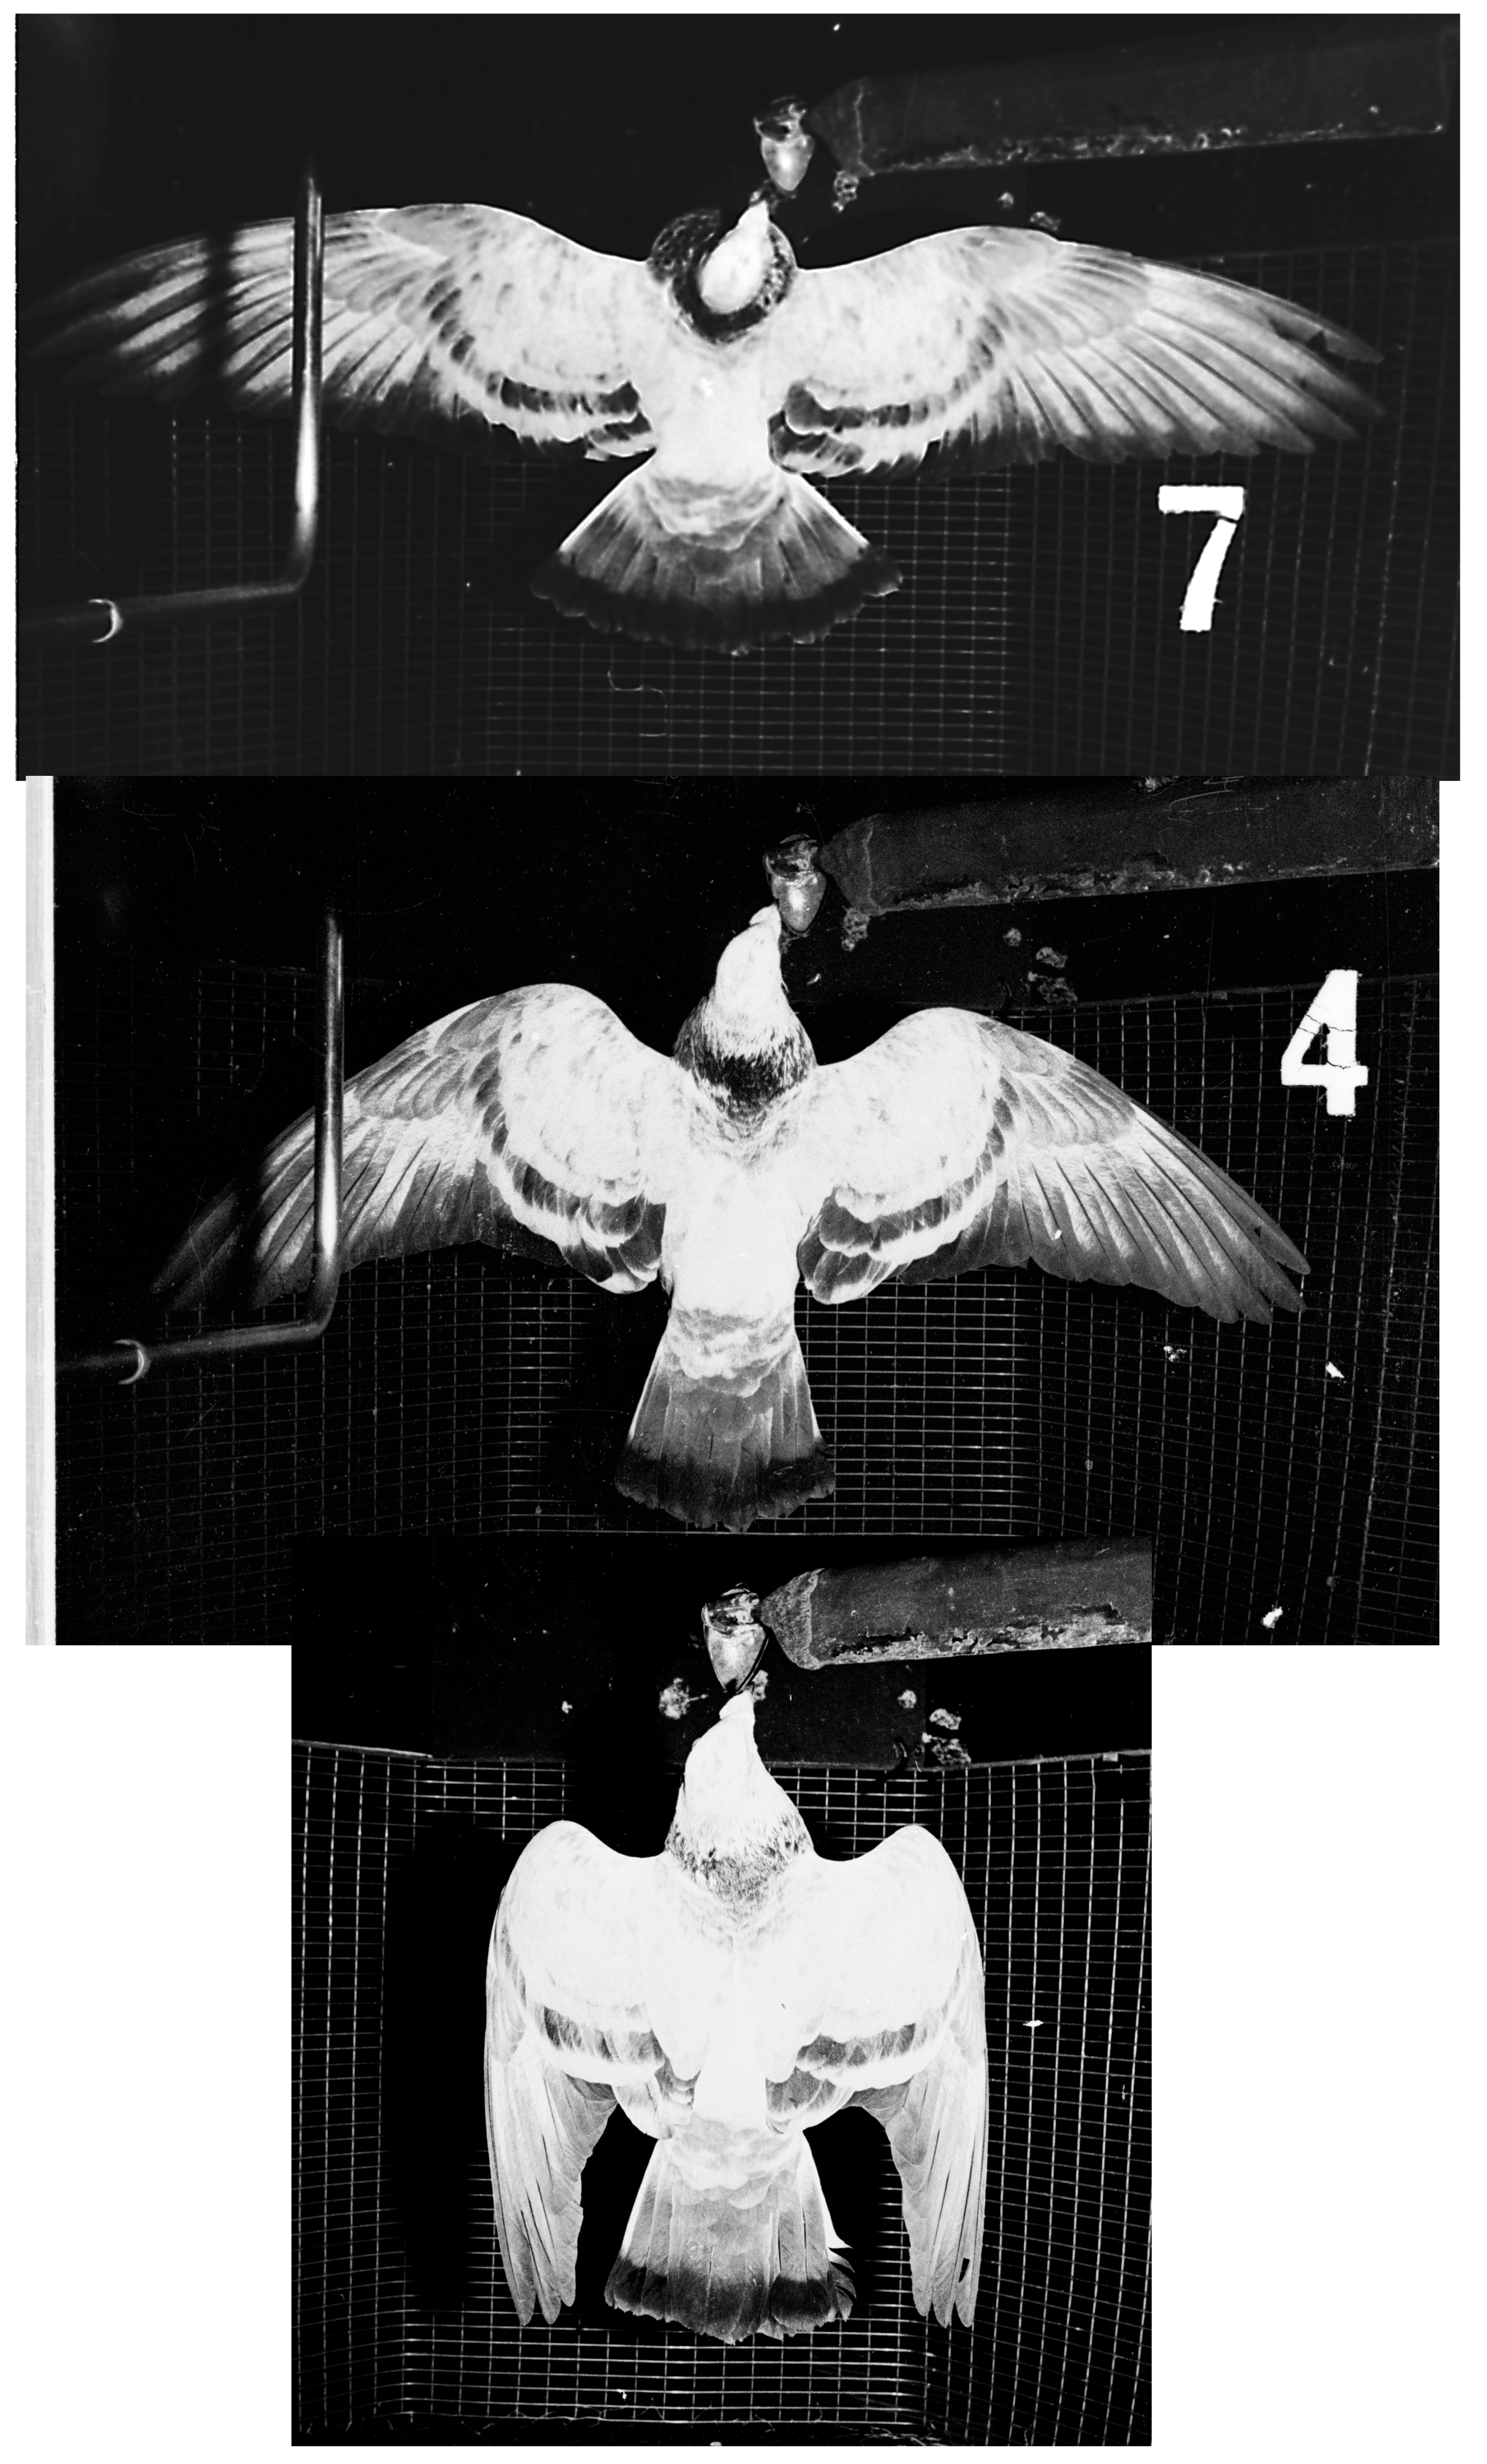
A pigeon gliding in the Bristol wind tunnel, showing planform variations with speed. There are no mechanical constraints with this in a bird wing, but there are in bat or pterosaur wings. The lift coefficient went from 1.3 to 0.3, not taking account of the tail area. It would have been much lower at high speeds, if the full span had been maintained.
Aerospace 02 00505 g003
A gliding pigeon (Figure 3) is quite a spectacle for a glider designer. In the first place, it gets unsteady at low speeds, but still flies nearly as well as before, if you put a rubber band around its tail to prevent it from spreading. How, then does it control its speed? The pigeon’s wings can move about the shoulder joints, forwards or back, upwards or down, and twisting nose-down or nose-up. To control speed, it moves them forward or back, like a hang-glider pilot. Moving the wings forward also spreads them to their greatest area, while moving them back allows the elbow and wrist joints to flex, so that the feathers of the wing slide inwards over one another, reducing the span and area of the wing. Fast-gliding birds can reduce their wing area and span to less than half the maximum values, without losing any strength whatsoever. This is possible because the bird wing is a multiple-spar design, with the shaft of each feather being a local spar for its own part of the wing. The same movement that adjusts the area of the wing also serves to control the area, by allowing the feathers to slide over one another. Varying the span is a better method of adjusting wing planform for speed than adjusting the chord, for instance by Fowler flaps. However, it involves a set of elbow and wrist joints, whose axes are out of line with each other, to allow various parts of the wing to be aligned, in a way that is unfamiliar in aircraft wings.

2.3. Measuring Drag

To generalise a measured glide polar, that is, adapt a measured polar to get new polars for other birds, you can add up sources of drag, starting with the drag of the feathered body, minus wings. If you try that, you get into trouble straightaway. If you take a dead bird, or stuffed or simulated one, no matter what you do, the air flow just separates from the body surface, and will not reattach. It gives a drag coefficient of 0.3 or more, like a football. As with all wind tunnel measurements on birds, trying to measure drag on parts of a dismembered bird is useless.
This problem was not solved until a way was found to measure a living bird’s body drag, without balances or any form of external measurement. It was noticed some years ago that this body drag coefficient is one of two morphological variables needed to calculate the speed (Vmp) at which a particular bird requires minimum power to fly level. The other one is the dimensionless variable k, which accounts for differences in lift distribution from the ideal ellipse. k can be got at from field observations of wild birds and is a little below 1, because of splayed feathers at the wing tips. The other variables for the calculation are easily measured, like wing span, gravity, air density and so on. The experiment for the body drag coefficient is to fly the bird level, and measure its wing beat frequency, where it is easy to show that the small variations of frequency vary directly with the power. If the drag coefficient is high, Vmp comes down, and if it is low Vmp goes up. You take a few dozen of those frequency curves, from the minimum to the maximum speeds at which the bird will fly horizontally, and having measured Vmp, you turn the equation round to get the body CD. A bird with no back load has a value around 0.1 or a bit less, but adding even small bits of plastic on the bird’s back sends its CD up sharply [6]. That is a serious problem for those of us who use satellite tracking to follow long-distance migrants, as we do not have an easy way to check increases of body drag, caused by add-on equipment boxes.

2.4. Power in Biology

A bird flying horizontally overcomes drag by flapping its wings about the shoulder joint. The flapping motion results in a mean horizontal thrust force, and this force, multiplied by the speed, is the power required from the flight muscles [6]. The power comes from the stress developed by the muscle, and the speed at which it can shorten, and these two variables set the power available for shortening in the muscles of birds of different size. Measuring a bird’s total drag is the starting point in any discussion of power requirements in level flight, but the drag itself is not a simple calculation, as in a fixed wing.
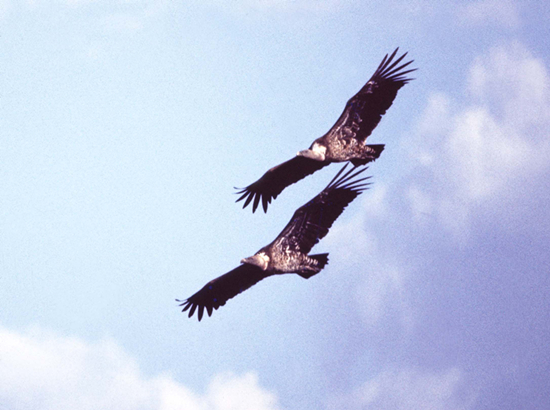
To measure the drag, you have to measure (or estimate) the rates of all processes in the living bird that require energy from fuel reserves. This begins with the basal metabolism, the power needed to keep the bird alive, which scales roughly with the 0.75 power of the body mass in birds of different mass. The mechanical power required to fly, neglecting comparisons, varies with about the 1.17 power of the mass. An African vulture requires less than 4% of its cruising power to stay alive, whereas a small passerine like a Goldcrest uses over 30% of its power for the same purpose. Also the small bird goes slower than the large one. Consequently small birds cannot afford any kind of migration strategy that wastes time, whereas large birds can use soaring procedures that cut their energy expenditure, at the expense of a lot of time spent soaring in thermals. The energy used in flapping the wings, and overcoming the drag of the wings also has to be expressed in terms of the fuel energy consumed, rather than of the work done. The task of calculating the power needed by a flapping wing is far beyond current experimenters, but can be handled by analogy methods, relating this work to the amount of work that would have to be done, without flapping the wings. The details of how that is done are in my book Modelling the Flying Bird [2].
Biologists know that using muscles to generate mechanical power results in the consumption of fuel, but they call this “metabolism”, and think of it as something that occurs during muscular activity, but not connected with other changes that occur in flight. They never measure the air density, or think about changing gravity. If the bird is “flying”, that is enough, and if it does manoeuvres like cyclical acceleration and deceleration, they are just ignored. Consequently, published measurements of the rate of fuel consumption when flying, which have been made by physiological methods, are not very helpful to the flight theorist. The key to using this approach for practical calculations is to define a speed Vmp, at which the bird requires less power to fly, than one flying faster or slower, and devise a practical way to measure it, which can be done by measuring wingbeat frequency in level flight.
Biologists like to do statistics on every kind of wing that is of interest to them, while those of us who study flight behave more like engineers, and define any bird by its mass, wing span and wing area, plus those environmental variables that affect the result, i.e., gravity and the air density. Having defined these primary variables, we can define others that follow, and combine the whole thing into a programme called Flight, which has been available from [2] for many years, and is essentially a model of a flying bird. If we have a bird and we know its measurements and the air density, then we also have a power curve for it, i.e., a curve that relates power required, and rate of loss of fuel, to the forward speed. The curve is severely constrained by natural selection, as we can see by thinking about birds that do not exist. If we extend our known measurements upwards to birds bigger than any that we know (20 kg and up), we find that the wingbeat frequency goes down, and the work done by each gram of muscle in each contraction goes up, until eventually the bird cannot fly at all, because the requirements for stress and strain are above the upper limit for flight muscles. There are no huge flapping birds. Beyond a certain size, there is no room for extra muscle to fly at Vmp, and well before that, the bird cannot lift extra load in the form of fuel, or do sudden manoeuvers to change speed or avoid obstacles. Current birds fly up to a body mass around 16 kg, where they have obvious difficulties, and there are none at all above 20 kg.
There was once a group of very large flapping animals, the last known pterosaurs of the Cretaceous period. At the end, for a short time, they had wing spans approaching 12 m, far more than earlier pterosaurs. We do not know what happened, but most probably the earth changed, by changing minerals in the mantle into a less dense form, and moving them outwards. This would reduce the surface gravity without changing the Earth’s mass [7]. If we extend the measurements down to miniature hummingbirds (3 g and down) the wingbeat frequency gets so high that the wing muscles do not have time to get ready for the next contraction, a problem that insects overcome with a different type of muscle, that develops low-amplitude contractions in the kilohertz range. Meanwhile, the regular-sized birds all have essentially the same anatomy, with adjustable mass, wing span and wing area. They obey the rules, and adjust everything together. The best combination of power and wingbeat frequency is found in medium-sized birds, especially waders of around 300 g, some of which fly over 10,000 km non-stop. Range performance fades to nothing in very small and very big birds.

2.5. Accuracy of Calculations

These arguments depend on calculating the power required in level flight, which we can do, but we can only check the accuracy of the results by looking at the performance of migrants. We got a chance to try this in 2008, when we were asked by the BBC to help tracking geese on their spring migrations [8]. We joined in a BBC radio project by Julian Hector, called “World on the Move” in which a great variety of animals were tracked as they migrated, and our job was to work out each goose’s remaining fuel, and show it on the website. When the birds were airborne, we had the help of the BBC weather department to get the winds and the groundspeeds. The GPS tracks gave the ground speeds, which were sometimes so low that it was clear that the birds had stopped, although this was not visible from the GPS points. We could calculate the power the geese needed to fly at the measured air speed, or sit on the ground, and the mass of fuel consumed.
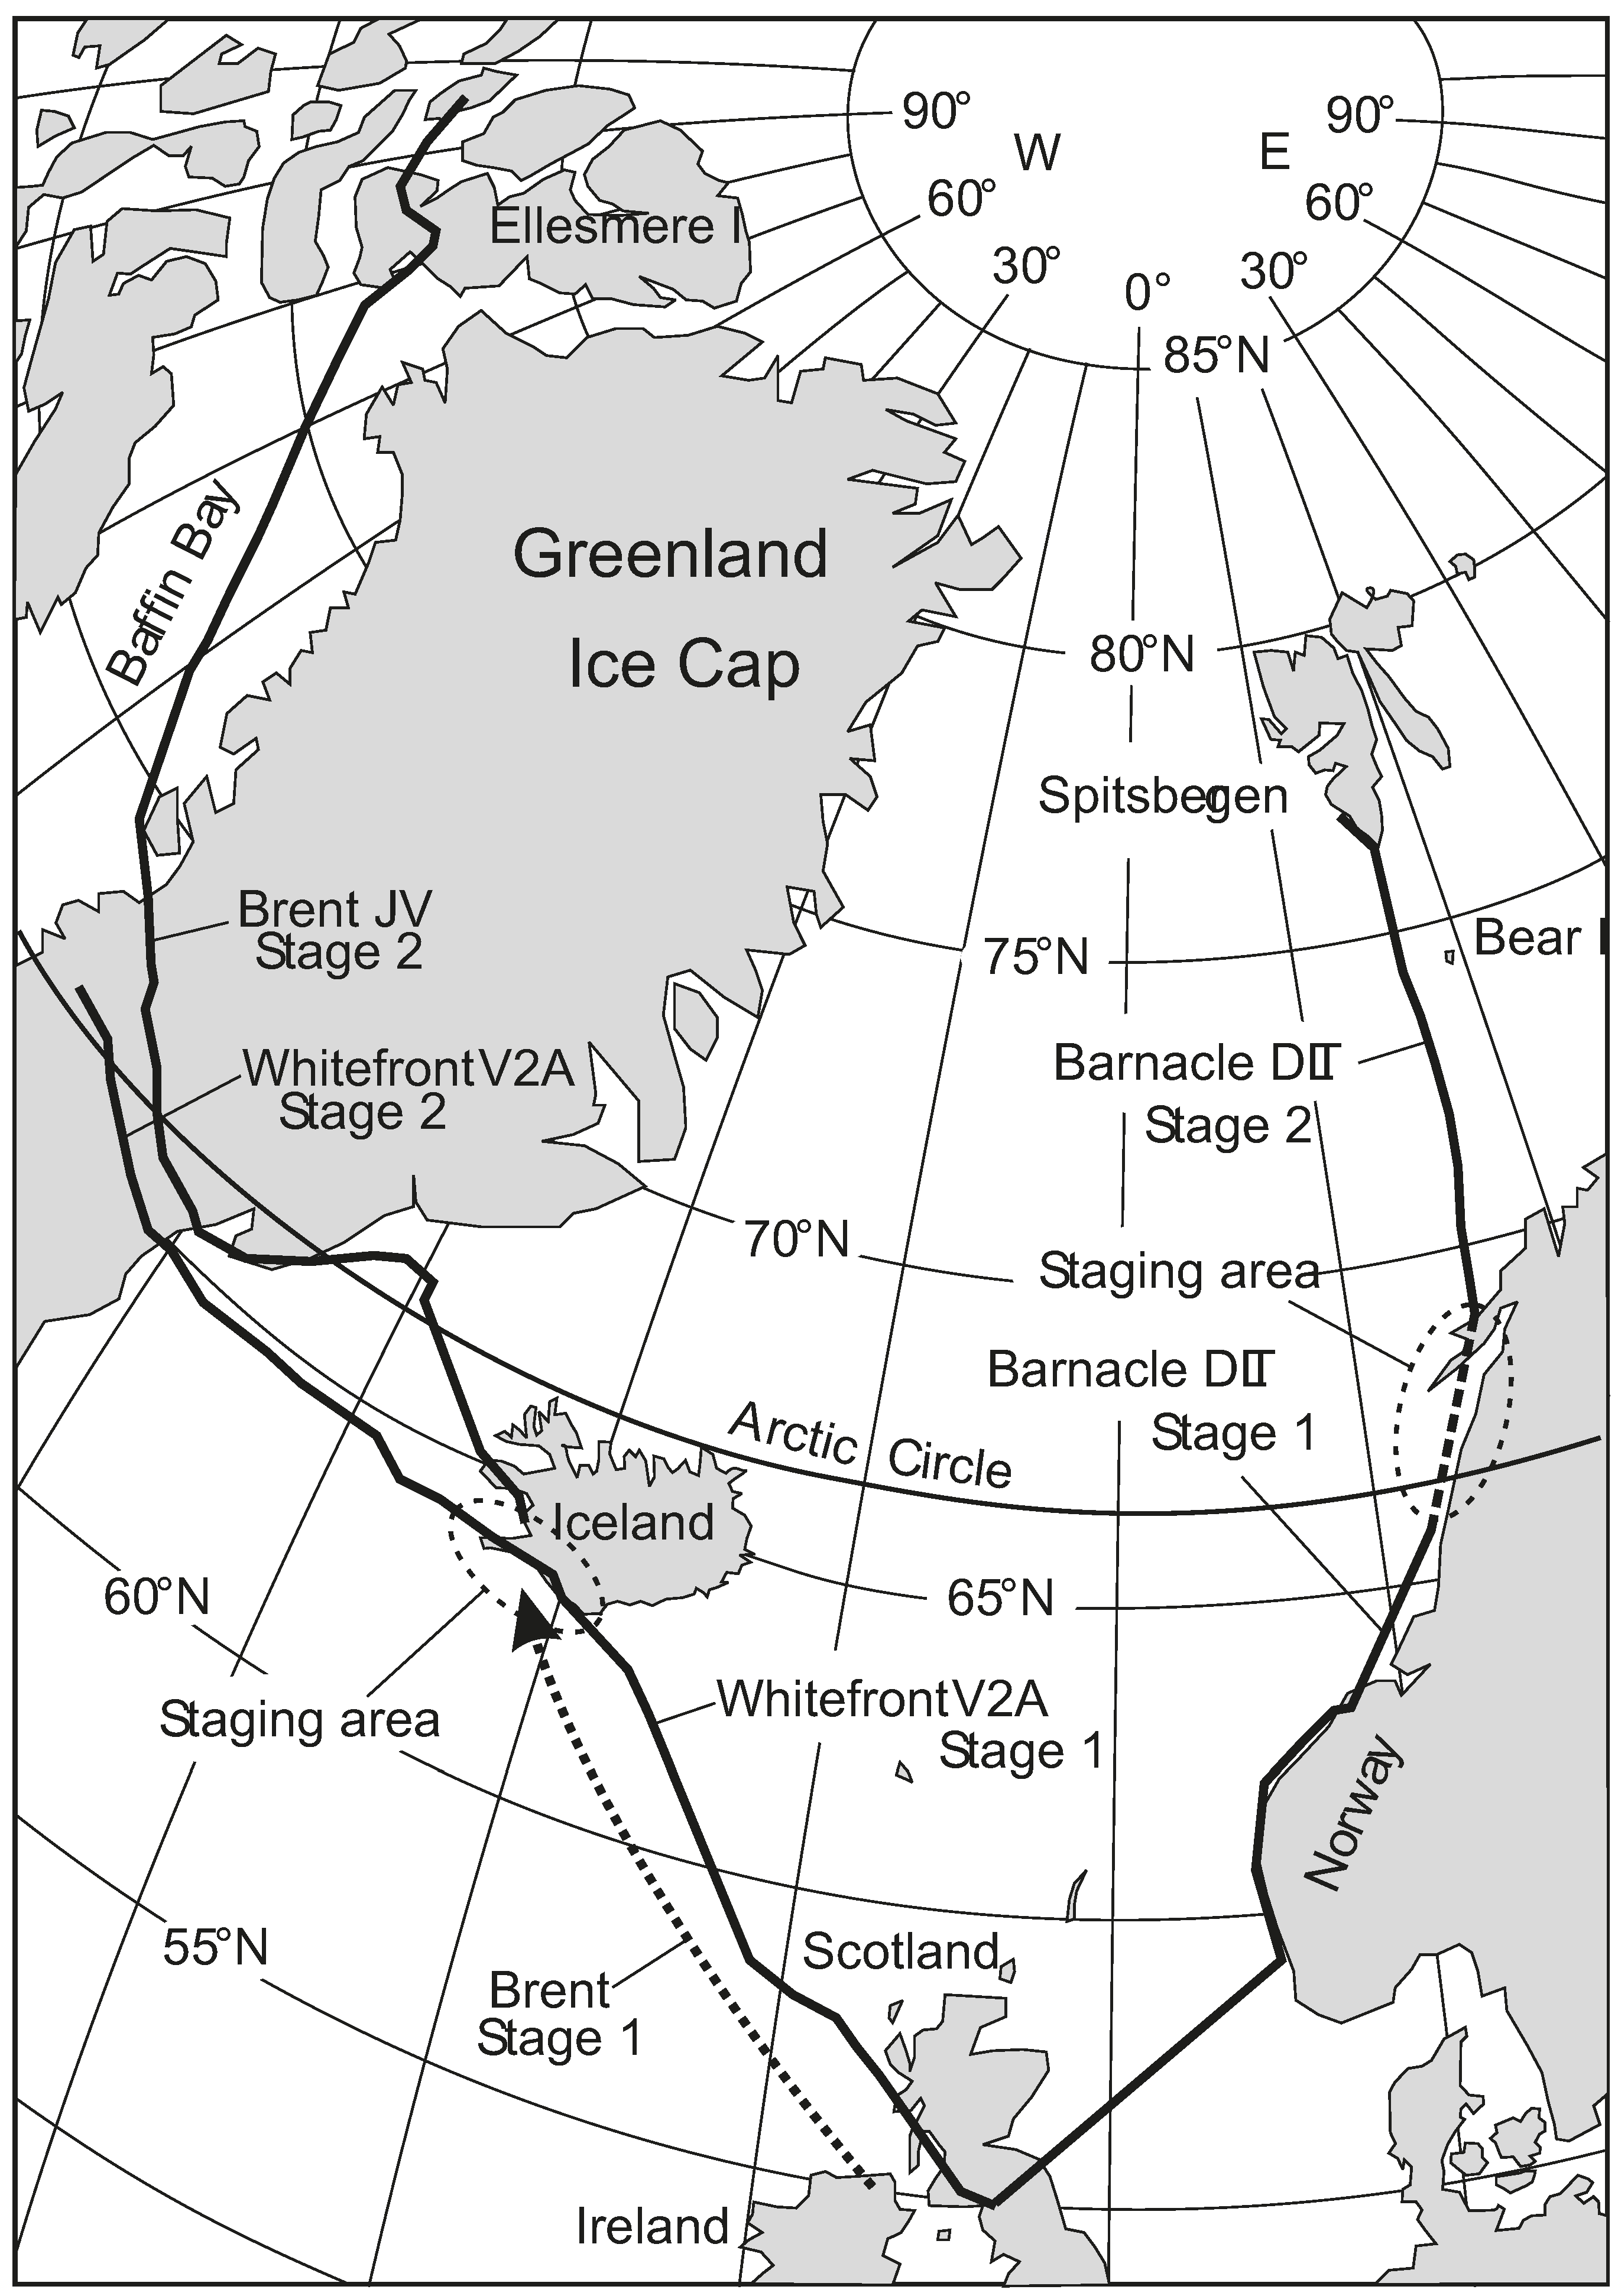
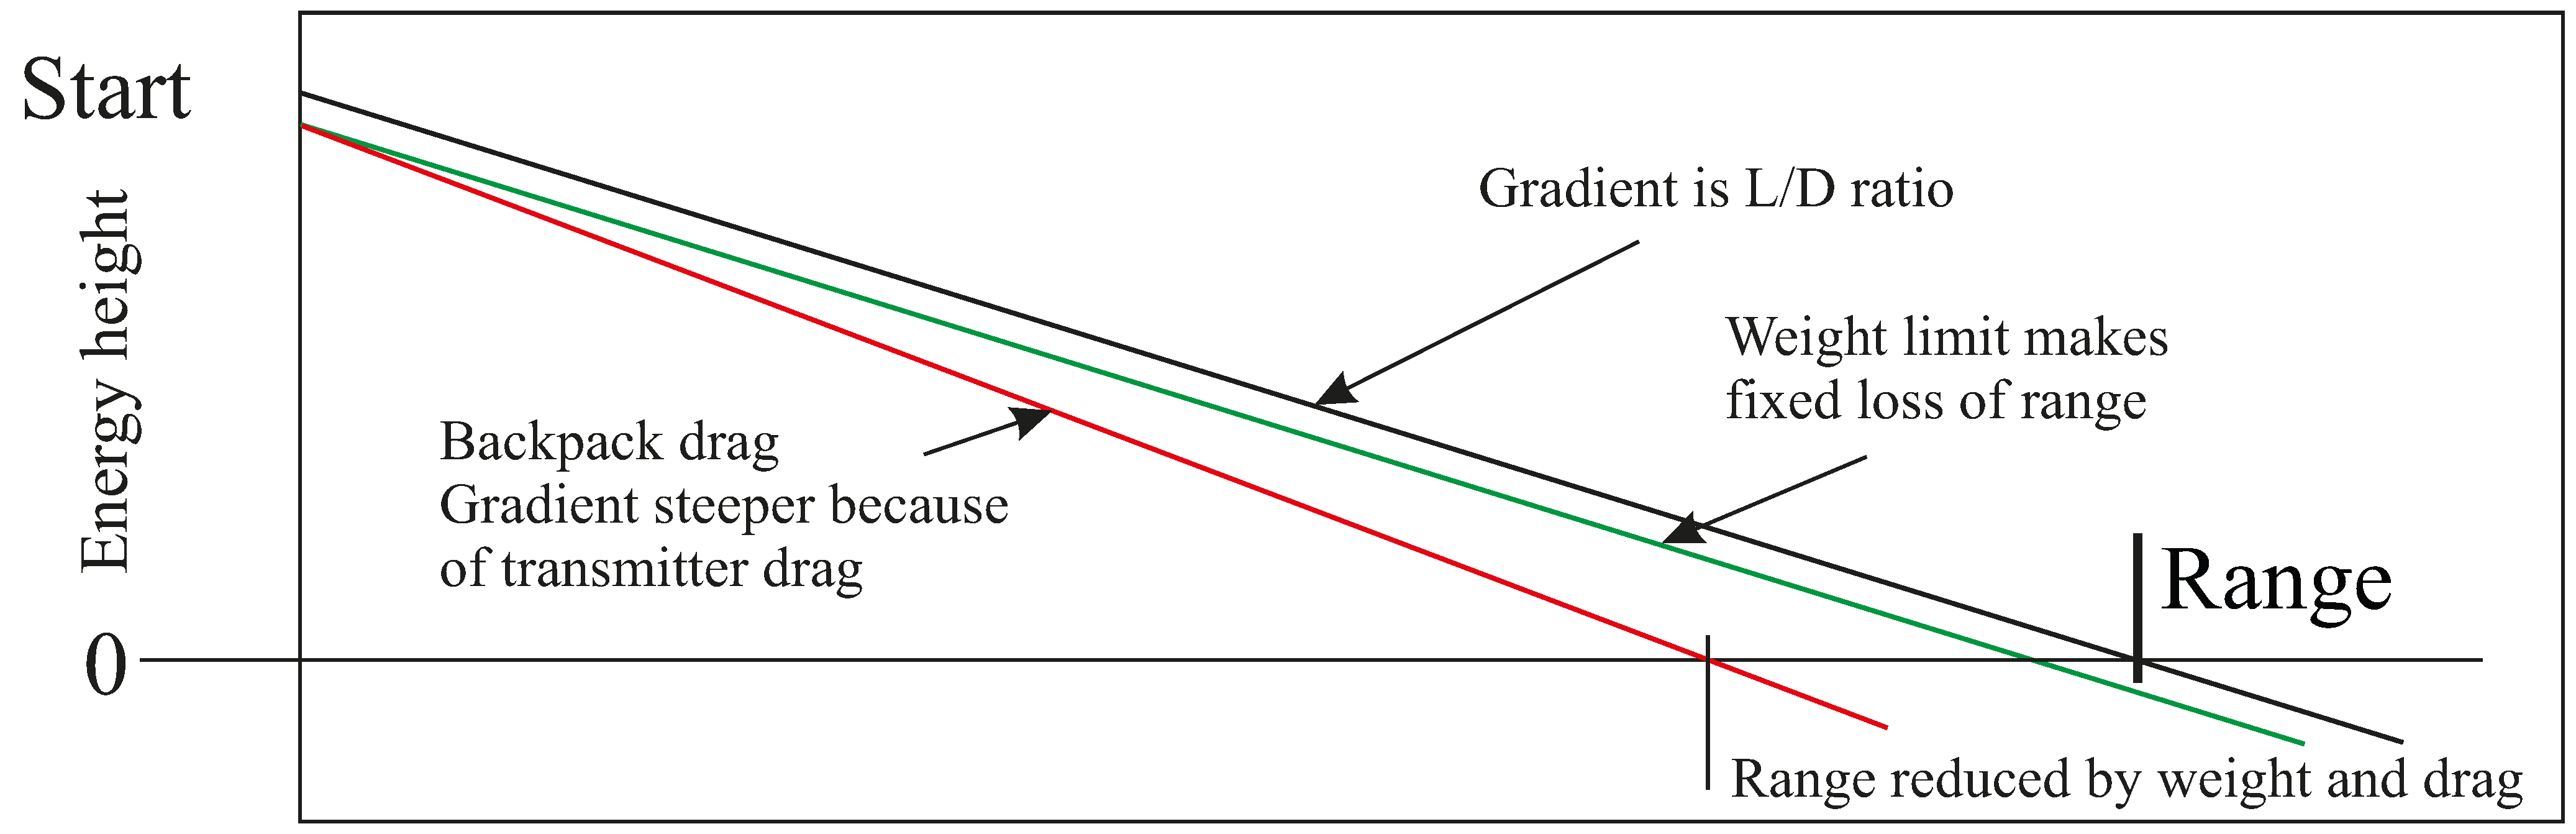
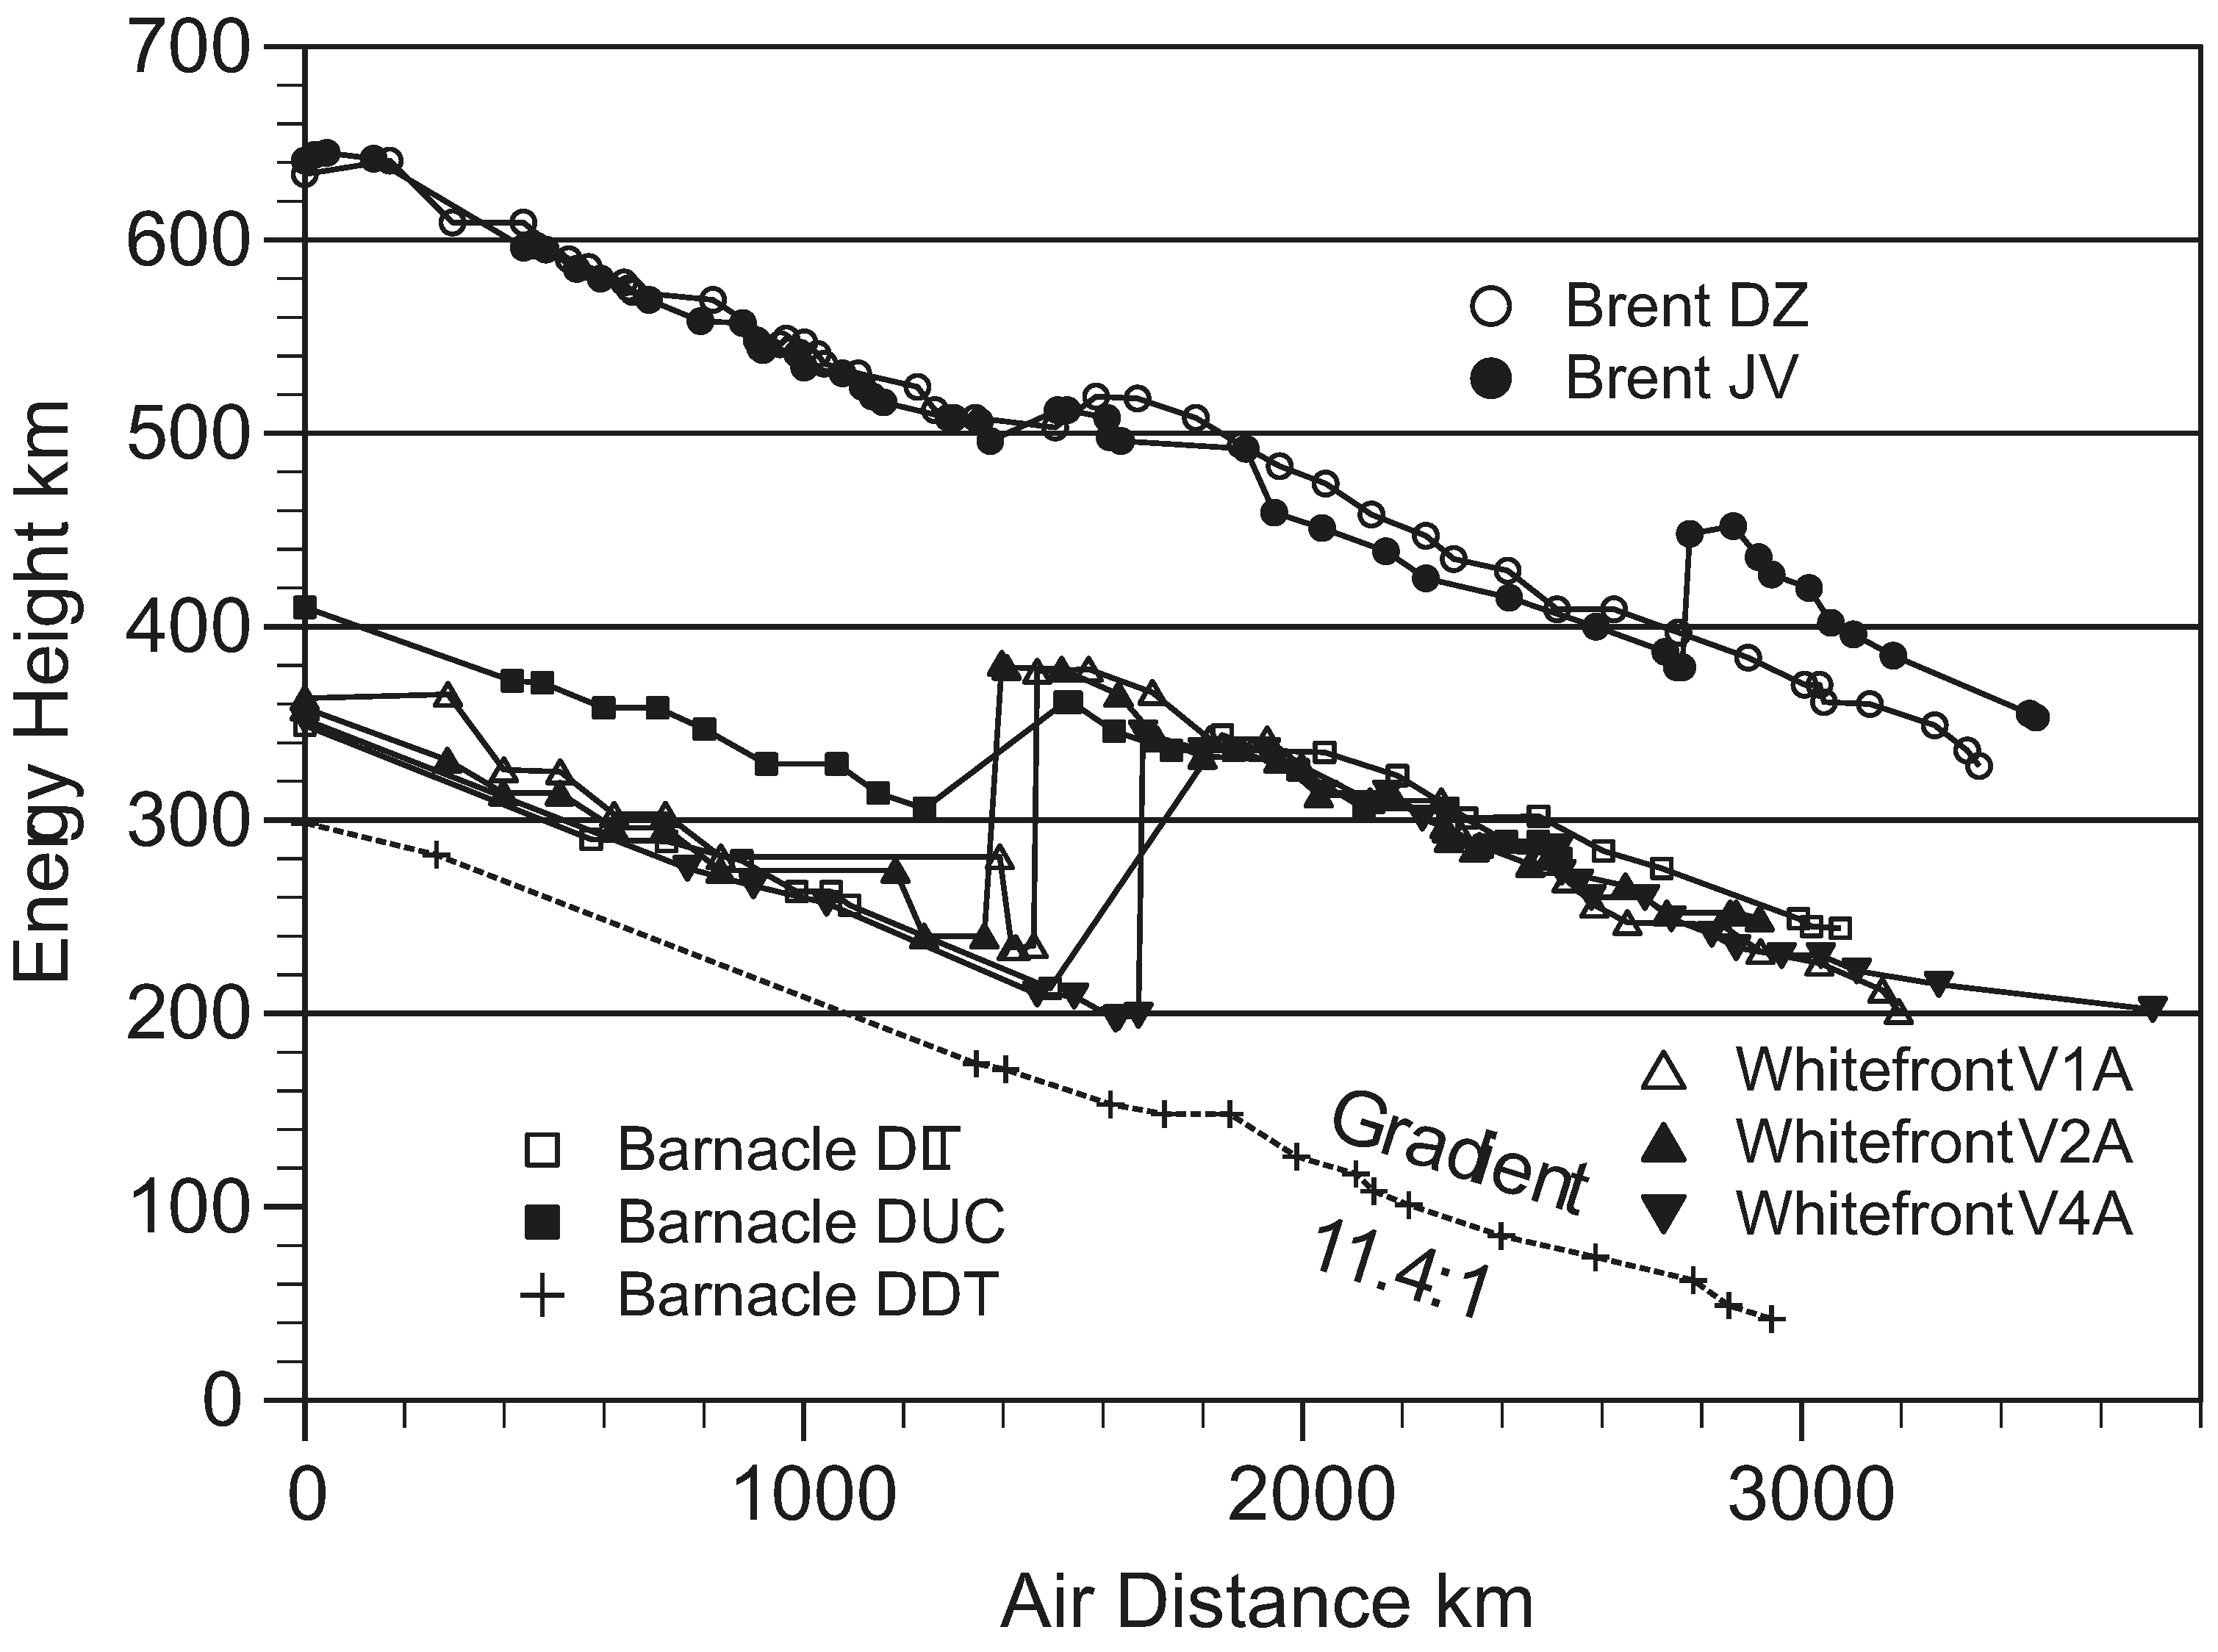
Figure 4 shows the routes that the different kinds of geese followed. We saw the climb up the Greenland ice cap, the increased speed at the top, and the fact that the big geese (Whitefronts) had trouble flying when they were up there and had to walk at times, while smaller geese (Brents) could fly over the top, and carry on up into Canada on the west side. We had estimates of starting fuel loads, and saw that these geese always arrive anywhere with at least 200 km of energy height in hand (more later), except when going south in autumn, when they crept into the wintering area without much fuel in hand. In other words, the predicted fuel amounts from the Flight programme gave quite a detailed idea of exactly how the geese set up their migratory flights, and showed that they did not stop for head winds, but just carried on, head wind or not. However, we had no direct way of checking whether our calculated fuel accounts were right, as we could not get at the birds when they were out in the wilds.
In its predictive format, the Flight programme prints out a list of the current values of 30 variables that change as the bird goes along, starting with the mass, the speed and the power. If we were to catch the bird over the ocean, those figures say what we would expect to see, if we were to catch and inspect the geese. Actually, the Lund wind tunnel was originally designed to make those checks possible, during a long flight in the wind tunnel. To do that, you have to swing a balance into the test section every hour or so, and stop the wind for a minute or two so that the bird can weigh itself. You also have to make provision so that the bird can control its flight speed, using sensors that determine whether the bird is creeping to the upstream or downstream end of the test section, and adjusting the speed accordingly. This arrangement of sensors and speed control was included in the original design [4], but it would require a lot of time to get all that working. The tunnel is all set up to monitor a flight lasting days, allowing the bird to set its speed, and keeping track of its weight, measuring fuel, speed and everything else as we go, but this has not yet been done.
Figure 4. Migration routes of the three species of geese tracked during the spring migration of 2008. Positions were GPS recorded, usually every 2 h.
Aerospace 02 00505 g004

3. Migration in Small Birds

Small birds have much the same density as bigger ones, and scaling effects see to it that their speeds for minimum power (Vmp) and maximum range (Vmr) can be calculated as in bigger birds. The winds are the same for any bird, and a goose that can cruise at 20 m/s does a lot better than a sparrow going at 10 m/s, in the same winds. Another general effect of scaling laws is that big birds have higher aspect ratios, like 9 for a goose, whereas little birds that flit about in the bushes typically have aspect ratios of 5 to 7. That means that if you think of migration range in terms of energy height (more below), the distance that each bird goes depends on its remaining energy height, and its lift:drag ratio. That is Breguet’s Law, and nothing else is involved. Small birds in general have smaller lift to drag ratios than large ones, and waste more energy on their basal metabolism, a biological energy ratio which is not otherwise needed in the range calculations themselves. Low cruising speed is a major waster of energy for small birds, as they use energy for basal metabolism (staying alive), and the smaller the bird, the bigger the fraction of the total power needed for that. They need to do something that allows them to increase their cruising speed, which will save on basal metabolism, without a big penalty in lift:drag ratio.
Scaling laws also show that swans can hardly find enough muscle power to fly, whereas blackbirds, whose muscles shorten at a higher frequency, have plenty of power for vertical take-off, sudden changes of direction and so on. Does a blackbird cruise along, using only half its flight muscle? Rather than that, it uses the whole muscle, at a higher frequency, but only for part of the time. The characteristic flight style of small birds (passerines) is “bounding”, in which the bird flaps for a few wingbeats, then closes its wings completely, and follows a parabolic flight path, with the wings closed, for a short time. As it needs the same mean power as before, for a shorter (flapping) time, the work done by each gram of muscle while flapping also goes up; the muscles work more efficiently at the higher power. If you work out Vmp and Vmr for a bird that is bounding, the bird works at full power as it pulls up while flapping, which brings the muscles into their most efficient operating range. The acceleration that a small bird can pull while flapping is about 4g, meaning that it can maintain a “power ratio” (flapping time/cycle time) down to 0.25. This may push its maximum range speed up by 11%, or more. Bounding is a peculiarly bird habit, and seen only in smaller species that are specialised to fly in this way. The effects of bounding on air speed have been observed in the field [9], and are included in the Flight programme. A wind tunnel study would be interesting, but would require more space for vertical movements than is available in any wind tunnel that exists at the moment.

4. Energy Height for Planes and Birds

All of this depends of calculating the bird’s fuel reserves in terms of its energy height, which is the height that the bird would get to, if all of its stored fuel were converted into height, using the engine (muscle) that it has. Figure 5 shows a bird starting from a known energy height. When the goose lands, the energy height continues going down (because of basal metabolism), and when the goose is moving, the energy height goes down a slope that is equal to its current lift:drag ratio. If our geese flew at their maximum range speed, they would come down on a gradient of about 19, but taking account of stops, they managed about 15 (Figure 6). No goose wants to arrive anywhere in spring below an energy height of 200 km, and those with longer ranges maintain 300 or 350 km. If the goose stops and feeds (and we knew where they did that), the energy height climbs up with little forward movement.
You work out the energy height from the current value of the fat fraction, which is the mass of consumable fat that the bird has on board, divided by the total mass of the bird (fuel and all). All birds with the same fat fraction and the same physiology come out at the same energy height, which is a logarithmic function of the fat fraction. The theory [10] says that the range is just the energy height multiplied by the lift:drag ratio. It would be simple to display energy height in a glass cockpit with an “energy altimeter”, a fact which has not escaped the engineers [11]. Any pilot can multiply this by the lift:drag ratio, and any bird watcher can do it from the Flight programme, which displays both the energy height and the L/D ratio.
Figure 5. “Energy height” calculated from the fat fraction, represents the bird’s fuel ratio, but does not reflect the bird’s size. The “descent” from energy height in level flight is the same as the bird’s lift-to-drag ratio. Extra drag uses up fuel continuously during a long flight, while the weight of the box may limit the amount of fuel that can be taken up initially, but has little other effect. The increased drag due to an added box (red line) consumes fuel whenever the bird is flying.
Aerospace 02 00505 g005
Figure 6. The energy heights achieved by different goose species are about 15:1, taking account of stops, as compared to a calculated maximum of about 19:1. Energy height is built up during feeding stopovers, and no goose wants to arrive anywhere below 200 km in spring. The Brent Geese, with the longest routes, stayed above 300 km. The fuel is not allowed to run low in spring migrations, but may do so in the autumn migrations.
Aerospace 02 00505 g006
Bird flight ranges are a little more complicated than those of aircraft, as all birds (it seems) have a dual fuel system in which the main energy supply source is fat. This is the best long-range fuel, because it can be stored in a non-hydrated form, which makes its energy density (3.9 MJ/kg) higher than for other forms of animal fuel. However, animals can also get usable energy by burning carbohydrate or protein, and a migrating bird, once it has been going for a few hours, no longer needs the amount of flight muscle that it needed to get airborne at the start [12]. That muscle becomes progressively surplus to requirements, so the bird burns it. Birds get most of the way by burning fat, and a lot further by burning their engines. The Flight programme takes account of this by taking the use of protein into account. This makes only a small difference on short flights, but a big difference to the range on longer routes, where the low energy density of hydrated protein means that burning a small amount of it gets rid of a lot of weight. Those godwits that migrate from Alaska to New Zealand started with a fat fraction of 0.55, and have enough fuel left to carry on to the South Pole, if they really wanted to do that.

5. Feathered Wings

5.1. The Feathered Surface

The bird skin structures (feathers) are often said to be just another variant of a modified reptile scale, and that may be so, but they are made of different protein from other reptile scales, and have some special properties of their own. Feathers are the only known skin covering structures that contribute directly to the structure of the animal, and they have nothing to do with the vaguely fibrous “feather-like” structures seen in fossils that are later in time than the earliest birds (lower Cretaceous). The shafts of a bird’s wing feathers form a distributive spar, which collects up the forces caused by the air flow on each feather, and sends it through the feather’s root to the bony skeleton (Figure 7). The bird wing is a “distributed spar wing”, not a “tension wing” as seen in bats and pterosaurs. The feathers not only form the structure of the wing, they determine its aerodynamics as well. The unusual shape of feathers is so distinctive that the first known bird feather from the early-bird fossil Archaeopteryx was known as “the feather” in the mid nineteenth century, and identified as coming from a bird, long before any other parts of these fossils were known [13]. It has a central rhachis (shaft), which is shaped to collect up the bending and torsional moments developed by the vanes, and deliver them through the root of each feather, to the bony skeleton of the arm. If a feather is lost, there is a gap in the wing, but the wing as whole continues to work, unlike a bat or pterosaur wing, which collapses if a part of the bony structure is lost. The whole structure of the bird wing, made of feathers, can be shed by molting, once per year or more often, and replaced.
Figure 7. The shaft of a Greylag Goose secondary flight feather is made of keratin, and has a second moment of area that carries the bending and torsional loads of that feather (not of other feathers). The late-Jurassic Archaeopteryx fossils had wing feathers exactly like this, showing that the bird wing was developed in Jurassic times. This was about 110 million years before the extinction of the pterosaurs, which had no such structures.
Aerospace 02 00505 g007

5.2. Lowson’s Contribution

It has been noted above that a feather-covered non-lifting bird body behaves in a way of its own, and that its lack of drag seems to be something to do with the feathered covering. The late Prof. Martin Lowson, formerly head of Aero Engineering at Bristol, studied the lifting of feathers in reversed flow, both on wings and bird bodies, but had trouble with referees in biological journals, and had not published this at the time of his death in 2013. He produced both theoretical and observational grounds that this lifting can be controlled by muscles under the skin, and can be used to defer or reverse flow separation, both on lifting and body surfaces. The Lund wind tunnel has a PIV system devised and installed by Geoff Spedding of the University of Southern California [14], whose primary purpose is to map the wake velocities, downstream of a small bird in flapping flight. Observers trying to observe separated flow with this device easily detected it in wing models, but had great difficulty in seeing any such effects behind a flapping wing of a live bird. The feathered surface clearly has something to do with these effects, and the PIV system might be able to find out how it works at the level of individual feathers, with respects to Prof. Lowson.

6. Tension Wings

6.1. The Tension Wing of Bats

There is another type of modern wing, that of bats, which started from nothing after the loss of the dinosaurs, and developed alongside the post-dinosaur birds. Fruit bats were flown in Nairobi with the original blower tunnel (Figure 8) [15,16]. It allowed 3-dimensional stereo pictures of the wing membranes to be obtained, which were good enough for rough lift and drag analysis, and showed gliding performance much like a pigeon. Several species of small insectivorous and nectar-eating bats have been flown in the Lund wind tunnel, mainly to observe their wakes with the PIV installation [17]. Bat wings are held in shape by a skeletal framework, stretching a membrane that has no stiffness of its own, and is not stiff in itself, as bird wings are. In flight the planform has only a limited degree of variability of shape, because relaxing the muscles that hold the framework in shape also takes the tension out of the main membrane. Bats have a wholly different system of muscle fibres in the membrane, which tighten up to reduce its curvature, without connecting with the skeleton. Their wings are exceptionally good at low-speed manoeuvring flight, but are not general purpose wings, adaptable like those of birds for swimming, running on the ground, catching other birds in the air and so on. Birds use every kind of habitat known to mammals, whereas bats are fruit and honey eaters, and (especially) catchers of slow-flying insect prey. Bat eyes do not dominate their skull, and they are mostly nocturnal animals with senses that are based around hearing. Bats go up to the size of a small goose, and do not reach the size of swans, or do the long-distance migrations that are so familiar in birds.
Figure 8. A Rousettus fruit bat gliding at Nairobi in the original Bristol blower tunnel, illuminated by a flashgun shining upwards through the wing. This is one frame of a stereo pair. All the strength comes from the bones of the skeleton, not from the membrane itself. The bat cannot adjust its wing in the manner of Figure 3, as this would unload the membrane. The thin muscles in the membrane, which do not attach to the skeleton, are used to flatten the wing profile at higher speeds. The sections are all convex at low speed, but the bat flew perfectly steadily, with no signs of instability.
Aerospace 02 00505 g008

6.2. The Tension Wing of Pterosaurs

It would be an error to think of birds as being permanently the best flying animals, although they have held that position for some millions of years. Their modern time began in the Palaeocene, when a few birds survived from the disaster that finished the dinosaurs, probably an impact with a small asteroid about 65 million years ago. Their rivals, the pterosaurs [18] disappeared from the fauna, along with all the remaining dinosaurs, never to return. The period from about 250 million years ago up till 65 million years ago followed the great extinction which ended the preceding Permian period. At some time in the Triassic period, which followed the great Permian extinction, both the birds and the pterosaurs started from scratch, as non-flying arboreal creatures, living in the trees of the time. Their anatomy is radically different from the start, showing the contrast between the multiple-spar wing, built around feathers (above), and the tension wing seen in the pterosaurs. The pterosaur wing [19] is made up from a flexible protein membrane, which (unlike feathers) has no strength to resist the bending and torsional moments developed by a wing. The resistance to these forces comes not from the wing area itself, but from the bony framework surrounding it, made up from the side of the body and the arm skeleton, which had just one extremely elongated wing finger along the leading edge. The wing was held in shape by the muscles controlling the body framework, and when these muscles relaxed (as in death) the wing simply collapsed. It is like a hang glider wing, but not like a bird wing, which does not collapse when the bird dies. Figure 9 is a reconstruction of an early pterosaur wing from about 150 million years ago. It had an elastic membrane which was pulled into shape by the muscles, and required the side of the body to be suitably shaped to hold it in position, whereas the bird wing shape does not depend on the shape of the body or legs. Figure 9 shows some differences from the common reconstruction of pterosaurs.
The astonishing thing about this is that the very same German Jurassic rocks, from Solnhofen in Bavaria, that held the fossils of Archaeopteryx, the first known bird, also held a good selection of pterosaurs from the same time and habitat. This was not the end of the pterosaur time, but the middle, and the really big pterosaurs were then still millions of years in the future. How, then did birds and pterosaurs carry on side by side throughout the Cretaceous period of time, another 60 or so million years, which ended with the destruction of the dinosaurs and pterosaurs? Why did not birds, with much better wings, replace the pterosaurs? In my view there is a reason for that, and it is to do with the automatic homing system that bird that modern birds (the few survivors) have built into their brains. They have a time sense that will keep track of time within seconds for months at a time, in the absence of external stimuli, and the ability to do trigonometry relating a currently observed plane (the horizon) to a world-sized sphere. That is all it takes to navigate anywhere on earth [20]. It is not unlikely that just one group of birds could do that at the time of the loss of dinosaurs, and that they were the only ones that were able to survive, and become the ancestors of all modern birds.
Figure 9. Reconstruction of a blackbird-sized pterosaur. (A) Wing skeleton without membrane; (B) The wing is pulled open by the wrist muscle (Fmusc), and elastic fibres in the membrane maintain tension as it is stretched; (C) The surface wrinkles (“stiffening fibres”) are surface features that only appear when the membrane contracts, especially when it is dead; (D) The elongated 5th toe stretches the trailing-edge tendon.
Aerospace 02 00505 g009

7. Why Study Birds?

Ornithologists, like biologists of any kind, want to know where birds came from, and (nowadays) what the potential of flying animals might be, on planets that differ from our own home, here on Earth. We have, effectively, one good wind tunnel in Lund in which to continue this study, and another at Seewiesen that is missing some features. We have a theory that predicts in some detail what migrating birds can do, and how their bodies work in long-range flights like those of the BBC geese [8]. Despite the evidence presented, current bird watchers seem reluctant to believe that it really is possible to estimate the physical details of a migration flight. That may be because we do not have direct observations of real birds, to see whether their behavior is as predicted by the theory. The facilities to test this were built into the Lund wind tunnel, which can simulate long migratory flights. The bird can set the flight speed, and the tunnel can be stopped at any time to weigh the bird, and check its body composition. The theory predicts in detail what the bird should do in these circumstances, and checking this is a matter of training and prolonged experiments, to see whether the theory is basically correct, and amenable to fit what birds actually do. Bird watchers assume that the results in [8] are from a theory about geese, but they are not. The Flight programme applies to any birds whose wing span, wing area and mass are known, flying in air of known density, with a known strength of gravity. Testing it on any bird, in any wind tunnel, will test it for all.
I say [7] that modern birds are not like other animals. The birds that survived the dinosaur crash are the only living animals with a fully automatic, long period, spherical celestial navigator that works without modification anywhere in the world. Disprove it if you can.

Acknowledgments

My views come from watching birds and from arguments with pilots and birdwatchers alike. It is a pleasure to thank them all.

Conflicts of Interest

The author declares no conflict of interest.

References

  1. Pennycuick, C.J. A wind tunnel study of gliding flight in the pigeon Columba livia. J. Exp. Biol. 1968, 49, 509–526. [Google Scholar]
  2. Pennycuick, C.J. Modelling the Flying Bird; Elsevier: Amsterdam, The Netherlands, 2008. [Google Scholar]
  3. Hill, A.V. The dimensions of animals and their muscular dynamics. Sci. Prog. 1950, 38, 209–230. [Google Scholar]
  4. Pennycuick, C.J.; Alerstam, T.; Hedenström, A. A new wind tunnel for bird flight experiments at Lund University, Sweden. J. Exp. Biol. 1997, 200, 1441–1449. [Google Scholar] [PubMed]
  5. Pennycuick, C.J. Power requirements for horizontal flight in the pigeon Columba livia. J. Exp. Biol. 1968, 49, 527–555. [Google Scholar]
  6. Pennycuick, C.J.; Fast, P.L.F.; Ballerstädt, N.; Rattenborg, N. The effect of an external transmitter on the drag coefficient of a bird’s body, and hence on migration range, and energy reserves after migration. J. Ornithol. 2011, 153, 633–644. [Google Scholar] [CrossRef]
  7. Pennycuick, C.J.; Pennycuick, S. Birds Never Get Lost; Troubador: Leicester, UK, 2015. [Google Scholar]
  8. Pennycuick, C.J.; Griffin, L.R.; Colhoun, K.; Angwin, R. A trial of a non-statistical computer program for monitoring fuel reserves, response to wind and other details from GPS tracks of migrating geese. J. Ornithol. 2011, 152, 87–99. [Google Scholar] [CrossRef]
  9. Pennycuick, C.J. Speeds and wingbeat frequencies of migrating birds compared with calculated benchmarks. J. Exp. Biol. 2001, 204, 3283–3294. [Google Scholar] [PubMed]
  10. Pennycuick, C.J. The concept of energy height in animal locomotion: Separating mechanics from physiology. J. Theor. Biol. 2003, 224, 189–203. [Google Scholar] [CrossRef]
  11. Merkt, J.R. Flight energy management training: Promoting safety and efficiency. J. Aviat. Technol. Eng. 2013, 3, 24–36. [Google Scholar] [CrossRef]
  12. Piersma, T.; Gill, R.E. Guts don’t fly: Small digestive organs in obese bar-tailed godwits. Auk 1998, 115, 196–203. [Google Scholar] [CrossRef]
  13. Wellnhofer, P. Archaeopteryx the Icon of Evolution; Pfeil: Munich, Germany, 2009. [Google Scholar]
  14. Hedenström, A.; Rosen, M.; Spedding, G.R. Vortex wakes generated by robins Erithacus rubecula during free flight in a wind tunnel. J. R. Soc. Interface 2006, 3, 263–276. [Google Scholar] [CrossRef] [PubMed]
  15. Pennycuick, C.J. Gliding flight of the dog-faced bat Rousettus aegyptiacus, observed in a wind tunnel. J. Exp. Biol. 1971, 55, 833–845. [Google Scholar]
  16. Pennycuick, C.J. Wing profile shape in a fruit bat gliding in a wind tunnel, determined by photogrammetry. Period. Biol. 1973, 75, 77–82. [Google Scholar]
  17. Hedenström, A.; Muijres, F.T.; von Busse, R.; Johansson, L.C.; Winter, Y.; Spedding, G.R. High-speed stereo DPIV measurement of wakes of two bat species flying freely in a wind tunnel. Exp. Fluids 2009, 46, 923–932. [Google Scholar] [CrossRef]
  18. Wellnhofer, P. The Illustrated Encyclopedia of Pterosaurs; Salamander: London, UK, 1991. [Google Scholar]
  19. Pennycuick, C.J. On the reconstruction of pterosaurs and their manner of flight, with notes on vortex wakes. Biol. Rev. 1988, 63, 299–331. [Google Scholar] [CrossRef]
  20. Pennycuick, C.J. The physical basis of astro-navigation in birds: Theoretical considerations. J. Exp. Biol. 1960, 37, 573–593. [Google Scholar]

