Article

A CNN-GRU Hybrid Model for Predicting Airport Departure Taxiing Time

1
State Key Laboratory of Air Traffic Management System, Nanjing 211106, China
2
College of Civil Aviation, Nanjing University of Aeronautics and Astronautics, Nanjing 211106, China
3
College of Computer Science and Technology, Nanjing University of Aeronautics and Astronautics, Nanjing 211106, China
*
Author to whom correspondence should be addressed.
Aerospace 2024, 11(4), 261; https://doi.org/10.3390/aerospace11040261
Submission received: 29 December 2023 / Revised: 19 March 2024 / Accepted: 25 March 2024 / Published: 27 March 2024

Abstract

:
Scene taxiing time is an important indicator for assessing the operational efficiency of airports as well as green airports, and it is also a fundamental parameter in flight regularity statistics. The accurate prediction of taxiing time can help decision makers to further optimize flight pushback sequences and improve airport operational efficiency while increasing flight punctuality. In this paper, we propose a hybrid deep learning model for departure taxiing time prediction based on the new influence factors of taxiing time. Taking Pudong International Airport as the research object, after analyzing the scene operation mode, we construct the origin–destination pairs (ODPs) with stand groups and runways and then propose two structure-related factors, corridor departure flow and departure flow proportion of ODP, as the new features. Based on the new feature set, we construct a departure taxiing dataset for training the prediction model. Then, a departure taxiing time prediction model based on convolutional neural networks (CNNs) and gated recurrent units (GRUs) is proposed, which uses a CNN model to extract the high-dimensional features from the taxiing data and then inputs them to a GRU model for taxiing time prediction. Finally, we conduct a series of comparison experiments on the historical taxiing dataset of Pudong Airport. The prediction results show that the proposed hybrid prediction model has the best performances compared with other deep learning models, and the proposed structure-related features have high correlations with departure taxiing time. The prediction results of taxiing time for different ODPs also verify the generalizability of the proposed model.

1. Introduction

The departure taxiing time of a flight is defined as the interval from the off-block time to the moment of actual take-off, following the clearance provided by ramp control. Taxiing time serves as an important indicator reflecting the operational efficiency of an airport. Accurately predicting the taxiing time before flight pushback helps optimize the pushback sequence, thus improving airport traffic, reducing taxiing delays, and enhancing the utilization efficiency of taxiing ways and runways. Currently, a common practice among domestic airports is to determine the off-block time for departing flights by subtracting a fixed taxiing time from the takeoff time. However, this static method fails to consider factors like the specific layout of the airport, the availability of parking spaces, and the scene traffic flow. For large and busy airports, taxiing time vary greatly from flight to flight. Therefore, the value of taxiing time obtained by using a uniform calculation method will have a large error with the actual value. If we cannot accurately predict the taxiing time of each flight, we will not be able to make reasonable arrangements for the flight departure process, which will certainly affect the overall operational efficiency of an airport.
Existing studies on taxiing time prediction have seen a transition from simulation methods to machine learning techniques in terms of prediction methodologies. For instance, references [1,2], among others, employed simulation methods for taxiing time prediction. Meanwhile, refs. [3,4,5,6,7,8] and other studies utilized machine learning methods, including random forest, neural networks, and support vector machines, highlighting the superiority of machine learning approaches. In feature studies, there has been a predominant focus on macro features like taxiing distance and scene flow [9,10,11]. However, micro features, especially those tied to scene structure, have been largely overlooked. A significant portion of these studies emphasize predicting the taxiing time of flights that are characterized by short durations and high dynamics. These predictions are challenging due to their need for high accuracy, making them less suitable for practical applications. In contrast, estimating the average taxiing time offers a broader perspective, allowing for a general prediction of taxiing dynamics in subsequent hours. This is achieved by incorporating both macro and micro features of the scene. Such an approach serves a dual purpose: it caters to the demand for high precision in short-term dynamic predictions and also paves the way for optimal early calculated take-off time (CTOT) and calculated off-block time (COBT) allocation.
To address the limitations of the existing work, we first analyze the scene structure and traffic flow characteristics of Pudong International Airport and propose two new features: corridor departure flow and departure flow proportion which serve as the foundation for constructing both the feature set and the dataset aimed at predicting departure taxiing time. Taking advantage of deep learning technology, we introduce a model based on convolutional neural networks (CNNs) and gated recurrent units (GRUs) for predicting departure taxiing time. In this model, a CNN is employed to uncover relationships in the data, while a GRU captures the dynamic variations inherent to the data. Finally, comparison experiments are applied to make predictions on the historic traffic flow data of Pudong International Airport to verify the effectiveness of the proposed features and prediction model.
The main contributions of this paper can be summarized as follows:
(1)
Two new features, corridor departure flow and departure flow proportion, are proposed to further improve the departure taxiing time feature set as well as the dataset.
(2)
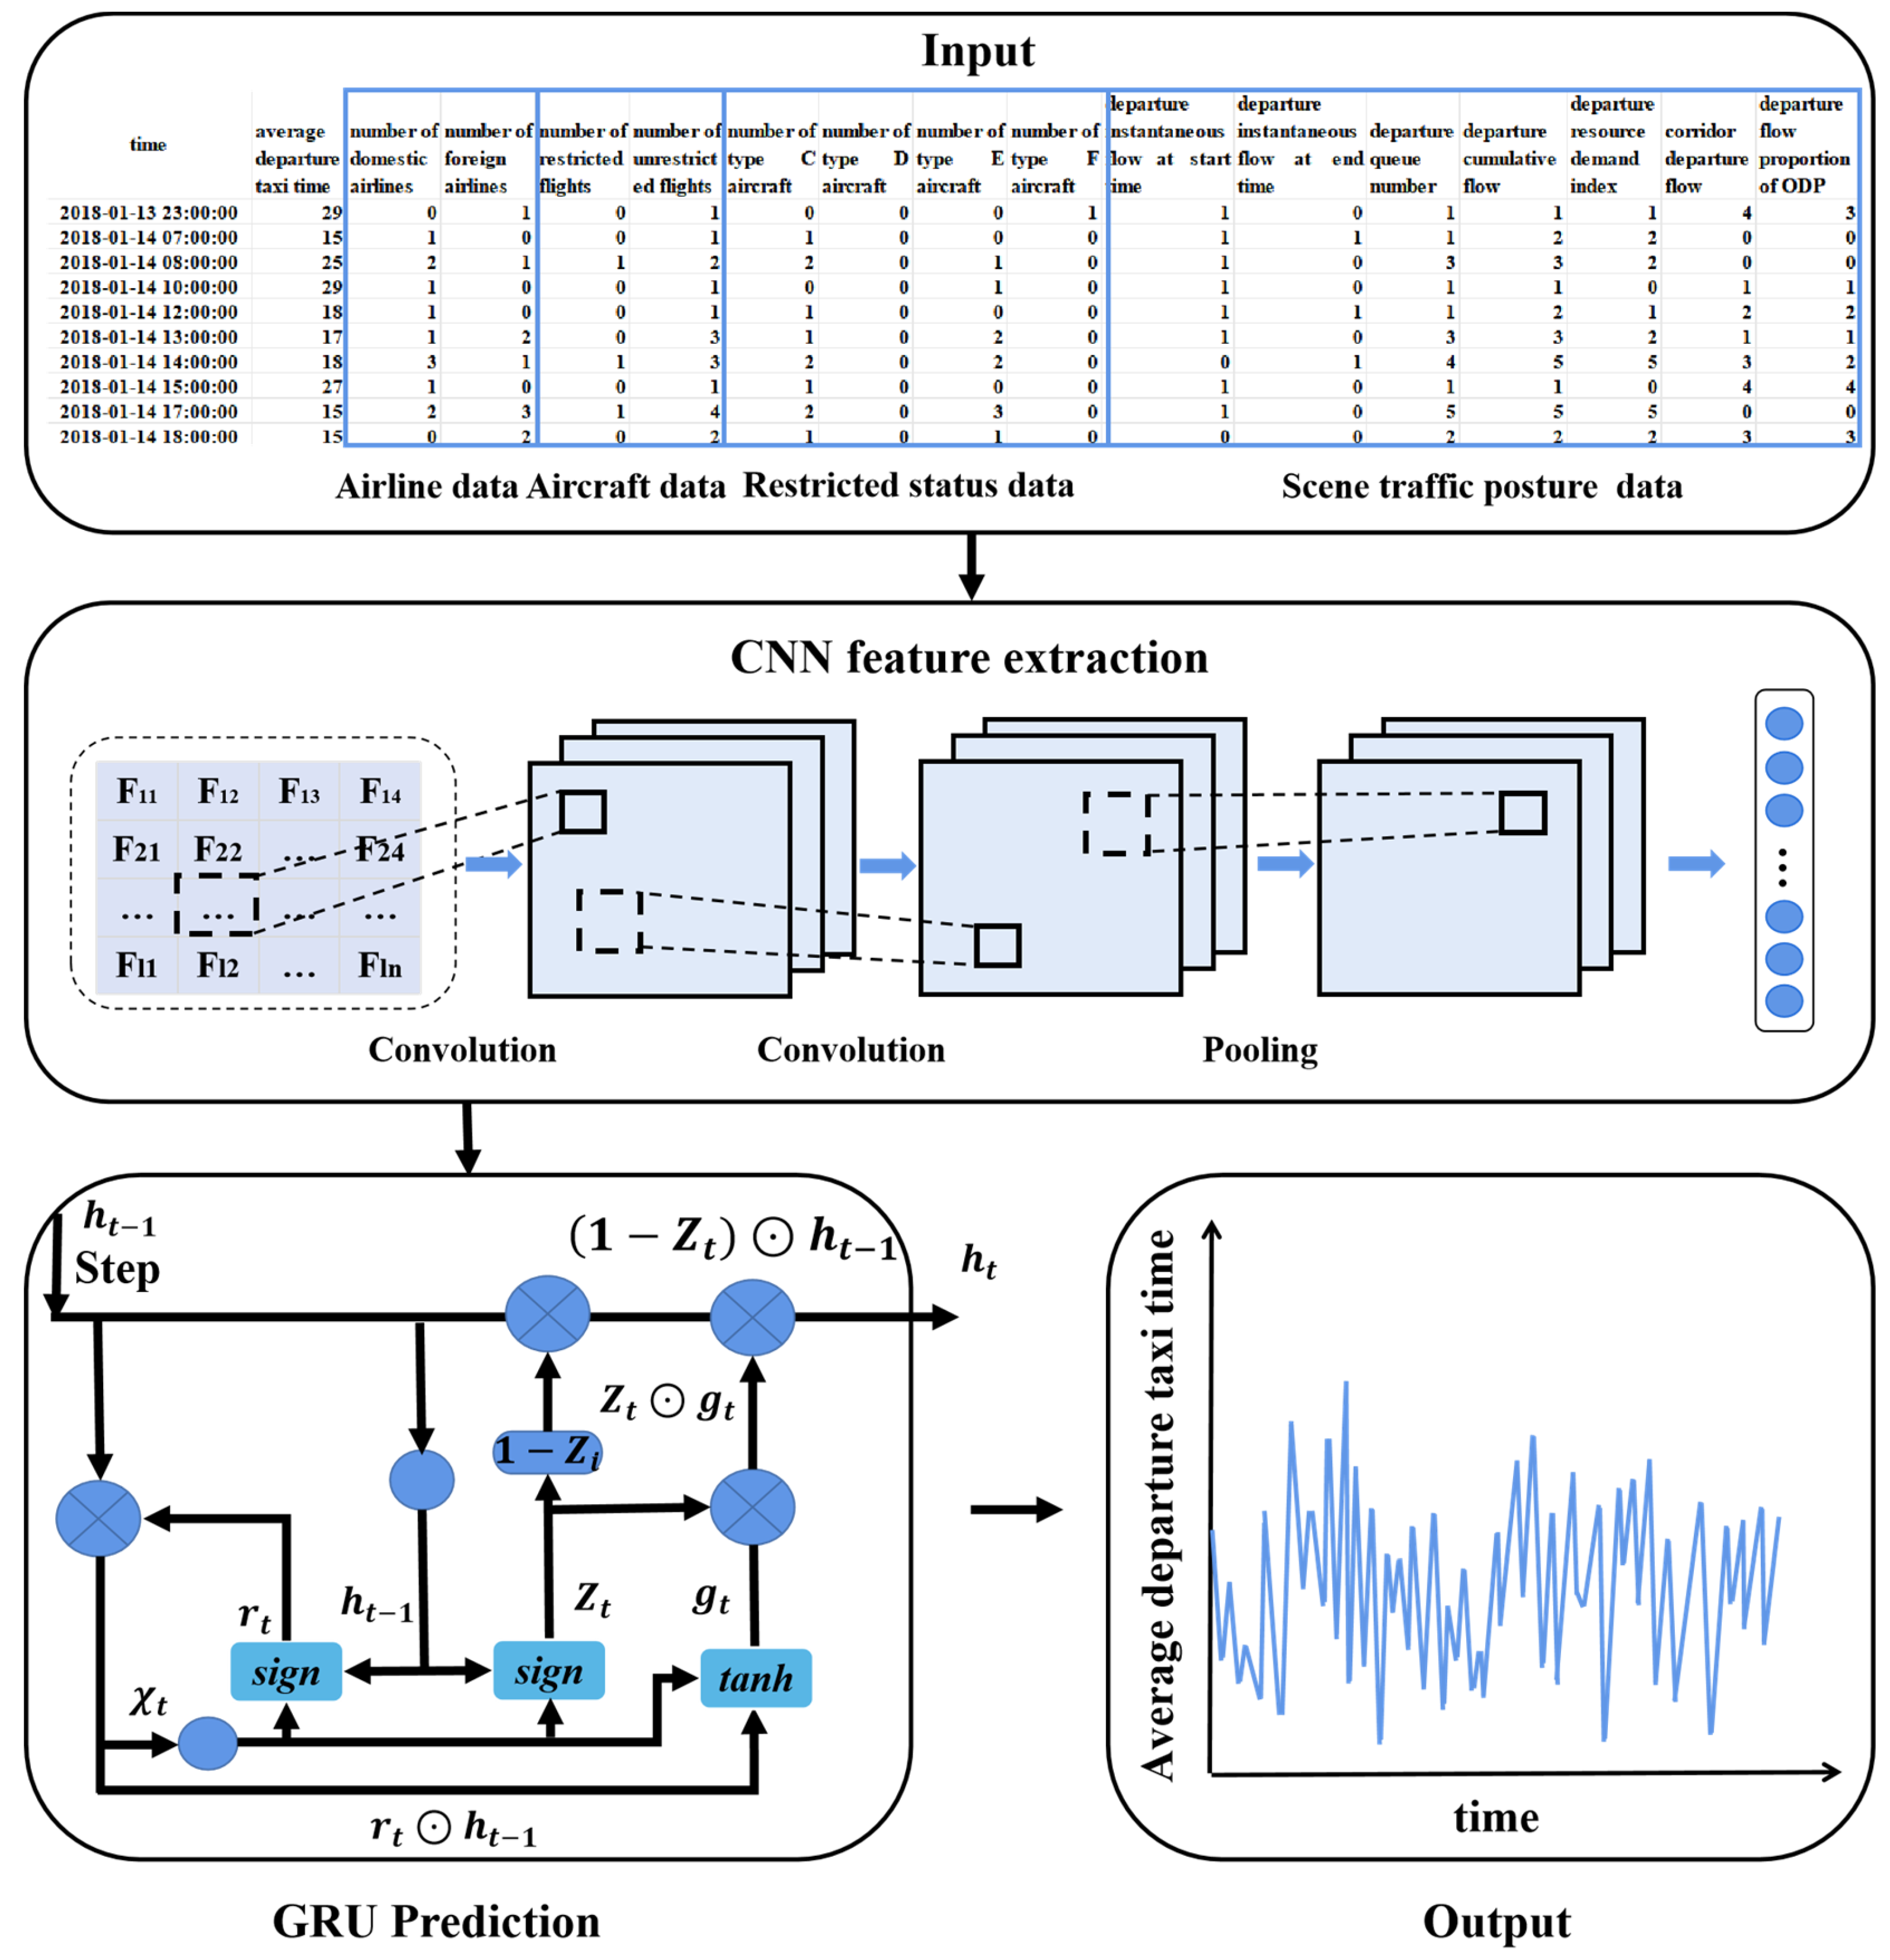
A departure taxiing time prediction model based on CNN-GRU is proposed.
(3)
The effectiveness and generalization ability of the proposed features and models are verified on the historical dataset of Pudong International Airport.

2. Literature Review

2.1. Related Work

Currently, the research on departure taxiing time prediction include two aspects: the construction of features and the development of prediction models. For feature construction, Wang et al. [9] studied the impacts of various features on taxiing time and emphasizes that employing selected features, such as taxiing distance, average speed of aircraft, and scene traffic flow, can get more accurate taxiing time predictions. Li et al. [10] classified taxiing time features into two distinct categories. The first, centering on sparse features, encompasses elements like weather conditions, runway configurations, types of aircraft, and time period. In contrast, the second category encompasses dense features, which include factors such as instantaneous traffic flow at the airport, the number of taxiing flights at the scene, and the overall taxiing distance. Du et al. [11] considered the influence of weather factors on taxiing time and established four characteristics characterizing scene flow: Scene Instantaneous Flow Index (SIFI), Scene Cumulative Flow Index (SCFI), Aircraft Queue Length Index (AQLI), and Slot Resource Demand Index (SRDI). Xia et al. [12] investigated the correlation between six indexes such as the number of departure flights, the number of arrival flights, the number of flights launching in the same time period, the average taxiing-out time per half hour, the taxiing distance, the number of turns, and the departure taxiing time. The results show that taxiing-out time has the highest correlation with airport scene traffic flow, moderate correlation with average taxiing-out time, and weak correlation with taxiing distance and number of turns. Lee et al. [13] considered the effects of several factors on their taxiing time prediction: the month, terminal, points the aircraft passes through when entering the taxiing area from the ramp, the takeoff runway, the departure fix, and the weight class of the aircraft. Tang et al. [14] innovatively introduced features related to the apron configuration, i.e., real-time dynamic flight flow at the scene, unobstructed taxiing time of the stand group, and the spatial influence index of the stand group.
Machine learning methods and simulation methods are increasingly used for the construction of prediction models. Lee et al. [1] proposed a simulation model based on linear optimized sequencing (LINOS) to simulate the path of an aircraft taxiing along the taxiway between the gate and the runway. This method was compared with four machine learning methods: linear regression (LR), support vector machine (SVM), k-nearest neighbors (KNN), and random forest (RF). The results indicate that the LINOS simulation outperforms LR, has a similar prediction accuracy to SVM, but is less accurate than both KNN and RF. Murça et al. [2] introduced a runway sorting and scheduling mixed integer linear programming model. This model incorporates the set of uncertainties in the slip-out time to dynamically determine the optimal order in which aircraft are released from the gates. One notable contribution is from Wang et al. [3] who designed the informer–random forest regression model which was crafted specifically for predicting departure taxiing time across various boarding gates and was tested on the data of Capital International Airport. Impressively, its validation demonstrated a prediction accuracy of 96.62% within a margin of ±5 min. Jeong et al. [4] innovated a prediction method tailored based on the airport node-link model for unimpeded taxiing time, which specifically targets both departure and arrival taxiing time at Incheon International Airport. Jiao et al. [5] introduced an advanced method based on attention mechanism, which synergizes long- and short-term memory with a deep neural network (D-LSTM) to predict taxiing time. Jiao et al. [10] proposed a wide deep neural network model (WDM) to predict both taxiing-in and taxiing-out time of flights at Hong Kong Airport. Du et al. [11] proposed a deep metric learning model to learn the similarity between historical scenarios consisting of flight characteristics, ground traffic, and meteorological conditions. This model was also combined with the k-nearest neighbor regression algorithm to find a set of historical environments similar to a reference scenario for predicting taxiing time. Kim et al. [6] used a random forest algorithm to predict the departure taxiing time at Incheon International Airport. Zhou et al. [7] developed a gated recurrent unit (GRU) model to predict the departure taxiing time at Lukou International Airport and considered the effect of hyperparameters on the network performance. Zhang et al. [8] established a probabilistic taxiing time prediction model based on machine learning, utilizing both random forest regression and kernel density estimation methods.
In summary, existing studies have focused on predicting variable taxi time (VTT) for single flights, which is essential for precise aircraft pushback control and enhanced efficiency in ground operations. However, the short time interval between the prediction trigger and the flight’s expected departure requires high accuracy and a significant amount of dynamic information. The regular A-CDM (Airport Collaborative Decision Making System) or DMAN (departure management system) basically sets fixed taxiing times by the area paired with runways, which can be used to support COBT calculations more than 2 h in advance. However, they mostly use methods based on historical statistics, with weak timing dynamics, and cannot support dynamic configuration. Therefore, predicting average taxiing time based on timing characteristics can alleviate this problem and support the collaborative operation of flight ground services more accurately at an earlier stage.
Based on the research mentioned above, we propose two new factors: corridor departure flow and departure flow proportion. Subsequently, we establish a hybrid model that combines a CNN model with a GRU model to predict the departure taxiing time.

2.2. Research Gap

We summarized the above studies in three aspects, including the research object (average departure taxiing time or single-flight departure taxiing time), the features used, and the prediction method, as shown in Table 1. From Table 1, we can obtain the following conclusions:
(1)
Most of the existing studies on taxiing time prediction focus on single-flight departure taxiing time [2,3,4,5,6,7,8,9,10,11,12,13,14] and less on the average departure taxiing time [1].
(2)
All existing studies use macroscopic scene flow features [2,3,5,6,7,8,9,10,11,12,13] but do not consider the influence of scene structures, such as connecting corridors.
(3)
Most of the existing studies use single and traditional machine learning methods [5,6,7,8,9,11,12,13,14], and few attempts are made to apply deep learning methods or combined models to improve prediction accuracy [3,10].
To address these issues, in this paper, we propose an average departure glide time prediction method based on a combined deep learning model after constructing new scene structure-based features. The gaps between our work and existing studies are as follows:
(1)
Unlike existing departure taxiing time prediction methods, our proposed method focuses on the average departure taxiing time, which can reflect the congestion of the field in a macroscopic way.
(2)
Compared with similar methods, we consider not only the conventional traffic flow features but also construct the structural features related to connecting corridors, aircraft groups, and runways in our prediction model, which explores more factors affecting the taxiing time.
(3)
In addition, we used a combined deep learning model for taxiing time prediction, using CNNs to extract deep features and inputting them into a GRU for prediction, which improved the prediction accuracy.
Table 1. Summary of taxiing time prediction works.
ReferenceResearch ObjectFeaturesPrediction Method
Lee et al. [1] (2015)AverageRunway and fix information, flight call signs, destination airports, aircraft models, initially assigned gate, spot and scheduled gate-out timeLinear optimized sequencing
Lee et al. [13] (2016)Single flightTerminal concourse, spot, runway, departure fix, and weight classLR, SVM, KNN, RF, NN
Murça [2] (2017)Single flightDeparture traffic, taxiing distanceInteger linear programming model
Li et al. [10] (2020)Single flightWeather, runway configuration, aircraft type, time period, airport instantaneous traffic flow, number of ground taxiing aircraft, and taxiing distanceWide-deep neural network model
Kim et al. [6] (2021)Single flight Airline, wingspan category, depart apron, take-off runway, operation type, take-off route, month, day of taxiing-out operation, time of taxiing-out operation, CTOT issued, queue length, ground traffic, and air trafficRF
Jiao et al. [5] (2022)Single flight Aircraft type, taxiing distance, and airport traffic flowLSTM
Du et al. [11] (2022)Single flight Flight properties, surface traffic, and meteorological conditionsDeep metric learning
Zhou et al. [7] (2022)Single flight Flight information, airport, weather, and airlineGRU
Zhang et al. [8] (2023)Single flight Scene traffic, gate, airline, and time periodRFR, kernel density estimation
Wang et al. [3] (2023)Single flightDeparture traffic, aircraft type, expected delay and gateInformer–RFR

3. Construction of Feature Set and Dataset

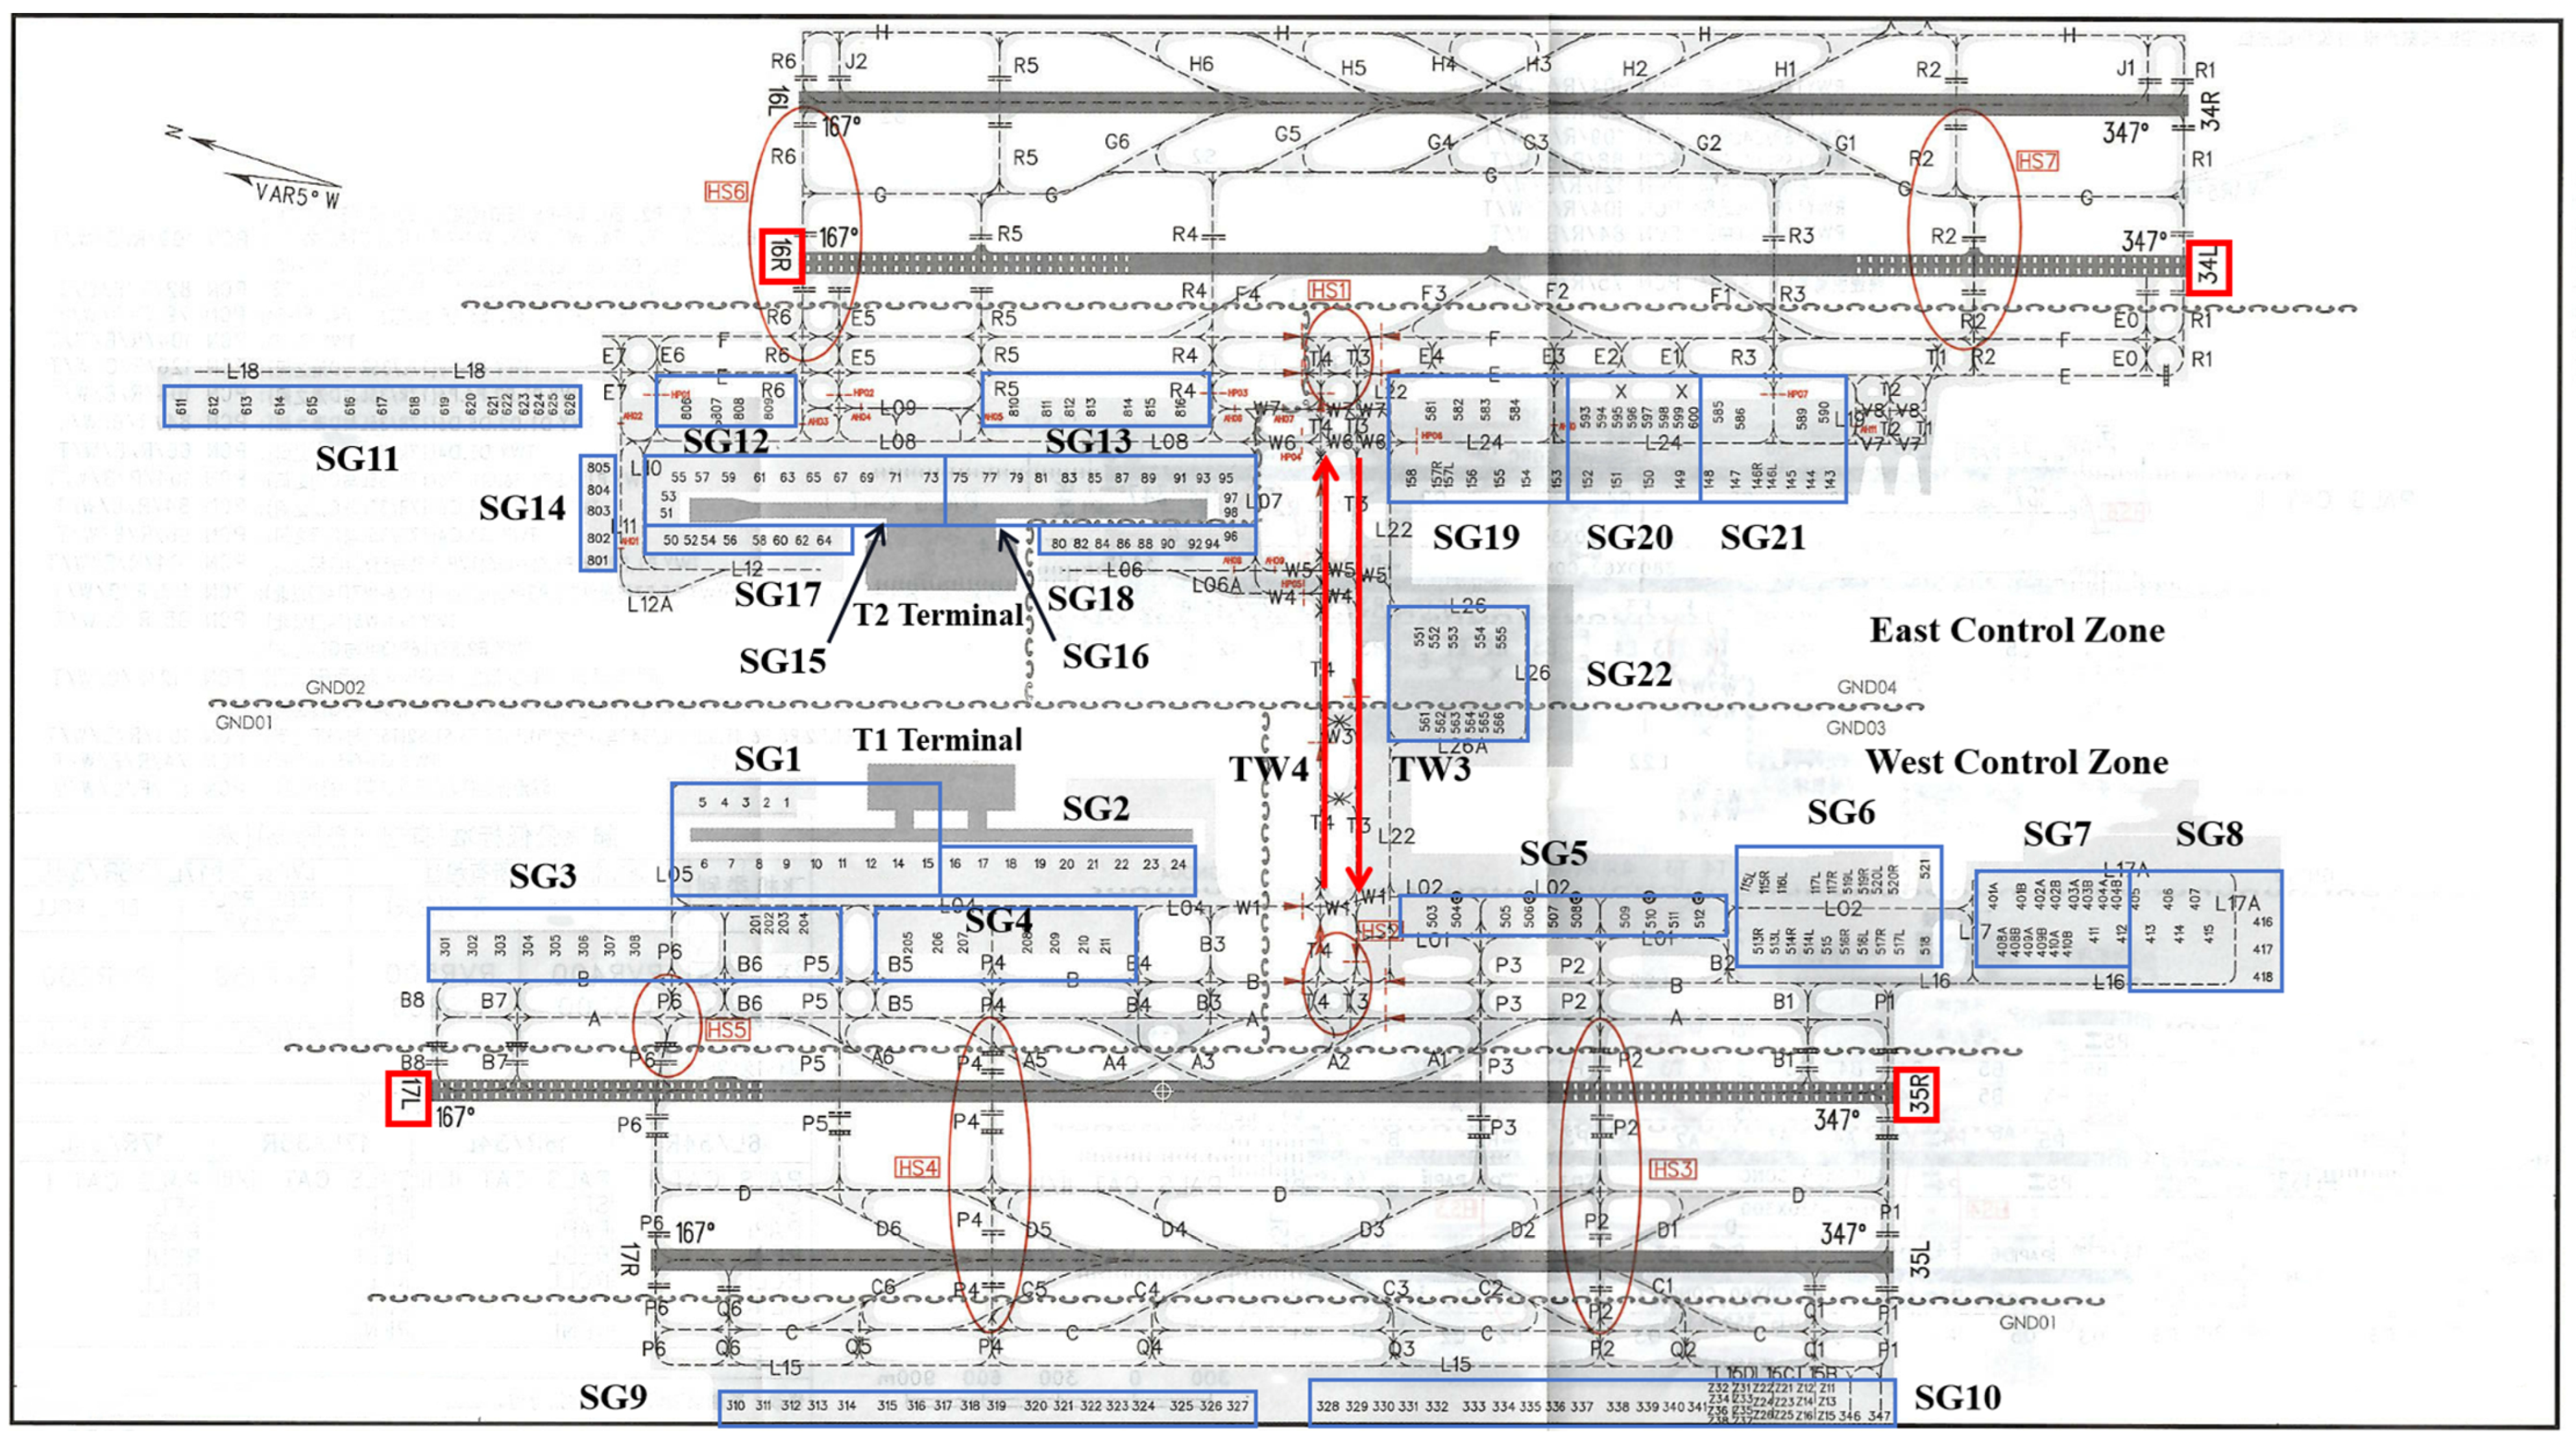
3.1. Layout of Pudong International Airport

As one of the three major hubs, Pudong International Airport is the first airport in China that has four runways. As depicted in Figure 1, these four runways are uniquely arranged in two parallel sets, with 17L/35R and 17R/35L in the T1 terminal and 16R/34L and 16L/34R in the T2 terminal. Specifically, 16R/34L and 17L/35R are used for taking off and 16L/34R and 17R/35L for landing. The 255 parking stands in this airport are grouped into 22 stand groups based on their locations, as shown in Figure 1, where SG stands for the abbreviation of stand group. Flights within a stand group share identical arrival and departure taxiing ways and operate in a coordinated manner. This airport has two control zones, the east control zone and the west control zone, which are connected to each other by a central corridor. The corridor has two unidirectional taxiing ways, TW3 for the east-to-west flights and TW4 for the opposite direction.

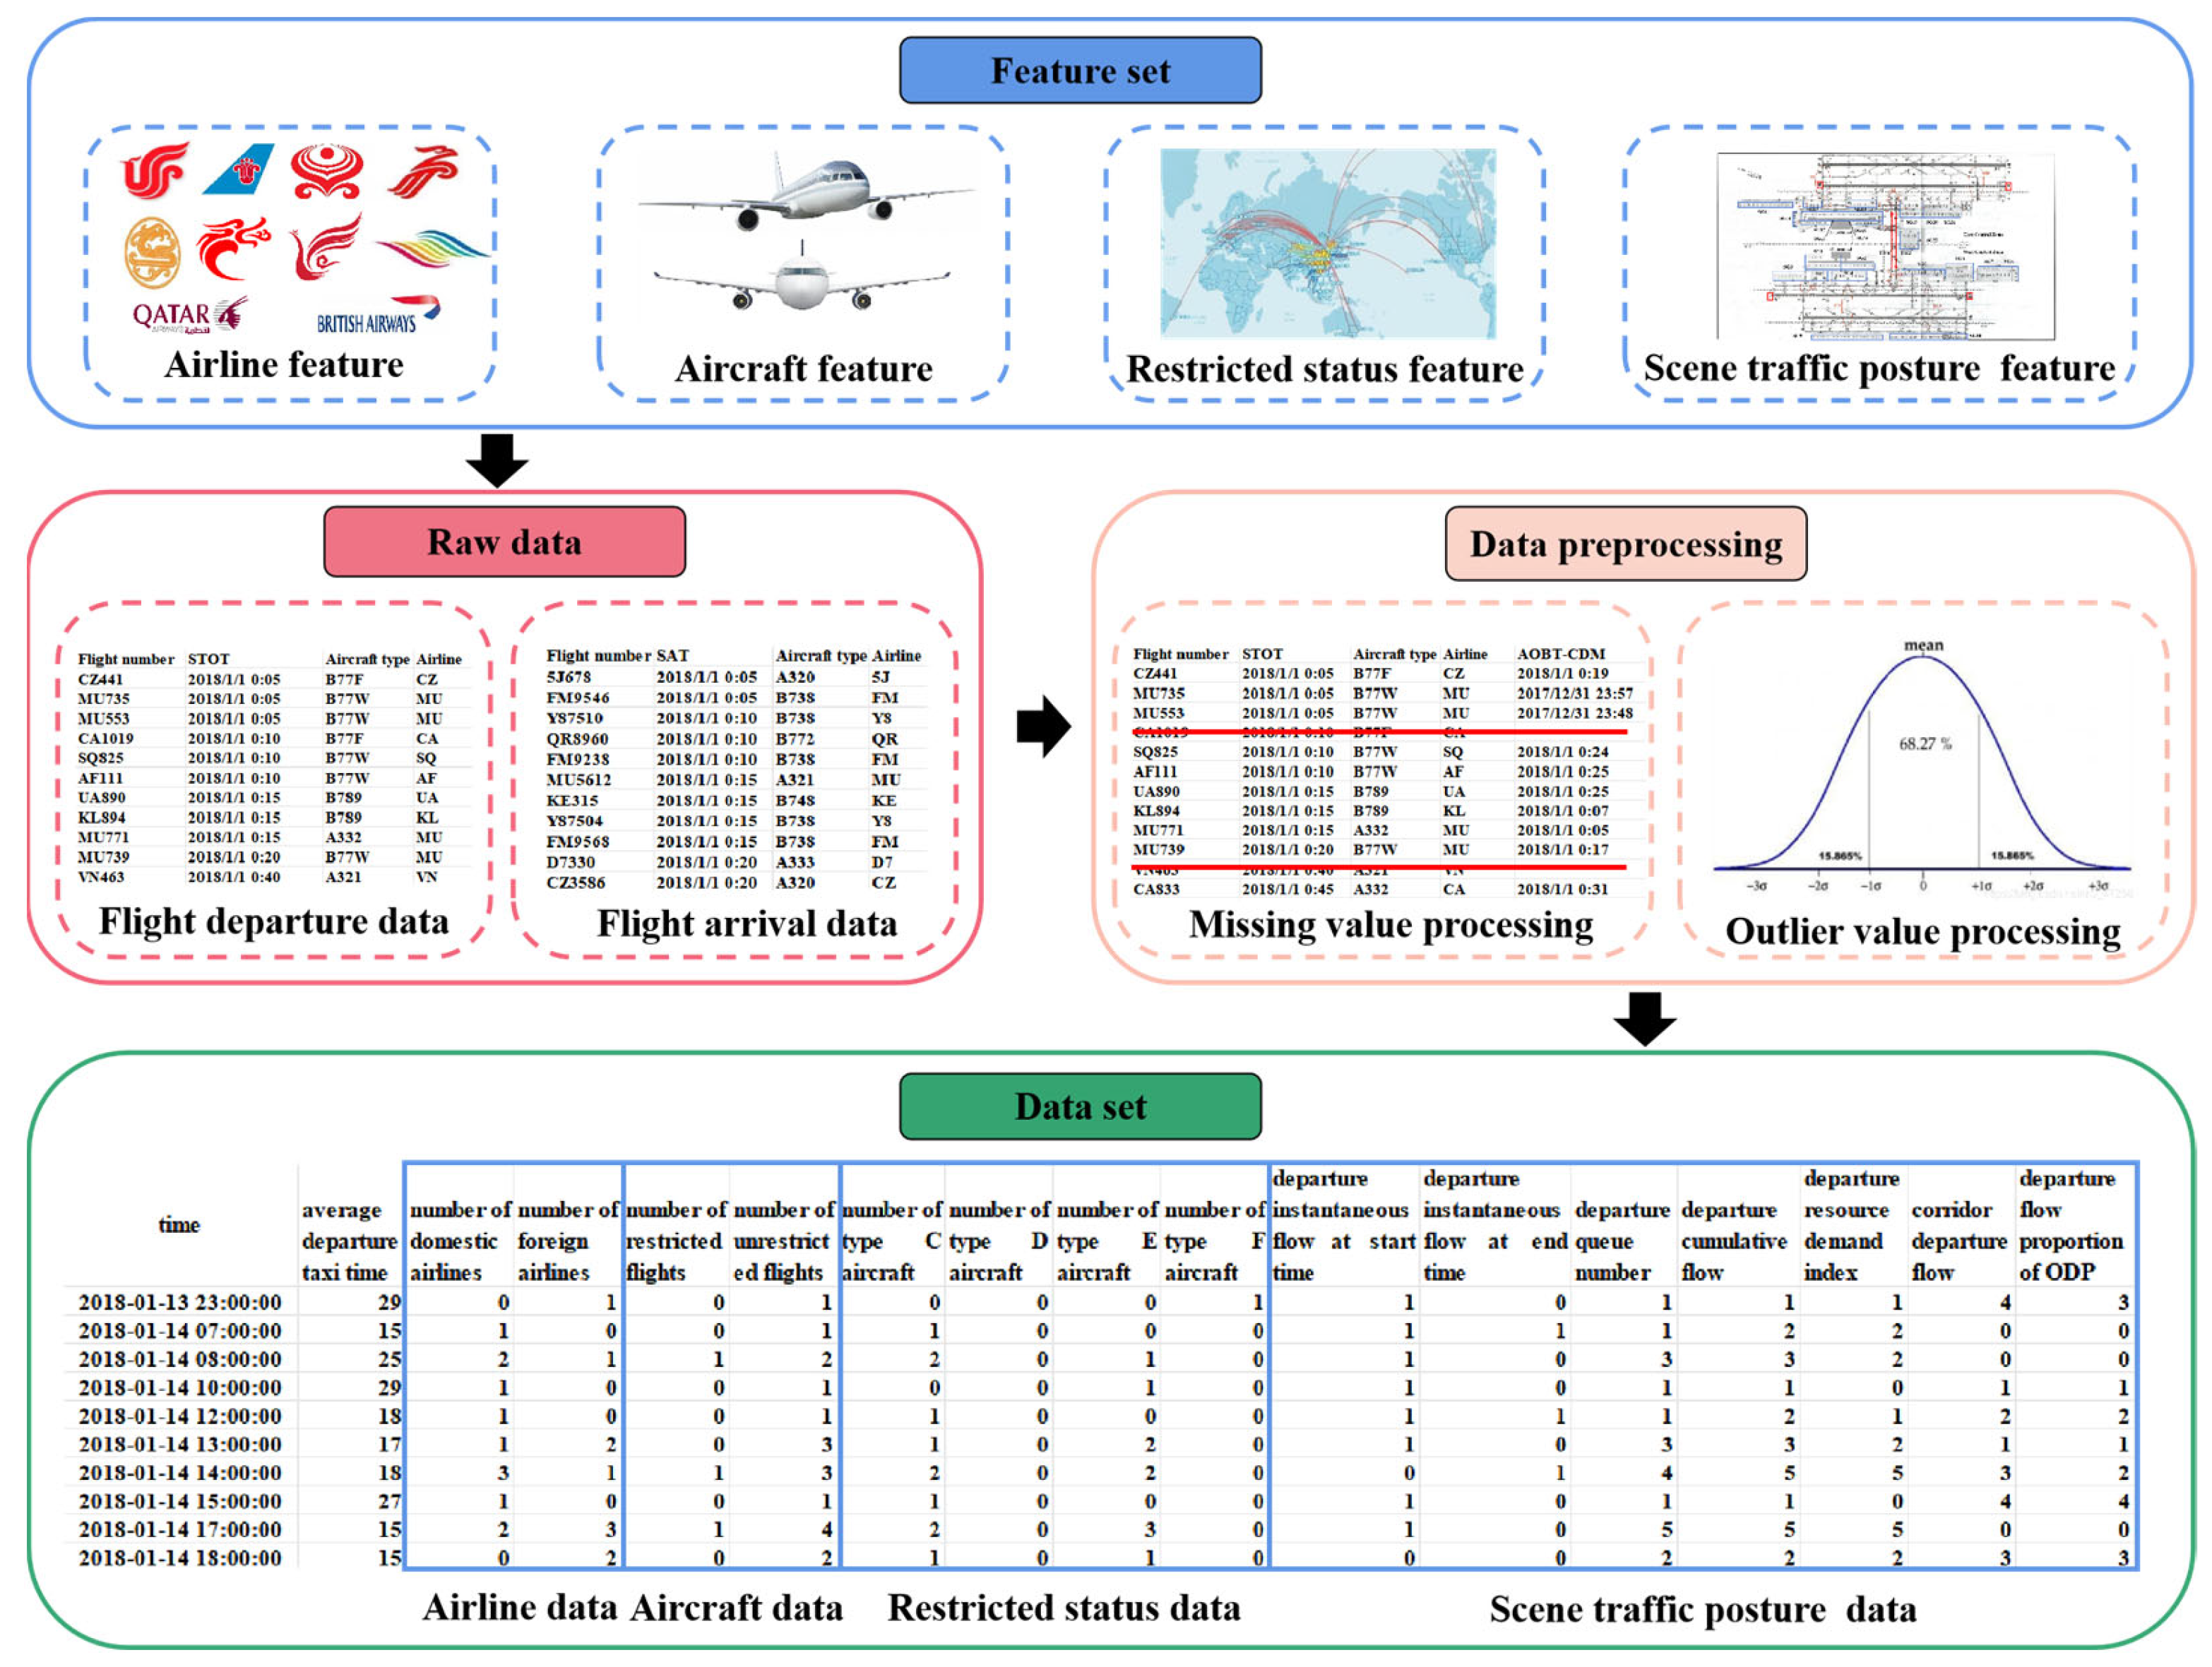
3.2. Construction of Feature Set

We take 22 stand groups as the origin and four departure runways as the destination, forming 88 origin–destination pairs (ODPs) to analyze the factors affecting departure taxiing time. Combined with the layout of Pudong Airport, we propose two new features, corridor departure flow and departure flow proportion.

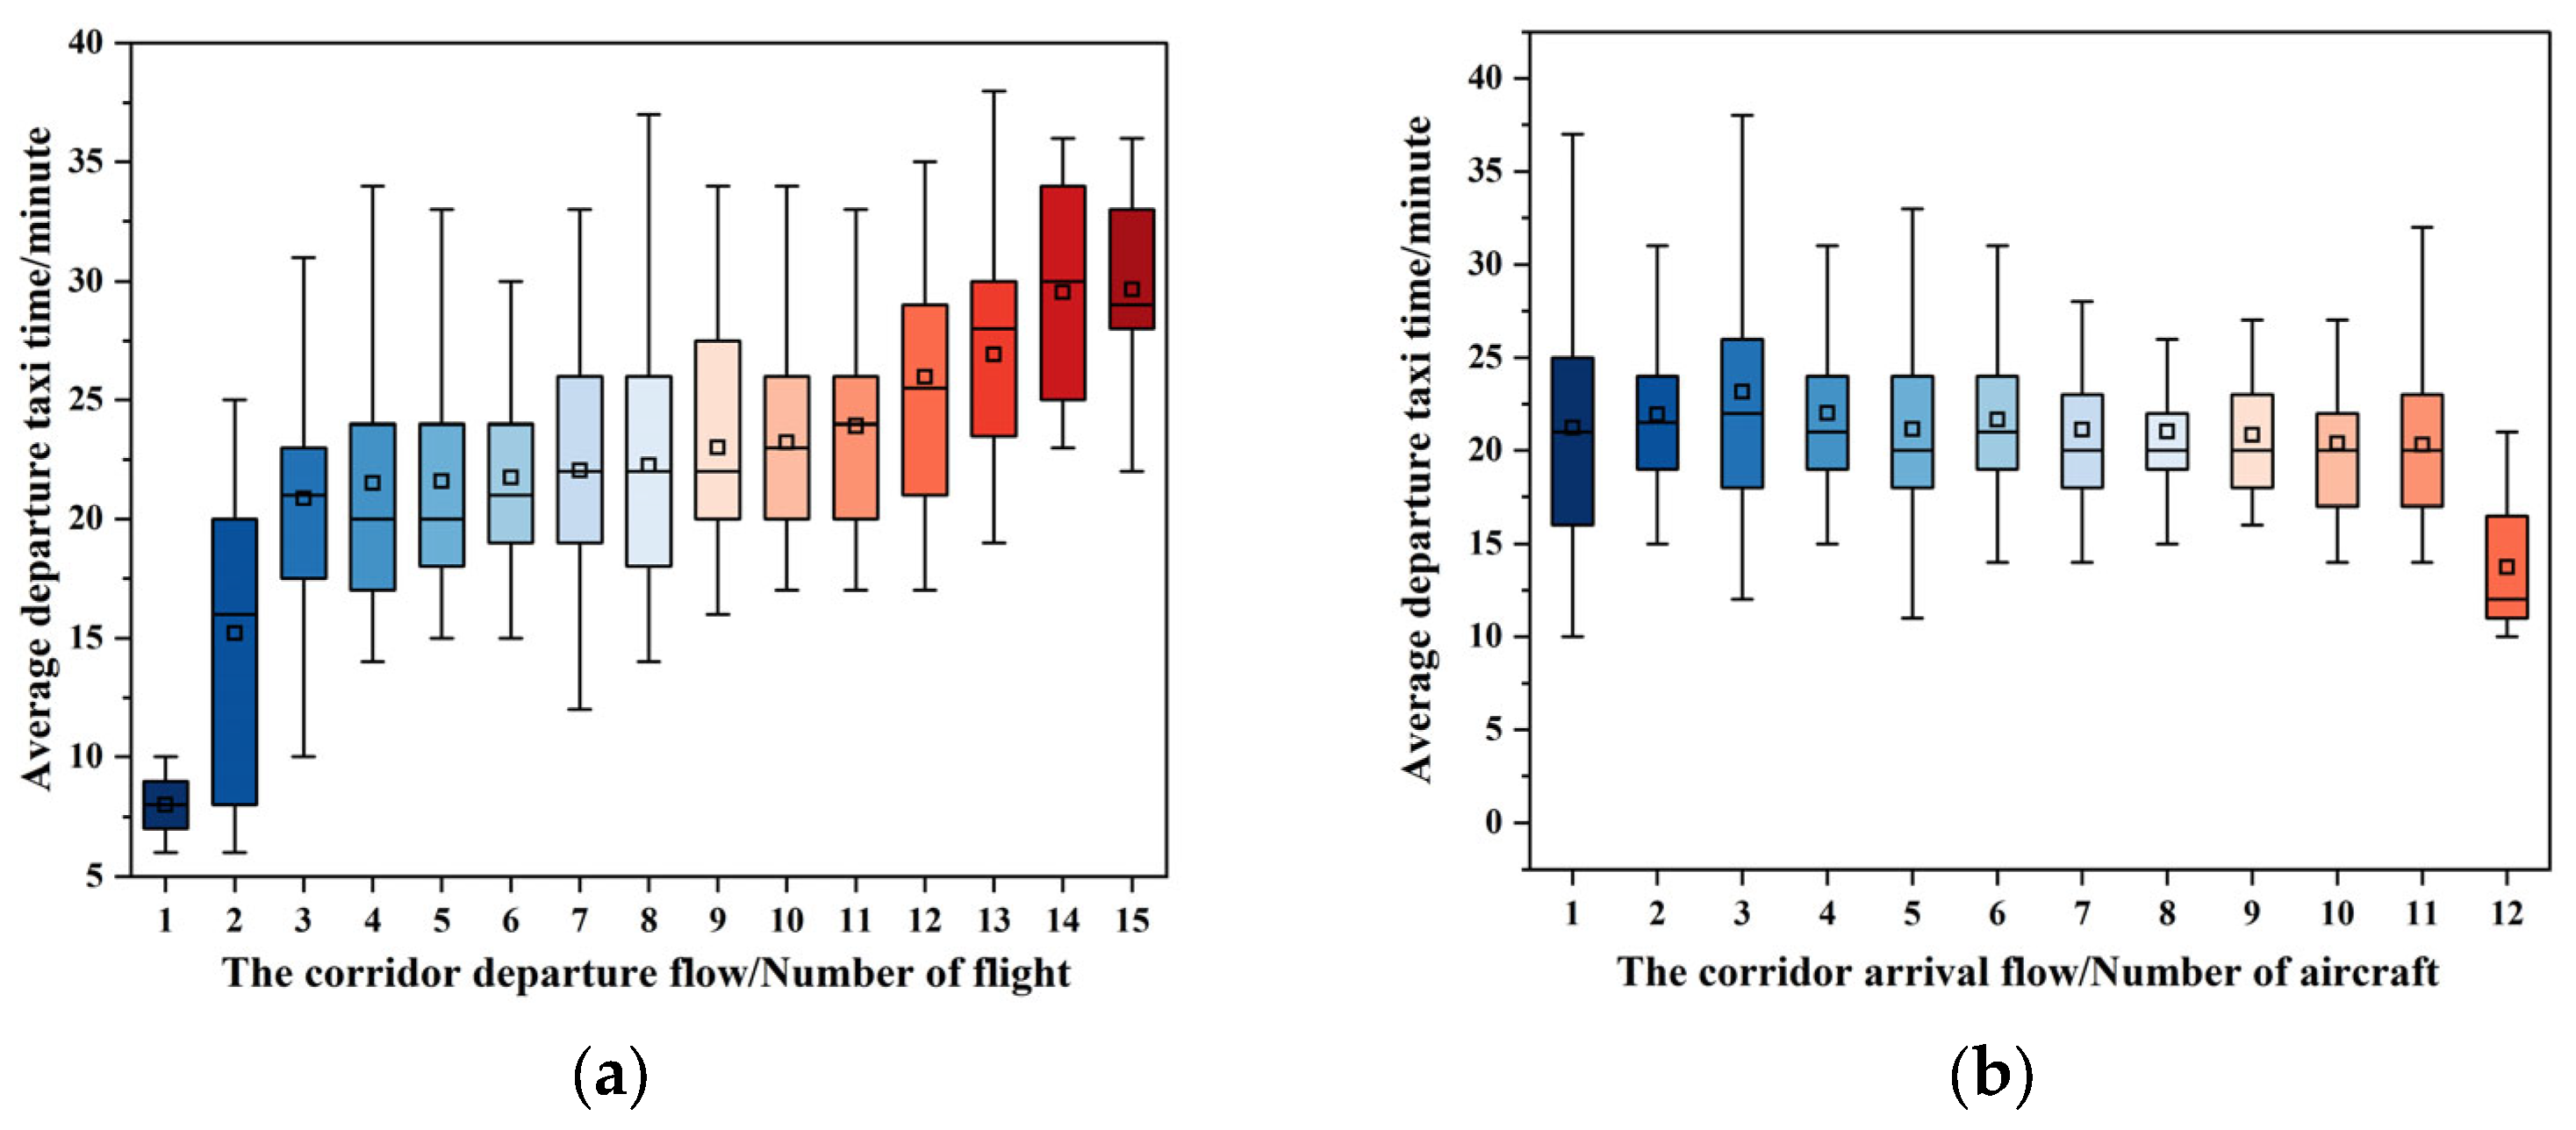
3.2.1. Corridor Departure Flow

Pudong International Airport has a corridor bridging the east and west control zones, which is an area prone to traffic conflicts for all the departure flights leaving from the stand groups in the east control zone; flights arriving have to go through TW3 to get to the 35R runway in the west to depart, and the flights arriving on the 16L/34R runway in the east also have to go through TW3 to get to their stand groups in the west. Therefore, traffic flow of the corridor can significantly affect the departure taxiing time of flights that have to pass through the corridor during the taxiing process.
Figure 2 shows how the departure taxiing time varies with the arrival and departure traffic flow of the corridor. The median of the average departure taxiing time gradually increases as the corridor departure flow increases. The main reason is that if the corridor departure flow is larger, the hotspots at the intersections of the corridor and taxiing ways are more likely to be congested, resulting in a longer waiting time. On the other hand, the correlation between the corridor arrival flow and the average departure taxiing time is weak, with no obvious correlation trend, so the influence of corridor arrival flow is not considered in this paper.

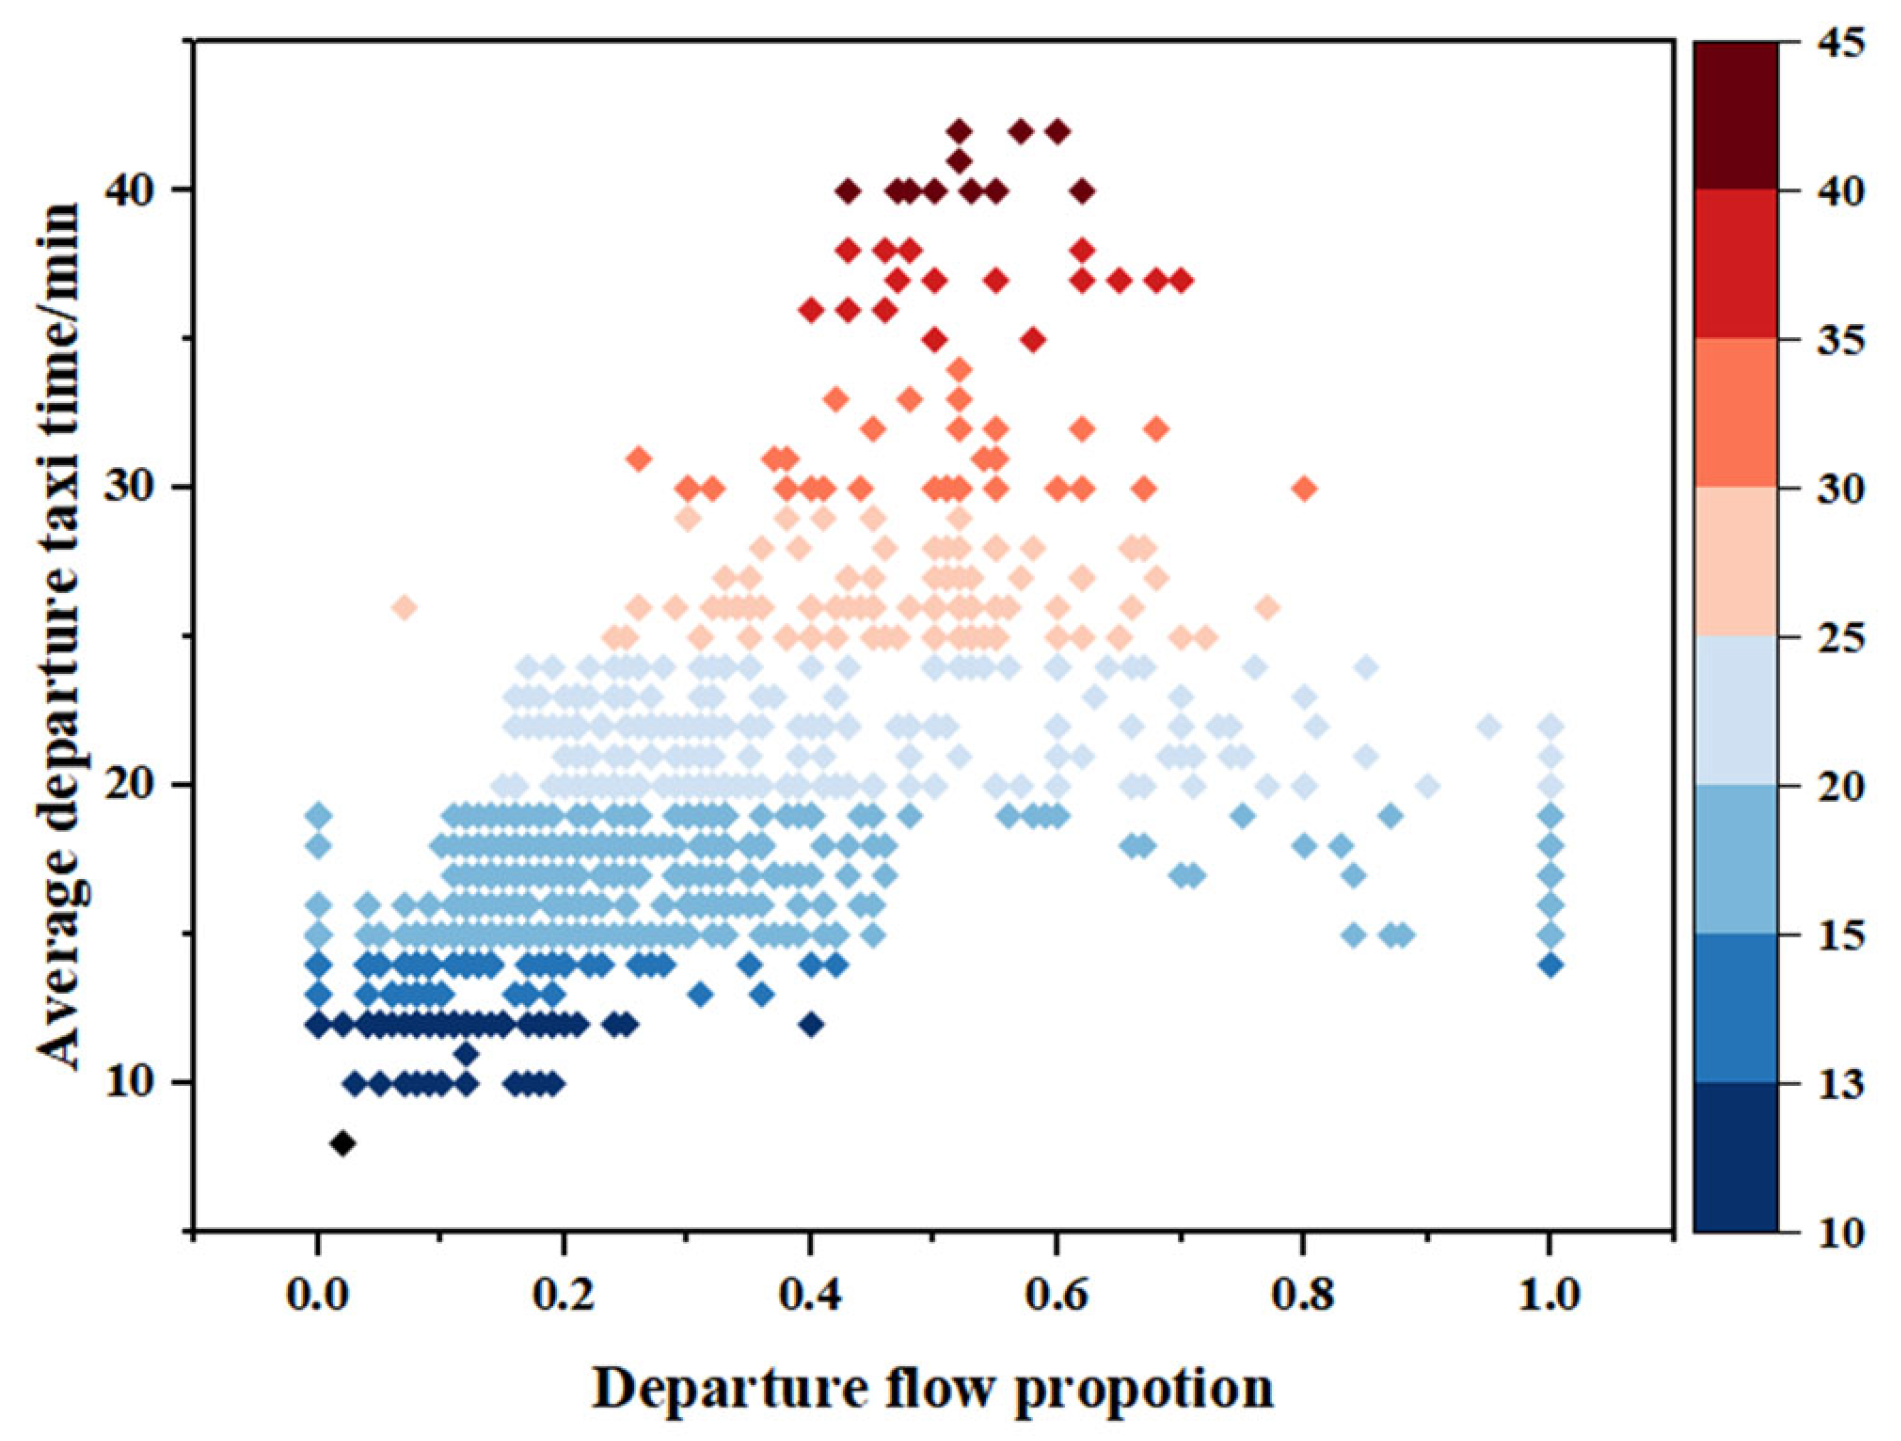
3.2.2. Departure Flow Proportion of ODP

This feature refers to the proportion of an ODP’s departure flow to the total arrival and departure flow within that OPD in a time slice. In the case of ODP 16-35R, which is used for departure, its arrival flow is the flow of the neighboring ODP 17R/35L-16, which is used for landing. Taking one hour as a time slice, we calculated the Pearson’s correlation coefficient between the average departure taxiing time and the percentage of departure flow for all ODPs, and the results are shown in Figure 3, with the corresponding average Pearson’s correlation coefficient 0.52. The average departure taxiing time is lower when the proportion of departure flow is larger or smaller. When the proportion of departure flow is about 0.5, that is when there is a high mix of arrival and departure, the scene is busier, and the average departure taxiing time is higher.
The departure flow proportion of ODPs ranging from 0 to 0.5 is larger than that from 0.5 to 1, which is more compact. This is because during the counting process, flights at both ends of the arrival runway are included, resulting in more cases where the number of arriving flights exceeds that of departing flights at different times of the day. Consequently, there are also more instances where the departure flow proportion of ODPs is smaller. Compared to calculating the departure flow proportion for the whole scene, the ODP’s departure flow proportion can reflect the effect of an OPD’s departure flow on the average departure taxiing time in a more microscopic way.
In addition to the two new features of corridor departure flow and departure flow proportion mentioned above, we use a total of 15 features and classify them into four categories based on their relevance, airline, aircraft, restricted status, and scene traffic flow, as shown in Table 2.
In Table 2, aircraft types are classified into four types, C, D, E, and F, according to wingspan and main wheel wheelbase, with type C having the smallest wingspan and main wheelbase. Restricted status refers to whether a flight is subject to route traffic restrictions or control area traffic restrictions, which generates ground waiting time.
Since the runway operation mode at Pudong International Airport is an independent parallel approach and departure entails two take-offs and two landings, the number of arrival flights as well as the number of queuing flights have less impact on the departure taxiing time. Therefore, in this paper, we focus on the impact of several departure flow features on the departure taxiing time.

3.3. Construction of Dataset

Based on the feature set established in Section 3.2, the raw data are preprocessed to construct the required dataset for further prediction. The process of constructing the dataset is shown in Figure 4. The red line in the figure indicates deletion of missing data, and the blue boxes indicate different categories of datasets.
Firstly, we select the data corresponding to the features or the data used to calculate the features from the original data based on the feature set. Then, the selected data are preprocessed, including missing value and outlier processing. Due to the small amount of missing data, samples with missing values are directly deleted. We use the  3 σ  principle to find outliers. That is, when the departure taxiing time deviates more than three times the standard deviation from the mean, the sample is considered as an outlier for deletion. Finally, the preprocessed data are used to calculate the values of the features by different time slices to get the final departure taxiing time dataset.

4. Prediction of Departure Taxiing Time

On the obtained departure taxiing dataset, we construct an end-to-end departure taxiing time prediction model based on CNN and GRU models, and its framework is shown in Figure 5.
The proposed prediction model takes the departure taxiing data as input. Firstly, it uses the powerful feature extraction capability of a CNN model to mine the intrinsic connection between various types of features in the input data and obtains the high-dimensional feature space representation of the input samples. Then, the extraction results of the CNN model are used as inputs to the GRU model to predict the departure taxiing time of flights. The working process of CNN-GRU-based departure taxiing time prediction model is described as shown in Algorithm 1.
Algorithm 1: CNN-GRU-based departure taxiing time prediction
Input: training set  D 1 , test set  D 2
Output: prediction value  H
W z , W r , W h N ( 0 , 1 ) —weight matrix,  x t —input vector at time t
1. for each epoch:
2.     for each batch in  D 1 :
3.        Perform a convolution operation
4.        Perform activation using  Re LU  function
5.        Perform pooling operations using max pooling
6.        Compute the update gate  Z t  according to  Z t = σ ( W z [ h t 1 , x t ] )
7.        Compute the reset gate  r t  according to  r t = σ ( W r [ h t 1 , x t ] )
8.       Compute the candidate state  g t  according to  g t = tanh ( W h [ r t h t 1 , x t ] )
9.        Compute the hidden state  h t  according to  h t = ( 1 Z t ) h t 1 + Z t g t
10.       Input the fully connected layer to get the prediction value
11.       Compute the mean square loss of  D 1
12.       Update the  W z , W r , W h  by using optimizer
13.     end for
14. end for
15. Input  D 2  into the best trained model to get the prediction value  H

5. Experiments

5.1. Experimental Setup

To verify the effectiveness and superiority of the departure taxiing time prediction model based on CNN-GRU proposed in this paper, we compared the prediction accuracy of this model with the departure taxiing prediction models based on three other deep learning models, LSTM, CNN-LSTM, and GRU. To verify the generalization ability of the CNN-GRU-based departure taxiing time prediction model proposed in this paper, we predicted and analyzed the results of departure taxiing time for different ODPs. To investigate the effect of different categories of features on the taxiing time prediction, we used ablation experiments to observe the changes that occur in the prediction results after removing a certain category of feature. To investigate the effect of different time slice lengths on the prediction performance of the model, we divided the time slice into five lengths of 30, 45, 60, 75, and 90 min and compared the prediction results.
We collected flight inbound and outbound data from Pudong International Airport from 5 January 2018 to 7 March 2018, including 40,504 arrival data and 40,072 departure data. After preprocessing, the dataset required for the experiment was obtained, and the dataset was divided into a training set, a validation set and a test set in the ratio of 6:1:3.
We used five indicators to evaluate the performance of the prediction models, including mean absolute error (MAE), root mean square error (RMSE), coefficient of determination (R2), ±3 min accuracy, and ±5 min accuracy, and the expressions for the last two are given as follows:
( ± 3 min   accuracy )   = i = 1 n L ( y ^ i , y i ) n , L ( y ^ i , y i ) = 0 , y ^ i y i > 3 1 , y ^ i y i 3
( ± 5 min   accuracy )   = i = 1 n L ( y ^ i , y i ) n , L ( y ^ i , y i ) = 0 , y ^ i y i > 5 1 , y ^ i y i 5
where  y ^ i  denotes the predicted value,  y i  denotes the true value, and  n  denotes the number of samples.
For the parameters in the CNN and GRU models, the optimal values were obtained after several rounds of debugging in advance as shown in Table 3.

5.2. Results and Discussions

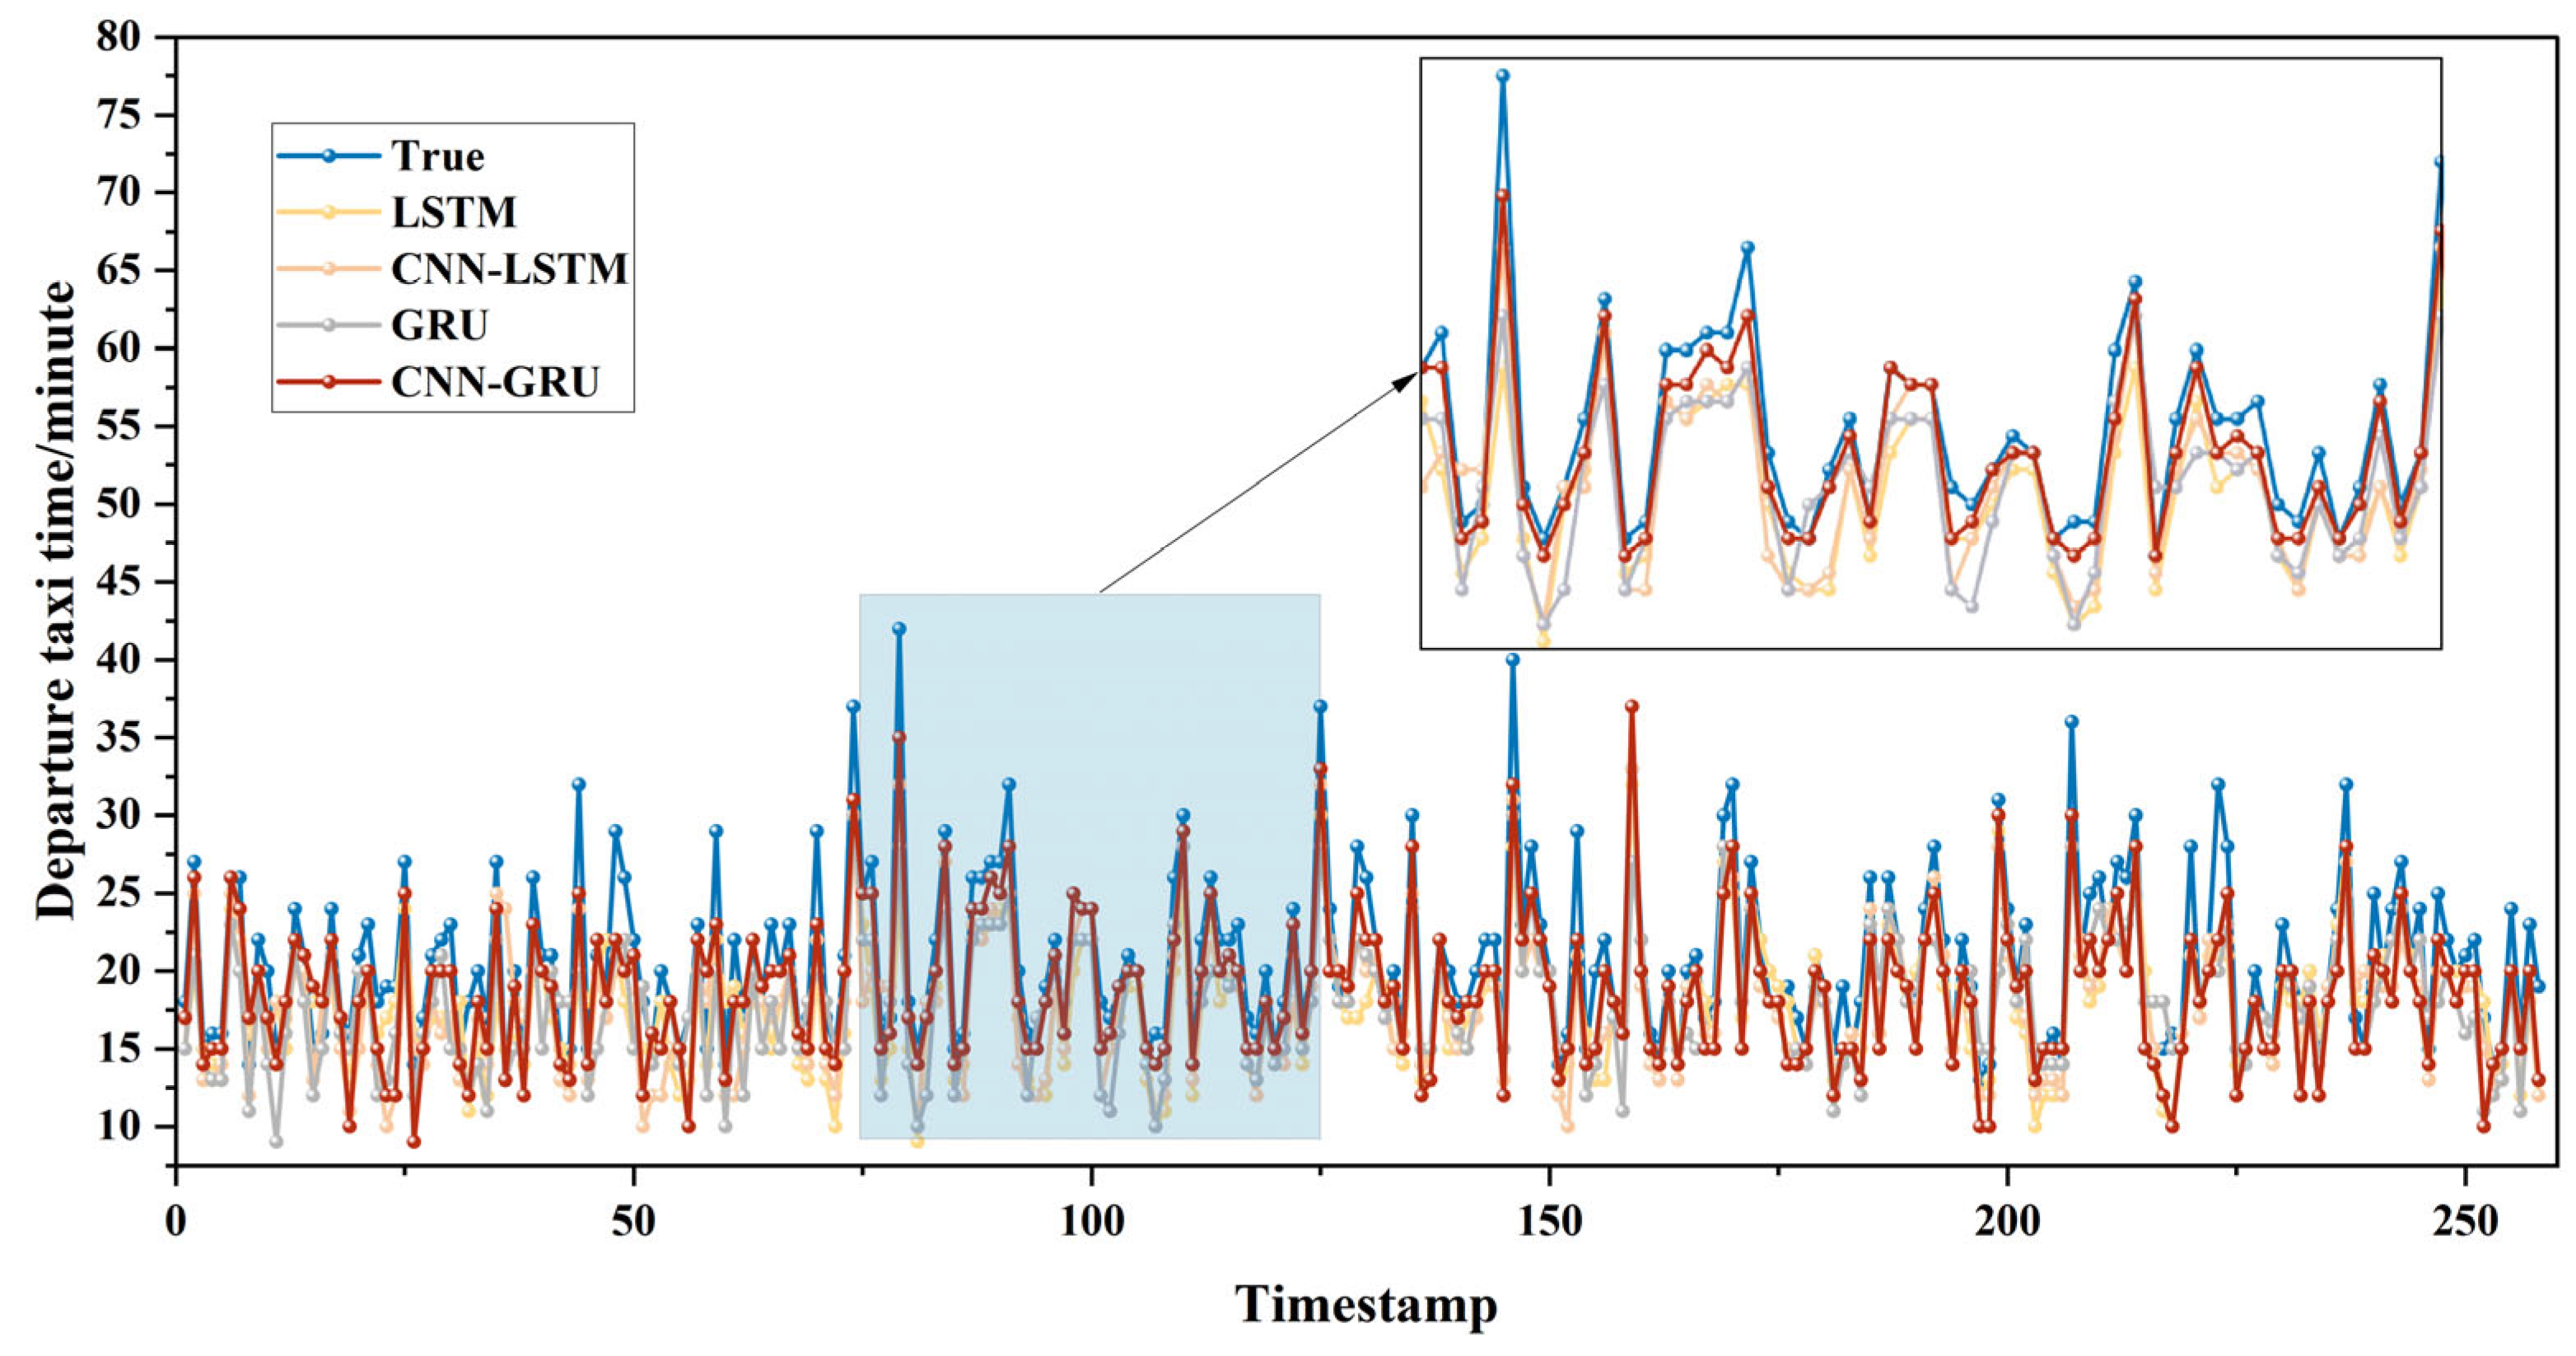
5.2.1. Performance Comparison of Different Prediction Models

In order to validate the prediction performance of the combined CNN-GRU model, we simultaneously predicted the departure taxiing time of ODP 16-35R and 1-35R based on four deep learning models, namely, LSTM, CNN-LSTM, GRU, and CNN-GRU. The prediction performances of the four prediction models of 16-35R are shown in Table 4 and Figure 6, with the length of the time slice being 60 min. And, the prediction performances of the four prediction models of 1-35R are shown in Table 5, with the same time slice.
As can be seen from Table 4, the CNN-GRU-based prediction model achieved the best performance. Compared to the LSTM-based prediction model, its MAE and RMSE were improved by 13.12% and 13.70%, respectively. Compared to the prediction model based on CNN-LSTM, its MAE and RMSE were improved by 8.55% and 7.07%, respectively, which indicates that the GRU outperforms the LSTM in processing time series data. Compared to the prediction model based on GRUs, its MAE and RMSE were improved by 14.34% and 15.75%, respectively, which indicates that the use of a CNN can effectively extract the deep features of the data and improve the prediction performance.
Figure 6 illustrates the gaps between the predictions of the four prediction models and the true values. In order to see the gaps more clearly, the plots corresponding to the 75th to 125th prediction results are zoomed in. In the enlarged figure, it can be seen that the CNN-GRU prediction model proposed in this paper fits the best with the true values, which also proves its superiority.
As can be seen from Table 5, the CNN-GRU-based prediction model also achieved the best performance. Compared to the LSTM-based prediction model, its MAE and RMSE were improved by 10.89% and 14.03%, respectively. Compared to the prediction model based on CNN-LSTM, its MAE and RMSE were improved by 2.42% and 5.88%, respectively. Compared to the prediction model based on GRU, its MAE and RMSE were improved by 9.27% and 4.52%, respectively.

5.2.2. Taxiing Time Prediction for Different ODPs

In order to investigate the generalization ability of the proposed CNN-GRU-based prediction model, we performed taxiing time predictions for all the ODPs consisting of stand group 16 and stand group 1 with different runways, and the results are shown in Table 6. As can be seen from Table 6, the proposed prediction model can achieve about 70% ±3 min accuracy and 85% ±5 min accuracy, i.e., it is able to effectively predict the departure taxiing time for different ODPs.

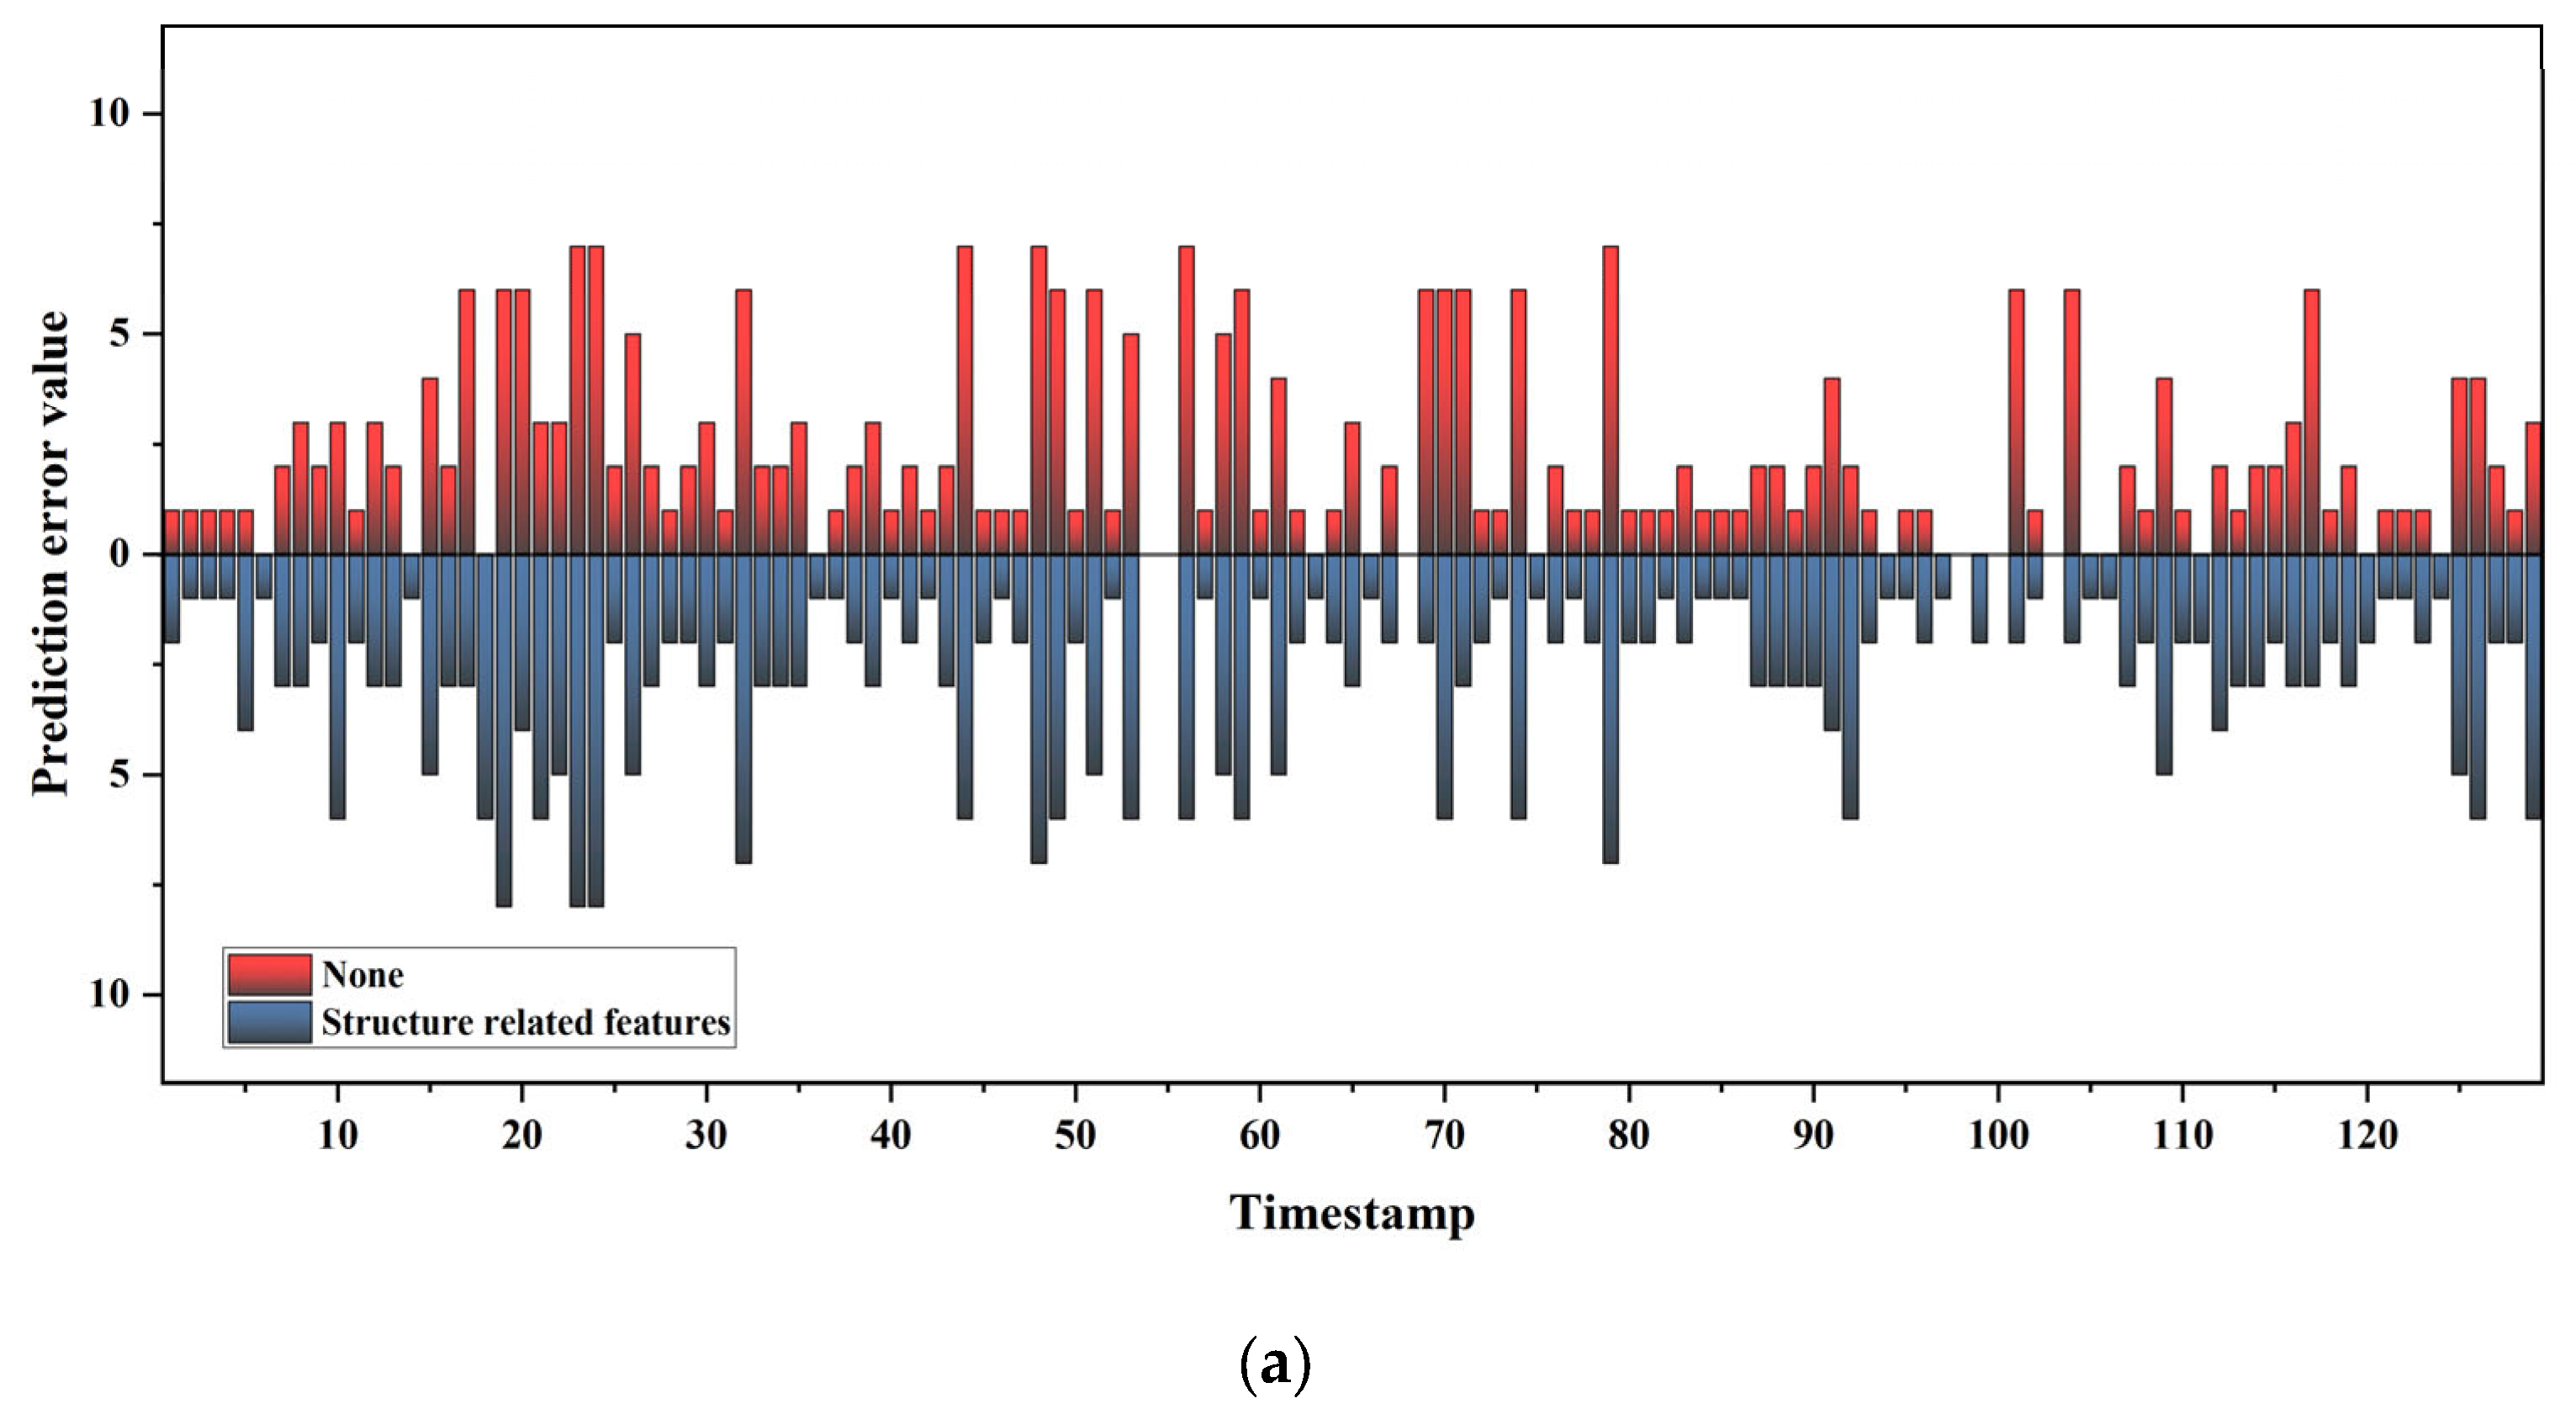
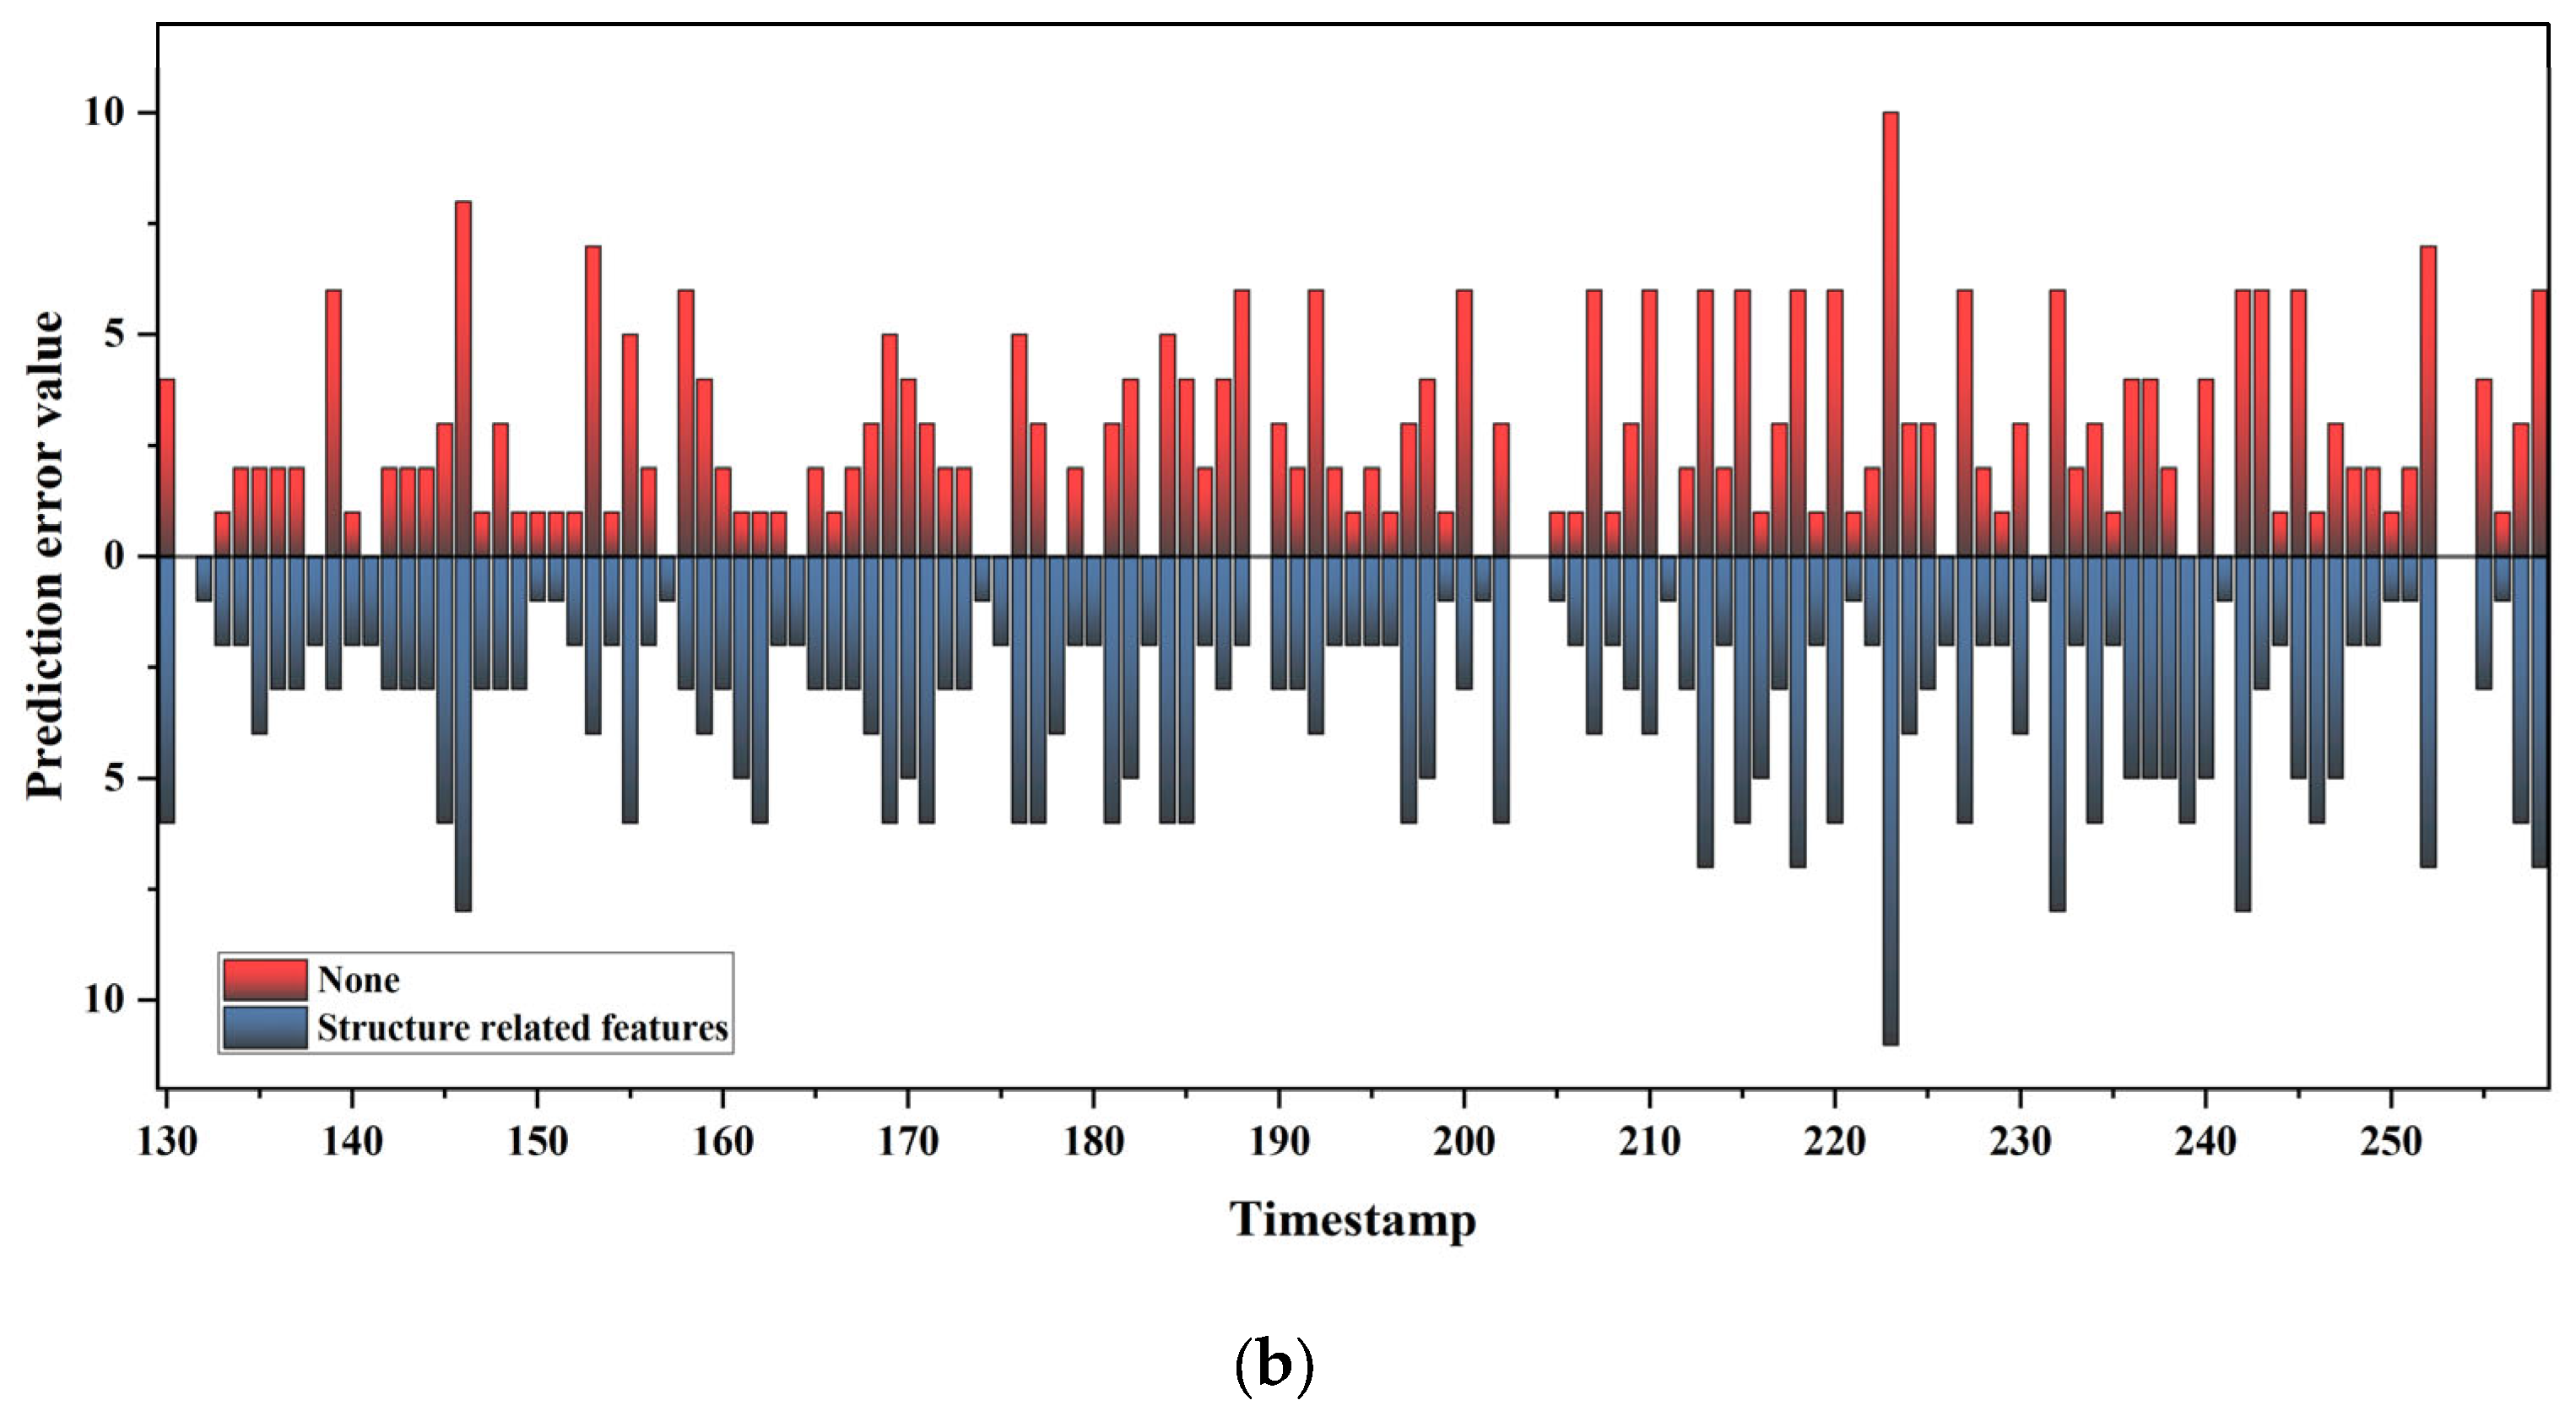
5.2.3. Prediction with Different Features

In order to verify the effects of different categories of features on the prediction, we conducted feature ablation experiments using the ODP 16-35R and 1-35R departure taxiing time prediction as an example. That is, a group of features was removed each time and then the model was trained to obtain the values of various performance indicators of the prediction model. The experimental results of 16-35R are shown in Table 7 and Figure 7. And, the experimental results of 1-35R are shown in Table 8.
As can be seen from Table 6, the scene traffic flow features have a greater impact on the prediction performance. The MAE, RMSE, R2, ±3 min accuracy, and ±5 min accuracy of the prediction model were improved by 7.89%, 4.37%, 5.19%, 13.64%, and 8.64%, respectively, after adding the normal field traffic flow features. After adding the proposed structure-related features corridor departure flow and the departure flow proportion of ODP, the MAE, RMSE, R2, ±3 min accuracy, and ±5 min accuracy metrics of the prediction model were improved by 5.04%, 3.77%, 3.85%, 10.29%, and 7.32%, respectively, which are higher than the other categories of features.
By adding the corridor departure flow feature alone, we can see that the MAE, RMSE, R2, ±3 min accuracy, and ±5 min accuracy of the prediction model were improved by 2.78%, 3.16%, 2.53%, 8.70%, and 3.53%, respectively. The prediction effects were also improved while adding the departure flow proportion of ODP feature alone. The MAE, RMSE, R2, ±3 min accuracy, and ±5 min accuracy of the prediction model were improved by 1.61%, 2.13%, 2.53%, 2.74%, and 2.33%, respectively. The experimental results proved the effectiveness of the proposed two new features.
Figure 7 shows the comparison of 258 prediction errors using all features and removing the proposed structure-related features, the first 129 in Figure 7a and the last 129 in Figure 7b, for a time slice length of 60 min. It is clear from these two bar charts that the blue bars cover more area than the red bars. This means that if the two structure-related features constructed in this paper are not used, this will result in a large prediction error. This also proves that these two proposed new features have an important effect on the departure taxiing time.
From Table 8, we can also see that the normal features of scene traffic flow have the greatest impact on the comparison of the prediction results. The prediction effect of the model was also improved by adding the two indicators we proposed respectively.

5.2.4. Prediction with Different Length of Time Slice

In order to verify the effect of different lengths of time slices on the prediction performance, we take the prediction of the departure taxiing time of ODP 16-35R as an example and conduct prediction experiments under the time slice lengths of 30 min, 45 min, 60 min, 75 min, and 90 min, respectively, and the results are shown in Table 9.
From Table 9, it can be seen that the model prediction performance is best when the time slice length is 60 min, while too short or too long a time slice will lead to a decrease in the prediction performance.

6. Conclusions

In the realm of airport operations management, enhancing the accuracy of departure taxiing time predictions is important for boosting operational efficiency and ensuring a high flight punctuality rate. In this paper, we presented a model for predicting the average departure taxiing time, taking advantage of the combined strengths of CNNs and GRUs.
First, we analyzed the scene operation layout of Pudong International Airport and proposed two new features from a structure point of view: corridor departure flow and the departure flow proportion of ODP. Then, we established a CNN-GRU hybrid model to capture the underlying patterns in departure taxiing data and predict the taxiing time. Finally, we validated the model on actual operational data from Pudong Airport. The results show that, compared with other deep learning models, the proposed CNN-GRU model has the highest prediction accuracy, which shows its superiority. We also verified that the addition of the proposed structure-related features can effectively improve the prediction accuracy. Meanwhile, the CNN-GRU model can also predict the average departure taxiing time for different ODPs effectively, which indicates its broad applicability.
Predicting the average departure taxiing time bridges the early allocation of CTOT and COBT with high-accuracy predictions in the later dynamic phase. On the other hand, it allows for a more comprehensive understanding of the overall taxiing situation on the scene, which can help in providing early warning alarms for potential congestion and enhancing the intelligent management of the airports.
In terms of practical application requirements, the prediction of the average departure taxiing time can be used not only for monitoring the taxiing efficiency of the auxiliary field but also for the dynamic configuration of the taxiing time in the earlier stages of the A-CDM system, which can improve the accuracy of early COBT calculations and reduce the large-scale jump of COBT.
Subsequently, we will continue to work on single-flight taxi time predictions, considering more characteristics of the field structure and traffic distribution, as well as innovations in prediction methods. From the perspective of field operations management, these two components will form a solution that can continuously improve the configuration of taxi times as time approaches at different time scales.

Author Contributions

Conceptualization, L.Y.; methodology, L.Y., J.L. and W.C.; software, D.F.; formal analysis, J.L. and D.F.; investigation, L.Y. and H.C.; resources, L.Y. and W.C.; data curation, D.F.; writing—original draft preparation, J.L. and D.F.; writing—review and editing, L.Y., J.L. and H.C.; supervision, L.Y. and H.C.; project administration, L.Y.; funding acquisition, L.Y. All authors have read and agreed to the published version of the manuscript.

Funding

This paper is supported by the National Key R&D Program of China (No. 2021YFB1600500).

Data Availability Statement

The raw data supporting the conclusions of this article will be made available by the authors on request.

Acknowledgments

We would like to thank the State Key Laboratory of Air Traffic Management System for providing the data used in the model tests described in this paper.

Conflicts of Interest

The authors declare no conflicts of interest.

References

  1. Lee, H.; Malik, W.; Zhang, B.; Nagarajan, B.; Jung, Y.C. Taxiing time prediction at Charlotte Airport using fast-time simulation and machine learning techniques. In Proceedings of the 15th AIAA Aviation Technology, Integration, and Operations Conference, Dallas, TX, USA, 22–26 June 2015. [Google Scholar]
  2. Murça, M.C.R. A robust optimization approach for airport departure metering under uncertain taxiing-out time predictions. Aerosp. Sci. Technol. 2017, 68, 269–277. [Google Scholar] [CrossRef]
  3. Wang, F.; Bi, J.; Xie, D.; Zhao, X. A data-driven prediction model for aircraft taxiing time by considering time series about gate and real-time factors. Transp. Metr. A Transp. Sci. 2023, 19, 2071353. [Google Scholar]
  4. Jeong, M.; Eun, Y.; Jeon, D.; Bang, H. Unimpeded Taxiing-Time Prediction Based on the Node–Link Model. J. Aerosp. Inf. Syst. 2020, 17, 591–602. [Google Scholar] [CrossRef]
  5. Jiao, Q.Y.; Li, N. Taxiing Time Prediction by Using Data Driven Approach: A New Perspective [Preprint]. Available at SSRN 4084964. 2022. [CrossRef]
  6. Kim, J.; Baik, H. Taxiing-Out Time Prediction at a Busy Airport using Random Forest Algorithm. In Proceedings of the 2021 IEEE/AIAA 40th Digital Avionics Systems Conference (DASC), San Antonio, TX, USA, 3–7 October 2021. [Google Scholar]
  7. Zhou, H.; Li, W.; Jiang, Z.; Cai, F.; Xue, Y. Flight Departure Time Prediction Based on Deep Learning. Aerospace 2022, 9, 394. [Google Scholar] [CrossRef]
  8. Zhang, Y.; Li, X.; Yin, J.; Zhou, X. Flexible Control of Aircraft Departure Rollout Based on Probabilistic Taxiing Time. Aeronaut. J. 2023, 44, 212–225. [Google Scholar]
  9. Wang, X.; Brownlee, A.E.; Woodward, J.R.; Weiszer, M.; Mahfouf, M.; Chen, J. Aircraft taxiing time prediction: Feature importance and their implications. Transp. Res. Part C Emerg. Technol. 2021, 124, 102892. [Google Scholar] [CrossRef]
  10. Li, N.; Jiao, Q.Y.; Zhang, L.; Wang, S.C. Using Deep Learning Method to Predict Taxiing Time of Aircraft: A case of Hong Kong Airport. J. Aeronaut. Astronaut. Aviat. Ser. A 2020, 52, 371–386. [Google Scholar] [CrossRef]
  11. Du, J.; Hu, M.; Zhang, W.; Yin, J. Finding Similar Historical Scenarios for Better Understanding Aircraft Taxiing Time: A Deep Metric Learning Approach. IEEE Intell. Transp. Syst. Mag. 2022, 15, 101–116. [Google Scholar] [CrossRef]
  12. Xia, Z.; Huang, L. Prediction of departure flights’ taxiing-out time based on intelligent algorithm optimized BP. Math. Probl. Eng. 2022, 2022, 6254251. [Google Scholar] [CrossRef]
  13. Lee, H.; Malik, W.; Jung, Y.C. Taxiing-out time prediction for departures at Charlotte airport using machine learning techniques. In Proceedings of the 16th AIAA Aviation Technology, Integration, and Operations Conference, Washington, DC, USA, 13–17 June 2016. [Google Scholar]
  14. Tang, X.; Chen, Z.; Zhang, S.; Ding, Y. Impact of Apron Spatial Configuration on Flight Departure Taxiing Time at Busy Airports. J. Transp. Syst. Eng. Inf. Technol. 2022, 22, 309. [Google Scholar]
Figure 1. Layout of Pudong International Airport.
Aerospace 11 00261 g001
Figure 2. Effect of corridor flow on departure taxiing time. (a) Effect of corridor departure flow; (b) effect of corridor arrival flow.
Aerospace 11 00261 g002
Figure 3. Correlation of departure flow proportion on departure taxiing time.
Aerospace 11 00261 g003
Figure 4. Departure taxiing time dataset construction process.
Aerospace 11 00261 g004
Figure 5. CNN-GRU-based departure taxiing time prediction model.
Aerospace 11 00261 g005
Figure 6. Prediction results of different models.
Aerospace 11 00261 g006
Figure 7. Comparison of 258 prediction errors. (a) Comparison of the first 129 prediction errors; (b) comparison of the last 129 prediction errors.
Aerospace 11 00261 g007aAerospace 11 00261 g007b
Table 2. Departure taxiing time feature set.
Feature CategoriesFeature Name
AirlineNumber of domestic airlines, number of foreign airlines
AircraftNumber of type C aircraft, number of type D aircraft, number of type E aircraft, and number of type F aircraft
Restricted statusNumber of restricted flights, number of unrestricted flights
Scene traffic flowNormalDeparture instantaneous flow at start time, departure instantaneous flow at end time, departure queue number, departure cumulative flow, and departure resource demand index
Structure relatedCorridor departure flow and departure flow proportion of ODP
Table 3. Optimal values of key parameters of the model.
ModelParameterValue
CNNThe size of kernels3 × 3
Sliding window step1
Padding0
GRUThe number of neurons128
Dropout rate0.2
Iteration rounds100
Table 4. Performance of four prediction models of 16-35R.
Model BaseMAERMSER2±3 min Accuracy±5 min Accuracy
LSTM2.825.330.750.710.84
CNN-LSTM2.654.950.780.740.85
GRU2.865.460.730.720.82
CNN-GRU2.454.600.810.750.88
Table 5. Performance of four prediction models of 1-35R.
Model BaseMAERMSER2±3 min Accuracy±5 min Accuracy
LSTM2.755.040.730.630.79
CNN-LSTM2.544.680.770.660.81
GRU2.714.620.740.630.76
CNN-GRU2.484.420.790.690.87
Table 6. Prediction performance under different ODP.
ODPMAERMSER2±3 min Accuracy±5 min Accuracy
16-35R2.454.600.810.750.88
16-17L2.404.660.820.730.87
16-16R2.695.320.770.680.81
16-34L2.585.290.780.700.82
1-35R2.484.420.790.690.87
1-17L2.544.520.800.670.85
1-16R2.294.390.800.740.87
1-34L2.324.350.820.760.89
Table 7. Prediction performance under different features of 16-35R.
Features Removed MAERMSER2±3 min Accuracy±5 min Accuracy
None2.454.600.810.750.88
Airline category2.474.660.800.710.86
Aircraft category2.484.630.790.710.85
Restricted status category2.484.690.790.700.87
Normal features of scene traffic flow2.664.810.770.660.81
Structure-related features2.584.780.780.680.82
Corridor departure flow2.524.750.790.690.85
Departure flow proportion of ODP2.494.700.790.730.86
Table 8. Prediction performance under different features of 1-35R.
Features Removed MAERMSER2±3 min Accuracy±5 min Accuracy
None2.484.420.790.690.87
Airline category2.484.530.780.660.86
Aircraft category2.504.560.770.670.85
Restricted status category2.494.610.770.630.85
Normal features of scene traffic flow2.714.720.750.600.81
Structure-related features2.644.680.770.630.83
Corridor departure flow2.604.630.770.650.84
Departure flow proportion of ODP2.574.610.780.680.85
Table 9. Prediction performance under different time slice.
Time SliceMAERMSER2±3 min Accuracy±5 min Accuracy
30 min2.455.070.800.720.85
45 min2.625.000.800.720.84
60 min2.454.600.810.750.88
75 min2.865.290.780.710.84
90 min2.895.390.740.720.83
Disclaimer/Publisher’s Note: The statements, opinions and data contained in all publications are solely those of the individual author(s) and contributor(s) and not of MDPI and/or the editor(s). MDPI and/or the editor(s) disclaim responsibility for any injury to people or property resulting from any ideas, methods, instructions or products referred to in the content.

