Article

Risk Assessment Method for UAV’s Sense and Avoid System Based on Multi-Parameter Quantification and Monte Carlo Simulation

by
Bona P. Fitrikananda
1,2,
Yazdi Ibrahim Jenie
1,*,
Rianto Adhy Sasongko
1 and
Hari Muhammad
1
1
Faculty of Mechanical and Aerospace Engineering, Institut Teknologi Bandung, Jl. Ganesha 10, Bandung 40132, Indonesia
2
PT. Dirgantara Indonesia, Jalan Pajajaran No. 154, Bandung 40174, Indonesia
*
Author to whom correspondence should be addressed.
Aerospace 2023, 10(9), 781; https://doi.org/10.3390/aerospace10090781
Submission received: 17 April 2023 / Revised: 26 August 2023 / Accepted: 28 August 2023 / Published: 1 September 2023

Abstract

:
The rise in Unmanned Aerial Vehicle (UAV) usage has opened exciting possibilities but has also introduced risks, particularly in aviation, with instances of UAVs flying dangerously close to commercial airplanes. The potential for accidents underscores the urgent need for effective measures to mitigate mid-air collision risks. This research aims to assess the effectiveness of the Sense and Avoid (SAA) system during operation by providing a rating system to quantify its parameters and operational risk, ultimately enabling authorities, developers, and operators to make informed decisions to reach a certain level of safety. Seven parameters are quantified in this research: the SAA’s detection range, field of view, sensor accuracy, measurement rate, system integration, and the intruder’s range and closing speed. While prior studies have addressed these parameter quantifications separately, this research’s main contribution is the comprehensive method that integrates them all within a simple five-level risk rating system. This quantification is complemented by a risk assessment simulator capable of testing a UAV’s risk rating within a large sample of arbitrary flight traffic in a Monte Carlo simulation setup, which ultimately derives its maximum risk rating. The simulation results demonstrated safety improvements using the SAA system, shown by the combined maximum risk rating value. Among the contributing factors, the detection range and sensor accuracy of the SAA system stand out as the primary drivers of this improvement. This conclusion is consistent even in more regulated air traffic imposed with five or three mandatory routes. Interestingly, increasing the number of intruders to 50 does not alter the results, as the intruders’ probability of being detected remains almost the same. On the other hand, improving SAA radar capability has a more significant effect on risk rating than enforcing regulations or limiting intruders.

1. Introduction

The rise in unmanned aerial vehicles (UAVs), or drones, has opened many exciting possibilities across various industries. However, this rise has also created new challenges and risks, particularly in the aviation industry. Incidences involving UAVs flying dangerously close to commercial airplanes in operation have been reported worldwide, with authorities often unable to locate both the drone and its operator afterward. These incidents exemplify the heightened risk of mid-air collisions or near-miss events during UAV operations in non-segregated airspace. The potential for fatal accidents resulting from such collisions underscores the urgent need for effective measures to mitigate this risk.
The potential hazards of UAV operation in non-segregated airspace have been widely studied and discussed in the literature. Several fundamental issues in UAV integration into the airspace were listed in [1,2], emphasizing safety issues and the importance of UAVs’ collision avoidance systems. Regulatory issues in UAVs’ operation were discussed in [3] as critical factors in ensuring an adequate “level of safety” and risks in the airspace. Management issues have also been addressed in [4], along with a proposal for a comprehensive risk management framework that is suitable for both long-term and short-term traffic planning. Furthermore, implications for the environment, such as on the near ground where UAVs operate, have also been studied [5]. Expanding on this topic, an innovative model that considers population density and infrastructure for accurate risk assessment and mitigation strategies has also been proposed [6].
Consequently, other research has addressed efforts to mitigate the risk of mid-air collisions for UAVs. The variation of approaches is highlighted in [7], which proposed a taxonomy of alternative Conflict Detection and Resolution (CD & R), spanning from procedural approaches to the use of onboard Sense and Avoid (SAA) systems. Procedural measures, such as flight planning and scheduling, can proactively enhance safety, such as task allocation in multi-UAV operations elaborated in [8], taking safety considerations to a more intricate level. Managing UAV traffic using a swarming mechanism, observed in various animal behaviors, could serve as a pivotal approach to mitigating collisions, particularly in high-density airspace scenarios [9]. However, the SAA system’s importance remains critical, as shown in [10], where numerous UAVs in high-density airspaces are simulated in a Monte Carlo simulation setup. Therefore, SAA development and advancement are always in the spotlight [11,12,13,14,15,16,17,18,19,20] when discussing UAVs’ operation in the airspace system.
Despite its advancements, however, assessing the SAA system’s effectiveness still needs to be improved. For instance, UAV developers and operators need more tools to measure whether the specifications of the SAA employed are already sufficient to achieve a certain level of safety. Furthermore, they need to be more informed about which part of the complex SAA system needs to be upgraded to improve safety levels efficiently. Therefore, it is necessary to define and quantify the parameters of an SAA system and rate their effectiveness in supporting UAV operations. Such quantification needs to consider both the inherent parameters of the SAA and the operational parameters that depend on the UAV’s possible encounter geometry during operations.
This research paper aims to provide a novel method for assessing the effectiveness of the SAA system in mitigating operational risks, especially for UAVs. Method development begins by defining the general parameters in various SAA systems and quantifying each of those parameters to rate their effectiveness. While prior studies have addressed the quantification of specific parameters separately, this research’s main contribution is the comprehensive method that integrates them all within a cohesive structure. This harmonized approach facilitates a holistic evaluation of the effectiveness of SAA systems in mitigating operational risks into a simple five-level risk rating system. The quantification is then complemented in this research by a risk assessment simulator. The simulator is specifically developed to test a UAV’s operation within a large sample of arbitrary flight traffic, ultimately determining its maximum risk rating on specific air traffic characteristics. Moreover, since the method is based on individual SAA parameters, it can also serve as a reference for developers to identify inadequate aspects of the SAA system to improve it efficiently. Additionally, authorities can use precise risk ratings and make informed decisions to develop the necessary regulations for the SAA system.
This article is structured as follows. After this introduction, Section 2 will explain elements of standard SAA systems, categorization, and their parameters, supporting the operation of UAVs. Section 3 describes the quantification method used to rank each SAA parameter. Section 4 will elaborate on developing a risk assessment simulator capable of generating various air traffic scenarios for UAV flights. The UAV risk rating assessment will be conducted in Section 5, with Monte Carlo simulations set up for en-route traffic involving ten intruders and three types of air traffic. Furthermore, additional simulations will explore the effects of different setups on risk rating assessments. Finally, Section 6 presents concluding remarks to wrap up this article.

2. Sense and Avoid System for UAV

The utilization of the SAA system is of utmost importance when it comes to preventing mid-air collisions for UAVs, which can significantly enhance safety and enable them to operate within a broader range of airspace. This section will explain the SAA system in three parts of the discussion: its main components, categorizations, and general performance parameters. The main components of the SAA system will assist in compiling the main parameters for carrying out the functions of the system. Categorization will help select the system to use for the UAV.

2.1. Components/Elements

The SAA system comprises two crucial components: Sensing Technology and Avoidance Technology, as described in [11,12]. Sensing technology uses sensors and cameras to detect potential obstacles in a UAV’s flight path. These sensors must accurately detect and track other aircraft, obstacles, and potential hazards in real time (sensing function) [13]. On the other hand, avoidance technology involves algorithms and software that allow the UAV to calculate whether the detected object poses a potential hazard (detecting function) and to take evasive action in the event of a potential collision (avoiding function).

2.1.1. Sensing Technology

Sensing technology is an essential component of the SAA system that enables UAVs to detect and avoid potential obstacles on their flight paths. The effectiveness of the SAA system is directly proportional to the type of sensor technology used. Various types of sensors can be utilized based on the method of detection required, as described in [14,15,16]. Currently, among the most commonly used sensing technologies are electro-optical (EO) cameras, Infra-red (IR) cameras, Light Detection and Ranging (lidar) sensors, and Radio Detection and Ranging (radar) sensors, as described in [17,18].
Optical cameras are cost-effective solutions that provide crucial visual information, similar to the eyes of a pilot. They can detect and identify objects at long distances with high precision, making them suitable for long-range detection. However, advanced processing (stereoscopy) is needed to calculate distances, and they depend on clear atmospheric conditions and adequate lighting for effective operation. Multiple cameras can also provide a three-dimensional view that helps to detect and track objects in the UAV’s flight path.
Lidar utilizes a laser system to emit pulses and detect the distance between objects within their lines of sight. It can detect the position and distance of objects with a high degree of precision, making it useful for applications that require accurate measurements. However, lidar provides a narrow field of view, making it unsuitable for monitoring a wide area and expensive due to its complex technology.
Conversely, radar uses radio waves to detect objects’ position, distance, and velocity. Although its resolution is lower than that of lidar, radar can operate in harsher atmospheric conditions and is generally a more affordable option. It can detect and track multiple objects simultaneously, making it suitable for monitoring a wider area. The development of synthetic aperture radar (SAR) has also enabled higher-resolution imaging, making it a potential alternative to lidar in specific applications.
The performance of these sensors can be evaluated using several parameters, including range, resolution, ability to operate in different lighting conditions, influence of weather conditions (such as rain, snow, or fog), image clarity, speed of object capture, sensor size, and price. Visual comparisons of performances, such as Figure 1, adapted from [17], can assist in selecting sensors for different UAV applications.
Radar technology is the most widely used sensor technology for SAA systems in UAVs. The maturity of radar technology and its ability to be used on a small scale make it a suitable option for small UAVs. Furthermore, radar technology has the advantage of being able to operate in all weather conditions, making it a robust option for outdoor environments. The use of radar to support the UAV SAA system is the focus of the method proposed in this research, although it can also be applied to other types of sensors.

2.1.2. Avoidance Technology

Avoiding technology includes detection and avoidance functions in SAA systems, which have several methodological approaches, as described in [15]. The detection function of the SAA involves detecting whether an object captured by the sensor has the potential for collision. The most common approach involves calculating the trajectories of the UAV and the intruder and estimating the distance between them over time. A collision is likely if the distance between the two is smaller than a predetermined threshold. One study employs a worst-case estimation method, considering all possible intruder trajectories that could intersect the UAV’s path [16]. Another approach involves estimating probabilities, where a model is established for the UAV and the intruder, accommodating the calculation of uncertain factors and probability distributions [17]. A Monte Carlo simulation is then used to calculate the likelihood of a collision occurring. A different approach is used for SAA systems that use visual or camera sensors. Instead of estimating the likelihood of a collision, the system acts more defensively and proactively in response to any detected obstacle, as discussed in [19,20].
The avoidance function of the SAA system involves initiating an evasive maneuver if the object or intruder has the potential for collision. Several approaches have been proposed for calculating this evasive maneuver. One such study uses a geometric approach, calculating the movement vectors of the difference between the UAV and the intruder aircraft in a two-dimensional environment to determine the shortest distance between them [21]. The trajectories of the UAV and the intruder aircraft are then altered based on the shortest distance vector obtained, widening the shortest distance to prevent collisions. In addition to these calculations of evasive maneuvers, several modeling studies have been conducted, such as [22]. This mathematical model is based on having onboard proximity sensors on the UAV and considers flight constraints as part of the sensor input. Another approach to enhancing collision avoidance capabilities is presented in [23]. The author introduces a mathematical model that employs quantum computing to address the complex issue of mission planning for multiple Unmanned Aerial Vehicles (UAVs) while implementing efficient conflict management strategies to maintain airspace safety. The proposed model specifically tackles the UAV collision avoidance problem by mapping it as a problem called the Quadratic Unconstrained Binary Optimization problem.

2.2. Category of Sense and Avoid System

SAA systems for UAVs can be categorized into two main groups according to their approach to detecting and evading other aircraft in airspace: cooperative and non-cooperative [8,24]. Cooperative SAA systems rely on the active participation of other aircraft in airspace, providing information on their position, velocity, and trajectory. This information can be transmitted using various communication technologies, such as Automatic Dependent Surveillance-Broadcast (ADS-B) or Traffic Information Services Broadcast (TIS-B). With this information, the UAV can plan its trajectory to avoid other aircraft collaboratively. Non-cooperative SAA systems, in contrast, depend on sensors, such as radar or lidar, to detect other aircraft in the airspace without requiring their active participation. These systems can provide information about other aircraft’s position, velocity, and trajectory, even if they are not equipped with communication technologies, such as ADS-B or TIS-B. The UAV can then use this information to independently plan its trajectory and avoid other aircraft.
Both cooperative and non-cooperative SAA systems offer advantages and disadvantages. Cooperative SAA systems can provide more accurate and timely information about other aircraft in airspace, but they depend on the active participation of these aircraft. Non-cooperative SAA systems, being more autonomous, do not rely on the active participation of other aircraft, but they can be more complex and may require more sophisticated sensors and algorithms. Table 1 summarizes the key points from each category and the associated technology based on references [12,24,25].
The selection of a cooperative or non-cooperative SAA system for a UAV is contingent upon its unique specifications and limitations. Factors that must be considered include the operational environment, scale, and mission characteristics of the UAV, the availability of communication technologies, and interaction with other aircraft in the airspace. By meticulously assessing these components, an appropriate SAA system can be chosen to ensure secure and efficient navigation within the designated airspace.

2.3. General Parameters of the Sense and Avoid System

The definition and quantification of SAA system parameters are vital to evaluating its performance. These parameters can be examined from two points of view, as summarized in Figure 2. The first is based on the inherent characteristics of the SAA system, while the second focuses on the operational aspects of the UAV that carries the SAA.
The first set of parameters is concerned with the intrinsic capabilities of the SAA system, excluding external factors, such as other objects or intruders. Given the variety of SAA systems, defining a set of parameters that applies to a wide range of types is necessary. Generally, there are standard specification requirements for all SAA systems that can serve as performance measurement parameters. Reference [13] outlines five essential requirements: detection range, field of view, sensing accuracy, measurement rates and latencies, and system integration. These parameters are commonly essential for developers when choosing an SAA system for their UAV.
The second set of parameters focuses on the operational aspects of the SAA system, which focuses on external factors such as the presence of intruders in the flight environment. In this research, these factors are represented as the parameters of the intruder range and the closing speed. These two are closely connected to the five parameters mentioned in the first set and are crucial for thoroughly evaluating the SAA system’s performance.
Overall, seven parameters are to be quantified in this research to develop a rating system of the SAA system supporting UAV operation.

3. SAA Multi-Parameter Quantification

The parameters used for quantification can vary depending on the context and specific requirements of the system, which encompass both the technical specifications of the system and its operational use. Parameters for this quantification are based on the previously described parameters in Figure 2 and are listed again in Table 2. Parameters 1 to 5 represent the inherent parameters of the SAA system, while parameters 6 and 7 are related to the encounter geometry of the UAV operation.

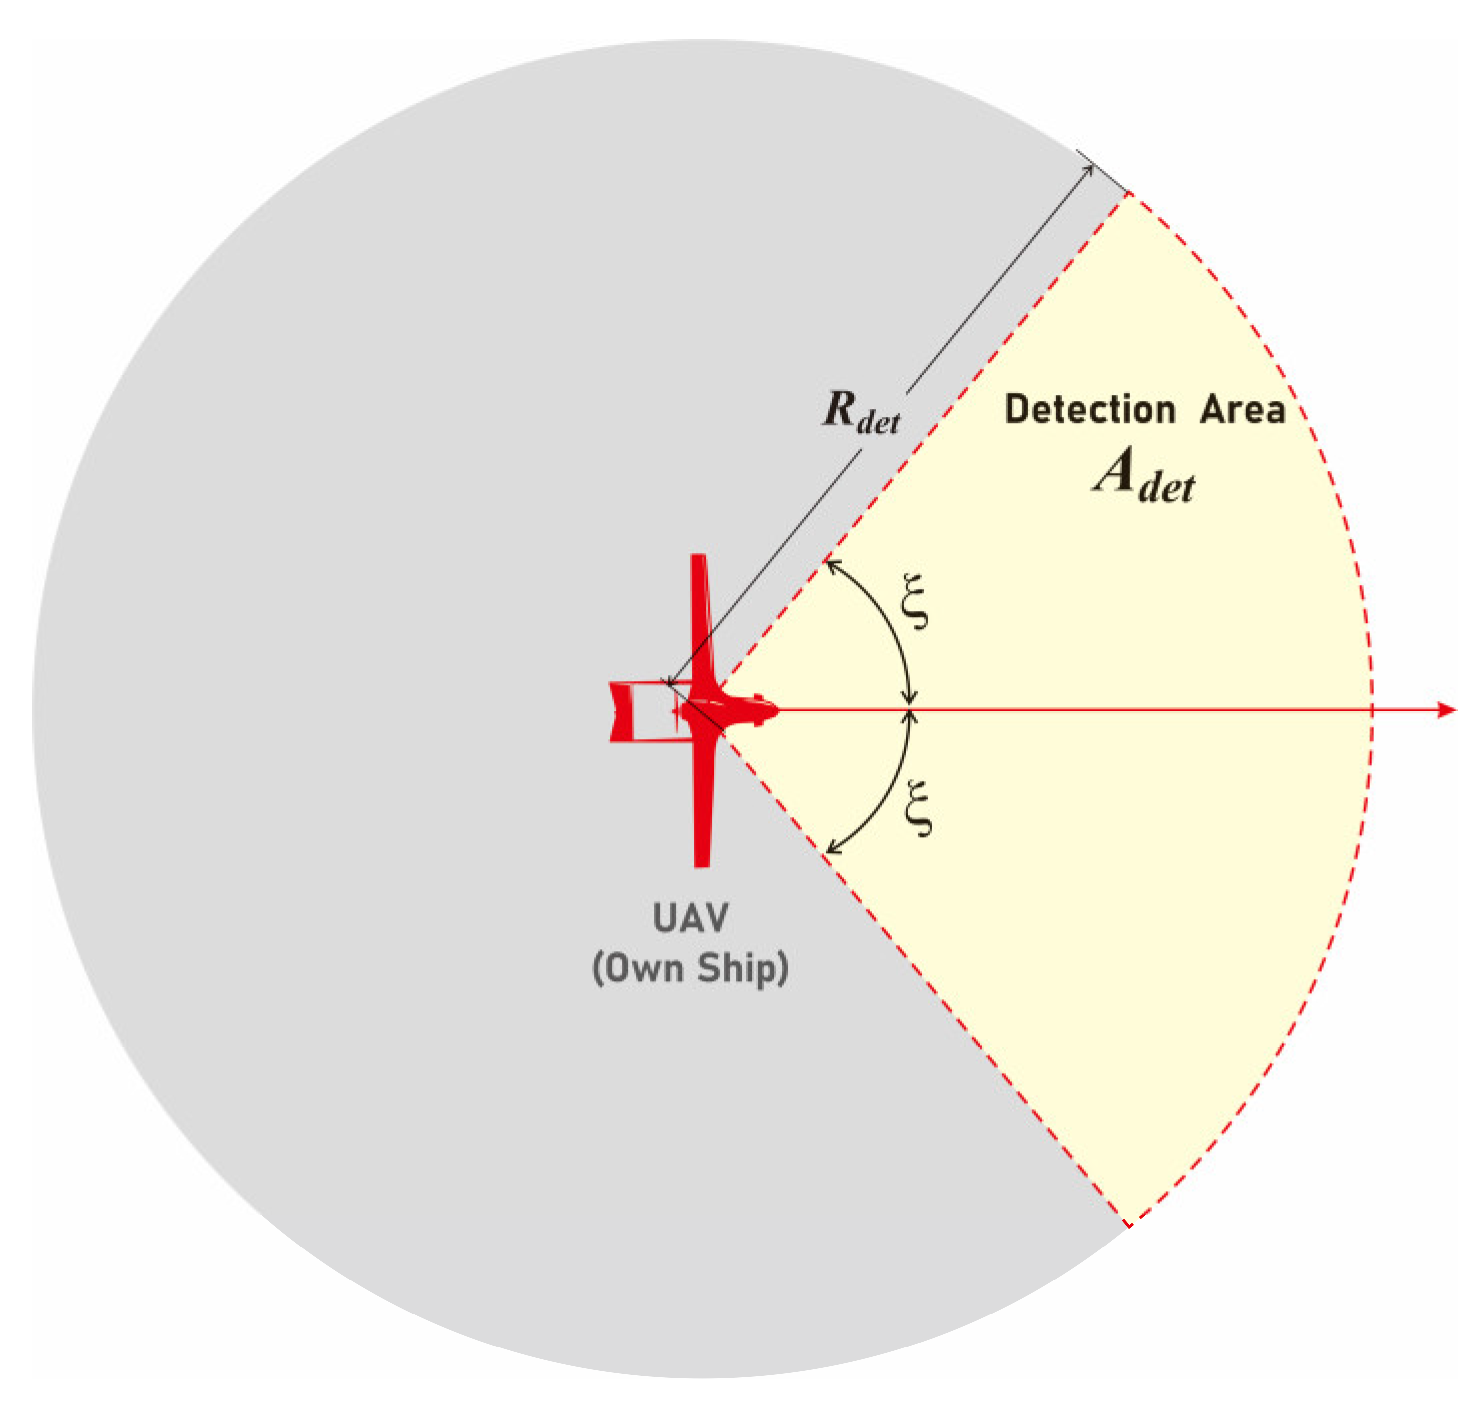
3.1. Detection Range (DR)

The DR parameter measures the maximum distance from which the SAA system can detect an object or intruder. Generally, a more extended detection range is desirable to provide more time for the system to react to and prevent collisions. The exact value depends on the type of sensor used in the system. For example, the detection range of radar sensors depends on the radar wave frequency, with high-frequency waves offering higher resolution and more extended detection ranges compared to low-frequency waves. On the other hand, the detection range of EO cameras depends on the camera lens, where lenses with longer focal lengths provide a wider field of view and a more extended detection range.
In the risk assessment process, the detection range ( R d e t ) is divided by the minimum avoidance range ( D M A R ) to obtain the detection distance ratio. The minimum avoidance range refers to the minimum distance required for a UAV to perform evasive maneuvers safely. Each aircraft has unique maneuvering limitations, depending on its capabilities, leading to variations in the minimum avoidance range among aircraft. A geometrical approach depicted in Figure 3 is used to measure this range to generalize the DR quantification.
The equation used to calculate the D M A R , therefore, can be presented as,
D M A R = R s e p 2 V u 2 g n 2 1 + R s e p + V Δ τ ,
where
V Δ = V u + V i cos ξ .
This detection distance ratio, annotated as D1, is the chosen metric to assess the risk rating of the SAA sensor detection range and is presented as
D 1 = R d e t D M A R .
where R d e t is the detection range and D M A R is the minimum avoidance range.
D1 measures the sensor system’s efficiency and effectiveness in detecting potential hazards compared to the vehicle’s capability to conduct required mid-air collision avoidance. If the detection distance exceeds the minimum avoidance distance, the UAV has enough time to avoid a collision. On the contrary, if the detection distance is smaller than the minimum avoidance distance, hence D1 < 1, the UAV may not have enough time to perform evasive actions, increasing the likelihood of a mid-air collision. Therefore, the value of 1 is used as the shortest safe detection range, equivalent to a rating of 5. On the other hand, any D1 that is larger than one will be considered to have a safe distance to avoid, as shown in Table 3. Any value larger than 2, where the detection range is twice the D M A R , will be considered to have a rating of 1 or very safe. Other ratings are simply an equidistant partition from 1 to 2.

3.2. Field of View (FOV)

The FOV is a parameter that determines the area or volume that the SAA system can monitor during operation. A broader detection area allows the SAA system to monitor more space and detect objects more effectively, thus reducing mid-air collision risks. The detection area can be two-dimensional or three-dimensional, depending on the system requirements.
In a two-dimensional case, the risk rating of this parameter is calculated by dividing the area of a full circle by the detection area limited by the system’s FOV, as shown in Figure 4.
This research assumes that the detection area is a sector of a circle, and therefore, D2, the rating for the field of view, can be determined by
D 2 = A c i r c l e A d e t = 360 ° 2 ξ .
A higher D2 ratio indicates that the system has a narrower detection area and is therefore less capable of detecting potential intruders, leading to a higher risk of mid-air collisions. In contrast, a lower D2 ratio means that the system has a broader detection area and is better equipped to detect potential intrusions, thus reducing the risk of a mid-air collision. The rating of this parameter is represented in Table 4, which displays the relationship between the D2 ratio and the risk of mid-air collision. Naturally, the largest FOV that an SAA can provide is 360°, corresponding to D2 = 1, and should be the safest FOV rating. Conversely, the highest risk rating limit is set to be 5, equivalent to a FOV of 72°, which is in the range of the typical lowest field of view for consumer drones’ cameras, 70–80°.

3.3. Sensor Accuracy (SA)

SA is an essential aspect of the SAA system that must be evaluated to determine its effectiveness. High accuracy is critical for the system to make informed decisions about an object’s presence and potential danger. Factors that determine the accuracy include the type of sensor used, the operating conditions, and the hardware and software processing the sensor data. Ensuring a high level of accuracy is vital to reducing the risk of mid-air collisions and ensuring the safe operation of UAVs.
Measuring SA depends on the type of sensor employed. The signal-to-noise ratio (SNR) parameter is used in this research as a general parameter to determine the accuracy of various sensors by measuring the amount of noise the radar captures when detecting an object. A higher SNR value indicates a more dominant signal over noise, resulting in more minor measurement errors, as depicted in Figure 5.
For radars, the SNR value can be calculated by
SNR = P T G T G R λ 2 σ 4 π 3 R 4 k T o B F n L ,
where P T is the transmitter’s peak transmit power, G T is the directive gain, G R is the receiver, R is Range, K is the Boltzmann constant, T o is Reference Temperature, B is the effective noise bandwidth, F n is the radar noise figure, L is losses, λ is Wavelength, and σ is the target radar cross-section.
Utilizing the SNR, the SA can be quantified using the measurement error ratio ( δ R ). This parameter compares the detected object’s relative position with its actual position with the speed of light c , such that
δ R c 2 B 2   SNR
The rating of SA is then calculated as the ratio of the measurement error ( δ R ) to the minimum avoidable range ( D M A R ). This ratio, annotated as D2, is calculated by
D 3 = δ R D M A R .
The D3 ratio provides a clear indication of the reliability of the measurement results and allows for a quick evaluation of the sensor’s performance. The accuracy of radar detections is directly proportional to the size of the measurement error: the smaller the measurement error, the more accurately the radar will detect the object. Therefore, for the D3 ratio, a smaller value will indicate a lower measurement error and more accurate detection, as listed in Table 5 for easy reference. The highest rating is set to have a measurement error of more than 0.15% of the D M A R . If the D M A R is equal to the typical radar separation, which is 9260 m (5 NM), then the value represents 13.9 m of accuracy, close to the ICAO recommendation of 14.5 m for the accuracy of air traffic control’s surveillance radar.

3.4. Measurement Rate (MR)

The MR parameter dictates the SAA’s ability to detect and measure objects in the environment promptly and accurately to make timely and effective decisions, ensuring aircraft safety. The Hits per Scan is an essential metric for measuring MR for SAA, which employs a radar system. This parameter indicates the number of objects detected in one scan sweep and directly reflects the system’s ability to quickly capture and measure objects, as shown in Figure 6. The higher the value of hits per scan, the faster the radar can detect objects and provide crucial information to the SAA system for evasive action.
The values of hits per scan are determined by the dwell time ( T D ) and pulse repetition time (PRT) values. The T D represents the time the radar is focused on one point, while PRT is the time between successive pulses. Since this metric is already non-dimensional, it can be used directly as a rating for MR. Annotated as D4, the MR rating is calculated by,
D 4 = T D PRT = θ A Z ω PRT ,
where θ A Z is the radar beam width in degrees, and ω is the turning rate in degrees/seconds.
The D4 value indicates the number of objects detectable in a single scan sweep and reflects the system’s ability to detect objects rapidly and accurately. A higher D4 value means a higher hits-per-scan value, which suggests faster object measurement and lowers the MR risk rating, as listed in Table 6.

3.5. System Integration (SI)

The SI parameter represents how well the signal from the SAA sensor is communicated through the UAV flight computer system (FCS) and finally manipulates vehicle maneuvers. This wellness is crucial to ensure the effectiveness of the avoidance process since most developments of SAA sensors, FCS, and the vehicle are being carried out independently. Achieving compatibility between the SAA system’s output format and the flight control system’s input format is vital for seamless integration.
Several system integration concepts exist between the SAA and FCSs, as shown in Figure 7. If the SAA system employs sensors with analog output, a converter is necessary to transform the output into a digital format that is compatible with the FCS. On the other hand, a sensor with digital output might be readily compatible with the FCS, although it might still require some format adjustment. A similar transformation and adjustment will also be needed for signal continuation to the UAV control surfaces.
Converting the SAA system’s output from analog to digital may induce delays, potentially increasing latency and reducing real-time responsiveness. Compatibility and the usage of digital formats are imperative for seamless system integration between SAA and aircraft control systems. For SAA systems that use digital output, such as radar, output formats are essential for smooth integration. Although most modern radar systems employ digital formats, verifying compatibility between the specific formats used by SAA and FCSs is crucial, as different FCSs may utilize various data formats. To quantify this parameter, we analyzed the current output of the SAA system. Table 7 lists the output types associated with SAA systems.
The rating of these system integration parameters can be seen in Table 8 below.

3.6. Range of Intruder (RI)

The RI parameter is a non-inherent parameter for the SAA but plays a critical role in a UAV’s ability to evade potential collisions. This measurement assesses the distance between the UAV and other objects in its vicinity, including stationary objects, such as buildings, and moving objects, such as other aircraft, whether unmanned or manned, as shown in Figure 8.
To accurately determine this distance, it is essential to calculate the trajectories of both the UAV and the intruder by determining their positions and directions of motion. The risk rating for this parameter is annotated as D5, which is the ratio between the distance between the UAV and the intruder and the minimum avoidance range ( D M A R ), such that
D 6 = X D M A R ,
where X is the distance UAV from the intruder distance.
It should be emphasized that both the intruder range parameter and the detection range are critical for ensuring safety during flight. A high rating in the range of intruder parameters signifies that the UAV is better equipped to detect potential hazards and execute the necessary maneuvers to prevent collisions. On the contrary, a low D6 ratio implies the intruder’s proximity to the aircraft, presenting a higher risk and yielding a higher rating value. By using this ratio, the parameter rating values can be seen in Table 9. The value limits are chosen in the same way as the DR.

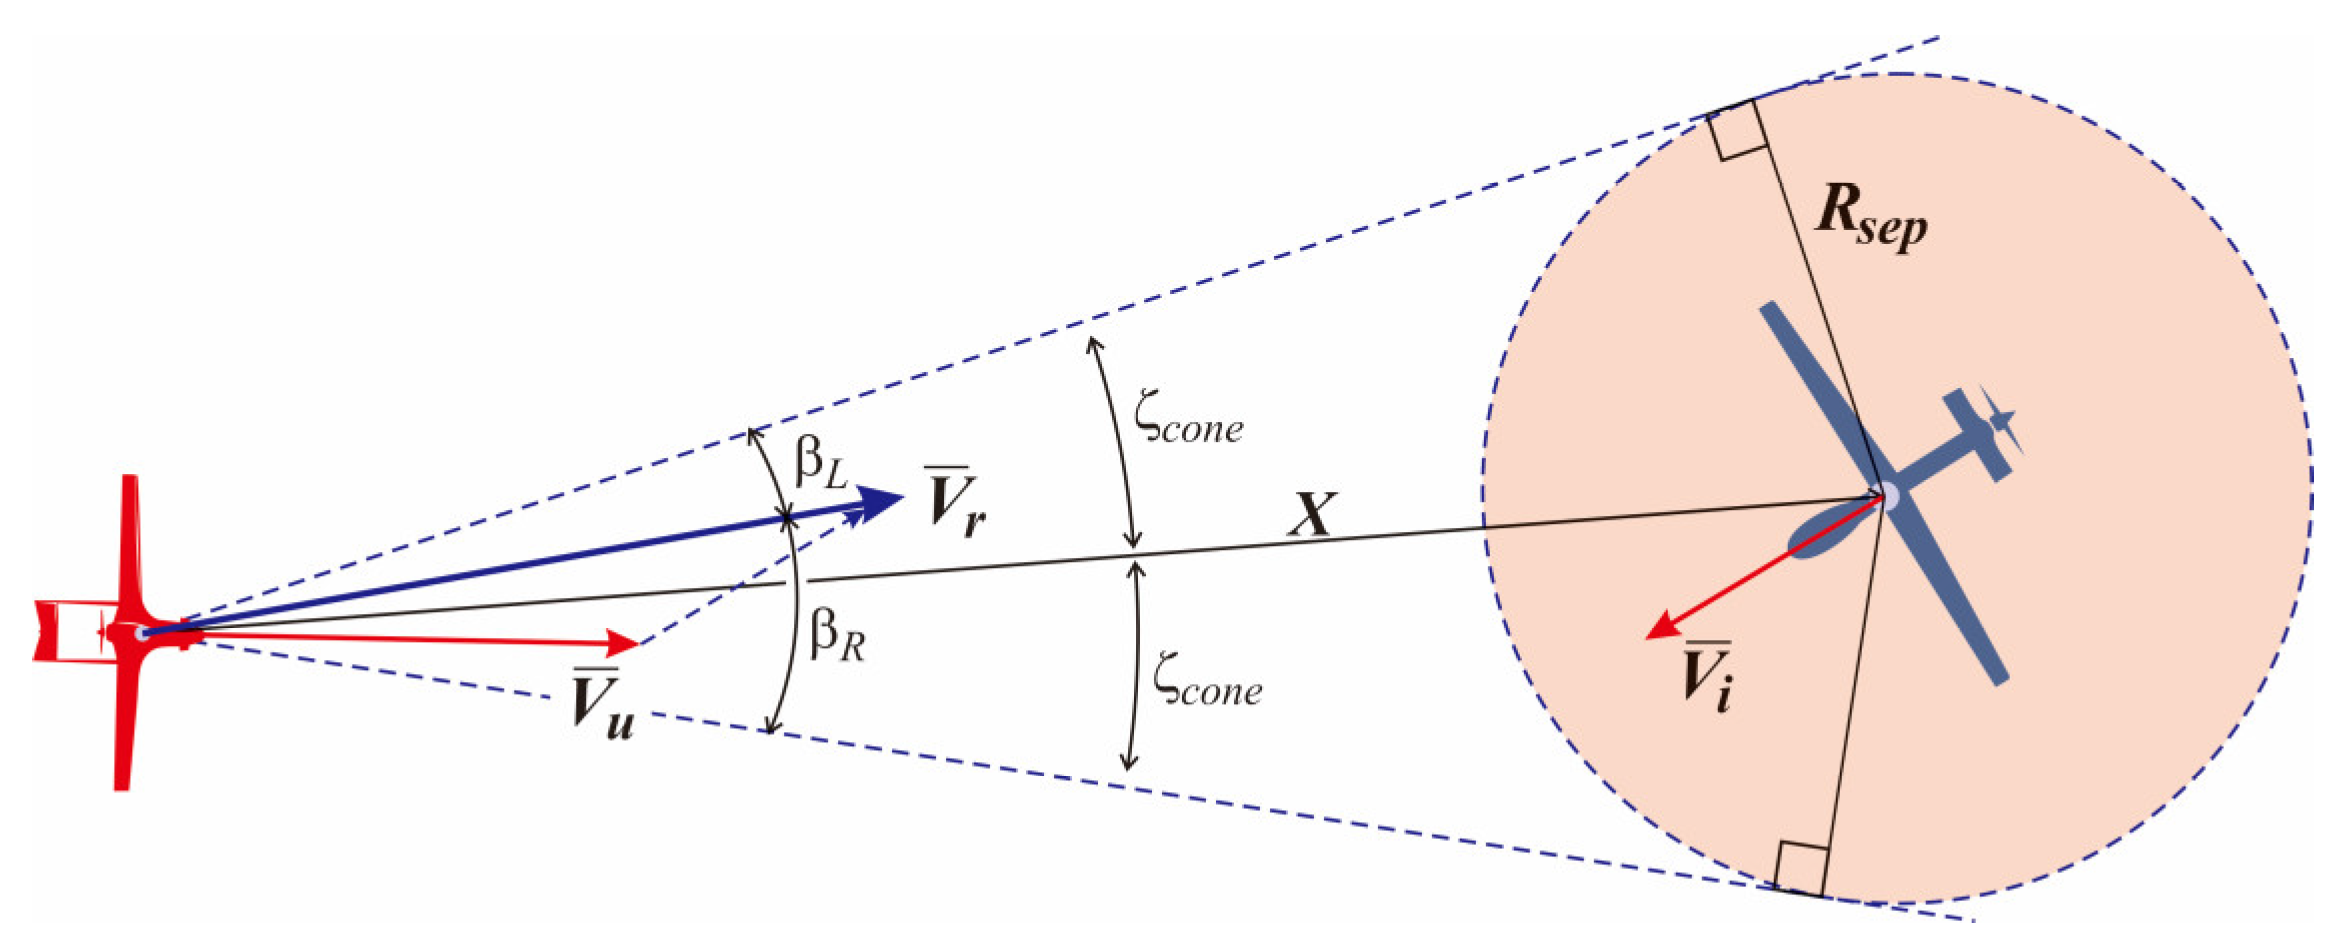
3.7. Closing Speed (CS)

The CS parameter is another non-inherent metric for assessing the potential risk of mid-air or near-mid-air collisions. This parameter quantifies the speed at which the UAV and the intruder get close to each other, calculated by determining the difference in their respective rates of change in distance and direction. Essentially, the closing speed represents the resultant velocity of the UAV and the intruder.
The geometric approach of the approaching velocity can be used to evaluate this parameter, as illustrated in Figure 9. This figure depicts the resultant velocity ( V ¯ r ) as a combination of the UAV’s velocity ( V ¯ u ) and the intruder’s velocity ( V ¯ i ). Additionally, the intruder’s safe separation radius ( R s e p ) is shown, serving as a reference to determine whether the UAV and the intruder are on a potential collision course. The distance ( X ) between the UAV and the intruder is also calculated; if this distance falls below the safe separation radius, it indicates a potential mid-air collision risk.
To better understand this concept, a geometric approach called the Velocity Obstacle method [25] is employed to evaluate the closing speed. A reference point is established using the UAV’s position, from which a tangent line is drawn to the separation area circle of the intruder. This results in a cone with the UAV’s tip and tangent to the circle of separation from the intruder.
The original velocity obstacle method establishes a means of assessing the likelihood of a collision between a UAV and an intruder. According to this method, a collision is likely if the resultant velocity Vr,
V ¯ r = V ¯ u V ¯ i
falls within the cone between the UAV and the intruder’s separation area. The collision probability increases as the closing speed nears the center and decreases as it approaches the cone’s edge. A collision is therefore considered improbable if the resultant velocity lies outside the cone.
Equation (11) quantifies the risk using the ratio between the closing speed and the cone angles. This ratio indicates collision potential, with higher ratios corresponding to an increased likelihood of a collision.
D 7 = arg min β L , β R ζ c o n e
A lower D7 angle ratio corresponds to a reduced collision probability, providing the aircraft with a broader range of opportunities to execute evasive maneuvers and avoid collisions. In essence, the lower the angle ratio, the greater the chance for the aircraft to avoid a collision and the lower the risk. The angle ratio D7 is used to compute the rating and indicates the aircraft’s ability to maneuver around the intruder, as listed in Table 10. The values of the D7 limits are determined by partitioning the collision cone into five.

4. Risk Rating Assessment Simulator

In the context of testing the assessment method described in Section 3, a simulator has been developed to generate various situations of UAV operation in the airspace. This simulator can simulate multiple vehicles, i.e., own-ship and intruders, moving within a designated area starting from initial speeds, positions, and headings, which can be arranged or left random.
The SAA predetermined parameters, such as the radar’s detection range, field-of-view, or dwelling time, can be initialized for the ownship UAV, from which the quantified parameters and the risk rating of the SAA system used can be calculated throughout the simulation. The simulator is designed to run multiple simulations in a Monte Carlo framework, allowing for a probabilistic analysis of the risks involved in UAV operations.
The risk rating for the SAA parameters to be calculated is the risk of ownship from each of the intruders. The main results will be the maximum rating of the UAV for each SAA parameter in every time step and for the whole simulation time. Ultimately, a combined maximum risk rating can be obtained by averaging the rating of each SAA parameter rounded up to the next integer.

4.1. Area of Observation

Figure 10 presents the visualization of the simulation area, which, at initialization, is populated with one ownship at the center and a predefined number of intruders around it. In this research, the simulation area is 20 × 20 km square.
Observation of risks for the ownship, however, is only conducted for vehicles within the Observation Area (OA), the 9260 × 9260 m (or 5 × 5 NM) square centered from the ownship. The size matches the minimum radar horizontal separation distance in en-route airspace, which is commonly used by airspace controllers. The SAA parameters to be computed in OA will focus on the Range of Intruder (RI) and the Closing Speed (CS). The other five parameters (DR, FOV, SA, MR, and I) for each vehicle inside the OA will be given the highest risk rating of 5 since they intrude on the radar separation while it is not yet detectable. However, vehicles that will not cross the centerlines of the area (OA = 1, DA = 0) and those outside the OA (OA = 0) will be given the lowest risk rating of 1 for all seven SAA parameters.
The intruders will be considered to be detected when they lie within the sectoral area called the Detection Area (DA), an area that represents the SAA sensor range and field of view, hence the circular sector shape. Only inside this area will the other five SAA parameters (DR, FOV, SA, MR, and I) be calculated.

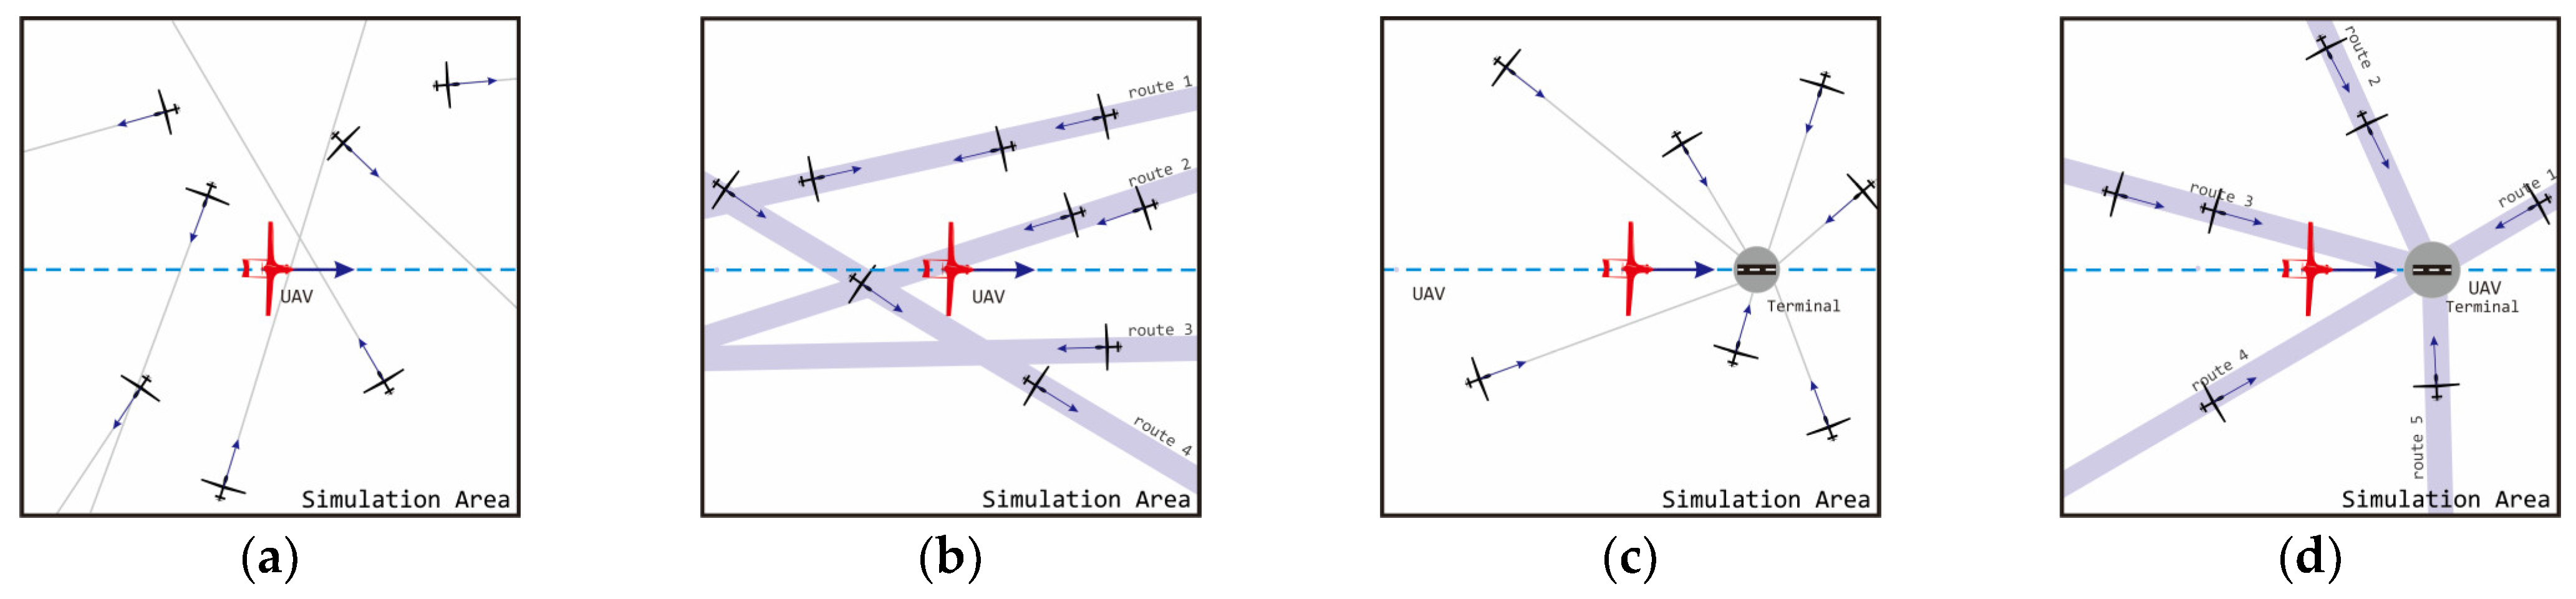
4.2. Initial Positions and Air Routes

The simulation area is then populated with several vehicles whose positions and headings can be set randomly around an ownship (the subject UAV). The ownship will always be positioned at the center of the simulation area, heading to the right.
A purely randomized setup, however, cannot represent realistic encounters in airspace since, in reality, most existing air traffic has definitive routes. Therefore, to accommodate the routes while maintaining adequate randomness, the simulator can generate the intruders’ initial positions within the simulation area using two setups:
  • Random points, where a certain number of intruders are positioned randomly; each is given constant but random headings. The range of headings is limited to the opposite quadrant of the initial position to avoid the intruder’s immediate leave.
  • Random within routes, where a certain number of routes with random headings are generated before placing intruders around them. The routes are maintained close to the UAV. Each intruder heading, therefore, follows the heading of the routes.
Several flight conditions can be created using these two choices, as illustrated in Figure 11. Figure 11a,c depicts uncontrolled airspaces where intruders can move freely without navigational routes. On the other hand, Figure 11b,d illustrates a more realistic situation of a UAV flying through the traffic of other flight vehicles, which most likely have a predetermined air route.
Another simulator capability is to select intruders’ headings toward an approximate point in the center of the Area of Interest, as illustrated in Figure 11c,d. This option represents scenarios near an aerodrome where an intruder heads toward a central point, either with or without predefined air routes.

4.3. Vehicle Kinematics

In this research, the simulator is run with the assumption that the ownship and intruders travel in a straight line at a constant speed. In general, for dynamic conditions, the discrete motion equations for both the UAV and the intruders can be calculated using Equation (12) for the positions ( x ¯ ) at each time step, using their respective velocities ( V ¯ ) and the time step setting ( Δ t ),
x ¯ k + 1 = x ¯ k + V ¯ ( k ) Δ t .
Since velocities are constant, the simulation will not include any avoidance maneuvers. Moreover, there will be no collision model, meaning that the simulated vehicles will go straight through one another whenever their positions coincide. This setup is chosen since the method to be analyzed focuses on the dynamics of risk and the ratings in the simulated scenarios without the effect of any maneuver, including avoidance. Instead, the obtained rating progression can serve as a valuable guide for making informed decisions on avoidance strategies.

4.4. Test Run: Superconflicts

In order to see how well the simulator performs, two preliminary superconflict scenarios are simulated. While those scenarios are extreme and most likely will never happen in real life, they can be used to test whether the simulator’s behavior on its limits is as expected. Superconflict scenarios are also conducted by [26,27] to test the performance of their algorithms.
The first superconflict scenario, referred to as the “Wall of Intruders,” involves the ownship (UAV) facing seven intruders moving parallel in the opposite direction, as shown in Figure 12a. In this case, each of the 30 intruders is separated by 330 m, and all vehicles travel at the same speed of 55 m/s. In this setup, the ownship has a detection area with a radius of 1500 m and an FOV of 120°. The second superconflict scenario is the “Converging-30”, as shown in Figure 12b. Here, the ownship flies through 30 intruders that are all heading toward a point in the center of the simulation area. All vehicles are initially equally distanced, and since they have the same speed (55 m/s), they will arrive at the center simultaneously. Therefore, risk changes due to various intruders’ encounter angles can be conducted.
The simulator was able to conduct the superconflict scenarios and listed the intruders’ status progressions accordingly, as shown in Figure 13a,b. Figure 13a shows that in the Wall of Intruder scenario, most of the intruders never went inside the detection area, which resulted in a minimum risk rating average. Intruders that go inside the OA will not give any treatment (shown in yellow), except one that is in line with the ownship (shown in red). However, A few intruders went inside the DA briefly (shown in blue), which then changed the SAA parameter risk ratings.
Figure 13b shows the status progression in the Converging-30 superconflict scenario. Unlike the previous one, here, all intruders went inside the DA, increasing risk to the ownship, shown by the increase of the yellow area (OA = 1, DA = 1) up until the 25th second. Afterward, while still inside the OA, the number of vehicles that a treat reduces as the ownship moves forward, effectively escaping the converging point, as shown by the increase in the green area (OA = 1, DA = 0). At the 50th second, some vehicles began to penetrate the DA, where the risk rating of each SAA parameter would change, as presented by the increase in the red area in Figure 13a,b, which eliminates abruptly after the 60th second due to the field of view boundary.

5. Monte Carlo Simulations, Results, and Analyses

The UAV operation risk assessment method was tested in numerous randomly simulated scenario samples in a Monte Carlo simulation setup. The main parameter to be obtained is the average maximum rating value throughout the samples; for every sample added, the average maximum rating value will change. As the number of samples increases, the average value becomes convergent and stops changing at a particular value due to the increasing denominator. Therefore, the reliability of the Monte Carlo simulation evaluation is evaluated by the convergence of the calculated value, as described in [10,28].
The simulation scenarios focus on the situation during an en-route flight, where the ownship (UAV) is moving through the predefined air traffic of 10 other aircraft. These scenarios are generated automatically by randomizing the intruder’s initial positions and headings within the simulated area in three types of traffic that are increasingly regulated: free-flight (no routes), 5-routes, and 3-routes traffic. Figure 14 visualizes one example scenario for each of the three traffic types.
Table 11 summarizes the scenario used, along with other constant values that are set for the simulation. As shown in the table, the simulation work in this research will also test the variation in the number of intruders and the types of radar in terms of its range and field of view.

5.1. Test for Convergencies

Figure 15 shows the convergence of the calculation with 150 samples, calculating the average maximum risk rating for the SAA parameters: DR, SA, MR, RI, and CS. These SAA parameters are affected by the position and velocity of every intruder at each time step. The jaggy line of the plot is caused by the discrete nature of the ratings, which can only result in integers. Another insight from the plot is that, most of the time, the intruders will have a rating of 5 (most risky), and on several less often occasions in the samples, they can change to a lower rating. The simulation was conducted for ten intruders and one ownship (UAV), each having a speed of 40 m/s and flying without air routes. All other setups are shown in Table 11.

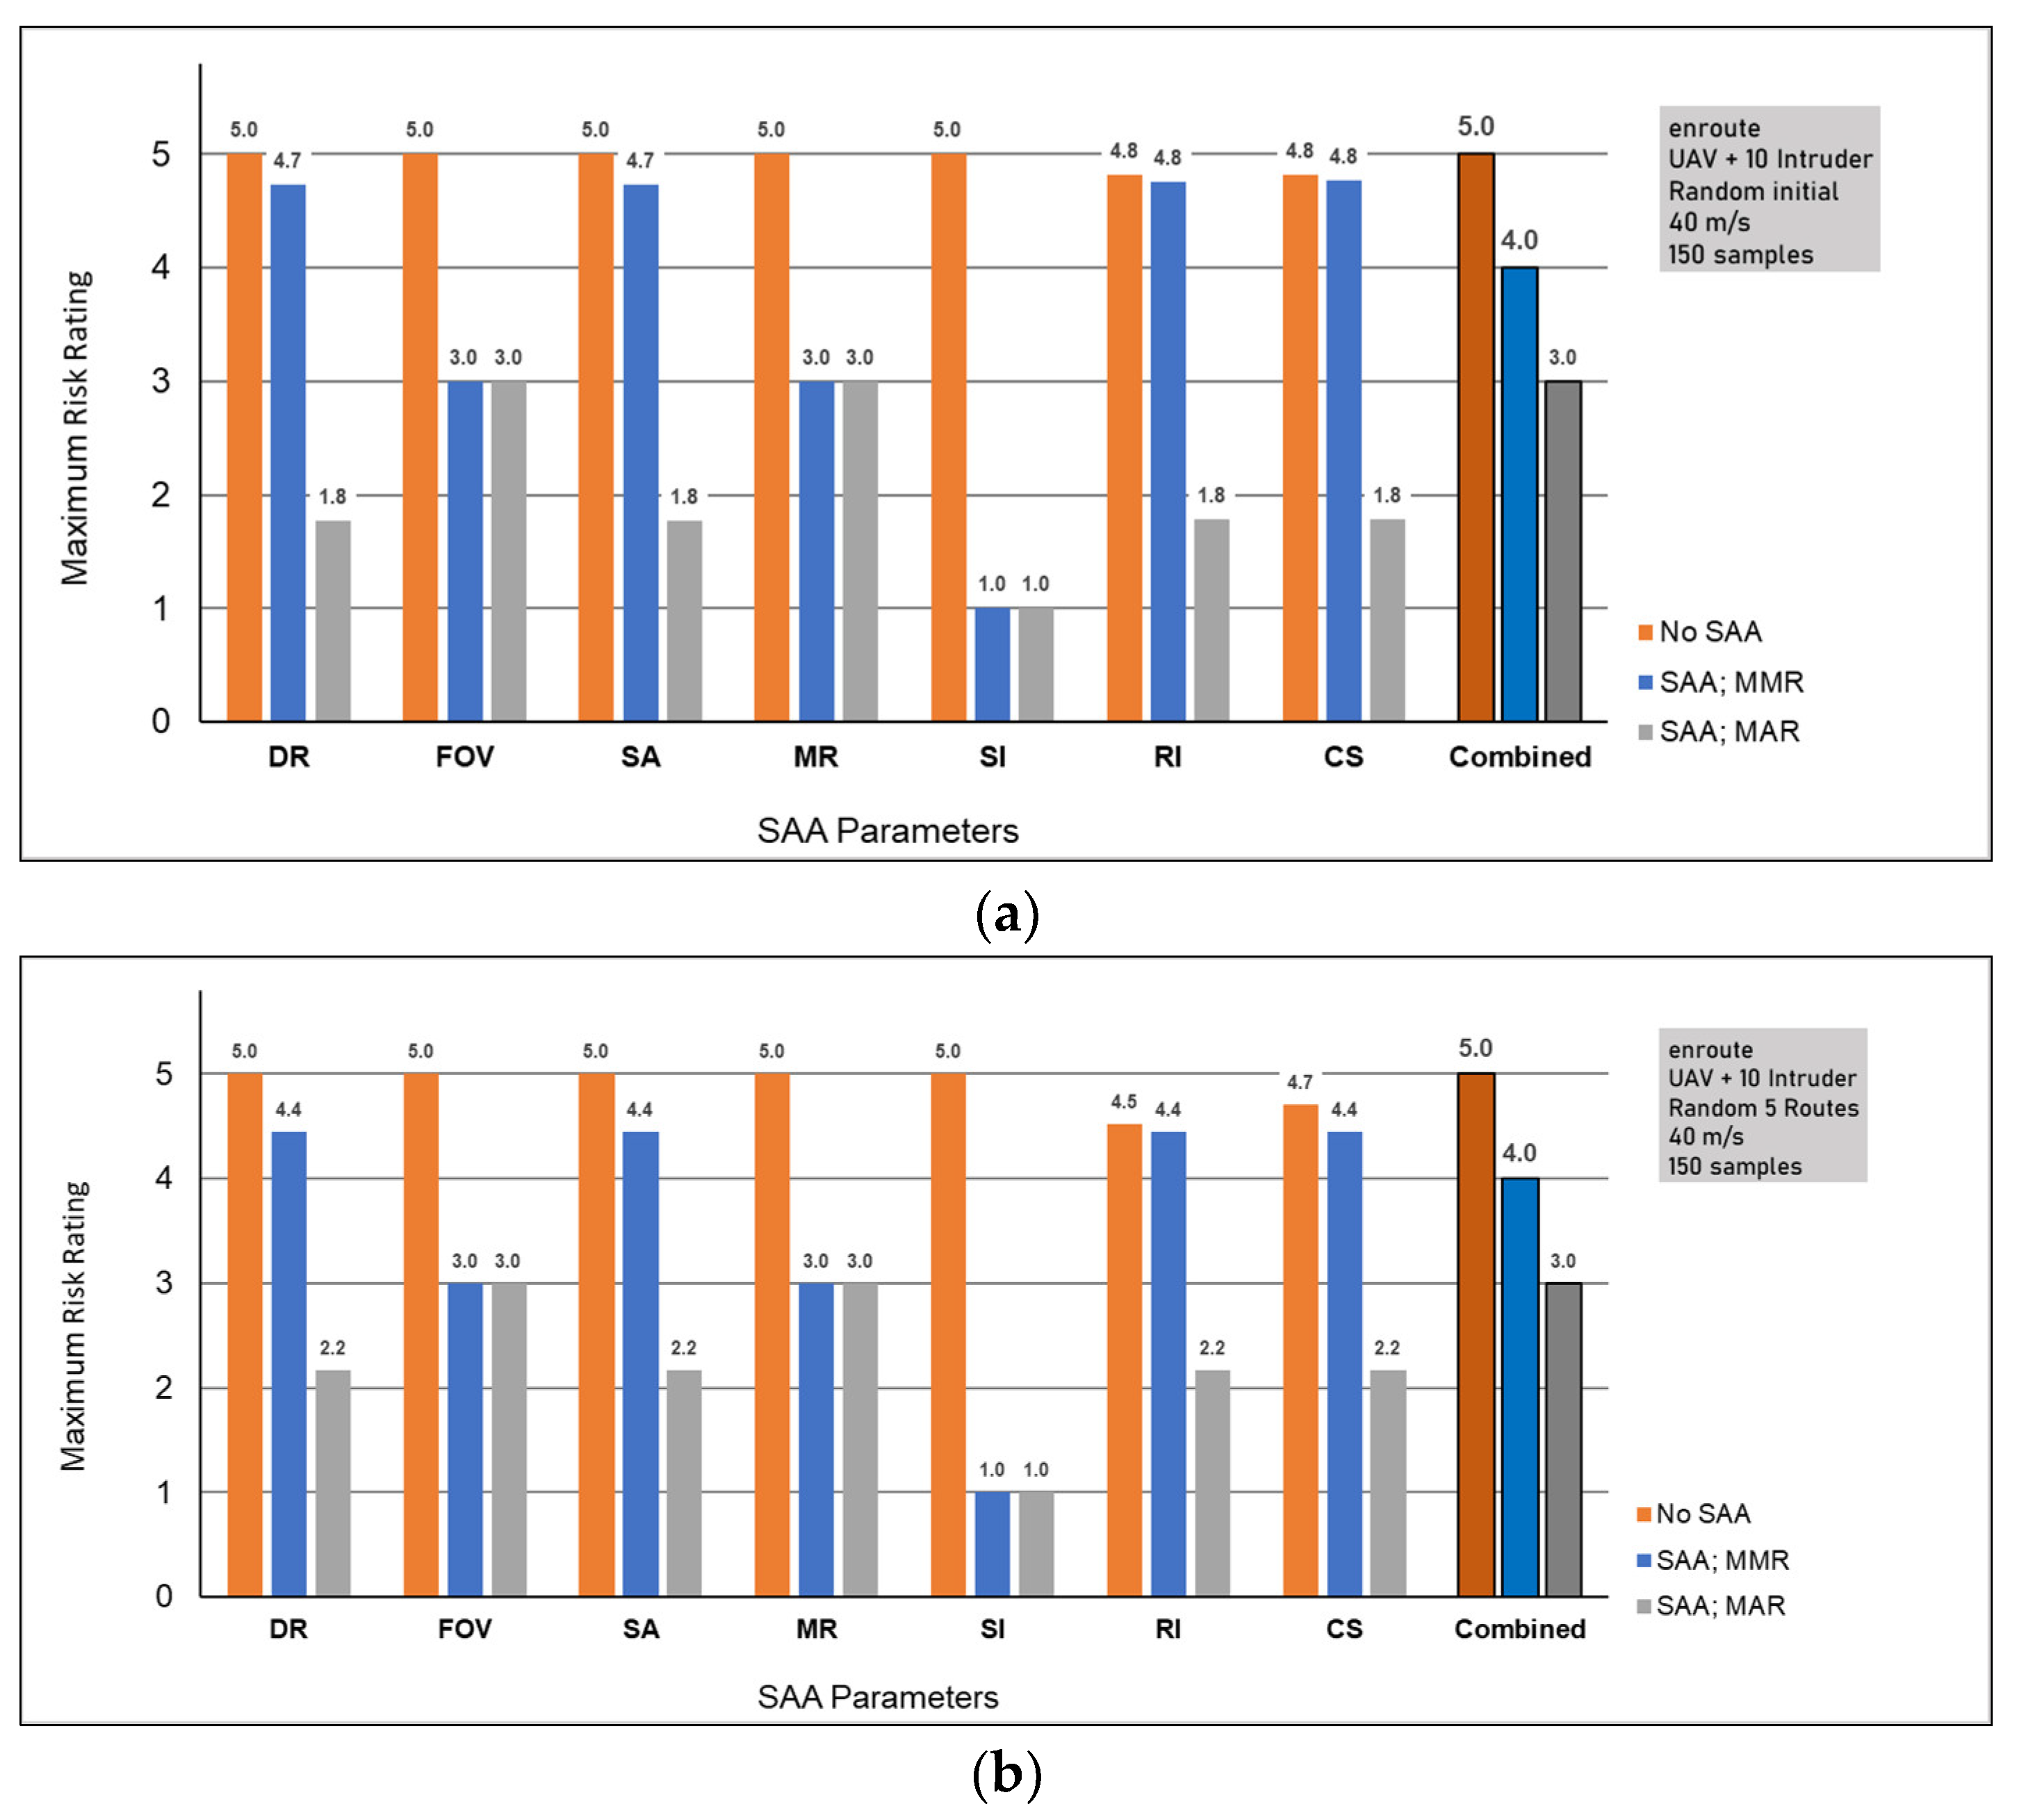
5.2. Maximum Risk Rating

Since all vehicles change their relative position to the ownship throughout the simulation, the values of all ratings, except for FOV and I, will also change with time. Furthermore, since there are ten intruders, the ownship will have ten risk rating values for all seven SAA parameters. Therefore, instead of using the value that changes over time for each intruder, this research takes the maximum value of the risk rating subjected to the ownship.
The maximum risk level is assessed in two ways. The first is examining the highest rating value for all intruders throughout the simulation, denoted as the MMR (Maximum-maximum Risk) Rating. The second way is averaging the rating value over the intruders, then taking the maximum average value throughout the simulation, denoted as the MAR (Maximum-average Risk) Rating. Ultimately, the combined MMR and MAR Ratings for the SAA system used by the ownship is the average of all parameter ratings, rounded to the next integer.
Figure 16a–c presents the results of the MMR and MAR ratings of a UAV flying through air traffic of 10 intruders in the three air route types for each SAA parameter, along with the resulting combined risk. Every graph in Figure 16 shows three results for each parameter rating. The first is the MMR results if the ownship does not have any SAA system (no radar), which means the risk rating is the highest, 5, for the parameters of DR, FOV, SA, MR, and SI. On the other hand, the RI and CS do not depend on the range and FOV of the detection system and are therefore calculated in every time step.
Figure 16 illustrates the effects of the SAA system through the second and third bars for each parameter. The risk ratings for the parameters FOV, MR, and SI remain constant in every simulation sample due to their quantification formulas, which do not consider changes in encounter geometry between the ownship and intruders. These values are calculated using the setups listed in Table 11 at the beginning of the simulation. On the other hand, the MMR and MAR ratings for DR and SA are dependent on the minimum avoidance range ( D M A R ) of the ownship against each of the intruders, in conjunction with the sensor capability, including the detection range and the signal-to-noise ratio. As a result, the ratings for DR and SA reflect the true capability of the ownship in sensing and avoiding potential collisions in various scenarios. In contrast, the ratings for RI and CS are purely based on geometrical factors.
The effectiveness of the SAA system in enhancing the safety of UAV operations is evident through the observed decrease in MMR ratings compared to scenarios without SAA, which led to a one-level decrease in the Combined MMR. This is majorly demonstrated by the results in the DR and SA parameters, the two SAA parameters that depend on both sensor capability and encounter geometry. When the traffic becomes more regulated—that is, by limiting the number of possible routes—the risk rating is reduced even more, particularly demonstrated by the rating for each parameter shown throughout the graphs of Figure 16.
Regarding the Combined Rating, the impact of more regulated airspace appears negligible. The Combined MMR and MAR consistently display the same ratings (4 and 3, respectively) across all three types of traffic. This observation suggests that the probability of detecting intruders, which will reduce the risk, remains nearly identical for all traffic types, primarily depending on the number of intruders within the area. Consequently, this finding raises the need for another Monte Carlo simulation focusing on varying the number of intruders or radar capabilities. This option will be elaborated on in the following subsections.

5.3. Effect of the Number of Intruders

Two Monte Carlo simulations were conducted in this section to observe how the number of intruders affected the results. 30 and 50 intruders traffic scenarios were tested in the same simulation area with 150 random scenarios. Figure 17a,b captures the probability of intruders penetrating the OA and DA areas and creating risk to the ownship. As shown in Figure 17a, the composition of probabilities for each air traffic type is similar, almost unaffected by the increase in intruder numbers. The type of air route is more dominant, suggesting the crucial role of regulation, even in less dense airspace.
A closer look at the situation inside the OA (Figure 17b) reveals that the percentage of intruders that eventually went inside the DA (represented by the size of the blue area) is almost the same, less than 10%. This observation applies to both variations along the intruders’ number and the air traffic type. Therefore, it can be concluded that the Combined Risk rating values, whether MMR or MAR, will only depend on the SAA system capabilities, which take effect once the intruder is inside the DA. These SAA system capabilities are represented in the simulator by the parameters of DR, FOV, SA, MR, and I, which are varied in the following subchapter.

5.4. Effect of Radar Capability

Another series of simulations is conducted to test the effect of the SAA capability in the Risk Rating calculation. Here, two new radars are introduced, namely R2 and R3, with different field-of-view and ranges, as listed in Table 12. R1 is the radar with the specifications used in the previous simulations.
The results can be observed in Figure 18, which shows a significant decrease in detectable intruders (blue area) with the decrease of radar capability used in the SAA, as already expected. The decrease means that the risk rating increases since more intruders in the OA are not detected. From the red bar’s red size difference, it can also be concluded that radar capability is more dominant in reducing risk rating than imposing regulation by limiting routes. The radar FOV also plays a significant role; when it is reduced to only 40°, virtually no intruders can be detected. This result might mean that for a particular flight scenario, there is a non-zero critical radar FOV that will never be able to detect intruders. Further study on this matter needs to be conducted for every radar parameter.

5.5. Options for Risk Rating Reduction

One usage of risk rating analyses is that options to improve safety can be mapped, allowing operators and SAA designers to efficiently improve the SAA system by focusing on specific performance parameters. For instance, safety strategy charts, such as Figure 19, can be generated for the operation scenario described in this section. These charts simulate the reduction of the combined MMR rating if only a few parameters in the SAA are improved. The immediate strategy is to lower the rating of one parameter, one by one, from DR, FOV, SA, and MR, as shown in the first strategy, to the fourth. Next is lowering the rating of two parameters at a time, and so on, until all parameters are improved. The effect on the combined MMR is shown in the rightmost column, and based on that, the best strategy can be chosen: to reduce the Combined Rating by improving a minimum number of parameters. Note that the parameters SI, RI, and CS are not part of the improvement strategy in these charts. SI parameter is not being changed since it is already at the lowest rating, while RI and CS depend purely on the operation situation.
From the charts in Figure 19, the number of options to reduce the Combined MMR rating increases as more traffic regulations are imposed. If the rating reductions are limited to rating 2, then at least two parameters must be improved. The first and second charts suggest that the best option is to improve the DR and SA of the SAA system before others. This strategy is also viable for the third case, where the routes are limited to three. Another conclusion is that improving just one of the SAA parameters can be insufficient to improve safety, while improving more than two does not further reduce the Combined MMR.

6. Conclusions

This article has elaborated on a method for risk assessment of UAVs operating through arbitrary air traffic. The method relies on parameter quantification of the SAA system, from which the risk rating of the UAV operation can be derived. The method considers parameters of the SAA detection range, field of view, accuracy, measurement rates, and system integration, along with the parameters of encounter that include the intruders’ range and closing speed. A risk assessment simulator has also been developed to test this method in various flight conditions, simulating various random conditions in a Monte Carlo simulation setup. The risk rating for an SAA system on a UAV flying through traffic of 10 randomly positioned and directed intruders has been calculated using the simulator.
The results have demonstrated the safety improvements of UAV operation using the SAA system, as evident from the one-level rating value reduction of the combined maximum risk rating. Among the contributing factors, the detection range and sensor accuracy of the SAA system stand out as the primary drivers of this improvement. This conclusion is consistent even with more regulated air traffic tested, i.e., with five or three mandatory air routes. Interestingly, increasing the number of intruders to 50 does not alter the results, as the probability of intruders being detected remains almost the same. On the other hand, improving the SAA radar capability has a more significant effect on the risk rating compared to enforcing regulations or limiting the number of intruders. This finding highlights the importance of SAA system enhancements for better risk management in UAV operations.
Although the proposed method yields promising results and presents interesting findings, further in-depth studies are necessary to validate and refine the conclusions. Additional parameters, including the ownship maneuver capability and other real-world complexities, need further exploration to derive more accurate ratings. Using such a rating system is also intriguing, as it can allow UAVs to execute necessary avoiding maneuvers by maintaining a low-risk rating and ensuring a desired level of safety. Nevertheless, the proposed method has been demonstrated and performed as intended to assess the safety of UAV operations in the airspace.

Author Contributions

Conceptualization, B.P.F., Y.I.J., R.A.S. and H.M.; methodology, B.P.F.; software, B.P.F.; validation, Y.I.J., R.A.S. and H.M.; formal analysis, B.P.F.; writing—original draft preparation, B.P.F.; writing—review and editing, Y.I.J.; visualization, B.P.F. and Y.I.J.; supervision, H.M. and R.A.S. All authors have read and agreed to the published version of the manuscript.

Funding

This research received no external funding.

Data Availability Statement

No new data were created or analyzed in this study. Data sharing is not applicable to this article.

Acknowledgments

The authors would like to thank the management of PT. Dirgantara Indonesia and the Faculty of Mechanical and Aerospace Engineering, Institut Teknologi Bandung, for supporting this research.

Conflicts of Interest

The authors declare no conflict of interest.

References

  1. DeGarmo, M.T. Section 2 Issues. In Issues Concerning Integration of Unmanned Aerial Vehicles in Civil Airspace; MITRE Center for Advanced Aviation System Development: Arlington, VA, USA, 2004; pp. 1–59. [Google Scholar]
  2. MAA; BALPA. Scenarios. In Small Remotely Piloted Aircraft Systems (Drones) Mid-Air Collision Study; Department for Transport, Crown: London, UK, 2016; pp. 9–12. [Google Scholar]
  3. Dalamagkidis, K.; Valavanis, K.P.; Piegl, L.A. On unmanned aircraft systems issues, challenges and operational restrictions preventing integration into the National Airspace System. Prog. Aero. Sci. 2008, 44, 503–519. [Google Scholar] [CrossRef]
  4. Bijjahalli, S.; Gardi, A.; Pongsakornsathien, N.; Sabatini, R.; Kistan, T.A. Unified Airspace Risk Management Framework for UAS Operations. Drones 2022, 6, 184. [Google Scholar] [CrossRef]
  5. Clothier, R.A.; Walker, R.A. Safety Risk Management of Unmanned Aircraft Systems. In Handbook of Unmanned Aerial Vehicles; Valavanis, K., Vachtsevanos, G., Eds.; Springer: Dordrecht, The Netherlands, 2015; pp. 2229–2275. [Google Scholar]
  6. Liu, Y.; Zhu, Y.; Wang, Z.; Zhang, X.; Li, Y. Ground Risk Estimation of Unmanned Aerial Vehicles Based on Probability Approximation for Impact Positions with Multi-Uncertainties. Electronics 2023, 12, 829. [Google Scholar] [CrossRef]
  7. Jenie, Y.I.; van Kampen, E.-J.; Ellerbroek, J.; Hoekstra, J.M. Taxonomy of Conflict Detection and Resolution Approaches for Unmanned Aerial Vehicle in an Integrated Airspace. IEEE Trans. Int. Tran. Sys. 2017, 18, 558–567. [Google Scholar] [CrossRef]
  8. Tang, J.; Chen, X.; Zhu, X.; Zhu, F. Dynamic Reallocation Model of Multiple Unmanned Aerial Vehicle Tasks in Emergent Adjustment Scenarios. IEEE Tran Aero. Elec. Sys. 2023, 59, 1139–1155. [Google Scholar] [CrossRef]
  9. Tang, J.; Liu, G.; Pan, Q.T. A Review on Representative Swarm Intelligence Algorithms for Solving Optimization Problems: Applications and Trends. IEEE/CAA J. Auto. Sin. 2021, 8, 1627–1643. [Google Scholar] [CrossRef]
  10. Jenie, Y.I.; van Kampen, E.-J.; Ellerbroek, J.; Hoekstra, J.M. Safety Assessment of a UAV CD&R System in High Density Airspace Using Monte Carlo Simulations. IEEE Trans. Int. Tran. Sys. 2018, 19, 2686–2695. [Google Scholar]
  11. Klaus, R.A. Development of a Sense and Avoid System for Small Unmanned Aircraft Systems. Master’s Thesis, Brigham Young University, Provo, UT, USA, 7 August 2013. [Google Scholar]
  12. Yu, X.; Zhang, Y. Sense and avoid technologies with applications to unmanned aircraft systems: Review and prospects. Prog. Aero. Sci. 2015, 74, 152–166. [Google Scholar] [CrossRef]
  13. Orefice, M.; Di Vito, V.; Torrano, G. Sense and Avoid: Systems and Methods. In Encyclopedia of Aerospace Engineering; Blockley, R.H., Shyy, W., Eds.; John Wiley & Sons, Ltd.: Hoboken, NJ, USA, 2015; pp. 1–9. [Google Scholar]
  14. Fasano, G.; Accado, D.; Moccia, A. Sense and Avoid for Unmanned Aircraft Systems. IEEE Aerosp. Electron. Syst. Mag. 2016, 31, 82–110. [Google Scholar] [CrossRef]
  15. Pham, H.; Smolka, S.A.; Stoller, S.D.; Phan, D.; Yang, J. A Survey on Unmanned Aerial Vehicle Collision Avoidance Systems. arXiv 2015, arXiv:1508.07723. [Google Scholar]
  16. Strobel, A.; Schwarzbach, M. Cooperative Sense and Avoid: Implementation in Simulation and Real World for Small Unmanned Aerial Vehicles. In Proceedings of the 2014 International Conference on Unmanned Aircraft Systems (ICUAS), Orlando, FL, USA, 27–30 May 2014. [Google Scholar]
  17. Detect & Avoid—DAA: The Power of Combining Multiple Sensors. Available online: https://www.embention.com/news/detect-avoid/ (accessed on 19 April 2023).
  18. Nepal, R.; Zhang, Y.; Blake, W. Sense and Avoid Airborne Radar Implementations on a Low-Cost Weather Radar Platform. Aerospace 2017, 4, 11. [Google Scholar] [CrossRef]
  19. Kim, K.Y.; Park, J.W.; Tahk, M.J. UAV Collision Avoidance Using Probabilistic Method in 3-D. In Proceedings of the 2007 International Conference on Control, Automation and Systems, Seoul, Republic of Korea, 17–20 October 2007. [Google Scholar]
  20. McFadyen, A.; Durand-Petiteville, A.; Mejias, L. Decision Strategies for Automated Visual Collision Avoidance. In Proceedings of the 2014 International Conference on Unmanned Aircraft Systems (ICUAS), Orlando, FL, USA, 27–30 May 2014. [Google Scholar]
  21. Choi, H.; Kim, Y.; Hwang, I. Reactive Collision Avoidance of Unmanned Aerial Vehicles Using a Single Vision Sensor. AIAA J. Guid. Control Dyn. 2013, 36, 1234–1240. [Google Scholar] [CrossRef]
  22. Park, J.-W.; Oh, H.-D.; Tahk, M.-J. UAV Collision Avoidance Based on Geometric Approach. In Proceedings of the 2008 SICE Annual Conference, Chofu, Japan, 20–22 August 2008. [Google Scholar]
  23. Huang, Z.; Li, Q.; Zhao, J.; Song, M. Variational Quantum Algorithm Applied to Collision Avoidance of Unmanned Aerial Vehicles. Entropy 2022, 24, 1685. [Google Scholar] [CrossRef] [PubMed]
  24. Skowron, M.; Chmielowiec, W.; Glowacka, K.; Krupa, M.; Srebro, A. Sense and Avoid for Small Unmanned Aircraft Systems: Research on methods and best practices. Proc. Inst. Mech. Eng. Part G J. Aerosp. Eng. 2019, 233, 6044–6062. [Google Scholar] [CrossRef]
  25. Chand, B.N.; Mahalakshmi, P.; Naidu, V.P.S. Sense and Avoid Technology in Unmanned Aerial Vehicles: A Review. In Proceedings of the 2017 International Conference on Electrical, Electronics, Communication, Computer and Optimization Techniques (ICEECCOT), Mysuru, India, 15–16 December 2017. [Google Scholar]
  26. Jenie, Y.I.; van Kampen, E.-J.; Ellerbroek, J.; Hoekstra, J.M. Selective Velocity Obstacle Method for Deconflicting Maneuvers Applied to Unmanned Aerial Vehicles. AIAA J. Guid. Control Dyn. 2015, 38, 1140–1146. [Google Scholar] [CrossRef]
  27. Hoekstra, J.M.; Ellerbroek, J. Aerial Robotics: State-based Conflict Detection and Resolution (Detect and Avoid) in High Traffic Densities and Complexities. Curr. Robot. Rep. 2021, 2, 297–307. [Google Scholar] [CrossRef]
  28. Zio, E. System Reliability and Risk Analysis by Monte Carlo Simulation. In The Monte Carlo Simulation Method for System Reliability and Risk Analysis; Springer: London, UK, 2013; pp. 59–81. [Google Scholar]
Figure 1. SAA Sensor’s performance comparison, (a) camera sensor performance, (b) lidar performance, and (c) radar performance.
Aerospace 10 00781 g001
Figure 2. Classification of SAA system parameters.
Aerospace 10 00781 g002
Figure 3. Minimum Avoid Range definition.
Aerospace 10 00781 g003
Figure 4. UAV’s field of view definition in a two-dimensional case.
Aerospace 10 00781 g004
Figure 5. Signal to Noise Ratio.
Aerospace 10 00781 g005
Figure 6. Hit per Scan.
Aerospace 10 00781 g006
Figure 7. Typical Integration setups of SAA System.
Aerospace 10 00781 g007
Figure 8. Range of Intruder.
Aerospace 10 00781 g008
Figure 9. Closing Speed Geometry Definition.
Aerospace 10 00781 g009
Figure 10. Definition of the simulation area, the observation area, and the detection area.
Aerospace 10 00781 g010
Figure 11. Various simulated flight conditions; (a) Random points generation with random headings, (b) Random within routes generation with random heading, (c) random points generation with heading toward the center, and (d) random within routes generation with heading toward the center.
Aerospace 10 00781 g011
Figure 12. Visualization of superconflict scenarios of a UAV flying (in the direction shown by the arrow in the first time-captured plot) trough a traffic of 30 intruders, i.e., (a) Wall of Intruder, (b) Converging-30.
Aerospace 10 00781 g012
Figure 13. Number of intruders inside the observation and detection area in every simulation time step, (a) the Wall of Intruders superconflict scenario, and (b) the Converging-30 superconflict scenario.
Aerospace 10 00781 g013
Figure 14. Visualization of one simulation scenario each, among 150 samples, of a UAV flying (in the direction shown by the arrow) trough the three traffic cases; (a) random free-flight traffic, (b) 5 random air route traffic, and (c) 3 random air route traffic.
Aerospace 10 00781 g014
Figure 15. Maximum Risk Rating result convergence.
Aerospace 10 00781 g015
Figure 16. Maximum risk rating values result comparison between operation without and with SAA System across three cases of traffic: (a) random free-flight traffic, (b) 5 random air routes traffic, and (c) 3 random air routes traffic.
Aerospace 10 00781 g016aAerospace 10 00781 g016b
Figure 17. The effect of the number of intruders on the number of intruders penetrating the observation and detection area across three types of traffic, i.e., random free-flight, 5 air routes, and 3 air routes: (a) all area of simulation, (b) only within the observation area (OA).
Aerospace 10 00781 g017
Figure 18. The effect of radar capability on the number of detected intruders across three types of traffic, i.e., random free-flight, 5 air routes, and 3 air routes.
Aerospace 10 00781 g018
Figure 19. Risk rating improving strategy charts for UAV en-route operation among 10 intruders in (a) random free-flight traffic, (b) 5 random air route traffic, and (c) 3 random air route traffic. The most efficient improvement strategies are shown by the red boxes.
Aerospace 10 00781 g019aAerospace 10 00781 g019b
Table 1. SAA category comparison [24,25].
Sensor NameCategoryApplicationType UAVRemarks
TCASCooperativeRange and relative altitudeLarge UAVWell proven
Widely used
Detect only other crafts
ADSBCooperativeRelative position and
relative velocity
Medium to Large UAVWell-proven
Can’t detect ground
obstacles
RadarNon-CooperativeRelative position and
velocity
All typesTypically, poor accuracy
ActiveMost widely used
LidarNon-CooperativeRange, azimuth, and
elevation
All typesEasy configuration
ActiveNarrow Field of View
SonarNon-CooperativeRelative position and
velocity
All typesLess popular in UAV
Active
OpticalNon-CooperativeAzimuth and elevationMedium to Small UAVWidely used in smaller UAVs
PassiveData link required
AcousticNon-CooperativeRangeMediumLess popular
Passive
GPSNon-CooperativePosition and
relative velocity
All types-
Passive
Table 2. List of parameters.
NoParameterValues
Symbol
Remarks
1Detection Range (DR)D1D1: Detection Range Ratio
DR Rating: 1–5
2Field of View (FOV)D2D2: Area of field of View Ratio
FOV Rating: 1–5
3Sensing Accuracy (SA)D3D3: Sensing Accuracy Ratio
SA Rating: 1–5
4Measurement Rate and Latencies (MR)D4D4: Hits per scan
MR Rating: 1–5
5System Integration (SI)D5D5: Output Type of SAA
SI Rating: 1–5
6Range of Intruder (RI)D6D6: Intruder Range Ratio
IR Rating: 1–5
7Closing Speed (CS)D7D7: Angle ratio
CS Rating: 1–5
Table 3. Detection Range (DR) Rating.
DR RatingValueRemarks
12 < D1Longest detection range, very safe to avoid.
21.6 < D1 ≤ 2
31.3 < D1 ≤ 1.6
41 < D1 ≤ 1.3
5D1 ≤ 1Shortest detection range, not safe to avoid
Table 4. Field of View (FOV) Rating.
FOV RatingValueRemarks
1D2 ≤ 1Widest detection area, lowest risk
21 < D2 ≤ 2
32 < D2 ≤ 3
43 < D2 ≤ 5
5D2 > 5Narrowest detection area, highest risk
Table 5. Sensing Accuracy (SA) Rating.
SA RatingValueRemarks
1D3 ≤ 10−4Smallest error, easy to detect objects accurately
210−4 < D3 ≤ 5 × 10⁻⁴
35 × 10−4 < D3 ≤ 10−3
410−3 < D3 ≤ 1.5 × 10⁻³
5D3 > 1.5 × 10⁻³Largest error, difficult to detect objects accurately
Table 6. Measurement Rate (MR) Rating.
MR RatingValueRemarks
15000 < D4Highest detectability
23000 < D4 ≤ 5000
31250 < D4 ≤ 3000
4500 < D4 ≤ 1250
5D4 ≤ 500Lowest detectability
Table 7. Output type of SAA.
Value D5Remarks
1Integrated with FCS
2Digital, the same data format
3Digital, not the same data format
4Analog with converter
5Analog
Table 8. System Integration (SI) Rating.
SI RatingValueRemarks
1D5 = 1Easiest to integrate
2D5 = 2
3D5 = 3
4D5 = 4
5D5 = 5Hardest to integrate
Table 9. Range of Intruder (RI) Rating.
IR RatingValueRemarks
12 < D6Longest intruder distance, very safe to avoid.
21.6 < D6 ≤ 2
31.3 < D6 ≤ 1.6
41 < D6 ≤ 1.3
5D6 ≤ 1Shortest intruder distance, not safe to avoid
Table 10. Closing Speed (CS) Rating.
CS RatingValueRemarks
1D7 < 0.2Highest chance to avoid
20.2 ≤ D7 < 0.4
30.4 ≤ D7 < 0.6
40.6 ≤ D7 < 0.8
5D7 ≥ 0.8Lowest chance to avoid
Table 11. Simulation scenario inputs.
SetupParameterInput
GeneralSimulation Area2000 × 2000 m
Observation Area9260 × 9260 m
Population1 ownship with 10 intruders
Air Routes
3 cases of traffic
-
Case 1: No Routes
-
Case 2: 5 Routes
-
Case 3: 3 Routes
UAV (Own Ship)Initial Position[0, 0] m
Speed40 m/s
Heading
SAA’s RadarDetection Range1500 m
Field of View120°
Hit per Scan1440
IntegrationIntegrated with FCC
Intruders
(1–10)
Initial PositionFrom −2000 to 2000 m (randomized for x and y)
Speed60 m/s
Headings
3 cases of traffic
from −180–180° randomized for headings:
-
Case 1: 10 values
-
Case 2: 5 values
-
Case 3: 3 values
Table 12. Variation of radar for the SAA system to be tested.
ParameterRadar 1
(R1)
Radar 2
(R2)
Radar 3
(R3)
DescriptionAerospace 10 00781 i001Aerospace 10 00781 i002Aerospace 10 00781 i003
Detection Range (Rdet)1500 m1000 m500 m
Field of View (FOV = 2ξ)120°80°40°
Hit per Scan144014401440
IntegrationIntegrated with FCCIntegrated with FCCIntegrated with FCC
Disclaimer/Publisher’s Note: The statements, opinions and data contained in all publications are solely those of the individual author(s) and contributor(s) and not of MDPI and/or the editor(s). MDPI and/or the editor(s) disclaim responsibility for any injury to people or property resulting from any ideas, methods, instructions or products referred to in the content.

