1. Introduction
A new concept of air traffic management using the Global Navigation Satellite System (GNSS) has been recently developed. It is assumed that the distance-measuring equipment infrastructure substituting GNSS will be retained and expanded. The Federal Aviation Administration (FAA) have also confirmed and recommended using DME systems for air navigation until 2030. This will require a significant expansion of the current DME ground infrastructure due to its poor distance measuring accuracy. If the position of the flying object is determined using the rangefinder method, the accuracy of determining the position Δ
l can be determined according to the following relationship:
where
γ is the angle between the position lines of the DME systems;
,
are the linear errors of the position lines of the DME systems. From the aforementioned relationship, it is clear that the accuracy of determining the position of the flying object depends, among other things, on the geometry of the system (angle γ) and on the accuracy of the measurement of the DME systems (
,
).
One of the disadvantages of the DME system is its low resistance to interference [
1]. Based on this, it is very timely to investigate the possibilities of designing a receiver of the DME system that can process measurement signals even in conditions of narrowband interference. Older DME systems show a distance measurement error of around 200.0 m. It is clear from the above relationship that such an error will not allow accurate determination of the aircraft’s position.
Research in the field of the operation of navigation systems has confirmed that the accuracy of the system is affected by interference [
1,
2,
3,
4,
5,
6,
7,
8,
9]. The most common types of interference include broadband fluctuation interference, narrowband interference, and chaotic impulse interference. These types of interference significantly affect the accuracy of measurement of navigation parameters using these systems. When investigating the accuracy and resistance of electronic systems to interference, it is necessary to create models of signal processing that represent these systems. These models usually describe random processes and include models of measured signals and disturbances [
1]. The basic requirement for these models is the greatest possible accuracy of a priori data, which ensures the high reliability of the simulation results according to the used models. To verify models of random processes, it is advisable to use statistical tests [
1].
In works devoted to the use of telemetric methods in navigation, it is stated that the signals of satellite navigation systems are not always available or are degraded by interference [
1,
2,
3,
4,
5,
6,
7,
8,
9], which significantly affects the safety of flight operations. In the work [
6], it is stated that DME signals cause interference in satellite navigation systems. This creates errors when tracking the flight trajectory of aircraft. It is clear the accuracy of determining the position of a flying object using a DME system depends on the accuracy of the distance measurement between the DME system and the flying object. Based on this, we proceeded to research the design of a DME system that would be able to work under the conditions of narrowband interference. We are interested in whether it is possible to increase the accuracy and robustness of a DME operating under the conditions of narrowband interference. The design of the DME system, which works under interference conditions, is presented in [
2]. In this study, algorithms for processing measurement signals when using binary carrier signals were derived. The algorithms presented in this work allowed us to estimate the potential accuracy of DME, but did not allow us to simulate the real accuracy of distance measurement carried out by the DME system.
In the study [
5], the problems of improving the accuracy of aircraft distance measurement with a DME navigation system using a Kalman filter under the conditions of wide-band interference of the white noise type were solved. This approach makes it possible to optimize this system and significantly increase its accuracy. The modeling results showed that the variance of the distance measurement error was 14.42 m
2, and the mean value of the error was close to zero. The design of the DME/DME navigation system algorithms is presented in [
8]. The simulation results of this system confirmed that the accuracy of the DME/DME system is better than 0.1 nautical miles. The authors of the article did not solve the issue of the immunity of DME systems to interference. The accuracy of distance measurement carried out by the DME system can also be increased by using new measurement signals [
2,
9]. The results presented in this work confirm an accuracy improvement of up to 77.3% compared to classical signals.
The authors of the paper [
10] proposed a solution for increasing the accuracy of the DME system based on the implementation of a Kalman filter. The authors concluded that by increasing the accuracy of the DME system, it is possible to improve the accuracy of determinations of the position of a flying object. The Mosaic/DME system is investigated in [
11], from the point of view of FO positioning accuracy, using the Monte Carlo method. The research results confirm that such a system can be used for tracking the trajectory of flying objects. In this article, the immunity of this system to interference has been not solved. An L-band Digital Aeronautic Communication Systems receiver prototype which uses rank-ordered absolute differences (ROAD) statistics to detect the distance measuring equipment (DME) interference was designed in [
12]. For the SNR value of 0 dB, the proposed method of detection could achieve a 3% increase in terms of accuracy, with a reduction of 4% in false alarms. In article [
13], an algorithm for mitigating DME interference in L-band digital aeronautical communication system type 1 (LDACS1)-based aeronautical communication systems is presented. In the proposed method, an estimation of DME interference component in the received LDACS1 signal is executed, and then the subtraction signal is estimated before the final LDACS1 decoding section. The simulation confirmed that the proposed method is suitable for interference suppression.
An analysis of intra-system and inter-system electromagnetic interference in the DME system is given in [
14]. It is reported that large errors may be made in interference analysis if a large number of aircraft cooperate with the DME ground equipment.
For the use of the DME system in the air traffic control process, it is advisable to verify the impact of interference on this system. When performing the analysis, a problem arises if the DME system is used by more than one aircraft. The authors of the paper [
14] solve this problem by creating an analytical model of interference analysis on DME, which enabled the determination of the effective replies and capacity of the DME.
In the literature [
15], several methods of eliminating the interference of navigation systems are analyzed, which include detection, mitigation, localization, and classification. The authors of this work state that narrowband interference and broadband interference are among the most dangerous interferences in aeronautical navigation systems. An overview of different interference detection techniques is given in [
16]. The authors of this work emphasize that the elimination of interference is possible if a monitoring system is available, because commercial receivers do not have such a system. This approach is disadvantageous in that it requires additional hardware that is not part of the navigation system.
Interference suppression using the pulse blanking (PB) method is analyzed in [
17]. It is stated that the disadvantage of this solution is the loss of information in cases in which the receiver is blocked due to the presence of interference.
The presented work contains the results of research in the field of an accuracy and resistance assessment of the DME system, which works in conditions of narrowband interference, using modeling and simulation. The use of the modeling and simulation method makes it possible to evaluate the operation of the DME system under the conditions of narrowband interference. Based on the derived model of the DME measurement signal, its parameters, and narrowband interference, algorithms for processing the measurement signals of the DME system under the conditions of narrowband interference were derived. The block wiring of the receiver is shown in
Figure 1c. The simulation results presented in
Figure 2,
Figure 3,
Figure 4,
Figure 5,
Figure 6,
Figure 7,
Figure 8,
Figure 9,
Figure 10,
Figure 11,
Figure 12,
Figure 13,
Figure 14,
Figure 15,
Figure 16,
Figure 17 and
Figure 18 confirm that the created models are relatively sensitive to the input of a priori data. Entering a priori data that are in accordance with the physical meaning of the task allow the achievement of high accuracy in the simulation results. The sensitivity of the algorithms to changes in DME operating parameters was determined. The simulation confirmed that the measurement accuracy of the DME system depends on the stability of the frequency of the DME support generator, the signal-to-noise ratio, and the signal-to-interference ratio at the input of the DME receiver.
3. Result and Discussion
On the basis of algorithms (1)–(25), a simulation of the potential (maximum) accuracy of DME was performed. The simulation results are shown in
Figure 2.
Figure 2 shows the dependence of the
δDD = Kdd . σD −2 is the standardized measurement error of the slant distance
D(
t) between FO and DME, at time t.
Kdd is the a posteriori dispersion of the measurement error of the slant distance
D(
t) between FO and DME. The following signal and interference parameters have been used in the simulations:
From
Figure 2a, it is obvious that the standardized posterior dispersion decreases as the time increases. After 0.9 s, the value of δ
DD is equal to 0.194, which corresponds to the potential accuracy of distance measurement Δ
DP = (
δDD . σ2D)
0.5= 2.2 m. The
δDD waveform confirms that the DME receiver is operating in a stationary state after one second.
In the time between the received pulses of the measurement signal, which is equal to 1/T
i, the parameters of the state vector are extrapolated according to algorithms (21) and (22), which have the following form:
The simulation results in
Figure 2b confirm that the δ
DD increases in the gaps between the received measurement signal pulses. After receiving the measurement signal, the measurement results are corrected.
Figure 3 shows the dependence of the
δDD standardized measurement error on the a priori dispersion σ
D. It is clear from the figure that as σ
D increases, the standardized coefficient
δDD decreases. The simulation results confirmed that if the a priori dispersion σ
D varies from 2.0 m to 15.0 m, the
δDD standardized measurement error varies from 0.6 to 0.02.
We assume that this is why the transition process in the receiver is shortened. We further investigated how the potential accuracy of the DME ΔDp system depends on the σD parameter.
The dependence of the potential accuracy Δ
D = (δ
DD.
σ2D)
0.5 on the a priori dispersion σ
D is shown in
Figure 4. The simulation results show that increasing the a priori dispersion σ
D in the range from 2 to 15 does not cause a decrease in the potential accuracy Δ
D. Therefore, we can confirm that the potential accuracy of the receiver basically does not depend on the a priori dispersion σ
D.
The dependence
δDD of the standardized error of the slant range measurement
D(
t) between the FO and the DME on the useful signal-to-noise ratio S/N is shown in
Figure 5. The figure shows that the standardized posterior dispersion
δDD decreases as the S/N ratio increases. This fact indicates that the accuracy of the receiver improves as the S/N ratio increases. When the S/N is increased by 4 times, the
δDD standardized measurement error decreased by 2.5 times.
The dependence
δDD of the standardized error of the slant range measurement D(t) between FO and DME on the interference power-to-noise ratio AKUN is shown in
Figure 6. The figure shows that the normalized posterior dispersion
δDD increases as the AKUN ratio increases. This fact indicates that the accuracy of the DME receiver deteriorates as the AKUN ratio increases.
When the AKUN is increased by 7.5 times, the δDD standardized measurement error increases by 1.5 times. Based on this, we can confirm that the DME receiver is resistant to narrowband interference.
Figure 7a shows the dependence of the
δφφ = Kφφ.σφ−2 standardized measurement error of the random phase of the DME signal on time t.
Kφ φ is the posteriori dispersion of the measurement error of the random phase of the DME signal. Signal and noise parameters during simulations are determined by relation (27). The figure shows that after 0.45 s, the coefficient
δφφ settles at a value of 0.44. In the gaps between the received pulses of the measurement signal, the coefficient
δφφ increases. After receiving the measurement signal, the measurement results are corrected (see
Figure 7b).
The dependence of the standardized a posteriori dispersion of the random phase of the DME signal
δφφ on the a priori dispersion
σφ is shown in
Figure 8. The simulation results confirmed that as the a priori dispersion of the random phase
σφ increases by 8 times, the a posteriori dispersion
δφφ decreases by 48.4 times. Increasing a posteriori dispersion
σφ causes an increase in the measurement error of the phase of the measurement signal Δ
φ (see
Figure 9).
The dependence of the Δ
φ = (
δφφ . σφ2) potential accuracy of measurement of the random phase of the DME signal on the a priori dispersion
σφ is shown in
Figure 9. The simulation results show that increasing the a priori dispersion
σφ in the range from 0.78 to 6.28 causes a decrease in the potential accuracy of the Δ
φ the measurement from 3.65 to 4.2 rad. Therefore, we can confirm that the potential accuracy of measuring the random phase of the DME signal does not depend on the a priori dispersion
σφ.
The dependence of the standardized posterior dispersion of the random phase of the DME signal
δφφ on the ratio of the power of the useful signal to the noise S/N is shown in
Figure 10. The figure shows that the normalized posterior dispersion
δφφ decreases as the S/N ratio increases. This fact indicates that the accuracy of the random phase measurement improves as the S/N ratio increases. When the S/N increases by 4 times, the normalized posterior dispersion of the random phase
δφφ decreases by 2.1 times.
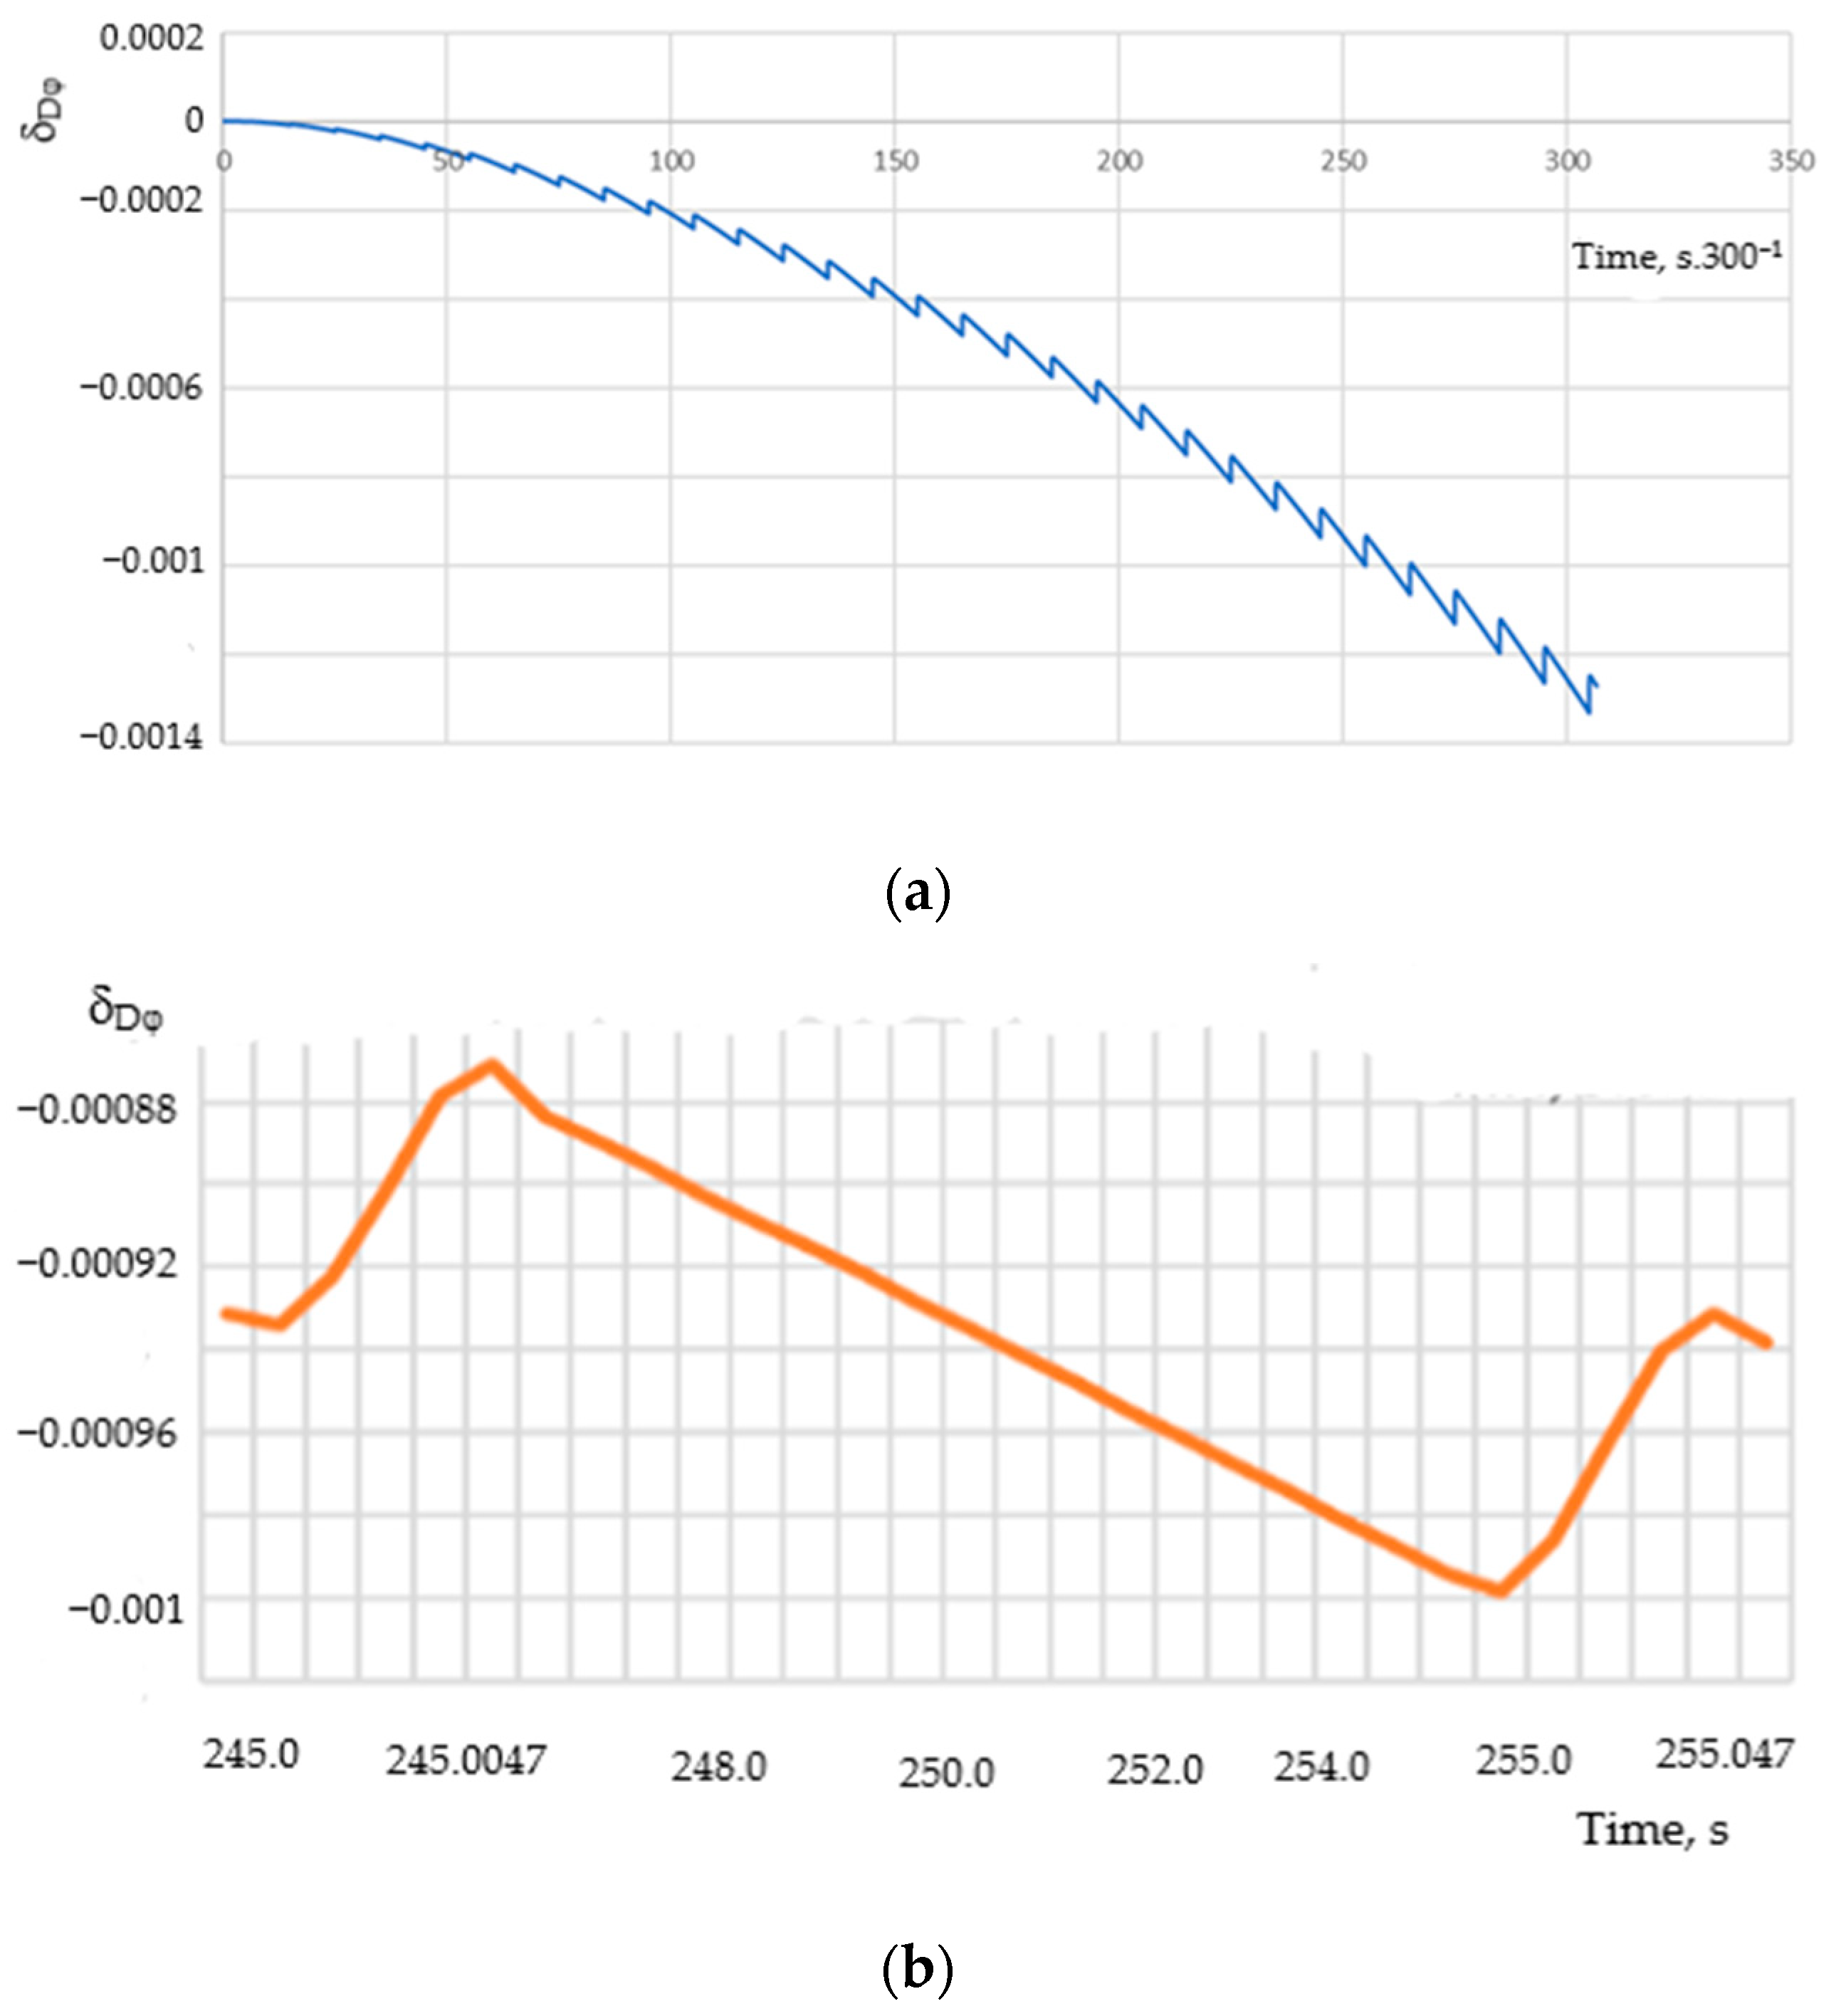
Figure 11a shows the dependency of the standardized a posterior dispersion
δDφ on time t. The parameter
δDφ expresses the mutual dependence of the distance measurement accuracy
D(
t) and the random phase
φ(
t). The simulation confirmed that with increasing time,
δDφ increases, which causes errors in measuring the distances between FO and DME. Since δ
Dφ ≠ 0, the accuracy of the
D(
t) measurement is affected by the phase fluctuation of the DME measurement signal.
In the time between the received pulses of the measurement signal, which is equal to 1/Ti, the
δDφ parameter increases. After receiving the measurement signal, the measurement results are corrected (ee
Figure 7b).
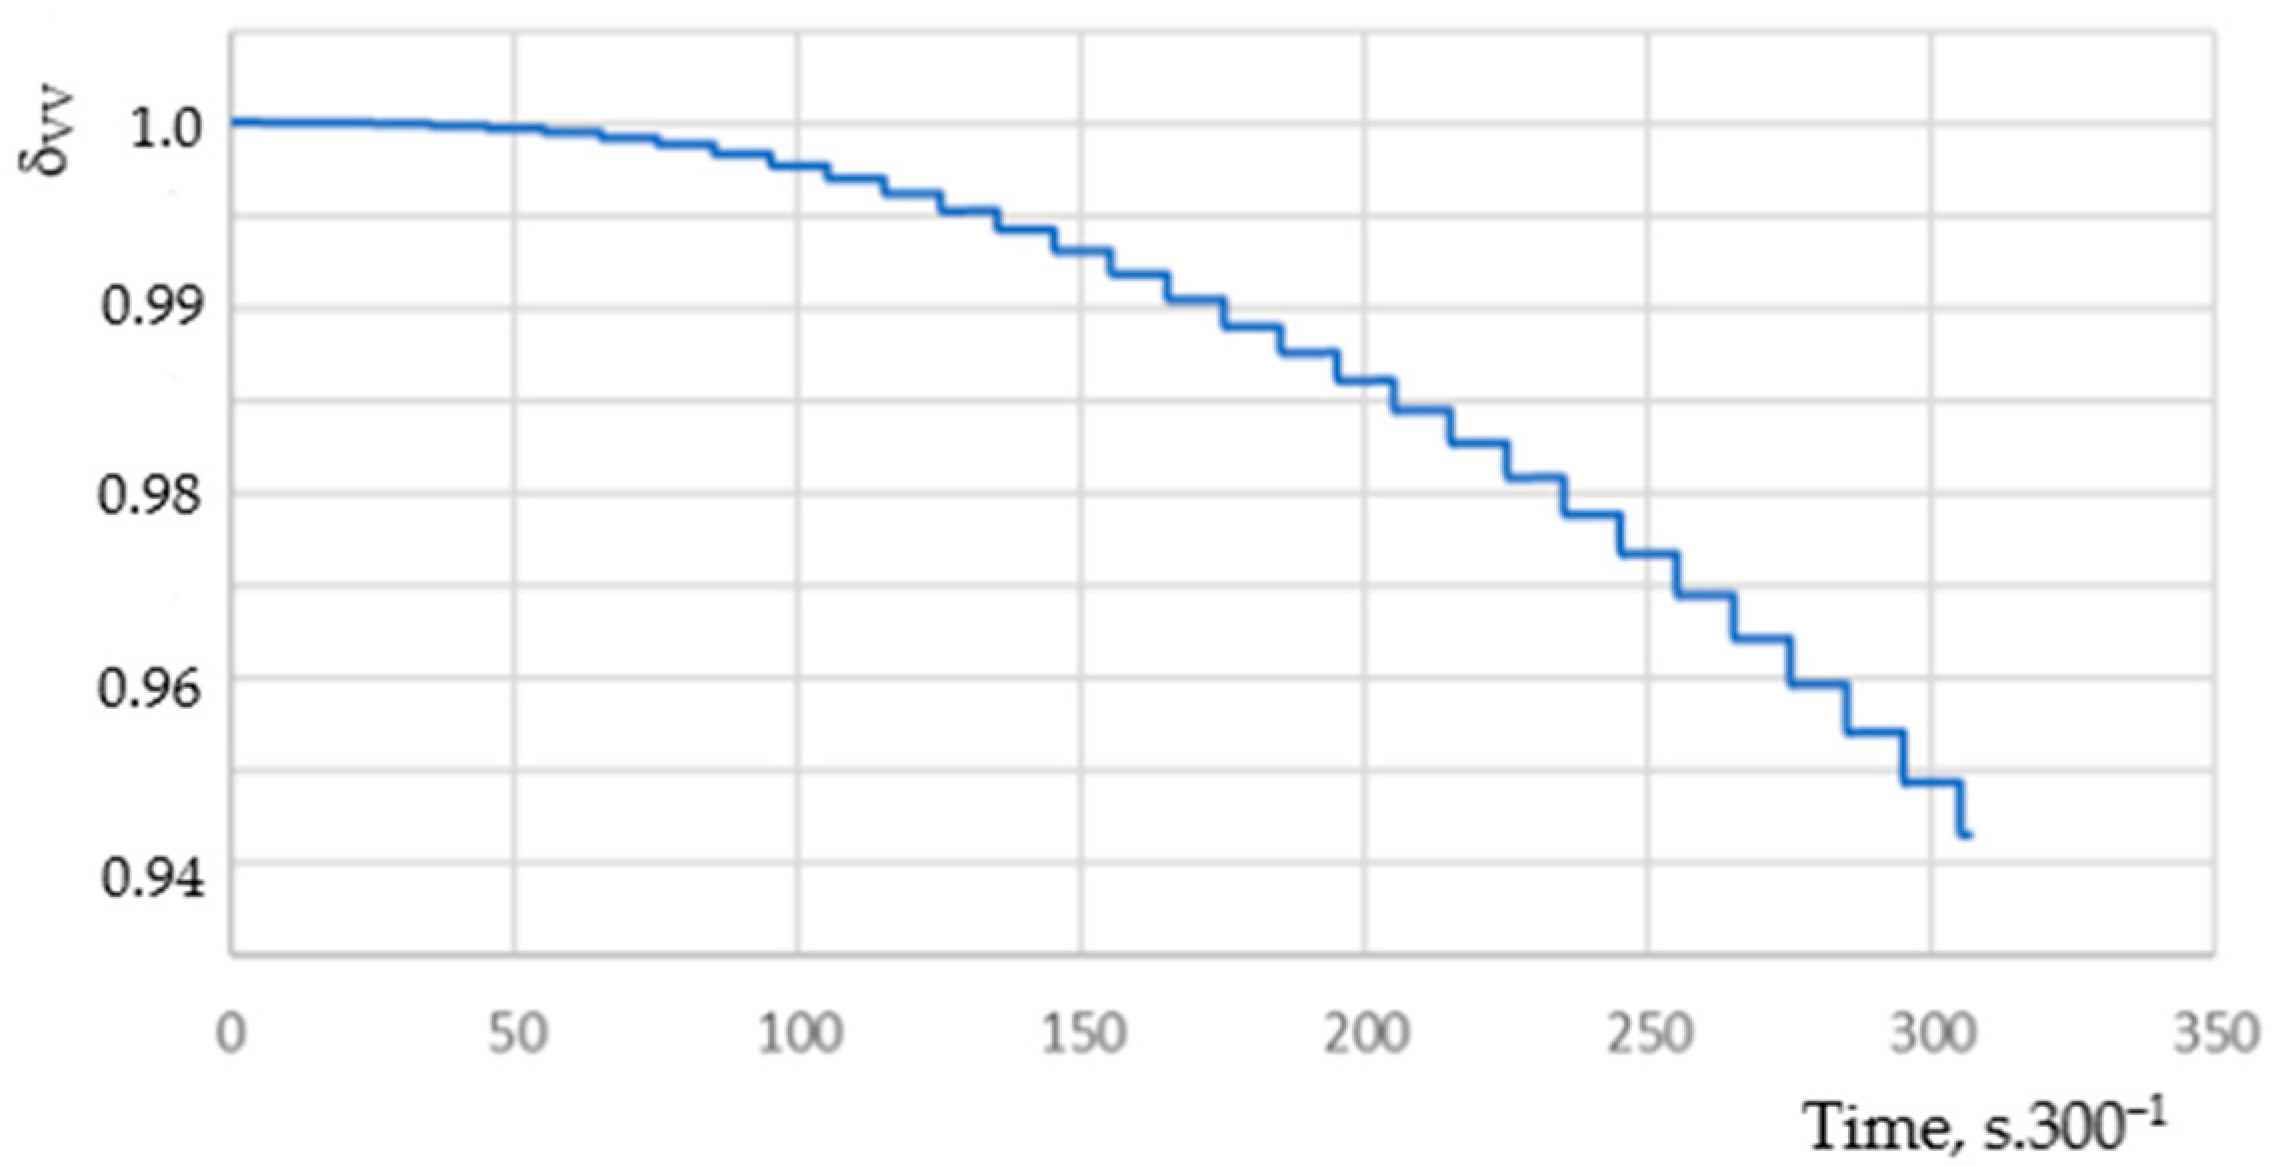
The dependence of the standardized a posteriori dispersion of the speed
δVV on time is shown in
Figure 12. It is obvious from the figure that the coefficient
δVV decreases with increasing time, which allows a more accurate measurement of the speed of movement of FO.
Figure 13 shows the dependency of the standardized posterior dispersion of acceleration
δaa on time t. The simulation results show that as time increases, the coefficient
δaa increases. This is due to the FO acceleration model used, which is sensitive to acceleration fluctuations. The increasing coefficient
δaa causes errors in the estimation of the FO acceleration.
The dependence of the standardized posterior dispersion of narrowband interference δ
2UC on time is shown in
Figure 14. The simulation results show that the coefficient δ
2UC settles at a value of 0.57 in a short time, which allows a good estimate of the interference at the input of the DME receiver. This is due to the presence of narrowband interference at the receiver input.
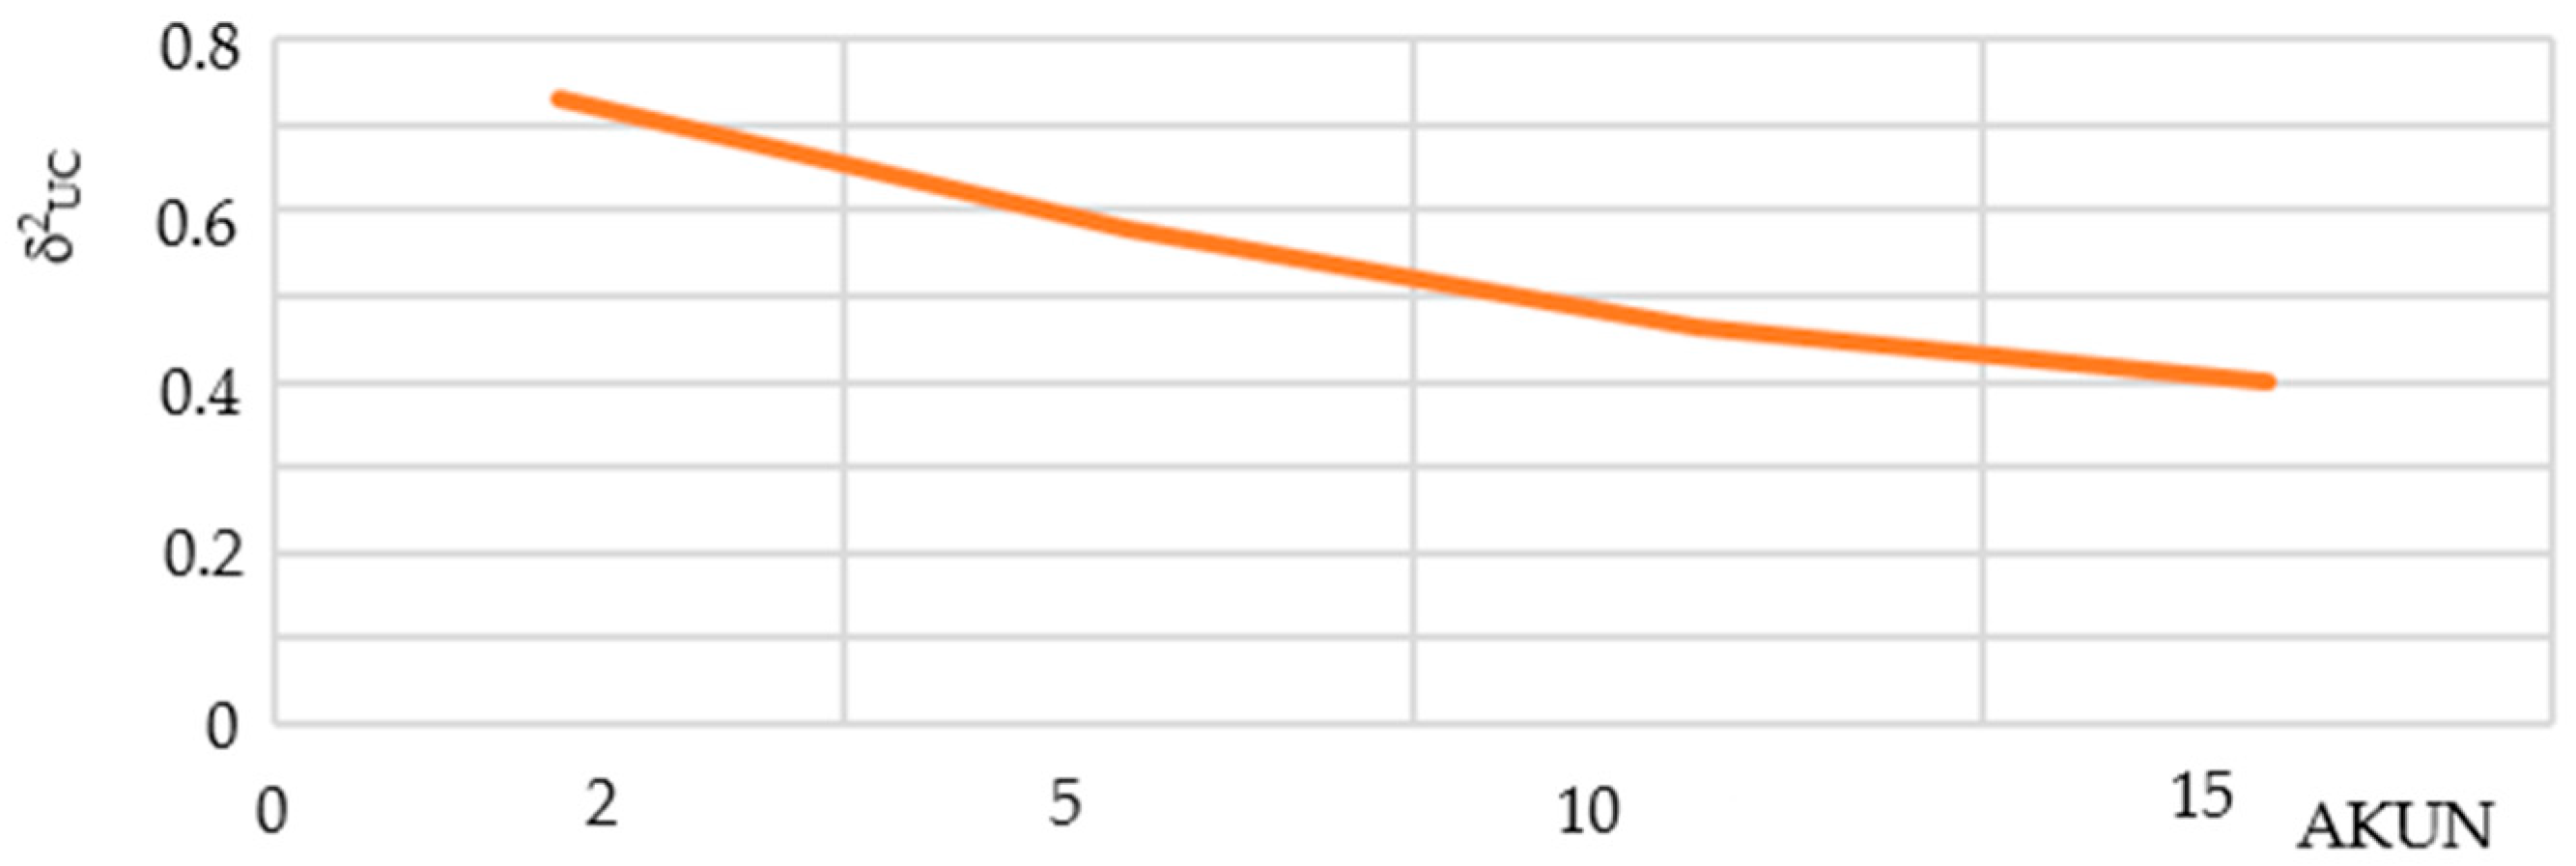
Figure 15 shows the dependency of the standardized posterior dispersion δ
2UC on the ratio of the power of narrowband interference to the noise AKUN. When the AKUN ratio increases by 7.5 times, the normalized posterior dispersion δ
2UC decreases by 1.8 times. It follows that as AKUN increases, the receiver can better identify narrowband interference and eliminate this interference from the additive mixture of useful signal and narrowband interference. Even so, higher AKUN values worsen the accuracy of measuring the navigation parameter
D(
t) (see
Figure 17).
The dependence of the distance measurement error Δ
D = D −
D* of the DME receiver on time, for signal and interference parameters (27), is shown in
Figure 16.
D* is the measured value of the slant range D(t) between FO and DME, which was calculated according to Equation (21). The figure shows that the distance measurement error Δ
D increases in the transition mode of the receiver. After 0.58 s, the distance measurement error Δ
D decreases. In the transition mode, the mean value of the measurement error of the distance FO from DME
D(
t) is equal to −6.24 m, and the dispersion is equal to 2.1 m
2.
The dependence of the distance measurement error Δ
D on the S/N ratio is shown in
Figure 17. The simulation time equals 1.0 s. The results of the simulation show that the accuracy of distance measurement by the DME receiver improves as the S/N ratio increases. If the S/N ratio varies from 5 to 20, then the distance measurement error Δ
D varies from +4.0 m to −1.4 m.
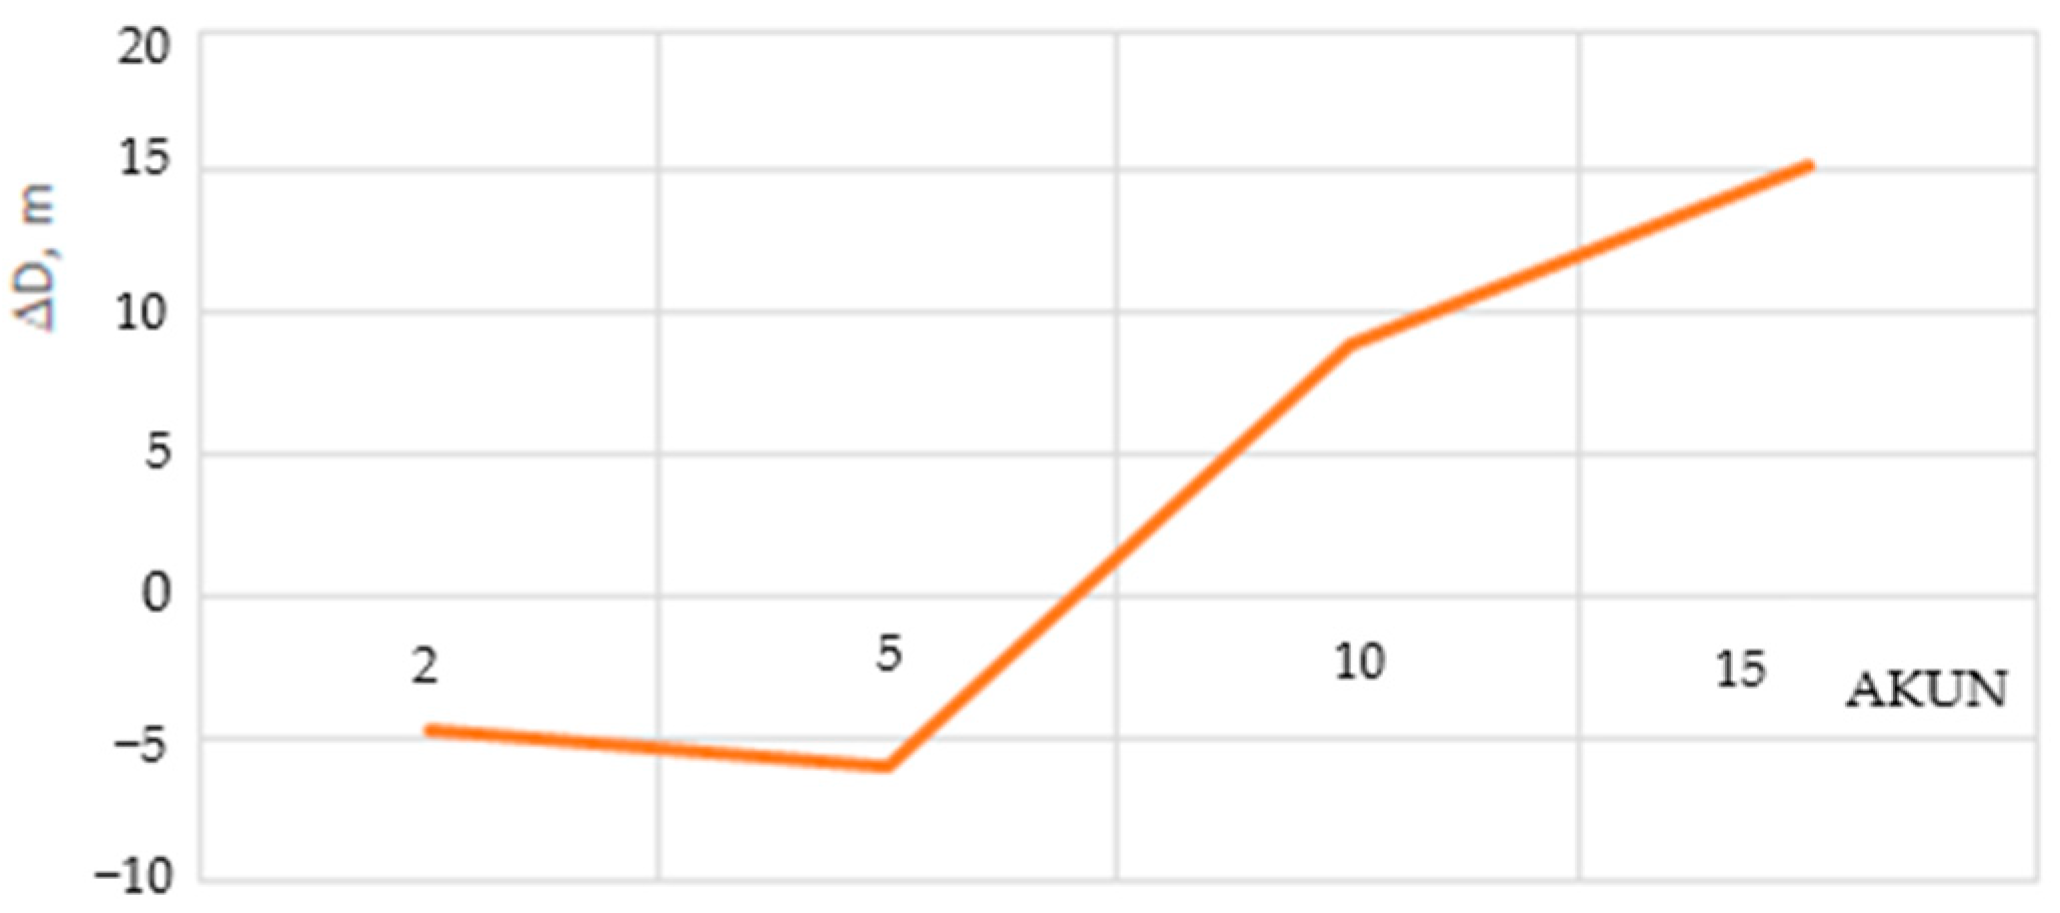
Figure 18 shows the dependency of the distance measurement error Δ
D on the ratio of the power of narrowband interference to the noise AKUN.
If the AKUN ratio changes ten times, then the distance measurement error ΔD increases four times. The simulation confirmed that the accuracy of the DME system deteriorates as the power of the narrowband interference increases. The results of the simulation, which was performed according to algorithms (21) and (22), showed that the accuracy of such a system would meet the current requirements for determining the position and navigation of flying objects using DME systems.
4. Conclusions
A characteristic feature of air traffic at present is the emphasis on its safety. With the increase in the intensity of air traffic, the problem of replacing classic navigation systems with new technologies has come to the fore. These technologies reduce costs and increase the safety of air traffic control. The new air traffic management concept envisages the use of the Global Navigation Satellite System (GNSS) and the preservation of Distance Measuring Equipment (DME). As stated in the introduction of this work, it assumes the expansion of the DME infrastructure as a substitute for GNSS. This requires an expansion of the current DME infrastructure, as these systems are not sufficiently accurate. Therefore, in our research, we focused on the possibility of increasing the accuracy and resistance to interference of DME systems. In this work, we present selected research results from the field of accuracy and robustness assessments of DME systems, which operate under the conditions of narrowband interference. In our research, a modeling and simulation method was used, which allowed us to evaluate the operation of a DME system in the conditions of narrowband interference. Models of the DME’s measurement signal, its parameters, and a narrowband interference model were created. Based on this, algorithms were derived for processing the measurement signals of the DME system under narrowband interference conditions. A non-linear filtering method was used in the derivation of the algorithms. The quadratic loss function, the Gaussian approximation method, and the large and small parameter methods were used in the optimization. Algorithms (21,22) determine the architecture of an optimal DME receiver that operates under the conditions of narrowband interference. The proposed receiver is a nonlinear filter that consists of the information channel that ensures the measurement of the components of the state vector X(t). It contains the phase-tuning system of the DME generator and a narrowband interference compensation channel. The simulation results presented in
Figure 2,
Figure 3,
Figure 4,
Figure 5,
Figure 6,
Figure 7,
Figure 8,
Figure 9,
Figure 10,
Figure 11,
Figure 12,
Figure 13,
Figure 14,
Figure 15,
Figure 16,
Figure 17 and
Figure 18 confirm that the created models are relatively sensitive to the input of a priori data. Entering a priori data that are in accordance with the physical meaning of the task allows for the achievement of high accuracy in the simulation results. The sensitivity of algorithms to changes in DME operating parameters was determined. The simulation confirmed that the measurement accuracy of the DME system depends on the stability of the frequency of the DME support generator, the signal-to-noise ratio, and the signal-to-interference ratio at the input of the DME receiver. Based on the results of the simulation of the operation of the DME system according to algorithms (21) and (22), we can conclude that these algorithms are applicable for evaluating the potential and actual accuracy of the DME. It is common knowledge that companies do not publish navigation system algorithms. Based on the derived algorithms, it is possible to create a DME system architecture that is resistant to interference. Algorithms determine the block connection of the receiver and the requirements for the transmission functions of individual blocks. Subsequently, it is possible to propose the basic connection of these blocks. Assuming the availability of a priori data in existing radio navigation systems and their signals, it is possible to use algorithms to analyze these systems in terms of their accuracy and immunity to interference. Based on algorithms (21) and (22), the potential (maximum) accuracy of the DME system was evaluated. The standardized posterior dispersion of the measurement error of the slant distance D(t) between FO and DME decreases as time increases. After 0.9 s, the value of
δDD is equal to 0.194, which corresponds to the potential accuracy of distance measurement Δ
DP = (
δDD. σ2D)
0.5= 2.2 m. The simulation showed that after the end transition process, the DME receiver operates in quasi-stationary mode thus making it possible to substantially simplify the structure of the quasi-optimal DME, thereby shortening the time it takes to process measurement signals and evaluate measurement results. The simulation results confirm that the standardized posterior dispersion
δDD decreases as the S/N ratio increases. This fact indicates that the accuracy of the receiver improves as the S/N ratio increases. The accuracy of the DME receiver deteriorates as the AKUN ratio increases. The simulation confirmed that the accuracy of the
D(
t) measurement is affected by the phase fluctuation of the DME measurement signal. The simulation results show that the DME receiver allows a good estimate of the interference at the input of the DME receiver. IF as AKUN increases, the receiver can better identify narrowband interference, and eliminate this interference from the additive mixture of useful signal and narrowband interference. Even so, higher AKUN values worsen the accuracy of measuring the navigation parameter
D(
t). The simulation results confirm that the distance measurement error ΔD increases in the transition mode of the receiver. After 0.58 s, the distance measurement error ΔD decreases. In the transition mode, the mean value of the measurement error of the distance FO from DME
D(
t) is equal to −6.24 m, and the dispersion is equal to 2.1 m
2. The results of the simulation show that the accuracy of distance measurement by the DME receiver improves as the S/N ratio increases. The simulation confirmed that the accuracy of the DME system deteriorates as the power of the narrowband interference increases. Comparing the results of the DME system receiver designed by us with the parameters listed in [
5,
8,
9,
12], we can conclude that its accuracy is much better. Therefore, it would be appropriate to use the derived algorithms in the construction of the DME receiver. However, the mentioned algorithms require substantial simplification to be used for real-time signal processing. We assume that by performing further simulations, we will determine which coefficients of the receiver can be excluded from the derived algorithms or considered constants, which would significantly reduce the time required to evaluate the results of the slant distance measurement. This will be our next research direction.


