Article

Active Flow Control for Passage Vortex Reduction in a Linear Turbine Cascade with Various Tip Clearance Sizes Using a Dielectric Barrier Discharge Plasma Actuator

by
Takayuki Matsunuma
* and
Takehiko Segawa
National Institute of Advanced Industrial Science and Technology (AIST), 1-2-1 Namiki, Tsukuba 305-8564, Japan
*
Author to whom correspondence should be addressed.
Aerospace 2023, 10(7), 641; https://doi.org/10.3390/aerospace10070641
Submission received: 20 June 2023 / Revised: 14 July 2023 / Accepted: 14 July 2023 / Published: 16 July 2023
(This article belongs to the Special Issue Plasma Actuator)

Abstract

:
In an axial-flow turbine of a jet engine used for aircraft propulsion, the passage vortex (PV) and tip leakage vortex (TLV) generated inside the blade passage deteriorate the aerodynamic performance. In this study, a dielectric barrier discharge plasma actuator (PA) was installed in the upstream endwall of the turbine cascade to suppress the PV. The effects of the presence or absence of tip clearance and the change in the size of the tip clearance on the vortex structure at the exit of the turbine cascade were observed by recording the flow velocity distributions using particle image velocimetry. In the absence of tip clearance, only the PV existed and was completely suppressed by the PA. By contrast, in the presence of tip clearance, a TLV occurred in addition to the PV. When the input voltage to the PA was varied with various tip clearance sizes, the change in the flow fields where the PV and TLV interfered was clarified. With tip clearance, the PV was suppressed as the input voltage increased; however, the TLV increased considerably. At each tip clearance size, changes in the center positions of the PV and TLV were observed at varying input voltages of the PA. With increasing input voltages of the PA, the center position of the PV moved to the pressure surface side of the tip of the adjacent blade, and the center position of the TLV moved toward the middle of the flow passage. With a larger tip clearance, the amount of movement at the center positions of both the PV and TLV increased.

1. Introduction

The single stage of an axial-flow turbine used for aircraft propulsion consists of a combination of nozzle blades (stationary blades), which change the flow direction and accelerate the flow, and rotor blades (rotating blades), which extract power from the accelerated high-velocity flow. Generally, axial-flow turbines are used in combination with multiple turbine stages. The main causes of deterioration in the aerodynamic performance of the axial-flow turbines are secondary flows such as the passage vortex (PV) and tip leakage vortex (TLV). Denton [1] classified the losses in a turbine blade into three categories: (1) profile loss, owing to the boundary layer developed on the blade surface; (2) endwall loss, mainly owing to the PV; and (3) leakage loss, owing to the tip leakage flow (TLF). Each of these losses occupies approximately one-third of the total loss. As axial-flow turbines are used worldwide, slight improvements in their aerodynamic performance can produce a significant energy-saving effect. Therefore, loss reduction has been an important research topic for several years.
The turbine nozzle consists of stationary blades without tip clearance. Figure 1a shows the PV occurring inside the passage of turbine blades without tip clearance. The boundary layer upstream of the turbine blade collides with the leading edge and rolls up to form a horseshoe vortex (HSV). Then, this HSV moves to the suction surface (SS) of the adjacent blade, and an endwall boundary layer is added inside the blade to form a large PV at the blade exit.
By contrast, the turbine rotor consists of rotating blades with tip clearance because a small gap is required between the rotating blade tips and the stationary outer casing. Figure 1b shows the PV and TLV occurring inside the passage of turbine blades with tip clearance. The TLV is formed as a vortex in which the leakage flow passes from the pressure surface (PS) to the SS through the blade tip gap and rolls up on the corner of the SS near the blade tip.
Research on the structure of PVs has been ongoing since the 1950s. Turner [2] conducted an initial study to clarify the behavior of the PV from the oil-film trace and static pressure distribution on the endwall, as well as the total pressure and static pressure distributions at the blade outlet plane. Dunham [3] reviewed the empirical correlations for the secondary flow loss proposed in the 1960s. Langston [4] examined the total pressure, static pressure, and flow direction near the endwall using a miniature five-hole probe. Sieverding [5] reviewed the PV studies conducted until the early 1980s. Hodson and Dominy [6,7] assessed the structure of three-dimensional flow and the distributions of total pressure loss at the design and off-design points. Sharma and Butler [8] proposed a quasi-empirical model based on understanding complex secondary flows near the endwall. Wang et al. [9] captured minute vortex structures by visualizing the flow using smoke wires. In the 2000s, research on the structure of PVs using numerical analyses became mainstream. Papa et al. [10] predicted heat transfer using numerical analysis and compared it with the experimental results. Cui et al. [11] conducted a numerical analysis to examine the turbine’s secondary flow structure by changing the inlet conditions to three types: (1) laminar boundary layer, (2) turbulent boundary layer, and (3) wakes and secondary flow from upstream blades. Kanani et al. [12] examined the effects of inlet turbulence and heat transfer on the secondary flow in turbine blades via numerical analysis. Sun et al. [13] investigated the leading-edge vortex effect on an unsteady secondary flow generated near the endwall. Robison and Gross [14] numerically investigated the upstream wake effect on turbine endwall flow. Ligrani and Potts [15] presented an overview of the secondary flow models until 2014 and a survey of the aerodynamic endwall losses by May 2016.
In addition, research on controlling PV has been conducted extensively. In related previous studies, leading-edge fillets/bulbs [16,17], non-axisymmetric endwall contouring [18,19,20,21], boundary layer endwall fences [22], and undulated blades [23] were used as passive control devices, whereas steady jet blowing [24], pulsed jet blowing [25], air suction [26], and PAs [27] were used as active flow-control devices.
By contrast, the effect of tip clearance on the TLV was extensively examined in the 1980s and 1990s. Booth et al. [28] measured the leakage flow rate at the blade tip using a water channel and proposed a simple model for the TLF. Wadia and Booth [29] optimized the design of a blade tip using numerical analysis and experiments. Moore and Tilton [30] experimentally and numerically analyzed the detailed flow inside the tip clearance and discussed the increase in pressure in the gap and the heat transfer at the blade tip. Bindon [31] investigated the mechanisms of loss generation owing to the TLF and clarified that when the TLF entered from the blade PS side, a separation bubble formed on the blade tip edge, causing a significant total pressure loss. Yamamoto [32] conducted experiments using a linear turbine cascade (LTC) with four tip clearance sizes and six incidences. The interference mechanism between the TLV and PV was clarified. Moreover, Yamamoto [33] assessed the flow near the endwall in detail, including inside the tip gap, and clarified the effects of the differences in tip gap sizes and incidences on the total loss. Heyes and Hodson [34] proposed a simplified two-dimensional model to determine the leakage flow and compared it with the experimental results. Sjolander and Cao [35] used a large-size experimental model of an idealized turbine blade tip to measure the gap flow in detail. They compared the predicted and measured values of the two models proposed by Moore and Tilton [30] and Heyes and Hodson [34]. As the tip gap height is an important parameter, considerable research has been conducted to clarify the effects of tip gap variations [36,37,38,39]. Sjolander [40] comprehensively reviewed tip gap effects in axial-flow turbines. Bunker [41] summarized the design, function, and durability of axial-flow turbine blade tips.
Since the beginning of the 2000s, research on controlling TLF has become mainstream. Tip shape [42], squealer tips [43,44,45], stepped squealer tips [46], winglets [47], cavity winglets [48], winglet-cavity tips [49], dual-cavity tips [50], winglet squealer tips [51], and casing grooves [52] have been used as passive control devices. Tip injection [53], blowing jets [54], combined sweeping jet actuators, winglet tips [55], dynamic humps [56], and PAs [57,58,59,60,61] were used as active control devices.
Generally, flow control is divided into passive and active modes. Although some passive flow-control initiatives have achieved varying degrees of success [62], passive control devices have the inconvenience of being permanent and being unable to adapt to changes in operating conditions. By contrast, active flow-control devices can be turned on and off, depending on the operating requirements. Among the active flow-control devices, dielectric barrier discharge (DBD) plasma actuators (PAs) are attracting increasing attention, and research ranging from fundamentals to applications has been conducted. PAs are characterized by a simple structure with flexibility and high response speeds owing to the presence of an electric circuit without mechanical moving parts. Moreau [63], Corke et al. [64,65], and Wang et al. [66] presented comprehensive reviews of the DBD-PA. Recently (published in 2023), three numerical models for DBD-PA were evaluated among themselves and with experimental data, and model modification was proposed [67]. The suitability of DBD-PAs for reducing free vibrations of plates was experimentally and numerically evaluated [68]. Flow separation control over rotating blades of rotorcraft, such as helicopters and drones, using DBD-PA was numerically investigated [69].
The active flow control achieved by applying PAs to the flow of a turbine cascade can be classified into three categories: (1) suppression of the flow separation on the blade SS, (2) reduction in the PV, and (3) reduction in the TLV.
Thus far, the suppression of flow separation in the boundary layer on the SS of a turbine blade has been extensively studied [70,71,72,73,74,75]. Huang et al. [70] successfully reduced the flow separation at low Reynolds numbers by installing a PA at the separation start line on the SS of an LTC. A research group led by De Giorgi [74,75] investigated in detail the effect of the mainstream velocity on the flow separation control and the influence of the PA input waveform using a curved surface model simulating the SS of a turbine blade. In addition, the installation of a PA on the PS of a turbine nozzle blade was proposed by Li et al. [76] to enhance the film cooling effect.
Regarding PV reduction near the endwall of the turbine blade, the installation of PAs in the upstream endwall of the turbine blade was proposed by Matsunuma [27] to accelerate the flow of the inlet wall boundary layer, and experimental research was conducted to reduce the generation of the PV.
Regarding TLV reduction, Van Ness II et al. [57] conducted experiments to reduce the TLF by attaching a PA to the blade tip of an LTC. More recently, a turbine blade with 15 PAs arranged at the SS of the blade tip was proposed by a research group led by Chen [59,60,61], and the effect of TLF reduction was examined using both experimental and numerical analysis. In addition, a unique PA in which the electrodes were installed in the static outer casing of the turbine rotor was developed by Matsunuma and Segawa [58].
The purpose of this study is to clarify changes in the reduction effect of the PV depending on the tip clearance size and the effect of changes in the tip clearance size on the PV when a TLV occurs. In this research, which includes a series of studies conducted to reduce the PV of an LTC using a PA [27], when the PV and TLV coexist, the flow velocity distribution at the cascade exit is measured using particle image velocimetry (PIV), and the change in the vortex structure due to the drive of the PA is captured. This study targets active flow control using a PA at a low Reynolds number condition in the order of 104, where the generated secondary vortices are stronger than those generated at a high Reynolds number in the order of 105 [27].

2. Experimental Equipment and Method

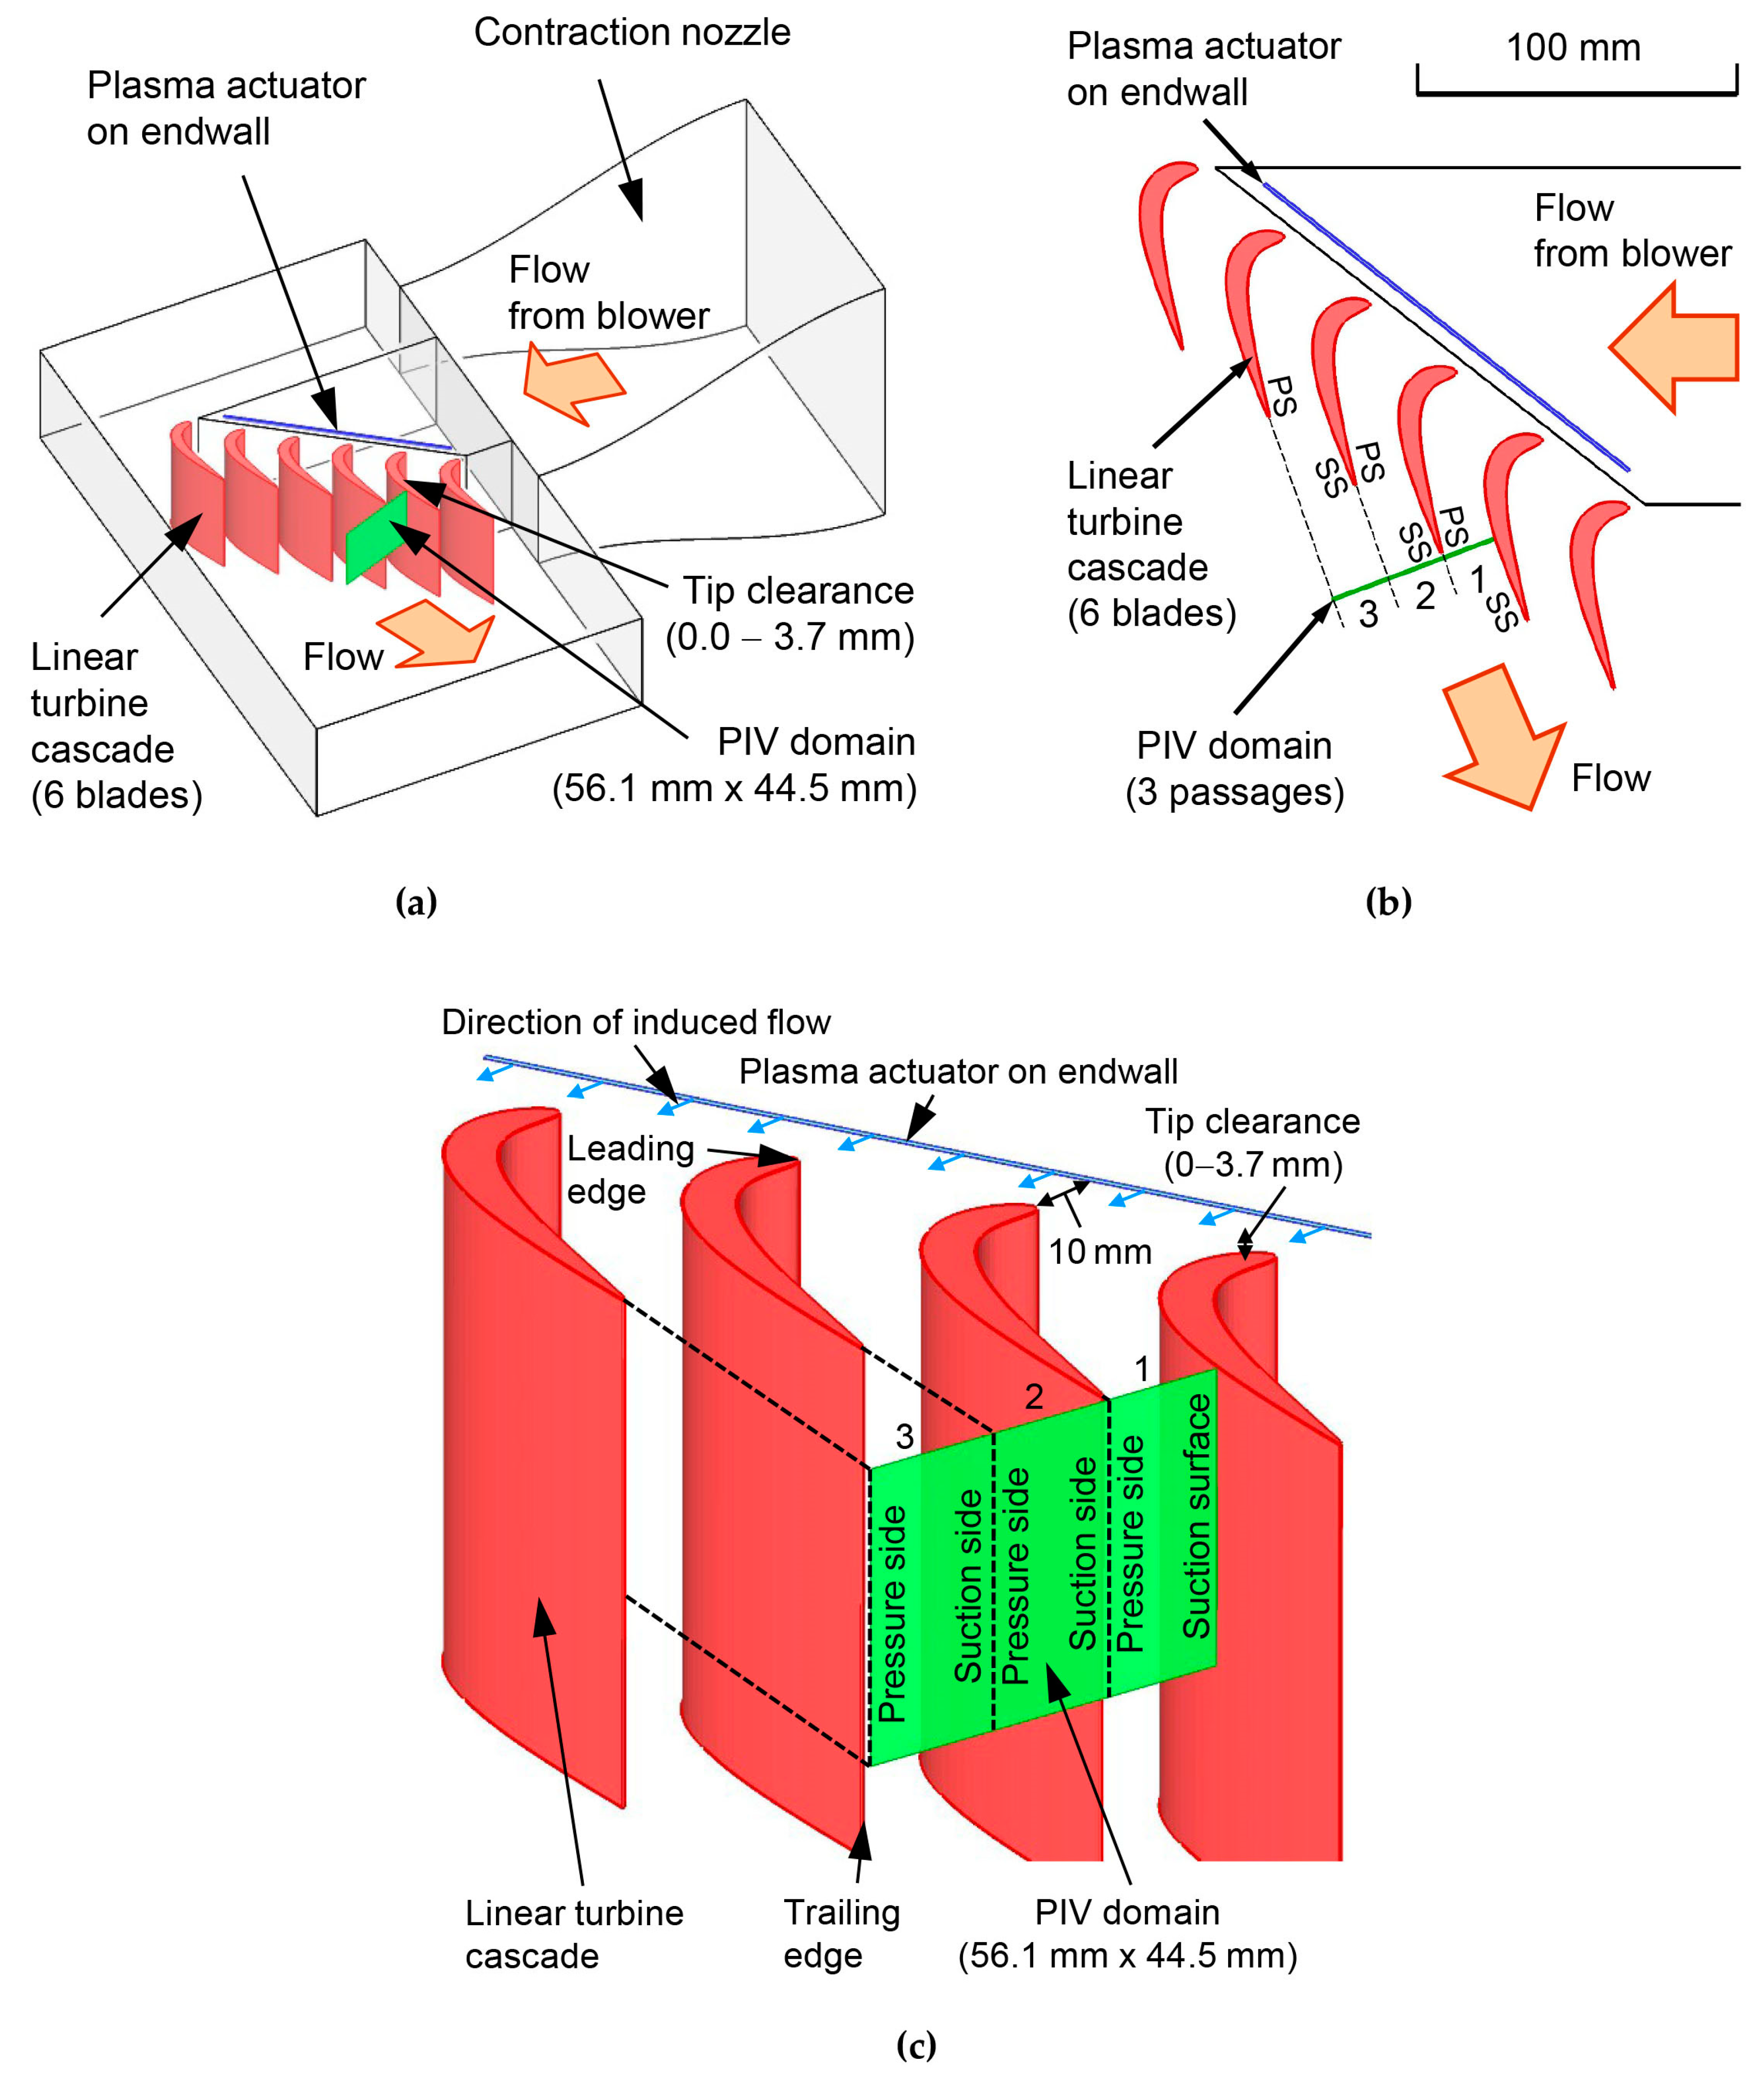
2.1. LTC Wind Tunnel

The measurement section of the LTC is shown in Figure 2. Figure 2a shows that the measurement section had an LTC with six blades. Air from the blow-down wind tunnel was sent to the measurement section. The velocity distribution of the secondary flows, including PV and TLV, at the exit of the LTC, was captured via PIV. In this study, the tip clearance size varied across six types, ranging from 0.0 to 3.7 mm. By changing the tip clearance size, the relationship between the magnitudes of the PV and TLV was varied, and the effect of the PA operation on the change in the vortex structure was observed.
Notably, the relative motion of rotor blades and casings in actual axial-flow turbines was ignored in this experiment. However, Yaras and Sjlander [77] and Yaras et al. [78] investigated the effect of relative motion between the casing and blades using a moving belt attached to the endwall of their LTC wind tunnel. Consequently, they discovered that the effect of rotation reduces the TLF rate. Since the TLF rate contributes to the generation of TLV, the effect of TLV in the fixed blades and fixed endwall experiments is stronger than that in real rotating blades environments. Therefore, there is no problem with using fixed blades for experiments because PA performance is evaluated under more severe conditions than the real rotating blades conditions.
The top view of the measurement section is shown in Figure 2b. A conventional PA was installed 10 mm upstream from the leading edge of the LTC. When dimensionless with respect to the axial chord length, the PA was located at Z/Cax = −0.20, which corresponded to 20% upstream of the axial chord length. As clarified in a previous study [27], this is the most appropriate location for the PA as it results in the highest effect of PV reduction. The PIV domain ranged across three blade passages. Figure 2c shows an enlarged view of the PIV measurement position indicated in Figure 2a. Passages 1, 2, and 3 were located inside, at the exit, and downstream of the blades, respectively. The PA induced a downstream flow, as indicated by the blue arrows in the figure.
The specifications of the present LTC are shown in Table 1. The blade height and pitch are 75.00 and 35.47 mm, respectively. The blade geometry and coordinate data are shown in Appendix A to evaluate the computational fluid dynamics.
In the experiment, the inlet and outlet freestream velocities of the LTC were kept at 3.9 m/s and 4.7 m/s, respectively. The Reynolds number based on the outlet freestream velocity (UFS,out = 4.7 m/s) and blade chord length (C) was approximately 1.8 × 10⁴, corresponding to a low Reynolds number condition.

2.2. PIV Measurements and Data Analysis

The two-dimensional velocity field at the exit of the LTC was recorded using PIV. A detailed description of the PIV system was provided by Matsunuma and Segawa [58]. Atomized dioctyl sebacate (DOS) oil with an average particle diameter of 1 μm was used as the smoke for visualization. A high-speed camera with a resolution of 1280 × 1024 pixels and a frame rate of 3.75 Hz captured 300 pairs of flow images in one experimental condition. The time-averaged velocity, turbulence intensity, and vorticity distributions were analyzed. Preliminary experiments clarified that 200 velocity pairs of flow images or more were sufficient for data analysis of the time-averaged velocity, turbulence intensity, and vorticity. The freestream velocity at the exit of the LTC, UFS,out = 4.7 m/s, was used for the nondimensionalization of the velocity and turbulence intensity distributions.

2.3. PA

A schematic of the conventional DBD-PA is shown in Figure 3a. The device consists of a dielectric material sandwiched between two electrodes. One electrode is exposed to air, and the other is embedded in the dielectric material. When a high-frequency high voltage is applied to the electrodes, DBD plasma is generated at the end of the exposed electrode and induces a unidirectional flow along the surface of the PA.
In this study, the PV was controlled (weakened) by accelerating the boundary layer at the blade inlet using a PA. Figure 3b depicts the control of the inlet boundary layer flow using a PA. By installing a PA on the upstream endwall of the blade leading edge to accelerate the boundary layer flow near the endwall surface, the generation of an HSV at the blade leading edge was weakened, and the PV formed by the development of the HSV was suppressed.
Figure 3c shows a photograph of the PA, with a 150 mm spanwise width, and its cross-section [27]. A 10 kHz sine wave was continuously input, and the input voltage to the PA was changed in the range of 6–15 kVp-p. The absolute velocities induced by the PA at input voltages of 6 kVp-p (minimum) and 15 kVp-p (maximum) were 0.6 and 4.5 m/s, respectively. The power consumptions per PA unit length (1 m) at input voltages of 6 and 15 kVp-p were 13.1 and 421 W/m, respectively.
More detailed information regarding the PA and related operating systems can be found in the paper authored by Matsunuma [27].

3. Experimental Results and Discussion

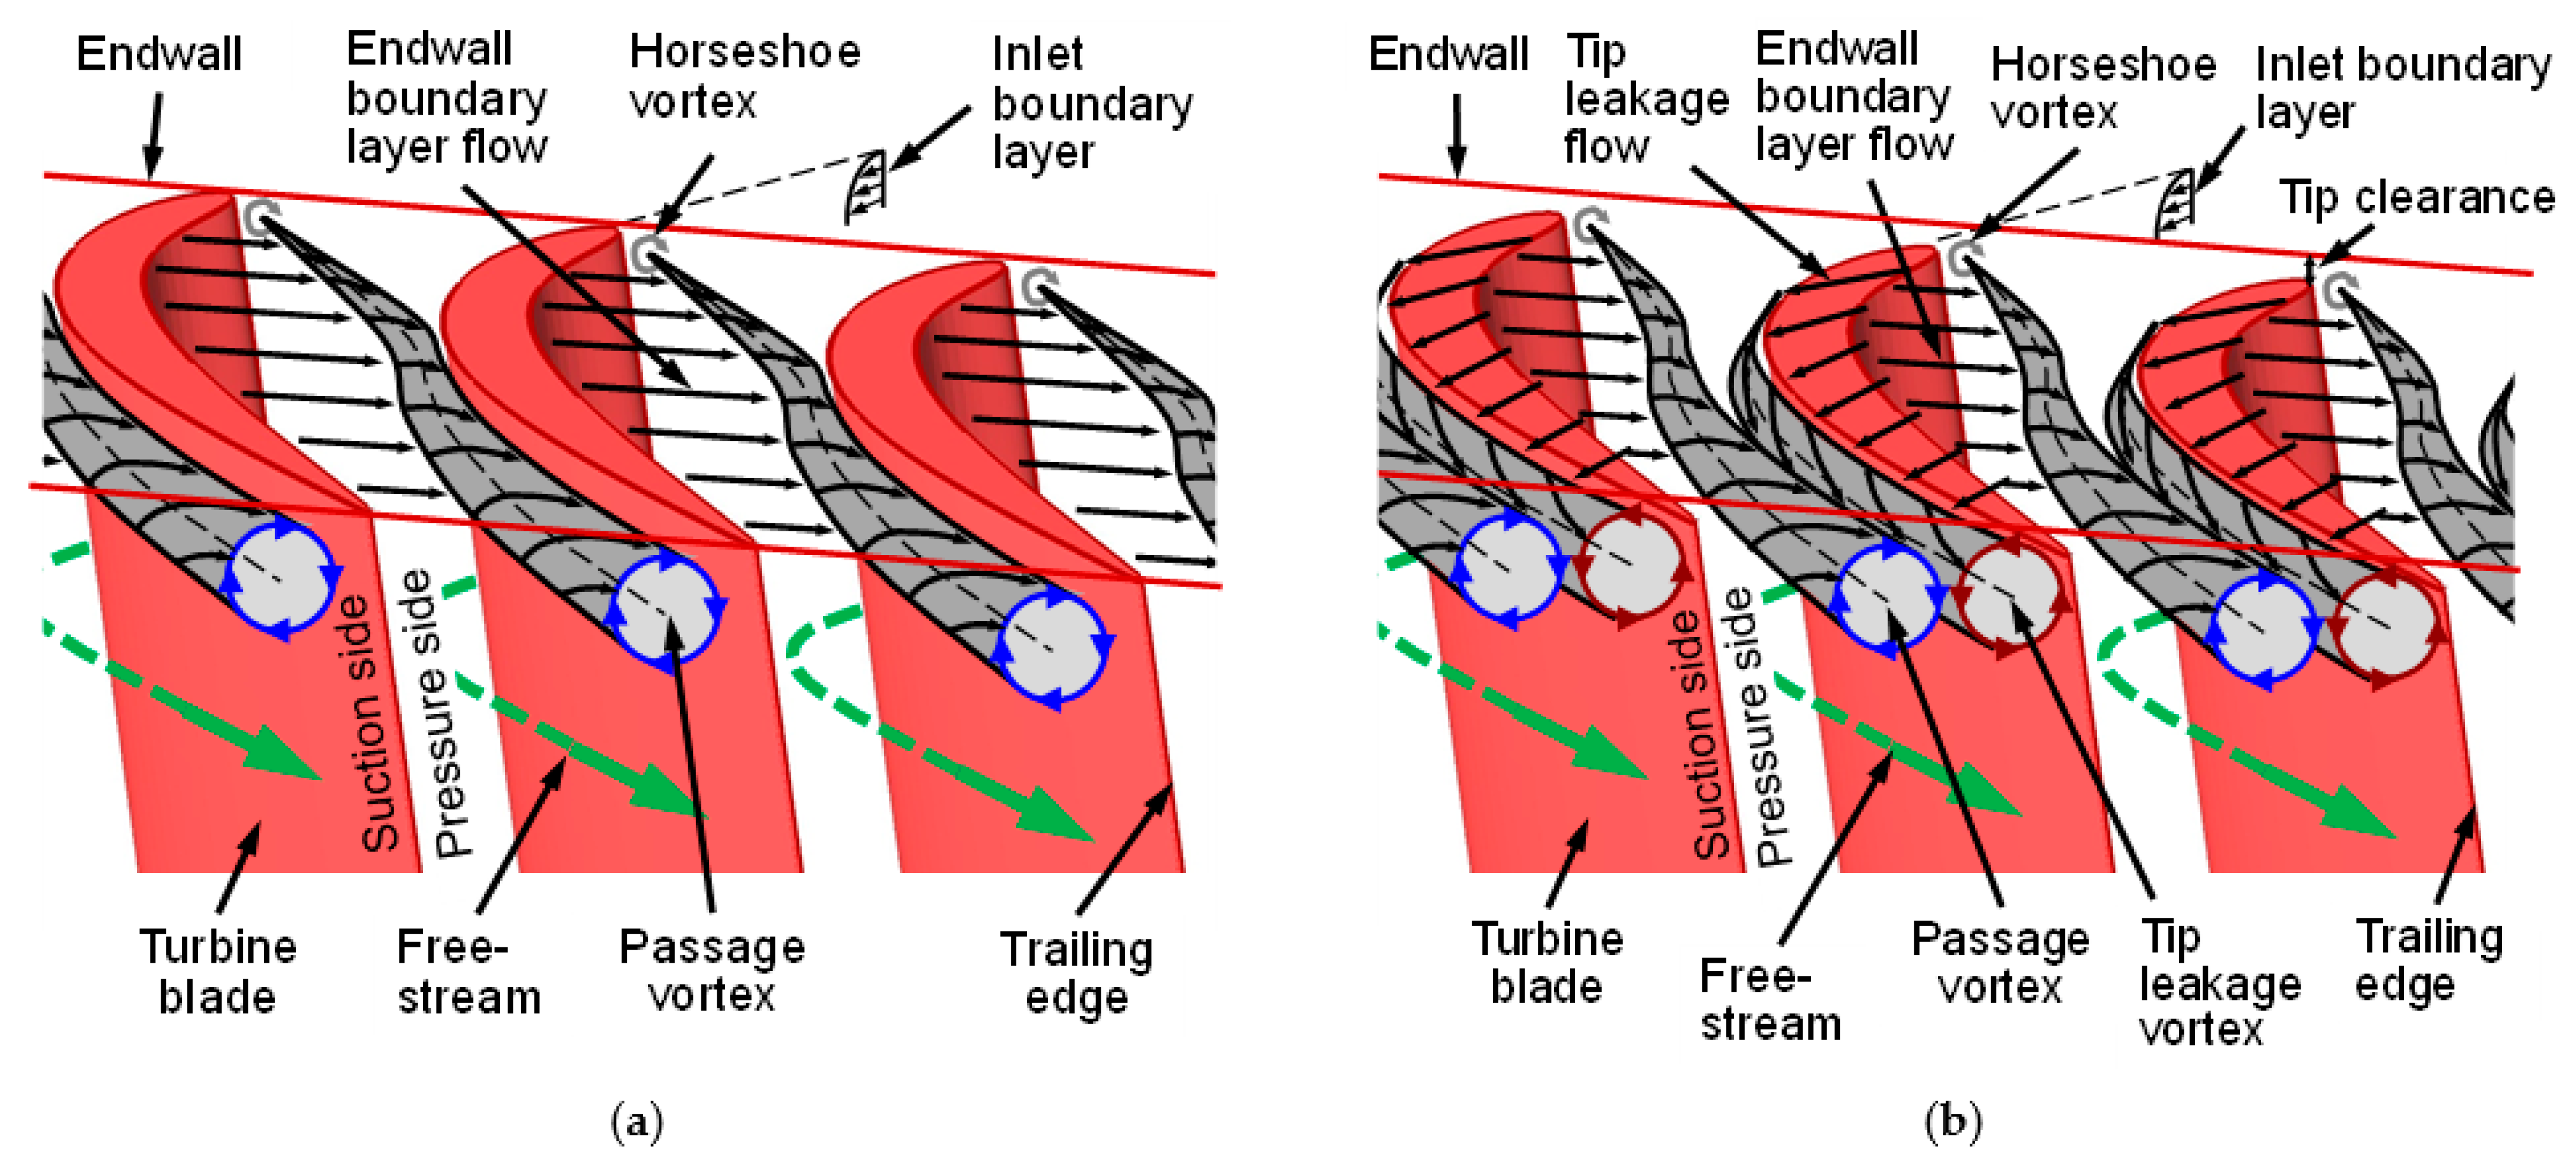
3.1. Secondary Flow without Tip Clearance

Figure 4 shows the velocity distribution of the secondary flow at the exit of the LTC without tip clearance. The freestream velocity at the exit of the LTC is used for the nondimensionalization of the velocity distribution. The figure superimposes the maximum peak values of the velocity.
The baseline velocity distribution under the condition of no control is shown in Figure 4a. A clockwise PV was observed between the blades, and the secondary flow velocity became stronger when the PV collided with the blade SS. The maximum velocities of the PV in Passage 1 (blade inside), Passage 2 (blade exit), and Passage 3 (blade downstream) were 0.32, 0.29, and 0.21, respectively. The maximum velocities decreased as the PV moved downstream.
Figure 4b shows the velocity distribution when the PA was operated at 12 kVp-p. Due to the PV, the high-velocity area weakened and moved toward the endwall. The peak velocities in Passages 1, 2, and 3 were 0.17, 0.10, and 0.12, respectively. These values at 12 kVp-p were less than half of those obtained under the condition of no control.
Figure 5 presents the spanwise distributions of the pitchwise averaged velocity in Passage 2 (center passage, blade exit) without tip clearance for the input voltage varying in the 6–15 kVp-p range. At the no-control condition (black circle in the figure), the maximum peak was observed at the spanwise position between 10 and 20 mm, corresponding to the collision position of the PV and the blade SS, as depicted in Figure 4a. As the input voltage increased, the peak velocity was reduced and moved to the upper endwall side. In particular, the velocity reduction between the input voltages of 9 kVp-p (yellow circle) and 12 kVp-p (light blue circle) was large. At 12 kVp-p, the distribution of the spanwise velocity assumed the flattest shape without a specific peak velocity. Following this, at input voltages higher than 12 kVp-p, the velocity around Y = 10 mm gradually increased.
Figure 6 shows the maximum peak velocity of the PV in Passage 2 (center passage, blade exit) when the input voltage varies in the range of 6–15 kVp-p. The black dashed line in the figure (0.29) indicates the maximum velocity under the condition of no control as the reference. After a 17% decrease from the input voltage of 6–8 kVp-p, the value at the input voltage of 9 kVp-p was almost the same as that with no control. Subsequently, the value at the input voltage sharply decreased by 66% at 12 kVp-p. At input voltages higher than 12 kVp-p, the trend increased slightly. The maximum velocity at 15 kVp-p was reduced by 59%.
Figure 7 shows plots of the center position of the PV. The black and brown circles indicate the center position under no-control and flow-control conditions, respectively, with an input voltage of 15 kVp-p. As the input voltage increased, the center position of the PV moved to the upper endwall side. The amount of movement in the center position of the PV due to the drive effect of the PA increased as the PV moved downstream from Passage 1 (blade inside) to Passage 3 (blade downstream). In particular, the movement between the input voltages of 9 kVp-p (yellow circle) and 12 kVp-p (light blue circle) was significant. This corresponds to the fact that the maximum velocity due to the PV decreased sharply between the input voltages of 9 and 12 kVp-p, as observed in Figure 6.
Figure 8 shows the vorticity distribution. The vorticity distribution under the condition of no control is shown in Figure 8a. The absolute value of the vorticity was high at the center of the clockwise PV observed between each blade. The peak vorticity values in Passages 1, 2, and 3 were −830, −700, and −520 (1/s), respectively. Therefore, the absolute value of the vorticity peak decreased as the PV moved downstream.
Figure 8b shows the vorticity distribution when the PA was operated at 12 kVp-p. The region with strong vorticity weakened and moved toward the upper endwall. The peak vorticity values in Passages 1, 2, and 3 were −380, −260, and −270 (1/s), respectively; these values were less than half of those in the case of no control.
Figure 9 shows the peak value of the vorticity distribution in Passage 2 when the input voltage was varied from 6 to 15 kVp-p. The peak vorticity decreased by 29% when the input voltage varied from 6 to 8 kVp-p and temporarily increased by 23% at 9 kVp-p. Subsequently, it decreased by 63% at 12 kVp-p. At voltages higher than 12 kVp-p, it gradually increased to a 40% decrease at an input voltage of 15 kVp-p.
From the results presented in this section, it can be concluded that the PV with no tip clearance was optimally suppressed at an input voltage of 12 kVp-p.

3.2. Effects of Tip Clearance Size under the Condition of No Control

Figure 10 shows the velocity distribution of the secondary flow at the exit of the LTC when the tip clearance was changed under no control. Figure 10a is the same as Figure 5a and shows the velocity distribution without tip clearance. A clockwise PV was observed between the blades, and the secondary flow was strong when the PV came into contact with the SS. Figure 10b shows the velocity distribution with a tip clearance of 0.9 mm. The maximum peak values of the velocity distribution owing to the PV at Passages 1, 2, and 3 were 0.31, 0.25, and 0.20, respectively. These values were slightly lower than those under no tip clearance, as shown in Figure 10a. Owing to the small tip clearance, the TLV was not captured. Figure 10c shows the velocity distribution at a tip clearance of 1.6 mm. In Passage 1, a small TLF was observed. In Passages 2 and 3, the TLF rolled up and formed a small TLV. Figure 10d shows the velocity distribution with a tip clearance of 2.3 mm. The TLF and TLV increased, and the PV and TLV had the same peak velocity values. Figure 10e shows the velocity distribution with a tip clearance of 3.0 mm. The PV became smaller, and the center position of the PV moved in the upper tip endwall direction. By contrast, the TLF increased and became more dominant than the PV in Passage 1. In Passage 2, the PV was pushed away from the PS of the adjacent blade owing to the influence of the TLV. In Passage 3, the PV disappeared, and only a large TLV existed. Figure 10f shows the velocity distribution at a tip clearance of 3.7 mm. TLVs account for most of the flow passage. PVs were observed in Passages 1 and 2. The PV was pushed toward the tip endwall side of the PS of the adjacent blade, owing to the influence of a strong TLV. Further downstream, in Passage 3, the PV disappeared, and only the TLV remained.
Figure 11 presents the spanwise distributions of the pitchwise averaged velocity in Passage 2 (center passage, blade exit) at various tip clearances. The black circle indicates the spanwise velocity distribution without tip clearance. As indicated, as the tip clearance increased, the velocity near the endwall (the upper region of approximately Y = 20 mm) gradually increased owing to the increase in TLV.
Figure 12 displays the turbulence intensity distribution at the exit of the LTC when the tip clearance is changed under the condition of no control. The turbulence intensity distribution under the condition of no tip clearance is shown in Figure 12a. A clockwise PV only existed in each blade passage, and the turbulence intensity was high at the center position of the PV. In addition, a high turbulence intensity region was observed along the blade SS from the midspan to the lower side of the PV, Y = 30–37.5 mm. This region occurred because the boundary layer on the blade SS was detached owing to the negative velocity gradient in the blade profile. The turbulence intensity distribution with a tip clearance of 0.9 mm is shown in Figure 12b. Although no significant change was observed, the area with high turbulence intensity in the corner on the tip side of the blade SS was considered slightly stronger, indicating that a slight TLF occurred. Figure 12c shows the turbulence intensity distribution at a tip clearance of 1.6 mm. In the TLF and TLV regions, the turbulence intensity was higher than that in Figure 12b. Figure 12d shows the turbulence intensity distribution at a tip clearance of 2.3 mm. The TLV at each passage formed an area with high turbulence intensity. Figure 12e shows the turbulence intensity distribution at a tip clearance of 3.0 mm. The TLF area increased and reached the middle of the passage. In Passage 1, the turbulence intensity was high both at the center position of the TLV and at the part where the TLF and PA collided. In Passage 2, the region with high turbulence intensity extended to the spanwise position of Y = 0–20 mm between the SS and PS sides of the blade passage. In Passage 3, the attenuation of the turbulence intensity approached a uniform turbulence intensity. Figure 12f shows the turbulence intensity distribution at a tip clearance of 3.7 mm. The tip leakage vortices accounted for most of the flow passage, and the turbulence intensity was high, with a peak value of 18%. In Passages 1 and 2, a small PV was observed at the tip endwall of the blade PS. Owing to the influence of the strong TLVs, the turbulence intensity was high in the entire area, from the SS to the PS sides. Further downstream, in Passage 3, the PV disappeared, and only the TLV remained at the center of the passage. The turbulence intensity was attenuated because of flow mixing, and the distribution approached a uniform value at a turbulence intensity of 11%.
Figure 13 presents the spanwise distributions of the pitchwise averaged turbulence intensity in the center passage (Passage 2) under no control at various tip clearances. As the tip clearance increased, the turbulence intensity near the endwall (approximately Y = 25 mm or less) increased significantly. This can be attributed to the rapid development of the TLV, as observed in Figure 12.
Contrarily, at Y = 25 or more, the shapes of the turbulence intensity distributions at tip clearances of 2.3 mm or below were almost flat with 7–8% turbulence intensity. This turbulence intensity could be attributed to the flow separation on the blade SS. When the tip clearance increased with the 3.0 and 3.7 mm values, the turbulence intensity at Y = 25 and below was reduced to 5–7%. This reduction in the turbulence intensity indicates that the flow separation of the blade SS was suppressed by the increased TLV.
Figure 14 shows the streamlines of the secondary flow at the exit of the LTC when the tip clearance changes under the condition of no control. The streamlines under the condition of no tip clearance are shown in Figure 14a. Only one clockwise PV existed between each blade passage. The center positions of the PV were maintained at approximately Y = 16 mm in the longitudinal (spanwise) position of Passages 1, 2, and 3. For the lateral (pitchwise) position, the center position of the PV moved from the SS to the middle of the passage as it moved downstream. In Passages 1 and 2, when the PV collided with the blade SS and rolled up, a counter-rotating wall vortex induced by the PV (indicated by WVIPV in the figure) was generated. Using a smoke-wire flow visualization, Wang et al. [9] also found a similar formation of a wall vortex. Figure 14b shows the streamlines at a tip clearance of 0.9 mm. As the tip clearance was small, it was almost the same as that shown in Figure 14a. The streamlines at a tip clearance of 1.6 mm are shown in Figure 14c. A TLF and TLV were observed on the SS of the blade tip. Figure 14d shows the streamlines at a tip clearance of 2.3 mm. Between all the flow passages, the TLV grows larger, pushing the PV to the PS of the adjoining blade. Figure 14e shows the streamlines at a tip clearance of 3.0 mm. The TLV increased, and Passages 1 and 2 occupied up to the middle of the passage. The PV was pushed by the TLV and moved to the blade PS. In passage 3, the PV disappeared, and only the TLV remained. Figure 14f shows the streamlines at a tip clearance of 3.7 mm. The PV became smaller, and the TLV accounted for most of the flow passage. In Passage 3, the TLV was observed.
Figure 15 explains how the PV and TLV center positions change when the tip clearance is changed in the no-control condition, as shown in Figure 14. The black and green marks indicate the center positions under the conditions of no tip clearance (0.0 mm) and a tip clearance of 3.7 mm, respectively. The circular and squared marks represent the centers of the PV and TLV, respectively. As the tip clearance increased, the center position of the TLV moved from the SS to the middle of the passage (indicated by the red arrow in the figure). By contrast, the PV was pushed away by the TLV, and the center position of the PV moved toward the upper part of the PS (indicated by the blue arrow in the figure). The amount of movement in the center positions of the TLV and PV increased as they moved downstream. When the tip clearance was 2.3 mm (marked in orange), the movement in the center positions was particularly large.
As described in the introduction, Yamamoto [32] experimentally investigated the interaction mechanisms between the TLV and PV in an LTC at various tip clearance sizes using a five-hole pressure probe. The major specifications of Yamamoto’s turbine blade are as follows: blade height: 100 mm, blade chord length: 73.5 mm, and design turning angle: 107.1°. Yamamoto’s study considered four tip clearance sizes of 0.0 (no clearance), 1.3, 2.1, and 2.7 mm. Comparing the specifications of the LTC in this study, as shown in Table 1, the blade height and blade chord length of Yamamoto’s LTC are approximately 1.3 times larger than those in this study. Hence, the turning angle of Yamamoto’s cascade is almost the same value of approximately 110° compared with that in this study. Accordingly, the blade aerodynamic characteristics of Yamamoto’s and our cascades were considered to be similar. Yamamoto’s paper shows the distributions of the secondary flow vectors at the blade exit and downstream planes at various tip clearance sizes. In Yamamoto’s results, when the tip clearance size was 1.3 mm, a small TLV appeared at the corner of the SS and endwall, which is close to the streamlines in Figure 14c in this study. When the tip clearance size became 2.1 or 2.7 mm, the TLV got larger, which resembled the streamlines in Figure 14d. The TLV pushed the PV to the PS of the adjoining blade. With the tip clearance size increase, the TLV became stronger; however, the PV became weak. These results of the vortex motions caused by the increase in the tip clearance size were similar to those corresponding to the movement of the center positions of the passage and leakage vortices in Figure 13. Therefore, the observed results in this study were qualitatively the same as the previous observation by Yamamoto. Compared with Yamamoto’s experiments, the range of tip clearance change in this study was wide. Hence, the experimental results in this study showed very large tip clearance conditions like τ = 3.0 or 3.7 mm in Figure 14e,f, where the TLV is larger than the PV.
Figure 16 shows the vorticity distributions at the exit of the LTC when the tip clearance changes under the condition of no control. The vorticity distribution under the condition of no tip clearance is shown in Figure 16a. Regions of negative vorticity created by a clockwise PV were observed between the blades. The negative vorticity values at the center position of the clockwise PV in Passages 1, 2, and 3 were −830, −700, and −520 (1/s), respectively. Therefore, as the PV moved downstream, the vorticity at the center weakened. Moreover, a region of positive vorticity due to the counterclockwise wall vortex was generated under the clockwise PV. This wall vortex was induced when the PV collided and rolled up on the blade’s SS side. Figure 16b shows the vorticity distribution at a tip clearance of 0.9 mm. Although no significant change was observed in the shape of the overall distribution, the local vorticity strength at the center position of the PV was weakened, and a slight TLF affected the PV. Figure 16c shows the vorticity distribution at a tip clearance of 1.6 mm. Owing to the TLF and TLV, regions with strong positive vorticity occurred on the SS of the blade tip. Figure 16d shows the vorticity distribution at a tip clearance of 2.3 mm. In each passage, the TLV area was larger than in Figure 16c. By contrast, the peak vorticity at the center position of the PV was weaker than that shown in Figure 16c. Figure 16e shows the vorticity distribution at a tip clearance of 3.0 mm. The TLF increased, and the positive vorticity area occupied a wide area near the middle of the flow passage. The vorticity distribution at a tip clearance of 3.7 mm is shown in Figure 16f. The TLV accounted for most of the flow passage. A region of negative vorticity due to the PV in Passage 1 was observed on the tip endwall side of the PS of the blade. Downstream of Passages 2 and 3, the negative vorticity region owing to the clockwise PV weakened, and the positive vorticity region owing to the counterclockwise TLV spread in the middle of the flow passage.
Based on the experimental results presented in this section, it can be concluded that a large PV and a small TLV occurred under the 1.6 mm tip clearance condition, and a small PV and a large TLV occurred under the 3.0 mm tip clearance condition. Therefore, Section 3.3 presents the effects of driving a PA and changing the input voltage for two cases with tip clearances of 1.6 and 3.0 mm.

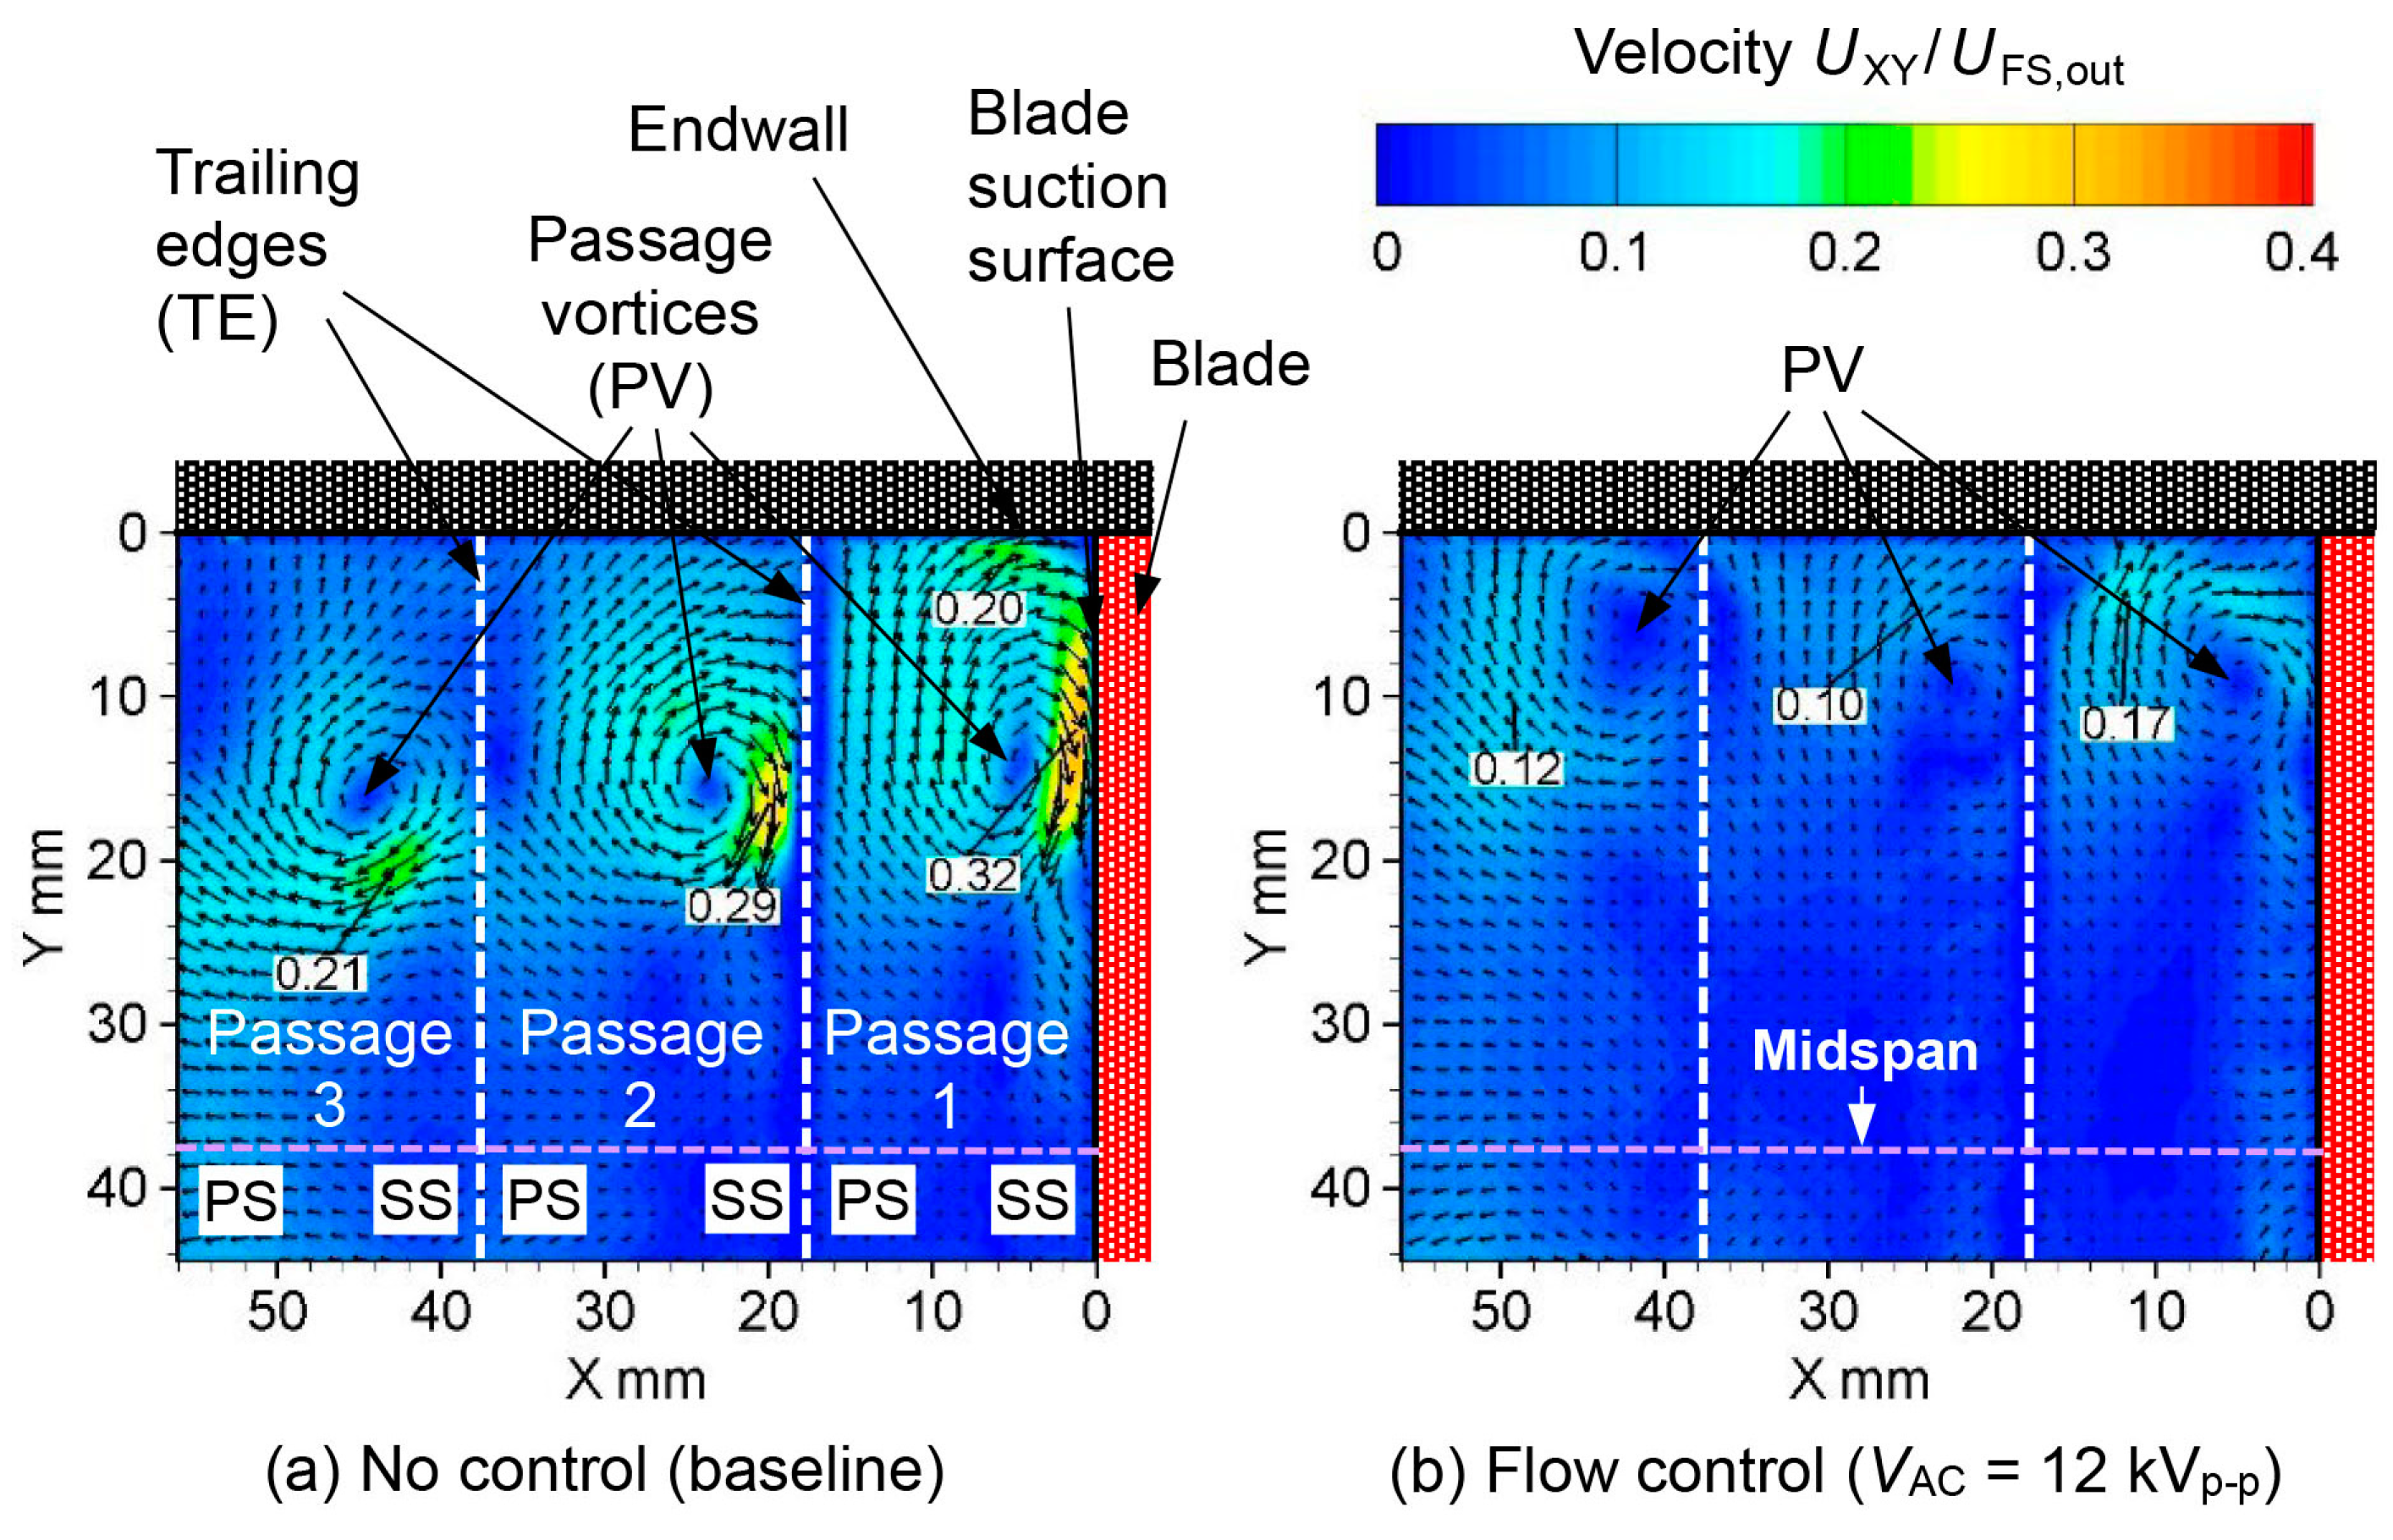
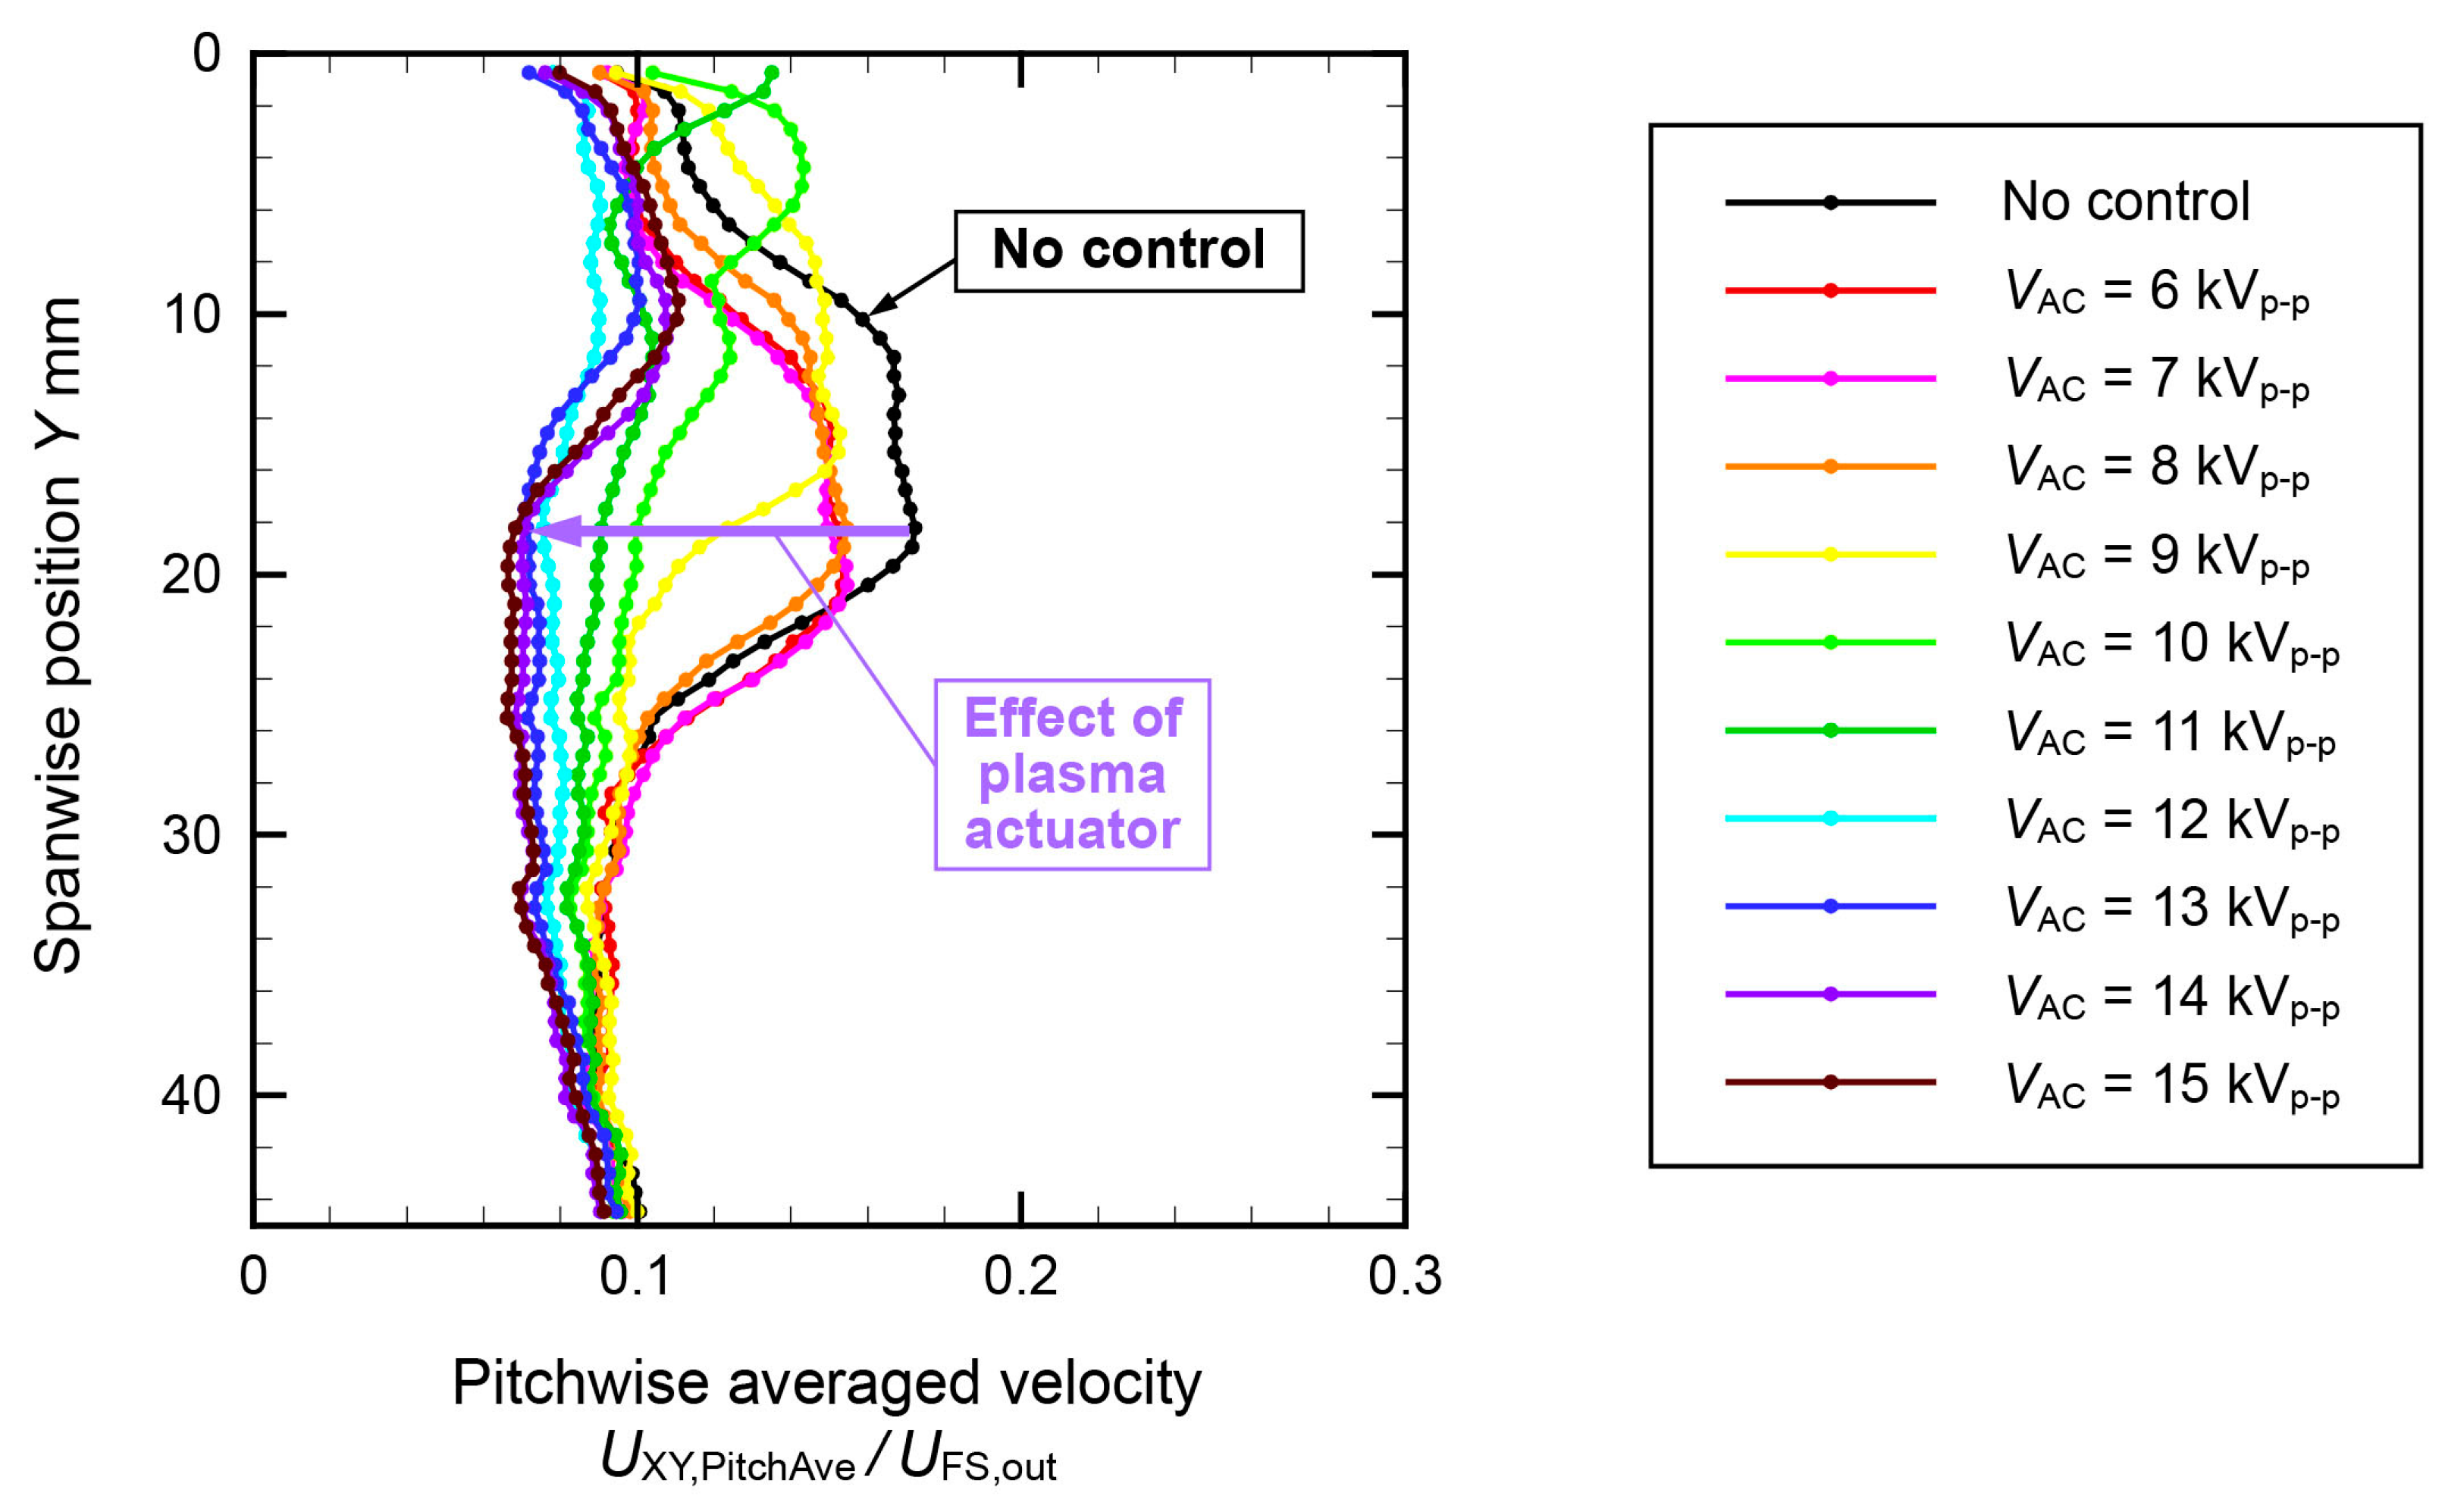
3.3. Effect of the Input Voltage on Active Flow Control of the PV by a Plasma Actuator

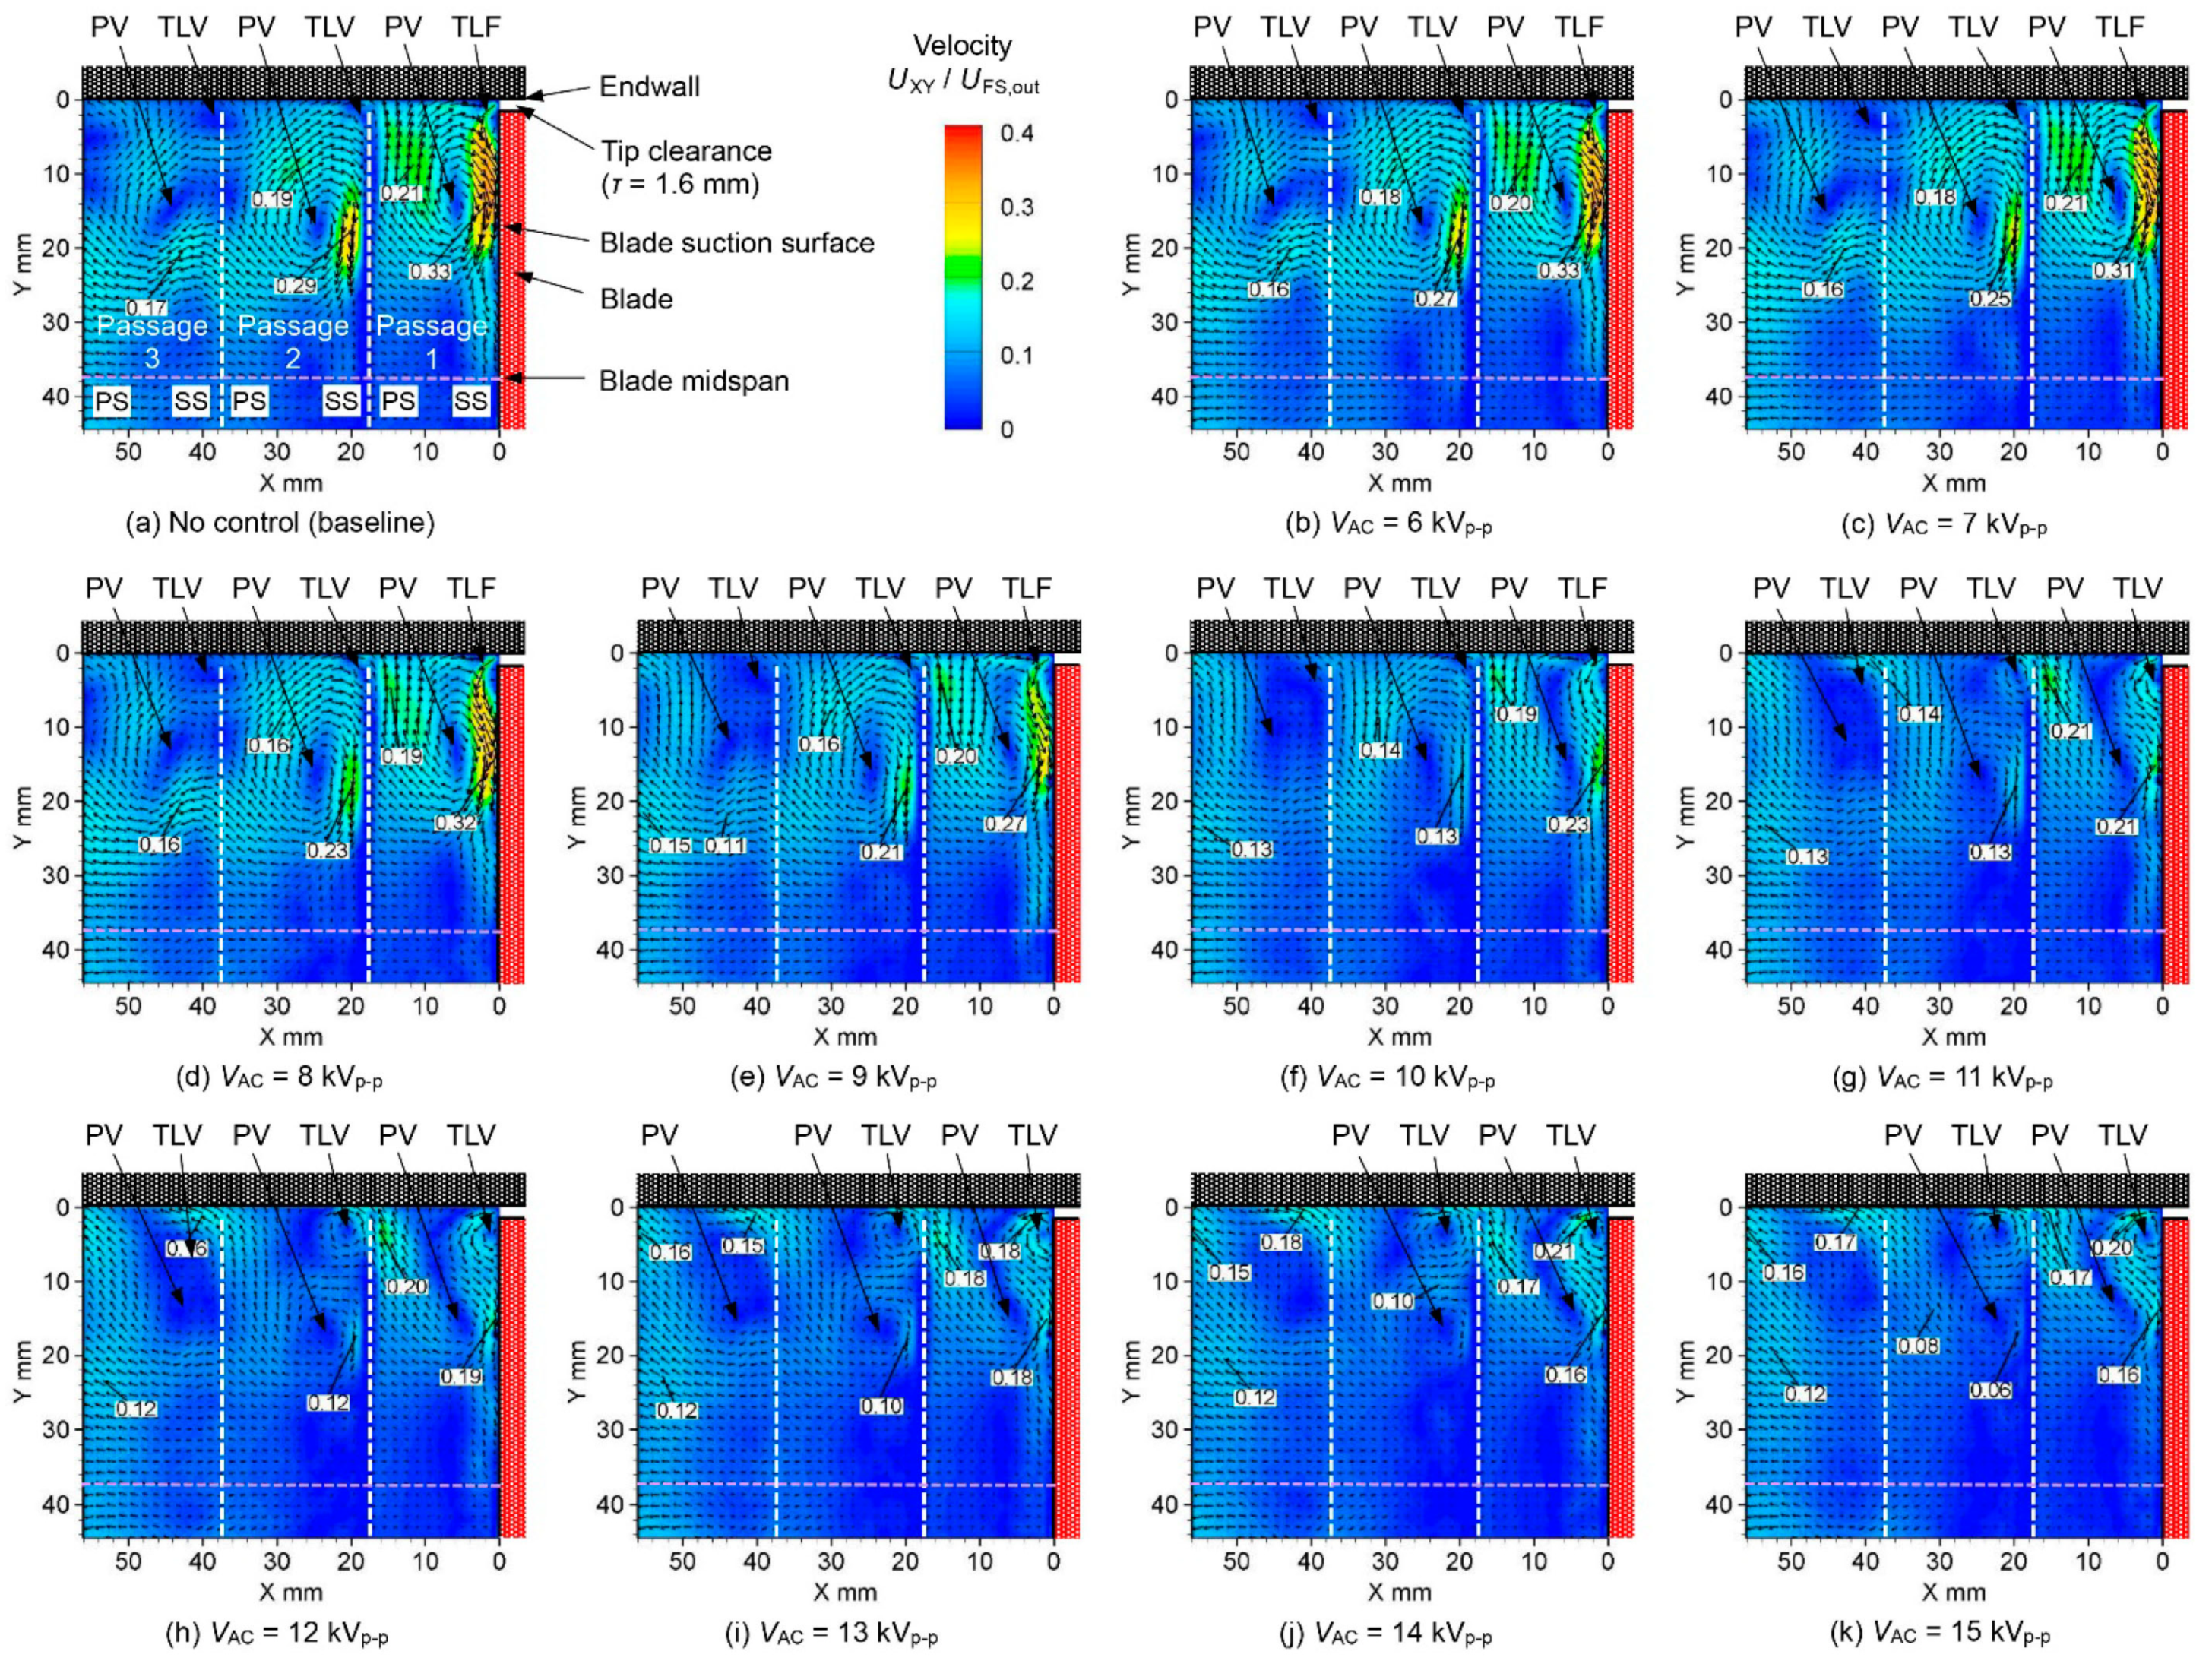
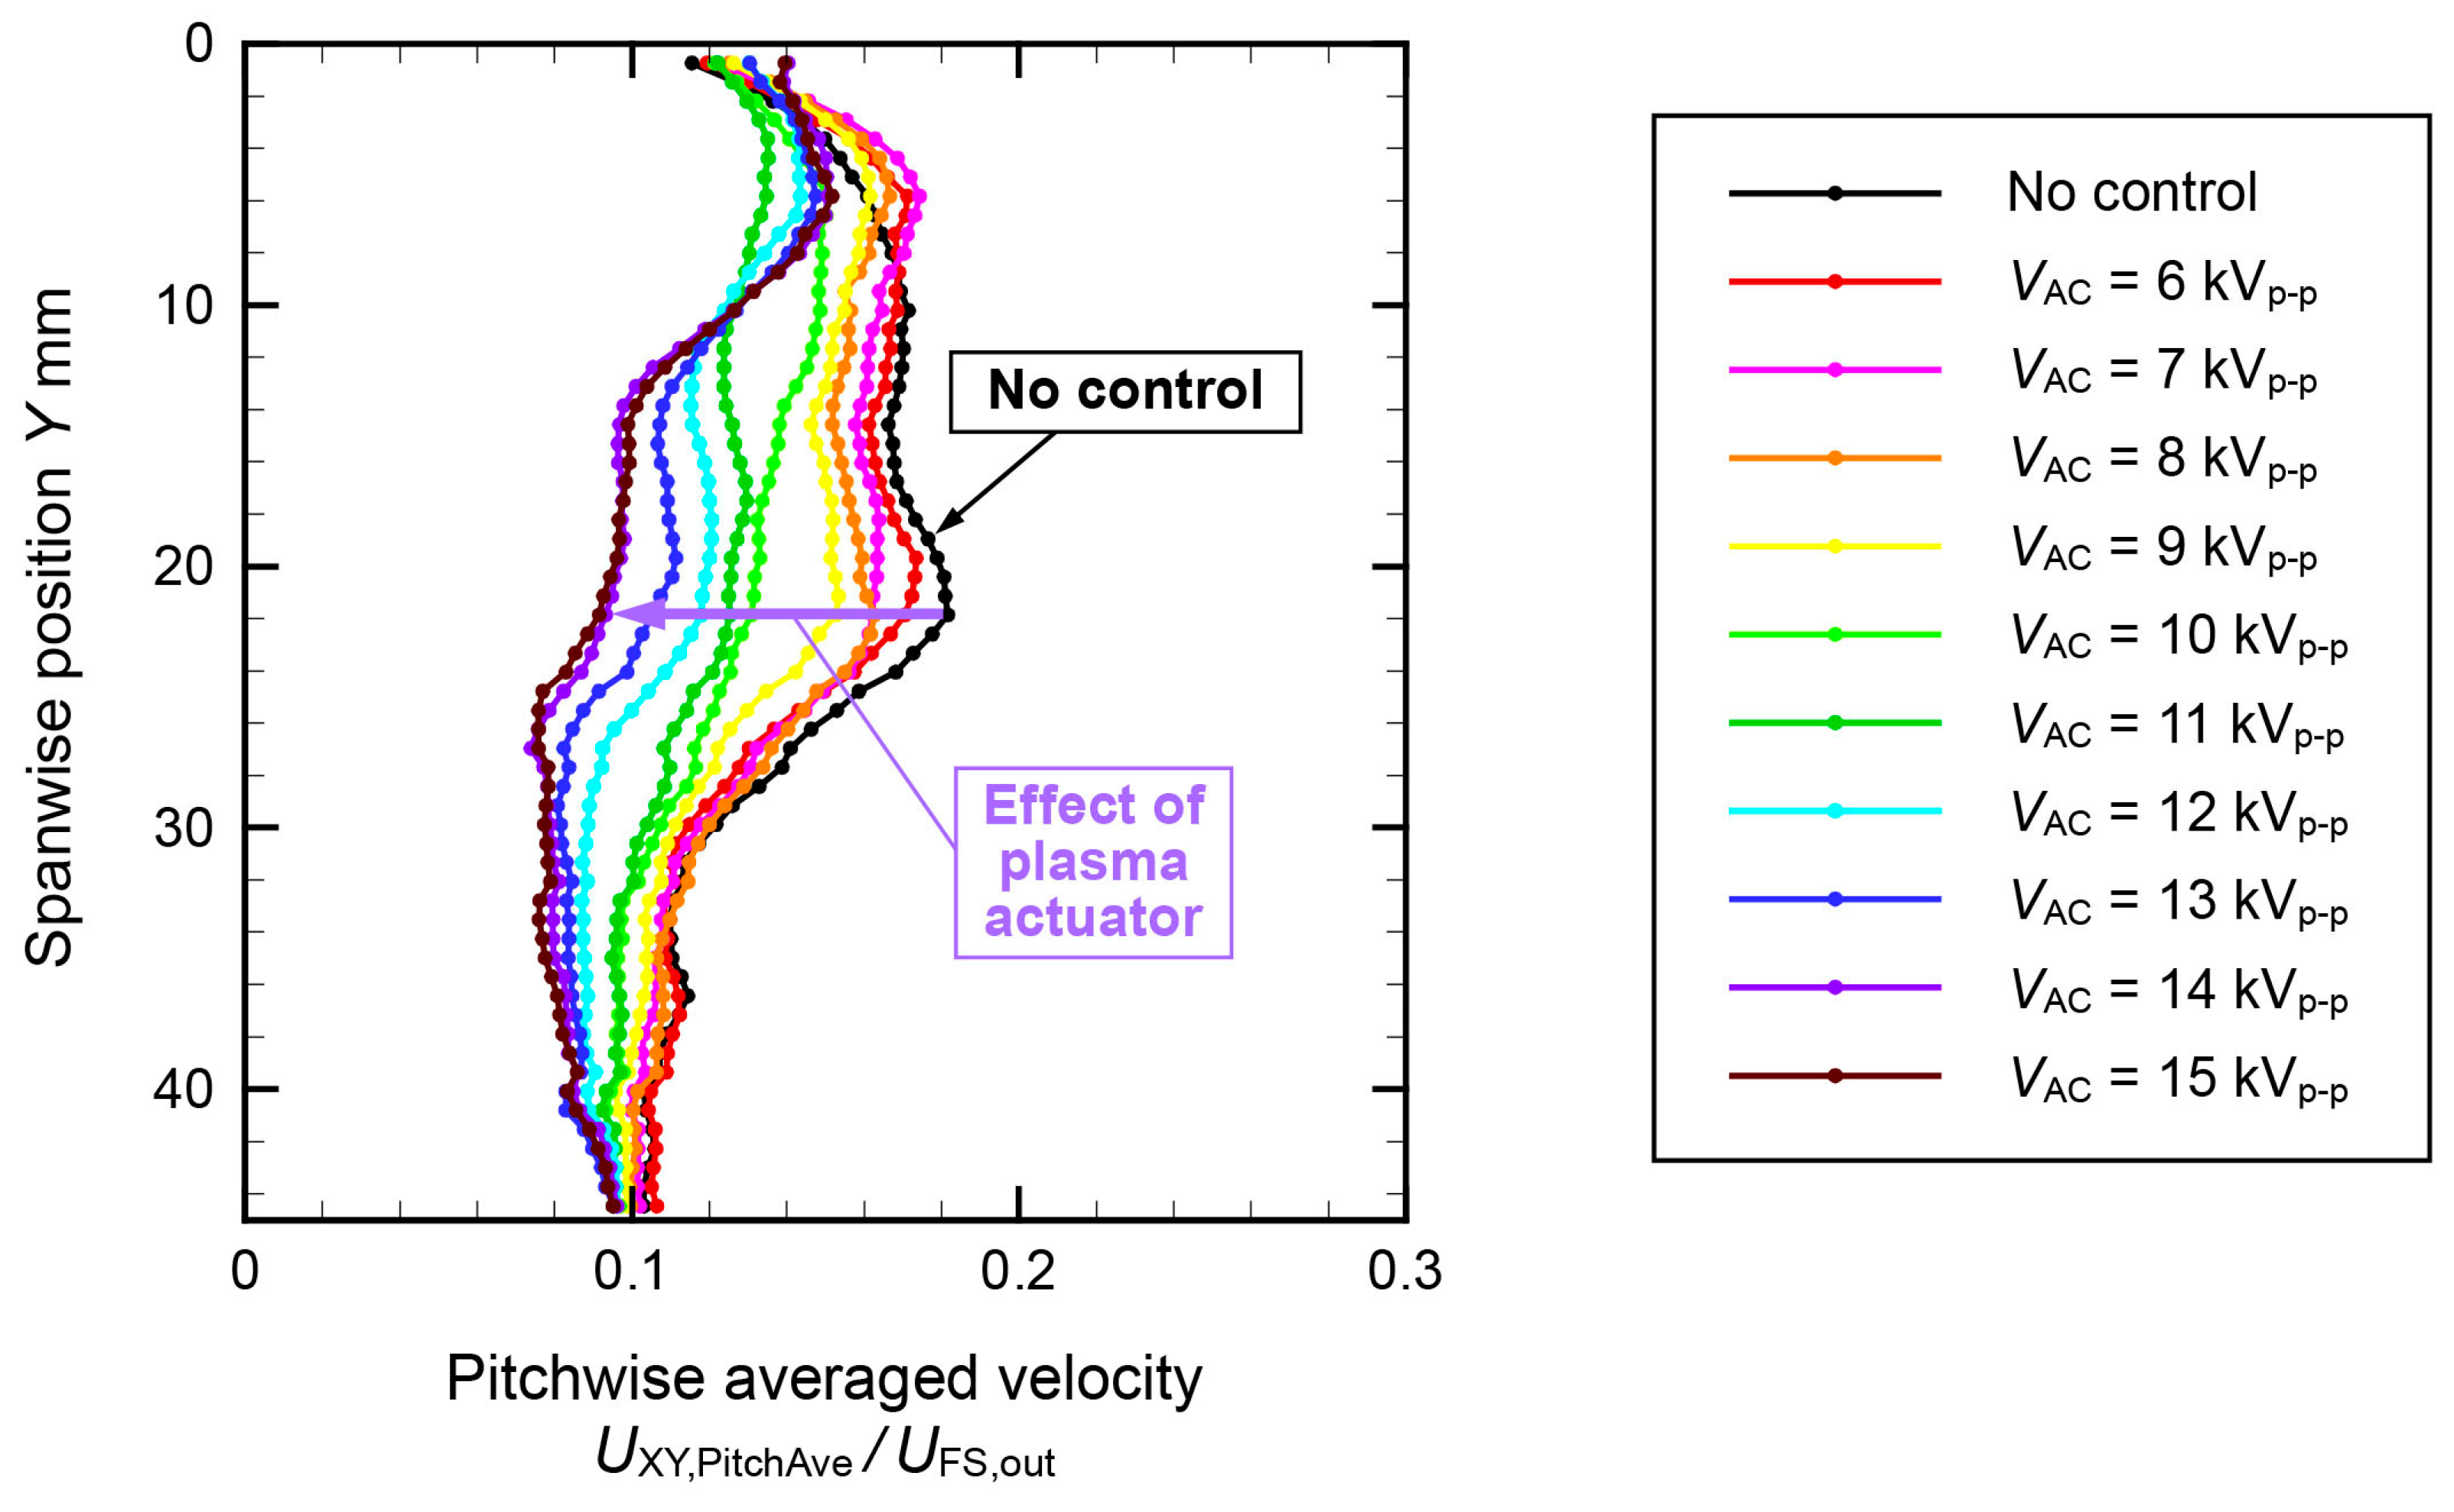
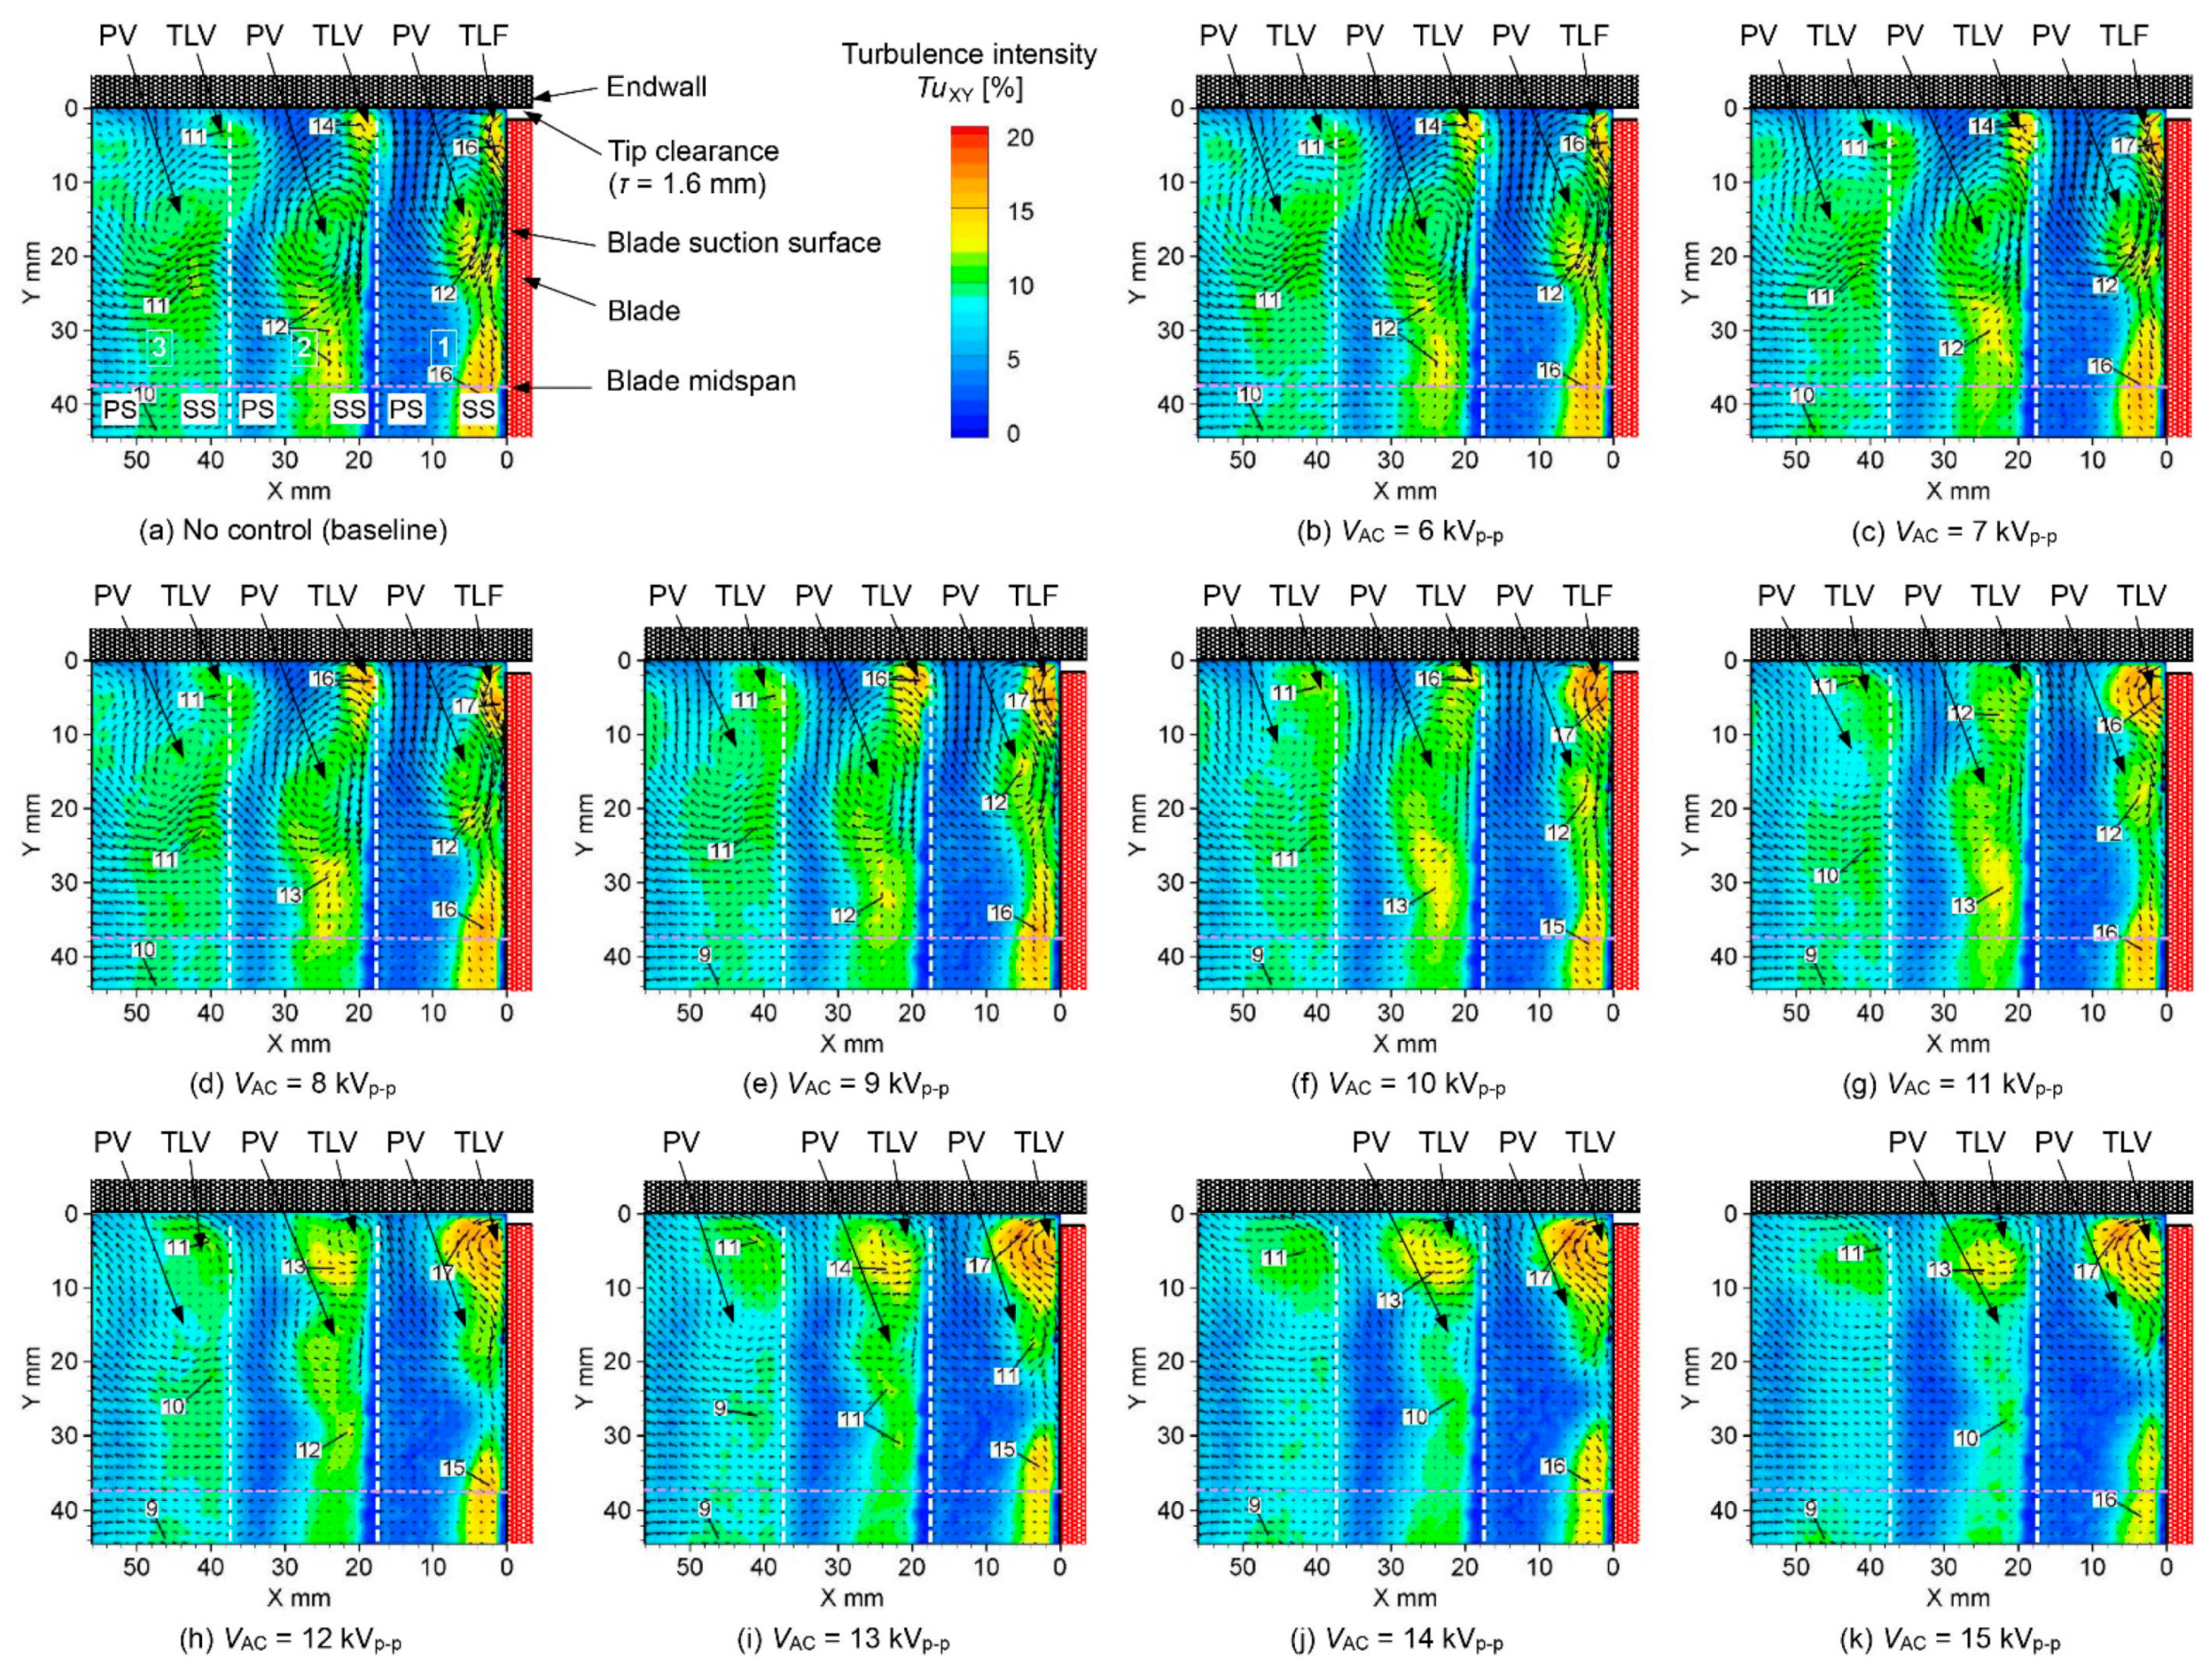
3.3.1. Tip Clearance of 1.6 mm (PV: Large, TLV: Small)

Figure 17 shows the velocity distribution of the secondary flow at a tip clearance of 1.6 mm. The velocity distribution under the condition of no control (considered the reference) is shown in Figure 17a, which is the same as that shown in Figure 10c. Figure 17b–k show the velocity distributions when the input voltage increases by 1 kVp-p from 6 to 15 kVp-p. As the input voltage increased, the peak velocity generated by the PV colliding with the blade SS decreased. This was because the drive of the PA suppressed the PV. By contrast, as the PV was suppressed, the TLV spread widely and was distributed in the middle of the flow passage. A high-velocity region was generated when the TLF exited the tip of the blade SS. At an input voltage of 14 kVp-p or higher (Figure 17j,k), the peak velocity of the TLV was higher than that of the PV. Moreover, as the input voltage increased, a high-velocity region occurred on the blade PS due to the tip gap flow.
Figure 18 presents the spanwise distributions of the pitchwise averaged velocity in the center passage at various input voltages. As the input voltage increased, the spanwise distribution of velocity gradually decreased. At the spanwise position around Y = 22 mm, the velocity at 14 kVp-p or higher was almost half that at no control.
Figure 19 shows how the maximum velocity in Passage 2 (center passage) changes depending on the input voltage. The maximum velocity in Passage 2 was generated at the position where the PV hits and rolls up from the blade SS. As the input voltage increased, the maximum velocity gradually decreased. In particular, the maximum velocity sharply decreased between 9 and 10 kVp-p, and the suppression effect of the PV increased in this vicinity. When the velocity distributions at the input voltages of 9 and 10 kVp-p in Figure 15e,f were observed again, the peak velocities at Passages 1 and 2 of Figure 15f decreased suddenly. For the last time, at an input voltage of 15 kVp-p, the maximum velocity owing to the PV was reduced by 72% compared with that under the condition of no control.
Figure 20 shows the turbulence intensity distribution. The turbulence intensity distribution under the condition of no control (reference) is shown in Figure 20a, which is the same as that shown in Figure 12c. The turbulence intensity was high at the position where the TLF exits the blade SS, where the TLF and the freestream strongly collided with each other, with large differences in velocities and flow angles. The maximum turbulence intensities in Passages 1, 2, and 3 were 16%, 14%, and 11%, respectively. Figure 20b–k show the turbulence intensity at the PA input voltage ranging from 6 to 15 kVp-p. The region with high turbulence intensity owing to the PV existed near the longitudinal position of Y = 10–25 mm under no control; however, as the input voltage increased, the PV weakened, and the turbulence intensity in this area was reduced. Moreover, a high turbulence intensity region caused by the blade boundary layer separation was observed beside the blade SS with Y = 25 mm or more. By contrast, the area of high turbulence intensity caused by the TLF increased, and the maximum turbulence intensity remained almost the same value of approximately 17% in Passage 1. The lateral spread of the high turbulence intensity area by the TLF was half of the flow passage width at 10 kVp-p and approximately two-thirds of the passage width at 12 kVp-p or more.
Figure 21 presents the spanwise distributions of the pitchwise averaged turbulence intensity in the center passage with a tip clearance of τ = 1.6 mm at various input voltages. At Y = 10 mm or more, the turbulence intensity gradually reduced as the input voltage increased. This could be attributed to the reduction in the PV. Contrarily, at Y = 10 mm or less, the turbulence intensity increased as the input voltage increased. This is caused by the TLV growth corresponding to PV reduction.
Figure 22 shows the streamlines of the secondary flow. The streamlines under the condition of no control (reference) are shown in Figure 22a. A large PV existed in each passage, and a small TLV at the SS near the blade tip. Figure 22b–k show that the PV decreases as the input voltage increases. By contrast, the TLV became larger, and the PV and TLV were approximately the same size at 14 kVp-p. Furthermore, at 15 kVp-p, the TLV was larger than the PV. In Passage 3, the TLV existed up to an input voltage of 13 kVp-p; however, it disappeared when the input voltage was increased to 14 kVp-p or higher. This was because the PV and TLV became equally strong, thus interfering with and weakening each other.
In the previous study for reducing the TLV using a PA conducted by Matsunuma and Segawa [58], as the TLV became weaker and smaller by the drive of the PA, the PV became stronger and larger. This phenomenon is similar to the result of this study. These observations indicate that when counter-rotating vortices, namely a PV and a TLV, coexist in the turbine passage, the dissipation of only one vortex provides the undesired development of the other vortex, which cancels the benefit of the reduction in a vortex by the PA.
Figure 23 shows how the center positions of the PV and TLV change when the input voltage of the PA is gradually increased. The circular and squared marks indicate the PV and TLV center positions, respectively. In Passage 1, as the input voltage increased, the PV weakened, and the center position of the PV moved toward the upper endwall side (blue arrow in Passage 1). In addition, the center position of the TLV moved slightly laterally (red arrow). In Passage 2, the center of the PV moved toward the upper endwall side at up to 10 kVp-p and then turned toward the blade SS at 11 kVp-p and above (blue arrow in Passage 2). By contrast, the center of the TLV moved laterally toward the middle flow passage (red arrow). In Passage 3, the center position of the PV at up to 10 kVp-p moved toward the upper endwall side; however, at 11 kVp-p and above, it moved toward the blade midspan side (blue arrow in Passage 3). This was because the TLV pushed back the PV diagonally downward from the flow passage (red arrow). Generally, the further downstream, the greater the movement of the PV and TLV center positions.
Here, the comparison of Figure 15 and Figure 23 is discussed. In Figure 15, the tip clearance size was primarily changed. Therefore, with the increase in the tip clearance size, the TLV was mainly strengthened. Then, the strengthened TLV weakened the PV and pushed it to the PS of the adjacent blade. Stated in a different way, the change in the TLV is master, and the change in the PV is servant. Contrarily, in Figure 23, the PV is primarily changed. According to the drive of the PA, the PV was mainly weak. Then, the weakened PV made a vacant space, and the TLV flowed into it. Consequently, the TLV was strengthened. In other words, the change in the PV is master, and the change in the TLV is servant. From this difference in the changing mechanism of the vortex structure, the movement of the center position of the PV in Figure 23 is relatively smaller than that in Figure 15.
Figure 24 shows the vorticity distribution. As shown in Figure 24a, under the condition of no control, the negative vorticity region due to the PV is large; however, as shown in Figure 24b–k, as the input voltage increases, the negative vorticity region (blue color) due to the PV decreases; conversely, the positive vorticity region (red color) due to the TLV increases.
Figure 25 shows the maximum vorticity (negative value) generated by the PV in Passage 2 (center passage). The black dashed line (−550 (1/s)) indicates the peak vorticity under the condition of no control as the reference. As the input voltage increased, the vorticity strength gradually decreased. The maximum vorticity at 15 kVp-p is −210 (1/s), which was reduced by 62% compared with the condition of no control.
Figure 26 shows the maximum vorticity (positive value) generated by the TLV in Passage 2. When the input voltage was 11 kVp-p or less, the vorticity value was almost the same under the condition of no control (indicated by the black dashed line, 650 (1/s)). However, when the input voltage was 12 kVp-p or higher, the vorticity gradually decreased, and the maximum vorticity at 15 kVp-p, 480 (1/s) was reduced by 26% compared with that under the condition of no control.

3.3.2. Tip Clearance of 3.0 mm (PV: Small, TLV: Large)

Figure 27 shows the velocity distribution of the secondary flow under a tip clearance of 3.0 mm. The velocity distribution under the condition of no control as the reference is shown in Figure 27a, which is the same as in Figure 10e. In Passage 1, the TLV was large and flowed out laterally to approximately half of the blade pitch. The PV was pushed away from the blade PS. As shown in Figure 27b–k, when the input voltage is increased, the PV is suppressed, and thus, it decreases in size. By contrast, the TLV increased and extended to the PS of the adjacent blade.
Figure 28 depicts the spanwise distributions of the pitchwise averaged velocity in the center passage with tip clearance (τ = 3.0 mm) at various input voltages. The velocity gradually reduced at Y = 12 mm or more as the input voltage increased. This could be attributed to the reduction in PV. Contrarily, at Y = 6 mm or less, the velocity increased as the input voltage increased. This occurs owing to the growth in the TLV due to reduction in the PV.
Figure 29 shows the maximum velocity generated by the TLV in Passage 2. The maximum velocity up to 9 kVp-p was almost the same as that under the condition of no control; however, the maximum velocity abruptly increased when the input voltage reached 10 kVp-p or more. At an input voltage of 15 kVp-p, the maximum velocity was 62% higher than that under the condition of no control. The higher the input voltage, the stronger the TLV.
Figure 30 shows the turbulence intensity distribution. The turbulence intensity distribution under the condition of no control is shown in Figure 30a. Owing to the presence of both TLV and PV, regions with high turbulence intensity spread throughout the passages in the vertical range of Y = 0–25 mm. When the PV weakened due to the drive of the PA, the TLV expanded laterally. At 10 kVp-p or higher (Figure 30f–k), the regions with high turbulence intensities were narrowed in the longitudinal position in the range of Y = 0–20 mm. At Y = 20 mm and above, the area with low turbulence intensity (the mainstream, blue-colored area) increased compared with that under no control. In addition, the area with high turbulence intensity near the midspan on the blade SS decreased, indicating that the boundary layer separation from the blade SS decreased.
Figure 31 illustrates the spanwise distributions of the pitchwise averaged turbulence intensity with tip clearance (τ = 3.0 mm). At Y = 32 mm or less, the turbulence intensity gradually reduced as the input voltage increased. Contrarily, the turbulence intensity at Y = 32 mm or more presented no differences at various input voltages.
Figure 32 shows the streamlines of the secondary flow. The streamlines under the condition of no control are shown in Figure 32a. In Passages 1 and 2, the TLV and PV existed adjacent to each other. In Passage 3, the PV disappeared, and only the TLV existed. When the PA was driven, as shown in Figure 32b–k, the PV was suppressed and became smaller as the input voltage increased; conversely, the TLV became larger. At 12 kVp-p or higher (Figure 26f–k), the PV almost disappeared, and only the TLV existed over a large area.
Figure 33 plots the center positions of the PV and TLV in each passage. The circular and squared marks indicate the PV and TLV center positions, respectively. When the input voltage was increased, the PV weakened, and the center position of the PV moved toward the tip side of the PS of the adjacent blade, like the blue arrows in the figure. By contrast, as the PV weakened, the TLF became stronger, and the center position of the TLV moved toward the PV, like the red arrow in the figure.
Next, the comparison of Figure 23 (τ = 1.6 mm) and 33 (τ = 3.0 mm) is discussed. In Figure 23, the PV is large, and the TLV is small because of the small tip clearance size. Therefore, according to the drive of the PA, the large PV was weakened. Then, the weakened large PV made a vacant space, and the small TLV flowed into it. Consequently, the TLV was strengthened. Contrarily, in Figure 33, the PV is small from the beginning, and the TLV is originally large because of the large tip clearance size. Therefore, according to the drive of the PA, the small PV was weakened. The small PV was easily weakened, and the large TLV strongly pushed the weakened PV. Consequently, the movements of the PV and TLV center positions in Figure 33 are greater than those in Figure 23.
From this difference in whether the PV or TLV was larger than the other, the movements of the center positions of the PV and TLV were different.
Figure 34 shows the vorticity distribution. The vorticity distribution under the condition of no control is shown in Figure 34a, which is the same as in Figure 34e. In Passage 1, the TLV was large, and the positive vorticity region caused by the TLV extended laterally to the right half of the blade pitch width. By contrast, the PV was pushed away to the PS of the blade near the endwall, forming a negative vorticity region. As shown in Figure 34b–k, when the input voltage was increased, the PV was suppressed, and the negative vorticity region gradually decreased. By contrast, the TLV became larger, and the positive vorticity region expanded to the PS of the adjacent blade.
Figure 35 shows the maximum vorticity generated by the PV in Passage 2, shown in Figure 34. The maximum vorticity at up to 9 kVp-p was almost the same as that under the condition of no control (indicated by the black dashed line). From 9 to 11 kVp-p, the vorticity was weakened by 43% compared with that under the condition of no control. From 11 to 13 kVp-p, the maximum vorticity returned to almost the same level as that of the no-control condition. From 13 to 15 kVp-p, the maximum vorticity weakened again.
Figure 36 shows the maximum vorticity generated by the TLV in Passage 2. Up to 8 kVp-p, the maximum vorticity was almost the same as that under the condition of no control (indicated by the black dashed line). From 8 to 11 kVp-p, the maximum vorticity was weakened by up to 19% compared with that under no control. From 11 to 15 kVp-p, the maximum vorticity was increased by 13% compared with that under no control.

4. Concluding Remarks

This study investigated the effects of the presence or absence of tip clearance and its size on the vortex structure at the blade exit when suppressing the PV of the turbine cascade using a DBD-PA. The two-dimensional flow fields, including the velocity, turbulence intensity, streamlines, and vorticity distributions, were measured and analyzed via PIV. First, the effect of the PA on the PV control was clarified in the absence of tip clearance (lack of a TLV). Second, when the PA was not controlled, the effect of the tip clearance size on the flow field was investigated. Finally, for the two tip clearance sizes of 1.6 mm (PV: large, TLV: small) and 3.0 mm (PV: small, TLV: large), we investigated how the flow field changed when the input voltage was changed. The following results were obtained.
  • Only a PV exists in the absence of tip clearance. As the input voltage increases, the PV gradually decreases.
  • In the absence of PA control, the blade TLV increases as the tip clearance increases. As the TLV increases, the PV decreases.
  • At a tip clearance of 1.6 mm, a large PV and a small TLV occur. As the input voltage increases, the maximum flow velocity of the secondary flow due to the PV decreases. The area of the high turbulence intensity caused by the TLV increased, and the maximum turbulence intensity remained almost unchanged. At the maximum input voltage of 15 kVp-p, the maximum velocity of the PV decreases by 72%. As the input voltage increases, the PV decreases; conversely, the TLV increases. At 15 kVp-p, the maximum vorticity due to the PV and TLV decreases by 62% and 26%, respectively.
  • At a tip clearance of 3.0 mm, a small PV and a large TLV occur. As the input voltage increases, the maximum flow velocity of the secondary flow due to the TLV increases. Owing to the PV and TLV, the regions with high turbulence intensity spread throughout the passage. At a maximum input voltage of 15 kVp-p, the maximum velocity of the TLV increases by 62%. At an input voltage of 11 kVp-p, the maximum vorticity due to the PV and TLV decrease by 43% and 19%, respectively.
  • Changes in the center positions of the PV and TLV are clarified for each tip clearance owing to changes in the input voltage of the PA. When the input voltage is increased, the PV and TLV center positions move toward the PS of the tip of the adjacent blade and the middle of the flow passage, respectively. Under the condition of large tip clearance, the amount of movement in the center position of the PV and TLV increases.
According to the experimental research presented in this paper, when the PV and TLV coexist, the reduction in the PV by the PA installed in the upstream endwall results in an undesired increase in the TLV. Therefore, it is insufficient to reduce only the PV using a PA to improve the aerodynamic performance of turbine blades. To solve this problem, a combination of two PAs is required to reduce both PV and TLV simultaneously. For the reduction in the TLV, the authors developed a unique ring-type PA [58]. A new hybrid PA is currently under development as the next step in this direction.

Author Contributions

Conceptualization, T.M. and T.S.; methodology, T.M.; software, T.M.; validation, T.M. and T.S.; formal analysis, T.M.; investigation, T.M. and T.S.; data curation, T.M.; writing—original draft preparation, T.M.; writing—review and editing, T.S.; visualization, T.M.; project administration, T.M.; funding acquisition, T.M. All authors have read and agreed to the published version of the manuscript.

Funding

This research was funded by the Japan Society for the Promotion of Science (JSPS), Grant Number 21K03868.

Data Availability Statement

Data will be made available on request.

Conflicts of Interest

The authors declare that there are no conflicts of interest regarding the publication of this article.

Nomenclature

Latin symbols
CChord length (mm)
CaxAxial chord length (mm)
HBlade height (mm)
NNumber of blades
SBlade pitch (mm)
TuTurbulence intensity (%)
UVelocity (m/s)
UFS,outFreestream velocity at the blade outlet (m/s)
VACPeak-to-peak input voltage (kV)
XHorizontal direction (mm)
YSpanwise (vertical) direction (mm)
Greek symbols
α1Inlet flow angle (°)
α2Exit flow angle (°)
ΩVorticity (1/s)
ξStagger angle (°)
τTip clearance (mm)
Abbreviations
DBDDielectric Barrier Discharge
FSFreestream
PAPlasma Actuator
PIVParticle Image Velocimetry
PSPressure Surface
PVPassage Vortex
SSSuction Surface
TETrailing Edge
TLFTip Leakage Flow
TLVTip Leakage Vortex
WVIPVWall Vortex Induced by Passage Vortex

Appendix A

The blade geometry data are presented in this appendix. Figure A1 and Table A1 present the shape of the turbine cascade used in this study and the coordinates of the turbine blade, respectively.
Figure A1. Turbine blade profile.
Aerospace 10 00641 g0a1
Table A1. Turbine blade geometry data.
Pressure Surface SideSuction Surface Side
No.XPS (mm)YPS (mm)XSS (mm)YSS (mm)
10.0000 0.0000 0.0000 0.0000
20.4423 0.1716 −0.2668 −0.3936
30.8643 0.1586 −0.3378 −0.8185
41.3546 0.0425 −0.3016 −1.3439
51.9132 −0.1619 −0.1580 −1.9662
62.5364 −0.4395 0.0963 −2.6771
73.2192 −0.7728 0.4666 −3.4644
83.9554 −1.1425 0.9591 −4.3130
94.7372 −1.5280 1.5815 −5.2050
105.5554 −1.9078 2.3431 −6.1186
116.4448 −2.2785 3.3067 −7.0759
127.7159 −2.7072 4.9615 −8.3417
138.8513 −2.9684 6.7522 −9.3026
149.8871 −3.0937 8.6428 −9.9493
1510.8682 −3.1083 10.5882 −10.2787
1611.8420 −3.0233 12.5412 −10.3015
1712.8480 −2.8355 14.4623 −10.0425
1813.9117 −2.5334 16.3257 −9.5341
1915.0445 −2.1045 18.1202 −8.8099
2016.2472 −1.5394 19.8450 −7.8995
2117.5146 −0.8345 21.5053 −6.8269
2218.8389 0.0095 23.1088 −5.6111
2320.2120 0.9885 24.6634 −4.2671
2421.6266 2.0957 26.1768 −2.8074
2523.0762 3.3231 27.6554 −1.2425
2624.5552 4.6618 29.1045 0.4183
2726.0593 6.1025 30.5287 2.1665
2827.5847 7.6360 31.9315 3.9940
2929.1285 9.2531 33.3160 5.8934
3030.6884 10.9446 34.6847 7.8573
3132.2621 12.7018 36.0394 9.8787
3233.8483 14.5159 37.3817 11.9509
3335.4456 16.3789 38.7130 14.0675
3437.0529 18.2827 40.0344 16.2223
3538.6694 20.2199 41.3465 18.4095
3640.2944 22.1830 42.6502 20.6237
3741.9276 24.1653 43.9458 22.8597
3843.5684 26.1604 45.2337 25.1129
3945.2168 28.1625 46.5143 27.3792
4046.8726 30.1662 47.7875 29.6549
4148.5360 32.1671 49.0534 31.9376
4248.6796 32.3109 49.0854 32.0333
4348.7752 32.3429 49.0806 32.1341
4448.8760 32.3383 49.0397 32.2263
4548.9683 32.2976 48.9683 32.2976

References

  1. Denton, J.D. The 1993 IGTI Scholar Lecture: Loss Mechanisms in Turbomachines. ASME J. Turbomach. 1993, 115, 621–656. [Google Scholar] [CrossRef]
  2. Turner, J.R. An Investigation of the End-Wall Boundary Layer of a Turbine-Nozzle Cascade. Trans. ASME 1957, 79, 1801–1805. [Google Scholar] [CrossRef]
  3. Dunham, J. A Review of Cascade Data on Secondary Losses in Turbines. J. Mech. Eng. Sci. 1970, 12, 48–59. [Google Scholar] [CrossRef]
  4. Langston, L.S. Crossflows in a Turbine Cascade Passage. J. Eng. Power 1980, 102, 866–874. [Google Scholar] [CrossRef]
  5. Sieverding, C.H. Recent Progress in the Understanding of Basic Aspects of Secondary Flows in Turbine Blade Passages. ASME J. Eng. Gas Turbines Power 1985, 107, 248–257. [Google Scholar] [CrossRef]
  6. Hodson, H.P.; Dominy, R.G. Three-Dimensional Flow in a Low-Pressure Turbine Cascade at Its Design Condition. ASME J. Turbomach. 1987, 109, 177–185. [Google Scholar] [CrossRef]
  7. Hodson, H.P.; Dominy, R.G. The Off-Design Performance of a Low-Pressure Turbine Cascade. ASME J. Turbomach. 1987, 109, 201–209. [Google Scholar] [CrossRef]
  8. Sharma, O.P.; Butler, T.L. Predictions of Endwall Losses and Secondary Flows in Axial Flow Turbine Cascades. ASME J. Turbomach. 1987, 109, 229–236. [Google Scholar] [CrossRef]
  9. Wang, H.P.; Olson, S.J.; Goldstein, R.J.; Eckert, E.R.G. Flow Visualization in a Linear Turbine Cascade of High Performance Turbine Blades. ASME J. Turbomach. 1997, 119, 1–8. [Google Scholar] [CrossRef]
  10. Papa, M.; Goldstein, R.; Gori, F. Numerical heat transfer predictions and mass/heat transfer measurements in a linear turbine cascade. Appl. Therm. Eng. 2007, 27, 771–778. [Google Scholar] [CrossRef]
  11. Cui, J.; Rao, V.N.; Tucker, P. Numerical investigation of secondary flows in a high-lift low pressure turbine. Int. J. Heat Fluid Flow 2017, 63, 149–157. [Google Scholar] [CrossRef] [Green Version]
  12. Kanani, Y.; Acharya, S.; Ames, F. Numerical Predictions of Turbine Cascade Secondary Flows and Heat Transfer With Inflow Turbulence. ASME J. Turbomach. 2021, 143, 121008. [Google Scholar] [CrossRef]
  13. Sun, S.; Kang, J.; Lei, Z.; Huang, Z.; Si, H.; Wan, X. Analysis of the Effect of the Leading-Edge Vortex Structure on Unsteady Secondary Flow at the Endwall of a High-Lift Low-Pressure Turbine. Aerospace 2023, 10, 237. [Google Scholar] [CrossRef]
  14. Robison, Z.; Gross, A. Comparative numerical investigation of wake effect on low-pressure turbine endwall flow. Aerosp. Sci. Technol. 2022, 131, 107970. [Google Scholar] [CrossRef]
  15. Ligrani, P.; Potts, G.; Fatemi, A. Endwall aerodynamic losses from turbine components within gas turbine engines. Propuls. Power Res. 2017, 6, 1–14. [Google Scholar] [CrossRef]
  16. Ananthakrishnan, K.; Govardhan, M. Influence of fillet shapes on secondary flow field in a transonic axial flow turbine stage. Aerosp. Sci. Technol. 2018, 82–83, 425–437. [Google Scholar] [CrossRef]
  17. Turgut, Ö.H.; Camci, C. A simultaneous use of a leading-edge fillet and a non-axisymmetrically contoured endwall in a turbine stage. Aerosp. Sci. Technol. 2021, 118, 106985. [Google Scholar] [CrossRef]
  18. Schmid, J.; Schulz, A.; Bauer, H.-J. Influence of a Non-Axisymmetric Endwall on the Flow Field in a Turbine Passage: High-Resolution LDV. In Proceedings of the ASME Turbo Expo 2018: Turbomachinery Technical Conference and Exposition, Oslo, Norway, 11–15 June 2018. Paper No. GT2018-75061. [Google Scholar] [CrossRef]
  19. Hu, C.; Liu, H.; Geng, K.; Rong, R. Numerical investigation and loss estimation of high-pressure turbine cascade flow with contoured endwall and incoming wakes. Aerosp. Sci. Technol. 2020, 107, 106335. [Google Scholar] [CrossRef]
  20. Su, X.; Bian, X.; Li, H.; Yuan, X. Unsteady flows of a highly loaded turbine blade with flat endwall and contoured endwall. Aerosp. Sci. Technol. 2021, 118, 106989. [Google Scholar] [CrossRef]
  21. Sangston, K.; Little, J.; Lyall, M.E.; Sondergaard, R. End Wall Loss Reduction of High Lift Low Pressure Turbine Airfoils Using Profile Contouring—Part II: Validation. ASME J. Turbomach. 2014, 136, 081006. [Google Scholar] [CrossRef]
  22. Chung, J.T.; Simon, T.W.; Buddhavarapu, J. Three-Dimensional Flow Near the Blade/Endwall Junction of a Gas Turbine: Application of a Boundary Layer Fence. In Proceedings of the ASME 1991 International Gas Turbine and Aeroengine Congress and Exposition, Orlando, FL, USA, 3–6 June 1991. Paper No. 91-GT-045. [Google Scholar] [CrossRef] [Green Version]
  23. Shyam, V.; Ameri, A.; Poinsatte, P.; Thurman, D.; Wroblewski, A.; Snyder, C. Application of Pinniped Vibrissae to Aeropropulsion. In Proceedings of the ASME Turbo Expo 2015: Turbine Technical Conference and Exposition, Montreal, QC, Canada, 15–19 June 2015. Paper No. GT2015-43055. [Google Scholar] [CrossRef] [Green Version]
  24. Benton, S.I.; Bons, J.P.; Sondergaard, R. Secondary Flow Loss Reduction Through Blowing for a High-Lift Front-Loaded Low Pressure Turbine Cascade. ASME J. Turbomach. 2012, 135, 021020. [Google Scholar] [CrossRef]
  25. Benton, S.I.; Bernardini, C.; Bons, J.P.; Sondergaard, R. Parametric Optimization of Unsteady End Wall Blowing on a Highly Loaded Low-Pressure Turbine. ASME J. Turbomach. 2014, 136, 071013. [Google Scholar] [CrossRef]
  26. Bloxham, M.J.; Bons, J.P. A Global Approach to Turbomachinery Flow Control: Passage Vortex Control. ASME J. Turbomach. 2014, 136, 041003. [Google Scholar] [CrossRef]
  27. Matsunuma, T. Effects of the Installation Location of a Dielectric Barrier Discharge Plasma Actuator on the Active Passage Vortex Control of a Turbine Cascade at Low Reynolds Numbers. Actuators 2022, 11, 129. [Google Scholar] [CrossRef]
  28. Booth, T.C.; Dodge, P.R.; Hepworth, H.K. Rotor-Tip Leakage: Part I—Basic Methodology. ASME J. Eng. Power 1982, 104, 154–161. [Google Scholar] [CrossRef]
  29. Wadia, A.R.; Booth, T.C. Rotor-Tip Leakage: Part II—Design Optimization Through Viscous Analysis and Experiment. ASME J. Eng. Power 1982, 104, 162–169. [Google Scholar] [CrossRef]
  30. Moore, J.; Tilton, J.S. Tip Leakage Flow in a Linear Turbine Cascade. ASME J. Turbomach. 1988, 110, 18–26. [Google Scholar] [CrossRef]
  31. Bindon, J.P. The Measurement and Formation of Tip Clearance Loss. ASME J. Turbomach. 1989, 111, 257–263. [Google Scholar] [CrossRef]
  32. Yamamoto, A. Interaction Mechanisms Between Tip Leakage Flow and the Passage Vortex in a Linear Turbine Rotor Cascade. ASME J. Turbomach. 1988, 110, 329–338. [Google Scholar] [CrossRef]
  33. Yamamoto, A. Endwall Flow/Loss Mechanisms in a Linear Turbine Cascade With Blade Tip Clearance. ASME J. Turbomach. 1989, 111, 264–275. [Google Scholar] [CrossRef]
  34. Heyes, F.J.G.; Hodson, H.P. Measurement and Prediction of Tip Clearance Flow in Linear Turbine Cascades. ASME J. Turbomach. 1993, 115, 376–382. [Google Scholar] [CrossRef]
  35. Sjolander, S.A.; Cao, D. Measurements of the Flow in an Idealized Turbine Tip Gap. ASME J. Turbomach. 1995, 117, 578–584. [Google Scholar] [CrossRef]
  36. Lee, S.W.; Moon, H.S.; Lee, S.E. Tip gap height effects on flow structure and heat/mass transfer over plane tip of a high-turning turbine rotor blade. Int. J. Heat Fluid Flow 2009, 30, 198–210. [Google Scholar] [CrossRef]
  37. Gao, J.; Zheng, Q.; Niu, X.; Yue, G. Aerothermal characteristics of a transonic tip flow in a turbine cascade with tip clearance variations. Appl. Therm. Eng. 2016, 107, 271–283. [Google Scholar] [CrossRef]
  38. Liu, Z.; Liu, Z.; Feng, Z. Unsteady Analysis on the Effects of Tip Clearance Height on Hot Streak Migration Across Rotor Blade Tip Clearance. ASME J. Eng. Gas Turbines Power 2014, 136, 082605. [Google Scholar] [CrossRef]
  39. Wang, T.; Xuan, Y.; Han, X. The effects of tip gap variation on transonic turbine blade tip leakage flow based on VLES approach. Aerosp. Sci. Technol. 2021, 111, 106542. [Google Scholar] [CrossRef]
  40. Sjolander, S.A. Overview of Tip-Clearance Effects in Axial Turbines; Lecture Series, 1997–2001, Secondary Flow and Tip-Clearance Flows in Axial Turbines; von Karman Institute for Fluid Dynamics: Sint-Genesius-Rode, Belgium, 1997; pp. 1–29. [Google Scholar]
  41. Bunker, R.S. Axial Turbine Blade Tips: Function, Design, and Durability. J. Propuls. Power 2006, 22, 271–285. [Google Scholar] [CrossRef]
  42. Nho, Y.C.; Park, J.S.; Lee, Y.J.; Kwak, J.S. Effects of turbine blade tip shape on total pressure loss and secondary flow of a linear turbine cascade. Int. J. Heat Fluid Flow 2012, 33, 92–100. [Google Scholar] [CrossRef]
  43. Lee, S.W.; Chae, B.J. Effects of squealer rim height on aerodynamic losses downstream of a high-turning turbine rotor blade. Exp. Therm. Fluid Sci. 2008, 32, 1440–1447. [Google Scholar] [CrossRef]
  44. Kang, D.B.; Lee, S.W. Effects of squealer rim height on heat/mass transfer on the floor of cavity squealer tip in a high turning turbine blade cascade. Int. J. Heat Mass Transf. 2016, 99, 283–292. [Google Scholar] [CrossRef]
  45. Jiang, S.; Li, Z.; Li, J.; Song, L. Numerical investigations on the unsteady leakage flow and heat transfer characteristics of the turbine blade squealer tip. J. Glob. Power Propuls. Soc. 2023, 7, 1–12. [Google Scholar] [CrossRef] [PubMed]
  46. Lee, S.E.; Lee, S.W.; Kwak, H.S. Tip leakage aerodynamics over stepped squealer tips in a turbine cascade. Exp. Therm. Fluid Sci. 2011, 35, 135–145. [Google Scholar] [CrossRef]
  47. Zhou, C.; Hodson, H.; Tibbott, I.; Stokes, M. Effects of Winglet Geometry on the Aerodynamic Performance of Tip Leakage Flow in a Turbine Cascade. ASME J. Turbomach. 2013, 135, 051009. [Google Scholar] [CrossRef]
  48. Coull, J.D.; Atkins, N.R.; Hodson, H.P. High Efficiency Cavity Winglets for High Pressure Turbines. In Proceedings of the ASME Turbo Expo 2014: Turbine Technical Conference and Exposition, Düsseldorf, Germany, 16–20 June 2014. Paper No. GT2014-25261. [Google Scholar] [CrossRef]
  49. Zhou, Z.; Chen, S.; Li, W.; Wang, S.; Zhou, X. Experiment study of aerodynamic performance for the suction-side and pressure-side winglet-cavity tips in a turbine blade cascade. Exp. Therm. Fluid Sci. 2018, 90, 220–230. [Google Scholar] [CrossRef]
  50. Chen, Y.; Cai, L.; Jiang, D.; Li, Y.; Wang, S. Experimental and Numerical Investigations for Dual−Cavity Tip Aerodynamic Performance in the Linear Turbine Cascade. Aerospace 2023, 10, 193. [Google Scholar] [CrossRef]
  51. Huang, M.; Li, Z.; Li, J. Investigations on the aerothermal performance of the turbine blade winglet squealer tip within an uncertainty framework. Aerosp. Sci. Technol. 2022, 123, 107506. [Google Scholar] [CrossRef]
  52. Kavurmacioglu, L.A.; Senel, C.B.; Maral, H.; Camci, C. Casing grooves to improve aerodynamic performance of a HP turbine blade. Aerosp. Sci. Technol. 2018, 76, 194–203. [Google Scholar] [CrossRef]
  53. Niu, M.; Zang, S. Experimental and numerical investigations of tip injection on tip clearance flow in an axial turbine cascade. Exp. Therm. Fluid Sci. 2011, 35, 1214–1222. [Google Scholar] [CrossRef]
  54. Volino, R.J. Control of Tip Leakage in a High Pressure Turbine Cascade Using Tip Blowing. In Proceedings of the ASME Turbo Expo 2016: Turbomachinery Technical Conference and Exposition, Seoul, Republic of Korea, 13–17 June 2016. Paper No. GT2016-56511. [Google Scholar] [CrossRef]
  55. Chen, S.; Li, W. Effects of combined sweeping jet actuator and winglet tip on aerodynamic performance in a turbine cascade. Aerosp. Sci. Technol. 2022, 131, 107956. [Google Scholar] [CrossRef]
  56. Yang, R.; Wang, H.; Zhong, D.; Ge, N. Effects of Frequency and Amplitude of Local Dynamic Hump and Inlet Turbulence Intensity on Flow Separation Control in Low-Pressure Turbine. Int. J. Aeronaut. Space Sci. 2023. [Google Scholar] [CrossRef]
  57. Van Ness, D.K., II; Corke, T.C.; Morris, S.C. Turbine Tip Clearance Flow Control Using Plasma Actuators. In Proceedings of the 44th AIAA Aerospace Sciences Meeting and Exhibit, Reno, NV, USA, 9–12 January 2006. Paper No. AIAA 2006-21. [Google Scholar] [CrossRef]
  58. Matsunuma, T.; Segawa, T. Vortex structure for reducing tip leakage flow of linear turbine cascade using dielectric barrier discharge plasma actuator. Aerosp. Sci. Technol. 2023, 136, 108215. [Google Scholar] [CrossRef]
  59. Yu, J.; Yu, J.; Chen, F.; Wang, C. Numerical study of tip leakage flow control in turbine cascades using the DBD plasma model improved by the parameter identification method. Aerosp. Sci. Technol. 2019, 84, 856–864. [Google Scholar] [CrossRef]
  60. Yu, J.; Wang, Z.; Chen, F.; Yu, J.; Wang, C. Kriging surrogate model applied in the mechanism study of tip leakage flow control in turbine cascade by multiple DBD plasma actuators. Aerosp. Sci. Technol. 2019, 85, 216–228. [Google Scholar] [CrossRef]
  61. Yu, J.; Lu, Y.; Wang, Y.; Chen, F.; Song, Y. Experimental study on the plasma actuators for the tip leakage flow control in a turbine cascade. Aerosp. Sci. Technol. 2021, 121, 107195. [Google Scholar] [CrossRef]
  62. Bons, J.; Benton, S.; Bernardini, C.; Bloxham, M. Active flow control for low-pressure turbines. AIAA J. 2018, 56, 2687–2698. [Google Scholar] [CrossRef]
  63. Moreau, E. Airflow control by non-thermal plasma actuators. J. Phys. D Appl. Phys. 2007, 40, 605–636. [Google Scholar] [CrossRef]
  64. Corke, T.C.; Post, M.L.; Orlov, D.M. SDBD plasma enhanced aerodynamics: Concepts, optimization and applications. Prog. Aerosp. Sci. 2007, 43, 193–217. [Google Scholar] [CrossRef]
  65. Corke, T.C.; Enloe, C.L.; Wilkinson, S.P. Dielectric Barrier Discharge Plasma Actuators for Flow Control. Annu. Rev. Fluid Mech. 2010, 42, 505–529. [Google Scholar] [CrossRef]
  66. Wang, J.-J.; Choi, K.-S.; Feng, L.-H.; Jukes, T.N.; Whalley, R.D. Recent developments in DBD plasma flow control. Prog. Aerosp. Sci. 2013, 62, 52–78. [Google Scholar] [CrossRef]
  67. Bernal-Orozco, R.A.; Carvajal-Mariscal, I.; Huerta-Chavez, O.M. Performance of DBD Actuator Models under Various Operating Parameters and Modifications to Improve Them. Fluids 2023, 8, 112. [Google Scholar] [CrossRef]
  68. Nicassio, F.; Bonuso, S.; Scarselli, G.; De Giorgi, M. Coupled fluid-structure simulations and experiments of DBD plasma actuator for damping of plate vibrations. Aerosp. Sci. Technol. 2023, 133, 108151. [Google Scholar] [CrossRef]
  69. Yu, H.; Cui, X.; Li, G.; Zheng, J. Numerical Investigation of Flow Separation Control over Rotor Blades Using Plasma Actuator. AIAA J. 2023, 61, 1151–1167. [Google Scholar] [CrossRef]
  70. Huang, J.; Corke, T.; Thomas, F. Plasma Actuators for Separation Control of Low Pressure Turbine Blades. In Proceedings of the 41st Aerospace Sciences Meeting and Exhibit, Reno, NV, USA, 6–9 January 2003. AIAA Paper, No. 2003-1027. [Google Scholar] [CrossRef]
  71. Hultgren, L.; Ashpis, D. Demonstration of Separation Delay with Glow Discharge Plasma Actuators. In Proceedings of the 41st Aerospace Sciences Meeting and Exhibit, Reno, NV, USA, 6–9 January 2003. AIAA Paper, No. 2003-1025. [Google Scholar] [CrossRef] [Green Version]
  72. List, J.; Byerley, A.; McLaughlin, T.; Van Dyken, R. Using a plasma actuator to control laminar separation on a linear cascade turbine blade. In Proceedings of the 41st Aerospace Sciences Meeting and Exhibit, Reno, NV, USA, 6–9 January 2003. AIAA Paper, No. 2003-1026. [Google Scholar] [CrossRef]
  73. Boxx, I.; Newcamp, J.; Franke, M.E.; Woods, N.M.; Rivir, R.B. A PIV Study of a Plasma Discharge Flow-Control Actuator on a Flat Plate in an Aggressive Pressure Induced Separation. In Proceedings of the ASME Turbo Expo 2006: Power for Land, Sea, and Air, Barcelona, Spain, 8–11 May 2006. ASME Paper, No. GT2006-91044. [Google Scholar] [CrossRef]
  74. Pescini, E.; Marra, F.; De Giorgi, M.; Francioso, L.; Ficarella, A. Investigation of the boundary layer characteristics for assessing the DBD plasma actuator control of the separated flow at low Reynolds numbers. Exp. Therm. Fluid Sci. 2016, 81, 482–498. [Google Scholar] [CrossRef]
  75. Pescini, E.; De Giorgi, M.; Suma, A.; Francioso, L.; Ficarella, A. Separation control by a microfabricated SDBD plasma actuator for small engine turbine applications: Influence of the excitation waveform. Aerosp. Sci. Technol. 2018, 76, 442–454. [Google Scholar] [CrossRef]
  76. Li, G.; Wang, Q.; Huang, Y.; Zhang, H. Large eddy simulation of film cooling effectiveness on a turbine vane pressure side with a saw-tooth plasma actuator. Aerosp. Sci. Technol. 2021, 112, 106615. [Google Scholar] [CrossRef]
  77. Yaras, M.I.; Sjolander, S.A. Effects of Simulated Rotation on Tip Leakage in a Planar Cascade of Turbine Blades: Part I—Tip Gap Flow. ASME J. Turbomach. 1992, 114, 652–659. [Google Scholar] [CrossRef]
  78. Yaras, M.I.; Sjolander, S.A.; Kind, R.J. Effects of Simulated Rotation on Tip Leakage in a Planar Cascade of Turbine Blades: Part II—Downstream Flow Field and Blade Loading. ASME J. Turbomach. 1992, 114, 660–667. [Google Scholar] [CrossRef]
Figure 1. (a) PV generated in the turbine passage without tip clearance. (b) PV and TLV generated in the turbine passage with tip clearance.
Aerospace 10 00641 g001
Figure 2. (a) Test section of the LTC. (b) Top view of the LTC. (c) PIV measurement plane.
Aerospace 10 00641 g002
Figure 3. (a) Schematic of DBD-PA. (b) Control of inlet boundary layer flow using the PA. (c) Photographs of top and bottom views and cross-sectional schematic of the PA.
Aerospace 10 00641 g003
Figure 4. Velocity distributions at the outlet of the LTC without tip clearance (τ = 0.0 mm).
Aerospace 10 00641 g004
Figure 5. Spanwise distributions of the pitchwise adveraged velocity in the center passage without tip clearance (τ = 0.0 mm).
Aerospace 10 00641 g005
Figure 6. Maximum velocity of the PV in the center passage without tip clearance (τ = 0.0 mm).
Aerospace 10 00641 g006
Figure 7. Plots of the center positions of the PV without tip clearance (τ = 0.0 mm) at various input voltages.
Aerospace 10 00641 g007
Figure 8. Vorticity distributions at the outlet of the LTC without tip clearance (τ = 0.0 mm).
Aerospace 10 00641 g008
Figure 9. Maximum vorticity of the PV in the center passage without tip clearance (τ = 0.0 mm) at various input voltages.
Aerospace 10 00641 g009
Figure 10. Velocity distributions at the outlet of the LTC for no control at various tip clearances.
Aerospace 10 00641 g010
Figure 11. Spanwise distributions of the pitchwise averaged velocity in the center passage without flow control at various tip clearances.
Aerospace 10 00641 g011
Figure 12. Turbulence intensity distributions at the outlet of the LTC at various tip clearances.
Aerospace 10 00641 g012
Figure 13. Spanwise distributions of the pitchwise averaged turbulence intensity in the center passage without flow control at various tip clearances.
Aerospace 10 00641 g013
Figure 14. Streamlines of secondary flow at the outlet of the LTC at various tip clearances.
Aerospace 10 00641 g014
Figure 15. Plots of the PV and TLV center positions at various tip clearances.
Aerospace 10 00641 g015
Figure 16. Vorticity distributions at the outlet of the LTC at various tip clearances.
Aerospace 10 00641 g016
Figure 17. Velocity distributions at the outlet of the LTC at various input voltages (τ = 1.6 mm).
Aerospace 10 00641 g017
Figure 18. Spanwise distributions of the pitchwise averaged velocity in the center passage with tip clearance (τ = 1.6 mm).
Aerospace 10 00641 g018
Figure 19. Maximum velocity of PV in the center passage with tip clearance (τ = 1.6 mm).
Aerospace 10 00641 g019
Figure 20. Turbulence intensity distributions at the outlet of the LTC at various input voltages (τ = 1.6 mm).
Aerospace 10 00641 g020
Figure 21. Spanwise distributions of the pitchwise averaged turbulence intensity in the center passage with tip clearance (τ = 1.6 mm).
Aerospace 10 00641 g021
Figure 22. Streamlines of secondary flow at the outlet of the LTC at various input voltages (τ = 1.6 mm).
Aerospace 10 00641 g022
Figure 23. Plots of the center positions of the passage and leakage vortices at various input voltages (τ = 1.6 mm).
Aerospace 10 00641 g023
Figure 24. Vorticity distributions at the outlet of the LTC at various input voltages (τ = 1.6 mm).
Aerospace 10 00641 g024
Figure 25. Maximum vorticity of the PV in the center passage with tip clearance (τ = 1.6 mm).
Aerospace 10 00641 g025
Figure 26. Maximum vorticity of the TLV in the center passage with tip clearance (τ = 1.6 mm).
Aerospace 10 00641 g026
Figure 27. Velocity distributions at the outlet of the LTC at various input voltages (τ = 3.0 mm).
Aerospace 10 00641 g027
Figure 28. Spanwise distributions of the pitchwise averaged velocity in the center passage with tip clearance (τ = 3.0 mm).
Aerospace 10 00641 g028
Figure 29. Maximum velocity of TLV in the center passage with tip clearance (τ = 3.0 mm).
Aerospace 10 00641 g029
Figure 30. Turbulence intensity distributions at the outlet of the LTC at various input voltages (τ = 3.0 mm).
Aerospace 10 00641 g030
Figure 31. Spanwise distributions of the pitchwise averaged turbulence intensity in the center passage with tip clearance (τ = 3.0 mm).
Aerospace 10 00641 g031
Figure 32. Streamlines of secondary flow at the outlet of the LTC at various input voltages (τ = 3.0 mm).
Aerospace 10 00641 g032
Figure 33. Plots of the center positions of the PV and TLV at various input voltages (τ = 3.0 mm).
Aerospace 10 00641 g033
Figure 34. Vorticity distributions at the outlet of the LTC at various input voltages (τ = 3.0 mm).
Aerospace 10 00641 g034
Figure 35. Maximum vorticity of passage vortex in the center passage with tip clearnace (τ = 3.0 mm).
Aerospace 10 00641 g035
Figure 36. Maximum vorticity of leakage vortex in the center passage with tip clearnace (τ = 3.0 mm).
Aerospace 10 00641 g036
Table 1. Specifications of the LTC.
ParameterValue
Number of blades, N6
Chord length, C (mm)58.65
Axial chord length, Cax (mm)49.43
Blade height, H (mm)75.00
Blade pitch, S (mm)35.47
Aspect ratio, H/C1.54
Solidity, C/S1.16
Inlet flow angle, α1 (°)51.86
Exit flow angle, α2 (°)58.74
Turning angle, α1 + α2 (°)110.60
Stagger angle, ξ (°)33.43
Tip clearance size, τ (mm)0.0–3.7
Disclaimer/Publisher’s Note: The statements, opinions and data contained in all publications are solely those of the individual author(s) and contributor(s) and not of MDPI and/or the editor(s). MDPI and/or the editor(s) disclaim responsibility for any injury to people or property resulting from any ideas, methods, instructions or products referred to in the content.

