Article

The Impact of Battery Performance on Urban Air Mobility Operations

School of Aerospace Engineering, Xiamen University, Xiamen 361102, China
*
Author to whom correspondence should be addressed.
Aerospace 2023, 10(7), 631; https://doi.org/10.3390/aerospace10070631
Submission received: 29 May 2023 / Revised: 3 July 2023 / Accepted: 11 July 2023 / Published: 13 July 2023
(This article belongs to the Special Issue Urban and Regional Air Mobility Research)

Abstract

:
Urban air mobility (UAM) is a promising transportation concept that can effectively address city traffic congestion and environmental pollution. Power batteries are used extensively in UAM vehicles, and their technical characteristics (charge rate and specific energy) are coupled with other sizing parameters to significantly impact the direct operating cost (DOC). This study develops a DOC model based on a standard flight profile and a detailed battery model to determine the impact of battery performance on UAM operations. The results reveal that for a given operating model and current battery technology, there is a narrower charge rate choice for different DOCs; a charging rate of at least 2–2.5 C is required for rational design. Advancements in specific energy are expected to reduce the DOC by 20–25% by 2035. This model reflects the impacts of battery performance on UAM operations, which is conducive to further developments in the UAM market.

1. Introduction

Traffic congestion in urban areas has garnered significant attention from the aviation industry, leading to considerable research in urban air mobility (UAM). UAM is a commercial-driven aviation application similar to traditional civil aviation industries. Its primary objective is to reduce operating costs and increase revenues. Achieving this requires considering a combination of technical and operational parameters related to the vehicle. As shown in Figure 1, technical factors influence the operating model, which constrains the technical parameters. UAM employs electric vertical takeoff and landing (eVTOL) aircraft as a delivery platform, which differ from conventional crewed aircraft. However, eVTOLs rely on power batteries, which are currently immature technologies, thus affecting UAM costs. Consequently, the overall design scheme must consider the power battery parameter model, coupled vehicle design parameters, and operational model. Cost and profitability are considered crucial evaluation indices.
There is some existing research in the field of UAM operations. To date, Garrow et al. reviewed and analyzed common articles about UAM operations and the UAM market [1]; as stated, most of the current articles are related to air traffic management and aviation operations. Research on aviation operations includes a focus on topics of economic, practical interest to UAM air carriers and on issues related to eVTOL recharging for flight operations. Harish et al. established an economic model for short-range transport aircraft by considering a battery model [2]. Their work focused primarily on fixed-wing aircraft without eVTOL. Howard et al. established a primary UAM aircraft direct operating cost (DOC) model, but it was only for a given airport network model with a simplified mission profile that considered only the cruise phase [3]. Goyal et al. established DOC and profitability models to analyze the UAM market potential, but only the essential mission phase was considered [4], which is similar to Pertz’s research [5]. Kohlman et al. from NASA used a more detailed battery model and mission profile and compared some of the battery parameters with the design scenarios [6]. Niklaß et al. presented a collaborative approach for an integrated modeling of UAM transportation, but the battery performance effect was not mentioned [7]. Justin et al. covered the power-optimized battery swap and recharge strategies for electric aircraft operation [8], but DOC was not considered. Hamilton et al. tried to choose the cruise airspeed within a schedule to maximize the energy feasibility of the schedule [9], which is another perspective on problem solving for battery performance and route. In addition, a large number of studies exist on the topics of economics for UAM operations [10,11,12] and optimal performance based on battery characteristics [13,14,15]. The above research was fruitful, mainly in involving the establishment of UAM vehicles’ DOC model and charging strategies with the goal of efficiency. However, none of these studies assessed impacts on the design parameters when coupling the battery and the operating costs.
In view of the study results of these researchers, the authors wanted to consider the impact of battery parameters and operating costs on the design parameters. This paper establishes and validates a UAM vehicle operating costs estimation model based on standard and detailed flight profiles. This approach includes a battery model to analyze the influence of the battery performance parameters on operating costs; that is, the effect of charge rate on reasonable MTOW with corresponding DOC trends and of advancements in specific energy on corresponding DOC ranges. This analysis not only presents DOC results but also analyzes the sizing performance of UAM vehicles because these sizing parameters act as the premise of the DOC. For example, the total mass for different charging rates of the given mission are shown in the analysis; they are one of the parameters representing design rationality, while DOC represents the decisive criterion. Such analysis has significant implications for current cost control and sizing in UAM vehicles.
The content of this paper is organized as follows. Section 2 describes the power battery, flight profile, and operating cost models. Section 3 gives results and prospects. Finally, conclusions are given in Section 4.

2. Models and Methods

2.1. Key Power Battery Parameters

Figure 1 illustrates the impacts of power battery interactions with other overall parameters of UAM vehicle designs. The power battery parameters related to the UAM vehicles are the specific energy charge rate, discharge rate, and cycle life. These parameters possess a nonlinear and complex relationship [16,17]. As such, describing interactions between these parameters with a general model is challenging. A brief description of each of the main parameters is given in the following sections.

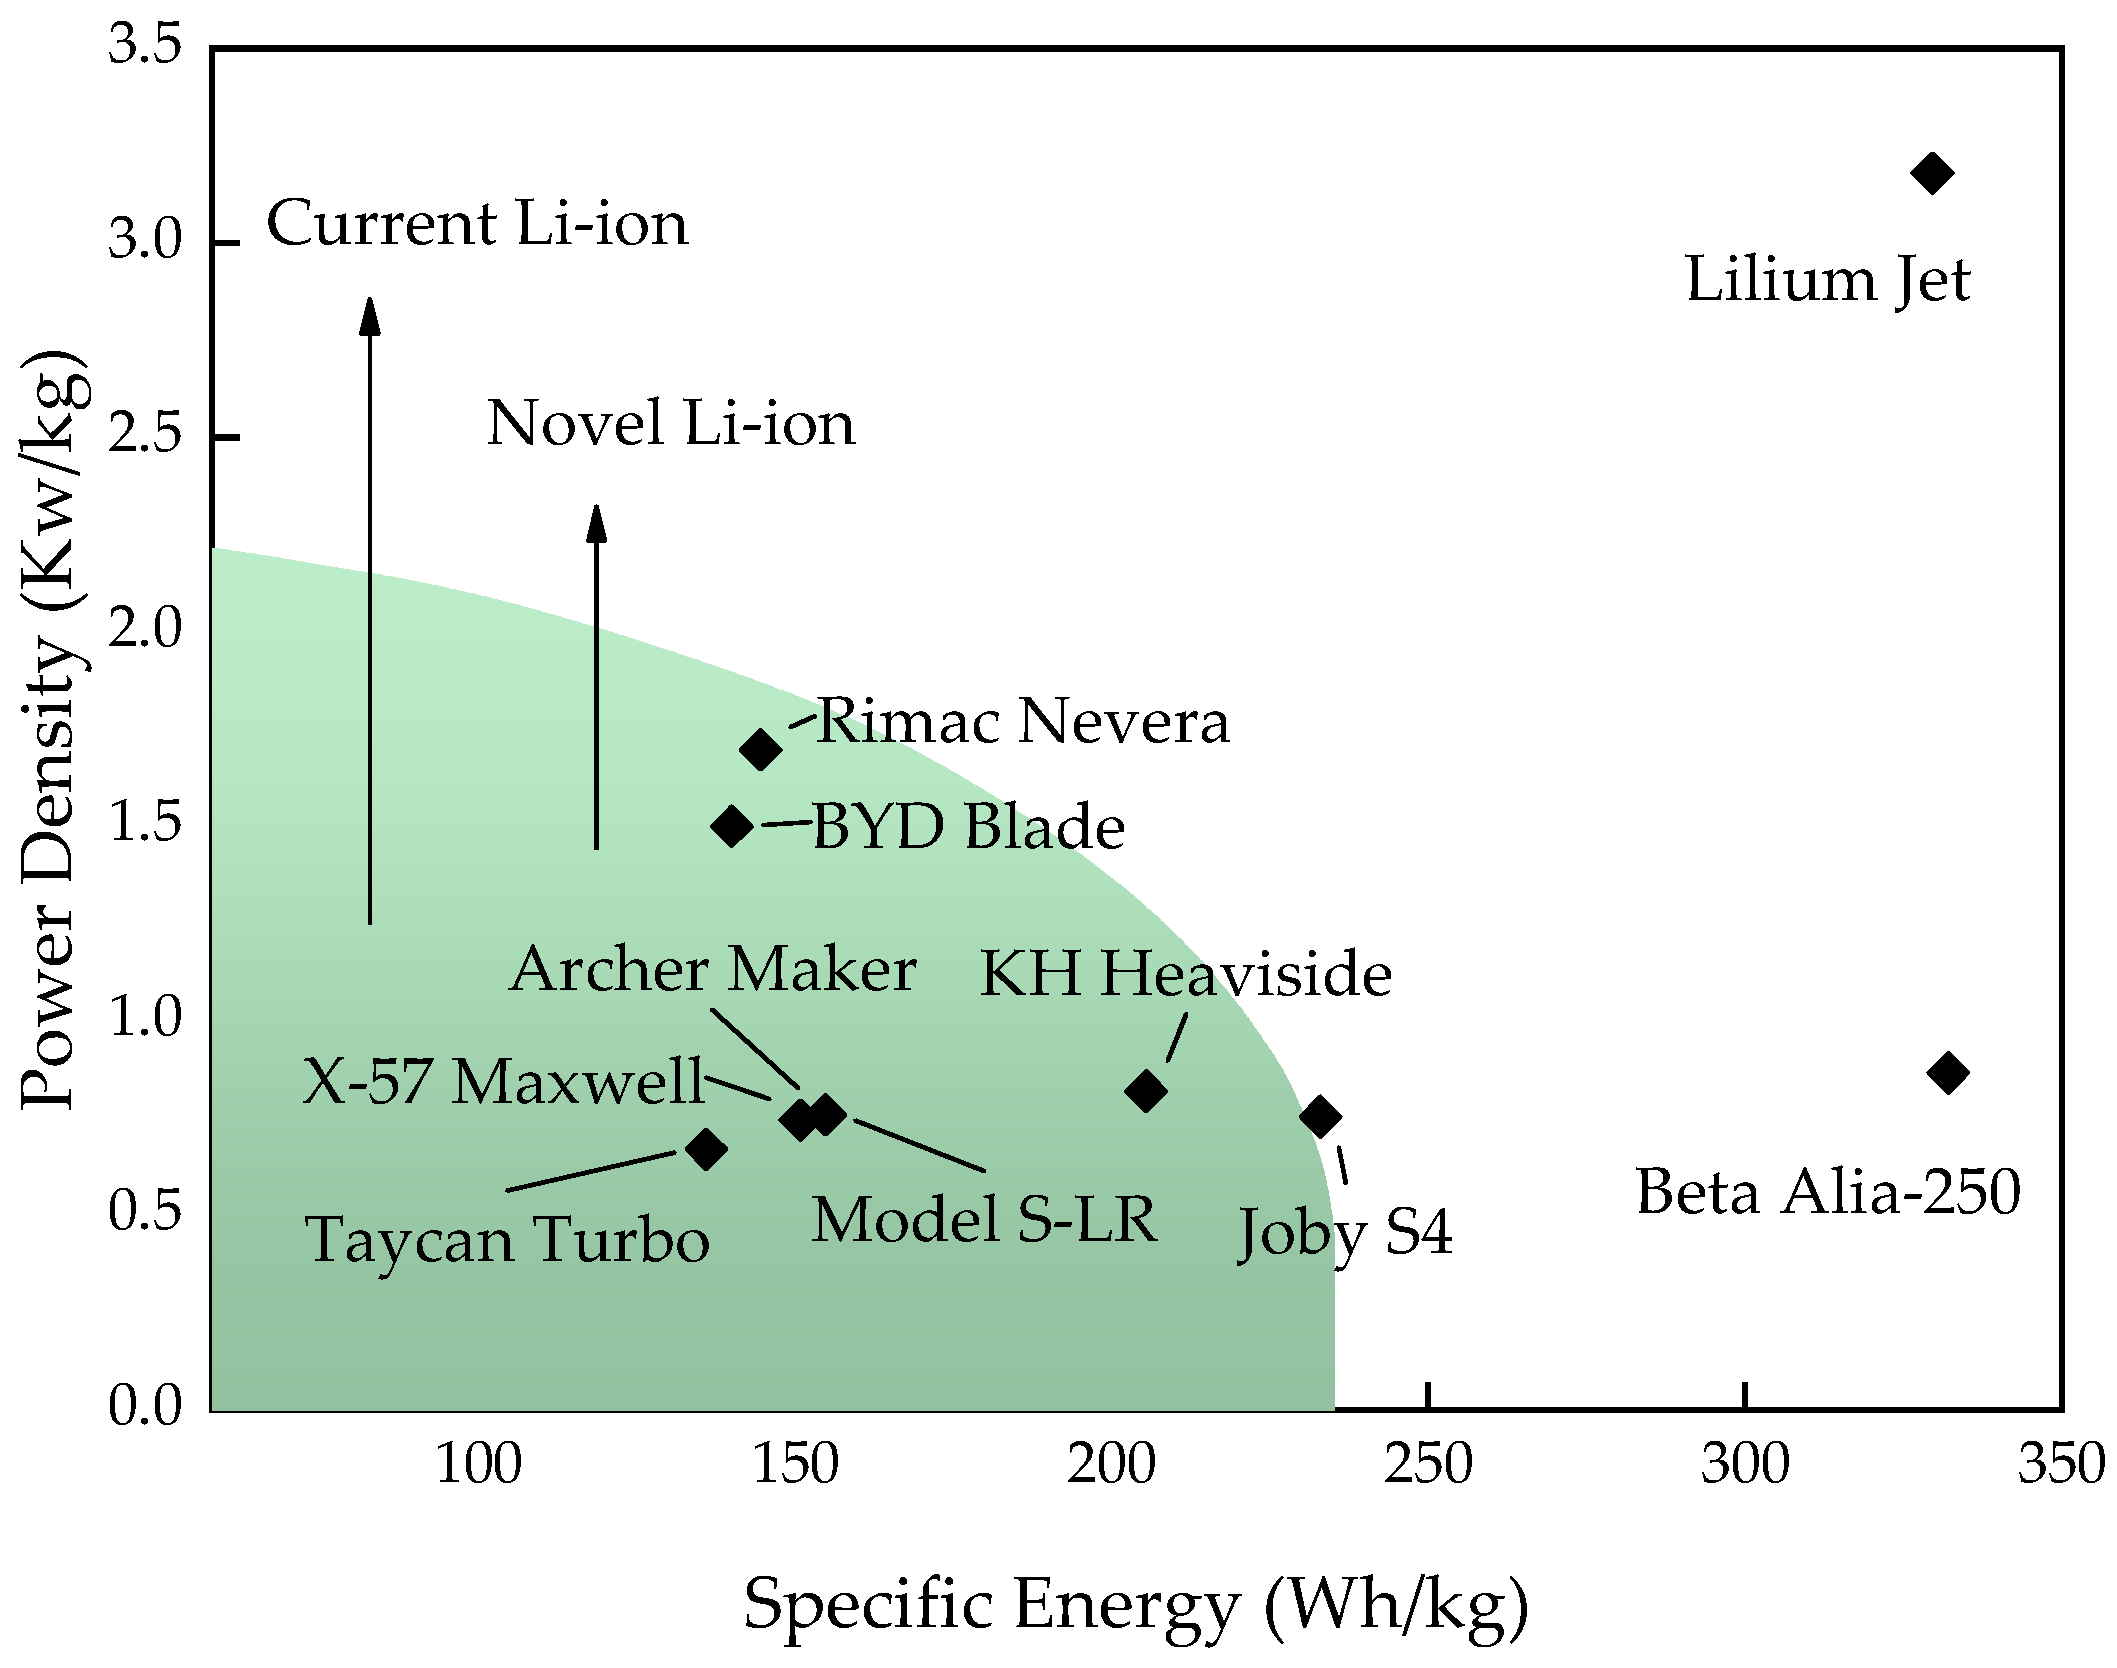
2.1.1. Specific Energy

Specific energy refers to the maximum energy stored per unit mass:
e = E / m
where e is specific energy, E is total energy of the battery, and m is mass of the battery. In this study, e is given and total energy is obtained. It is typically measured in terms of the specific energy of the electric cell, and the packing efficiency of the power battery is generally in the range of 60–70%. The pack specific energy of power batteries is expected to further increase with technological advancements such as the cell-to-pack concept. Figure 2 illustrates the specific energy of batteries used by UAM manufacturers [18]; fixed-wing aircraft that utilize distributed electric propulsion (DEP) technology typically have low-specific energy batteries with lower energy consumption during flight. In contrast, UAM vehicles with lower aerodynamic efficiencies require batteries with greater specific energy. In addition, Figure 2 shows that UAM vehicles’ battery technology is not dissimilar to that of EVs but is more advanced This study assumes a cell specific energy of 300 Wh/kg and a cell-to-pack integration factor of 0.75 based on the current technology level of ternary lithium batteries.

2.1.2. Charge Rate

The charge rate (C-rate) indicates the rate at which the power battery can be charged, and it is defined as:
C c h a r g e = 1 / t
where C c h a r g e is charge rate and t is charge time in hours. Charging at a C-rate of 1 C means that the battery is charged from 0 to100% in one hour; a 4 C rate is four times faster, so a full charge takes 15 min.
In commercial operations, UAM vehicles require energy replenishment during the typical 5–7 min turnaround time. Some manufacturers adjust this time based on their technology and revenue models. For instance, Archer Midnight vehicles have a turnaround time of 10 min. While fast-charging devices can quickly recharge batteries, they also shorten the battery cycle life and lead to increased operating costs. Nevertheless, research indicates that current mature fast-charging technology can sufficiently meet the requirements of UAM vehicles [19,20]. Typical fast-charge rates for electric vehicles range from 1 to 2 C. In contrast, high-end EVs or next-generation fast-charging modes may use 800 V high-voltage charging technology with rates of up to 2 or 4 C, as illustrated by the Taycan in Figure 2.

2.1.3. Other Parameters
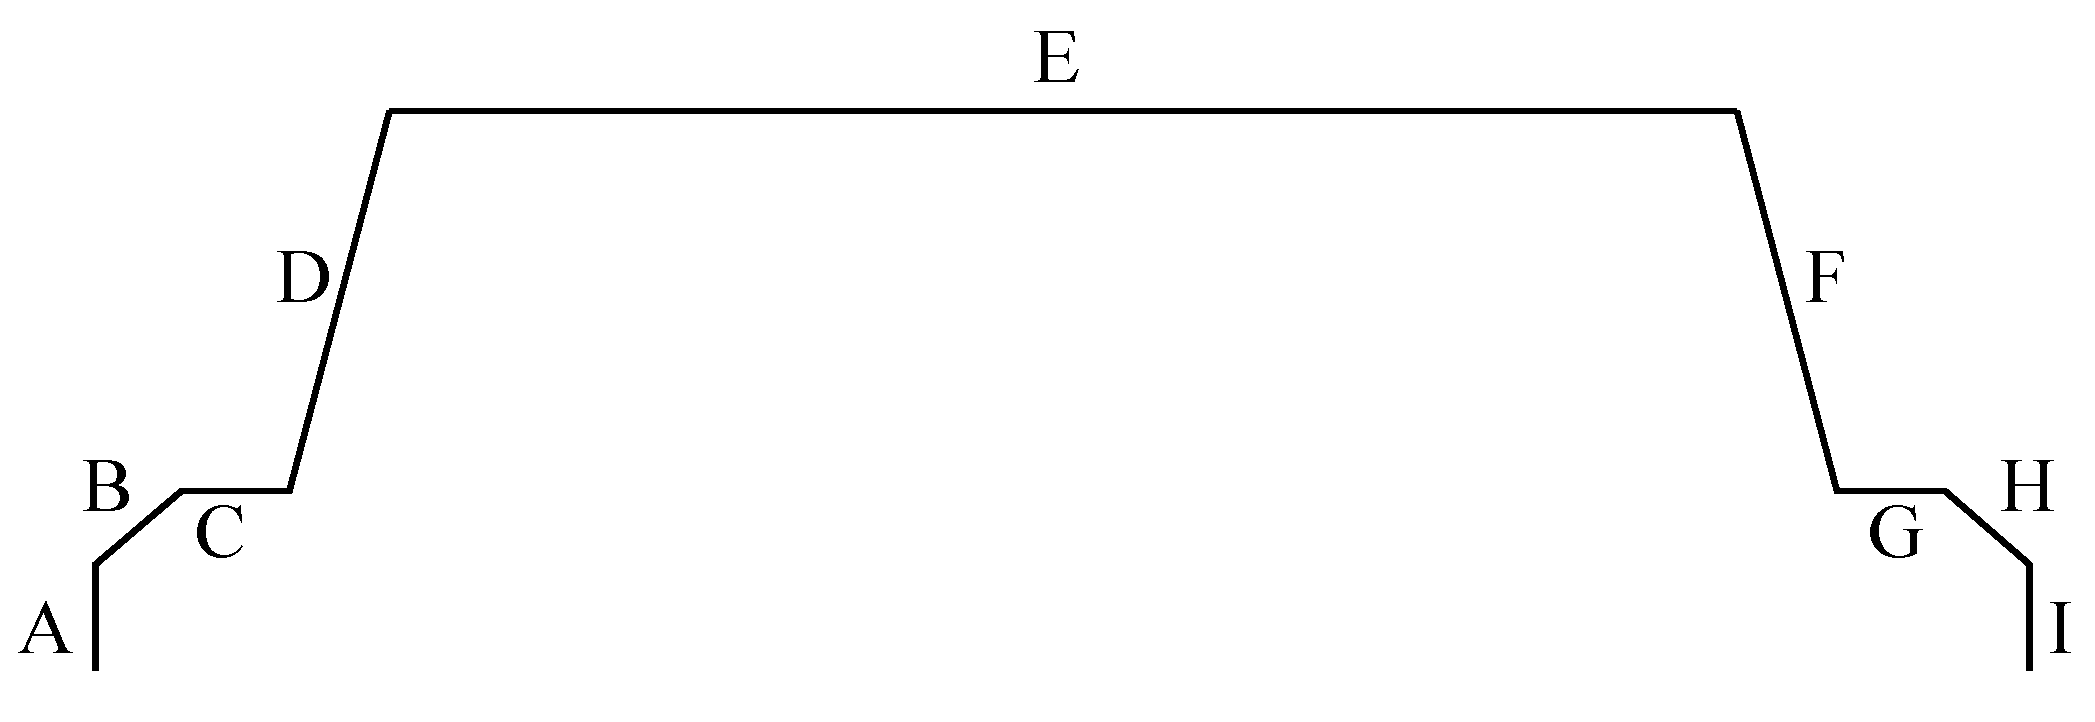
The key battery parameters in this study also include discharge rate and cycle life; although they are not the focus of this article, they also play important roles.
The cycle life of a power battery refers to the number of complete charge/discharge cycles it can undergo before its capacity decays to a certain level under ideal temperature and humidity conditions. A battery is generally considered to have reached the end of its life when its usable capacity drops to 80% of its nominal capacity [21]. Various factors influence the cycle life. However, no widely accepted model describes the relationships between these factors and the cycle life. Accurately describing this relationship requires complete cycle life experiments [22], which provide empirical mathematical models [21,23]. Current technological requirements indicate that UAM vehicles need to use higher energy density ternary lithium batteries. These batteries have cycle lifetimes between 500 and 2000, depending on the actual battery type, such as lithium nickel cobalt aluminum oxide (NCA) or different kinds of lithium nickel manganese cobalt oxides (NMC) batteries [14]. This paper assumes a cycle life for UAM vehicle batteries of 1000 cycles.
Similar to the charge rate, the discharge rate is critical in determining the maximum battery output power. For UAM vehicles, this is especially critical during vertical flight. However, the impact of a high discharge rate is not limited to an immediate increase in the battery output power. It may also result in irreversible damage to the battery [24], leading to a shorter cycle life and increased operating costs. In this study, average discharge rate is used to calculate cooling cost of the battery, expressed as:
C d i s c h a r g e ,   a v g = E m i s s i o n E t o t a l / T m i s s i o n
where C d i s c h a r g e ,   a v g is average discharge rate, E t o t a l is total energy of battery, and T m i s s i o n is total time of mission in hours.

2.2. Flight Profile

The considered UAM concept scenario is illustrated in Figure 3. The proposed system utilizes eVTOLs with advanced automation capabilities for transporting cargo or commuting between significant landmarks within a city; eVTOL can use conventional helicopter landing sites on top of buildings or dedicated UAM skyports, similar to airports, for takeoff and landing [25,26]. Passengers can use their phones to obtain real-time information on eVTOLs via the internet. In addition, Figure 3 hints at its complex application scenario, including a special flight profile for takeoff and landing.
There are no existing standardized regulations for UAM flight profiles. The EASA and the Federal Aviation Administration (FAA) are soliciting public input on UAM takeoff and landing field design requirements that supplement existing airworthiness regulations [27]. However, more standardized flight profiles have been proposed by Uber in their 2016 release of Uber Elevate [28], which includes fundamental and reserved missions. The fundamental mission, depicted in Figure 4, consists of several sequential phases: (A) vertical climb, (B) transition, (C) departure, (D) accelerated climb, (E) cruise, (F) deceleration landing, (G) approach, (H) transition, and (I) vertical landing. Phase A starts at an altitude of 0 m, and each phase starts at the ending altitude of the previous phase. The reserved mission ensures vehicles have a safe distance or time to reach a backup landing site in the event of an accident.
The specific parameters of each phase of the flight profile are shown in Table 1, where V s t a l l is the stall speed of the vehicle and V c r u i s e is the cruise speed.
The power calculations corresponding to different phases are expressed as:
P v = ( f w F O M f w / A 2 ρ + w V c l i m b 2 ) / η v e r t i c a l
P c = ( w V v e r t i c a l + w V L / D ) / η c r u i s e
where f   is the propeller and fuselage disturbance factor in the vertical flight mode, w is the total weight of the vehicle, and F O M (figure of merit) is the ratio of the ideal and actual power of the propeller, A is the propeller disk area, V c l i m b is the vertical climb speed, V v e r t i c a l is the vertical component of velocity, ρ is the air density, η v e r t i c a l is the vertical flight efficiency (including all conversion efficiencies from the battery to the propeller), V is the flight speed, L / D is the lift-to-drag ratio, η c r u i s e is the cruise flight efficiency, P v is the vertical flight power, and P c is the cruise power.
Transition flight has complex working conditions, and the power varies over time. The average power of the transition flight is calculated using the method described in [29]:
P t r , a v g = ( P v + P t r , e f f ) / 2
P t r , e f f = P v / κ
where κ is the scaling factor of the power at the end of the transition relative to the power before the transition.
For the reserved mission, the safety distance and the safety time are both considered. The safety distance is set to 9.7 km, and the safety time is set to 15 min. The energy consumption is calculated based on the mode that consumes the most energy.

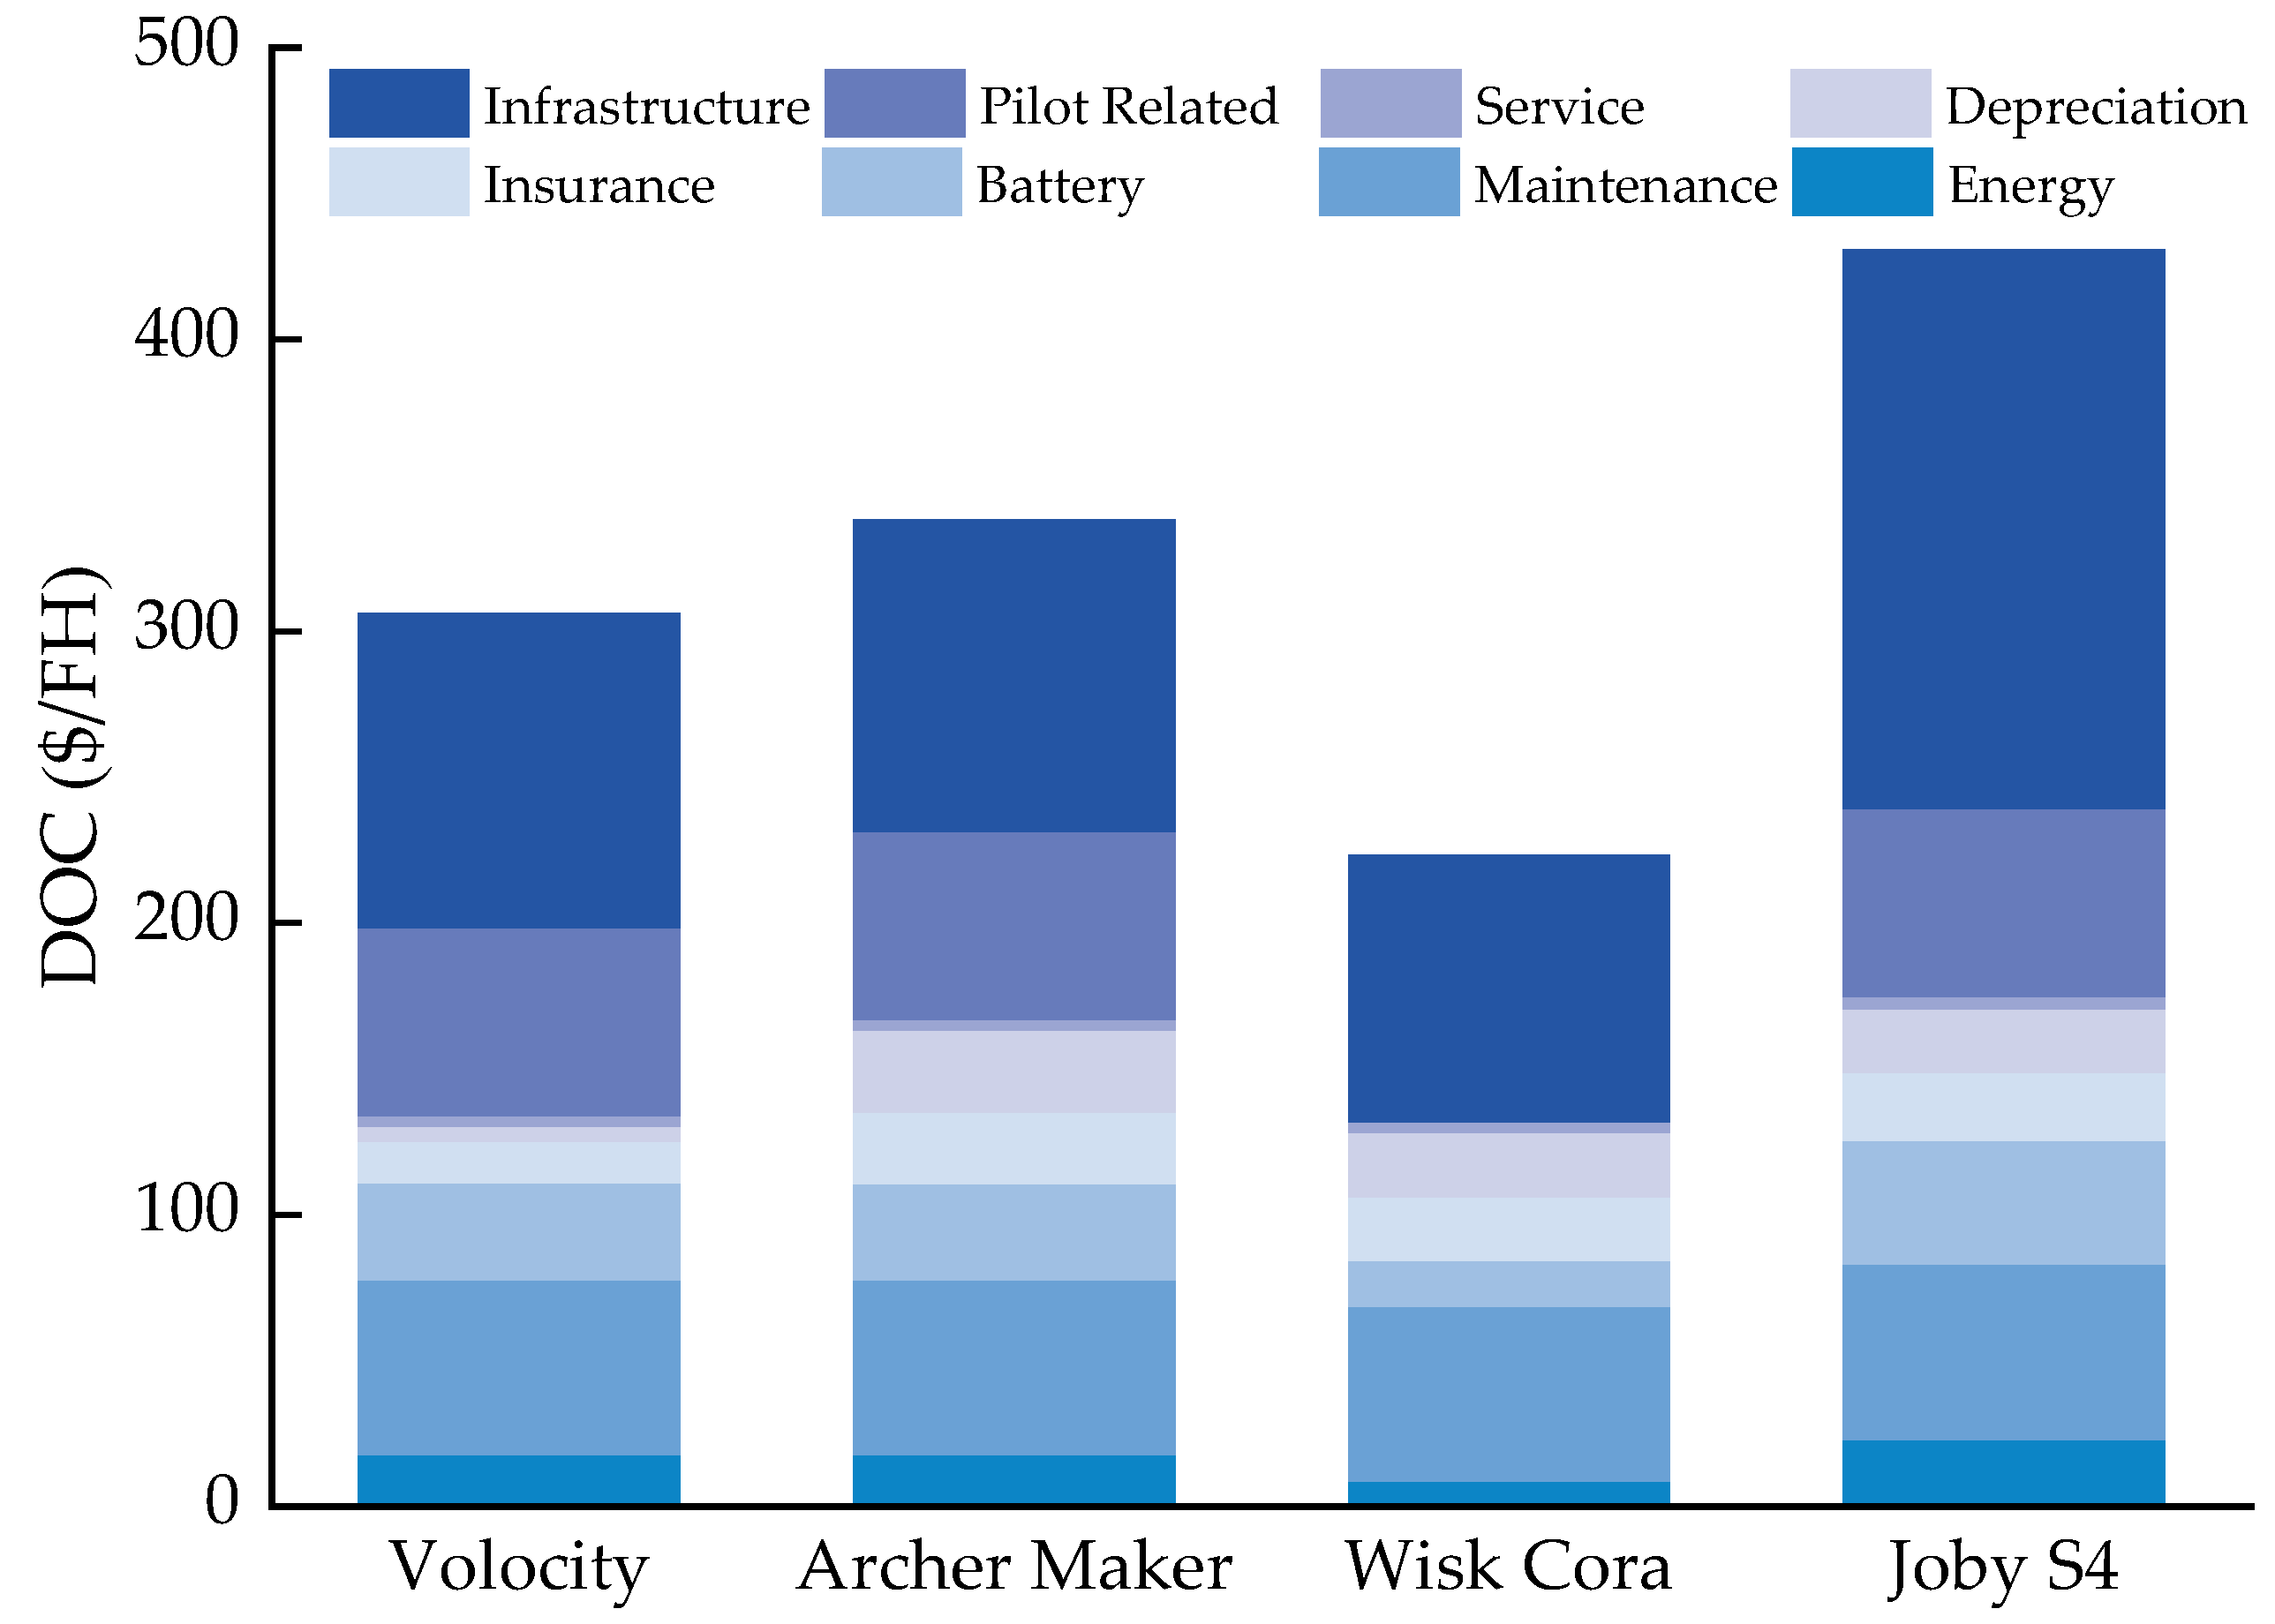
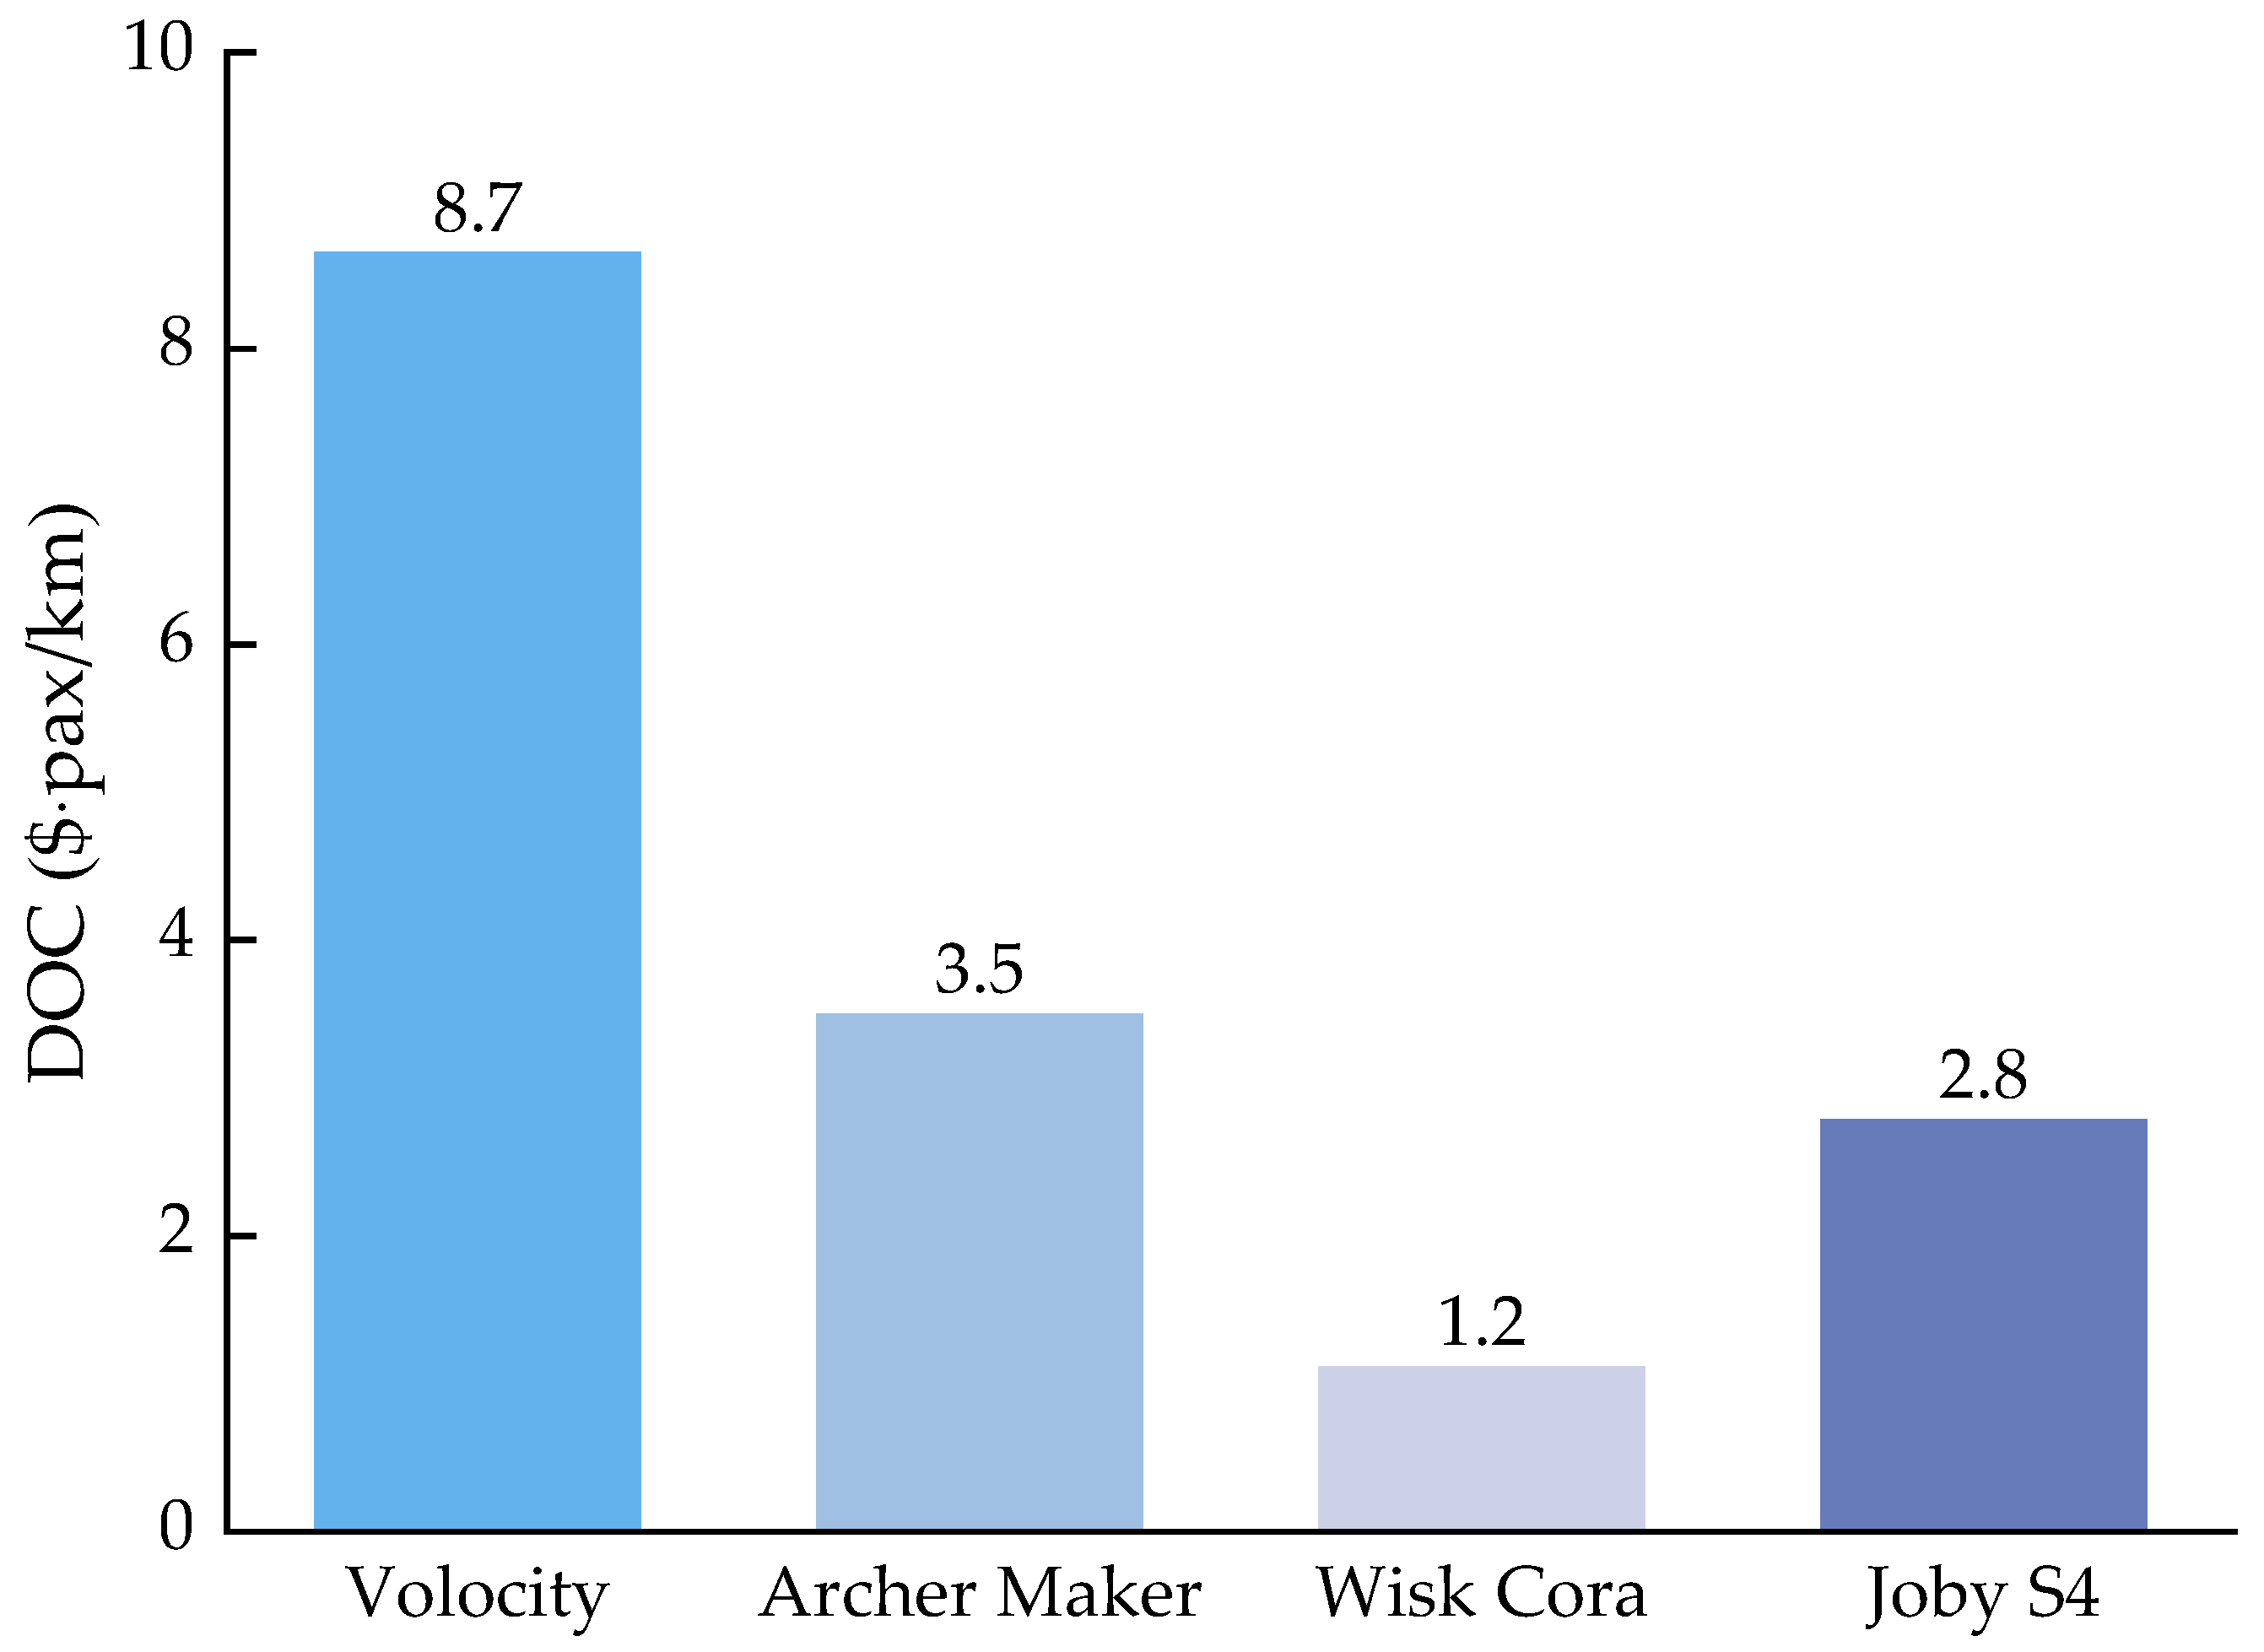
2.3. Direct Operating Cost

For market-oriented UAM vehicle designs, the total operating cost (TOC) is a critical parameter. However, estimating the TOC can be difficult, and the DOC is typically estimated first. The TOC is then calculated based on the proportional relationship between the TOC and DOC [30]. Two expressions for the DOC are considered: cost per flight hour (CPFH) and cost per passenger seat kilometer (CPSK) [31,32].
The composition of the DOC differs based on the airline and region. However, it generally includes costs associated with the flight crew, energy, maintenance, depreciation, insurance, and landing. Researchers have proposed various models to calculate these costs [33]. This paper divides the DOC into several categories based on previous studies, including costs for acquisition, battery, insurance, depreciation, energy, maintenance, service, pilots, and infrastructure.

2.3.1. Acquisition Cost

The acquisition cost of a UAM vehicle depends on the maximum takeoff weight (MTOW) and complexity. According to available public data [6], the acquisition cost per unit mass for a UAM vehicle is 734 $/kg. Based on available data, another study [3] predicts that the acquisition cost per unit mass of a UAM vehicle under current demand is about 661 $/kg. Using Joby S4 as an example, the acquisition cost is approximately $1.44 million. The Joby S4 investor presentation provides an acquisition cost of $1.3 million, which is close to the literature estimate and verifies the model in this paper. The acquisition cost per unit mass applies to fully electric and hybrid UAM vehicles. However, for UAM vehicles with multi-rotor configuration, this unit cost is reduced to 330 $/kg.

2.3.2. Battery Cost

The battery cost is divided into three components: unit energy pack, unit energy cell, and unit energy cooling. The unit energy cooling cost is related to the cooling costs at the depth of discharge and the average depth of discharge [34]. The battery pack cost varies greatly with time and region, so the average price is used for the calculations. For model validation, the unit energy cell cost is assumed to be 400 $/kWh, while for the remaining simulations, the cost is estimated for 2022. According to a study by Bloomberg [35], the cell cost typically accounts for over 80% of the pack cost. As of 2021, the average price of a Li-ion battery pack is 132 $/kWh, which is 6% lower than in 2020. The predicted price for 2022 is 124 $/kWh.

2.3.3. Depreciation Cost

The acquisition cost of an aircraft is considered the value of the aircraft itself, which decreases gradually during use due to wear and tear and technological development. The value transferred to the cost of goods is the depreciation cost. The depreciation rate is estimated to be 0.1.

2.3.4. Energy Cost

The energy cost is calculated from the electricity consumed by the UAM vehicle during flight. The unit cost of electricity used in this analysis is 0.13 $/kWh [36]. However, in practical applications, the actual consumption of electrified wire netting for charging is greater than the real energy stored in the battery due to equipment inefficiencies. Therefore, a charging efficiency of 90% is assumed to account for charging losses.

2.3.5. Maintenance Cost

The maintenance cost of UAM vehicles comprises expenses associated with inspection and repairing the aircraft system, which varies depending on the subsystem. An estimate of the maintenance cost is around 60 $/FH based on aircraft of the same size [6], while more detailed assessments considering infrastructure issues result in a range of 60–100 $/FH [30]. A conservative value of 60 $/FH is adopted here, with further refinement to be conducted as relevant subsystem models are developed.

2.3.6. Infrastructure Cost

Infrastructure costs are related to takeoff and landing sites. A previous statistical analysis for the busiest helipad data on Wall Street provided takeoff and landing costs based on the mass of the aircraft, including annual landing pad rental costs, annual site labor costs, etc. [3]. The same model is used here and is shown in Table 2.

2.3.7. Insurance and Service Fees

Insurance costs consider liability and hull insurance and refer to the current common standard. The insurance rate is assumed to be 4.5%, and liability insurance is $22,000 annually [6]. The service cost considers the cost of navigation, which is approximately $7770 annually.

2.3.8. Pilot-Related Fees

In UAM applications, different levels of automation have been classified by international professional bodies from manned to fully automated flight [37]. Despite the aim to operate fully autonomously, the proposed operating rules by the EASA [38] and other related agencies require manned piloting based on safety factors and technology levels. Pilot-related costs include pilot salaries, training costs, and the cost of manned avionics equipment. By current common standards, pilot costs are assumed to be $110,000 per person per year with additional training costs of $9000 annually. An additional $19,075 per year is also allocated for manned avionics-related equipment.

2.4. DOC Calculation Formulae and Other Parameters

The cost CPFH is calculated as:
C C P F H = C v a r i a b l e _ h o u r + C a n n u a l _ y e a r / H f l i g h t _ y e a r + C a e r o d r o m e _ h o u r
where C v a r i a b l e _ h o u r is the variable costs per flight hour, C a n n u a l _ y e a r is some fixed costs per year, H f l i g h t _ y e a r is flight hours per year, and C a e r o d r o m e _ h o u r is infrastructure cost per flight hour, which is obtained from Section 2.3.5.
The C v a r i a b l e _ h o u r and C a n n u a l _ y e a r are expressed as:
C v a r i a b l e _ h o u r = C e n e r g y _ h o u r + C b a t t e r y p a c k _ h o u r + C m a i n t e n a n c e _ h o u r
C a n n u a l _ y e a r = C i n s u r a n c e _ y e a r + C d e p r e c i a t i o n _ h o u r + C s e r v e _ h o u r + C p i l o t _ h o u r
where C e n e r g y _ h o u r is energy cost per flight hour, which is obtained by the method in Section 2.2; C m a i n t e n a n c e _ h o u r , C i n s u r a n c e _ y e a r ,   C d e p r e c i a t i o n _ h o u r , C s e r v e _ h o u r , and C p i l o t _ h o u r are per-flight-hour costs for maintenance, insurance, depreciation, service, and pilots; C b a t t e r y p a c k _ h o u r is battery pack cost per flight hour, which is calculated as:
C b a t t e r y p a c k _ h o u r = C b a t t e r y / H t o t a l
C b a t t e r y = ( C p a c k _ k w h + C c o o l i n g _ k w h _ c R d i s c h a r g e + C c e l l _ k w h ) E t o t a l
where C b a t t e r y is battery cost in the entire lift cycle, H t o t a l is total flight time in the entire lift cycle, and C p a c k _ k w h is the cost of battery pack components per kWh, C c o o l i n g _ k w h _ c is cooling cost per kWh per discharge rate, R d i s c h a r g e is average discharge rate in flight, and C c e l l _ k w h is battery cell cost per kWh.
The cost CPSK is based on CPFH expression:
C C P S K = C C P F H n p a x / R m i s s i o n
where n p a x is design passenger capacity and R m i s s i o n is mission range.
The remaining key parameters associated with operation are shown in Table 3.

3. Results

3.1. Existing UAM Vehicle Results

The objective of the simulation is to assess the validity of the DOC model. Some parameters were kept constant, including the annual flight time of 2000 h, vehicle depreciation rate of 0.1, battery acquisition cost of 400 $/kWh, and battery cycle life of 2000 cycles, to compare with the existing literature [3]. The proposed model gives all other pertinent settings. The simulations were conducted for various UAM vehicle configurations using data sourced from the dataset (Table 4) in [39] and relevant parameters obtained from respective UAM vehicle company white papers [40] or from other pertinent references [41]. This approach ensures that the simulation is comprehensive and encompasses a range of relevant factors. The specifications in Table 4 are taken into this study by formulas in Section 2, for example, empty mass of vehicle can be obtained by MTOW, passengers, and battery capacity; energy for mission can be derived from range and cruise speed. The parameters varied in this section include empty weight factor, L/D of cruise, passengers, cruise speed, range, MTOW, and battery capacity.
Figure 5 gives the DOC per flight hour, with the Joby S4 the largest at approximately 431 $/FH and the Wisk Cora the lowest at roughly 223 $/FH. Joby has indicated in publicly available information that the infrastructure, maintenance, and pilot costs are the primary contributors to the total cost per vehicle. Wisk Cora is designed to be fully automated with no pilot-related costs. The Joby S4 has a maximum range of 150 miles and an operational range of 24 miles, resulting in greater infrastructure and energy costs due to the larger battery mass and MTOW. Notably, the energy cost in the simulation is relatively small compared to in the literature [3], which assumes that only 60% of the battery energy is used for the mission and 40% of the energy is not available due to capacity degradation and reserved missions, resulting in greater and more expensive unavailable energy. The multi-rotor configuration is commonly used for short-range missions with relatively low operating costs per flight hour. In contrast, the tilt-rotor configuration is more suitable for longer-range flights with increased battery and infrastructure costs.
The CPFH does not account for the impact of aircraft size and range, so the CPSK must be used as a comparison. The CPSK results are shown in Figure 6, with the multi-rotor configuration having the largest CPSK and the tilt-rotor configuration having the lowest, which is the opposite of what was observed for CPFH. This is attributed to the tilt-rotor configuration’s increased design range and larger passenger capacity, effectively reducing the unit cost. As the literature provides a value of 2.7 for the CPSK, this study uses the flight distance to convert the CPSK to 3.375 using the average node distance of 51 miles, which is close to the 2.7 CPSK value.

3.2. Effect of Charge Rate

The ranges used in the preceding simulations are the maximum design ranges. In practical UAM operations, battery technology limitations suggest that the battery cannot be fully charged within the turnaround time. As a result, the “cab” operational mode is often used, whereby UAM vehicles are designed with long-range capabilities. However, the actual mission is limited to the optimal range, which is determined based on the battery parameters and basic demand requirements. In this mode, the battery performance directly impacts the operational model, and a reasonable charging rate can reduce the DOC and increase revenue while still meeting market demands. Therefore, optimizing the battery charging rate is critical in UAM operations and may significantly impact profitability.
Two specific energies are used in the subsequent analysis to determine the impact of battery performance on UAM operations. Firstly, the minimum design mass required to complete a given task at different charging rates is calculated. Given the range, speed, and daily flight frequency, a vehicle with a small battery lacks sufficient energy to complete the planned flight frequency. Increasing the mass leads to increased energy consumed by the task and the need to increase the battery mass. When a certain mass is reached, the planned flight frequency is completed. Secondly, the total mass and battery energy increase, enabling more energy to be charged during the turnaround time, possibly even more than the energy consumed in a single-flight mission. This state where the charging energy equals the single mission consumption energy is called the energy balance state. The design mass corresponding to the energy balance state is called the energy balance state mass. Finally, the 4-seat UAM vehicle is considered to analyze variations in the state of charge (SOC) during operations for a mission day at typical charging rates. This analysis sets a range at 60 km with a cruising speed of 45 m/s. The UAM vehicle is assumed to fly 24 sorties per day within a total operating time of nearly 14 h from 8 am to 10 pm. The upper and lower mass limits are 8000 kg and 600 kg, respectively.
Figure 7 shows that when the battery specific energy is 300 Wh/kg and the charging rate is 2 C, no reasonable design mass can meet the demands of the mission sortie. When the charging rate reaches 2.5 C, the design mass for two seats is approximately 1500 kg, which is reasonable, but the total mass for four seats is still too large. As the charging rate increases, the minimum required mass gradually decreases. However, the advantage of a larger charging rate gradually decreases with the rate. For example, for a 2-seat design with 2.5 C charging and a 300 Wh/kg specific energy battery, the minimum total mass required is about 1500 kg. When the specific energy increases to 400 Wh/kg, the required minimum weight is only about 800 kg. The specific energy significantly affects the necessary minimum mass reduction. For a 300 Wh/kg specific energy battery and the given sorties, a charging rate between 2.5 C and 3 C makes the total design mass reasonable without causing the fast-charging advantage to diminish. On the other hand, a 400 Wh/kg specific energy battery only requires a charging rate between 2 C and 2.5 C to achieve a reasonable total design mass.
The energy balance state mass shown in Figure 8 differs from Figure 7, representing more stringent conditions. If the energy balance state mass exists, a corresponding curve must exist in Figure 7 because it has more significant charge rate requirements. For instance, with a 300 Wh/kg specific energy and a 3.5 C charging rate, the energy balance state mass for four seats is 1978 kg. However, the minimum mass for the mission is 1898 kg, resulting in a smaller DOC. The energy balance state requires a greater charging rate and a more substantial battery mass, indicating that achieving the energy balance state may not be optimal as it could increase the DOC. Therefore, it is necessary to select a charging rate that meets market requirements and ensures that the DOC is reduced while revenue is maximized.
The analysis reveals that various states match the given sorties. For instance, considering the 4-seat design in Figure 9, mode 1 denotes a low charging rate (2.3 C or 2.4 C) that requires a large total mass and DOC. As the charging rate increases, the design mass and DOC decrease. Therefore, this mode is considered cost-for-task. Mode 2 represents a high-charging rate energy balance state (solid line 2.5–2.9 C) where the charging is only sufficient to perform task consumption. The corresponding DOC is larger than mode 1 due to the increased energy balance state mass. Mode 3 has a high charging rate (dashed line 2.5–2.9 C) and a low-capacity battery, where the design mass relative to the energy balance state mass is smaller to meet the task without an energy balance. Thus, the battery capacity requirements are smaller, leading to a lower DOC.
The results show multiple operating modes and design solutions for a given task, and small variations in the charging rate significantly impact the total mass and operational cost. The current battery technology level indicates that for a given task, a 300 Wh/kg specific energy battery needs a 2.5 C charging rate to have a reasonable design solution. Mode 3 has the lowest DOC, and the DOC at 3 C can be reduced by approximately 27% compared to 2.5 C. If a 400 Wh/kg energy density battery is used, a 2 C charging rate is sufficient.

3.3. Effect of Advances in Specific Energy

The simulations investigate the potential impact of advances in specific energy on the range and DOC of UAM vehicles with varying passenger capacities by 2035. The analysis assumes a mass of 450 kg for each passenger and a flight speed of 55 m/s for the UAM vehicles.
Industry trends and development plans suggest that by 2035, commercially available cells (solid-state battery) should achieve a specific energy of 500 Wh/kg [42,43]. The cost of batteries is also expected to decrease to $45/kWh by 2035 based on previous price decline rates [44].
The data presented in Figure 10 indicate that battery technology advancements result in a 20% to 25% reduction in the DOC for UAM vehicles with different passenger capacities, assuming a fixed range and speed. This reduction is more significant for UAM vehicles that accommodate more passengers. An increased battery specific energy leads to a reduced required battery capacity, which can be further improved by the design mass and reductions in battery-related and other costs. More precisely, the impact of battery technology advancement is reflected not only in the DOC but also in the overall UAM design scheme. As shown in Figure 11, battery technology advancements greatly affect the range of UAMs with different passenger capacities under the same conditions. The design range nearly doubles (or even triples) with improvements in battery technologies, which demonstrates the significant impact on the overall UAM design scheme.

4. Conclusions

This paper estimates the effect of power batteries on UAM vehicle economics. We developed a DOC model coupled with detailed UAM vehicle sizing parameters and flight profiles. We analyzed different aspects critical to designers. We summarized three states that provide various matches between the battery, MTOW, and DOC. UAM vehicle designers could further employ the proposed model for conceptual design.
Considering the charging rate selection interval to optimize UAM vehicle designs is crucial. The simulation results show a narrow range of charging rates that lead to different design gross weights and DOCs for a given operational model. The low-rate large capacity battery mode has the greatest DOC, the high-rate small capacity battery mode has the lowest, and the energy balance state falls in between. Current battery technology levels require a charging rate of at least 2.5 C for a given task for reasonable design solutions. A charging rate of up to 3 C can make the design solution more reasonable and lower the operating costs. Therefore, it is important to carefully select the charging rate based on the specific task and battery technology for an optimal design that minimized the DOC.
Projected battery technology advances by 2035 are expected to lead to 20–25% reductions in the DOC from the current base and nearly doubles the range with the same design. As a result, UAM designers must consider the impact of technological advances and incorporate future technology levels as a design parameter to reduce the DOC and increase competitiveness.

Author Contributions

Conceptualization, X.Q. and J.Z.; methodology, X.Q. and G.C.; software, X.Q.; validation, X.Q. and J.Z.; formal analysis, G.C.; investigation, X.Q.; resources, W.L.; data curation, X.Q.; writing—original draft preparation, G.C. and W.L.; writing—review and editing, X.Q. and G.C.; visualization, X.Q.; supervision, J.Z.; project administration, J.Z. All authors have read and agreed to the published version of the manuscript.

Funding

This research received no external funding.

Data Availability Statement

The data that support the findings of this study are available from the corresponding author upon reasonable request.

Conflicts of Interest

The authors declare no conflict of interest.

References

  1. Garrow, L.A.; German, B.J.; Leonard, C.E. Urban air mobility: A comprehensive review and comparative analysis with autonomous and electric ground transportation for informing future research. Transp. Res. Part C Emerg. Technol. 2021, 132, 103377. [Google Scholar] [CrossRef]
  2. Harish, A.; Perron, C.; Bavaro, D.; Ahuja, J.; Ozcan, M.; Justin, C.Y.; Briceno, S.; German, B.J.; Mavris, D.N. Economics of Advanced Thin-Haul Concepts and Operations. In Proceedings of the 16th AIAA Aviation Technology, Integration, and Operations Conference, Washington, DC, USA, 13–17 June 2016. [Google Scholar] [CrossRef]
  3. Howard, R.; Wright, E.; Mudumba, S.; Gunady, N.; Sells, B.; Maheshwari, A. Assessing the Suitability of Urban Air Mobility Vehicles for a Specific Aerodrome Network. In Proceedings of the Aiaa Aviation 2021 Forum, Online, 2–6 August 2021. [Google Scholar] [CrossRef]
  4. Goyal, R.; Reiche, C.; Fernando, C.; Cohen, A. Advanced Air Mobility: Demand Analysis and Market Potential of the Airport Shuttle and Air Taxi Markets. Sustainability 2021, 13, 7421. [Google Scholar] [CrossRef]
  5. Pertz, J.; Niklaß, M.; Swaid, M.; Gollnick, V.; Kopera, S.; Schunck, K.; Baur, S. Estimating the Economic Viability of Advanced Air Mobility Use Cases: Towards the Slope of Enlightenment. Drones 2023, 7, 75. [Google Scholar] [CrossRef]
  6. Kohlman, L.W.; Patterson, M.D.; Raabe, B.E. Urban Air Mobility Network and Vehicle Type—Modeling and Assessment. Available online: https://rotorcraft.arc.nasa.gov/Publications/files/Kohlman_TM-2019-220072_FINAL.pdf (accessed on 21 February 2022).
  7. Niklaß, M.; Dzikus, N.; Swaid, M.; Berling, J.; Lührs, B.; Lau, A.; Terekhov, I.; Gollnick, V. A Collaborative Approach for an Integrated Modeling of Urban Air Transportation Systems. Aerospace 2020, 7, 50. [Google Scholar] [CrossRef]
  8. Justin, C.Y.; Payan, A.P.; Briceno, S.I.; German, B.J.; Mavris, D.N. Power optimized battery swap and recharge strategies for electric aircraft operations. Transp. Res. Part C Emerg. Technol. 2020, 115, 102605. [Google Scholar] [CrossRef]
  9. Hamilton, T.; German, B.J. Optimal Airspeeds for Scheduled Electric Aircraft Operations. J. Aircr. 2019, 56, 545–555. [Google Scholar] [CrossRef]
  10. Kreimeier, M.; Stumpf, E.; Gottschalk, D. Economical assessment of air mobility on demand concepts with focus on Germany. In Proceedings of the 16th AIAA Aviation Technology, Integration, and Operations Conference, Washington, DC, USA, 13–17 June 2016. [Google Scholar] [CrossRef]
  11. Justin, C.Y.; Payan, A.P.; Briceno, S.I.; Mavris, D.N. Operational and Economic Feasibility of Electric Thin Haul Transportation. In Proceedings of the 17th AIAA Aviation Technology, Integration, and Operations Conference, Denver, Colorado, 5–9 June 2017. [Google Scholar] [CrossRef]
  12. Kreimeier, M.; Strathoff, P.; Gottschalk, D.; Stumpf, E. Economic Assessment of Air Mobility On-Demand Concepts. J. Air Transp. 2018, 26, 23–36. [Google Scholar] [CrossRef]
  13. Avanzini, G.; de Angelis, E.L.; Giulietti, F. Optimal performance and sizing of a battery-powered aircraft. Aerosp. Sci. Technol. 2016, 59, 132–144. [Google Scholar] [CrossRef]
  14. Traub, L.W. Optimal Battery Weight Fraction for Maximum Aircraft Range and Endurance. J. Aircr. 2016, 53, 1177–1179. [Google Scholar] [CrossRef]
  15. Gatti, M.; Giulietti, F.; Turci, M. Maximum endurance for battery-powered rotary-wing aircraft. Aerosp. Sci. Technol. 2015, 45, 174–179. [Google Scholar] [CrossRef]
  16. dos Reis, G.; Strange, C.; Yadav, M.; Li, S. Lithium-ion battery data and where to find it. Energy AI 2021, 5, 100081. [Google Scholar] [CrossRef]
  17. Hu, X.; Xu, L.; Lin, X.; Pecht, M. Battery Lifetime Prognostics. Joule 2020, 4, 310–346. [Google Scholar] [CrossRef]
  18. Sripad, S.; Viswanathan, V. The promise of energy-efficient battery-powered urban aircraft. Proc. Natl. Acad. Sci. USA 2021, 118, e2111164118. [Google Scholar] [CrossRef] [PubMed]
  19. Liu, T.; Yang, X.-G.; Ge, S.; Leng, Y.; Wang, C.-Y. Ultrafast charging of energy-dense lithium-ion batteries for urban air mobility. eTransportation 2021, 7, 100103. [Google Scholar] [CrossRef]
  20. Tomaszewska, A.; Chu, Z.; Feng, X.; O’Kane, S.; Liu, X.; Chen, J.; Ji, C.; Endler, E.; Li, R.; Liu, L.; et al. Lithium-ion battery fast charging: A review. eTransportation 2019, 1, 100011. [Google Scholar] [CrossRef]
  21. Severson, K.A.; Attia, P.M.; Jin, N.; Perkins, N.; Jiang, B.; Yang, Z.; Chen, M.H.; Aykol, M.; Herring, P.K.; Fraggedakis, D.; et al. Data-driven prediction of battery cycle life before capacity degradation. Nat. Energy 2019, 4, 383–391. [Google Scholar] [CrossRef] [Green Version]
  22. Omar, N.; Monem, M.A.; Firouz, Y.; Salminen, J.; Smekens, J.; Hegazy, O.; Gaulous, H.; Mulder, G.; Van den Bossche, P.; Coosemans, T.; et al. Lithium iron phosphate based battery—Assessment of the aging parameters and development of cycle life model. Appl. Energy 2014, 113, 1575–1585. [Google Scholar] [CrossRef]
  23. Bocca, A.; Sassone, A.; Shin, D.; Macii, A.; Macii, E.; Poncino, M. An equation-based battery cycle life model for various battery chemistries. In Proceedings of the 2015 IFIP/IEEE International Conference on Very Large Scale Integration (VLSI-SoC), Daejeon, Republic of Korea, 5–7 October 2015; pp. 57–62. [Google Scholar]
  24. Lain, M.J.; Kendrick, E. Understanding the limitations of lithium ion batteries at high rates. J. Power Sources 2021, 493, 229690. [Google Scholar] [CrossRef]
  25. Ahn, B.; Hwang, H.-Y. Design Criteria and Accommodating Capacity Analysis of Vertiports for Urban Air Mobility and Its Application at Gimpo Airport in Korea. Appl. Sci. 2022, 12, 6077. [Google Scholar] [CrossRef]
  26. Boeing; Wisk. Concept of Operations for Uncrewed Urban Air Mobility. Available online: https://wisk.aero/wp-content/uploads/2022/09/Concept-of-Operations-for-Uncrewed-Urban-Air-Mobility.pdf (accessed on 22 September 2022).
  27. EASA. Prototype Technical Specifications for the Design of VFR Vertiports for Operation with Manned VTOL-Capable Aircraft Certified in the Enhanced Category. Available online: https://www.easa.europa.eu/downloads/136259/en (accessed on 24 March 2023).
  28. Uber. Fast-Forwarding to a Future of On-Demand Urban Air Transportation. Available online: https://evtol.news/__media/PDFs/UberElevateWhitePaperOct2016.pdf (accessed on 12 February 2023).
  29. Nathen, P.; Strohmayer, A.; Miller, R.; Grimshaw, S.D.; Taylor, J. Architectural Performance Assessment of an Electric Vertical Take-Off and Landing (e-VTOL) Aircraft Based on a Ducted Vectored Thrust Concept. Available online: https://lilium.com/files/redaktion/refresh_feb2021/investors/Lilium_7-Seater_Paper.pdf (accessed on 7 April 2023).
  30. Reiche, C.; Goyal, R.; Cohen, A.; Serrao, J.; Kimmel, S.; Fernando, C.; Shaheen, S. Urban Air Mobility Market Study. Natl. Aeronaut. Space Adm. 2018. [Google Scholar] [CrossRef]
  31. Brelje, B.J.; Martins, J.R.R.A. Electric, hybrid, and turboelectric fixed-wing aircraft: A review of concepts, models, and design approaches. Prog. Aerosp. Sci. 2019, 104, 1–19. [Google Scholar] [CrossRef]
  32. Lin, W.; Ren, H.; Peng, Q. A general analysis model of economical efficiency for regional aircraft operation. Civ. Aircr. Des. Res. 2019, 135, 21–30. [Google Scholar]
  33. Liao, L.; Ye, Y.; Tiehong, D. The Method and Application of the DOC Analysis in European Market. Civ. Aircr. Des. Res. 2013, 1, 1–4+22. [Google Scholar]
  34. Bower, G. Vahana Configuration Trade Study—Part II. Available online: https://acubed.airbus.com/blog/vahana/vahana-configuration-trade-study-part-ii/ (accessed on 1 February 2022).
  35. BloombergNEF. Electric Vehicle Outlook 2022. Available online: https://about.bnef.com/electric-vehicle-outlook/ (accessed on 23 May 2022).
  36. Kohlman, L.W.; Patterson, M.D. System-Level Urban Air Mobility Transportation Modeling and Determination of Energy-Related Constraints. In Proceedings of the 2018 Aviation Technology, Integration, and Operations Conference, Atlanta, Georgia, 25–29 June 2018. [Google Scholar] [CrossRef]
  37. Mathur, A.; Panesar, K.; Kim, J.; Atkins, E.M.; Sarter, N. Paths to Autonomous Vehicle Operations for Urban Air Mobility. In Proceedings of the AIAA Aviation 2019 Forum, Dallas, TX, USA, 17–21 June 2019. [Google Scholar] [CrossRef]
  38. EASA. Introduction of a Regulatory Framework for the Operation of Drones. Available online: https://unmanned-network.com/wp-content/uploads/elementor/forms/62c5abfdb275b.pdf (accessed on 1 June 2022).
  39. Howard, R.J.; Wright, E.C.; Mudumba, S.V.; Gunady, N.I.; Sells, B.E.; Maheshwari, A.; Delaurentis, D.A.; Crossley, W.A. Urban Air Mobility Vehicle Dataset. Purdue Univ. Res. Repos. 2021. [Google Scholar] [CrossRef]
  40. Ehang. The Future of Transportation: White Paper on Urban Air Mobility Systems. Available online: https://www.ehang.com/app/en/EHang%20White%20Paper%20on%20Urban%20Air%20Mobility%20Systems.pdf (accessed on 15 January 2022).
  41. Balli, M.E. EVTOL aircraft conceptual design and optimization. Sc. Di Ing. Ind. E Dell’informazione 2020. Available online: http://hdl.handle.net/10589/154226 (accessed on 17 April 2023).
  42. Liu, M.; Hao, H.; Lin, Z.; He, X.; Qian, Y.; Sun, X.; Geng, J.; Liu, Z.; Zhao, F. Flying cars economically favor battery electric over fuel cell and internal combustion engine. PNAS Nexus 2023, 2, pgad019. [Google Scholar] [CrossRef]
  43. Wu, D.; Wu, F. Toward better batteries: Solid-state battery roadmap 2035+. eTransportation 2023, 16, 100224. [Google Scholar] [CrossRef]
  44. Bloomberg, N.E.F. Hitting the EV Inflection Point. Available online: https://www.transportenvironment.org/wp-content/uploads/2021/08/2021_05_05_Electric_vehicle_price_parity_and_adoption_in_Europe_Final.pdf (accessed on 23 May 2022).
Figure 1. Relationship between coupled design parameters.
Aerospace 10 00631 g001
Figure 2. Specific energy vs. specific power of common electric vehicle batteries. Source: [18].
Aerospace 10 00631 g002
Figure 3. UAM concept presentation for the considered scenario.
Aerospace 10 00631 g003
Figure 4. Typical flight profile of a UAM vehicle.
Aerospace 10 00631 g004
Figure 5. DOC breakdown for each commercial UAM vehicle.
Aerospace 10 00631 g005
Figure 6. CPSK of each considered UAM vehicle.
Aerospace 10 00631 g006
Figure 7. Minimum mass for the mission of required flight frequency as a function of passenger capacity.
Aerospace 10 00631 g007
Figure 8. Mass of energy balance state as a function of the number of passengers.
Aerospace 10 00631 g008
Figure 9. Temporal variations in the SOC with different charging rates.
Aerospace 10 00631 g009
Figure 10. Impact of battery improvements on the DOC.
Aerospace 10 00631 g010
Figure 11. Impact of battery improvements on the range.
Aerospace 10 00631 g011
Table 1. Specific parameters of the flight profile shown in Figure 4.
PhaseVertical Speed (m/s)Horizontal Speed (m/s)End Altitude (m)
A0–2.5015
B2.50–1.2 V s t a l l 91
C01.2 V s t a l l 91
D2.51.2 V s t a l l V c r u i s e 457
E0 V c r u i s e 457
F2.5 V c r u i s e –1.2 V s t a l l 91
G01.2 V s t a l l 91
H2.5–1.51.2 V s t a l l –015
I1.5–000
Table 2. Infrastructure cost for different MTOWs.
MTOW (kg)Takeoff Fee ($)Parking Fee ($/h)
0–18145030
1814–27216430
2721–362974300
3629–45369040
Table 3. Some design parameters of operation.
ParameterValueParameterValue
Empty weight factor0.6Hovering efficiency0.893
Daily planning operation hours12FOM of vertical flight0.8
Annual planning operation rate0.9Aerodynamic interference coefficient of vertical flight1.03
Actual operating rate0.9L/D of cruise16
Table 4. Detailed specifications of four commercial UAM vehicles. Source: [39].
ParameterVolocityArcher MakerWisk CoraJoby S4
Passengers1114
Cruise Speed (m/s)49.267.125.073.8
Range (km)35.496.699.8241.4
MTOW (kg)900.01508.01224.02177.0
Battery Capacity (kWh)83.374.063.0200.0
L/D2.511.313.913.8
Disclaimer/Publisher’s Note: The statements, opinions and data contained in all publications are solely those of the individual author(s) and contributor(s) and not of MDPI and/or the editor(s). MDPI and/or the editor(s) disclaim responsibility for any injury to people or property resulting from any ideas, methods, instructions or products referred to in the content.

