1. Introduction
Aviation has made fast and safe transportation over long distances accessible and affordable to an increasing part of the global population. However, along with this tremendous benefit, the negative effects of air traffic are becoming increasingly apparent, such as its substantial contribution to global warming [
1] and local noise emissions. The reduction in carbon dioxide emissions has become a major objective in current political framework of aviation. To sustain the benefits of efficient and fast air travel, while simultaneously reducing climate-active emissions, the electrification of aircraft propulsion systems is a promising approach.
Electrified propulsion has an advantage in that it converts high-grade energy (electricity) to another form of high-grade energy (mechanical power) at a high level of efficiency when compared to internal combustion engines, which convert low-grade energy (chemical energy) to high-grade energy (mechanical power). Moreover, electric propulsion allows the decoupling of power from thrust units [
2]. Depending on the utilised source of energy, electric motors can be operated locally free of climate-active gases and with reduced noise emissions from the engine [
3]. From an operational perspective, electric motors have fewer rotating parts and are expected to cause fewer vibrations than reciprocating combustion engines in which energy conversion occurs intermittently. Bringing these factors into the context of aircraft operations, lower vibrations also reduce maintenance efforts and therefore costs.
Electric propulsion systems for aviation applications have long focused on light, unmanned aerial vehicles; however, with increasing power and energy storage capabilities, electric propulsion systems have reached a technology level that currently allows them to power light, general aviation aircraft [
4]. The next foreseeable and achievable step would be the electrification of commuter and regional aircraft. As large commercial aircraft are not yet ready to be electrified with current electric technology, this allows the acquisition of more experiences with electrified propulsion systems at a smaller scale, but in an operational environment similar to commercial aircraft.
In addition to their role as a testbed, electrified commuter and light regional aircraft have the potential to develop into leading players in a proposed, intermodal transportation system, as they might offer fast and efficient low-capacity transportation. Further characteristics of commuter and regional air services can be summarised as follows:
Limited infrastructure required: apart from airfields and navigation facilities, no significant en-route infrastructure is needed, resulting in low capital investment and low emission of construction.
Travel times: short travel times and improved accessibility of remote areas.
Flexibility: low seating capacity per flight allow to avoid complex aggregation of demand.
Commuter and regional air services have been existing for decades; however, they have developed into a niche for the various reasons published by Maertens [
5] and Paul et al. [
6]. To exploit the benefits of a commuter network, the requirements of and constraints on a revitalised commuter network for efficient, fast, and low-capacity transport shall be discussed in the broader context of this work.
Recent publications have presented numerous electrified or hybrid-electric aircraft designs for commuter and regional aircraft, such as [
7,
8,
9]. These aircraft designs are optimised based on previously defined top-level aircraft requirements (TLAR). However, many of these TLAR have been derived based on existing, conventional aircraft. It is reasonable to assume that the characteristics of conventional and electrified aircraft are not necessarily congruent. Thus, it might be misleading to optimise divergent aircraft designs, which involve different design trade-offs, based on similar sets of aircraft requirements. To name an example, standard aircraft design textbooks, such as Torenbeek [
10], state the general rule that a reduction in fuel weight and take-off weight improves flight performance and operating expenses at a given payload and mission performance requirements. This general rule is challenged in electrified aircraft. Haran et al. [
2] emphasise the high sensitivity to aircraft range, weight, and energy-related operational conditions in the context of electric aircraft. Especially for battery-electric aircraft, the weight of energy storage scales to a much larger degree with the mission and range requirements than would be expected for fossil fuel-driven aircraft. Requiring electrified aircraft designs to fulfil all the requirements of conventional aircraft, which might be less relevant for electric commuter operation, would, therefore, hamper new technologies.
First, this work shall facilitate the design of electrified aircraft for proposed commuter and regional aircraft applications. It shall improve the understanding of the framework and the underlying trade-offs, which are crucial aspects of the design process. Requirements shall be defined to enable electrified commuter and regional aircraft to exploit their characteristics in a meaningful way in order to eventually reduce emissions and improve connectivity. Especially the design of battery-electric aircraft shows a strong influence of range requirements on the sizing of energy storage and power systems and, thus on the total aircraft weight and required propulsive power. Therefore, the second focus is to describe range requirements by analysing the flight leg distance between identified commuter connections. Third, a closer look at the existing ground infrastructure of the identified airfields shall illustrate the trade-off between aircraft’s take-off requirements and its effects on total travel times. To allow a comprehensive evaluation of commuter and regional air mobility, the identified connections are compared to the existing reference modes of ground and air transportation
Published works have underlined that identifying meaningful aircraft requirements is complex, as single requirements can interfere and even contradict. This can result in non-transparent or difficult-to-retrace design implications. To avoid this, Moebs et al. [
11] developed a method to identify, weigh, and filter requirements to determine a set of relevant requirements to streamline the aircraft design process. Eisenhut et al. [
12] applied the V-model of Systems Engineering in the context of a hybrid-electric regional aircraft. Their analysis identified passengers, operators, authorities, airports, air traffic management, supplier of energy, as well as the general public, as significant stakeholders. However, with a predefined focus on hybrid-electric regional aircraft and a seating capacity of circa 50, this approach had a strong focus on replacing existing regional aircraft within the already existing market requirements.
Further published works have focused on describing the prospects of a revitalisation of commuter air services and the requirements they pose on (electrified) aircraft designs. Grimme et al. [
13] performed a travel time benefit analysis for low-capacity commuter services. Limiting the study area to Germany, they showed that significant travel time improvements can be achieved by the introduction of low-capacity, point-to-point connections between regions when compared to existing individual road, rail, and scheduled airline services. Their results show that for distances of up to 200 km, individual road transportation results in the shortest travel times. Although the focus on a specific country improves the quality of the input data, it limits the general applicability of the results to a larger context.
Several publications have discussed the potential and market environment for low-capacity air transportation vehicles in Europe and Germany. Kreimeier [
14] conducted a comprehensive market analysis for on-demand air taxis in the German market. He derived travel times and traffic demand based on economic data within Germany for on-demand vehicles with 2–4 passengers. The analysis resulted in on-demand air taxis having the highest share of connections with an airfield-to-airfield distance of 350–500 km.
Sun et al. [
15] conducted a travel time benefit analysis for the largest 500 agglomerations in Europe. They compared travel times of road transportation, railway connections, CS-25 airline services, and on-demand air taxi connections. The assumed vehicles had a seating capacity of 2–4 passengers. The authors expressed significant travel time improvements for distances between 80–130 km and 220–340 km. Based on this, Schuh et al. [
16] developed a travel time benefit analysis with a modal split consideration on selected routes. They derived travel time benefits for Germany based on a geographical clustering of regions with circa 100,000 inhabitants each. The travel times for road transportation (based on simplified great circle (GC) distances with a detour factor), railway transportation, scheduled airline services, and on-demand commuter services were compared. The authors combined the feasible travel time benefits of on-demand commuter services with the cost of transportation to apply a value-of-travel-time model for connections within Germany. They determined the highest share of low-capacity air services was for connections between 180 and 500 km.
The presented publications are summarised in
Table 1. These works already offer meaningful insights into the potential of revitalised air taxi and commuter services and on which routes they could be applied. However, these studies limited the study area to a specific country or sets of large agglomerations. For example, by considering connections within Germany, the maximum range is naturally limited to flights of less than 1100 km. Furthermore, the comparison of connections between the largest agglomerations favours high-capacity connections, which are likely to be served by scheduled airlines on a lower cost base. In contrast, commuter air services would aim to improve the connectivity of remote areas, as well as secondary agglomerations, which are underserved by scheduled airline services. A further limitation of existing studies refers to the identified travel time benefits. Sun et al. and Grimme et al. assumed on-demand air services and, therefore, allowed all possible connections between regions. It was neglected if connections could generate sufficient demand potential to utilise the capacity of these connections. However, a fair comparison of travel times would require some kind of (pre-)selection to only consider connections, which could generate sufficient volume to fill the proposed vehicles on a regular base.
Building upon the existing literature, this work aims at the main proposition of commuter air services. It follows the assumption that an improvement in door-to-door travel time stimulates a (partial) shift in the selection of transportation mode. Therefore, travel times for individual road, railway, traditional airline, and commuter air services are compared. The objective is to elaborate on initial range and infrastructure requirements, which are crucial for the design of electrified commuter and regional aircraft. Thus, the geographical scope of this study was extended to include regions in the entire European Union (plus UK, Norway, and Switzerland). This is intended to better represent the actual operations that commuter and regional aircraft undertake. Furthermore, a simple demand model was applied to allow a rudimentary selection of connections which would likely allow sufficient traffic to be served by commuter aircraft. Further analysis was limited to the chosen high-demand connections, allowing for a higher quality of input data. The subsequent analysis of the existing ground infrastructure was performed only for those airfields and airports which were previously identified as potentially useful for the studied use cases. This work shows which range and mission profile improvements in door-to-door travel times can be achieved. Furthermore, it identifies the reference cases in which the proposed commuter system should outperform to be used efficiently.
In the following, this work will start with an empirical description of the operational and mission-related characteristics of current commuter and light regional aircraft. In the second part, the travel time benefit model and its results will be presented. In the last step, the already existing infrastructure and how it could be used for a revitalisation of commuter and regional air services will be illustrated.
2. The Status Quo of European Commuter and Regional Aviation
Regional air services have existed in Europe—and especially in North America—since the 1950s [
6]. They focussed on connecting secondary cities with high frequencies of inter-city travel, which made them attractive for business traffic but also improved the connectivity of remote areas [
5,
17]. Since commuter air services have reached their peak in the 1990s, this segment of aviation has faced a stark and constant decline with an increasingly aged fleet and only a few aircraft types still in production [
6,
16]. Previous publications have linked the decline essentially to the increasing market penetration of low-cost carriers, which have added more efficient narrowbody aircraft to fly from first- and second-tier, but also regional airports. As they achieved lower costs per seat, low-cost carriers shifted the demand and cannibalised many regional connections [
17]. Furthermore, capacity constraints on major airports, as well as the development of high-speed rail (HSR) services accelerated the decline of regional aviation [
5].
Regional air services are usually conducted by commuter and regional aircraft. This work defines commuter aircraft as fixed-wing aircraft that are certified under the FAR-23/CS-23 Commuter paragraph [
18]. Commuter aircraft are transportation aircraft with a seating capacity of up to 19 passengers, a maximum take-off weight of 19,000 lb, and no more than 2 propulsor units. Aircraft which operate very similar missions, but are certified under the FAR-25/CS-25, are defined as regional aircraft. A subset of light regional aircraft was defined as regional aircraft with a seating capacity of 20 to 50 seats. A detailed analysis of current commuter and regional air services in the European airspace was based on the Eurocontrol air traffic management (ATM) dataset [
19] and can be found in a previous publication [
20]. It was shown that a large majority of commuter missions are operated on relatively short flights of less than 600 km. Traditional commuter aircraft are applied predominantly on routes that connect secondary cities, but also on routes that connect large agglomerations. Light regional aircraft have proven to be operated on very similar missions. Air traffic with light regional aircraft has developed into a role that is traditionally attributed to commuter aircraft: they concentrate on connecting secondary cities, as well as linking remote areas to international hub airports. The main difference between commuter and regional aircraft lies in their average utilisation with light regional aircraft flying significantly more cycles than commuters.
In regard to the number of flights and traffic volume, the data shows that current commuter and regional air services only play a minor role in European air traffic. Together, commuter and light regional aircraft cover about 3.07% of scheduled passenger flights in European airspace. However, 32.05% of the total operated flights are within the stated range of 700 km, whereas the largest part is currently operated on narrow-body aircraft.
3. Method of Assessing Proposed Future Demand
In contrast to the analysis of existing commuter air services, the following section focuses on the potential of a revitalised commuter air transportation system. As this future transportation system has not been established yet, its definition is linked to a high level of uncertainty. To take account of this, we defined the proposed air transportation system based on the V-model approach of Systems Engineering as defined by Haberfellner [
21]. The analysis was conducted in the following stages and considered available transportation policy publications by political and scientific organisations [
22,
23,
24]:
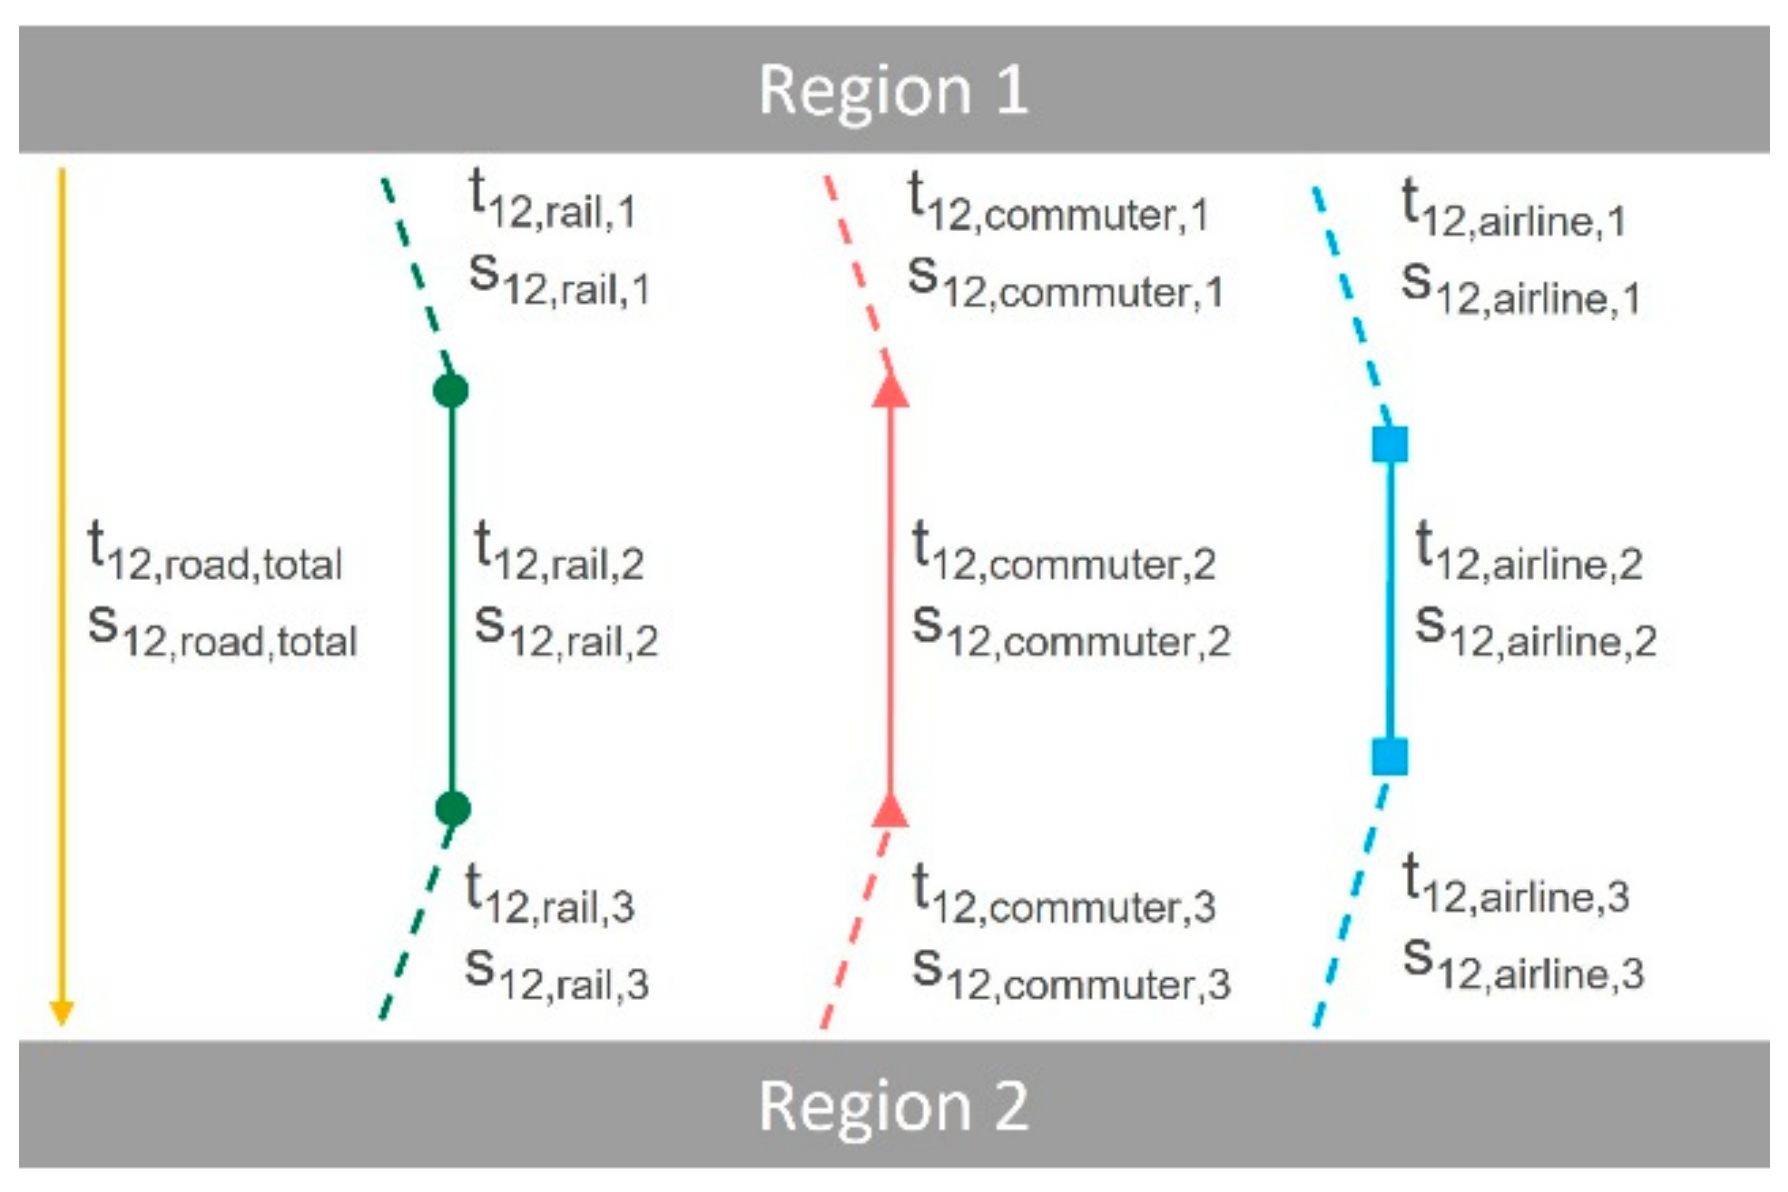
This publication focuses on the proposition of improving total door-to-door travel times. The basic idea of this work is that an improvement in travel time will lead to a (partial) shift in the selection of the mode of transportation. Therefore, a comparison of door-to-door travel times was conducted for a large set of connections with different modes of transportation. These comparisons were summarised to different levels of aggregation to identify route profiles and ranges where commuter air services can significantly improve travel times. The studied modes of transportation were individual road (road), high-speed railway (HSR), and mainline airline services. For clarification, the term
airline services will refer to any already existing, conventional, and scheduled flight on CS-25 aircraft. All modes of transportation were considered in their current networks and infrastructure.
Figure 1 illustrates the modes of transportation and their corresponding segments.
The analysis focused on Europe, which was defined as the EU27, Liechtenstein, Norway, Iceland, Switzerland, and the UK (overseas territories were excluded). The study area was subdivided into 1,390 statistical regions (European NUTS level 3), with each region having a population of 150,000 to 800,000 inhabitants. The population of a region was assumed to be concentrated in a geographic point, which was set depending on the region’s population characteristics:
High concentration with one predominant city: coordinates of the major city.
High concentration with 2–3 predominant cities: geographic centre of the cities’ coordinates.
Equal distribution, no predominant cities: geographic centroid of the region.
Each combination of two regions was defined as a potential connection, which could be either domestic or transborder. For these connections, the travel times of commuters and the reference modes of transportation were analysed.
Connections were filtered in order to include only those which were by default suitable for commuter air transportation. As in other publications, commuter connections were required to have a GC distance of more than 80 km, but less than 1500 km. Furthermore, a simple gravity-based demand model was applied to identify those connections which are likely to generate sufficient demand potential to sustain at least a daily flight with a 19-seater aircraft. The demand model has the number of (air) passengers as its dependent variable and considers the population [
25], economic activities (as GDP per capita) [
26], and the GC distance between regions as the independent variables. It is based on the work by Hazledine, who established this type of parameter study to describe air traffic volumes on a local level for New Zealand [
27]. All connections above a predefined threshold demand value were included in further calculations. The bottom threshold demand was defined regarding European commuter connection which sustains a maximum of one daily flight on a 15-to-19-seater aircraft. No upper demand threshold was applied.
In the following, the methods to calculate the journey times and distances for each mode of transportation are presented. A detailed overview of assumed speeds and processing times is presented in
Appendix A.
3.1. Road
Calculations for individual road transportation assumed a direct routing between the defined points in the region of origin and destination. The distance and duration of journeys were calculated by embedding the openrouteservice API for dynamic route calculations [
28]. Based on the current road network of Europe, the API calculated travel times and durations for a combination of two coordinates. Time for stops and breaks was not included. Road journeys of more than 1000 km GC distance (circa 11 to 12 h driving time) were excluded as they were assumed to be inferior due to the long self-driving time.
Apart from the usage of road transportation for the entire door-to-door journey, individual road transportation was also assumed for the first/last mile transportation to connect the HSR station, airfields, and airports with the point of origin and the destination. Individual route transportation excluded return or reallocation journeys of the vehicle, as this is reasonable to be assumed for car-sharing operators.
3.2. High-Speed Rail Services
The door-to-door journey on HSR was subdivided into three travel segments and two processes. The first segment includes road transport from the region of origin to an HSR access. Train stations with an HSR access were identified by the usage of a database [
29]. The duration was calculated with the openrouteservice API. A processing time of 15 min was included at the station to take into account walking distances and waiting times. To describe the HSR segment, stations with the HSR access closest to the region of origin and the destination were identified. The travel time was calculated based on the HAFAS API [
30] for the Winter 2022 schedule. The API showed good coverage of connections within Central Europe; however, the coverage of other regions could be improved. A second processing time of 10 min was considered at the HSR station of arrival. The last-mile transportation from the HSR access to the destination was carried out by individual road transportation and was calculated based on the openrouteservice API.
3.3. Commuter Air Services
Starting at the region of origin, the passenger was assumed to use individual road transportation for the first/last mile to one of the closest airfields. In accordance with an airport and runway database [
31], appropriate airfields were defined by the following requirements:
Currently active airfields;
Asphalt or concrete runway;
No slot restrictions applied [
29];
Minimum runway length of 300 m.
For each region, the closest airfield was identified. To improve the robustness of the results, the set of k = {1,2,3} closest airfields was also identified for further analysis. At the airfield, a processing time of 28 min was considered for check-in, security, and boarding. This is significantly shorter than today’s processing time for conventional airline flights; however, current US commuter operations prove that these processing times are realistic [
32,
33,
34] As commuter airfields are assumed to be less complex than airports, taxi-in and taxi-out times of 8 min in total were assumed.
The actual flight was subdivided into three phases with a dynamic climb and a descent phase at a vertical speed of 1000 ft/min to the cruising altitude. Cruising altitudes of a maximum FL 200 were assumed unless short flight distances indicated lower altitudes. The cruise flight was assumed to be at a speed of 400 km/h, but it could be varied for later sensitivity analysis. The horizontal speed was assumed to be 50% of the maximum cruising speed. The processing times at the airfield of disembarkment summed up to 20 min. The passengers reached their destination by individual road transportation for the last mile segment.
3.4. Airline Air Services
For each region, the five closest airports with scheduled passenger flights were identified and assigned. In a second step, a database containing all connections with at least one weekly scheduled flight [
19] was examined to find any combination that connected one of the airports close to the region of origin with an airport close to the region of destination. The actual flight and taxi-in/out times, as well as flight distances, were retrieved from the Eurocontrol ATM data [
19].
Equally to the other modes, the first/last mile transportation to and from the identified airports was assumed to be conducted on individual road transportation. The assumed processing time at the airport of origin was 65 min for check-in, security, and boarding, and 30 min at the airport of destination.
3.5. Travel Time Benefit
This work defines travel time benefits (TTB) as the improvement in total travel time due to the introduction of commuter services. TTB are defined regarding the fastest reference mode of transportation. TTB can be calculated for every connection between two regions based on the total journey times, t
i, according to Equation (1):
5. Discussion
This work transferred travel time benefit approaches from a locally limited to a European context to elaborate on the implications for range requirements for regional air mobility. It systematically formulated and quantified attainable improvements in total travel times for low-capacity, potentially electrified commuter air services based on the already existing ground infrastructure. The applied model compares travel times for different modes of transportation.
The results of this article can be interpreted in regard to the existing research as they are summarised in
Table 1. The described distribution of distances proved to be higher than what the existing research has shown. This delta occurred expectedly for two reasons. First, by extending the study area to large parts of Europe, the maximum possible door-to-door distance was obviously higher. Although the applied filter to identify connections that could generate sufficient demand depended on the distance between the origin and the destination (an increasing distance had a decreasing effect on the demand), a high number of additional, transborder connections was identified. Second, the general setup in the studies by Kreimeier, Sun, and Schuh focused on low-capacity (almost individual) air taxis, whereas this article set its assumption in regard to commuter and regional air transportation. The assumed boarding, deboarding, and taxiing times of this article were therefore higher than in the existing work. This penalised commuter services on short trips in comparison to road transportation, which caused the shift of the lower transition zone (road vs. commuter air services). In comparison to Grimme who applied processing time assumptions which were similar to this article, the location of the first transition zone was almost equal.
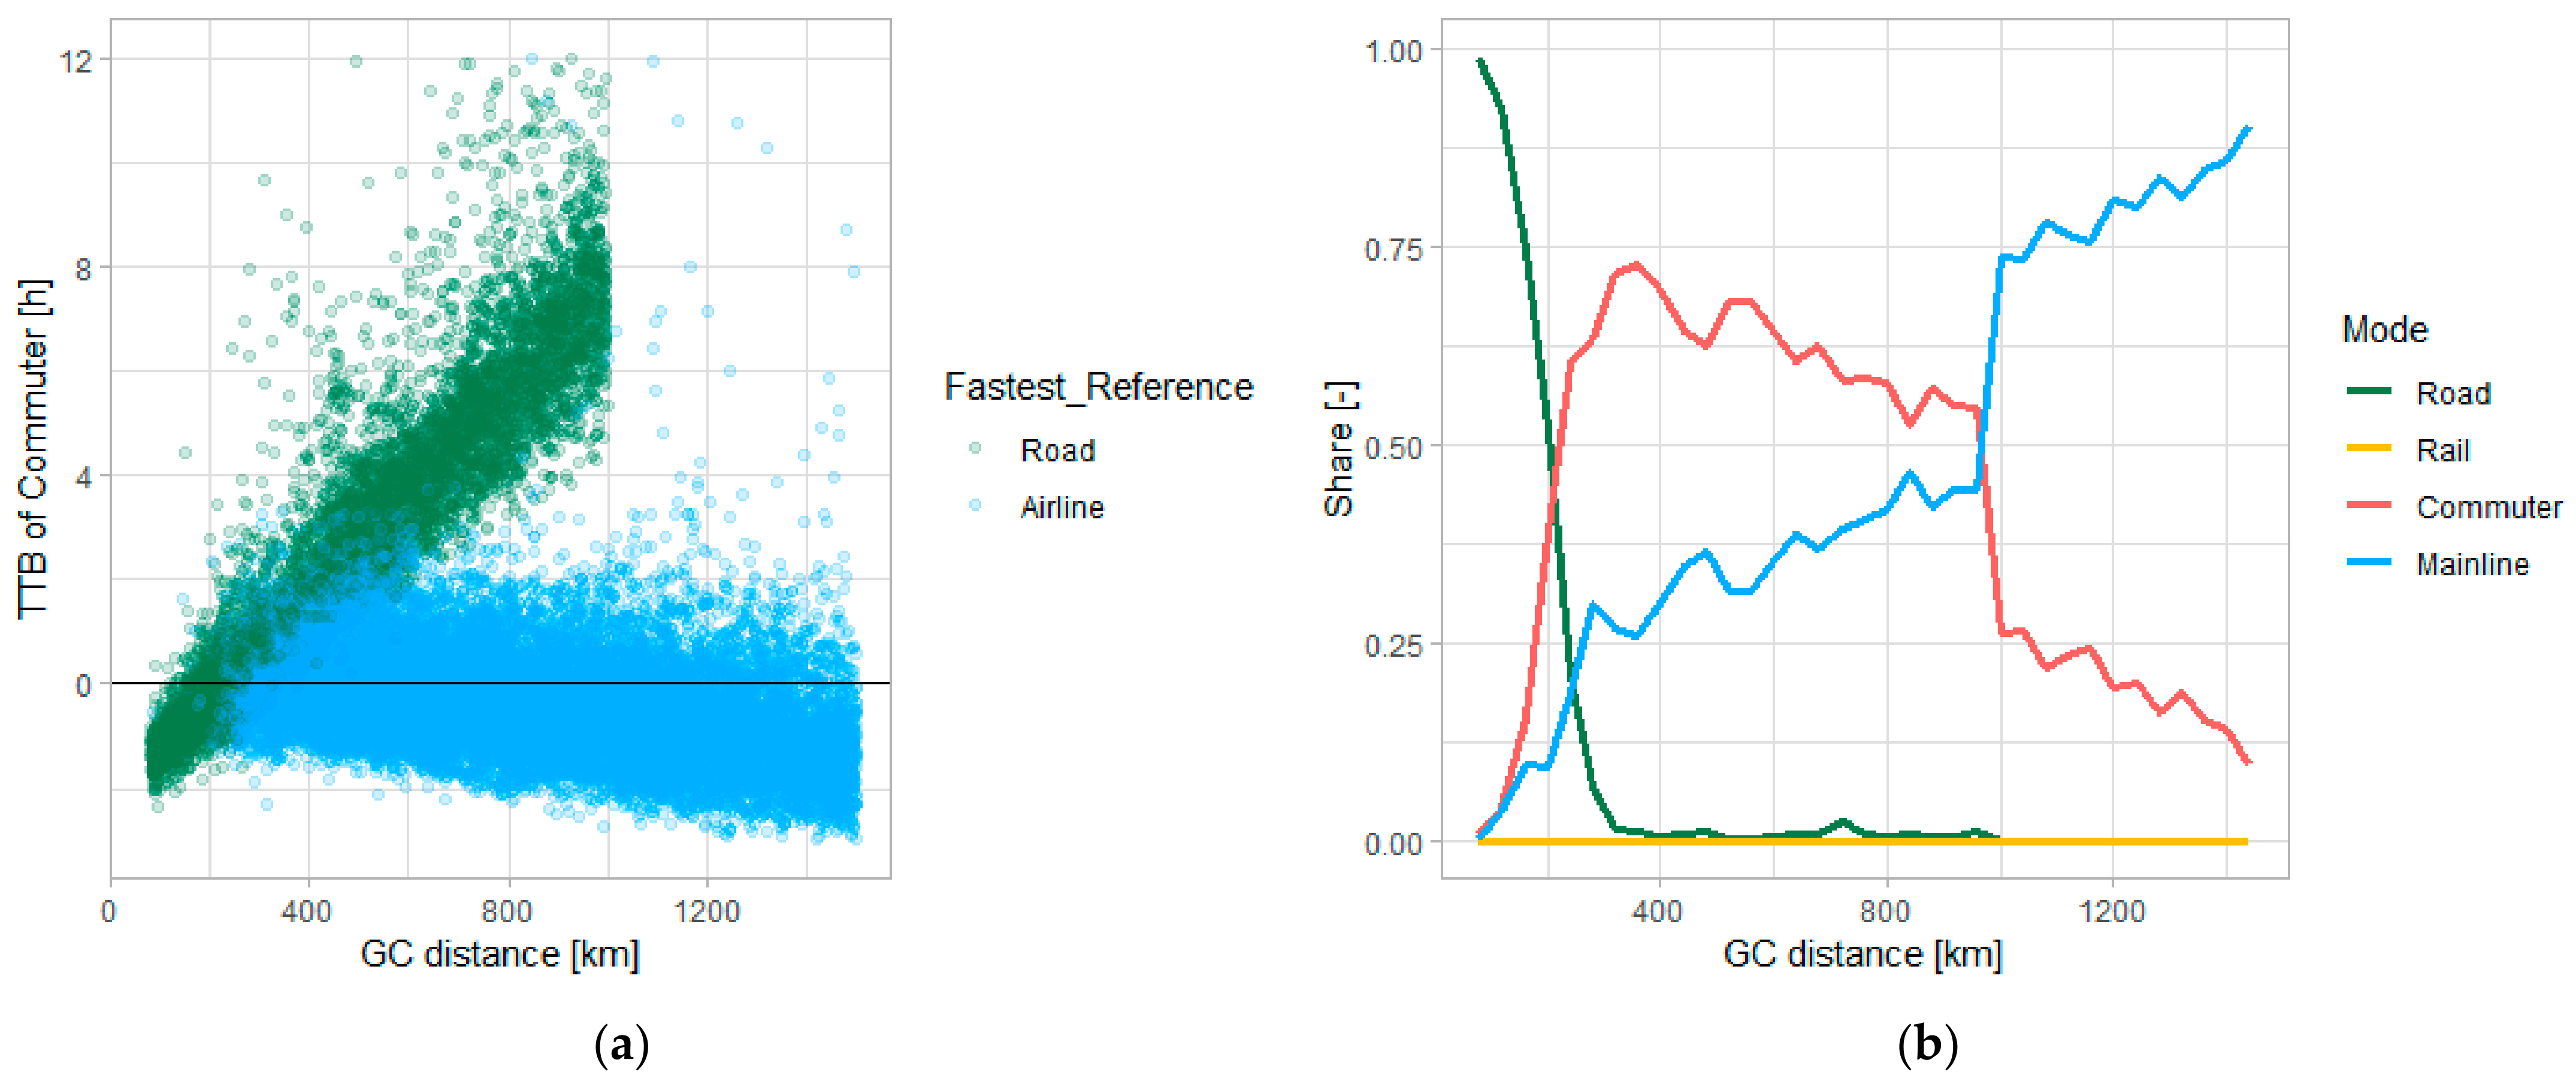
Figure 3a shows that the highest travel time improvements can be achieved by commuter services replacing long road transportation on thin, low-capacity connections to remotely located regions without sufficient airline coverage. However, the data shows that commuter services would compete to a higher degree with existing airline services where the travel time improvements are still substantial. In this regard, it is noteworthy that the transition zone between commuter and airline services also shifts in comparison to the existing research. This can be traced back to the different methods applied to describe the airline network. This work described the existing airline network by assuming scheduled, actually performed non-stop flights that occurred at least once per week between two airports on CS-25 aircraft. In contrast, other works have considered the mere proximity to airports served by airline services or included the availability of transfer connections. These alternative methods might suggest a better accessablity of regions by airline services.
At this point, no clear implication can be made yet whether it might be more promising to define future commuter requirements in reference to individual road or airline services. To model this, a quantification of demand would be required, which could apply a monetary value of travel time approach (such as presented in [
16]) based on an operational cost module. However, the applied method does not allow conclusions to be drawn about the distribution or quantification of demand yet. Further works shall include a cost-based model, which would allow consideration of travel times and operating costs to derive the expected demand. In the following paragraphs, we outline and discuss the main assumptions of this article.
5.1. Aircraft
As previously stated, regional air transport on commuter and light regional aircraft used to be a well-established segment of aviation. Since then, only a few aircraft models are still in production, with the majority of the fleet increasing in age with very limited possibilities for replacements [
6]. For the proposed revitalisation of commuter and light regional aircraft, significant improvement to these aircraft would be necessary to offer a competitive mode of transportation. These improvements need to address the following aspects:
Reducing operating costs;
Improvement in the availability of aircraft fuels;
Reducing noise to improve acceptance in communities affected by airfields.
It will be a subject for further research to elaborate on (foreseeable) available technologies and their technical constraints in the context of the derived requirements and make a preselection for further analysis. Additional aspects that should be considered for further research are the effects of seating capacity per aircraft and the cruise speeds of proposed commuter systems, as both aspects potentially strongly affect the resulting aircraft design and transportation system.
5.2. Range
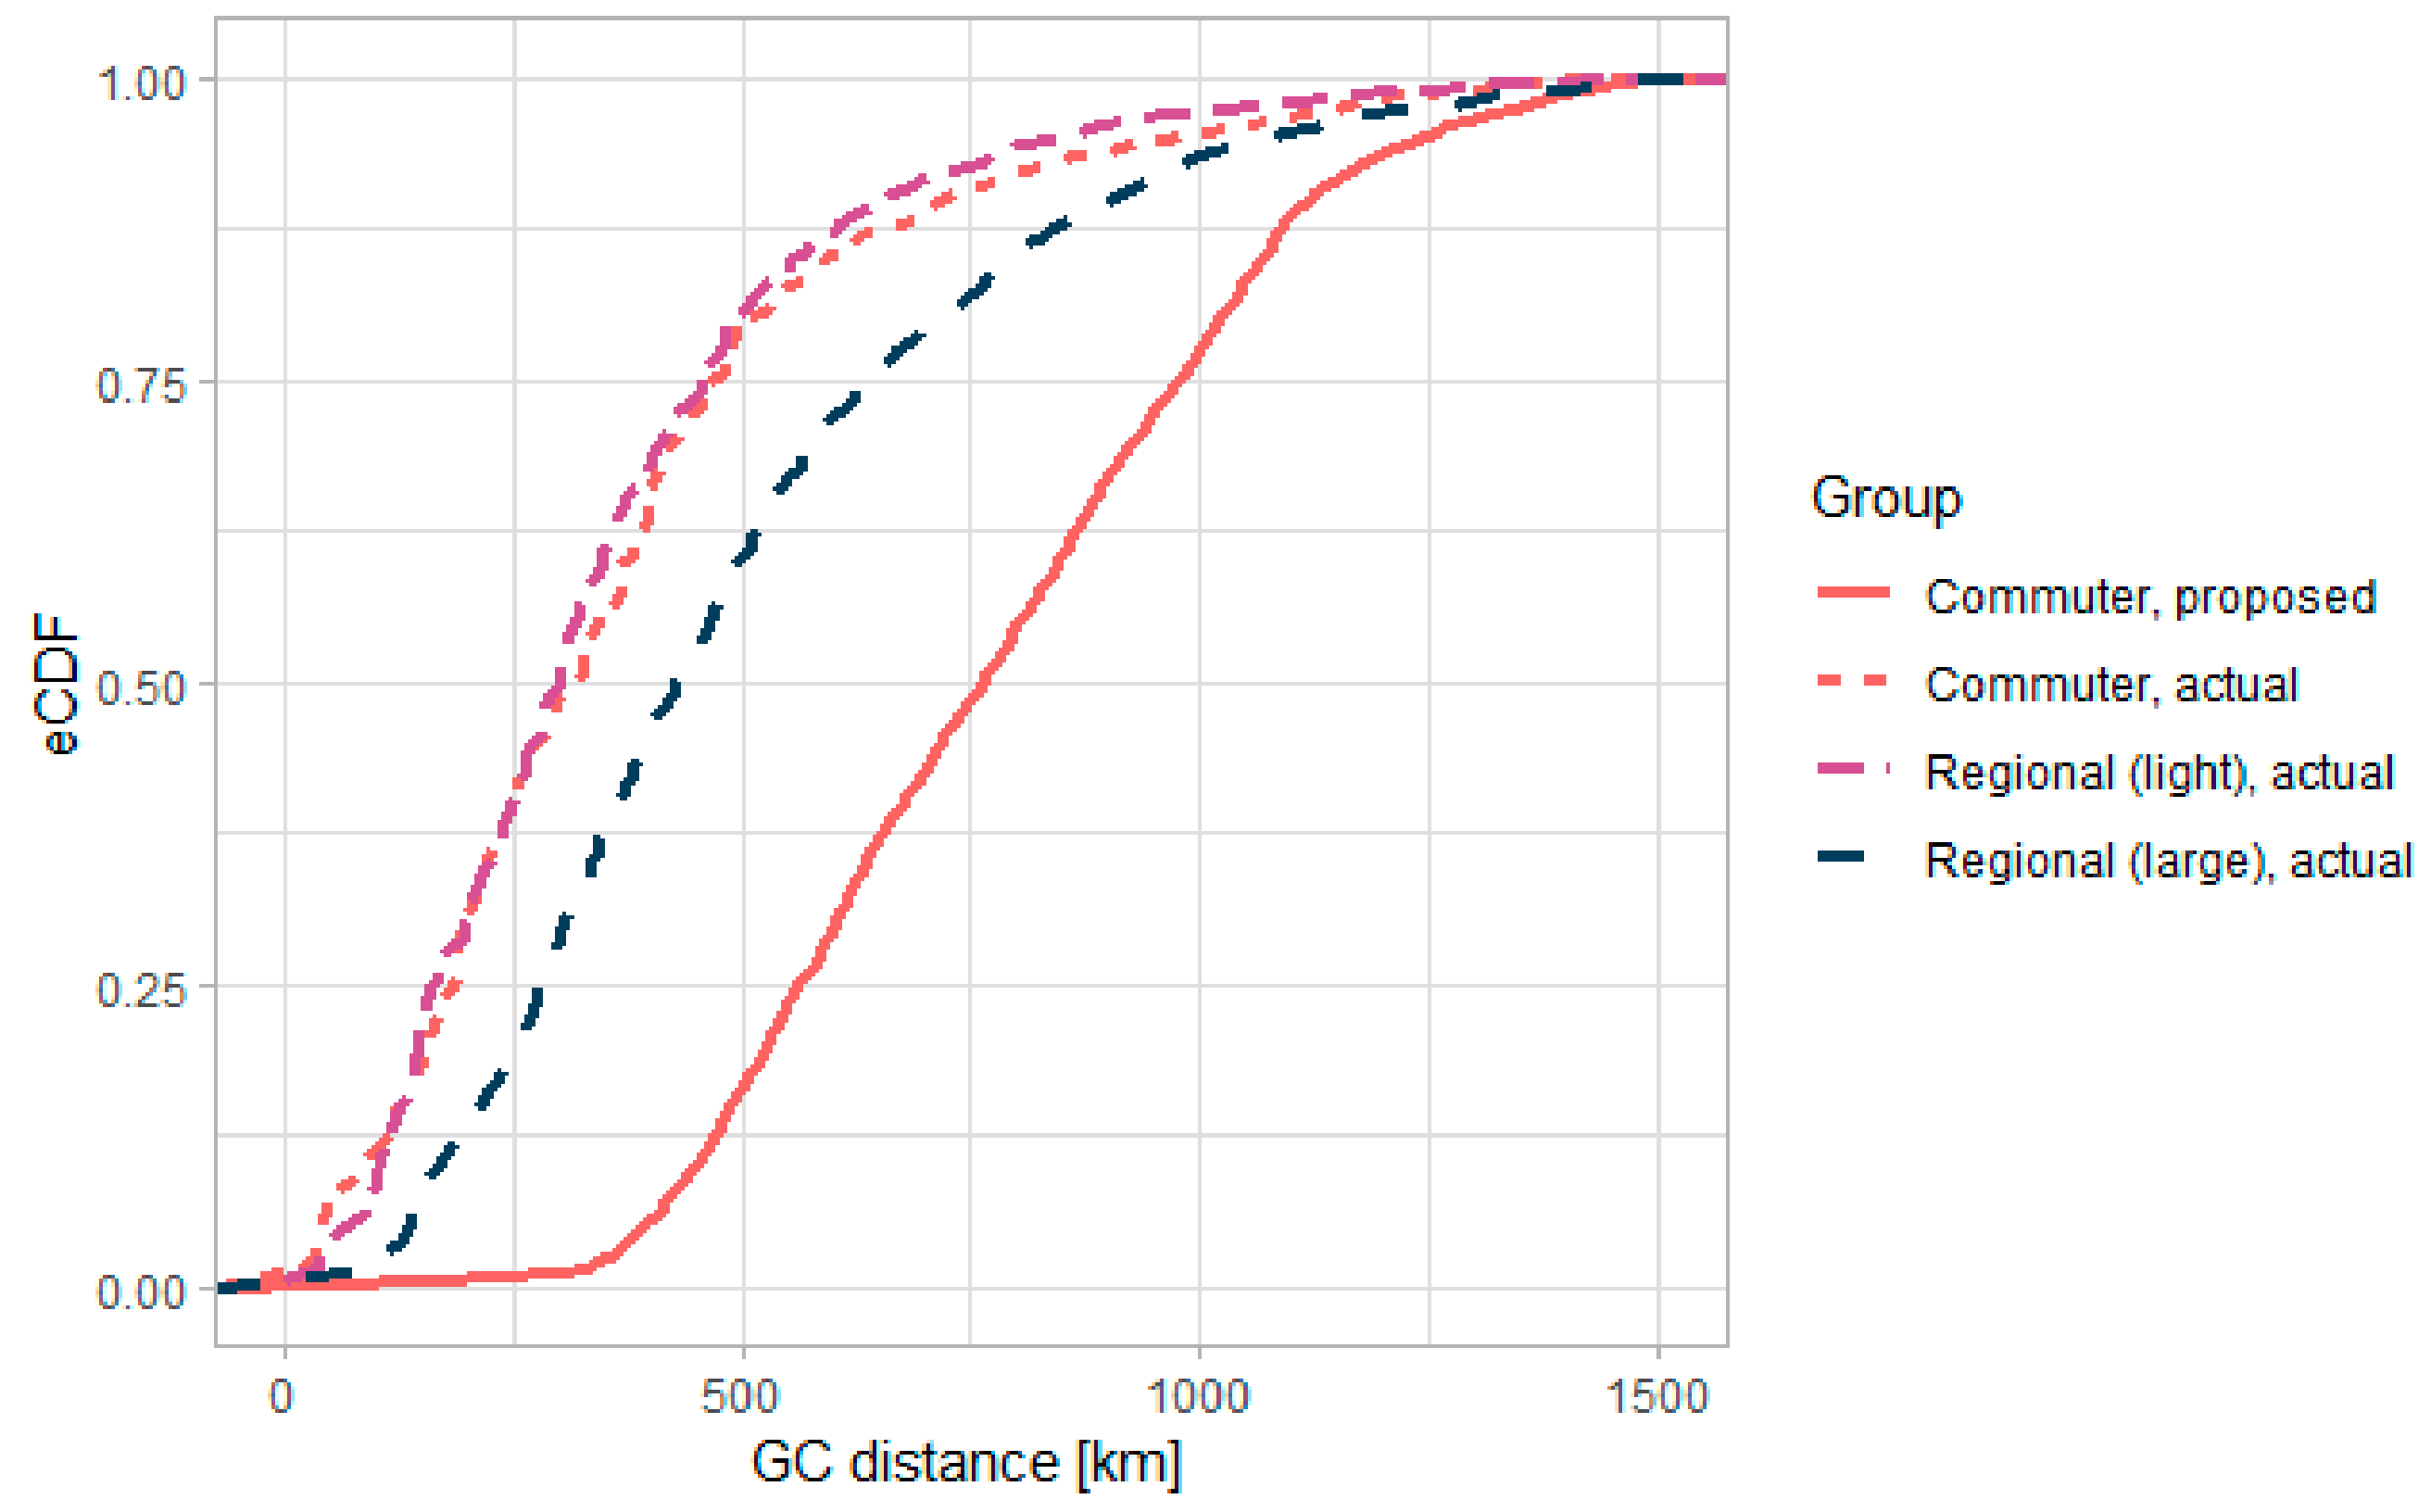
Across the entire spectrum of distances, connections can be found in which travel times can be improved by commuter air services. However, this potential is notably highest for distances between 200 and 950 km. The described distances include the first/last mile transportation. To focus only on the actual flight segment,
Figure 5 presents the accumulated distribution of commuter flight segments between the identified airfield of origin and destination on connections with total travel time benefits of commuters. The data are presented in the context of actual flight distances for commuter, as well as light and large regional aircraft (based on ASM data for 2019 [
19]). To ease comparability, all distances are expressed in GC distance between the airfield of origin to destination without detour factors. It is apparent that the general distribution of the proposed commuter system indicates flight distances which are longer than the current missions of regional air vehicles. For the evaluation of this result, it should be stressed that this manuscript only examined travel times. Under consideration of operating costs, it can be expected that some connections with moderate TTB do not require low-capacity vehicles and might be performed on larger aircraft with lower costs per seat-km.
The GC distance between airfields can be used as an estimation of the resulting flight distances and ultimately for aircraft range requirements. However, for reasons such as the orientation of runways, weather conditions and air traffic congestion, actual routings differ from the shortest possible flight connection. To modulate this, detour factors are applied which should be derived for the individual use cases. Based on the ASM data [
19] an average detour factor of 10.8 % can be assumed for all flights between 500 and 1500 km. Furthermore, a reasonable description of range requirements would also require fulfilling mandatory flight plan reserves. Based on current instrument flight rules (IFR), extra fuel to reach an alternative airport, as well as reserves for 45 min of loitering flight, need to be included [
38]. Assuming common flight and loitering speeds of current commuter aircraft, these reserves would account for a significant share of energy storage.
In this context, it is noteworthy that the majority of connections achieve travel time improvements, which theoretically allows intermediate landings for pooling passenger demand, but also for refuelling. A detailed evaluation of this appears promising for further work.
5.3. Ground Infrastructure
The identified connections were based on an already existing network of airports/airfields and their runway infrastructure in 2022. It was shown that a significantly higher share of airfields that were identified for commuter services would fall behind common TOFL requirements. It was demonstrated that for a set of appropriate airfields, common TOFL requirements could be met and only result in slight increases in travel times. Thus, for the analysed airfields, the TOFL requirements of circa 1200 m are uncritical. However, further aspects that need to be considered are the implications of an increase in traffic. As a first step, all airfields (or airports in this case) that currently operate under slot restrictions, as well as hub airports, were excluded from the analysis for obvious reasons. The integration into current airspace infrastructure is another interesting aspect since aircraft concepts with lower approach speeds are likely to affect the separation of aircraft.
For the current study, a preselection of suitable airfields was already set by applying the characteristics of
Section 3.3. Unpaved runways were excluded as a predominant usage for gliders and aviation sports was assumed. It is fair to assume that these airfield operators would have limited incentives to accommodate a large number of commuter flights or would not invest in substantial passenger infrastructure. On the contrary, a significant number of airfields exist that already operate non-scheduled or regional flights. These airports would be the most likely to be used by the proposed commuter system. In general, the development of sufficient infrastructure would be highly dependent on public acceptance of commuter air traffic. In this context, a significant noise reduction, a general reduction in gas emission, as well as a perceived improvement of connectivity are the main pillars of the envisaged system.
As a last aspect, the shift from traditional airline flights to commuter and regional air services would imply a significant reduction in seating capacity per aircraft and has therefore the potential to increase the number of flights. This affects especially the adequate sizing of the airfield’s aprons. Just to draw a strongly simplified example: An Airbus A320-200 has a seating capacity of up to 186 and occupies at least 1280 m
2 on the ground [
39]. In comparison, a BAe Jetstream 41 has a seating capacity of 29 but occupies at least 352 m
2 on the ground [
40]. This example shows that to accommodate a similar number of passengers, 6-7 regional aircraft would be needed which requires at least twice the apron space of the reference A320. Further considerations should therefore include possible effects that the increase in traffic could have on the entire air traffic infrastructure.
6. Conclusions
This manuscript showed the potential for a revitalisation of regional air services. In this context, electrified commuters could use their characteristics to enable and achieve significant travel time improvements. The analysis showed that improvements were present for large parts of the studied set of distances.
For the aggregated data, it was illustrated that the use cases where commuter services would improve total travel times are characterised by two transition zones. First, at a distance of circa 200 km between the origin and destination, the share of commuters offering the shortest travel times exceeds the share of the previously dominant mode of transportation. Until this point connections had generally the shortest total travel times on road transportation. The second transition zone exists for connections with a distance of circa 950 km between the origin and destination. For connections of 950 km and more, airline services have generally the lowest total travel times. This shows that commuter connections can improve total travel times for connections between 200-950 km. Within this range, commuter connections which replace road trips are most apparent as their travel time benefits are immense (up to 8 h); however, the large majority of commuter connections could replace airline services which include long first/last mile transportation. For these connections, total travel time improvements are still substantial. It should be remembered that these distances cannot directly be translated into aircraft range requirements; however, they offer a profound base to build upon.
Shorter total travel times of commuter services can be primarily traced back to shorter first/last mile transportation, but also to shorter processing times at the smaller airfields compared to international airports. Based on the existing infrastructure of airfields, it was shown that the share of airfields which may not fulfil commuter-typical minimum runway lengths would increase significantly compared to nowadays airports for scheduled services. However, by considering a set of airfields nearby, the availability of sufficient runways can be improved at the cost of a marginal increase in total travel times. Besides the runway infrastructure, it should be considered that a shift of airline passengers to low-capacity air services could cause an increase in traffic volume. This might further stress air traffic systems, as well as require the development of apron and ground-handling facilities.


