Article

Validating Dynamic Sectorization for Air Traffic Control Due to Climate Sensitive Areas: Designing Effective Air Traffic Control Strategies

German Aerospace Center (DLR) Braunschweig, Institute of Flight Guidance, Lilienthalplatz 7, 38108 Braunschweig, Germany
*
Author to whom correspondence should be addressed.
Aerospace 2023, 10(5), 405; https://doi.org/10.3390/aerospace10050405
Submission received: 29 March 2023 / Revised: 14 April 2023 / Accepted: 18 April 2023 / Published: 26 April 2023
(This article belongs to the Special Issue Advances in Air Traffic and Airspace Control and Management)

Abstract

:
Dynamic sectorization is a powerful possibility to balance the controller workload with respect to traffic flows changing over time. A multi-objective optimization system analyzes the traffic flow over time and determines suitable time-dependent sectorizations. Our dynamic sectorization system is integrated into a radar display as part of a working environment for air traffic controllers. A use case defining climate-sensitive areas leads to changes in traffic flows. When using the system, three controllers are assessed in two scenarios: the developed controller assistance system and the work in a dynamic airspace sectorization environment. We performed a concept validation in which we evaluated how controllers cope with sectors adapting to the traffic flow. The solution was rated as highly applicable by the involved controllers. The trials revealed the necessity to adapt the current procedures and define new aspects more precisely. In this paper, we present the developed environment and the theoretical background as well as the traffic scenarios. Furthermore, we describe the integration in an Air Traffic Management (ATM) environment and the questionnaires developed to assess the functionality of the dynamic sectorization approach. Finally, we present a proposal to enhance controller guidelines in order to cope with situations emerging from dynamic sectorizations, including naming conventions and phraseology.

1. Introduction

The sectorization of airspace enables air traffic controllers to guide aircraft in a safe and efficient way. Balanced operational performance, controller workload, procedure design or capacity management as well as territorial aspects are key factors triggering airspace sectorization. Dynamic Airspace Sectorization (DAS) addresses highly variable traffic patterns that demand mid- or short-term airspace adaptations. In this paper, these adaptations are a result of procedures to reduce the climate effects of air traffic, e.g., to avoid contrails.
Therefore, air traffic is redirected to avoid climate sensitive areas [1]. This re-routing of flights leads to a changing traffic distribution. The distribution of traffic may even shift over time with changing climate sensitive areas. Based on the work of the Eco2Fly project to determine climate sensitive areas [2], a sensitive region over the North Atlantic for an exemplary day as well as a time period where the conditions persisted were identified. Within this period, all flights originally crossing this sensitive area were redirected to reduce the climate impacts. The distribution of traffic, thus, changed over time and differed from the original distribution.
In this paper, we show how dynamic sectorization may help to cope with such changing traffic distributions. For the presented human-in-the-loop (HITL) trials, a controller assistance system to apply dynamic sectorization was developed and deployed at the Air Traffic Validation Center of the German Aerospace Center, the Air Traffic Management and Operations Simulator (ATMOS), described in more detail in Section 4.1. For the controller assistance system, a radar display that visualizes information about the time and area of sectorization changes as well as additional flight information was developed.
In our trials, controllers managed air traffic in the Shannon region with the re-routed incoming traffic from the North Atlantic (Oceanic region) in a scenario of 45 min simulation time. This scenario was applied in two simulation runs for each controller. First, the controllers were responsible for a fixed sector affected by the changed traffic pattern. In a second run, the dynamic sectorization changed the sector boundaries dynamically in order to adapt the structure to the traffic flow.
In the following, we give an overview of the applied dynamic sectorization concept, the simulation scenario and the simulation environment used for the presented feasibility study. The main aspects are the experimental setup, the trials and the assessment of the results. We summarize the constraints that have to be met to enable the deployment of dynamic sectorization and propose enhancements to the current instructions.

2. Background

To apply the concept of dynamic sectorization in a real working environment, the concept validation as described in Section 2.1 is followed.
Several approaches adapt or create airspace sectors automatically. Zelinski and Lai [3] as well as Hind et al. [4] compare different methods. DAS is one method to cope with changing traffic patterns in general. A survey of this methodology is given, e.g., in [5]. DAS allows the airspace structure to adapt to the traffic flow. Compared to today’s structure where existing airspace blocks are combined and split in a pre-defined manner, a system implementing dynamic sectorization has a more flexible assignment of airspace to controllers. The aim is to reduce or more evenly distribute the task load among air traffic controllers (ATCO). A brief overview on the methods applied in the presented validation is given in Section 2.2.

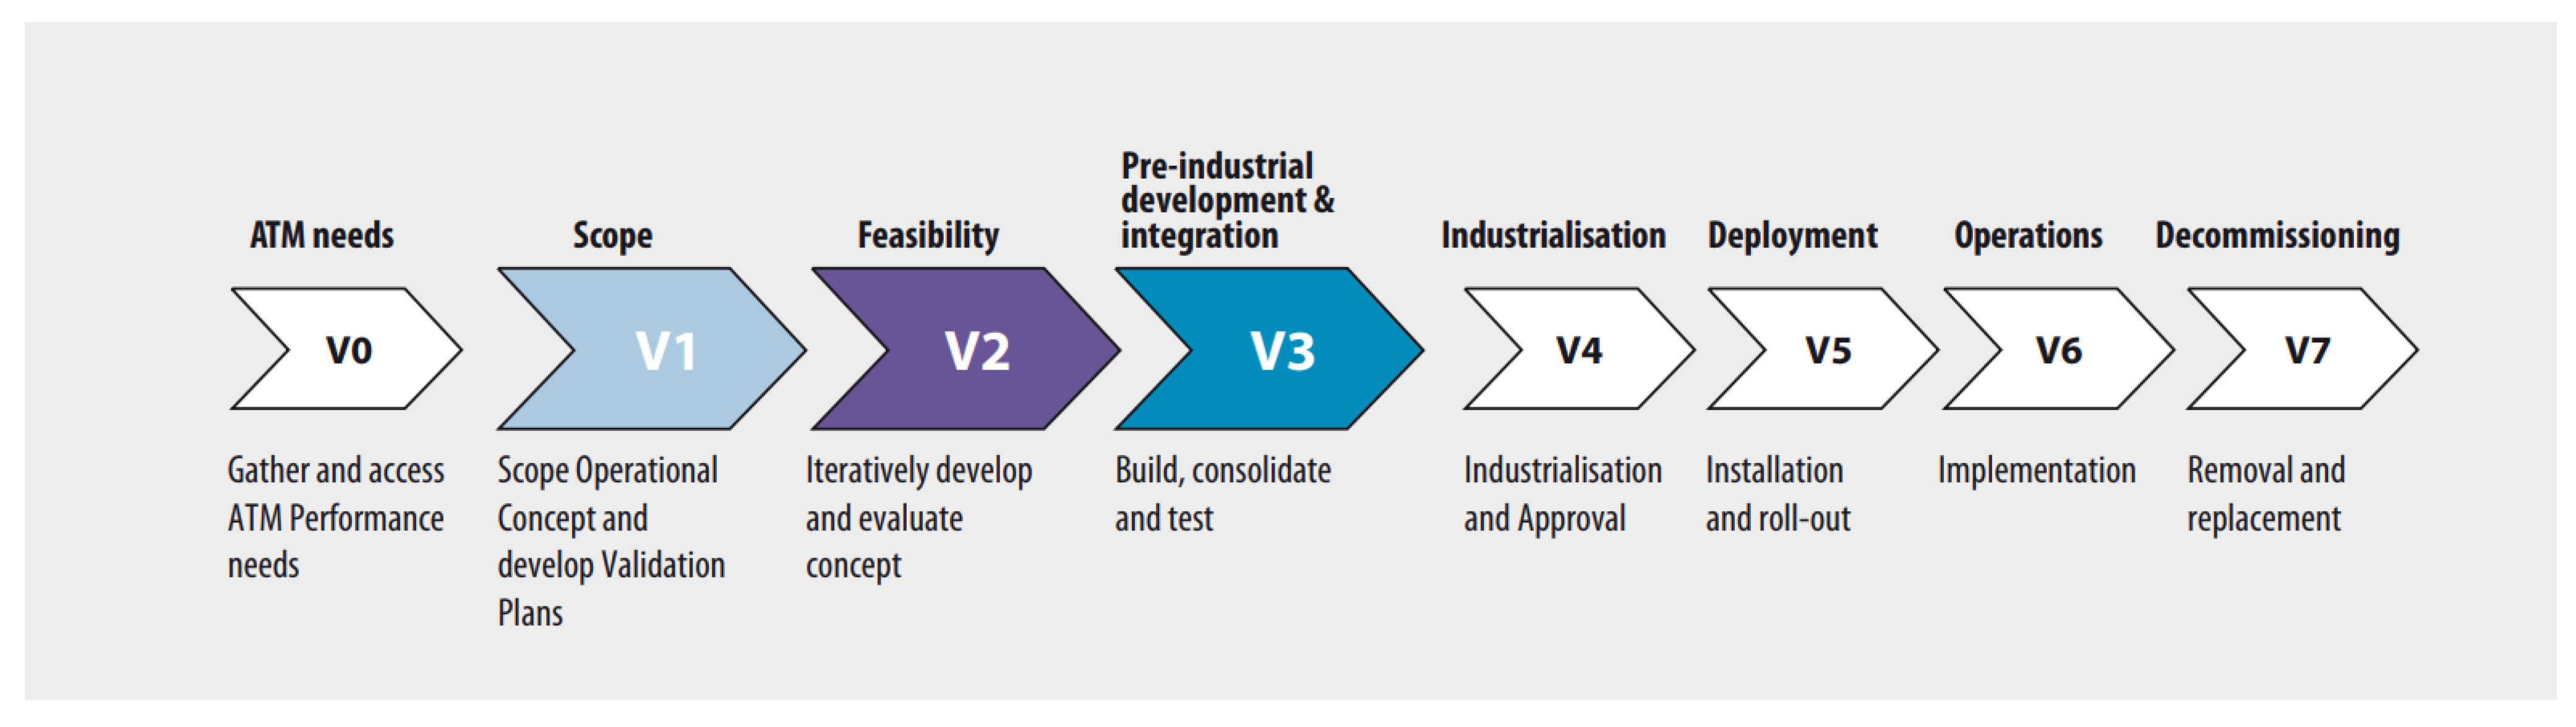
2.1. Concept Validation

Regarding the efficient support to transfer new operational concepts toward implementation in the ATM sector, EUROCONTROL published the European Operational Concept Validation Methodology (E-OCVM) already in its third version in the year 2010 [6]. The manual describes the validation process as one necessary part of the development of a new system leading to identification of the operational needs and establishment of appropriate solutions [6]. Within the system development, different validation phases [V0–V7] are defined; see Figure 1. Those validation phases are related to the technology readiness level (TRL) as defined by NASA [7].
The concept of DAS and the following Air Traffic Control (ATC) trials are located at phase V2 (feasibility study) or TRL3. Feasibility studies have the purpose to develop and explore concept elements until they can be considered as operational feasible [6]. The assessment of operational feasibility depends on the analysis, modeling and simulation of the proposed concept. Therefore, two general steps need to be addressed. First, the operational concept and application need to be described clearly. Second, an exercise plan, including the context, hypothesis, process, tools and metrics, has to be developed. Thereby, consideration and selection of the right validation techniques or tools is crucial.
One choices include real-time simulation techniques, which provide HITL exercises of the proposed concept in a controlled and repeatable environment [6]. Generally, a real-time simulation follows a fast-time simulation, which can be used to quickly narrow down the dependent variables by applying rule-based procedures. Thereafter, in a real-time simulation, the desired concept can be assessed. This enables the collection of data from simulator logs, observer notes, questionnaires and debriefing. In this way, objective and subjective outputs can be collected. Therefore, real-time simulation (HITL) validation techniques were selected for the dynamic sectorization concept in the study.

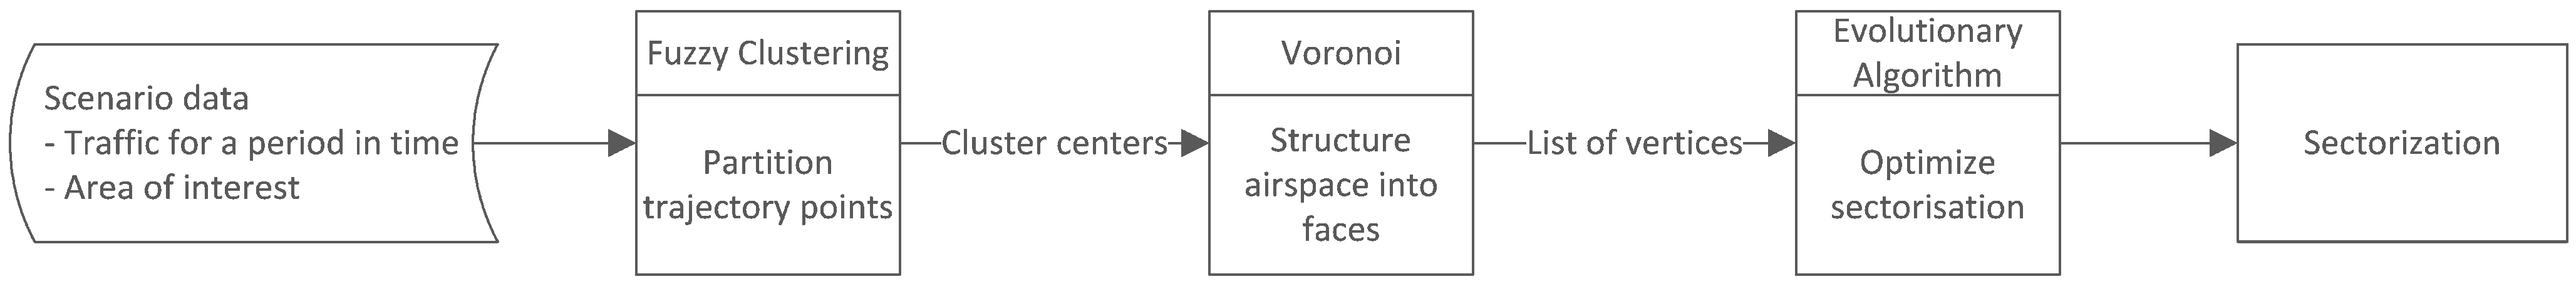
2.2. Dynamic Airspace Sectorization (DAS)

DAS is a flexible method enabling a continuous restructuring of airspace sectors. In contrast to dynamic airspace configuration (DAC) [3,8], no predefined airspace blocks are necessary to build airspace sectors [9]. This section gives a brief introduction to the DAS methodology; see Figure 2. Details are provided in [9,10]. The DAS concept applied in this study uses a three-step approach: aggregation of traffic patterns with fuzzy clustering, generation of a basic sectorization based on Voronoi diagrams and optimization of this structure with evolutionary algorithms (EA). All three methods are described in brief in the following sub-sections and include references to the theoretical foundations and related applications.

2.2.1. Fuzzy Clustering

Fuzzy clustering techniques partition a given data set into data groups and can handle noisy or not well-separated data sets [11]. Each member of the data set is associated by a membership degree to each data group. The membership degrees give information about the ambiguity of a classification and take a specified distance measure into account. Each group or cluster is represented by a cluster center—the so-called prototype, which is the center of gravity of the location of the cluster’s members. Thereby, each member influences the center of gravity according to it is membership degree.
To cluster air traffic trajectories, they are preprocessed in a first step. The trajectories are modified to achieve equidistant trajectory points in the area of interest. This avoids the unbiased influence of different trajectories on the clustering result. A probabilistic variant of fuzzy-c-means (FCM) clustering [12] with the great circle distance as the distance measure is used to cluster the preprocessed air traffic trajectories. FCM, as well as other objective-function-based fuzzy clustering techniques, optimize an objective function by alternately updating the membership degrees and cluster prototypes.
Therefore, the membership degrees and cluster prototypes are calculated alternately until these values do not change significantly from one iteration to the next. The result of the clustering process consists of these centers of gravity of the clusters. For further reading on fuzzy clustering, we refer, e.g., to [13]. For DAS, the trajectory points of the traffic sample are clustered into groups, and the resulting centers of gravity serve as center points for the Voronoi diagram.

2.2.2. Voronoi Diagrams

A Voronoi diagram (cf. [14,15]) is a possibility for structuring a plane—in the present case, the Shannon upper airspace—with a dependence on a certain number of so-called center points into sections where every point belongs to the section with the nearest center point. A Voronoi diagram is then described by a set of edges and vertices. An edge is defined by all points that have the same distance to two center points. Vertices are points that belong to three different center points. An area containing all points with the same nearest point is called a “face”, and the set of all faces can be used to determine a convex hull for this Voronoi diagram. Often this convex hull simply has the form of a rectangle; however, in the case of airspace areas that are taken into account to build the sectors, this cannot be guaranteed.
Therefore, the calculation of the Voronoi diagram—performed with a fortune algorithm [16]—was extended in such a way that it can be adapted to arbitrary boundaries [10]. To start with, the fortune algorithm is applied to the smallest airspace rectangle, including the selected boundary, which is clearly convex. For the creation of an authentic, non-convex boundary polygon, a method based on the “line-segment-intersection” method [14], in combination with the data structure of doubly connected edge lists (DCEL), was used. The endpoints of edges crossing the boundary polygon are than substituted by the break points with the boundary, new edges between these break points are added, and edges outside the boundary are removed.
For this study, a set of two main Voronoi diagrams was calculated with reference to the air traffic distribution (position data) at the beginning and the end of the selected time interval of one hour. To smooth the transition between these diagrams, two additional diagrams were calculated where the vertex positions were combined values from the main diagrams. The coordinates of the first additional diagram were calculated with two thirds of the first and one third of the second main diagram and, for the second, vice versa. These interim diagrams were inserted between the first and the second main diagram. These initial sectorizations were then further optimized by an EA as described in the next section.

2.2.3. Evolutionary Algorithms (EA)

The principles of EA follow the evolutionary theory from biology (cf. [17,18]) where a group of individuals mixes their genetic material coded in chromosomes. This results in a better chance of survival in a hostile environment through a higher degree of adaptation. For an EA, a population with a predefined number of solutions for an artificial problem is created, where each solution is a sequence (chromosome) of parameters (genes) describing a possible problem solution.
As in nature, new solutions can be created by mixing the genetic information of two chromosomes (so-called crossover) and/or mutating some genes of a single chromosome. To guarantee the “survival of the fittest”, an evaluation function has to be defined that rates each solution and supervises the selection of the fittest chromosomes for the next generation. These will undergo the evolutionary operator crossover and mutation again until an appropriate solution is found. This process is normally performed for a fixed number of generations or a for a prescribed distance of the evaluation value to a known solution.
EA are used in several aviation-related research fields, such as network planning [19], airline crew pairing [20] and aircraft boarding [21,22]. An approach to apply genetic algorithms to dynamic airspace configuration (DAC) was presented in Sergeeva et al. [23]. Within the following paragraphs, the EA with a problem-specific adaptation is described in short, including the search space, evolutionary operators and the evaluation function. The EA is applied to the main and the interim diagrams in a slightly different way where the mutation of the vertex position is concerned.
As the vertices are the backbone of the Voronoi diagram, defining it is structure, they are used directly as genes for the chromosomes together with the original structure described in a DCEL. Therefore, each chromosome represents a complete sectorization determined by the structure of the Voronoi diagram. The fitness of a chromosome is then evaluated with respect to the amount and distribution of the controller workload, the outline of the sectors and the dissection of the trajectories by the sectorization.
For the application of the EA, the vertices for the observed airspace with a non-convex boundary as described in Section 2.2.2 are divided into two groups: one with all vertices on the boundary and one with all vertices within the airspace area. The mutation operator for the boundary vertices is restricted to boundary points by using a percent value of the distance of the position on the boundary in relation to a boundary starting point instead of coordinates.
The general structure of the selected EA is based on the modGA introduced by Michalewicz [17], where the chromosomes are divided into groups with different purposes. It is especially designed to prevent so-called super-individuals (high-rate chromosomes) from overtaking the population in the start phase. For this, three groups of chromosomes are created for each generation, where the chromosomes of the first group are all different, remain unchanged and include a certain number of best chromosomes. The chromosomes of the second group undergo the crossover operator, whilst the chromosomes of the third group are mutated. Thus, crossover is responsible for composing new solutions from existing ones, and the mutation operator performs small steps to improve the solution by slightly moving a waypoint.
For the evaluation function, the following factors described in [10] were used:
  • Sum of the task load over all sectors.
  • Standard deviation of the task load between sectors.
  • Standard deviation of the interior angles (the angles between successive edges).
  • Number of flight intervals (partition of flights by sectors) over all sectors.
  • Closeness of vertices (VC, optional, in case interim diagrams are in use).
With this selection of evaluation parameters, the problem can be seen as a multi-objective optimization problem, as stated by Zou et al. [24]. Whilst 1. and 2. are directly connected to the task-load-distribution problem (balanced work flow for airspace controllers), 3. and 4. are used to ensure an operationally relevant (more “usable”) sector layout. The calculation of the task load was conducted following a list of relevant tasks and their assigned time values [10]. To avoid the influence of incomparable value ranges for the different factors of the evaluation function, a combined function using a ranking approach where the influence factors are weighted [25] was developed. The result of the EA is a sectorization for the defined area and time frame.

3. Scenarios

To test the DAS approach in HITL trials, two scenarios were defined. Flight data of both scenarios were based on EUROCONTROL’s demand data repository (DDR2) [26] for the same day. As the area of interest, the Shannon area over Ireland was selected due to the main traffic flow and the climate assessments presented in [27]. The filtered scenario data include all flights that passed the Shannon area in an altitude above FL300; see Figure 3. In the HITL simulations, each of the controller trials ran for 45 min. Therefore, one hour of traffic data was selected as basis for the scenarios. Both scenarios cover the time from 0600 to 0700 UTC, when part of the eastbound traffic flow passes through the selected Shannon area. All flights that occupy this geographic region at some point in the selected periods are included in the scenarios.
In the baseline scenario, the traffic was conducted as recorded in the historic data, whereas a climate-sensitive area over the North Atlantic was defined as a restricted area for a certain time for the climate-sensitive scenario. The restricted area was selected according to climate impact assessments of the Eco2Fly and WeCare projects [1,27,28,29]. In [27], the climate impact was calculated based on the data of 26 March 2014. On that day, there were relatively high H2O and O3 concentrations in the North Atlantic region in heights corresponding to the typical altitudes of air traffic over the North Atlantic. The climate-sensitive traffic scenario was designed to apply trajectories avoiding this area for the defined period of time.
In addition, the principles of traffic organization over the North Atlantic were applied. In general, North Atlantic air traffic is performed mainly on an Organized Track System (OTS): North Atlantic Tracks (NAT). NATs are selected on a daily basis and are based, e.g., on the location of jet streams, airspace restrictions and airlines’ preferred route messages. There are two major traffic flows on NATs: an eastbound flow departing from North America and arriving in Europe early in the morning as well as a westbound flow departing from Europe in the morning and arriving in North America in the afternoon. The OTS helps to effectively separate the aircraft by time, altitude and latitude in the oceanic region where no radar surveillance is provided [30]. ICAO defines the required separation minima in [31].
The climate-sensitive area affects one North Atlantic track; see Figure 3. For the climate-sensitive scenario, flights are re-routed either to a Northern or Southern track depending on their original exit point out of the Shannon area so that the resulting route is as short as possible. Since the main focus of this scenario was to avoid contrails in a climate sensitive area, slightly longer routes that may lead to minor additional fuel consumption were accepted in this scenario. The resulting traffic data for both scenarios and the Shannon boundary as the area of interest were fed into the simulation environment as illustrated in Figure 3.
To allow controllers to assess the DAS independently of their familiarity to current sector structures, a fixed sectorization for the baseline scenario with the same algorithms that were used in the climate sensitive scenario was calculated. The dynamic sectorization system determined two basic sectors in the Shannon area; see the main sectorization 0 in Figure 4a and the main sectorization 1 in Figure 4b. In the baseline scenario, the sectorization did not change over time whereas the sectorization of the climate sensitive scenario adapted three times during the simulation time to the changing traffic flow.
Between the two main sectorizations, two interim sectorizations were calculated as illustrated in Figure 4a,b to ensure a smooth transition between the main sectorizations. Although the dynamic sectorization system is capable to adapt to predicted changes in the traffic flow in real time; see Section 2.2 and [9,10], the sectorizations used in the HITL trials were calculated in advance to ensure the same conditions for all controllers. The following assumptions apply to the climate sensitive scenario:
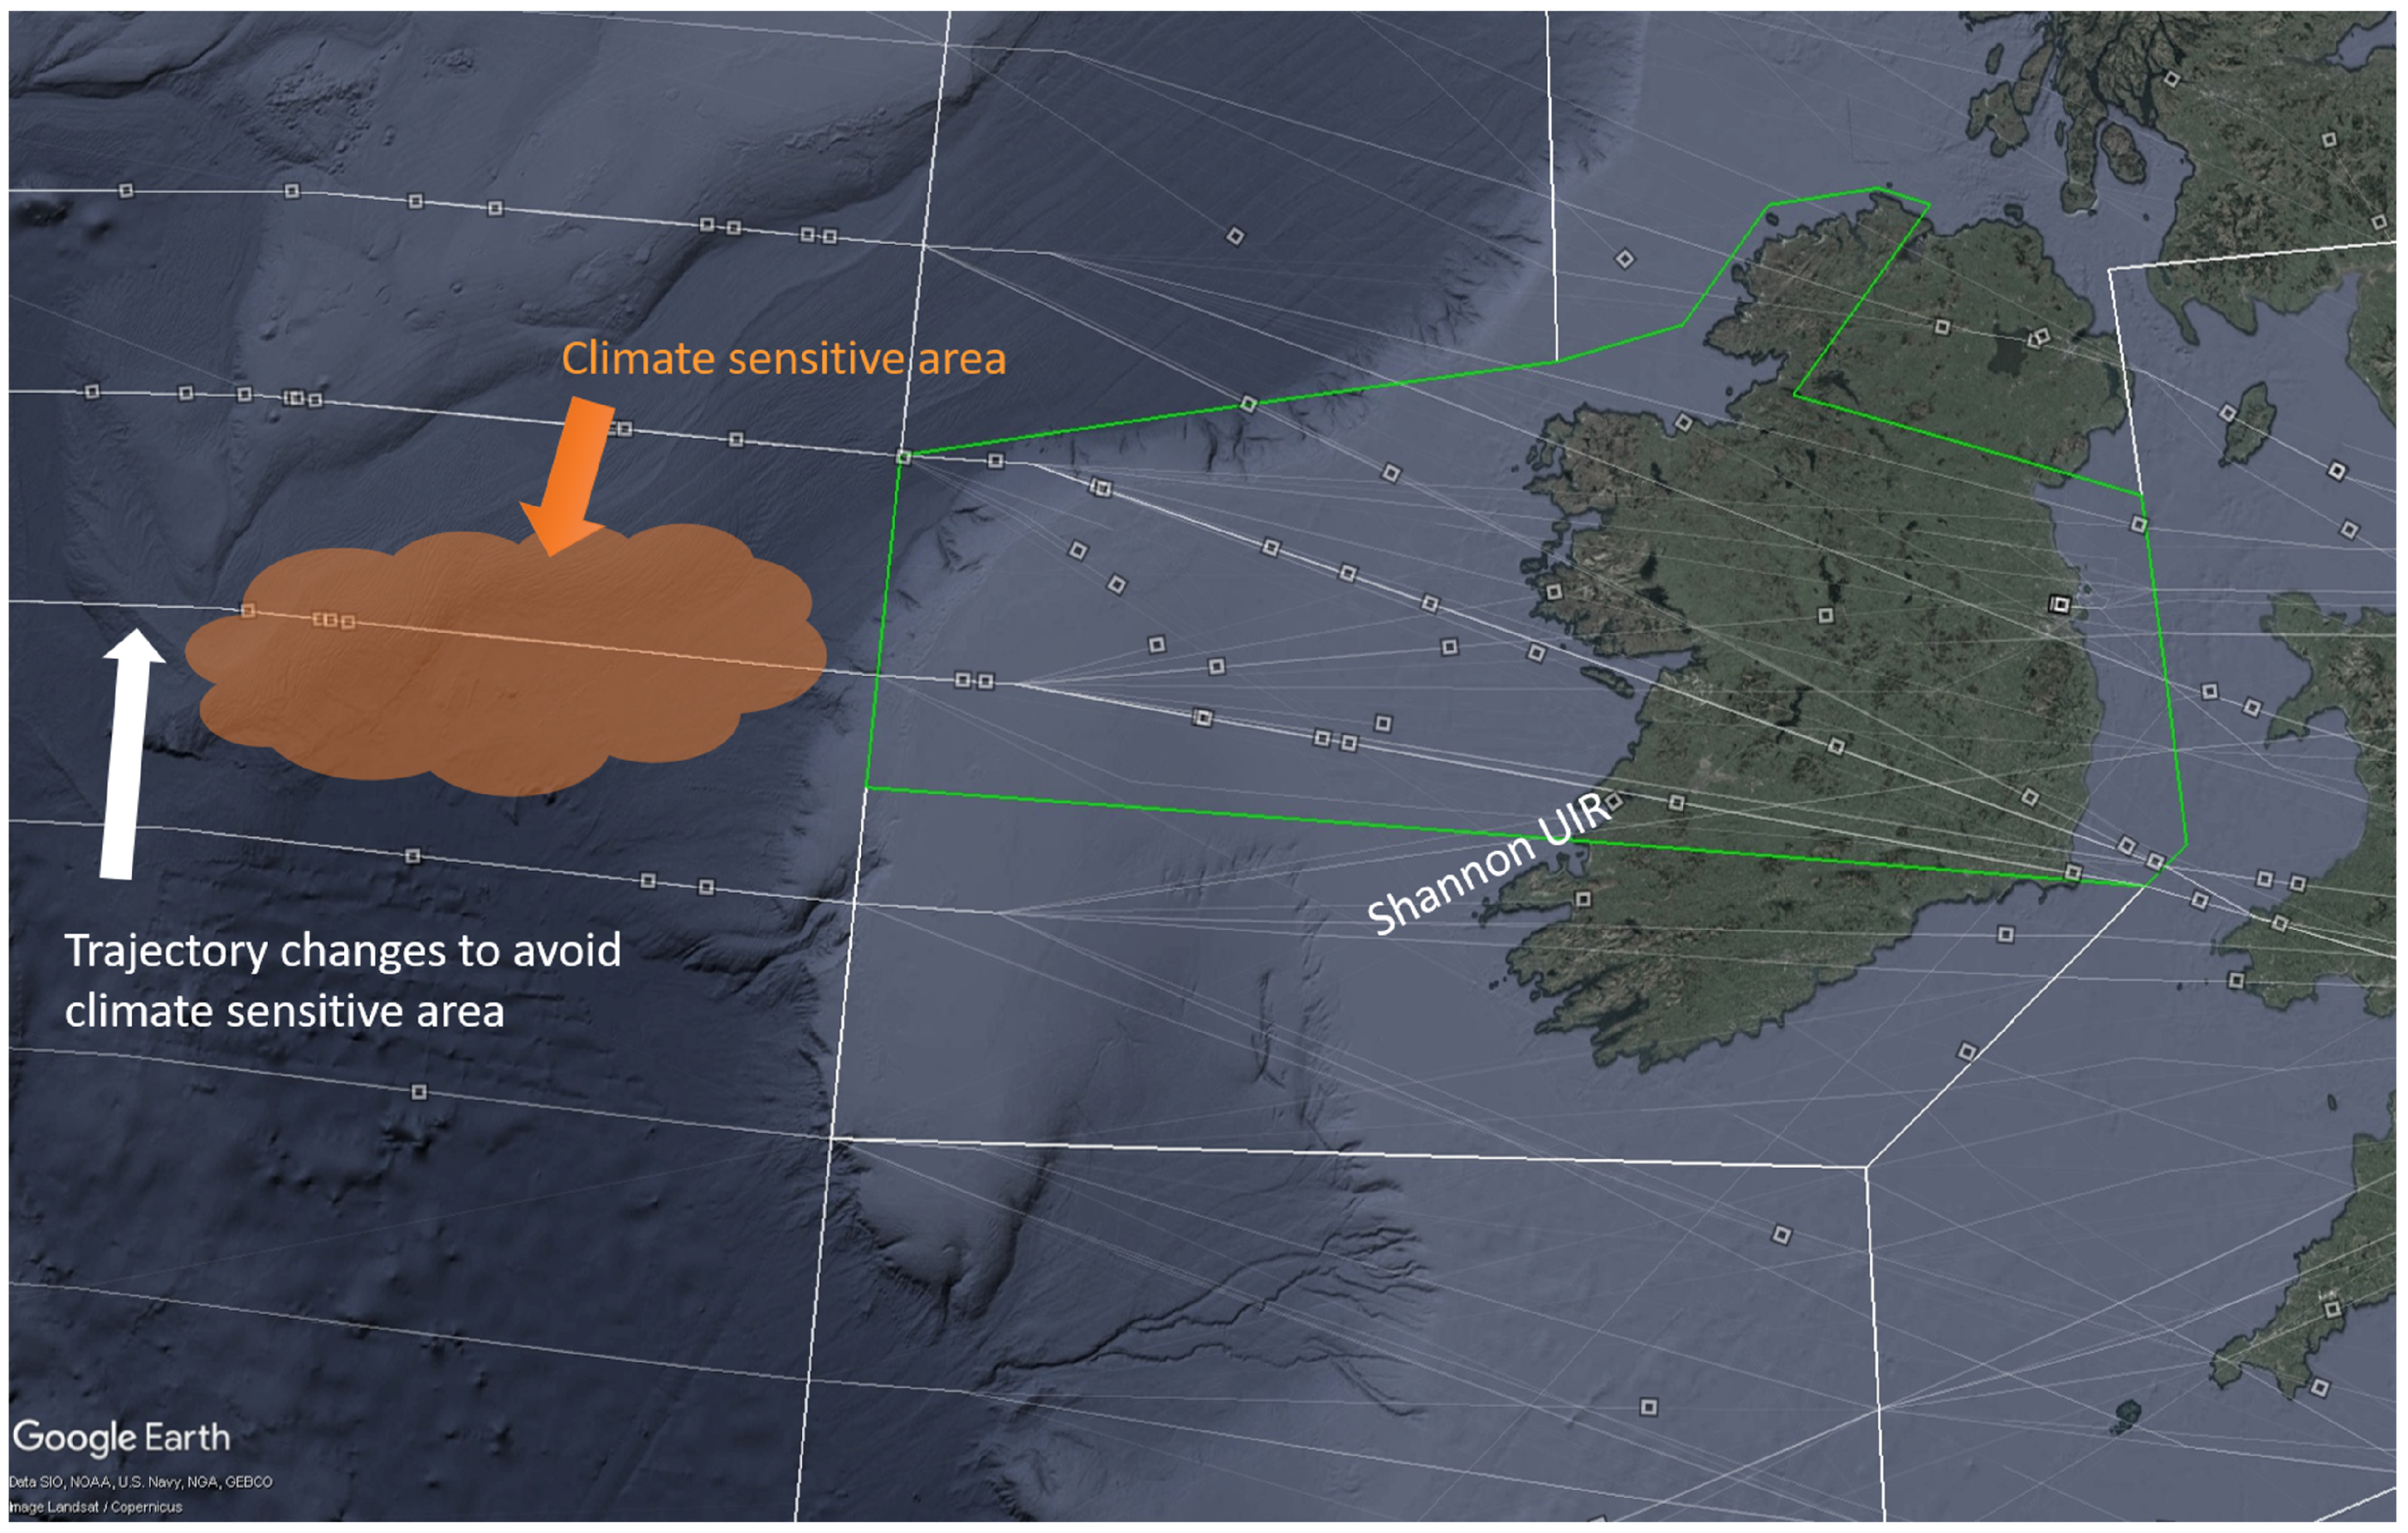
  • A climate sensitive area evolves west of Ireland in the morning in the altitude of en-route transatlantic flights.
  • Based on a prediction, the area is declared as a climate sensitive area from 0600 UTC.
  • Flights originally planned to enter this area after that time are re-routed to reduce the climate impacts.
  • Re-routed flights still follow the North Atlantic Tracks but on different paths.
  • To demonstrate the capabilities of the dynamic sectorization, only horizontal re-routings are applied.

4. Methodology

The applied methodology reflects the tool chain used to perform the ATC trials. The concept of DAS was applied, see Section 2.2 or [9], in simulations with ATCOs in the ATMOS. The sectorizations adapted to the changed traffic situations are provided by the Dynamic Airspace Sectorization System (DASSy). NLR’s Air traffic management Real-time SIMulator (NARSIM) [32] models aircraft behavior and is integrated in ATMOS. To assist controllers in handling aircraft, a controller display and assistance system (CoDiST) was developed and connected to NARSIM.
The tool chain is completed by a simulation pilot interface allowing participants to operate aircraft as advised by controllers. Each of these systems applies different methodologies. An overview of the connection among the systems is given in Figure 5a. In addition to this simulation environment, the scenario integration and the evaluation concept are major parts of the HITL experiments. All three are described in the following sections.

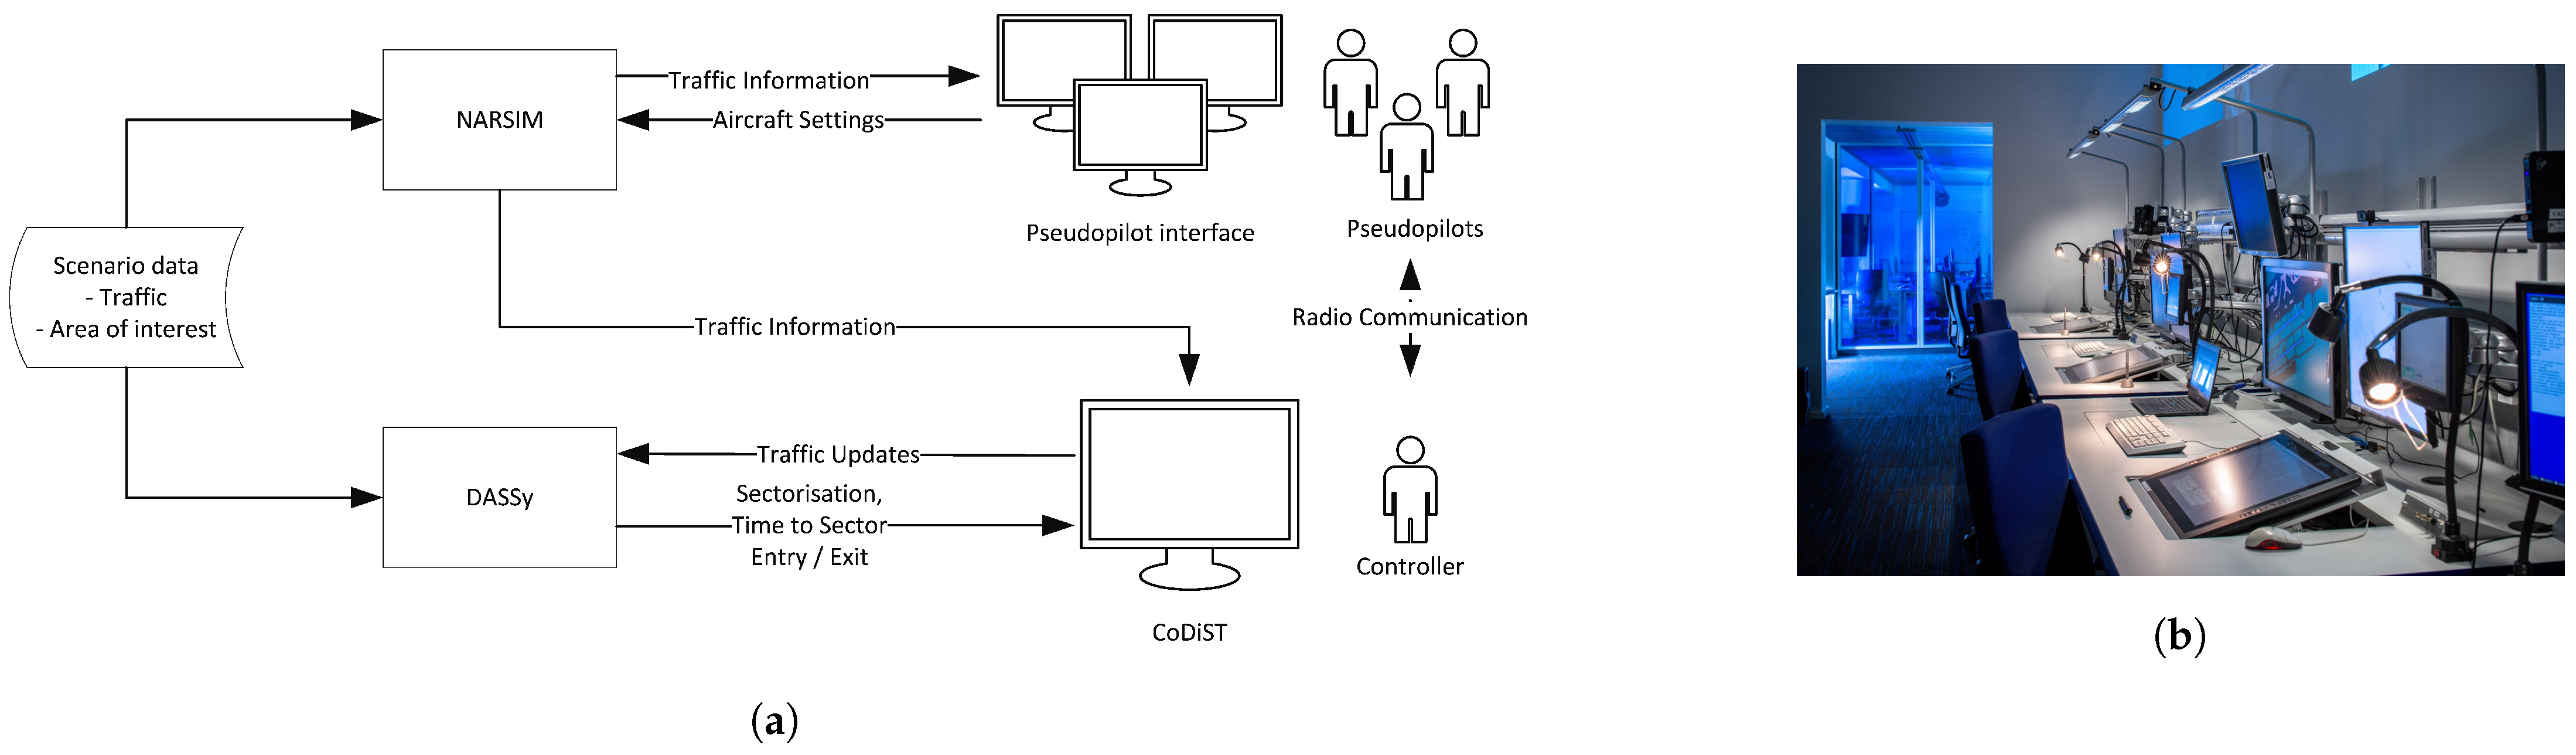
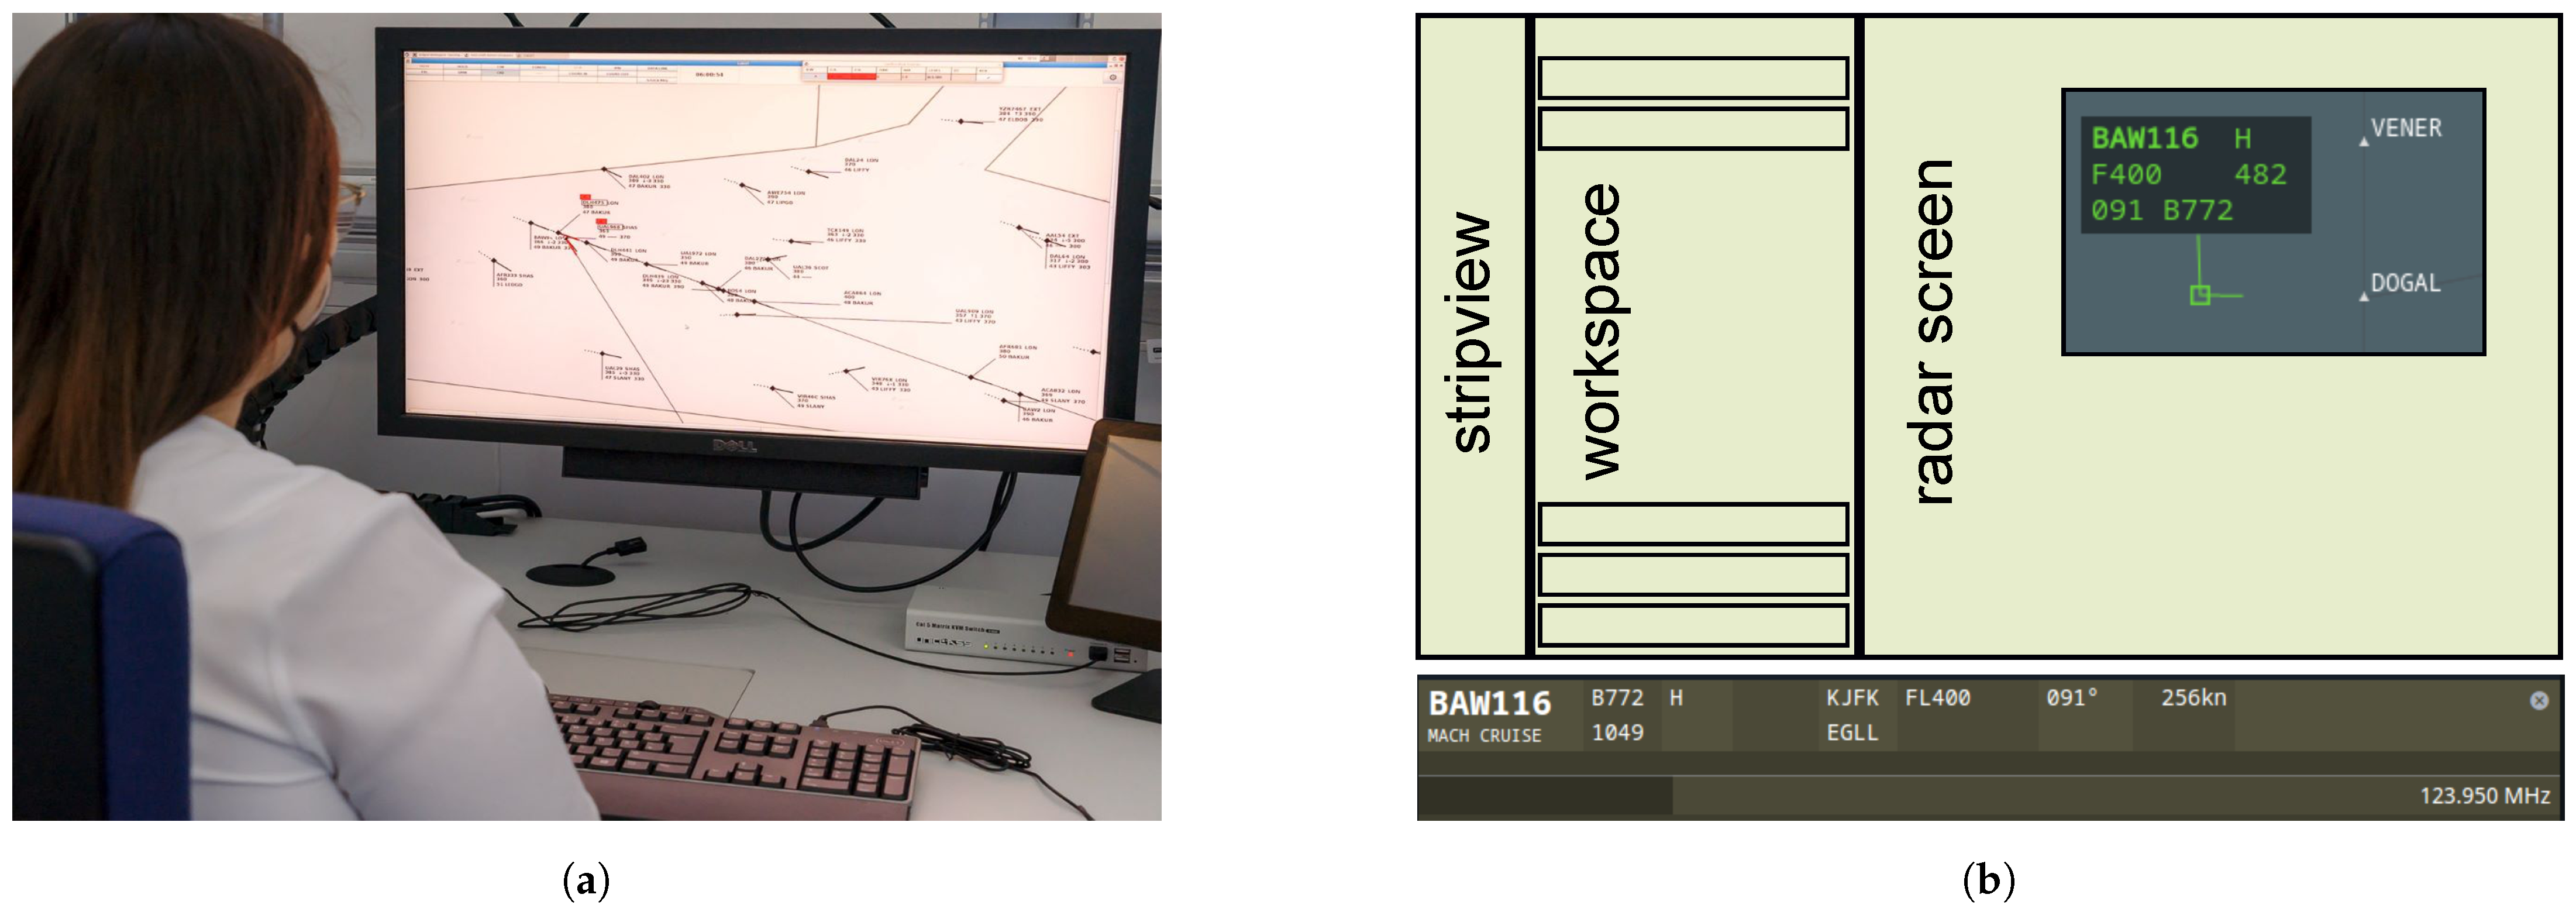
4.1. Simulation Environment

A feasibility study of the described concept of DAS in context with contrail avoiding trajectories requires a detailed modeling of the airspace and aircraft movements. Therefore, the ATMOS of the DLR Air Traffic Validation Center [33] was selected for this task. It provides freely configurable controller working positions (CWP) with interfaces to the air traffic processes. The controller is connected via a simulated radio connection with so-called simulation pilots, who are responsible for controlling the simulated aircraft. Thus, it is perfectly suited as a validation environment for the intended study. When it is necessary to adapt trajectories to avoid contrail problems, the traffic distribution may change and, with this, also the task-load distribution for the actual sectorization. For the creation of a new sectorization adapted to the changed traffic situation DASSy was developed.
Figure 5b gives an impression of the ATMOS environment. In the foreground on the right side, three CWPs with a radar screen, electronic flight strips (integrated in the tabletop) and several support tool screens can be seen. The briefing room is located behind the first glass door. It is joined by the simulation pilot room at the end. NARSIM [32] is the air traffic engine and base system for the ATMOS platform and a high fidelity HITL simulator, which is used by various stakeholders in the air traffic management community. It models the performance of the air vehicles based on the Base of Aircraft Data (BADA) of Eurocontrol [34], which is a comprehensive data source for aircraft performance modeling available for research.
In the simulation trial, the focus was placed on a new developed controller interface, supporting the dynamic sectorization with additional information displayed to the controller. For the presented feasibility study of DAS within Eco2Fly, a controller display capable of working with adapted sets of airspace sectors was needed. As this is an unusual requirement, a new display called CoDiST was developed. To ensure that the feedback of the controllers participating in the validation trials was not influenced by an unsuitable or unfamiliar radar screen, the designed radar display resembled typical controller displays as closely as possible. Therefore, the controller displays of several air navigation service providers were analyzed for the most important features desired by the controllers, and these were implemented into CoDiST:
  • Label interaction and deconfliction.
  • Short- and medium-term conflict detection, prediction and visualization.
  • Conformance monitoring and trajectory adaptation.
  • Flight status color.
  • Velocity/speed vector and track history.
  • Mouse control (zoom/movement of visible airspace area/selection of flights or interactions).
  • Elastic vector/probe trajectory/graphical route modification.
  • Restricted areas.
  • Range/heading calculation and calculation of the actual and expected minimal distance between flights.
The general design approach was inspired by different display systems used by European ANSPs. Some functionalities, such as Controller Pilot Data Link Communications (CPDLC), coordination dialogue and the display of weather contours, were not implemented because they were not part of the validation exercise. Figure 6a displays an example of CoDist integrated in the ATMOS simulation environment and the simulation pilot interface.
CoDiST is capable of handling different sets of sectorizations within a selected airspace boundary. For this, every sector is tagged with a validity time interval, and CoDiST always presents the appropriate sectors with a dependence on the actual time. In addition, the next sectorization is depicted as a dashed line in an unobtrusive color. When the sectorization changes, CoDiST calculates the overlapping part between the new sectors and the currently active sector, called the main sector. Automatically, the new sector with the highest share of airspace to the current sector is selected as the next main sector.
For controller support, CoDiST can display a separate line below the flight label. In the trials, this line was used to show the actual entry or exit times with respect to the actual and next sectorizations to support the handling of changing sector boundaries. In this line information sent by DASSy is the actual time for entering or leaving the main sector, and the similar time for the next sectorization is presented to the controllers.
Simulation pilots are provided with a separate display, the so-called IRIS. IRIS displays give an overview of the air traffic situation and allow pilots to handle aircraft within the sector while speaking to ATC. IRIS consists of three main components: stripview, workspace and radar screen; see Figure 6b. The stripview is located on the left side listing all aircraft within the airspace that are using the same frequency as ATC. In addition, the callsign, aircraft type and destination airport are indicated. The so-called workspace is located right next to the stripview.
Simulation pilots can double click on the desired aircraft within the stripview to receive the corresponding flight strip in the workspace. The complete flight strip displays all performance information, such as the Mach and calibrated airspeed, current heading and flight level, for the selected aircraft. Simulation pilots can control the aircraft’s behavior by giving commands with short cuts via the flight strip. The third component is the radar screen, located on the right side of IRIS. This component serves as an overview of the current traffic situation for the simulation pilots and allows planning for further actions. In the following, a brief overview on how the controllers and simulation pilots work together is given.
Depending on the traffic situation and traffic flow, simulation pilots normally control up to five aircraft simultaneously. While ATC is ensuring a safe and efficient guidance through the sector, simulation pilots have to follow their instructions regarding changes in the flight path, flight level or speed advisories. The communication is conducted according to the defined phraseology by ICAO [35] via simulated voice over IP (VoIP) connection. Thereby, the full readback and order of instructions is taken into account.

4.2. Scenario Integration into the Simulation Environment

For the HITL simulation trials, the developed scenarios described in Section 3 had to be implemented within the simulation environment. Since the NARSIM software is a generic air traffic engine, it is necessary to transfer and implement two main components. First, the airspace structure was modeled based on open access data that are published in aeronautical information publications [36], including all considered waypoints, sector boundaries, frequencies and airspace restrictions. Second, a flightplan was implemented for both traffic scenario samples.
Within the flightplan, every aircraft holds a parameter “body”, containing aircraft information, including all necessary aircraft parameters for simulation. The parameters range from the callsign, aircraft type and wake vortex category up to initial latitude and longitude coordinates, flown speed and route points. The latter correlate to predefined waypoints within the airspace structure. In addition to the aircraft parameters, the used radio frequency is defined within the flight plan. The frequency fulfills an important role regarding the communication between the different displays. Finally, for each provided traffic sample, a flight plan was defined in Extensible Markup Language (XML).

4.3. Evaluation Concept

The HITL simulation trials were scheduled into two different simulation runs for each ATCO. Each simulation run had a duration of 45 min, based on the developed simulation scenarios; see Section 3. Thus, in total, each of three ATCOs simulated both simulation runs in one day. This comparable small amount of ATCOs was used to first assess the feasibility of the concept. The next step was to extend the test group.
During the simulation runs, different data were collected to evaluate the concept. On the one hand, the simulator collected data for each aircraft for every second. During the post-analysis, these simulation data allowed for analysis of the ATCO performance on workload and safety, including the number of separation violations and flown distances. For separation analysis, a minimum separation of 2000 ft vertical and 7 NM lateral was applied. These high values were used to provoke the detection of conflicts because the traffic scenario was generated from real traffic data, which were already separated according to the ICAO standard by ATCOs.
On the other hand, different questionnaires were used to receive and collect qualitative ATCO feedback on the principle of dynamic sectorization as well as on the developed controller assistance system. This feedback was the main focus of the simulation runs. Two different questionnaires were used. After each simulation run, the so-called Post Run Questionnaire (PRQ), and, after the whole simulation day, the so-called Post Exercise Questionnaire (PEQ), were handed to the ATCO.
In principle, questions regarding the concept feasibility and safety aspects were posed, with a five-point Likert scale for the answers [37]. The answer possibility within the five-point scale depended on the posed question; see Table 1. For the first seven question from PRQ, the scale ranged from strongly disagree to strongly agree. Table 2 lists the included questions for PRQ and PEQ. These were mainly closed questions. As addition, open questions were also posed to gather qualitative feedback from ATCOs.

5. Results and Discussion
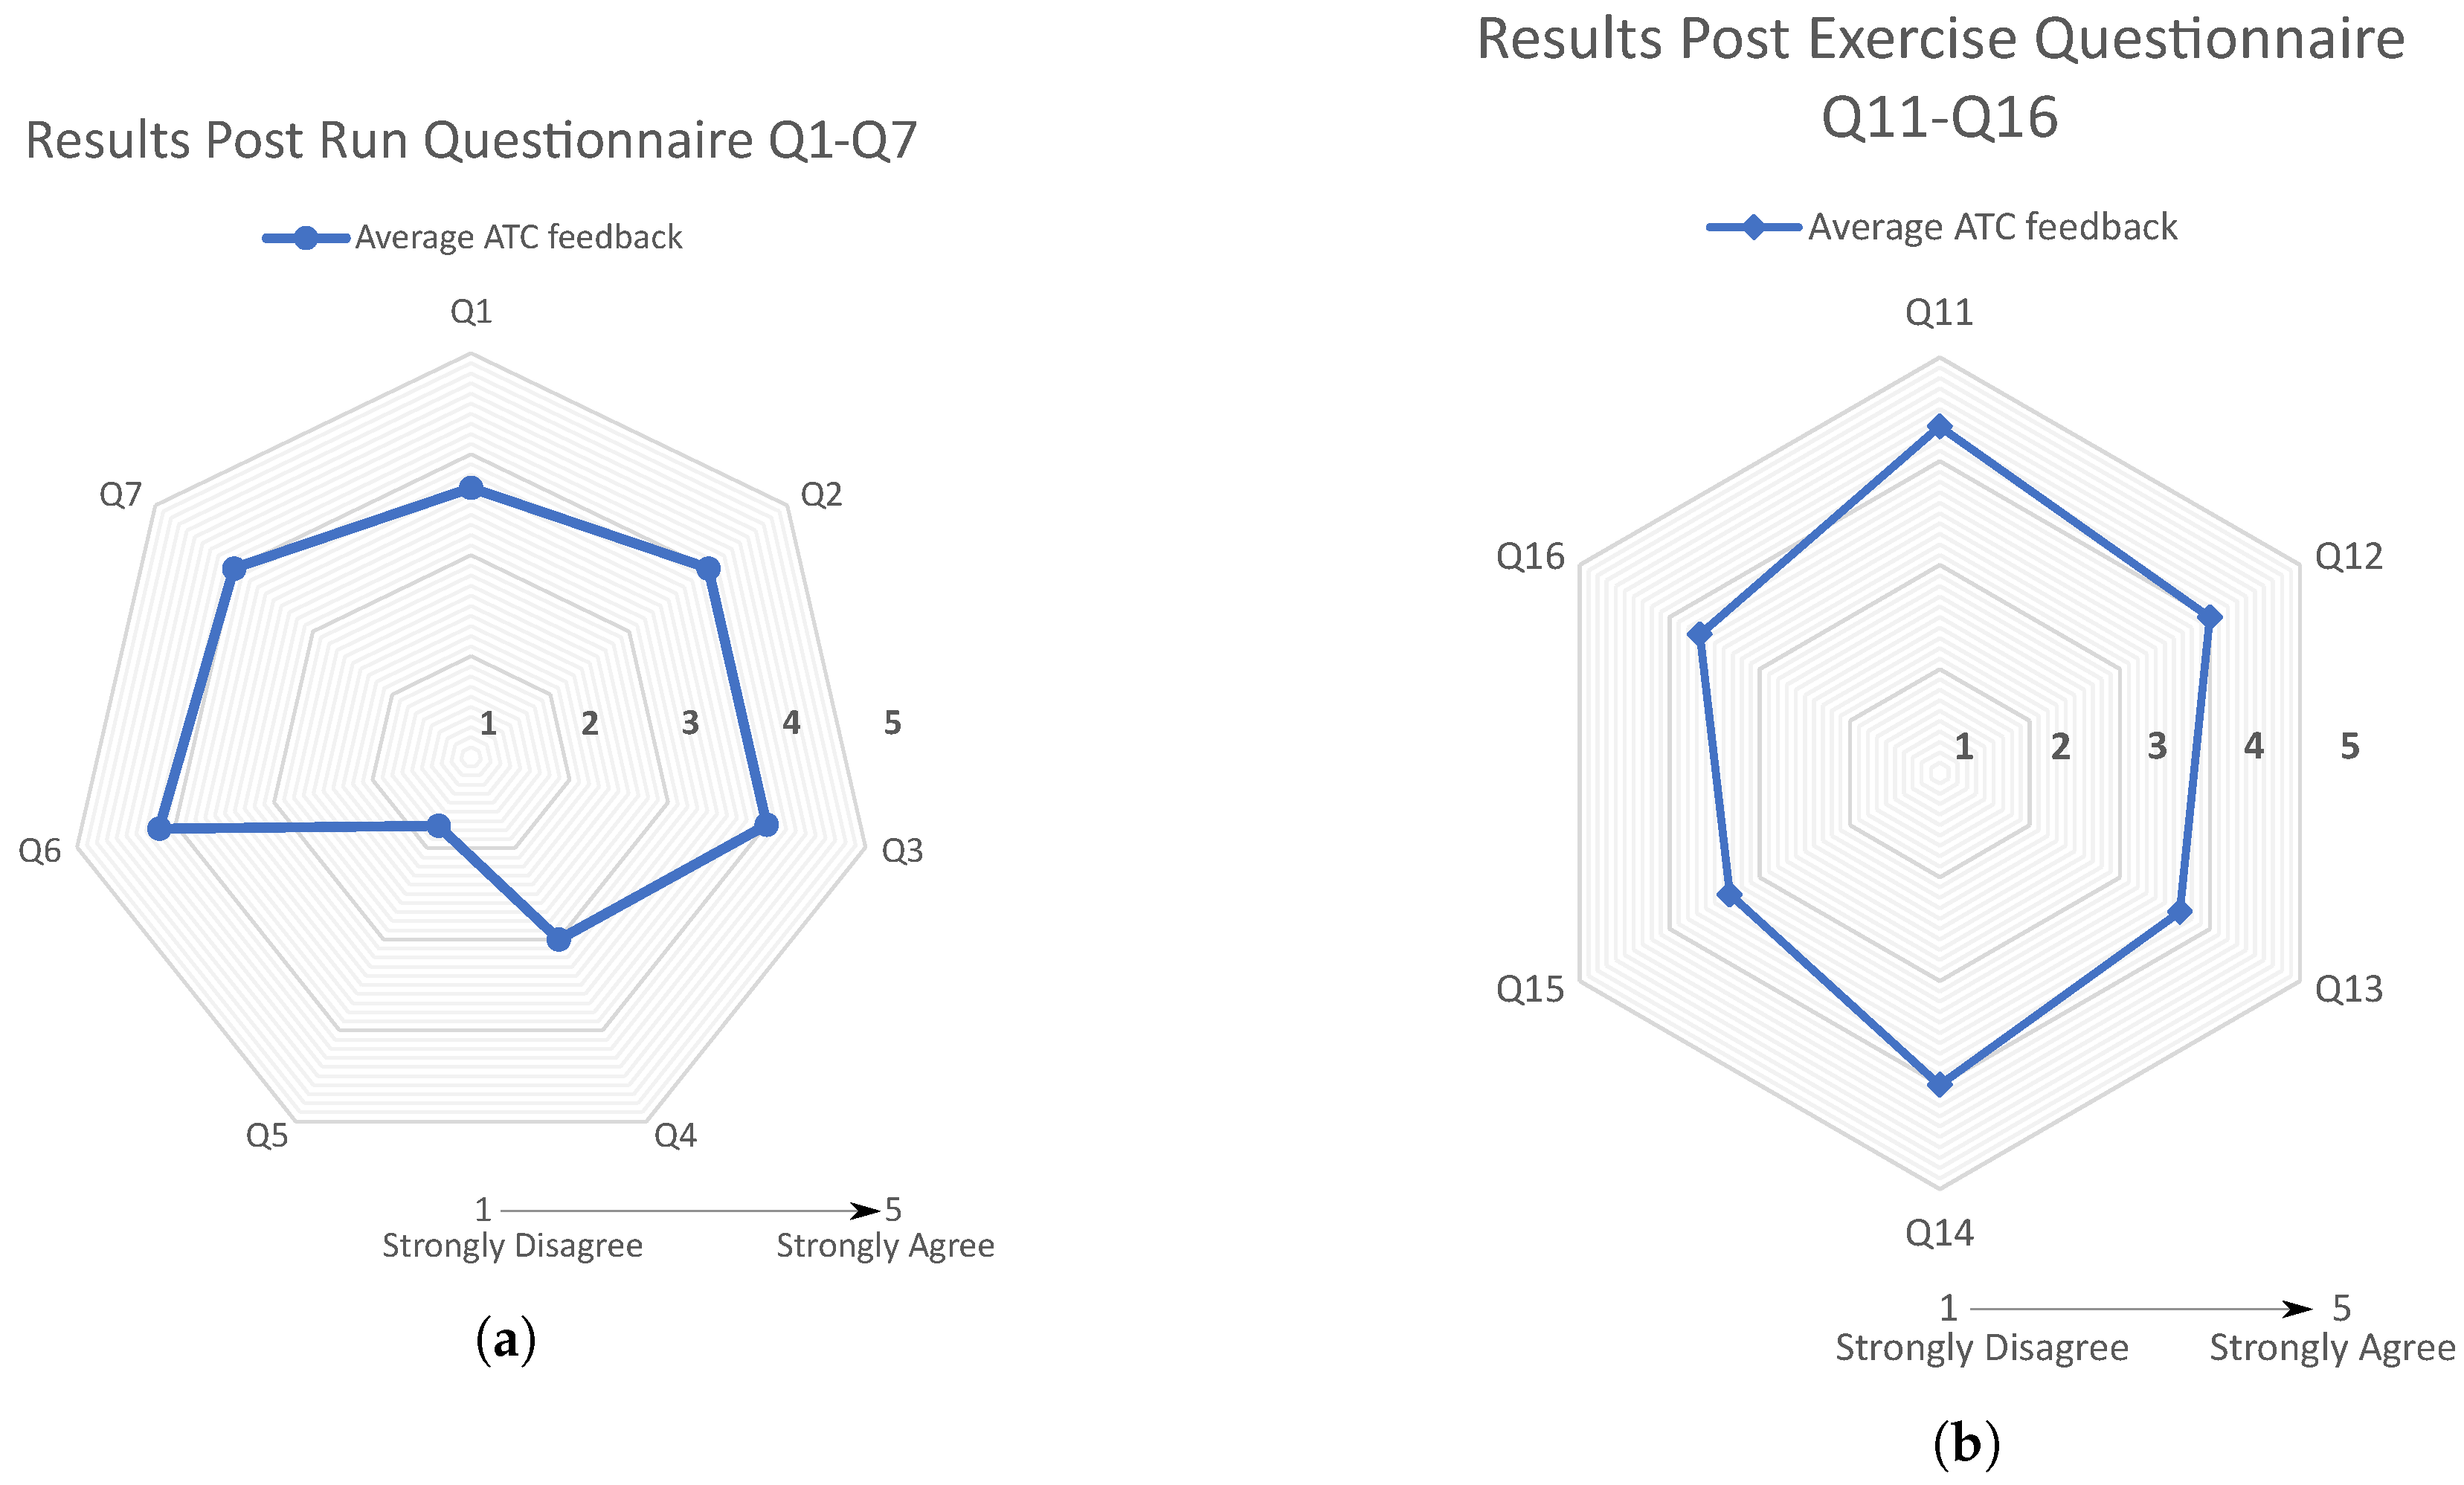
With the presented HITL experiments, we assessed whether the DAS approach allowed controllers to cope with traffic flows that changed over time due to applied contrail restrictions. Regarding the simulation environment, there were no unrealistic or unexpected behaviors. ATCOs evaluated the aircraft performance as realistic. All developed simulation scenarios ran fluently. The simulated radio connection via VoIP between ATCO and the simulation pilots worked fine. Furthermore, the training period was assessed as useful for ATCOs, and no technical issues appeared. Overall, a realistic HITL simulation environment was ensured.

5.1. Questionnaires

The two radar diagrams in Figure 7 display the calculated average of the ATCO feedback from the PRQ and PEQ questionnaires. The results from Figure 7a indicate that the ATCOs were able to plan and predict the traffic evolution depending on the traffic situation as usual. No safety concerns were identified, and the provided information was timely and complete. Furthermore, ATCOs did not experience any increase or shift in workload. On average, the results from PEQ, as shown in Figure 7b, suggest that ATCOs did not see any change in safety, satisfactory level or additional effort when applying the proposed concept of dynamic sectorization. In addition, the evaluation of the logged air traffic data showed neither separation violations nor unusual trajectories. This supports the aforementioned results that the ATCOs were able to control the traffic in a safe and efficient manner.
In addition to the closed questions used in PRQ and PEQ, the open questions provided further insight and qualitative feedback from the ATCOs. Generally, the ATCOs evaluated the DAS as a workable concept that could improve traffic and workload distribution. Nevertheless, ATCOs indicated challenges due to undefined procedures resulting from the adapting sector boundaries and requested the development of standard procedures for the coordination between sectors to cope with upcoming issues. In particular, the handling of aircraft entering or leaving a sector due to these changes in sector structure should be defined clearly.
Furthermore, the ATCOs would like to have an influence on the sector adaptation—in the worst case, allowing the supervisor to reject the sector adaptation using a veto. Additionally, the situational awareness could be influenced. ATCOs need to plan well ahead for which aircraft will leave or enter after the next sector adaptation. Thus, controllers developed their own procedures during the experiments. Since only one controller was involved during each experiment, no safety issues evolved, but a naming convention for the artificial sectors was requested to ensure clear identification. In total, the main concerns from ATCOs gathered through the questionnaires were summarized in the following seven items:
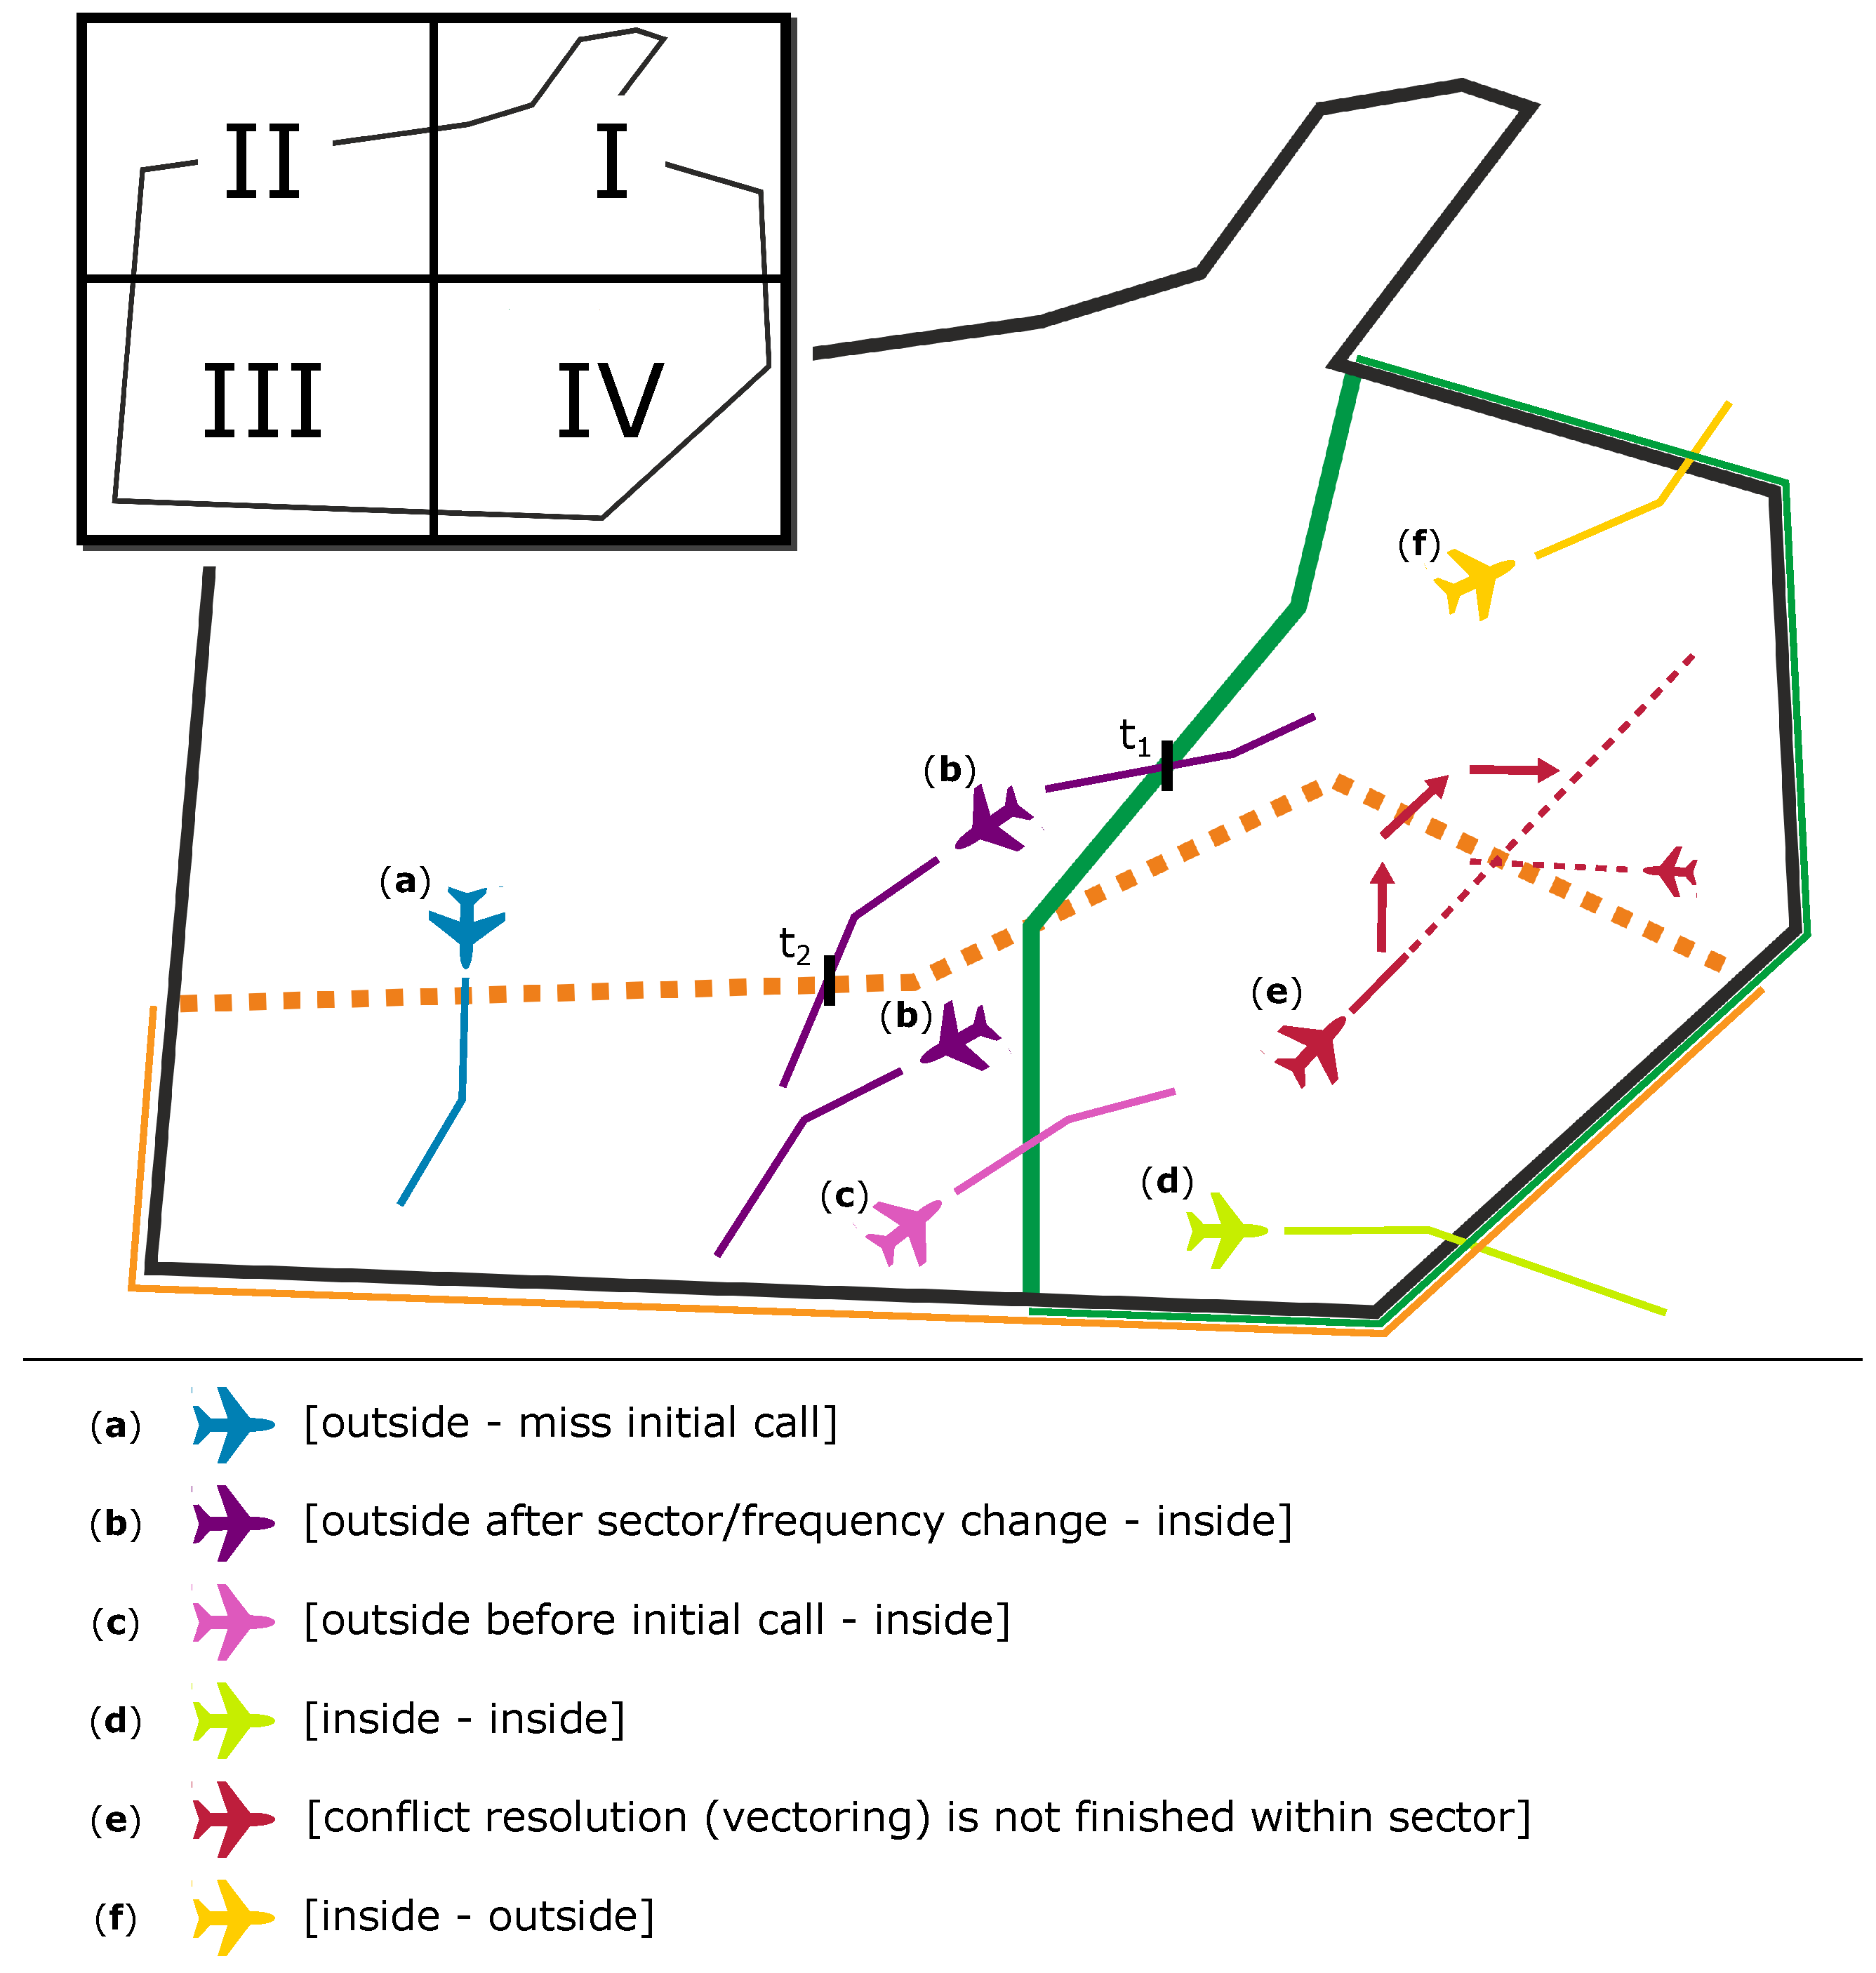
  • Aircraft leaves the sector but returns to the control area due to sector adaptation.
  • Aircraft is in a different sector after sector adaptation.
  • Aircraft leaves sector right before sector adaptation.
  • Aircraft responsibility could be unclear after sector adaptation.
  • Aircraft trajectories close to new sector boundaries (normally, a 2.5 NM distance).
  • Aircraft trajectories with sharp angle of entry. Receiving first instructions could take a long time according to the 2.5 NM rule.
  • Vectoring as conflict solution could not be finished after the sector.
These items were taken into account to develop a general controller manual based on the ATCO feedback gained in this study. The controller manual will include a naming convention and controller guidelines for different possible situations.

5.2. Proposal of DAS Procedures

The trials revealed that the principles of DAS are not completely covered by today’s regulation. In addition, the number of experimental controller studies related to DAS is rather limited. Studies, such as the one described in [23], focused on DAC where an observed airspace area was fragmented into typical airspace blocks, which were then combined depending on the traffic distribution. Since the sector boundaries were not adapted freely but were predefined by the airspace blocks, the challenges of DAS, such as the controller responsibility for an aircraft under certain circumstances, did not arise, and the distances (flight times) between the compound sectors were known to the controllers.
The presented DAS experiments and especially the ATCOs comments provided many hints on how to adapt the actual regulations to cope with the new situation. The involved controllers identified where an explicit assignment of responsibilities was necessary and when the advice/recommendations on how to handle flights in situations described in the table above were sufficient. The recommendations proposed in this section are designed on the basis of current ATC procedures in sectorized airspace environments. The backbone of every sectorization is a set of unique names for the observed sectors. Therefore, a naming convention that guarantees this is described in the next section before a recommendation on how to enhance controller guidelines is presented.

5.2.1. Naming Convention

An important point for the safe handling of sectors with boundaries that change over time is the assignment of unique sector names for each time step and sector. The participating controllers formulated the following requirements:
  • Unique names.
  • Easy to use/pronounce.
  • Obvious and informative.
To cope with these requirements, a naming convention was developed. The general ideas are illustrated in Figure 8 showing the sectorization of time step 3 (interim sectorization 2). Each sector starts with the standard abbreviation of the region (surrounding rectangle), which is SHA in the experiment. Next, the quarter of the surrounding square is calculated, which contains the main part of the sector. In case of the main sector of sectorization 3, this is section IV. Afterwards, the position of the gravity center (red dot) of this sector within this quarter (green area) is calculated based on an overlay with a wind rose and a center area colored in red.
The center area is an ellipse where the center is the center of the corresponding section, and the length of the major/minor axis is 1/3 of the section’s north–south/east–west extent. The centroid of that part of the sector located in this quarter determines an additional identifier for the sector. For centroids inside the center area, the additional identifier `Center’ is used, and, for all other positions, the identifier of the closest direction line. In the unlikely case that two sectors have the same identifier, an additional number is added in dependence of the position of the center of gravity increasing from left to right.
For the sector depicted in Figure 8, the naming convention would lead to SHA-IV-C (Shannon four center) describing the position clearly.

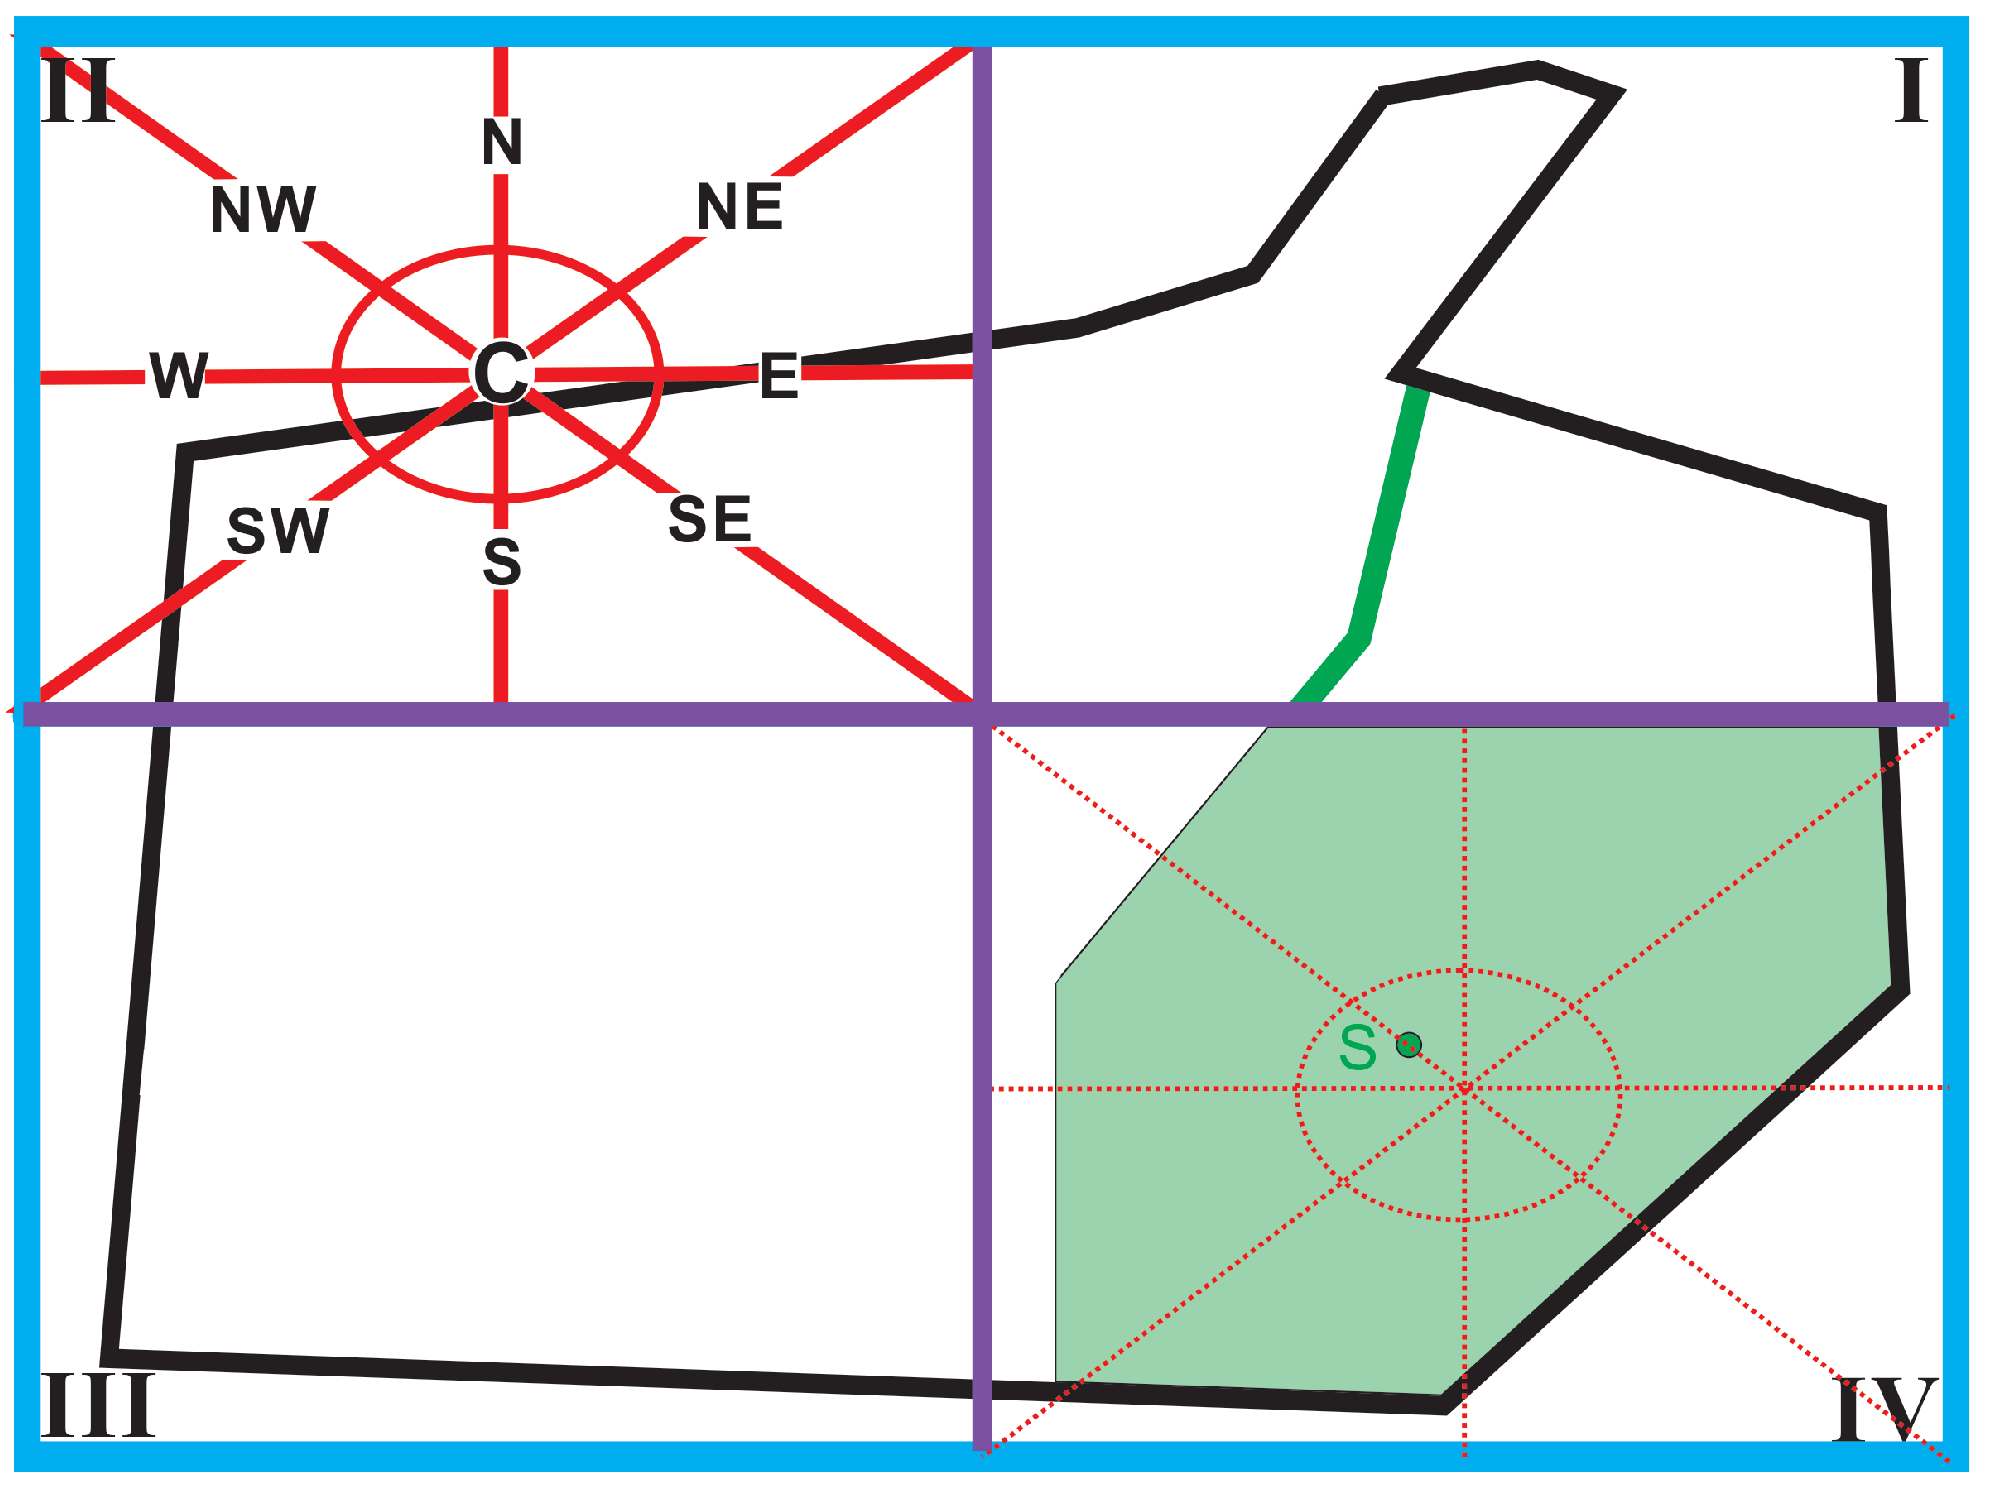
5.2.2. Controller Visual Guidelines for DAS Environments

To explicitly assign responsibilities, a development of procedures for handling flights affected by a changing sectorization is necessary. The target for the procedure development should be a concise “phraseology”. Seven important situations are already listed in Section 5.1. In this list, regarding possible handling procedures, item two can be seen as subitem of item one (resumption of responsibility). For item one, a time limit for the return time should be defined to indicate whether a flight should be kept under the advice of the current ATCO1 or handed over to the ATCO2 responsible for the neighboring sector.
The resulting action shall be indicated to the ATCO1 using attention guidance elements, such as a flashing label, if the flight should be send to the actual sector (ATCO2). Guidance should take into account not only the time until the flight is back (LeaveTime) but also the time this aircraft will then stay under the control of the ATCO1 (ReturnTime). If “LeaveTime + ReturnTime” are higher than, e.g., 15 min, and “ReturnTime” is higher than 8 min, the flight should be handed over. For item two, the time for handover when the new sectorization is activated is already displayed in the line below the label and serves as a controller guideline. For item three, again, the sum of “LeaveTime” and “ReturnTime” should be used as an indicator in the same way as for item one.
Regarding item four (unclear responsibility), the definitions for the first three items should clarify responsibilities. The fifth and sixth item have to be implemented as additional evaluation factors in the evaluation function of DASSy to prevent the generation of sectors with such problems. Thus, the generation of new sector boundaries would prevent sharp angles of entry of common flight trajectories parallel to conventional sector boundaries. For the last item, seven: to solve a conflict of two or more aircraft, they should stay in the responsibility of that ATCO1, who has advised the solution until he informs the next ATCO2 about the necessary next steps as is also common in today’s handover procedures. Time and distance parameters should be further tested and redefined based on the geographic area covered by the DAS environment.
Furthermore, it has to be clarified at which time an ATCO2 has the responsibility to take an aircraft under control that will enter their area of responsibility within the next few minutes. It is crucial to define the point of time when responsibility is not clear and is independent of the sector (actual or next). The current regulations prescribe a handover coordination in any circumstances when sectors change to clarify important traffic issues. As this will occur more often with DAS, this should only be performed under a limited number of circumstances. These could be:
  • There is an ongoing conflict resolution.
  • ATCO1 keeps the responsibility for an aircraft longer than expected.
  • Special predefined handover restrictions for flight level or speed cannot be met in time, and coordination is necessary.
In addition, this handover coordination should be simplified and supported by a special attention guidance module within the controller display. Attention guidance could inform the ATCOs about deviations from standard values/procedures or the commands necessary to complete a conflict resolution. This should be supported by a set of standard agreements for all sectors within the boundary of the area with changing sectors.

5.2.3. Controller DAS Manual

To finalize a set of different simplified cases that could occur when the DAS concept is applied, the constructed and recommended actions are discussed in Table 3. These cases include general situations that do not cause any responsibility issues. Additionally, the seven discussed situations where procedures need to be clarified from Section 5.1. Figure 9 displays those situations as a set from (a) to (f). Thereby, the green sector is the initially active sector, referred to as sector one. After the sector boundaries change due to DAS, the sector surrounded by orange dashed lines will be the active sector, referred to as sector two.
For all surrounding sectors, the responsible ATCO is referred to as ATCO2. Some mentioned situations in Section 5.1, such as number one (resumption of responsibility) and four (unclear responsibility), are combined in Figure 9 in case b. In Table 3, the presented cases and further proposed proceedings are summarized.

6. Conclusions

In this paper, the application of the dynamic sectorization concept was presented within a real controller environment. The fundamentals of the dynamic sectorization approach were provided as well as concept validation aspects. We introduced a scenario where climate aspects led to adaptations in sector structure. The simulation setup enabled HITL trials with air traffic controllers, and we evaluated the proposed dynamic sectorization environment in a first feasibility study with one controller for each simulation run.
The validation results and controller feedback showed that, apart from a coherent naming convention, an explicit assignment of responsibilities in the case of sector adaptations was necessary. This included a first set of recommendations on how to handle air traffic in certain conditions. These recommendations were analyzed, and a first guideline for the use of DAS environments and procedures was developed.
In the presented work, the adaptations are a result of calculated contrail zones. Nevertheless, the methodology can be used for several applications, such as the adaptation of traffic demand or short-term closure of airspaces, which leads to changes in traffic flow and, therefore, imbalances in air traffic controller workload. Taking more general changes in traffic flow into account, the methodology could also be applied to different flight phases, such as approach areas, because it does not depend on the flight phase. However, contrails evolve in the upper airspace, which limited the presented study to the en-route phase where the re-routing of aircraft could be conducted easily. Approach sectors generally depend on the airport and runway layout, which limits the possibilities to adjust the traffic. Therefore, the method is not easily adaptable to approach sectors.
The next step is the adaptation of the evaluation function of the genetic algorithm in order to take controller comments regarding sector restrictions into account and the implementation of the proposed attention guidance elements. Thereafter, extended feasibility tests with interacting controllers responsible for neighboring sectors shall assess whether the guideline and attention guidance has the intended effect. With a working environment and accepted procedures, the proposed methodology can be enhanced to 3D-airspace allowing not only horizontal but also vertical sector management.

Author Contributions

Conceptualization, I.G. and A.T.; methodology, N.A., I.G., T.M. and A.T.; software, I.G., N.A. and A.T.; validation, N.A., I.G. and T.M.; writing—original draft preparation, N.A., I.G., T.M. and A.T.; writing—review and editing, N.A., I.G., T.M. and A.T.; visualization, N.A., I.G., T.M. and A.T.; project administration, A.T.; All authors have read and agreed to the published version of the manuscript.

Funding

This research received no external funding.

Institutional Review Board Statement

Not applicable.

Informed Consent Statement

Informed consent was obtained from all subjects involved in the study.

Data Availability Statement

Data can be made available by contacting the corresponding author, Nils Ahrenhold.

Conflicts of Interest

The authors declare no conflict of interest.

References

  1. Simorgh, A.; Soler, M.; Gonzáles-Arribas, D.; Matthes, S.; Grewe, V.; Dietmüller, S.; Baumann, S.; Yamashita, H.; Yin, F.; Castino, F.; et al. A Comprehensive Survey on Climate Optimal Aircraft Trajectory Planning. Aerospace 2022, 9, 146. [Google Scholar] [CrossRef]
  2. Matthes, S.; Grewe, V.; Dahlmann, K.; Frömming, C.; Irvine, E.; Lim, L.; Linke, F.; Lührs, B.; Owen, B.; Shine, K.; et al. A concept for multi-criteria environmental assessment of aircraft trajectories. Aerospace 2017, 4, 42. [Google Scholar] [CrossRef]
  3. Zelinski, S.; Lai, C.F. Comparing methods for dynamic airspace configuration. In Proceedings of the 2011 IEEE/AIAA 30th Digital Avionics Systems Conference, Seattle, WA, USA, 16–20 October 2011; pp. 3A1-1–3A1-13. [Google Scholar] [CrossRef]
  4. Hind, H.; El Omri, A.; Abghour, N.; Moussaid, K.; Rida, M. Dynamic airspace configuration: Review and open research issues. In Proceedings of the 2018 fourth International Conference on Logistics Operations Management (GOL), Le Havre, France, 10–12 April 2018; pp. 1–7. [Google Scholar]
  5. Flener, P.; Pearson, J. Automatic Airspace Sectorisation: A Survey. arXiv 2013, arXiv:1311.0653. [Google Scholar]
  6. EUROCONTROL. European Operational Concept Validation Methodology; Version 3; EUROCONTROL: Brussels, Belgium, 2010; Volume 1. [Google Scholar]
  7. Mankins, J. Technology Readiness Level—A White Paper; 6 April 1995; Advanced Concepts Office, Office of Space Access and Technology, NASA: Washington, DC, USA, 1995. [Google Scholar]
  8. Kopardekar, P.; Bilimoria, K.; Sridhar, B. Initial Concepts for Dynamic Airspace Configuration. In 7th AIAA ATIO Conf, second CEIAT Int’l Conf on Innov and Integr in Aero Sciences, 17th LTA Systems Tech Conf Followed by Second TEOS Forum; AIAA: Belfast, Northern Ireland, 2007. [Google Scholar]
  9. Gerdes, I.; Temme, A.; Schultz, M. From free-route air traffic to an adapted dynamic main-flow system. Transp. Res. Part Emerg. Technol. 2020, 115, 102633. [Google Scholar] [CrossRef]
  10. Gerdes, I.; Temme, A.; Schultz, M. Dynamic airspace sectorisation for flight-centric operations. Transp. Res. Part Emerg. Technol. 2018, 95, 460–480. [Google Scholar] [CrossRef]
  11. Ruspini, E.H.; Bezdek, J.C.; Keller, J.M. Fuzzy Clustering: A Historical Perspective. IEEE Comput. Intell. Mag. 2019, 14, 45–55. [Google Scholar] [CrossRef]
  12. Bezdek, J.C. Pattern Recognition with Fuzzy Objective Function Algorithms; Springer: Berlin/Heidelberg, Germany, 1981. [Google Scholar]
  13. Keller, A. Objective Function Based Fuzzy Clustering in Air Traffic Management. Ph.D. Thesis, Otto-von-Guericke-Universtät Magdeburg, Magdeburg, Germany, 2002. [Google Scholar]
  14. de Berg, M.; Cheong, O.; van Kreveld, M.; Overmars, M. Computational Geometry: Algorithms and Applications; Springer: Berlin/Heidelberg, Germany, 2008. [Google Scholar]
  15. Xue, M. Airspace Sector Redesign Based on Voronoi Diagrams. J. Aerosp. Comput. Inf. Commun. 2009, 6, 624–634. [Google Scholar] [CrossRef]
  16. Fortune, S. A sweepline algorithm for Voronoi diagrams. In Proceedings of the Second Annual Symposium on Computational Geometry, Yorktown Heights, NY, USA, 2–4 June 1986; pp. 16–22. [Google Scholar]
  17. Michalewicz, Z. Genetic Algorithms + Data Structures = Evolution Programs; Springer: Berlin/Heidelberg, Germany, 1996. [Google Scholar]
  18. Gerdes, I.; Klawonn, F.; Kruse, R. Evolutionäre Algorithmen: Genetische Algorithmen—Strategien und Optimierungsverfahren—Beispielanwendungen; Springer: Berlin/Heidelberg, Germany, 2004. [Google Scholar]
  19. Kölker, K.; Lütjens, K. Using Genetic Algorithms to Solve Large-scale Airline Network Planning Problems. Transp. Res. Procedia 2015, 10, 900–909. [Google Scholar] [CrossRef]
  20. Deveci, M.; Çetin Demirel, N. Evolutionary algorithms for solving the airline crew pairing problem. Comput. Ind. Eng. 2017, 115, 389–406. [Google Scholar] [CrossRef]
  21. Soolaki, M.; Mahdavi, I.; Mahdavi-Amiri, N.; Hassanzadeh, R.; Aghajani, A. A new linear programming approach and genetic algorithm for solving airline boarding problem. Appl. Math. Model. 2012, 36, 4060–4072. [Google Scholar] [CrossRef]
  22. Schultz, M. Dynamic change of aircraft seat condition for fast boarding. Transp. Res. Part C Emerg. Technol. 2017, 85, 131–147. [Google Scholar] [CrossRef]
  23. Sergeeva, M.; Delahaye, D.; Mancel, C.; Vidosavljevic, A. Dynamic airspace configuration by genetic algorithm. J. Traffic Transp. Eng. 2017, 4, 300–314. [Google Scholar] [CrossRef]
  24. Zou, X.; Cheng, P.; An, B.; Song, J.O. Sectorization and Configuration Transition in Airspace Design. Math. Probl. Eng. 2016, 2016, 1–21. [Google Scholar] [CrossRef]
  25. Standfuß, T.; Gerdes, I.; Temme, A.; Schultz, M. Dynamic airspace optimisation. CEAS Aeronaut. J. 2018, 9, 517–531. [Google Scholar] [CrossRef]
  26. EUROCONTROL. DDR2 Reference Manual for General Users 2.9.5; EUROCONTROL: Brussels, Belgium, 2018. [Google Scholar]
  27. Grewe, V.; Dahlmann, K.; Flink, J.; Frömming, C.; Ghosh, R.; Gierens, K.; Heller, R.; Hendricks, J.; Jöckel, P.; Kaufmann, S.; et al. Mitigating the climate impact from aviation: Achievements and results of the DLR WeCare project. Aerospace 2017, 4, 34. [Google Scholar] [CrossRef]
  28. Frömming, C.; Grewe, V.; Brinkop, S.; Jöckel, P.; Haslerud, A.S.; Rosanka, S.; Van Manen, J.; Matthes, S. Influence of weather situation on non-CO 2 aviation climate effects: The REACT4C climate change functions. Atmos. Chem. Phys. 2021, 21, 9151–9172. [Google Scholar] [CrossRef]
  29. Rao, P.; Yin, F.; Grewe, V.; Yamashita, H.; Jöckel, P.; Matthes, S.; Mertens, M.; Frömming, C. Case Study for Testing the Validity of NOx-Ozone Algorithmic Climate Change Functions for Optimising Flight Trajectories. Aerospace 2022, 9, 231. [Google Scholar] [CrossRef]
  30. Dhief, I. Optimization of Aircraft Trajectories over the North Atlantic Airspace. Ph.D. Thesis, Université Paul Sabatier (Toulouse 3), Toulouse, France, 2018. [Google Scholar]
  31. ICAO. Application of Separation Minima—North Atlantic Region, NAT Doc 008 (EN), Amd 10, 1st ed.; ICAO European and North Atlantic Office: Montréal, QC, Canada, 2020. [Google Scholar]
  32. ten Have, J. The Development of the Nlr Atc Research Simulator (Narsim); Flight Devision, 01 ed.; National Aerospace Laboratory NLR: Amsterdam, The Netherlands, 1992. [Google Scholar]
  33. Deutsches Zentrum für Luft-und Raumfahrt e.V. Air Traffic Management and Operations Simulator (ATMOS); Institut für Flugführung: Braunschweig, Germany, 2019. [Google Scholar]
  34. EUROCONTROL. EEC Technical Report No. 2009-008, Base of Aircraft data (BADA); 008 ed.; EUROCONTROL EEC: Brussels, Belgium, 2009. [Google Scholar]
  35. ACA. ICAO Standard Phraseology. A Quick Reference Guide for Commercial Air Transport Pilots; Safety Initiative; EUROCONTROL: Brussels, Belgium, 2011. [Google Scholar]
  36. DDF GmbH. Luftfahrthandbuch Deutschland. Available online: https://aip.dfs.de/basicAIP/ (accessed on 19 January 2023).
  37. Joshi, A.; Kale, S.; Chandel, S.; Pal, D.K. Likert scale: Explored and explained. Br. J. Appl. Sci. Technol. 2015, 7, 396. [Google Scholar] [CrossRef]
Figure 1. The V-phases, validation and other ATM system development activities according to [6].
Aerospace 10 00405 g001
Figure 2. Overview of the applied dynamic sectorization approach.
Aerospace 10 00405 g002
Figure 3. Scenario overview.
Aerospace 10 00405 g003
Figure 4. Sectorizations. (a) Main sectorization 0 (blue dotted line) and interim sectorization 1 (red line). (b) Interim sectorization 2 (green line) and main sectorization 1 (orange dotted line).
Aerospace 10 00405 g004
Figure 5. Simulation Environment. (a) Overview of the simulation environment. (b) Picture of ATMOS.
Aerospace 10 00405 g005
Figure 6. Display for the controller and simulation pilots. (a) Controller Display and Simulation Tool (CoDiST) implemented within ATMOS. (b) IRIS Display for simulation pilots divided into three sections: stripview, workspace and radar screen.
Aerospace 10 00405 g006
Figure 7. Evaluation of the questionnaires. (a) PRQ. (b) PEQ.
Aerospace 10 00405 g007
Figure 8. Naming convention for sectors with boundaries changing over time. I–IV indicate the respective number for each quarter of the sector within the naming convention.
Aerospace 10 00405 g008
Figure 9. Different cases for responsibility manual. First, the sector surrounded by a green line is active. After DAS, the sector surrounded by orange + orange dashed line is active. t1 and t2 for case (b) indicate the time stamp when the aircraft left the sector (t1) and the time stamp when aircraft enters the new active sector (t2).
Aerospace 10 00405 g009
Table 1. The Likert scale for the questions.
Questions12345
Q1–Q7 and Q11–Q18strongly disagreedisagreeneither agree nor disagreeagreestrongly agree
Q8very badpoorfairgoodexcellent
Q9–Q10completely demandingdemandingneither demanding nor undemandingundemandingcompletely undemanding
Table 2. Questions PRQ (Q1 to Q10) and PEQ (Q11 to Q18).
IDQuestion
Q1I felt comfortable during the overall run.
Q2I was able to plan and organize my work according to my preferences.
Q3I was able to predict the traffic evolution dependent on the traffic situation and sectorization.
Q4I had the feeling of focusing too much on a single problem or a specific area during my work.
Q5I have the feeling that I focused too much on a single issue because of the changing sectorization.
Q6I was provided with all the information I needed to understand the traffic situation/implication of sector adaptation.
Q7The received information was timely and complete.
Q8On average, I would rate my situational awareness as…
Q9Considering the whole of the accomplished tasks, the time pressure experienced during this run was:
Q10The overall workload in terms of the attention, skill or effort I experienced during this run was:
Q11In general, I felt comfortable in managing aircraft en-route in the dynamic sectorization environment.
Q12Applying dynamic sectorization en-route will not negatively affect job satisfaction levels for ATCOs.
Q13The applied concept for en-route dynamic sectorization will allow a sufficient level of safety.
Q14The applied concept for en-route dynamic sectorization will allow a satisfactory personal situational awareness.
Q15The applied concept for en-route dynamic sectorization will allow management of the personal workload.
Q16The introduction of dynamic en-route sectorization does not imply additional effort or abilities.
Q17Do you see any unexpected or unwanted effects regarding the dynamically adapting sectors for managing en-route traffic?
Q18Do you see any need for change in training or human resource management to allow the application of the dynamic sectorization concept en-route?
Table 3. Simulation scenario composition and overview; XX = time needs to be defined by future validations.
CaseActive Sector 1Active Sector 2Action before Switch
(a)Aircraft is not in the sector.Aircraft is in the sector.ATCO of active sector one receives notification that aircraft will enter in [XX] min after sector two will be active. Entry time in sector two and label on radar screen are highlighted.
(b)Aircraft is not in the sector.Aircraft is in the sector.ATCO of active sector one receives notification that aircraft will enter again in [XX] min after sector two will be active. Entry time in sector two and label on radar screen are highlighted. If aircraft is already inside sector 2 after the switch. Entry time equals sector boundary time.
(c)Aircraft is not in the sector and did not call for identification (initial call)Aircraft is in the sector.ATCO of active sector one receives notification that aircraft will be inside sector two after switch. Entry time in sector two and label on radar screen are highlighted. Entry time equals sector boundary time. Pilot receives notification for a two minute early initial call.
(d)Aircraft is in the sector.Aircraft is in the sector.No proposals.
(e)Aircraft is in the sector.Aircraft is in the sector but will leave soon. Vectoring as conflict resolution is not finished before sector leave.ATCO keeps responsibility of the aircraft until conflict resolution is finished. ATCO2 receives notification and highlighted that conflict resolution is not finished yet. Predicted entry time is displayed on label.
(f)Aircraft is in the sector.Aircraft is not in the sector.ATCO of active sector one receives notification that aircraft will be outside sector after sector two will be active. Aircraft hand over to ATCO2 needs to be performed before sector two is active. Hand over time equals sector boundary time minus one minute.
Disclaimer/Publisher’s Note: The statements, opinions and data contained in all publications are solely those of the individual author(s) and contributor(s) and not of MDPI and/or the editor(s). MDPI and/or the editor(s) disclaim responsibility for any injury to people or property resulting from any ideas, methods, instructions or products referred to in the content.

