
Pilot Selection in the Era of Virtual Reality: Algorithms for Accurate and Interpretable Machine Learning Models

Abstract
:1. Introduction
Algorithms of Pilot Selection
- More specifically, for personality features, Cattell’s 16PF-personality scale using the Support Vector Machine (SVM) generated an accuracy of 64% and 78% in two studies by researchers at The Fourth Military Medical University, China [26,27]. A highly relevant summary whitepaper titled, “The predictive power of assessment for pilot selection”, generated by the cut-e Group, a consulting company in Germany specializing in pilot selection, reported that a job success prediction accuracy of 79.3% can be achieved using personality characteristics, flight simulator results, and prior flying experience [28].
- Cognitive tasks are the commonly-used predictors in pilot selection. These cognitive tasks include General Mental Ability (such as general ability, verbal ability, quantitative ability, or the g-factor), spatial ability, gross and fine dexterity, perceptual speed, etc. [29,30]. Cognitive tasks have the advantages of being low cost and easy to implement with paper and pencils or a computer, compared to EEG, eye movement, and flight dynamics. Two studies with cognitive tasks as subcomponents to select pilots achieved a predictability of accuracy in the range of 74% up to nearly 94% [31,32].
- Only one EEG and machine learning study was identified to select pilots [33]. The rare use of EEG to select pilots is perhaps because of the technical difficulty, intrusiveness, and more than 30 min of EEG preparation time to use traditional EEG. The EEG components used in their SVM machine learning classification were the power spectrum factor of alpha, theta, and delta waves at the O1, Oz, and O2 electrodes, and their relative power of the three EEG waves. As summarized in Table 1, a classification accuracy of 76% was achieved for a combination of EEG, heart rate, and eye movement [33], and each component’s predictability accuracy is unknown.
- Similar to EEG, a quite large amount of research has been performed on using eye movement and machine learning to select pilots. Only one study considered three eye movement parameters in selecting pilots: blink rate, average gaze duration, and pupil diameter [33]. Although they achieved an overall 76% prediction accuracy, no independent contribution of eye movement was provided in their work [33]. Despite little work on the utilization of eye movement in the pilot selection, eye movement was able to distinguish novice and expert vehicle drivers [34], and can be used to predict driver cognitive distraction with a high accuracy of 90% using machine learning algorithms like SVM [35]. Recent advances in VR-based eye-tracker can potentially reduce traditional eye-tracker costs and manual coding efforts, which might make the application of eye-trackers in pilot selection more feasible and practicable.
- Flight dynamics measured by a flight simulator or QAR is often considered in pilot selection [28]. The seminal work published in Psychological Bulletin after reviewing 85 years of research in pilot selection reported that the mean validity of 0.63 can be achieved with a combination of general mental ability and a work sample test [30]. Despite the high predictability of flight dynamics, no published scientific study on pilot selection was identified using flight dynamics and machine learning to our best knowledge. Flight dynamics are often rated crudely via peer ratings, which generates much lower validity than a work sample test (0.49 compared to 0.54, respectively) or flight dynamics [30].

| Index | Algorithms | Input Feature | Accuracy | Institute, Country | References |
|---|---|---|---|---|---|
| 1 | Support Vector Machine | Cattell’s 16PF-personality | 78% | The Fourth Military Medical University, China | [26] |
| 2 | Support Vector Machine | Cattell’s 16PF-personality | 64% | The Fourth Military Medical University, China | [27] |
| 3 | Extremely randomized tree | Cognitive task performance & personality test etc. | Nearly 94% | United States Air Force Academy, United States | [31] |
| 4 | Discriminant analysis | Cognitive task performance | 74% | ISPA- Instituto Universitário, Portugal | [32] |
| 5 | Logistic regression | Cognitive task performance | 77% | ISPA- Instituto Universitário, Portugal | [32] |
| 6 | Neural network | Cognitive task performance | 76% | ISPA- Instituto Universitário, Portugal | [32] |
| 7 | Support Vector Machine | EEG, heart rate measured using ECG, eye movements (blink rate, gaze duration, and pupil diameter) | 76% | Beihang University, China | [33] |
2. Methods
2.1. Participants
2.2. Procedure
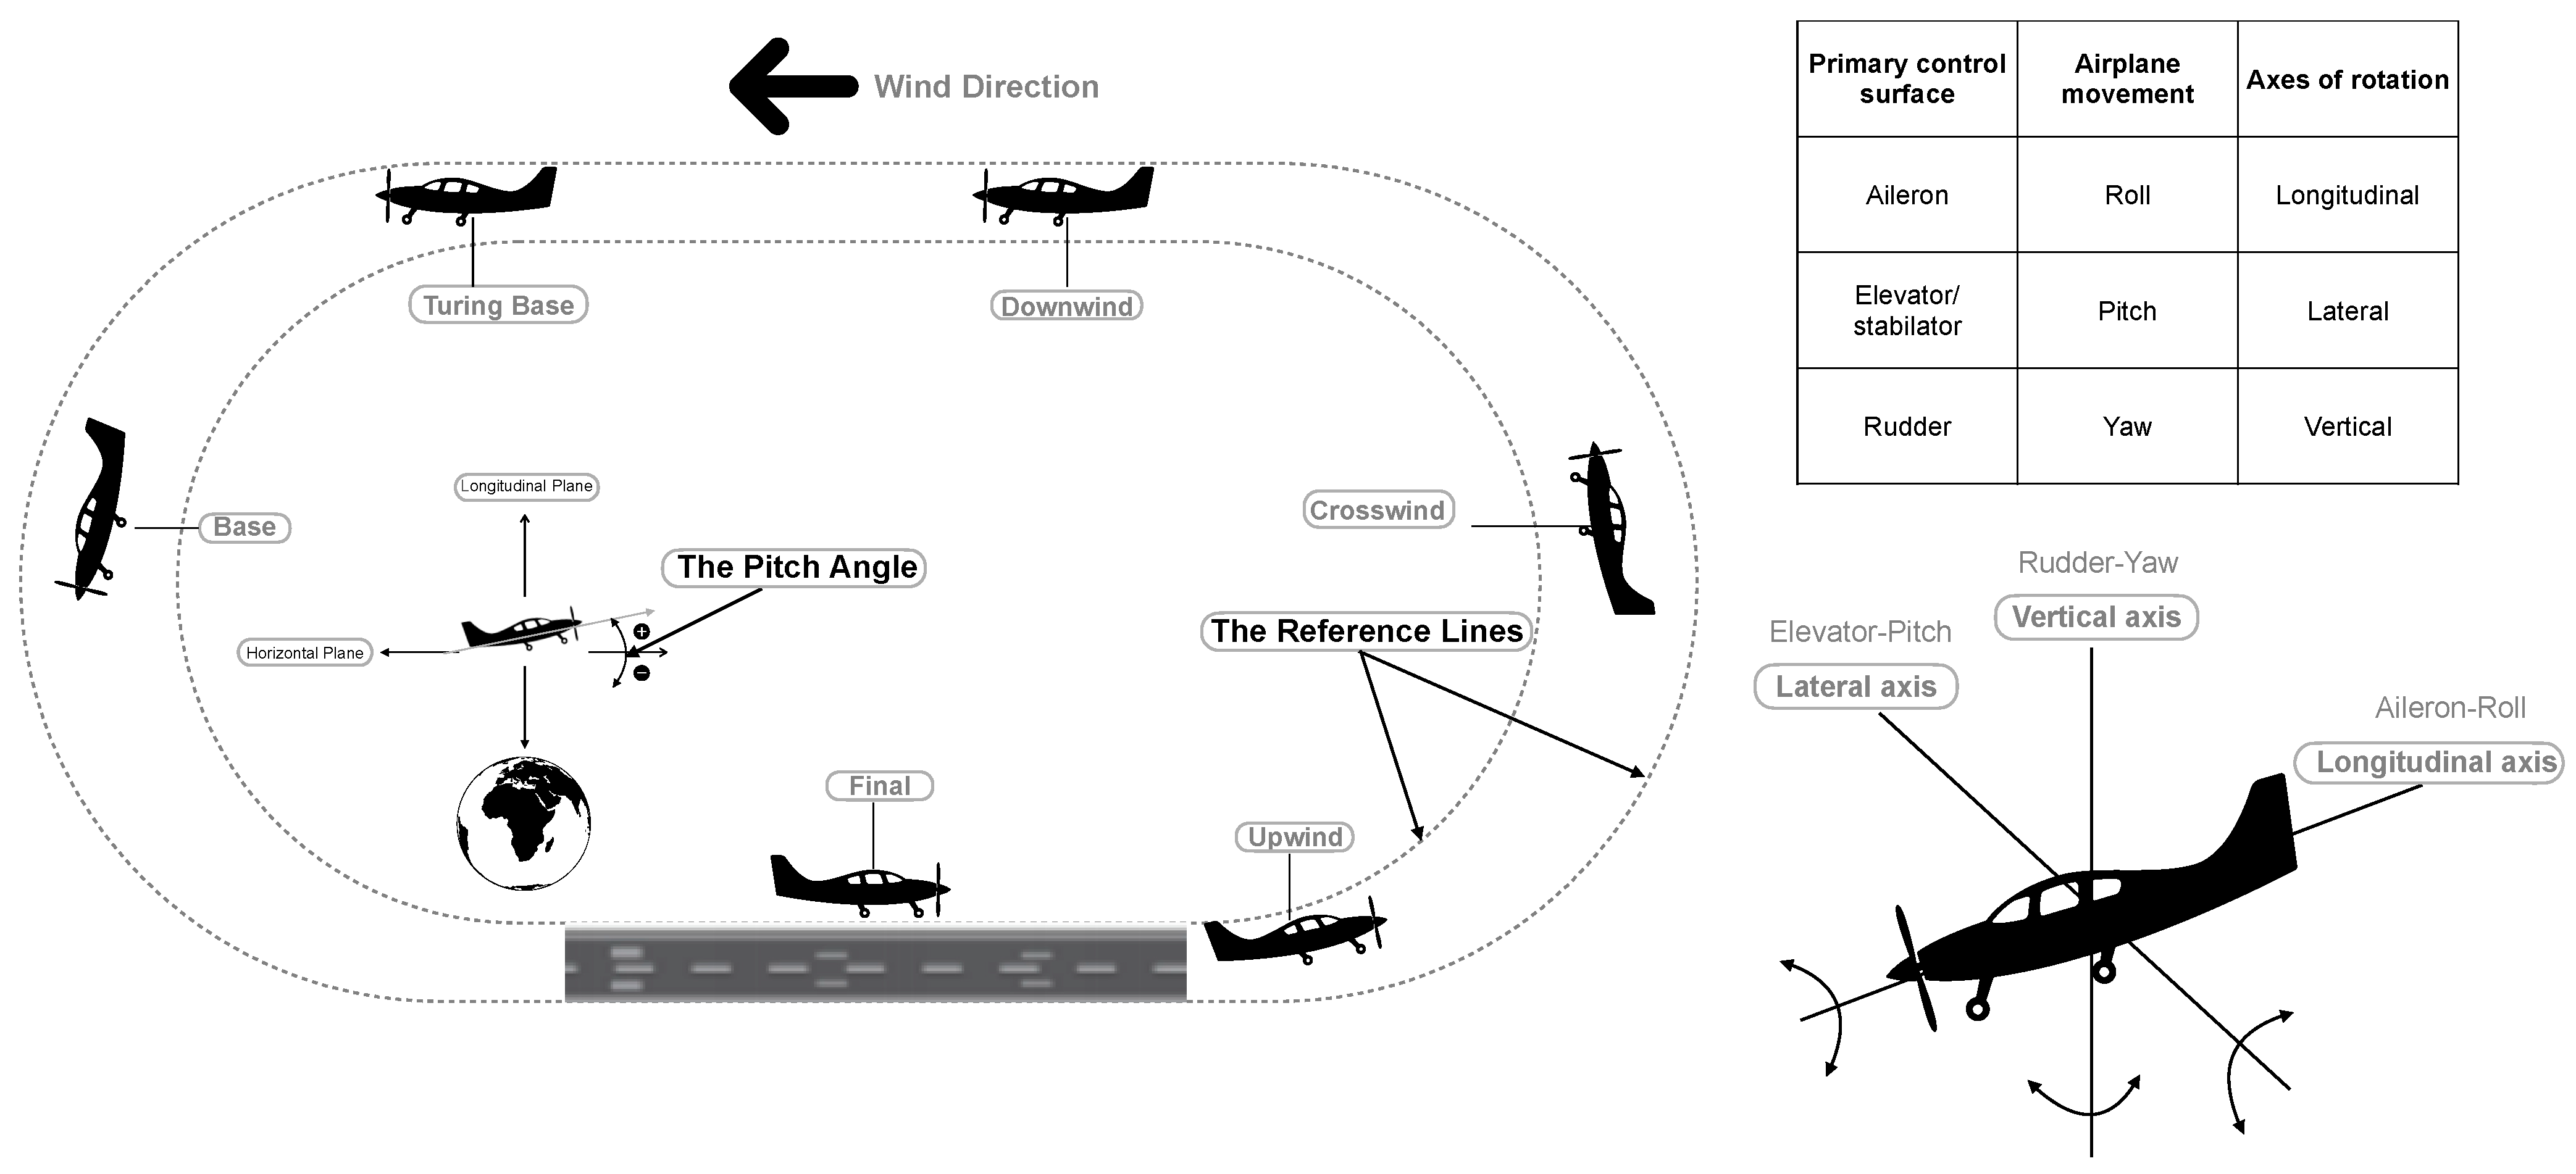
2.2.1. Flight Task
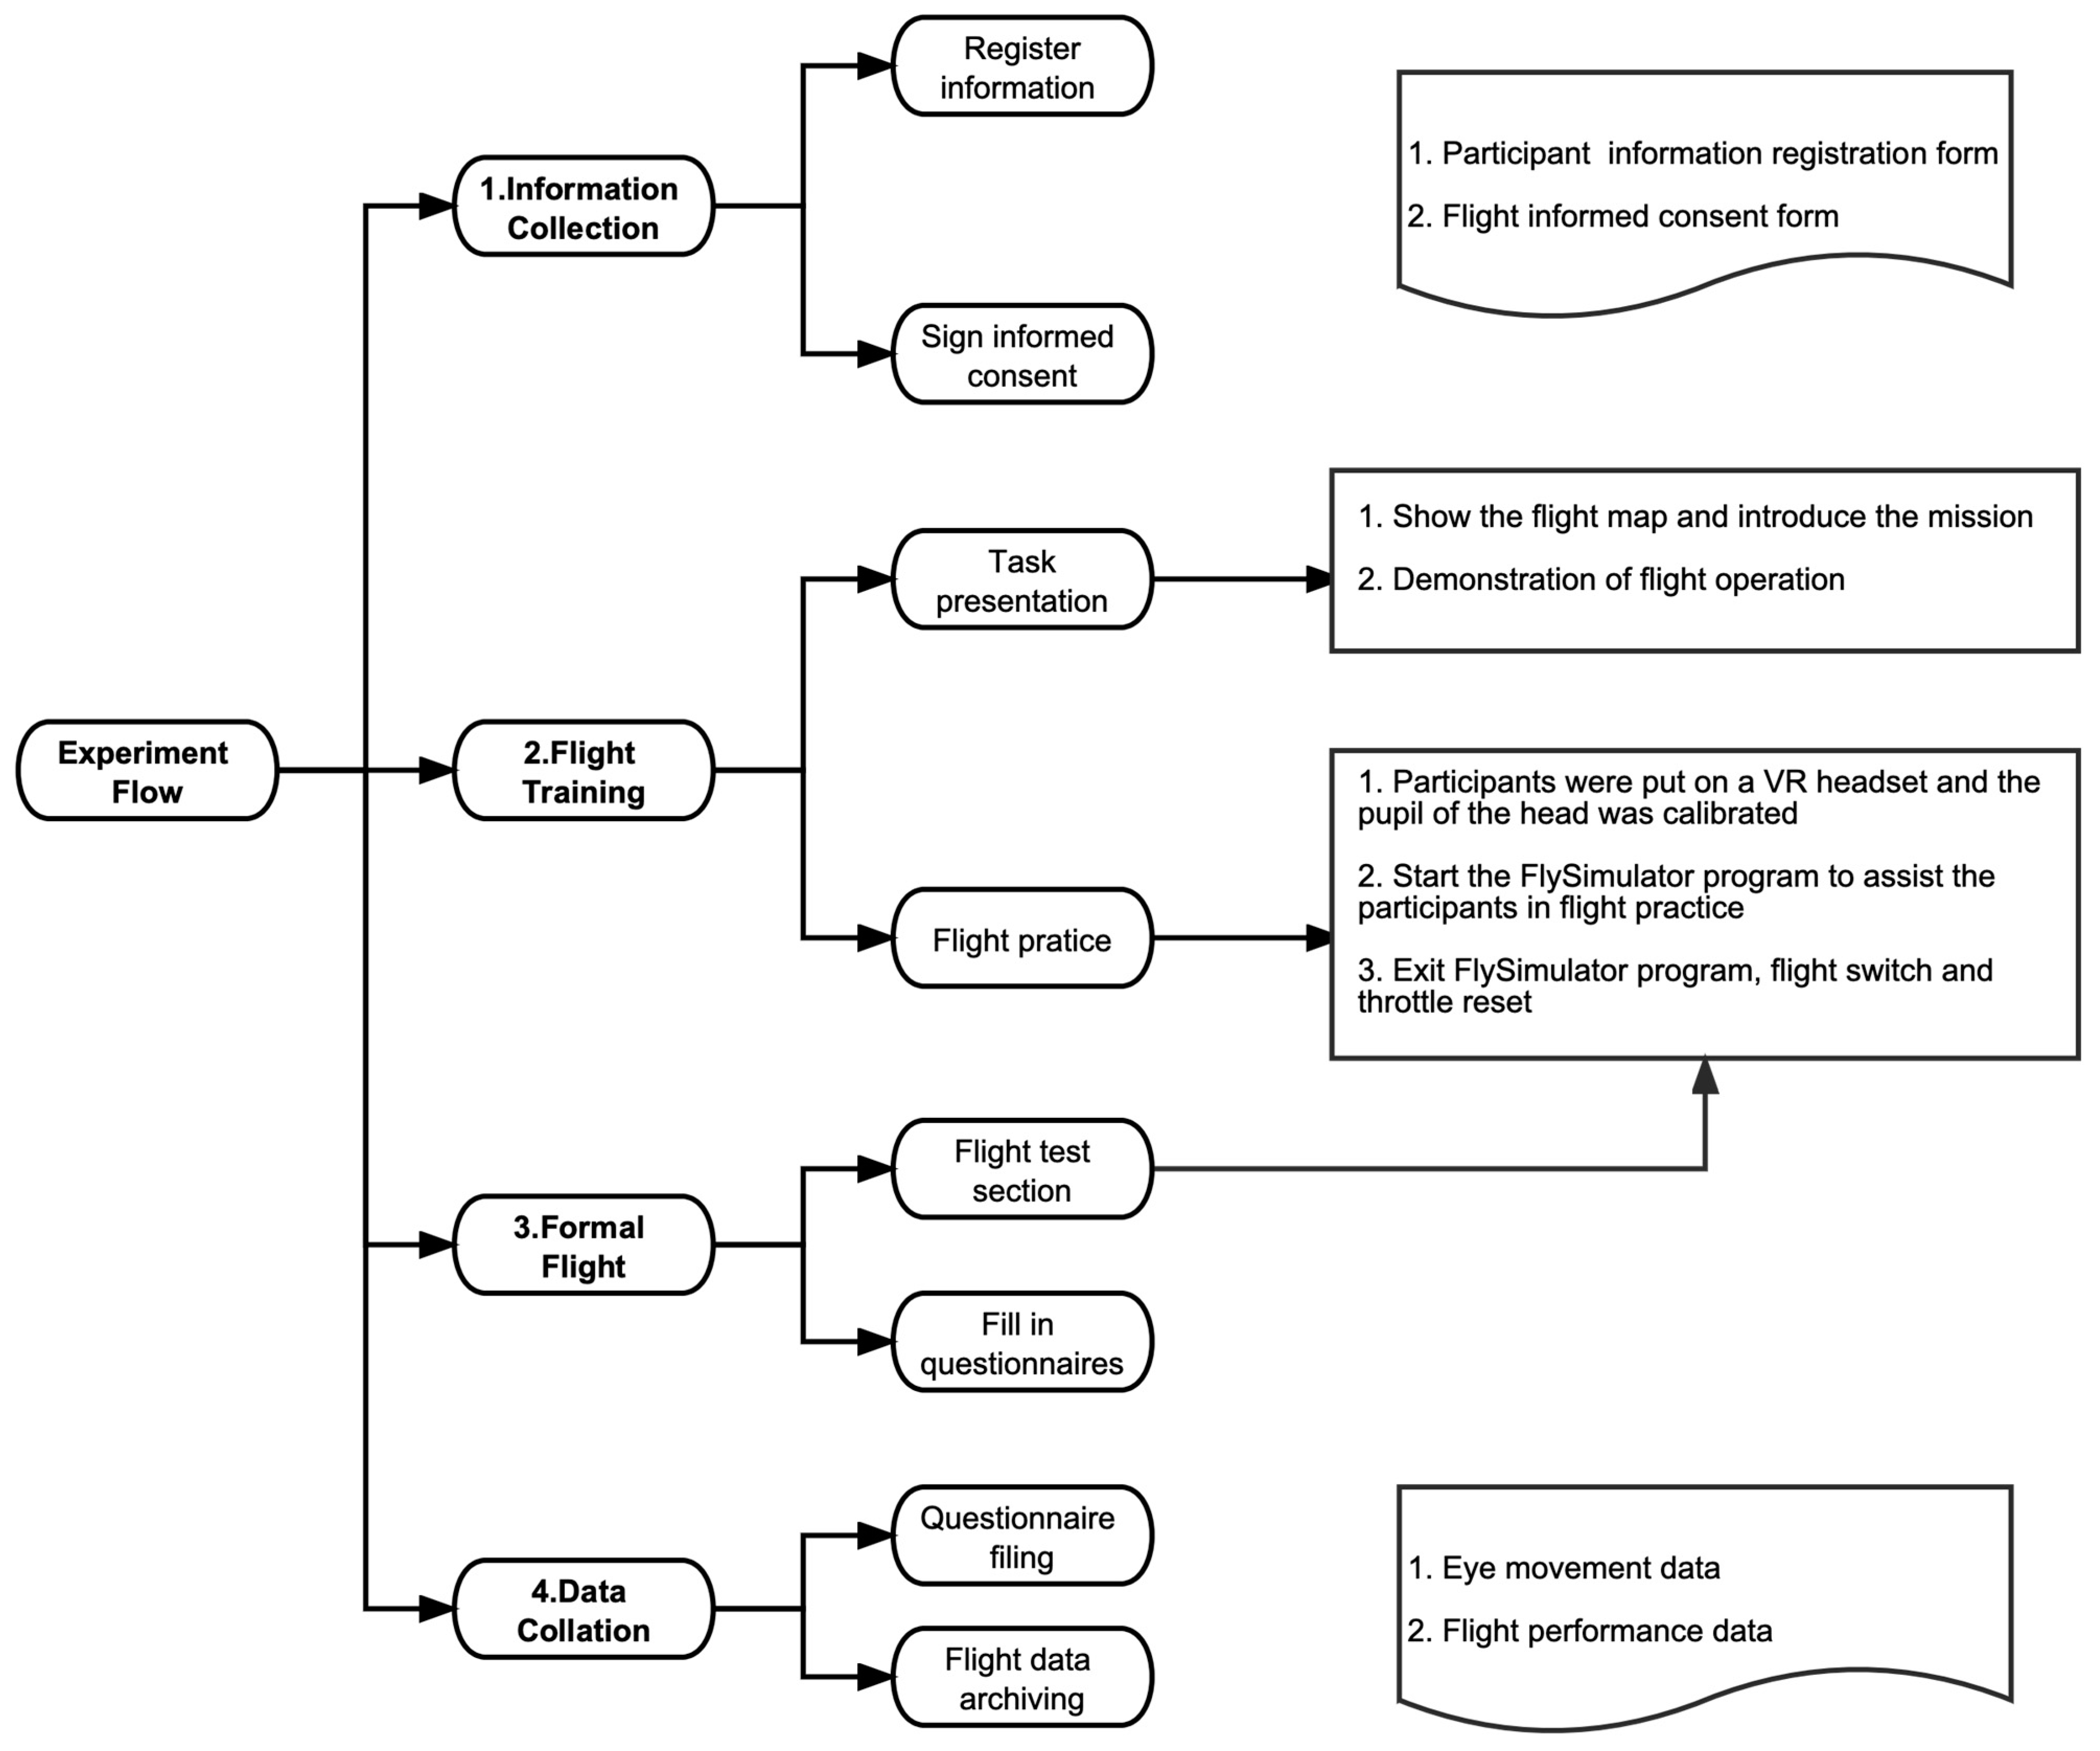
2.2.2. Experiment Process
2.3. Feature Selection Method
2.4. Predictors
2.5. Cross Validation
2.6. Metrics
2.7. Data Analysis
2.7.1. Flight Performance Data
2.7.2. Eye Movement Data
2.7.3. Statistic Analysis
2.7.4. Eye Movement Preprocessing & Analysis
2.7.5. Flight Dynamics Preprocessing & Analysis
2.7.6. Machine Learning Modeling
3. Results
3.1. Flight Performance Results
3.2. Eye Movement Analysis Results
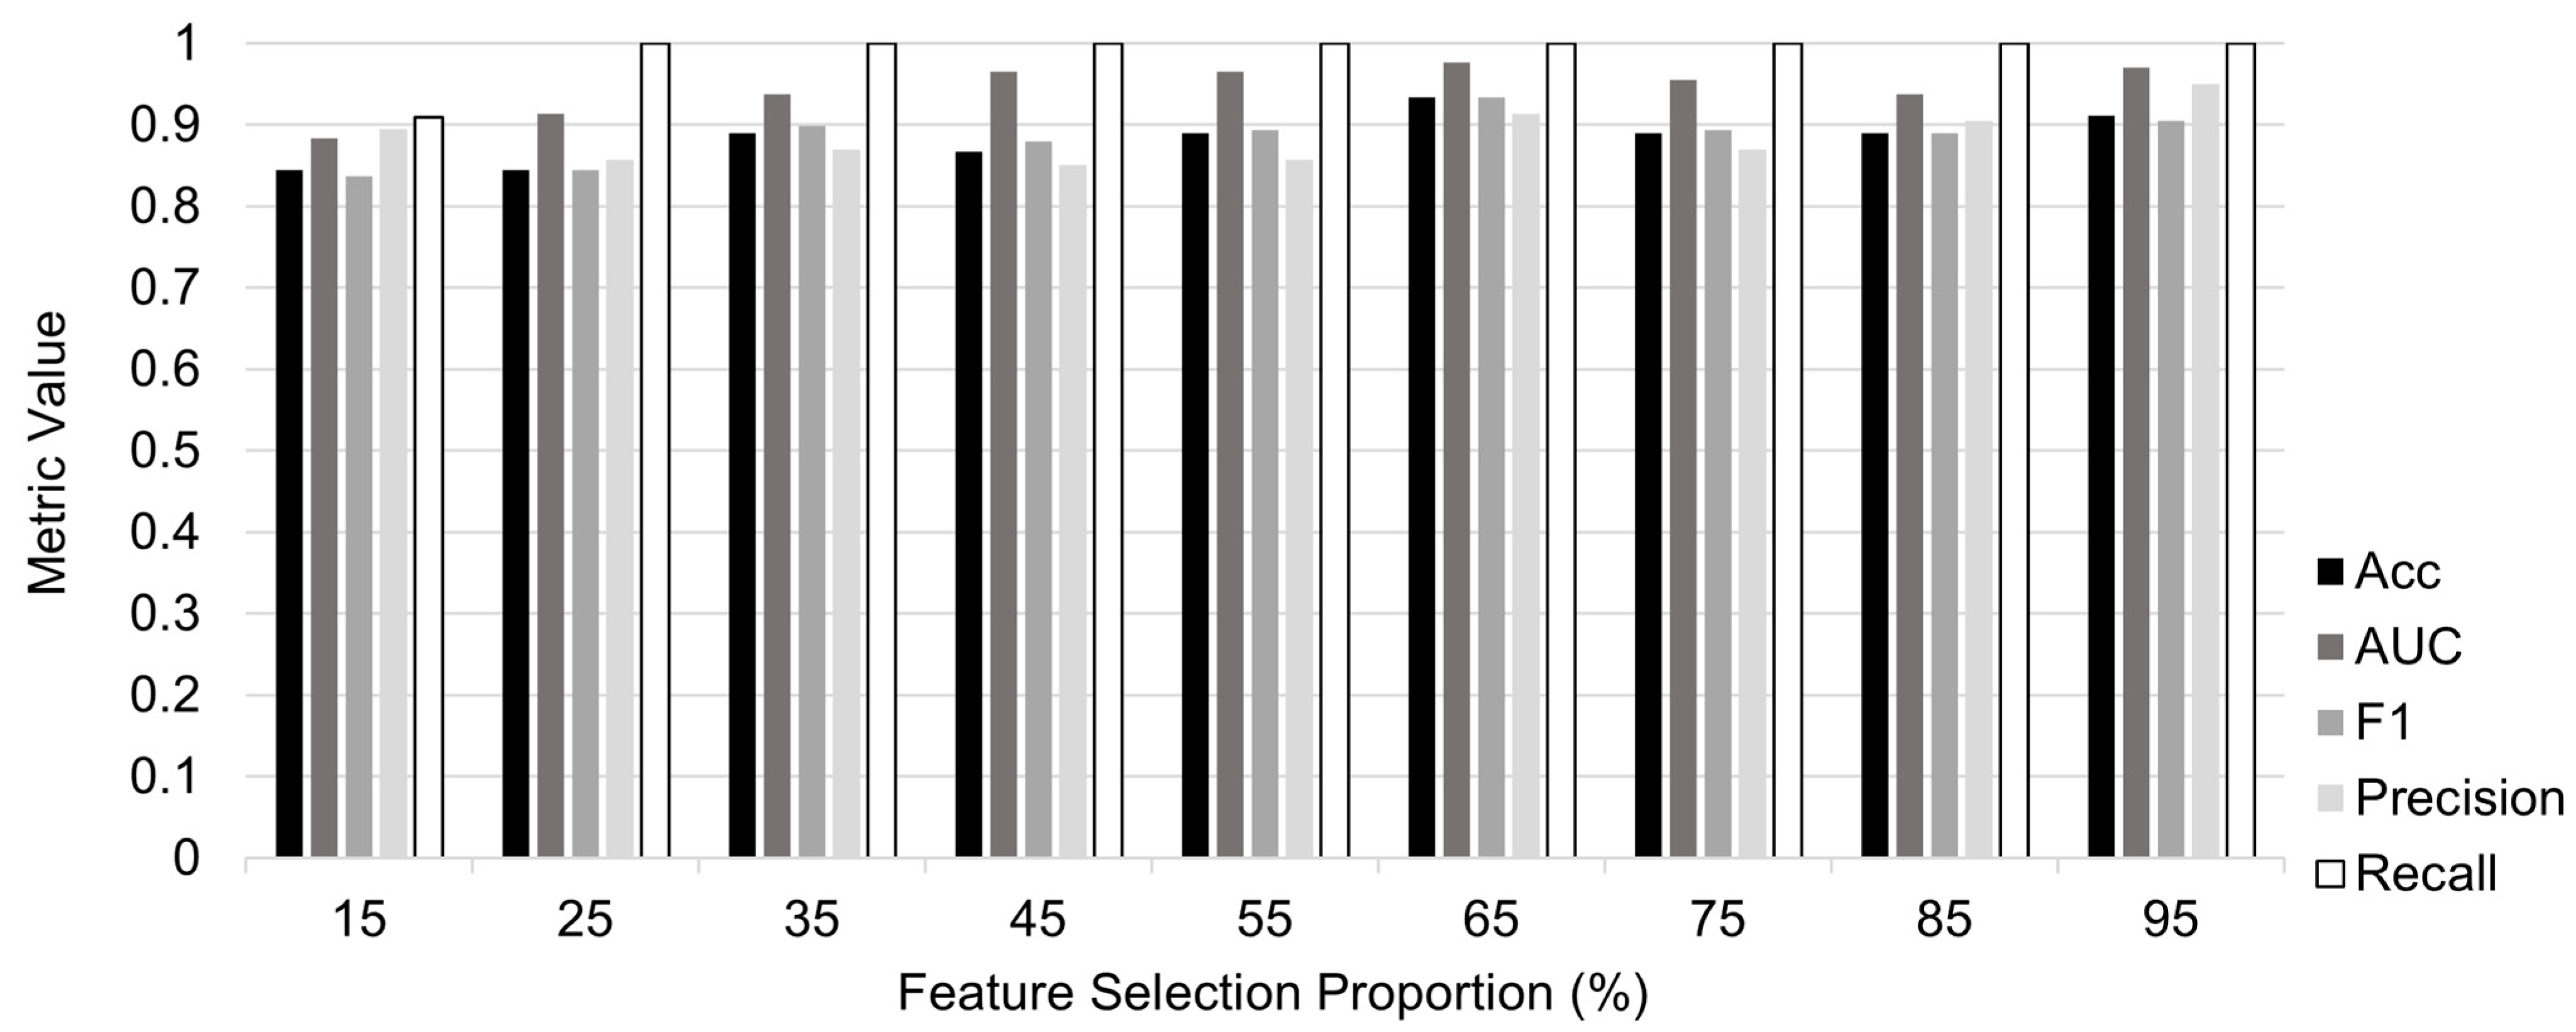
3.3. Evaluation of Different Proportions of Selected Features
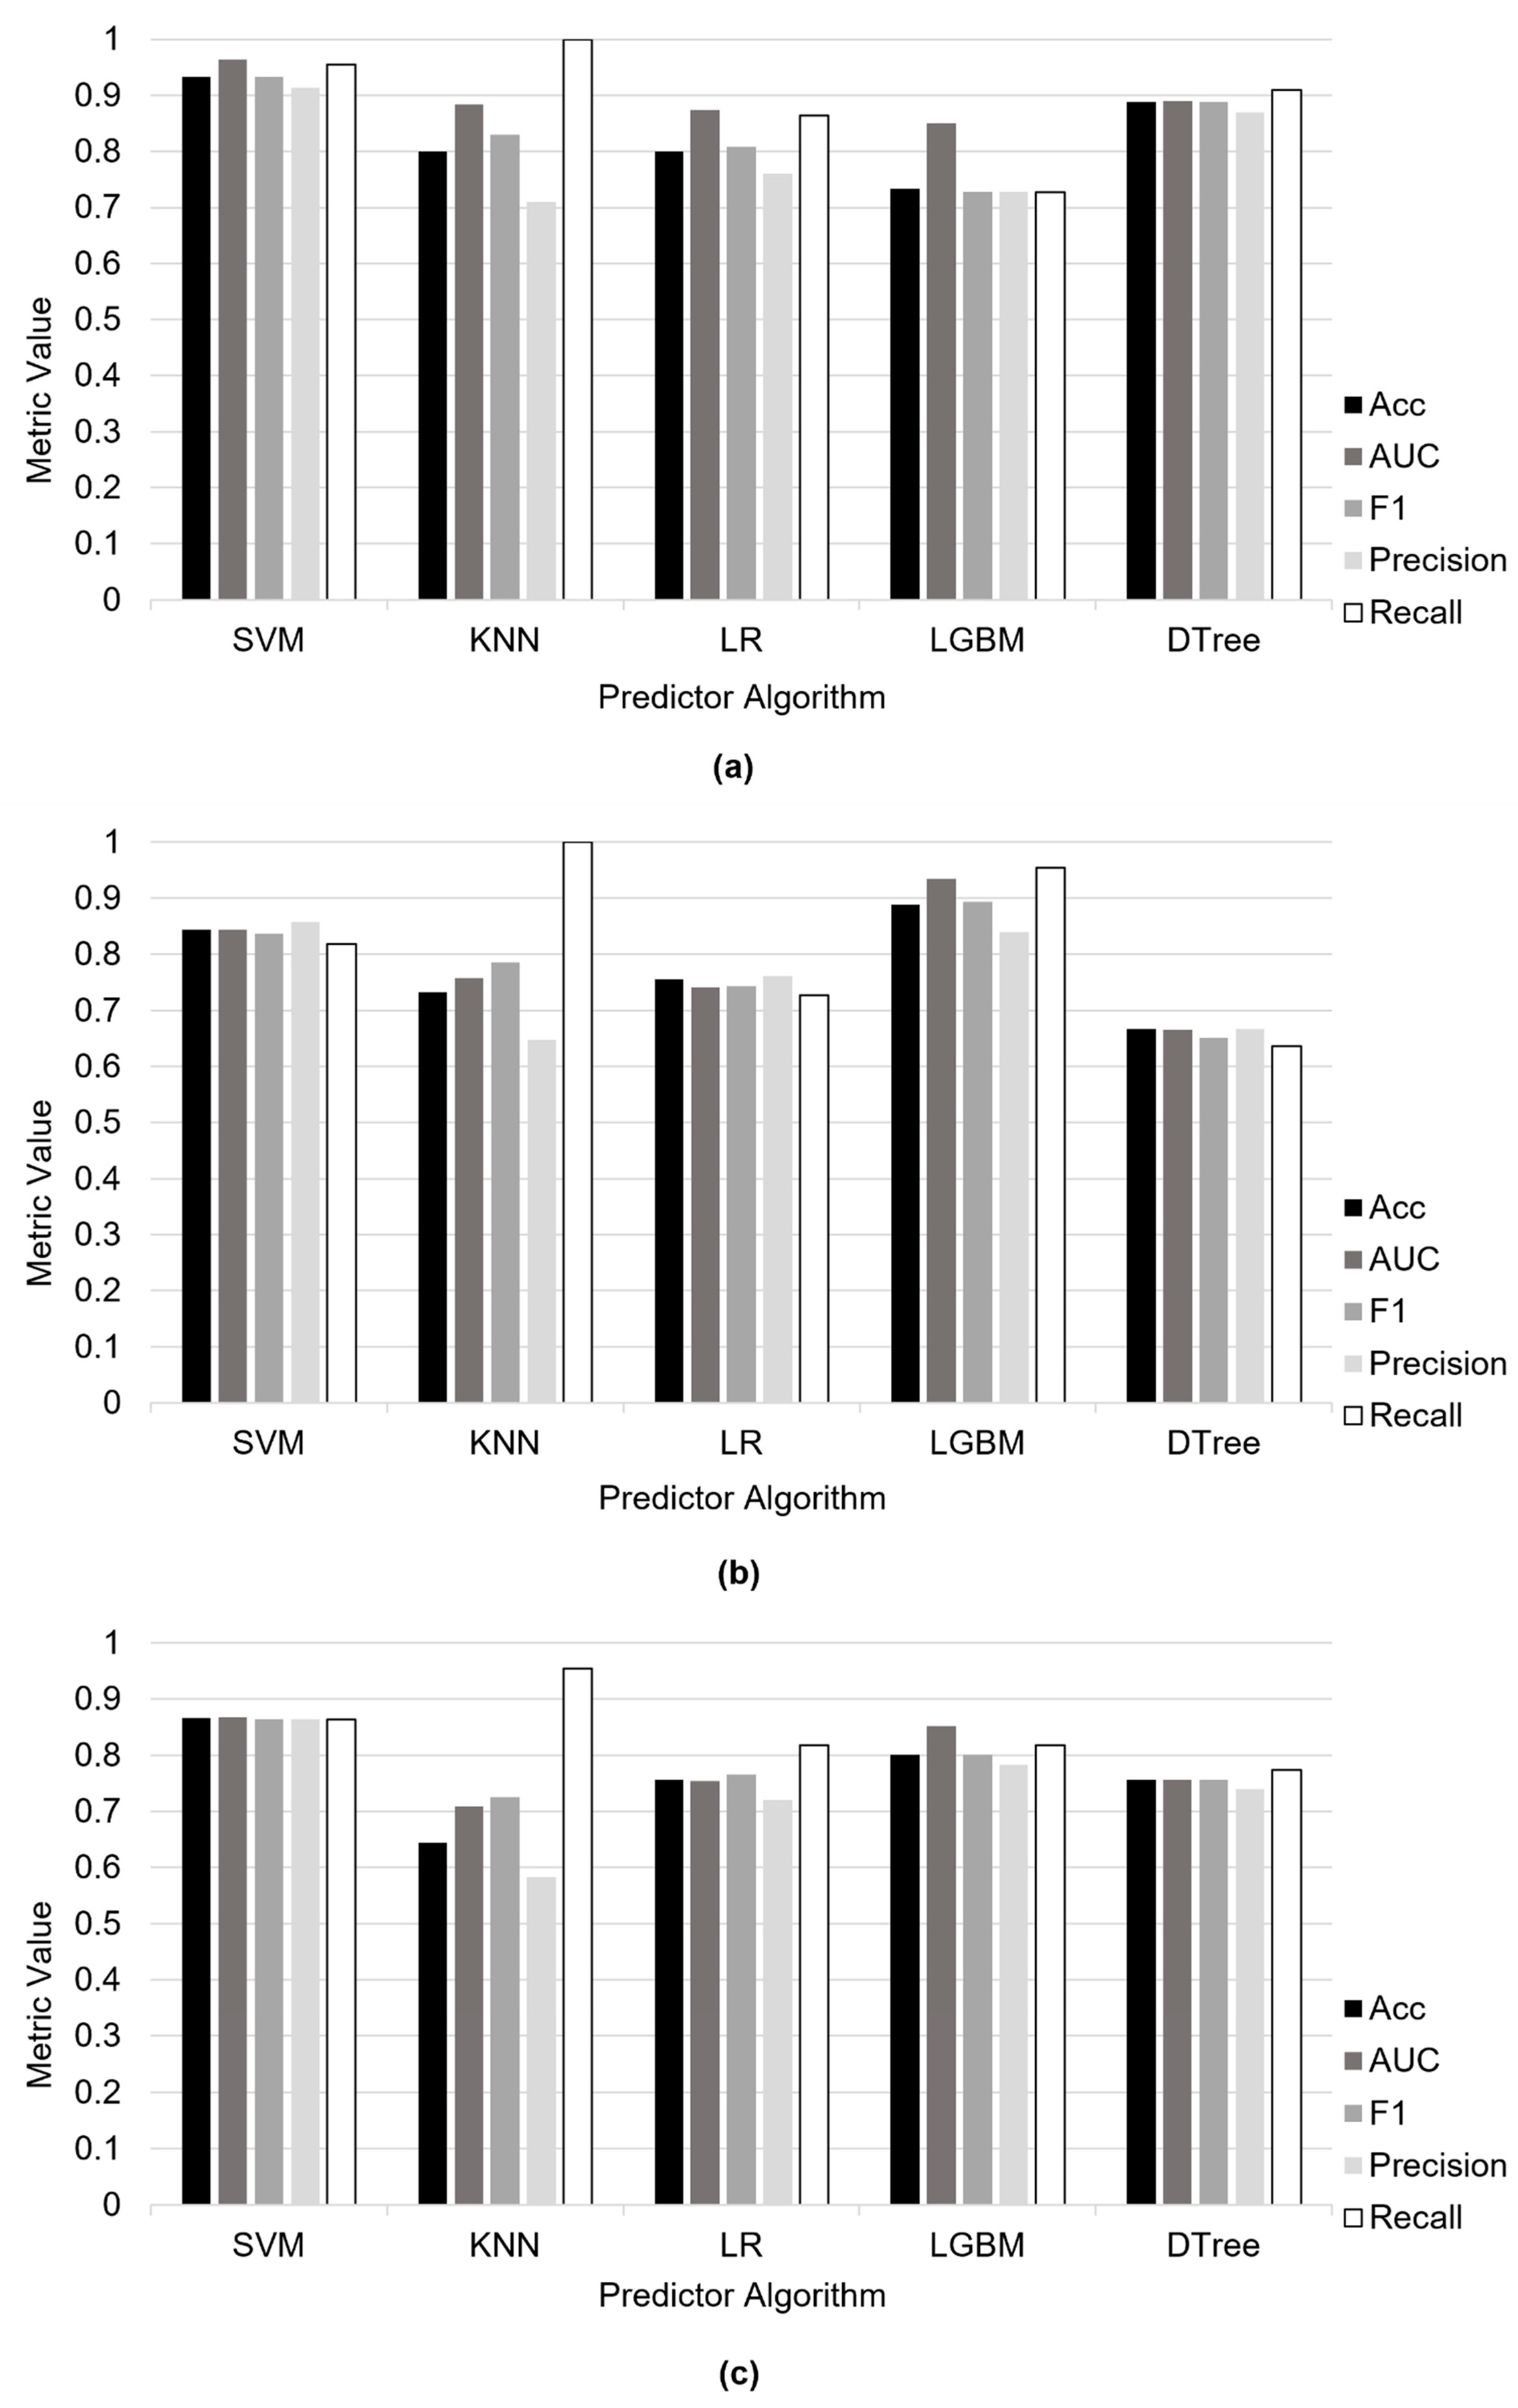
3.4. Performance Evaluation of Predictors and Feature Selection Methods
3.5. Ablation Experiments on Datasets
3.6. Interpretable Model Results Based Decision Tree (DTree)
4. Discussion
5. Conclusions
6. Limitations and Future Study
Author Contributions
Funding
Data Availability Statement
Acknowledgments
Conflicts of Interest
References
- Zheng, Z.; Gao, S.; Su, Y.; Chen, Y.; Wang, X. Cognitive load-induced pupil dilation reflects potential flight ability. Curr. Psychol. 2022, 1, 11. [Google Scholar] [CrossRef]
- Siem, F.M.; Carretta, T.R.; Mercatante, T.A. Personality, Attitudes, and Pilot Training Performance: Preliminary Analysis; Air Force Human Resources Lab., Brooks Air Force Base: San Antonio, TX, USA, 1988; Volume 1, p. 32. [Google Scholar]
- Byrnes, J.F.; Cascio, W. Costing human resources: The financial impact of behavior in organizations. Acad. Manag. Rev. 1984, 9, 370–371. [Google Scholar] [CrossRef]
- Lutte, R.; Lovelace, K. Airline pilot supply in the US: Factors influencing the collegiate pilot pipeline. J. Aviat. Technol. Eng. 2016, 6, 8. [Google Scholar] [CrossRef]
- Carretta, T.R.; Ree, M.J. Pilot-candidate selection method: Sources of validity. Int. J. Aviat. Psychol. 1994, 4, 103–117. [Google Scholar] [CrossRef]
- Martinussen, M.; Torjussen, T. Pilot selection in the Norwegian Air Force: A validation and meta-analysis of the test battery. Int. J. Aviat. Psychol. 1998, 8, 33–45. [Google Scholar] [CrossRef]
- Damos, D.L. Using meta-analysis to compare the predictive validity of single-and multiple-task measures to flight performance. Hum. Factors 1993, 35, 615–628. [Google Scholar] [CrossRef]
- Dang, J.; King, K.M.; Inzlicht, M. Why are self-report and behavioral measures weakly correlated? Trends Cogn. Sci. 2020, 24, 267–269. [Google Scholar] [CrossRef]
- ALMamari, K.; Traynor, A. Multiple test batteries as predictors for pilot performance: A meta-analytic investigation. Int. J. Sel. Assess. 2019, 27, 337–356. [Google Scholar] [CrossRef]
- Robinson, A.; Mania, K.; Perey, P. Flight simulation: Research challenges and user assessments of fidelity. In Proceedings of the 2004 ACM SIGGRAPH International Conference on Virtual Reality Continuum and Its Applications in Industry, Singapore, 16–18 June 2004; pp. 261–268. [Google Scholar]
- Goretzko, D.; Israel, L.S.F. Pitfalls of machine learning-based personnel selection: Fairness, transparency, and data quality. J. Pers. Psychol. 2022, 21, 37–47. [Google Scholar] [CrossRef]
- Yarkoni, T.; Westfall, J. Choosing prediction over explanation in psychology: Lessons from machine learning. Perspect. Psychol. Sci. 2017, 12, 1100–1122. [Google Scholar] [CrossRef]
- Phillips, P.; Hahn, C.; Fontana, P.; Yates, A.; Greene, K.; Broniatowski, D.; Przybocki, M. Four Principles of Explainable Artificial Intelligence, NIST Interagency/Internal Report (NISTIR); National Institute of Standards and Technology: Gaithersburg, MD, USA, 2021. Available online: https://tsapps.nist.gov/publication/get_pdf.cfm?pub_id=933399 (accessed on 20 January 2023).
- Peißl, S.; Wickens, C.D.; Baruah, R. Eye-tracking measures in aviation: A selective literature review. Int. J. Aerosp. Psychol. 2018, 28, 98–112. [Google Scholar] [CrossRef]
- Ziv, G. Gaze behavior and visual attention: A review of eye tracking studies in aviation. Int. J. Aviat. Psychol. 2016, 26, 75–104. [Google Scholar] [CrossRef]
- Lai, M.; Tsai, M.; Yang, F.; Hsu, C.; Liu, T.; Lee, S.; Lee, M.; Chiou, G.; Liang, J.; Tsai, C. A review of using eye-tracking technology in exploring learning from 2000 to 2012. Educ. Res. Rev. 2013, 10, 90–115. [Google Scholar] [CrossRef]
- Jin, H.; Hu, Z.; Li, K.; Chu, M.; Zou, G.; Yu, G.; Zhang, J. Study on how expert and novice pilots can distribute their visual attention to improve flight performance. IEEE Access 2021, 9, 44757–44769. [Google Scholar] [CrossRef]
- Yu, C.S.; Wang, E.M.Y.; Li, W.C.; Braithwaite, G.; Greaves, M. Pilots’ visual scan patterns and attention distribution during the pursuit of a dynamic target. Aerosp. Med. Hum. Perform. 2016, 87, 40–47. [Google Scholar] [CrossRef]
- Bellenkes, A.H.; Wickens, C.; Kramer, A. Visual scanning and pilot expertise: The role of attentional flexibility and mental model development. Aviat. Space Environ Med. 1997, 68, 569–579. [Google Scholar]
- Kasarskis, P.; Stehwien, J.; Hickox, J.; Aretz, A.; Wickens, C. Comparison of expert and novice scan behaviors during VFR flight. In Proceedings of the 11th International Symposium on Aviation Psychology, Columbus, OH, USA, 5–8 March 2001; Volume 6, pp. 1–6. [Google Scholar]
- Vlačić, S.; Knežević, A.; Rođenkov, S.; Mandal, S.; Vitsas, P.A. Improving the pilot selection process by using eye-tracking tools. J. Eye Mov. Res. 2020, 12, 10–16910. [Google Scholar] [CrossRef]
- Wang, L.; Ren, Y.; Sun, H.; Dong, C. A landing operation performance evaluation system based on flight data. In Proceedings of the International Conference on Engineering Psychology and Cognitive Ergonomics, Vancouver, BC, Canada, 9–14 July 2017; pp. 297–305. [Google Scholar]
- Le Ngoc, L.; Kalawsky, R.S. Visual circuit flying with augmented head-tracking on limited field of view flight training devices. In Proceedings of the AIAA Modeling and Simulation Technologies (MST) Conference, Grapevine, TX, USA, 9–13 January 2013; p. 5226. [Google Scholar]
- Oberhauser, M.; Dreyer, D.; Braunstingl, R.; Koglbauer, I. What’s real about virtual reality flight simulation? Comparing the fidelity of a virtual reality with a conventional flight simulation environment. Aviat. Psychol. Appl. Hum. Factors 2018, 8, 22–34. [Google Scholar] [CrossRef]
- Wang, L.; Ren, Y.; Wu, C. Effects of flare operation on landing safety: A study based on ANOVA of real flight data. Saf. Sci. 2018, 102, 14–25. [Google Scholar] [CrossRef]
- Sun, J.; Xiao, X.; Cheng, S.; Shen, C.; Ma, J.; Hu, W. Study on pilot personality selection with an SVM-Based classifier. In Proceedings of theInternational Conference on Man-Machine-Environment System Engineering, Nanjing, China, 20–22 October 2018; Springer: Singapore, 2018; pp. 3–10. [Google Scholar]
- Xiao, X.; Cheng, S.; Sun, J.; Ma, J.; Hu, W. A Pilot Study of Assessment of Civilian Pilot Personality Based on Support Vector Machine. Prog. Mod. Biomed. 2017, 17, 111–114. [Google Scholar]
- Lochner, K.; Nienhaus, N. The Predictive Power of Assessment for Pilot Selection. Technical Report Published by Cut-e Group. Retrieved 15 January 2023. 2016. Available online: https://www.cute.com/fileadmin/user_upload/Assessing_in_Aviation/White_Paper_Pilot_5238.pdf (accessed on 10 March 2023).
- Hunter, D.R.; Burke, E.F. Predicting aircraft pilot-training success: A meta-analysis of published research. Int. J. Aviat. Psychol. 1994, 4, 297–313. [Google Scholar] [CrossRef]
- Schmidt, F.L.; Hunter, J.E. The validity and utility of selection methods in personnel psychology: Practical and theoretical implications of 85 years of research findings. Psychol. Bull. 1998, 124, 262–274. [Google Scholar] [CrossRef]
- Jenkins, P.R.; Caballero, W.N.; Hill, R.R. Predicting success in United States Air Force pilot training using machine learning techniques. Socio-Econ. Plan. Sci. 2022, 79, 101121. [Google Scholar] [CrossRef]
- Maroco, J.; Bártolo-Ribeiro, R. Selection of air force pilot candidates: A case study on the predictive accuracy of discriminant analysis, logistic regression, and four neural network types. Int. J. Aviat. Psychol. 2013, 23, 130–152. [Google Scholar] [CrossRef]
- Wang, X.; Gong, G.; Li, N.; Ding, L.; Ma, Y. Decoding pilot behavior consciousness of EEG, ECG, eye movements via an SVM machine learning model. Int. J. Model. Simul. Sci. Comput. 2020, 11, 2050028. [Google Scholar] [CrossRef]
- Olsen, E.C.B.; Lee, S.E.; Simons-Morton, B.G. Eye movement patterns for novice teen drivers: Does 6 months of driving experience make a difference? Transp. Res. Rec. 2007, 2009, 8–14. [Google Scholar] [CrossRef]
- Liang, Y.; Lee, J.D. A hybrid Bayesian Network approach to detect driver cognitive distraction. Transp. Res. Part C Emerg. Technol. 2014, 38, 146–155. [Google Scholar] [CrossRef]
- Huang, M.W.; Chen, C.W.; Lin, W.C.; Ke, S.W.; Tsai, C.F. SVM and SVM ensembles in breast cancer prediction. PLoS ONE 2017, 12, e0161501. [Google Scholar] [CrossRef]
- Li, J.; Cheng, K.; Wang, S.; Morstatter, F.; Trevino, R.P.; Tang, J.; Liu, H. Feature selection: A data perspective. ACM Comput. Surv. 2017, 50, 1–45. [Google Scholar] [CrossRef]
- Khaire, U.M.; Dhanalakshmi, R. Stability of feature selection algorithm: A review. J. King Saud Univ.-Comput. Inf. Sci. 2022, 34, 1060–1073. [Google Scholar] [CrossRef]
- Nadimi-Shahraki, M.H.; Zamani, H.; Mirjalili, S. Enhanced whale optimization algorithm for medical feature selection: A COVID-19 case study. Comput. Biol. Med. 2022, 148, 105858. [Google Scholar] [CrossRef] [PubMed]
- Sheikhpour, R.; Sarram, M.A.; Gharaghani, S.; Chahooki, M.A.Z. A Survey on semi-supervised feature selection methods. Pattern Recognit. 2017, 100, 141–158. [Google Scholar] [CrossRef]
- Liu, C.; Wang, W.; Zhao, Q.; Shen, X.; Konan, M. A new feature selection method based on a validity index of feature subset. Pattern Recognit. Lett. 2017, 100, 1–8. [Google Scholar] [CrossRef]
- Wang, W.; Han, R.; Zhang, M.; Wang, Y.; Wang, T.; Wang, Y.; Shang, X.; Peng, J. A network-based method for brain disease gene prediction by integrating brain connectome and molecular network. Brief. Bioinform. 2022, 23, bbab459. [Google Scholar] [CrossRef]
- Wolff, J.; Backofen, R.; Gruening, B. Robust and efficient single-cell Hi-C clustering with approximate k-nearest neighbor graphs. Bioinformatics 2021, 37, 4006–4013. [Google Scholar] [CrossRef]
- Dong, C.; Qiao, Y.; Shang, C.; Liao, X.; Yuan, X.; Cheng, Q.; Li, Y.; Zhang, J.; Wang, Y.; Chen, Y.; et al. Non-contact screening system based for COVID-19 on XGBoost and logistic regression. Comput. Biol. Med. 2022, 141, 105003. [Google Scholar] [CrossRef]
- Wei, J.; Li, Z.; Pinker, R.T.; Wang, J.; Sun, L.; Xue, W.; Li, R.; Cribb, M. Himawari-8-derived diurnal variations in ground-level PM2.5 pollution across China using the fast space-time Light Gradient Boosting Machine (LightGBM). Atmos. Chem. Phys. 2021, 21, 7863–7880. [Google Scholar] [CrossRef]
- Ghiasi, M.M.; Zendehboudi, S. Application of decision tree-based ensemble learning in the classification of breast cancer. Comput. Biol. Med. 2020, 128, 104089. [Google Scholar] [CrossRef]
- Rafalo, M. Cross validation methods: Analysis based on diagnostics of thyroid cancer metastasis. ICT Express 2022, 8, 183–188. [Google Scholar] [CrossRef]
- Wong, T.-T. Performance evaluation of classification algorithms by k-fold and leave-one-out cross validation. Pattern Recognit. 2015, 48, 2839–2846. [Google Scholar] [CrossRef]
- Camacho, J.; Ferrer, A. Cross-validation in PCA models with the element-wise k-fold (ekf) algorithm: Theoretical aspects. J. Chemom. 2012, 26, 361–373. [Google Scholar] [CrossRef]
- Liang, X.W.; Jiang, A.P.; Li, T.; Xue, Y.Y.; Wang, G.T. LR-SMOTE—An improved unbalanced data set oversampling based on K-means and SVM. Knowl.-Based Syst. 2020, 196, 105845. [Google Scholar] [CrossRef]
- Chua, Z.K.; Feigh, K.M. Quantifying pilot performance during landing point redesignation for system design. J. Aerosp. Comput. Inf. Commun. 2011, 8, 183–196. [Google Scholar] [CrossRef]
- Tanveer, A. GitHub-Tanvcodes/Qar_Analytics: Scripts for Working with Publicly Available Quick Access Recorder (QAR) Data from a Fleet of 35 BAE-146 Aircraft. Retrieved on 2 March 2023. 2022. Available online: https://github.com/tanvcodes/qar_analytics (accessed on 10 March 2023).
- Weber, L. International Civil Aviation Organization (ICAO); Kluwer Law International BV: Alphen aan den Rijn, The Netherlands, 2021. [Google Scholar]
- Cervantes, J.; Garcia-Lamont, F.; Rodríguez-Mazahua, L.; Lopez, A. A comprehensive survey on support vector machine classification: Applications, challenges and trends. Neurocomputing 2020, 408, 189–215. [Google Scholar] [CrossRef]
- Yin, Z.; Hou, J. Recent advances on SVM based fault diagnosis and process monitoring in complicated industrial processes. Neurocomputing 2016, 174, 643–650. [Google Scholar] [CrossRef]
- Vergara, J.R.; Estevez, P. A review of feature selection methods based on mutual information. Neural Comput. Appl. 2014, 24, 175–186. [Google Scholar] [CrossRef]
- Bolon-Canedo, V.; Sanchez-Marono, N.; Alonso-Betanzos, A. A review of feature selection methods on synthetic data. Knowl. Inf. Syst. 2013, 34, 483–519. [Google Scholar] [CrossRef]
- Carretta, T.U.S. Air Force pilot selection and training methods. Aviat. Space Environ. Med. 2000, 71, 950–956. [Google Scholar]
- Carretta, T.R. Pilot Candidate Selection Method. Aviat. Psychol. Appl. Hum. Factors 2011, 1, 3–8. [Google Scholar] [CrossRef]
- Bhargava, B.C.; Deshmukh, A.; Narasimhadhan, A.V. Modulation and signal class labelling with active learning and classification using machine learning. In Proceedings of the 2022 IEEE International Conference on Electronics, Computing and Communication Technologies (CONECCT), Bangalore, India, 8–10 July 2022; pp. 1–5. [Google Scholar]
- Hunter, J.E.; Hunter, R. Validity and utility of alternative predictors of job performance. Psychol. Bull. 1984, 96, 72–98. [Google Scholar] [CrossRef]
- Carretta, T.R.; Ree, M.J. Pilot Selection Methods. In Principles and Practice of Aviation Psychology; Lawrence Erlbaum Associates Publishers: Mahwah, NJ, USA, 2003; pp. 357–396. [Google Scholar]
- Rafi, M.; Chandrasekaran, B.; Kusmez, B.; Steck, J.E.; He, J. Real-time Google glass heads-up display for rapid air-traffic detection. J. Aircr. 2017, 55, 263–274. [Google Scholar] [CrossRef]
- McCombes, S. Sampling Methods|Types. Techniques & Examples. Scribbr. 1 December 2022. Available online: https://www.scribbr.com/methodology/sampling-methods/ (accessed on 10 March 2023).
- Yanıkoğlu, Ö.; Kılıç, S.; Küçükönal, H. Gender in the cockpit: Challenges faced by female airline pilots. J. Air Transp. Manag. 2020, 86, 101823. [Google Scholar] [CrossRef]
- Pilot Institute. Women Pilot Statistics: Female Representation in Aviation. 7 October 2022. Available online: https://pilotinstitute.com/women-aviation-statistics/ (accessed on 10 March 2023).


| Index | Feature/Variable Names | Calculation Method | Performance Indication |
|---|---|---|---|
| 1 | Standard deviation of fixation in x axis | The standard deviation of FVL_X, e.g., numpy.std(data[‘ FVL_X’]) | Indicates the horizontal dispersion of fixations, or how wide participants looked |
| 2 | Standard deviation of fixation in y axis | The standard deviation of FVL_Y, e.g., numpy.std(data[‘ FVL_Y’]) | Indicates the vertical dispersion of fixations, or whether participants looked up and down. This often relates to whether pilots are able to look forward and near areas to guide their flight path |
| 3 | Standard deviation of fixation in z axis | The standard deviation of FVL_Z, e.g., numpy.std(data[‘ FVL_Z’]) | Indicates the depth of visual attention |
| 4 | Eye opening (%, from 0 to 1) | The mean of EOL or EOR, e.g., numpy.average(data[‘EOL’]) | Indicates how wide the eye opens, which is related to participants’ interests and workload |
| 5 | Percent dwell time (%) on each AOI | ( is a specific AOI, such as the altitude indicator; k = 1, 2, …, refer to all the indicators, where N = 19, as we have a total of 19 AOIs.) | Indicates the relative attention to a specific AOI, reflecting cognitive processing and understanding of information in that AOI. Note: This is labelled as “AOI” information in machine learning section; all others in this table labelled as “EM” (eye movement) |
| 6 | Frequency of AOI transitions (Hz) | The number of sequential pairs () where i! = j, divided by time | Indicates how actively participants look for information from gauges, which suggests understanding meaning of gauges |
| 7 | Fixation duration (ms). | Use i-VT algorithm to detect fixation, with threshold for velocity of 30 o/s | Larger value indicates more time spent on processing visual information |
| 8 | Fixation count | The number of fixations | Indicates actively looking for information |
| Index | Feature/Variable Names | Performance Indication |
|---|---|---|
| 1 | ldg_time (s) | landing time, that is, the time when the airplane lands, which is used as reference time point for the 1 s and 8 s before landing |
| 2 | Vert_accel_landing | Vertical acceleration when landing |
| 3 | AOA (1 s or 8 s before landing) (°) | Angle of Attack 1 s or 8 s before landing |
| 4 | AOA (min & max values) | The minimum and maximum values of Angle of Attack |
| 5 | Pitch_angle(1 s or 8 s before landing) (°) | Pitch angle 1 s or 8 s before landing |
| 6 | RudderInput (1 s or 8 s before landing) | Rudder input 1 s or 8 s before landing |
| 7 | ElevatorInput (1 s or 8 s before landing) | Elevator input 1 s or 8 s before landing |
| 8 | RollInput(1 s or 8 s before landing) | Roll input 1 s or 8 s before landing |
| 9 | TAS (1 s or 8 s before landing) (m/s) | True air speed (TAS) 1 s or 8 s before landing in unit of m/s |
| 10 | GS(1 s or 8 s before landing) (m/s) | Ground speed (GS) 1 s or 8 s before landing in unit of m/s |
| 11 | Velocity_Descent_mean (m/s) | Average descent velocity when landing in unit of m/s |
| 12 | Longitude_err (mean + SD) (m) | The mean and standard deviation (SD) of the airplane position in the longitude axis relative to the nearest center of the two reference lines |
| 13 | Latitude_err (mean + SD) (m) | The mean and standard deviation (SD) of the airplane position in the latitude axis relative to the nearest center of the two reference lines |
| 14 | Height_err (mean + SD) (m) | The mean and standard deviation (SD) of the airplane position in the height axis relative to the nearest center of the two reference lines |
| 15 | dist_err (mean + SD) (m) | The mean and standard deviation (SD) of the distance of the airplane position to the nearest center of the two reference lines |
| 16 | rou (min & max values) | The minimum and maximum values of the turning curvature of the airplane, with larger values indicating possibly unsafe sharp turning |
| 17 | acc_h_max (m/s2) | The maximum value of the vertical acceleration |
| 18 | acc_xy_max (m/s2) | The maximum values of the acceleration in the horizontal plane, with the recommended acc_xy_max value for civil aviation pilots being 1 G |
| 19 | Roll (min & max values) | The minimum and maximum values of Roll angle |
| 20 | Pitch (min & max values) | The minimum and maximum values of Pitch angle |
| 21 | slide_length (m) | The distance the airplane travelled after landing until full stop; the upper limit for this value is often 1800 m at most airports |
| Indicators | Novice | Expert | t | p | Cohen’s d |
|---|---|---|---|---|---|
| Mean (SD) | Mean (SD) | ||||
| The total flight time (s) | 902.32 (336.73) | 759.06 (163.58) | 1.84 | 0.07 | 0.54 |
| Pitch angle 1 s before landing (°) | −12.54 (29.03) | 3.97 (24.43) | 2.09 | * | 0.62 |
| Mean pitch angle 0–10 s before landing (°) | −6.25 (9.28) | −0.54 (7.37) | 2.31 | * | 0.68 |
| Standard deviation of pitch angle 0–10 s before landing (°) | 21.50 (14.31) | 13.18(14.15) | 1.96 | 0.06 | 0.58 |
| Mean distance to center of reference lines (m) | 873.89 (818.43) | 176.67 (205.52) | 3.96 | *** | 1.17 |
| Standard deviation of distance to center of reference lines (m) | 675.78 (589.07) | 211.52 (225.76) | 3.53 | *** | 1.04 |
| Area of Interest (AOI) | Novice | Expert | t | p | Cohen’s d |
|---|---|---|---|---|---|
| Mean (SD) | Mean (SD) | ||||
| Airspeed indicator | 5.32 (4.98) | 8.56 (5.45) | 2.11 | * | 0.64 |
| Attitude indicator | 31.03 (12.2) | 25.15 (9.23) | 1.84 | 0.07 | 0.56 |
| Vertical speed indicator | 5.33 (4.11) | 13.11 (8.84) | 3.83 | *** | 1.15 |
| Altitude indicator | 1.34 (2.22) | 2.83 (2.29) | 2.24 | * | 0.68 |
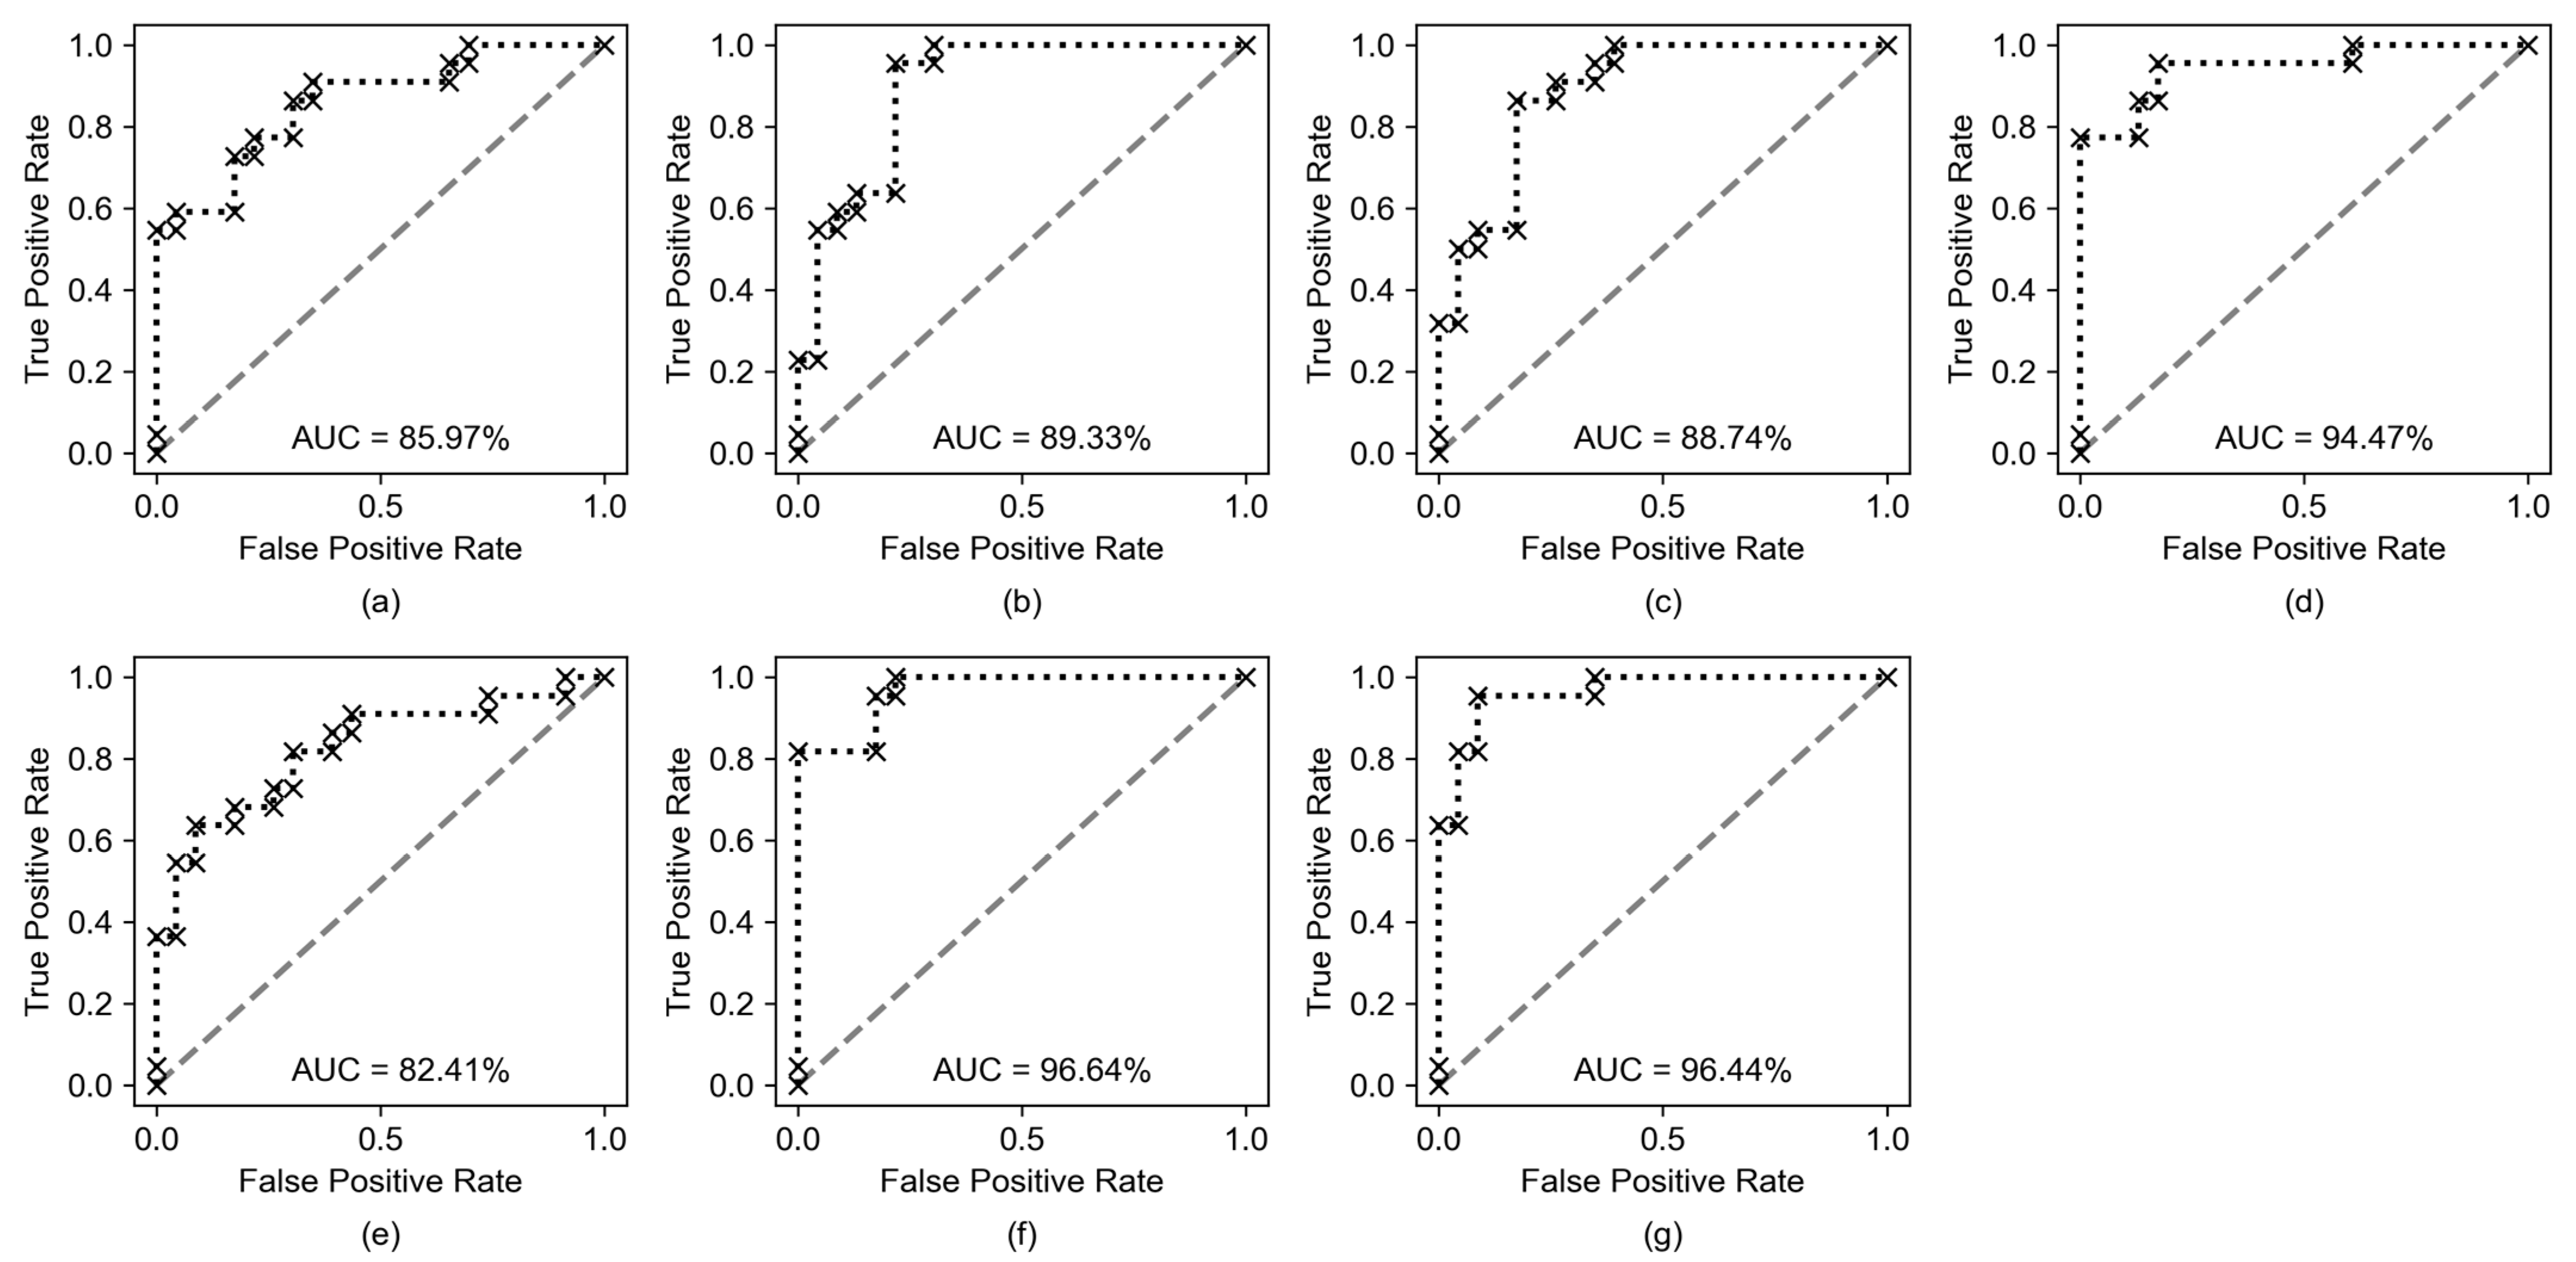
| Dataset | Acc | AUC | F1 | Precision | Recall |
|---|---|---|---|---|---|
| AOI | 0.7333 | 0.8597 | 0.7000 | 0.7778 | 0.6364 |
| EM | 0.8222 | 0.8933 | 0.8400 | 0.7500 | 0.9545 |
| QAR | 0.8444 | 0.8874 | 0.8444 | 0.8261 | 0.8636 |
| AOI & EM | 0.8667 | 0.9447 | 0.8696 | 0.8333 | 0.9091 |
| AOI & QAR | 0.7556 | 0.8241 | 0.7317 | 0.7895 | 0.6818 |
| EM & QAR | 0.8667 | 0.9664 | 0.8696 | 0.8333 | 0.9091 |
| AOI & EM & QAR | 0.9333 | 0.9644 | 0.9333 | 0.9130 | 0.9545 |
Disclaimer/Publisher’s Note: The statements, opinions and data contained in all publications are solely those of the individual author(s) and contributor(s) and not of MDPI and/or the editor(s). MDPI and/or the editor(s) disclaim responsibility for any injury to people or property resulting from any ideas, methods, instructions or products referred to in the content. |
© 2023 by the authors. Licensee MDPI, Basel, Switzerland. This article is an open access article distributed under the terms and conditions of the Creative Commons Attribution (CC BY) license (https://creativecommons.org/licenses/by/4.0/).
Share and Cite
Ke, L.; Zhang, G.; He, J.; Li, Y.; Li, Y.; Liu, X.; Fang, P. Pilot Selection in the Era of Virtual Reality: Algorithms for Accurate and Interpretable Machine Learning Models. Aerospace 2023, 10, 394. https://doi.org/10.3390/aerospace10050394
Ke L, Zhang G, He J, Li Y, Li Y, Liu X, Fang P. Pilot Selection in the Era of Virtual Reality: Algorithms for Accurate and Interpretable Machine Learning Models. Aerospace. 2023; 10(5):394. https://doi.org/10.3390/aerospace10050394
Chicago/Turabian StyleKe, Luoma, Guangpeng Zhang, Jibo He, Yajing Li, Yan Li, Xufeng Liu, and Peng Fang. 2023. "Pilot Selection in the Era of Virtual Reality: Algorithms for Accurate and Interpretable Machine Learning Models" Aerospace 10, no. 5: 394. https://doi.org/10.3390/aerospace10050394