1. Introduction
Taking advantage of a high propulsion efficiency and an excellent takeoff and landing performance, propellers are still one of the most important military and civilian aircraft power units and are widely used in large-, medium-, and small-transport aircrafts, unmanned aerial vehicles (UAVs), and electric aircrafts. At present, decent progress in propeller technologies has been observed; yet, this has focused on its excessive noise level. For civil applications, the external noise airworthiness standard needed to be satisfied, and the riding quality was affected by noise transmitted into the cabin. For military applications, acoustic stealth performance was also affected by its excessive noise. Nowadays, the continuous growth of UAV and general aviation markets and the increasing attention paid to environmental issues have been promoting the development of low-noise propeller design technology.
Unlike the noise reduction of turbofans, which can be commonly achieved at the sound transmission stage, i.e., the installation of a nacelle acoustic liner, the noise reduction of propellers has to be accomplished by lowering its sound source intensity through the formation of the blade structure and shape. This leads to a strong correlation between the design of a low-noise propeller and its aerodynamic design and strength design. However, the aerodynamic performance, strength, and noise are naturally conflicted. Therefore, the low-noise design of the propeller usually requires multidisciplinary optimization methods.
The multidisciplinary optimization algorithm can achieve a good compromise between a propeller’s aerodynamic performance, strength, and noise, and it has been applied to the optimization design of the propeller. Burger considered the two disciplines of aerodynamics and noise, in which a lifting surface is applied to calculate the aerodynamic performance, and the empirical model developed by Smith is applied to calculate the acoustic performance [
1,
2]. Later, many scholars carried out optimization design by comprehensively considering aerodynamics, noise, and structural strength. Pagano et al. carried out research on low-noise propeller design for P180 aircraft and calculated aerodynamic performance using a full potential flow model, and the FW-H method was used to calculate noise [
3,
4,
5]. Marinus carried out a lot of low-noise design work for propellers. In his previous research, he mainly considered two disciplines: aerodynamics and noise [
6]. Later, he also took structural strength into account [
7]. He used computational fluid dynamics (CFD) to calculate aerodynamic performance and the Farasset 1A equation [
8] to calculate aeroacoustic performance. Ohad carried out a low-noise multidisciplinary design for small UAV propellers, applied the blade element method to calculate the propeller aerodynamic performance, and applied the FW-H equation to calculate the aeroacoustic performance [
9,
10]. At present, it is only the ANIBAL propeller that was formed through multidisciplinary optimization and finally manufactured and tested. The lifting surface method and FW-H equation are used to calculate aerodynamic and acoustic performance.
At present, there are two deficiencies in the multidisciplinary optimization of low-noise propellers: (1) An insufficient consideration of structural strength. The low-noise propeller that has been verified is a straight-blade propeller, which is designed for light propeller aircraft. The low-noise propeller designed by Marinus et al. has not been manufactured and tested [
7]. (2) The method of calculating the propeller aerodynamic performance has a low accuracy or efficiency, which is not suitable for low-noise propeller optimization. The blade element method cannot consider the airflow movement along the blade radial direction, and the lift line cannot consider the twist angle change along the blade radial direction, while the CFD combined agent model method leads to low optimization efficiency.
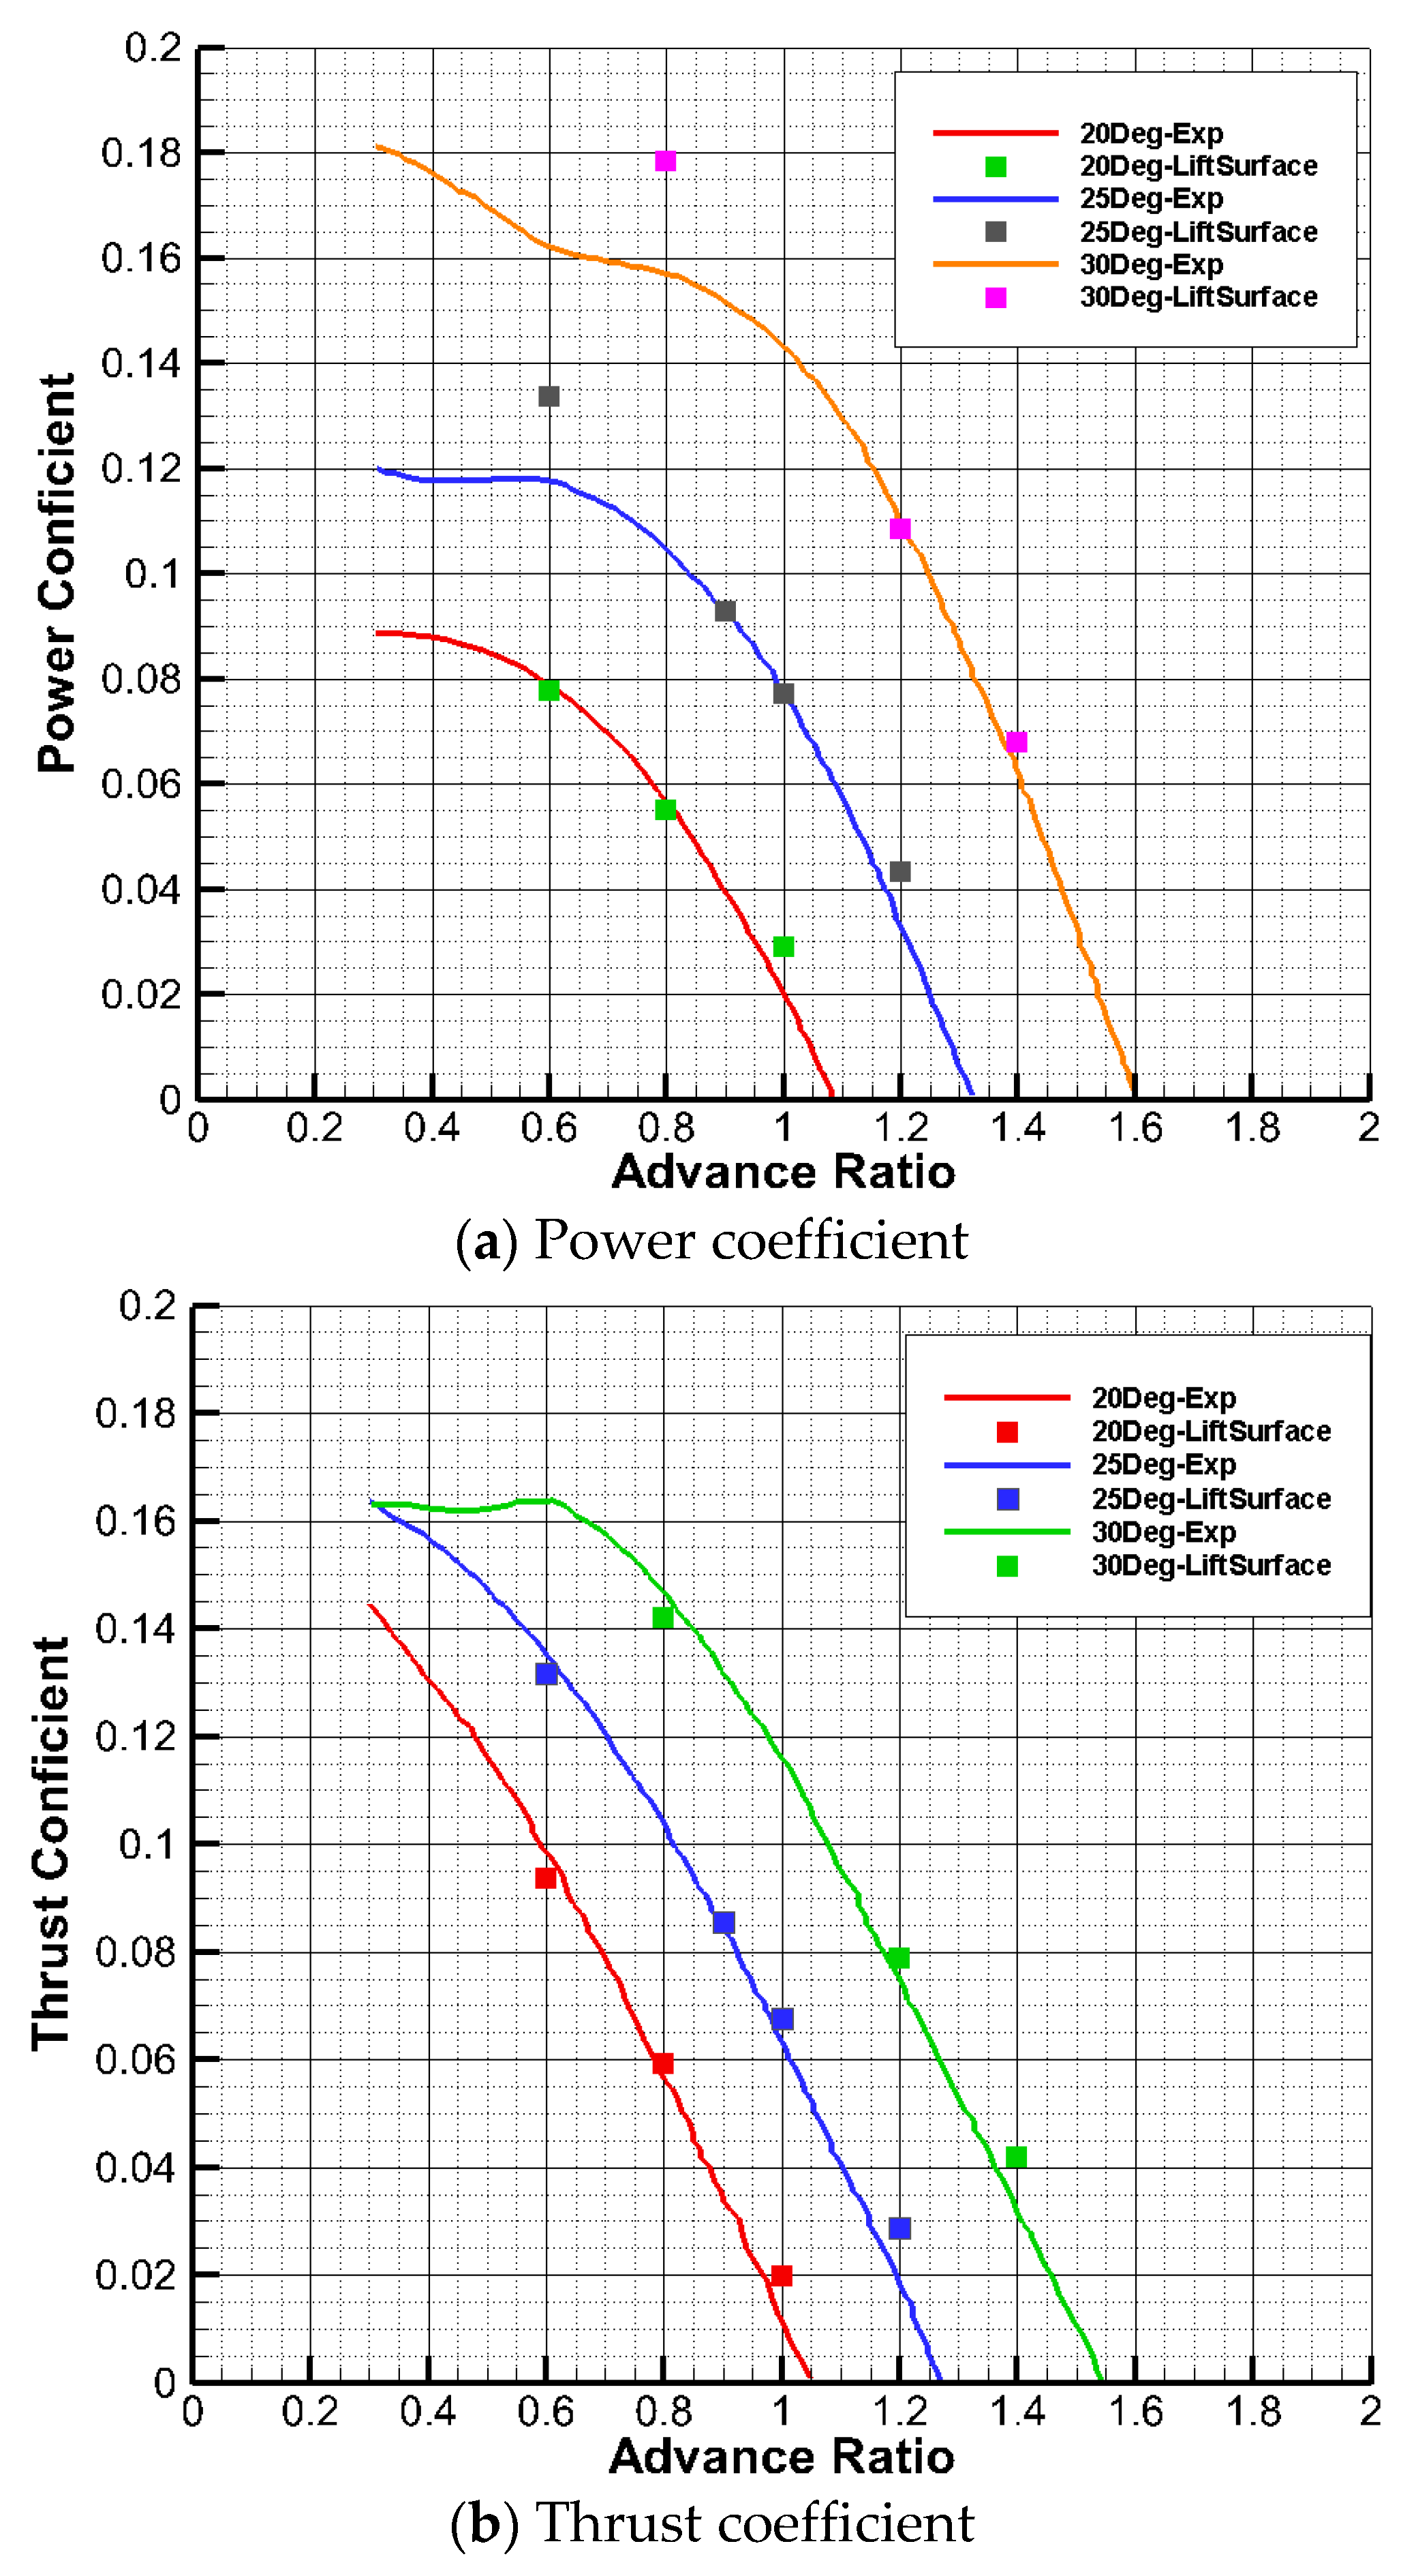
In this paper, aerodynamic, acoustic, and structural strength will be fully considered in the low-noise design of the propeller. Previous studies have shown that the lift surface method has a very high accuracy for predicting the aerodynamic performance of a propeller, with a tip Mach number less than 0.7 Ma [
11]. This method belongs to the analytical method and has a high optimization efficiency. Kotwicz et al. studied the acoustic prediction accuracy of different computational models by comparing them with several experimental results [
12,
13]. The results show that the Hanson model has a higher accuracy than those of other models used for predicting pure noise. In this paper, Hanson’s method will be used to calculate propeller noise [
14]. The strength of the blade structure is considered by adding constraints to the design variables. At the same time, the sweep and the large deformation of the blade under a 50% radius were avoided.
This paper includes the following four parts: First, the calculation method of propeller aerodynamics and noise is briefly presented, and the code is verified. Second, blade parameterization, constraint determination, optimization strategy, method determination, optimization design, and discussion are carried out, respectively. Third, propeller strength, aerodynamic, and noise verification is carried out. Finally, a summary is given.
3. Multidisciplinary Optimization
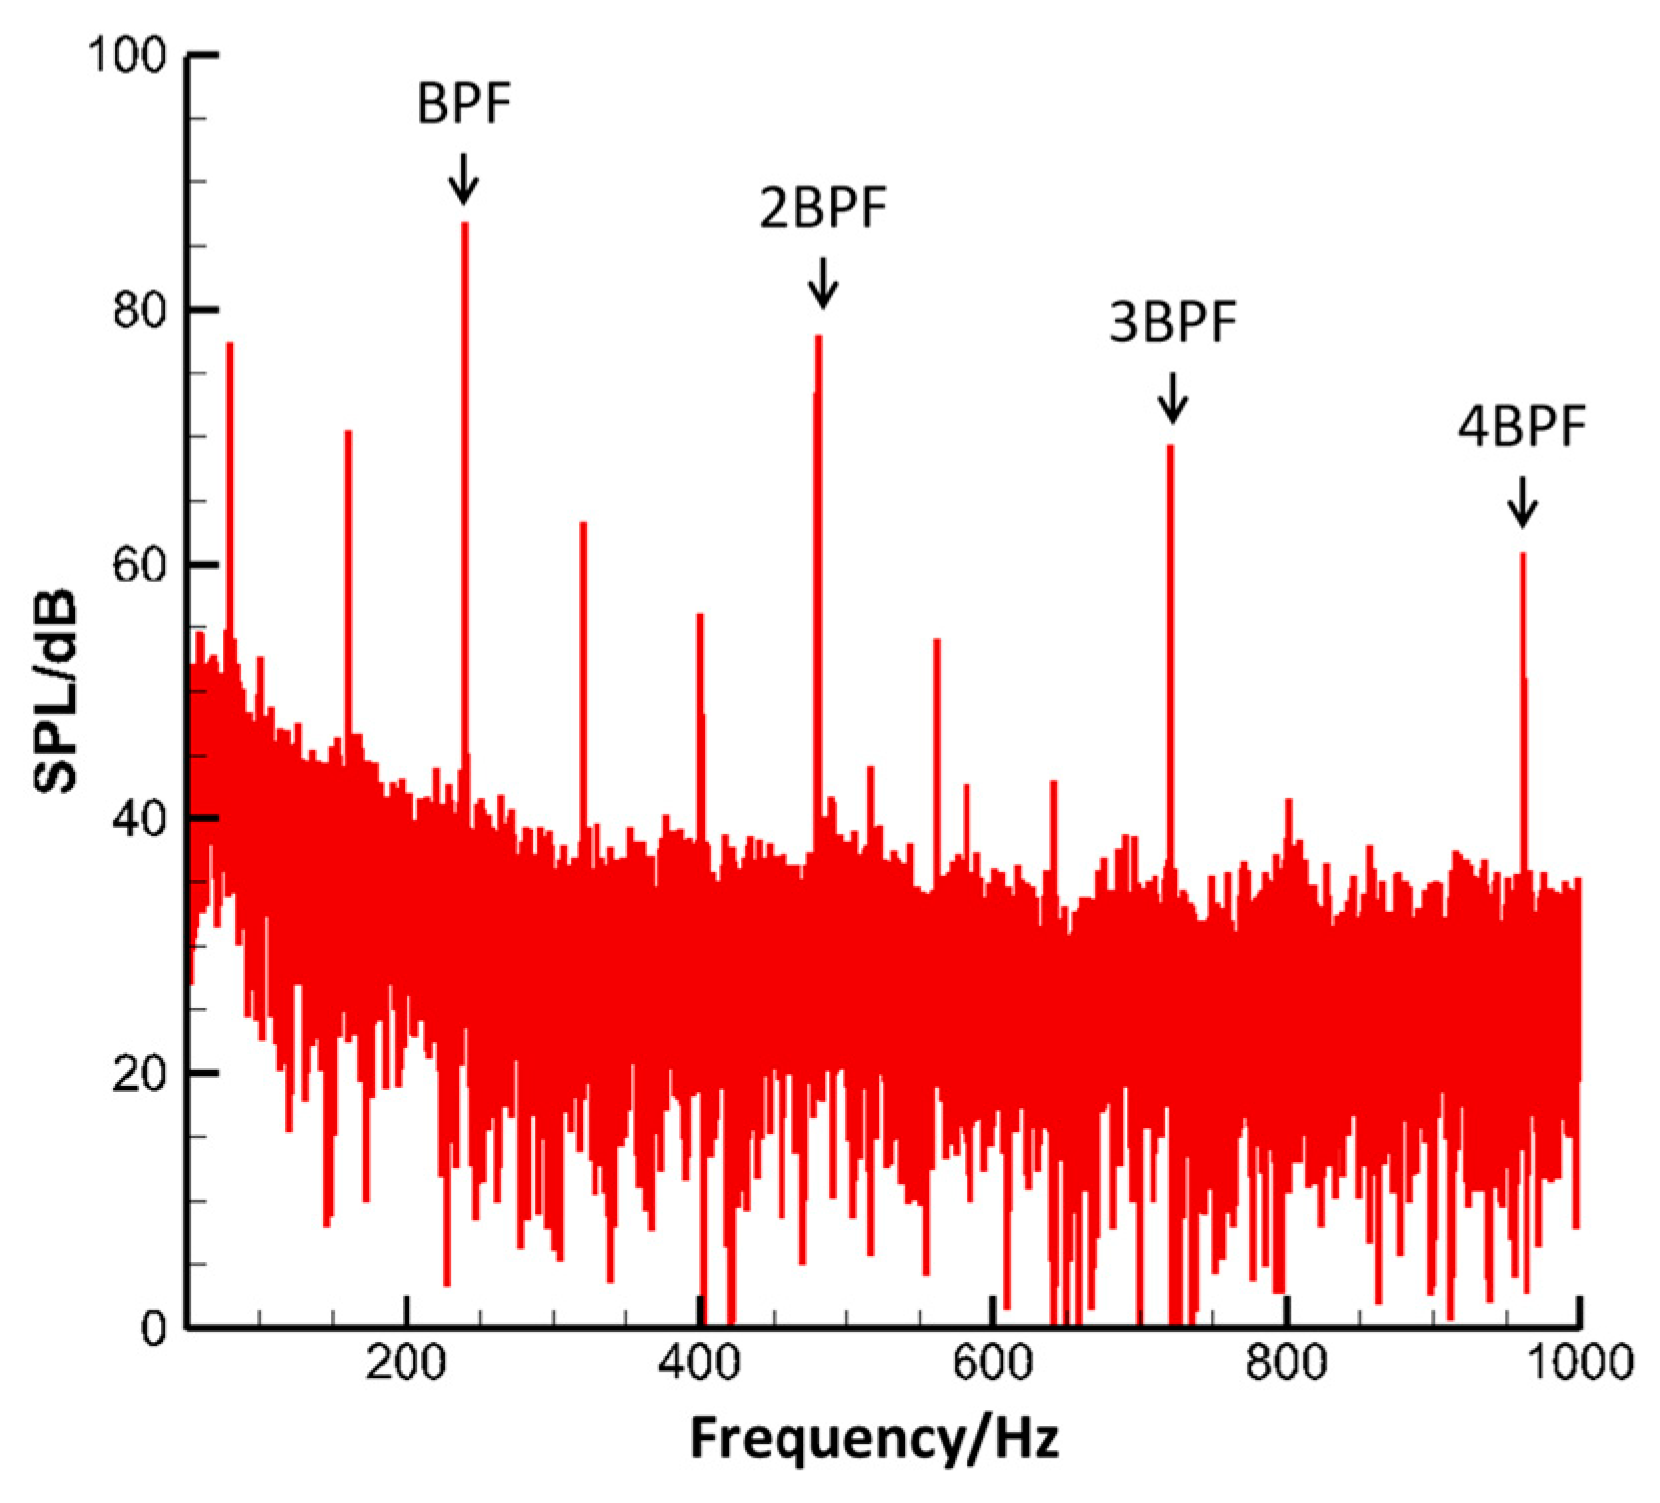
The selected basic propeller is a wind tunnel test three-blade propeller with a diameter of 800 mm. The rotational speed is 4811 rpm, the inflow speed is 50 m/s, and the blade angle is 22°. The spectrum of the measuring point of the far field directivity peak of the propeller is shown in
Figure 2. The propeller noise spectrum is dominated by four pure tones on the blade passing frequency (the first BPF is 240.5 Hz), of which the sound pressure level of 1 BPF is about 9 dB higher than that of 2 BPF. As the order increases, the corresponding SPL decreases.
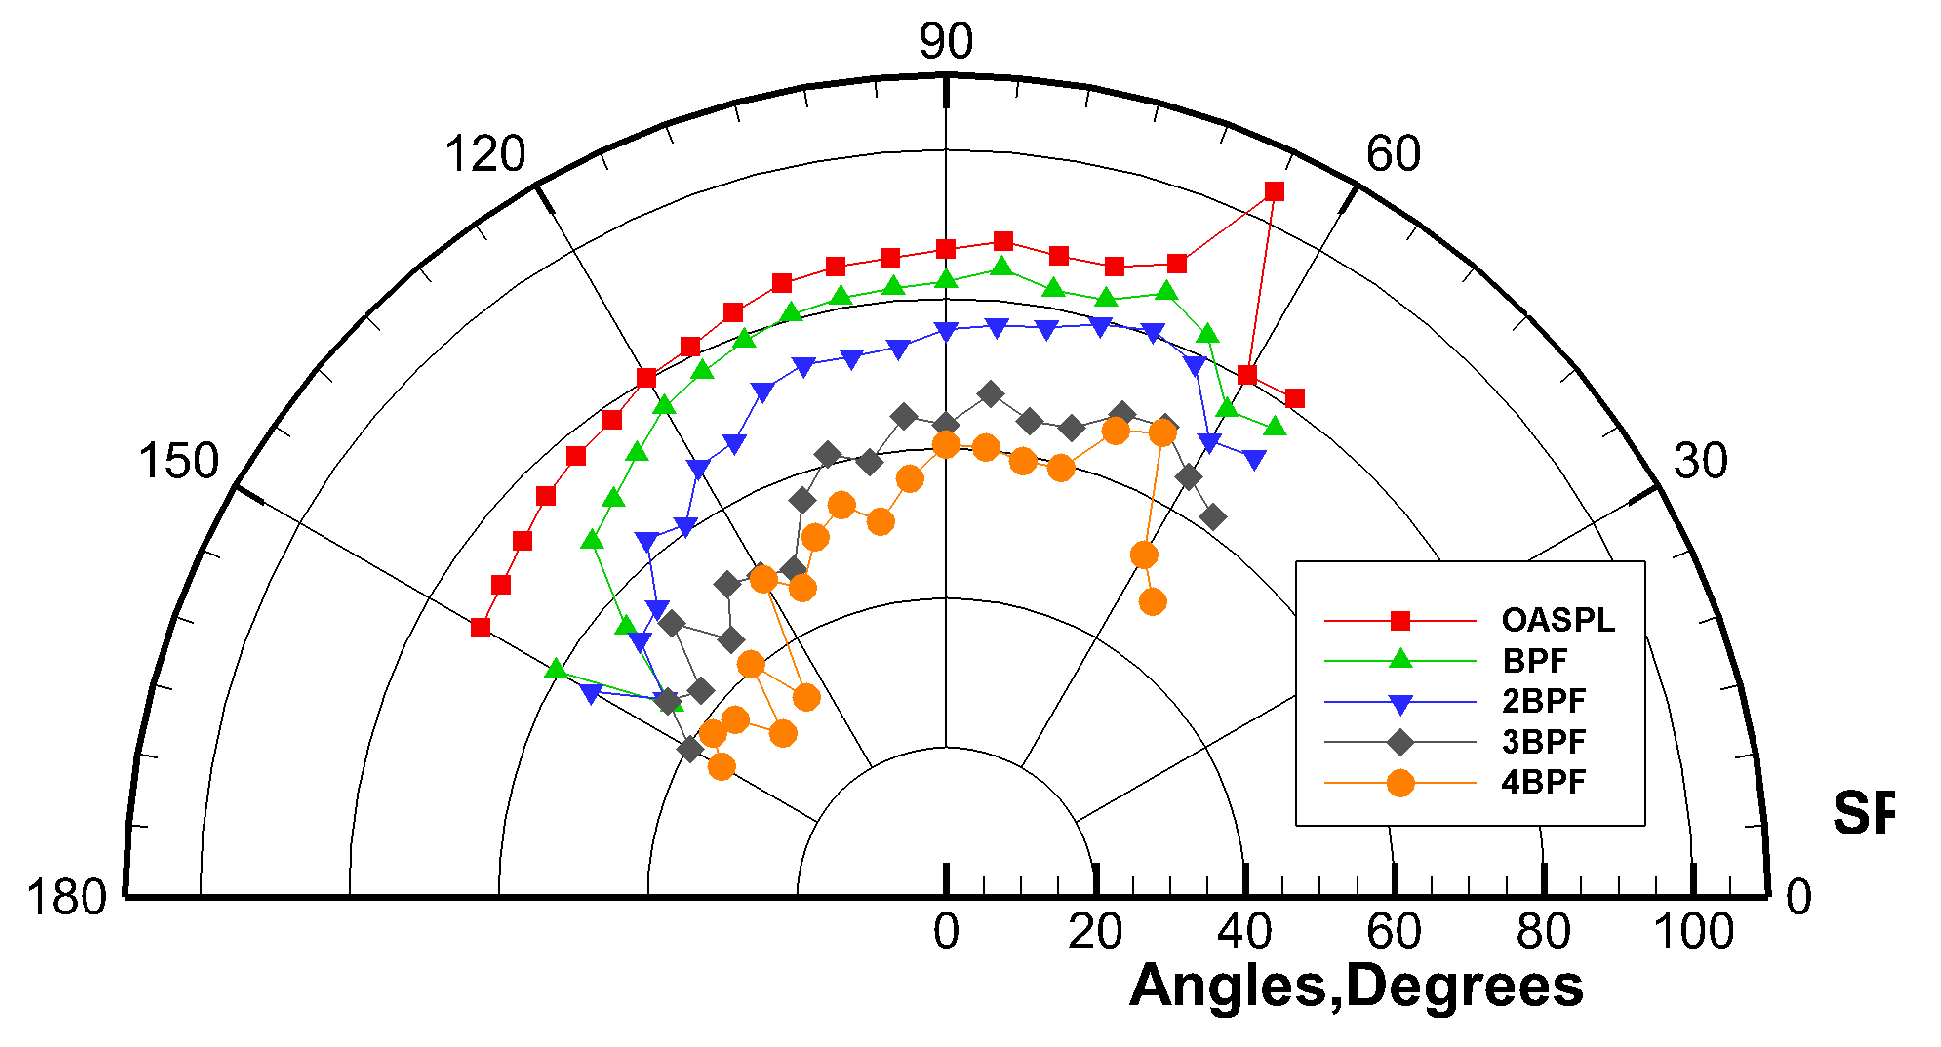
Figure 3 shows the far-field directivity, which shows a similar trend. The maximum SPL is around 75°. Several measuring points near the rotating plane have similar SPL values.
3.1. Propeller Parameterization and Selection of Design Variables
The parameterization of blade geometry is a key step in the low-noise design of the propeller. It is necessary to reduce the number of design variables as much as possible. At the same time, it needs to ensure that the propeller deformation space is large enough.
In this paper, optimization design and experimental verification are carried out for existing aircraft propellers. To ensure that the optimized propeller matches the aircraft, engine, and transmission mechanism, the number of engines, the number of blades, the speed and radius of the propeller, and other general parameters are not used as design variables.
Generally, the geometry of propeller blades is described completely in terms of two aspects. The first kind is the distribution of airfoils along the radius. The second kind is the sweep, the dihedral angle, the twist angle, the chord length, the thickness, and the distribution of the aerodynamic stacking center along the radius. The pitch angle is the twist angle at 0.7 r. The airfoils at different radii engage in dihedral angle and twist angle conversion around the quarter-chord point to stack as the blade. ARA-D airfoils at different radii are scaled to the chord and rotated around the quarter-chord point.
The propeller blade of the aircraft is very thin, the thickness of the blade has little influence on the thickness noise, and the thickness noise has a low proportion to the total propeller noise. Therefore, the thickness of the blade is not used as a design variable, and the thickness distribution of the basic blade is used. As pointed out by Gur et al., the selection of an airfoil has little effect on the aerodynamic performance of the propeller [
17,
18]. In terms of describing the geometric parameters of the airfoil, the ARA-D airfoil, like the basic propeller, is selected as the airfoil family. For the variation in airfoil parameters along the radius, the distribution law along the radius defined by the ARA-D airfoil itself is adopted. In addition, the selected aerodynamic stack center is the 1/4 chord length position of the airfoil. At present, the sweep seriously affects its structural strength performance. Mainstream propeller aircraft have no sweep, so this paper does not take the sweep as a design variable.
The design variables selected in this paper are three categories: twist angle, chord length, and dihedral angle. There are four control points distributed from the root to the tip of the propeller, and the Bezier curve [
3,
4,
5] is selected as the fitting curve, which can effectively avoid the strength problem caused by a sudden change in design parameters. In this way, 12 design variables are shared.
3.2. Constraints and Optimization Objectives
It needs to ensure that the optimized propeller will not be damaged during the experiment. Specifically, when the optimized propeller is subjected to twice the working aerodynamic load and centrifugal load, the test piece will not be damaged, and the dynamic characteristic frequency of the optimized propeller does not coincide with the working frequency of the propeller.
In this paper, the consideration of the structural strength discipline is mainly realized through the constraint of design variables and strength test verification. The constraints on design variables shall be fully communicated with the manufacturer and the tester, mainly in terms of the following two aspects:
- (a)
Constraints on large deformation regions. To ensure sufficient structural strength at the blade root, no obvious deformation is allowed in the area below 0.5 r, according to the manufacturer’s communication.
- (b)
Dihedral angle. An excessive dihedral angle affects the strength of the propeller. According to the communication with the manufacturer, the maximum dihedral angle is limited to 2.86°.
Therefore, the constraints of each design variable are:
- (a)
Chord. Strength needs to be considered. The minimum chord length is located at the propeller tip, and the minimum chord length is 5% of the propeller rotation radius.
- (b)
Twist angle. The maximum twist angle of the aerodynamic performance is at the blade tip, and the attack angle at the blade tip is positive.
- (c)
Dihedral angle. Strength is mainly considered. The maximum dihedral angle is 2.86°.
The objective of the optimization design in this paper is to reduce the far-field radiated noise of the propeller without reducing the aerodynamic performance of the propeller. This leads to one optimization objective and two constraints:
- (a)
Efficiency. The reduction in the propeller efficiency is less than 0.2%.
- (b)
Thrust. Considering the optimization design of the existing propeller under specific working conditions, the thrust under this working condition cannot be reduced, and the reduction in propeller thrust is set to be less than 0.1%.
- (c)
Far-field radiated noise (at the first blade passage frequency). The noise observation point is the far-field measurement point on the rotation plane. Find the maximum value of noise reduction.
The linear weighted sum method is used to deal with the relationship between multiple optimization objectives. The weighting factors need to be tried repeatedly so that the aeroacoustics of the blade can be reduced and the aerodynamic performance and strength of the propeller can be guaranteed.
Take its optimal solution x * as the “optimal solution” of the objective function in the sense of a linear weighted sum, wherein is the weighting factor.
3.3. Design Method and Strategy
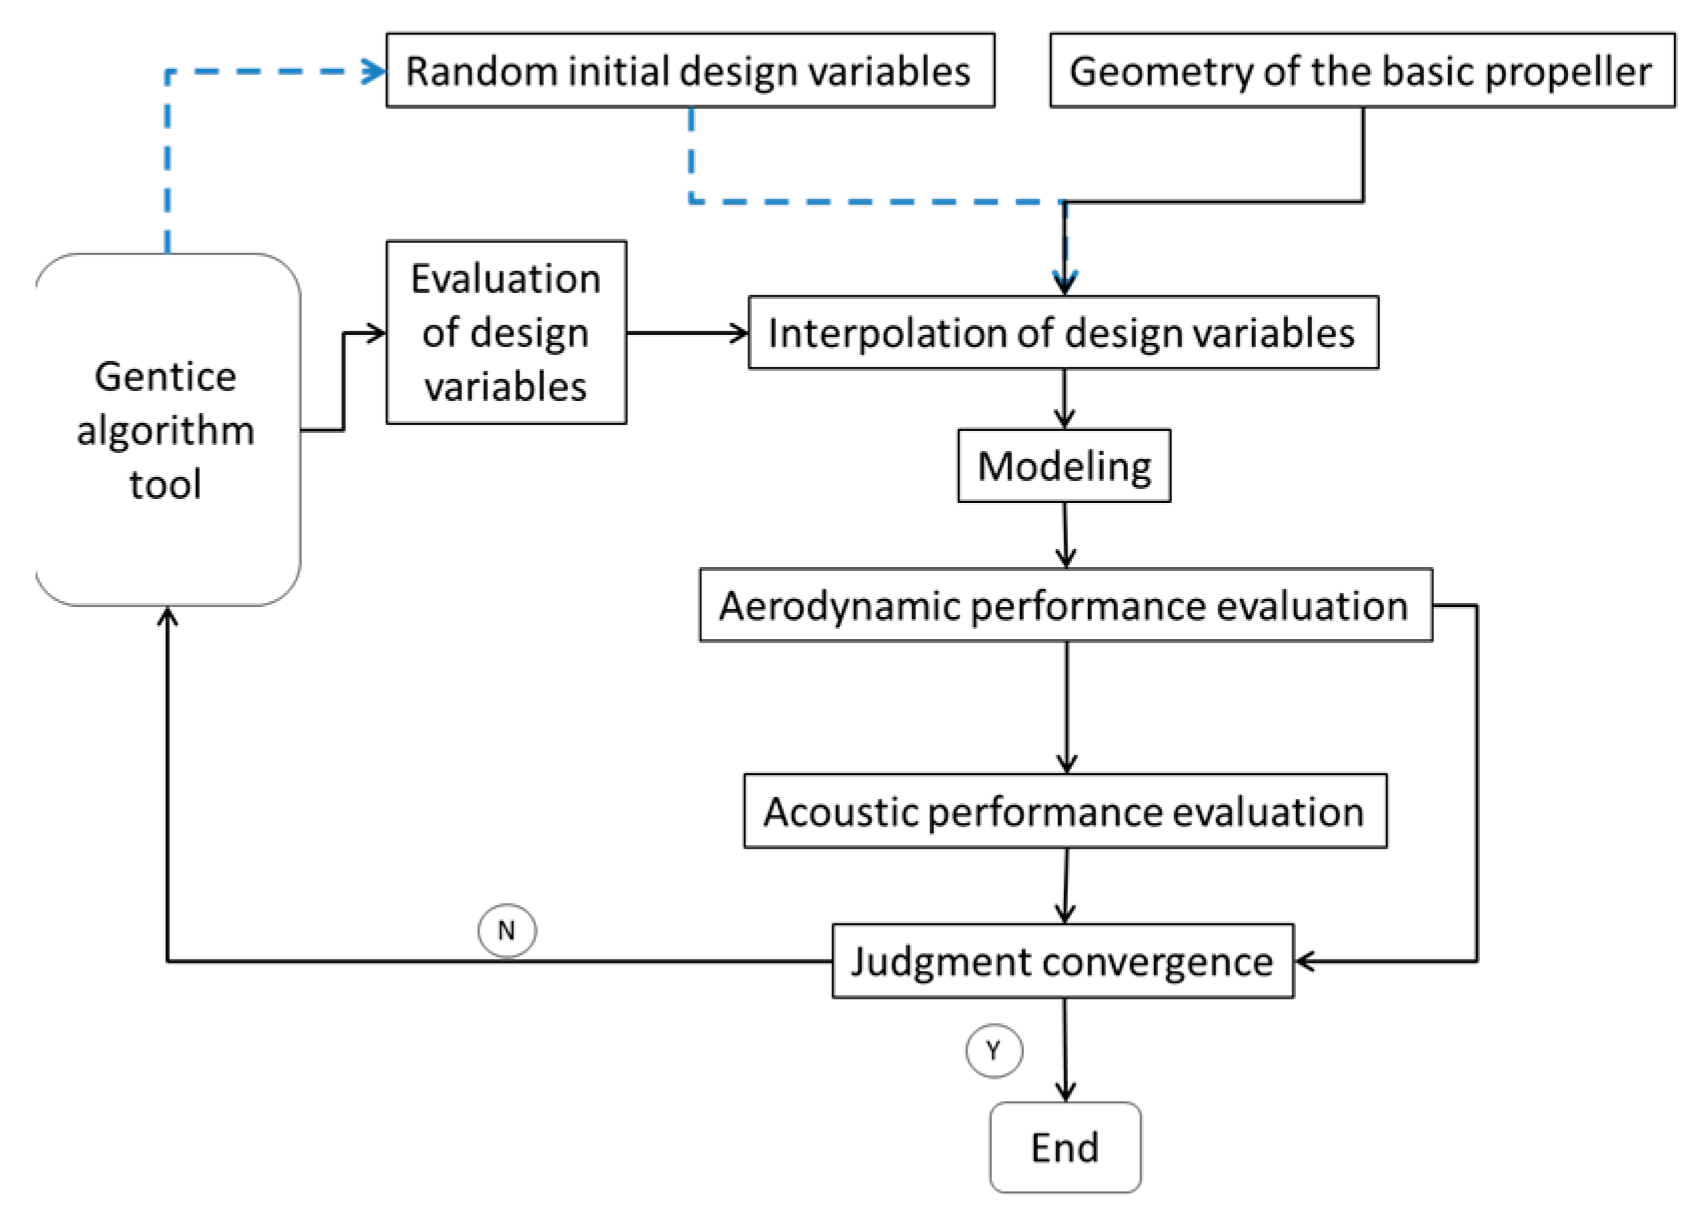
In this paper, a genetic algorithm is selected as the optimization design tool. The genetic algorithm has the advantage of global optimization, while its disadvantage is that the blade sawtooth problem is caused by the discontinuity between design variables, which is solved by Bezier curve fitting. To speed up the iteration, a parallel algorithm is used to synchronously calculate different individuals of the same population with 12 cores.
The optimization design framework of this paper is shown in
Figure 4.
3.4. Optimization Results
The contrast of the thrust, efficiency, and noise of the propeller before/after optimization is shown in
Table 3. The aerodynamic performance of the propeller has not changed, while the far field noise is reduced by 5 dB.
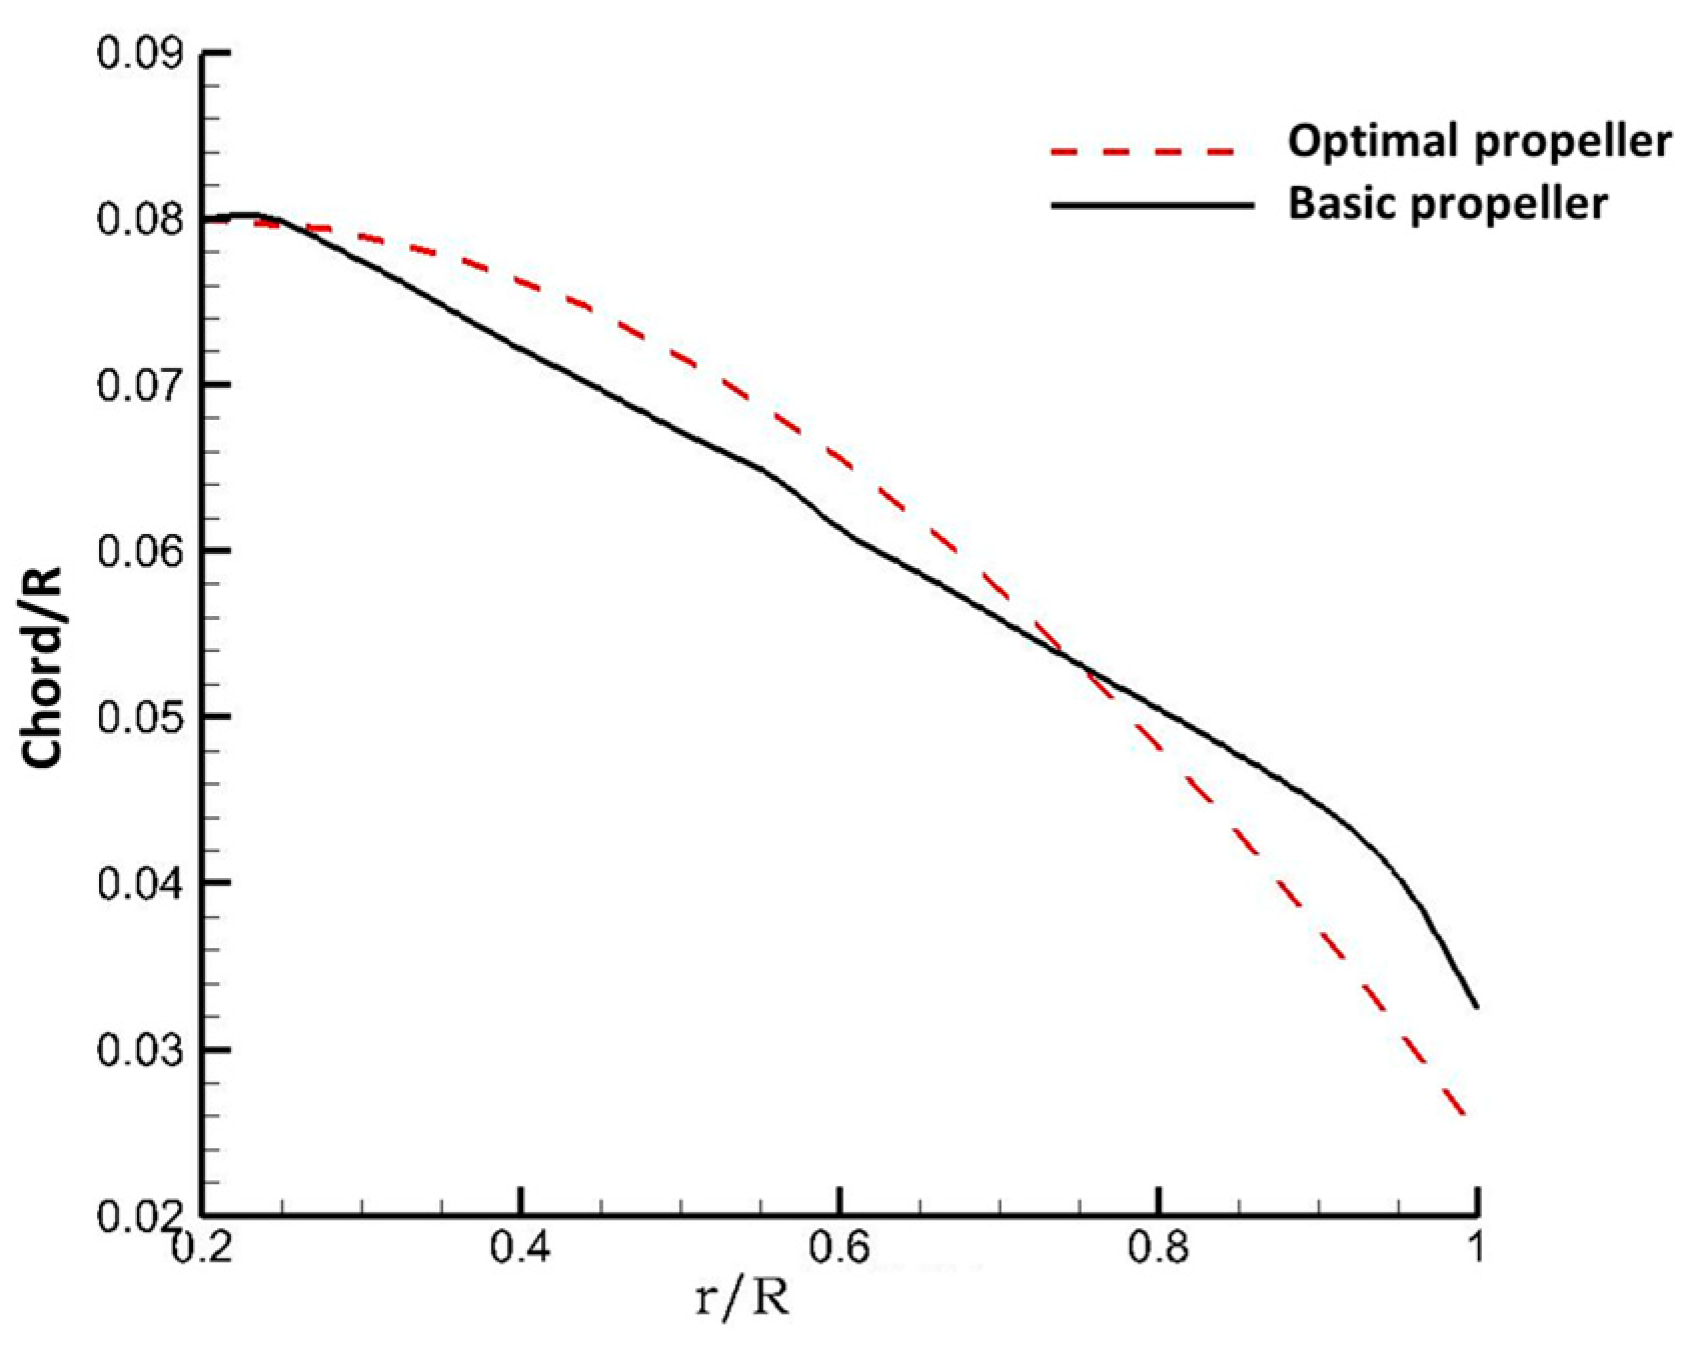
The optimized chord distribution is shown in
Figure 5 (where r is the dimensional radial coordinate and R is the propeller radius). The chord of the optimized propeller is larger in an area below 0.75 r. In the tip area, the chord length of the optimized propeller is smaller. The tip area is the main propeller noise source. Reducing the chord length of the propeller tip is helpful in reducing the load on the propeller tip. The thrust loss of the propeller tip is compensated by increasing the chord length of the blade below 0.75 r. The increase in the chord length below 0.75 r is also helpful in maintaining the propeller strength.
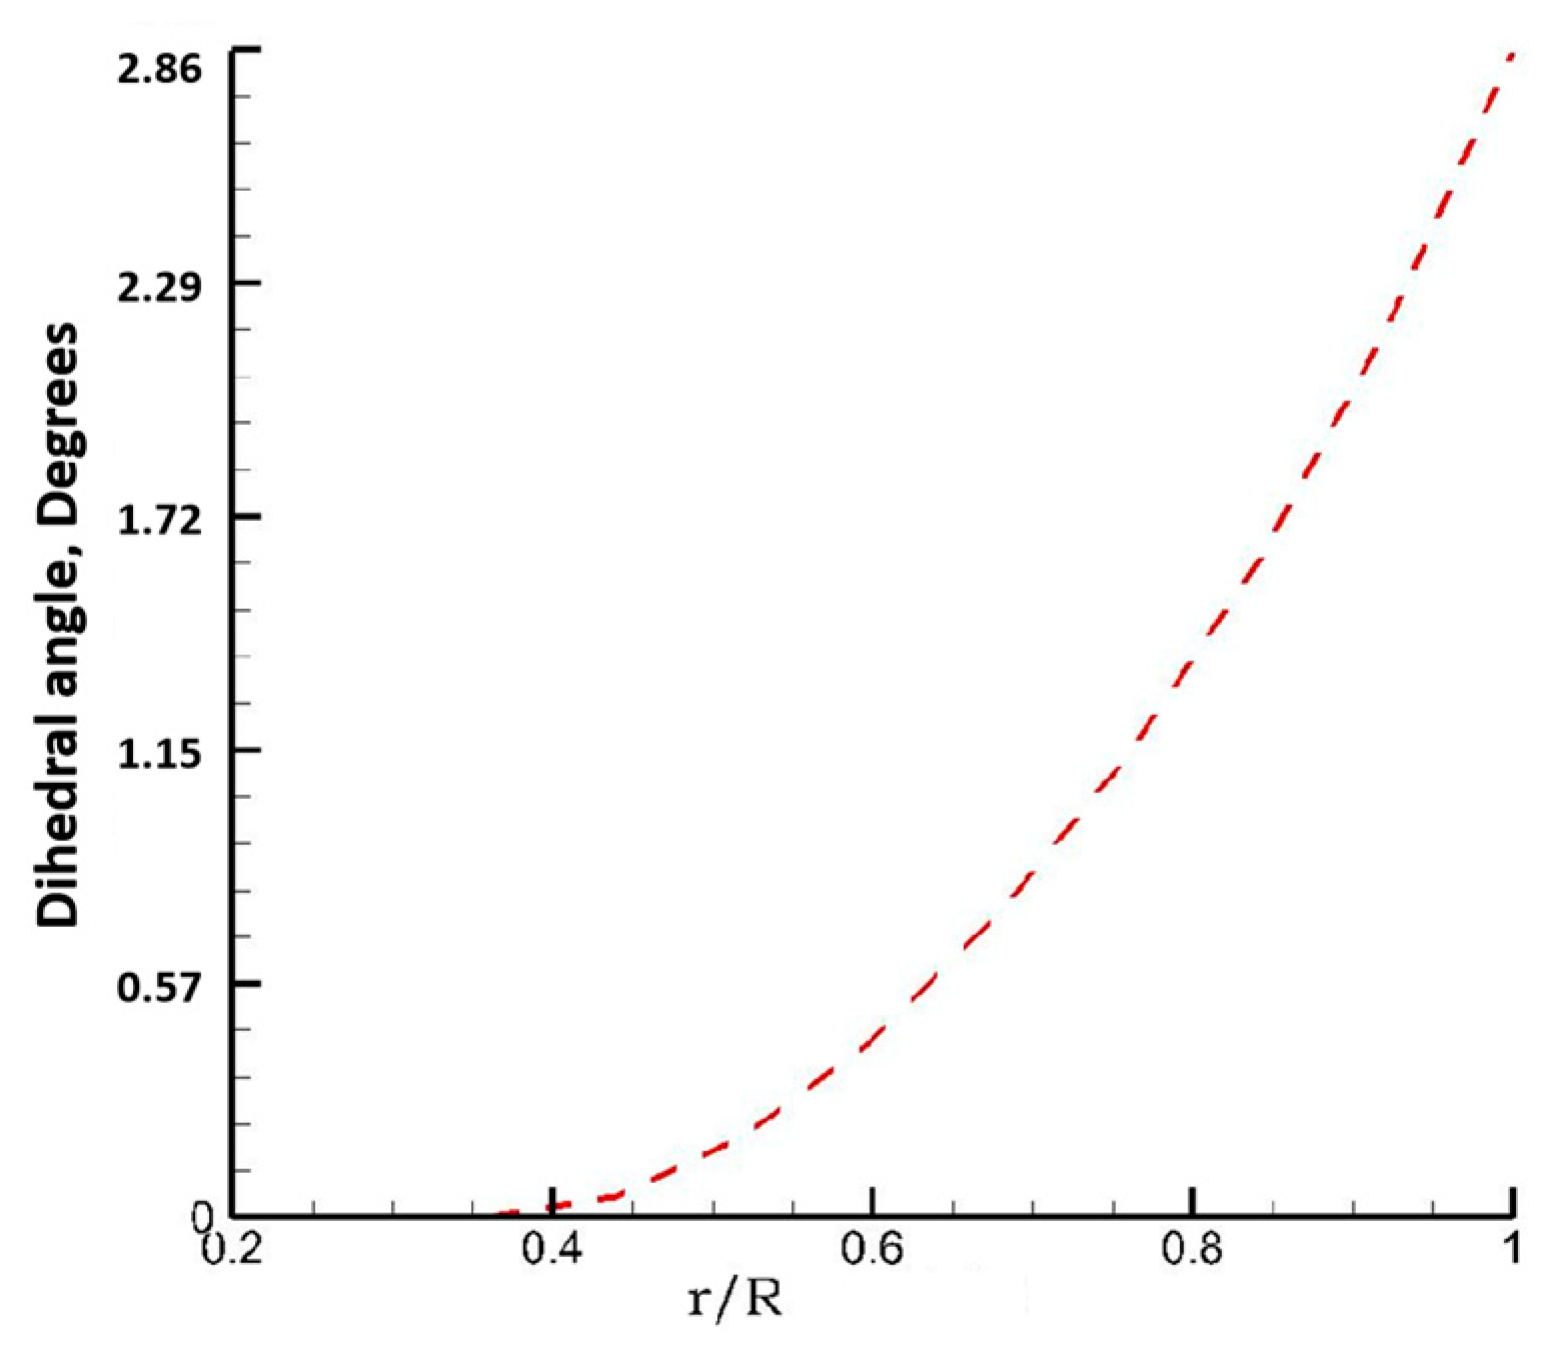
The optimized dihedral angle distribution is shown in
Figure 6. The original blade is straight, so there is no dihedral angle. At the propeller rotating radius below 50%, the dihedral angle of the optimized propeller is very small to ensure strength. In more than 50% of the area, the dihedral angle of the propeller increases exponentially. By changing the phase of the aeroacoustic load at different radii along the blade, far-field noise cancellation is achieved.
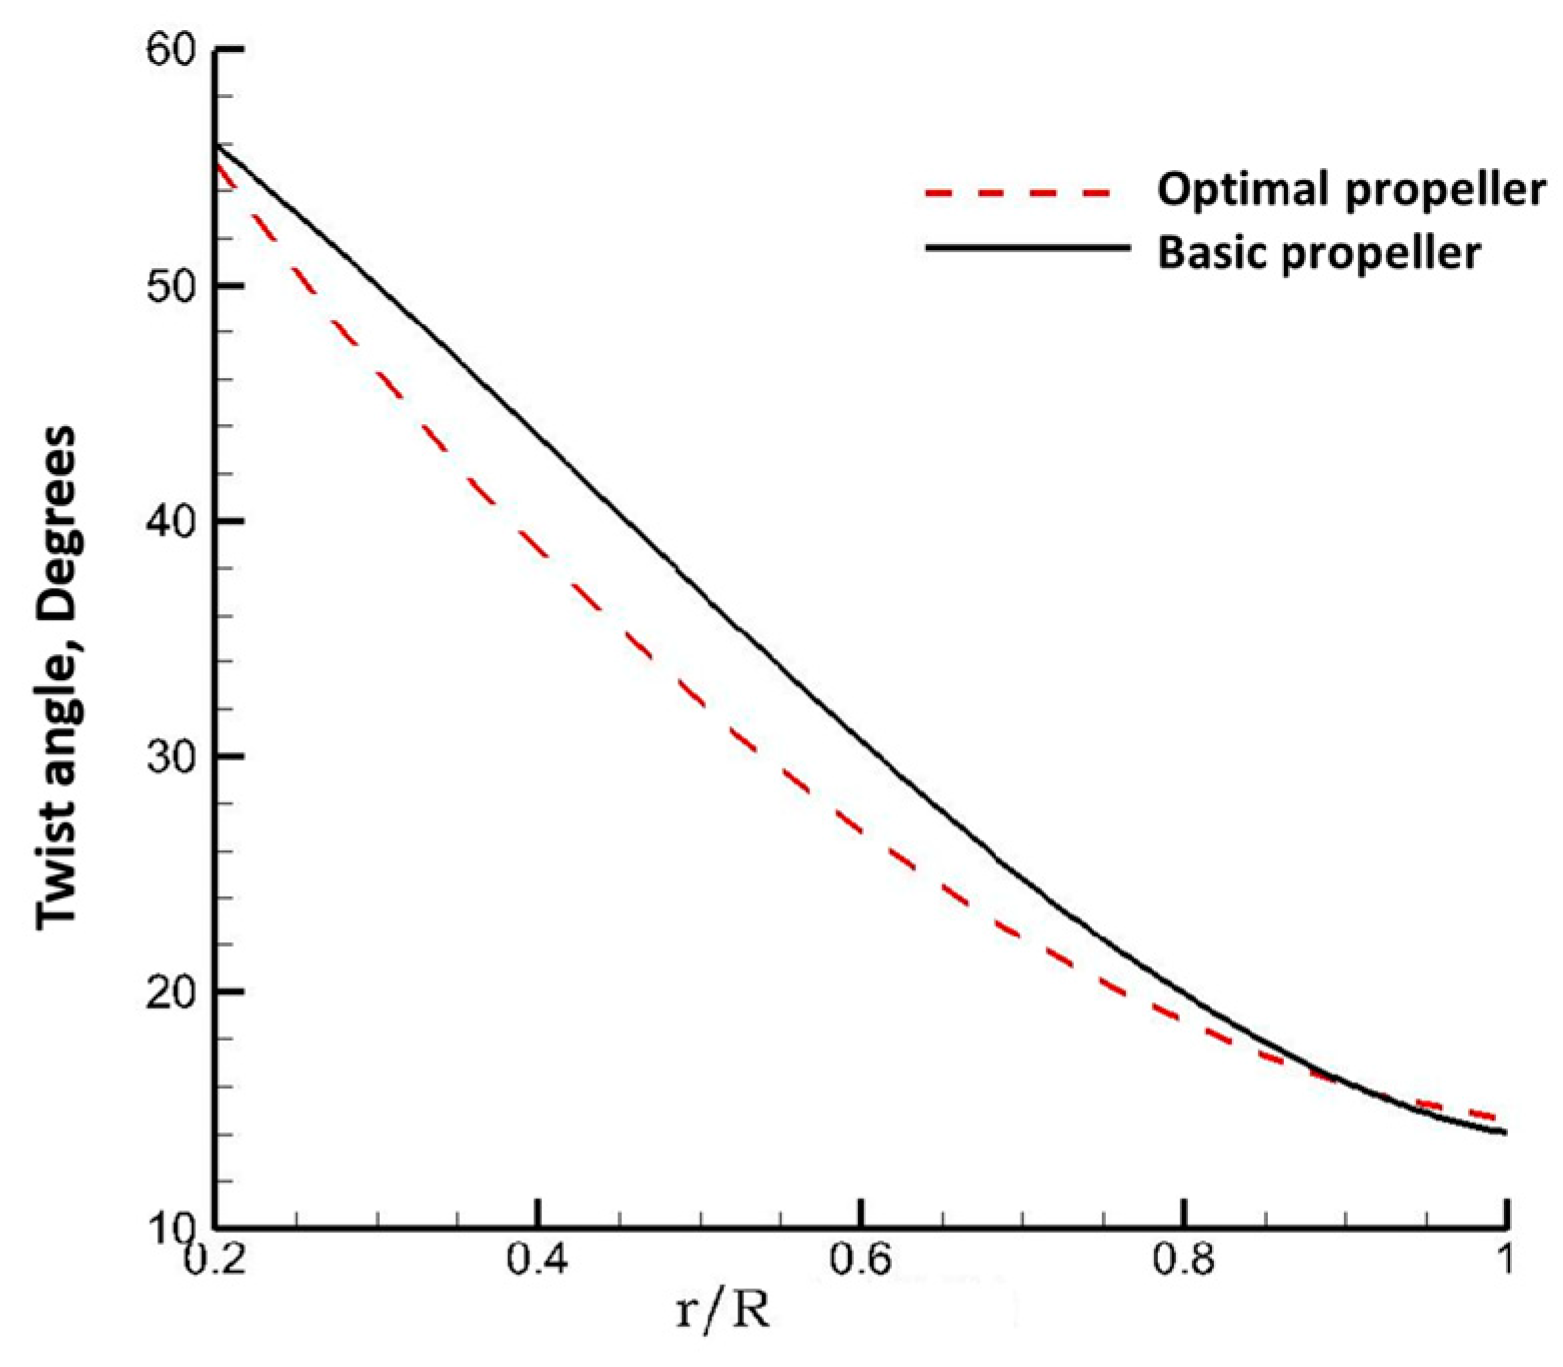
The optimized twist angle distribution is shown in
Figure 7. Compared with the original propeller, the twist angle of the optimized propeller is smaller at the blade tip.
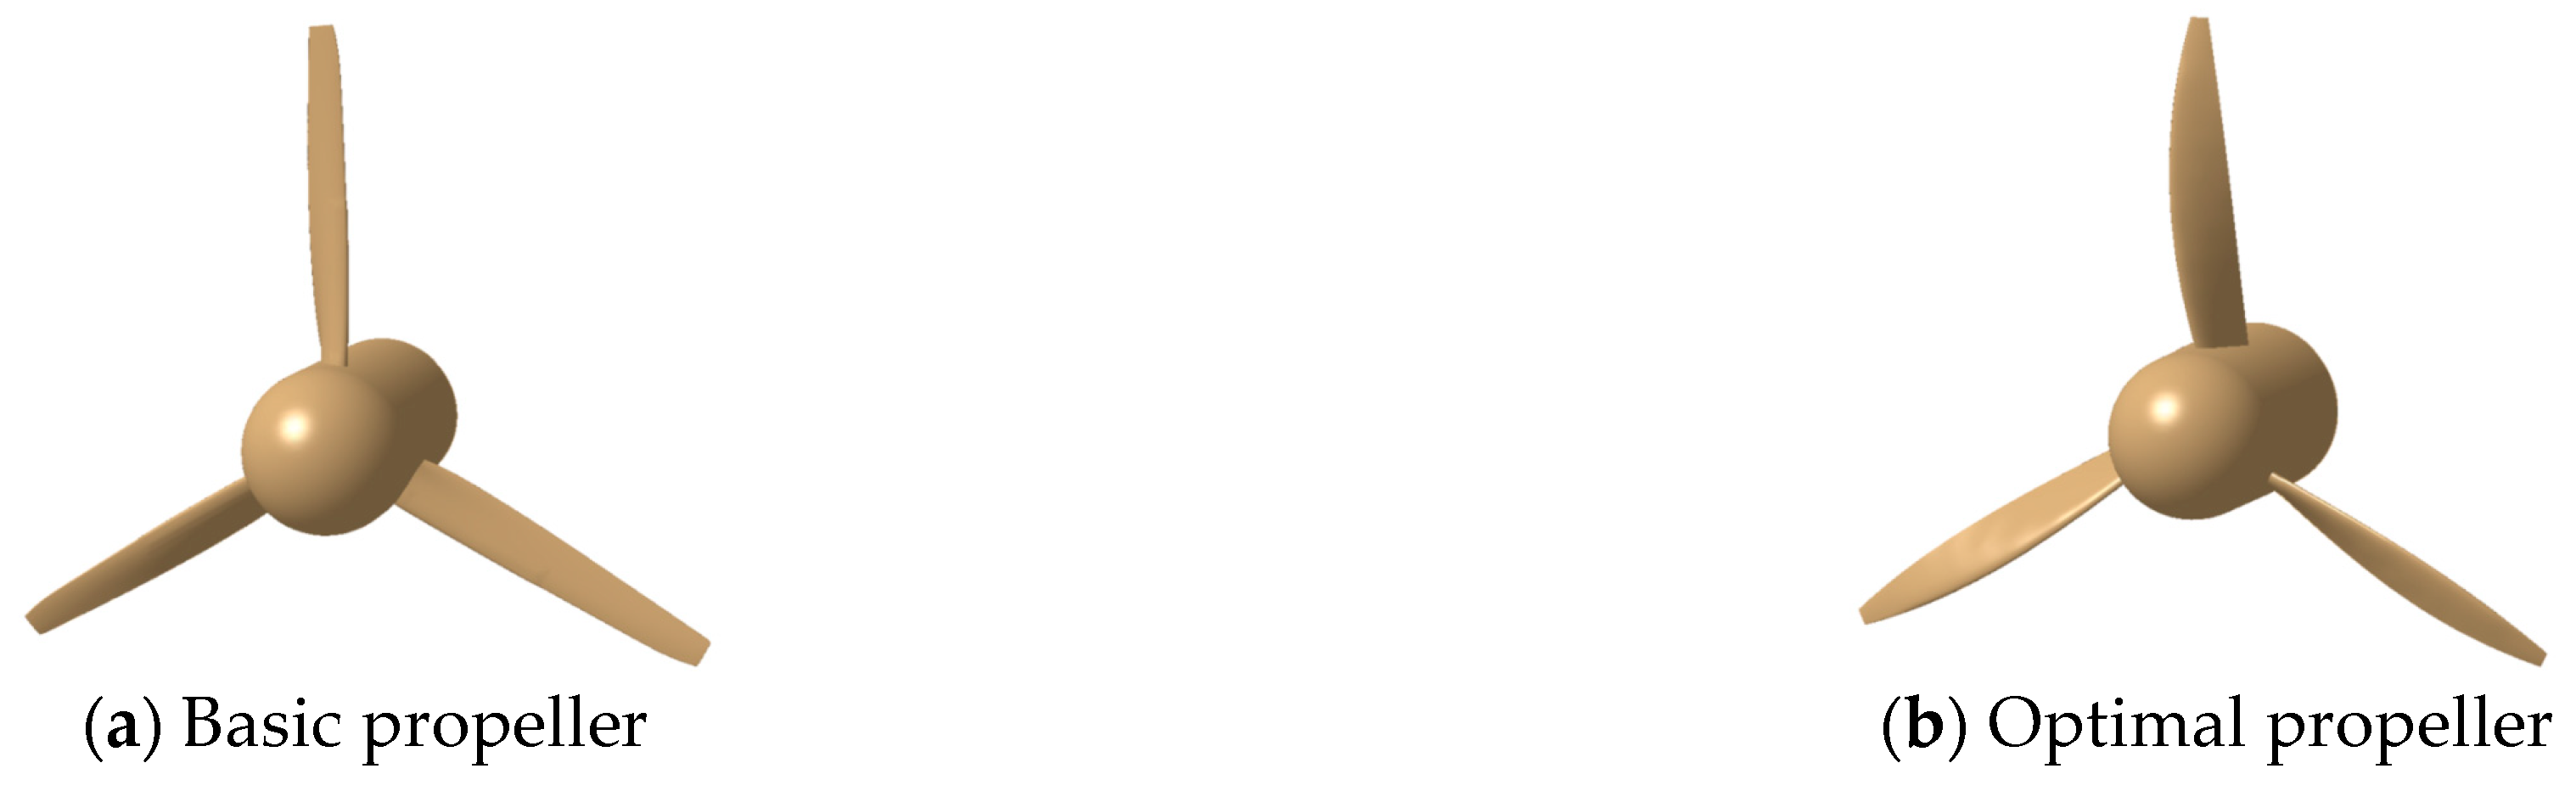
The geometry of the optimized propeller and the original propeller is shown in
Figure 8. Compared with the original propeller, the chord length of the optimized propeller increases significantly in the middle and bottom of the rotation radius; In addition, the optimized propeller has obvious dihedral angle characteristics.
4. Test Verification
4.1. Strength Verification
The purpose of propeller strength test verification is to ensure that the propeller can withstand centrifugal force and aerodynamic force and ensure that its structural dynamic characteristic frequency does not coincide with the working frequency of the propeller. The strength tests carried out mainly provide structural strength proof for the subsequent tests in the wind tunnel.
The design variables include the chord, twist angle, and dihedral angle. Therefore, the blade mass and center of gravity have changed, and a centrifugal load test is required to assess the carrying capacity of the blade root. The results show that the connection between the blade and the blade root meets the requirements of bearing twice the centrifugal force load. There is no crack in the connection part and no sudden displacement change during the test.
Under the action of an aerodynamic load, the blade bears the force on the rotating plane and the torsion around the pitch axis. The torque generated by the force on the rotating plane to the blade root and the force acted by the force on the rotating plane to the blade is the main load. The results show that, under 2.4 times the aerodynamic load, the blade is normal.
To further analyze the feasibility of optimal design, the dynamic characteristics of the propeller blade are tested, including the first-order mode and the frequency of the propeller blade waving, shimmy, and torsion. The method of knock excitation is adopted to identify the corresponding vibration frequency and mode of the blade according to the excitation force and response acting on the blade. The test shows that the structural frequency does not coincide with the operating condition of the blade.
4.2. Aerodynamic and Aeroacoustic Verification
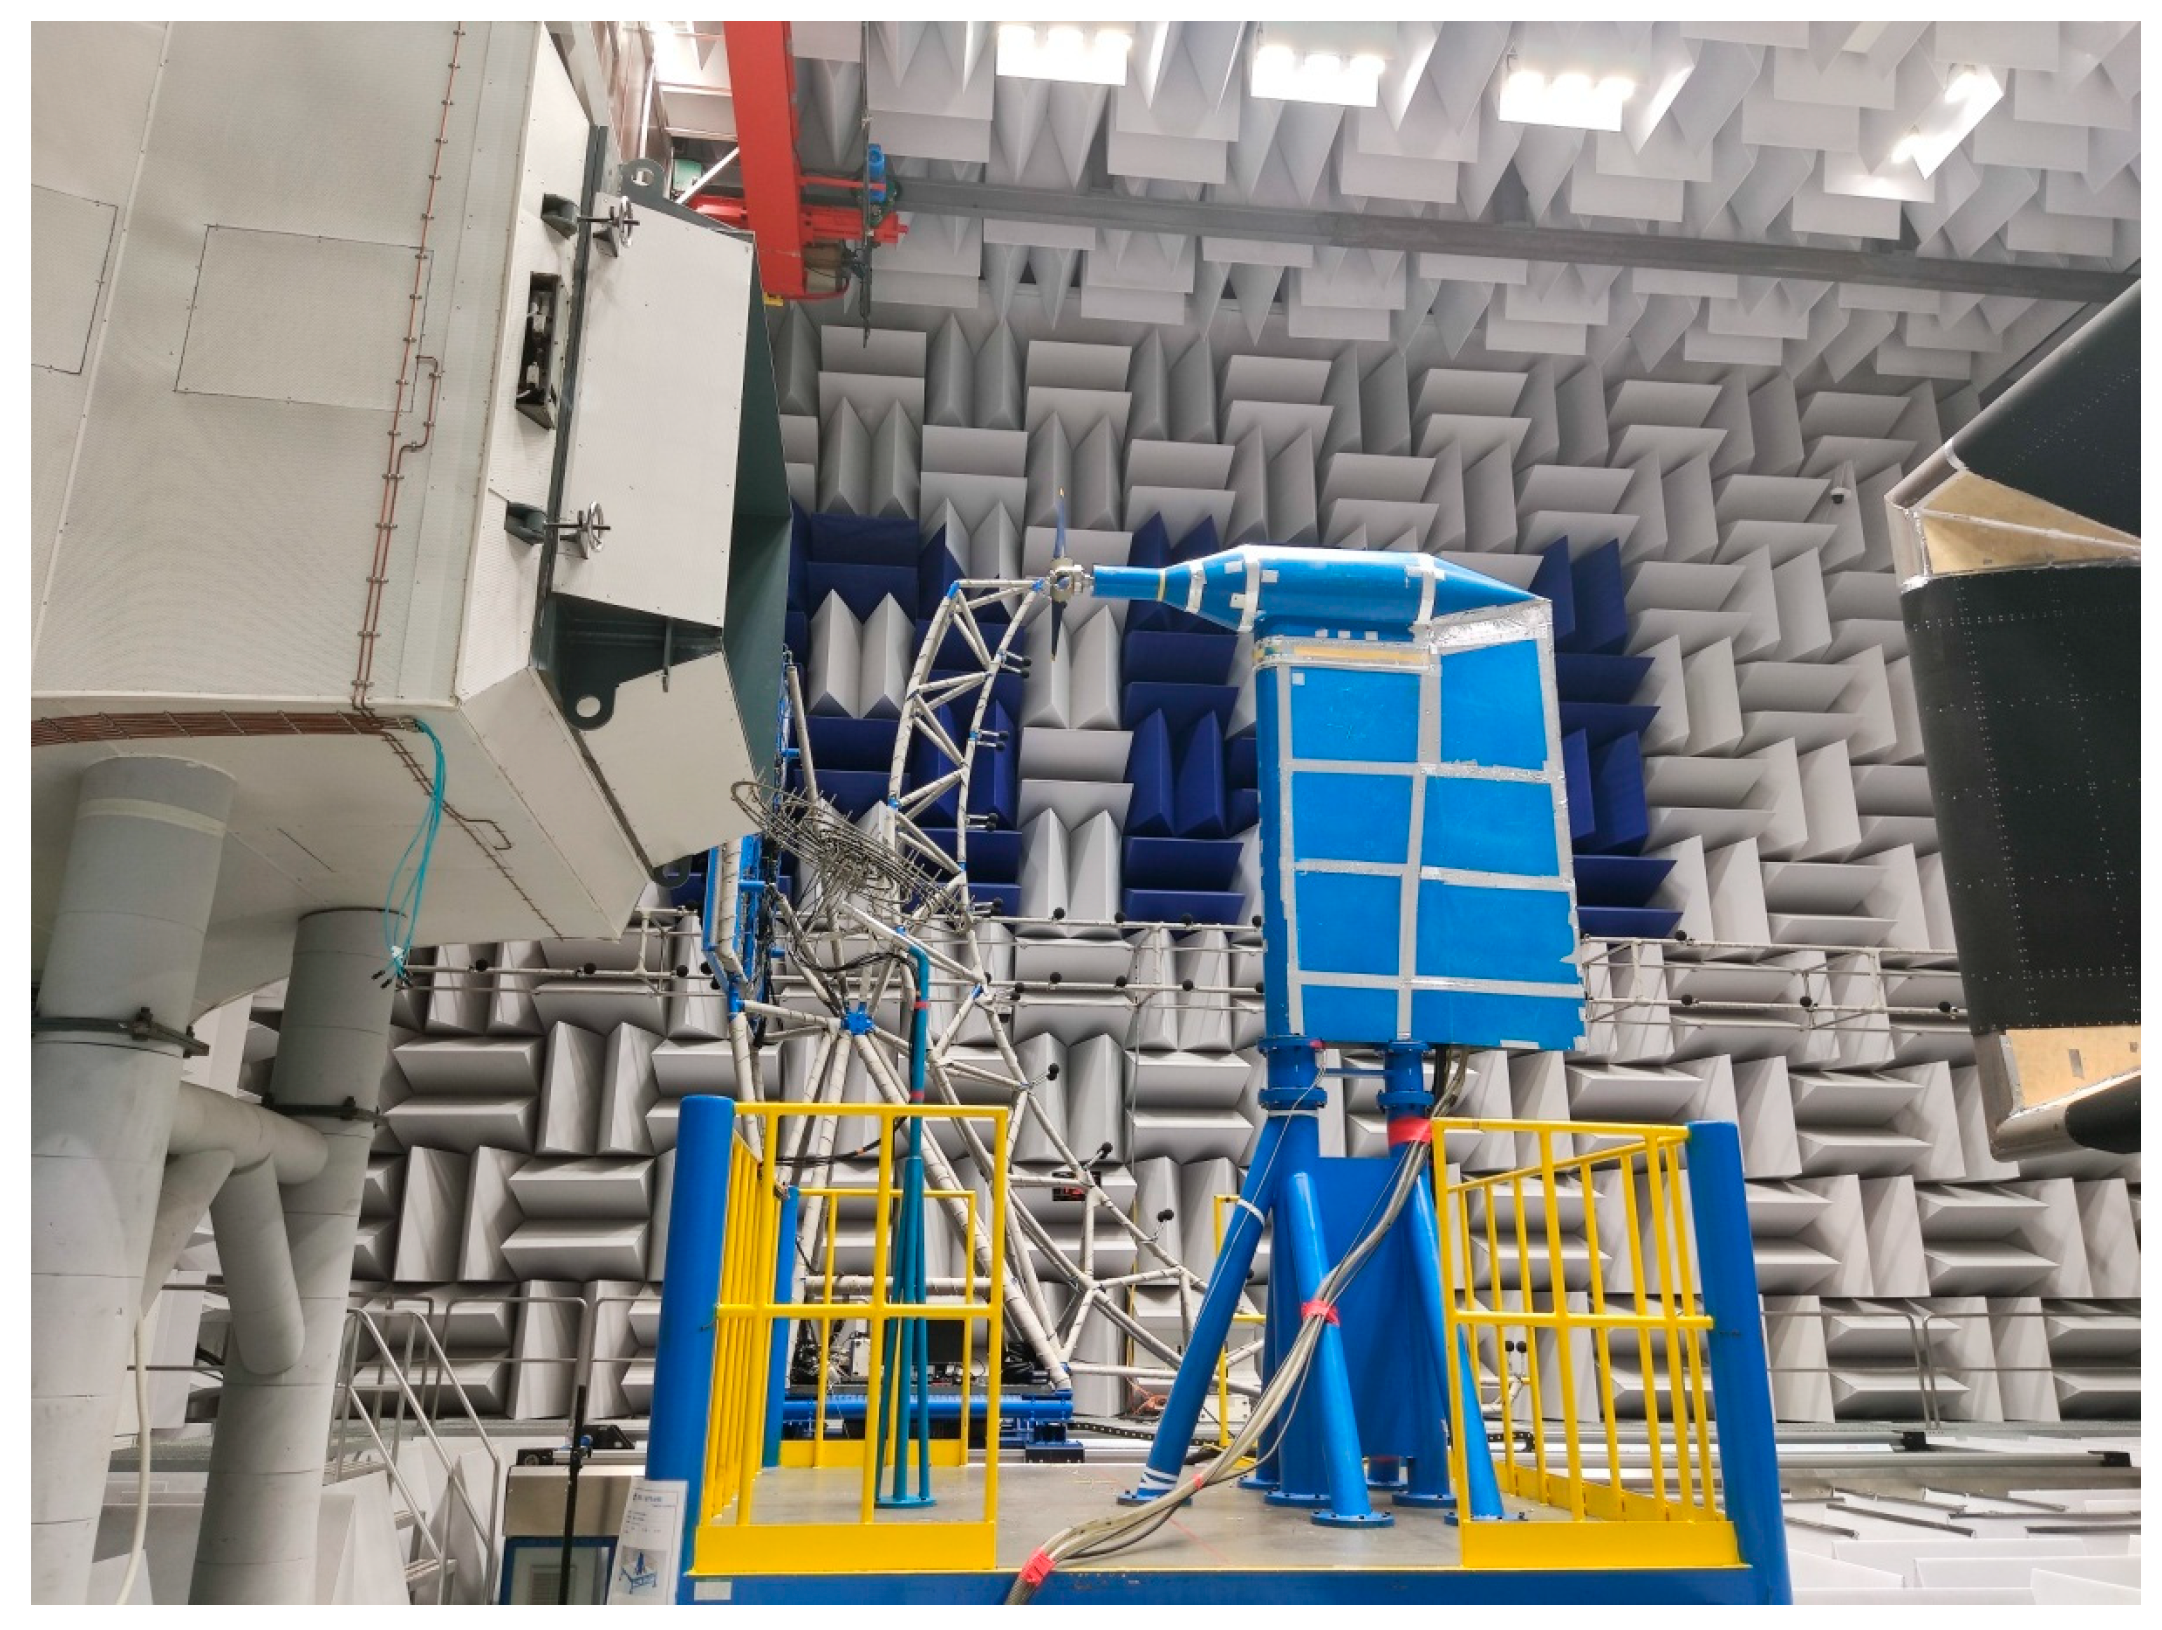
The aerodynamic and noise characteristics of the prototype propeller and the optimized propeller were tested in the aeroacoustic wind tunnel(
Figure 9). The thrust and torque of the propeller are measured by the balance, and the aerodynamic characteristics of the propeller, such as the thrust coefficient, power coefficient, and efficiency, are obtained by conversion. The noise characteristics of the propeller are obtained through the microphone array.
The size of the anechoic chamber is 13 m wide, 9.05 m high, and has a fetch length of 12.5 m. The wind tunnel test section size is 2.0 m wide, 1.5 m high, and has a fetch length of 6.3 m. The background noise is below 80 dBA (80 m/s). The linear array composed of 20-channel microphones is used to measure the far-field noise, which is 6.3 m away from the propeller axis and is arranged at an equal angle along the direction of the flow field. The angle measurement range is 50°, −145°, and 0° and is located upstream of the flow.
4.2.1. Comparison and Verification of Aerodynamic Performance
The curves of thrust versus torque at different incoming velocities and different pitch angles are given. As the operating conditions of the optimized propeller are different from those of the original propeller, the torque thrust diagram can better reflect the aerodynamic characteristics of the propeller. That is to compare and analyze the input torque of two sets of propellers under the same thrust.
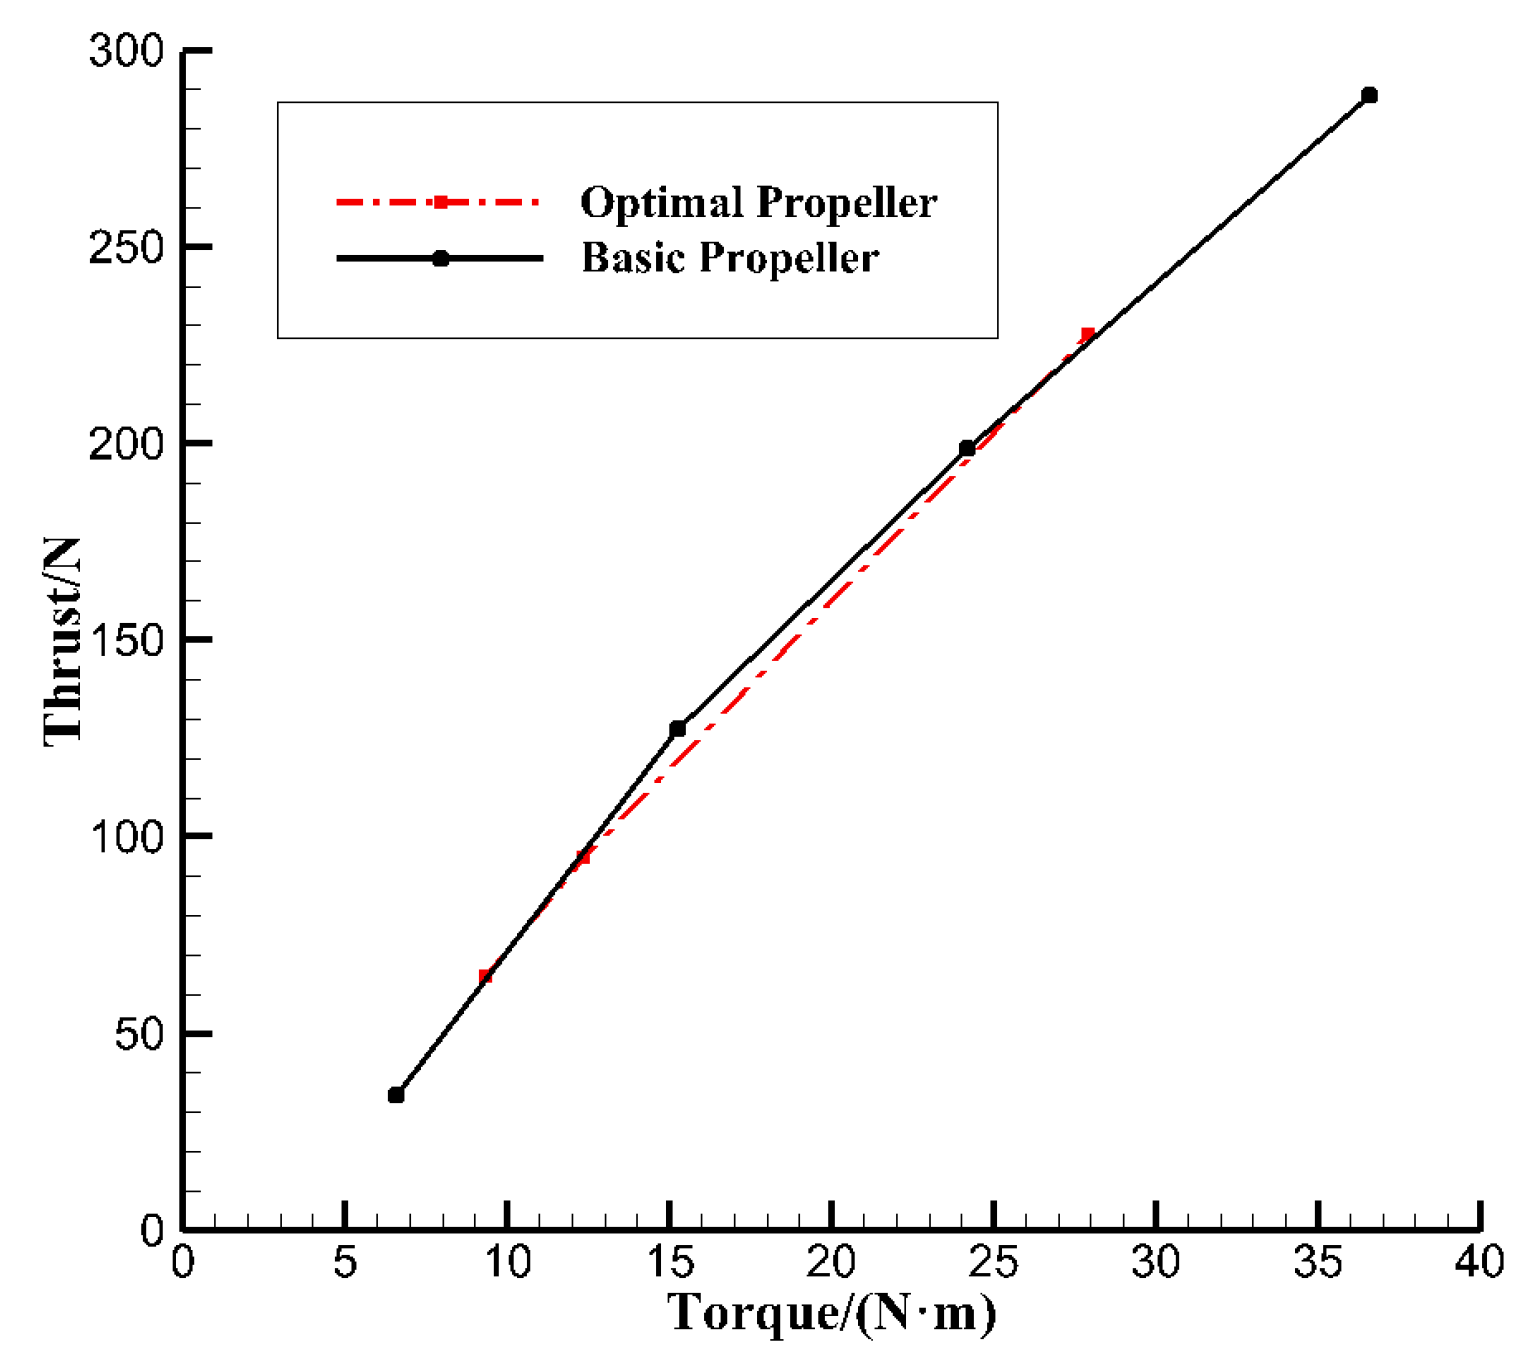
Figure 10 shows the torque curves corresponding to different thrusts under design conditions (flow velocity of 50 m/s, rotation speed of 4811 r/min). The curve corresponding to the optimized propeller coincides with the curve corresponding to the original propeller. The specific numerical comparison between the two is shown in
Table 4. Under the optimized design condition, the efficiency of the optimized propeller decreases slightly (the thrust decreases by 6 N, and the efficiency decreases by 0.035). However, under the two working conditions deviating from the design, the aerodynamic performance of the propeller is improved (the thrust is increased by 1 N~2 N, and the efficiency is increased by 0.01). Therefore, their aerodynamic performance is equivalent and consistent with the optimization goal. The results of the optimization design meet the requirement of no reduction in aerodynamic performance in the optimization goal.
In the design condition, the computation of optimization results shows that (
Table 3) the thrust of the optimized propeller is reduced by 1 N, while the efficiency is reduced by 0.0013. The test of the optimized propeller (
Figure 11 and
Table 4) shows that the thrust decreases by 6 N and the efficiency decrease by 0.035. It shows that the thrust prediction error is 5 N (the thrust coefficient error is 0.0015), while the efficiency prediction error is 0.0337. The calculation result is relatively accurate and consistent with the conclusion of calculation accuracy in
Section 2.2.
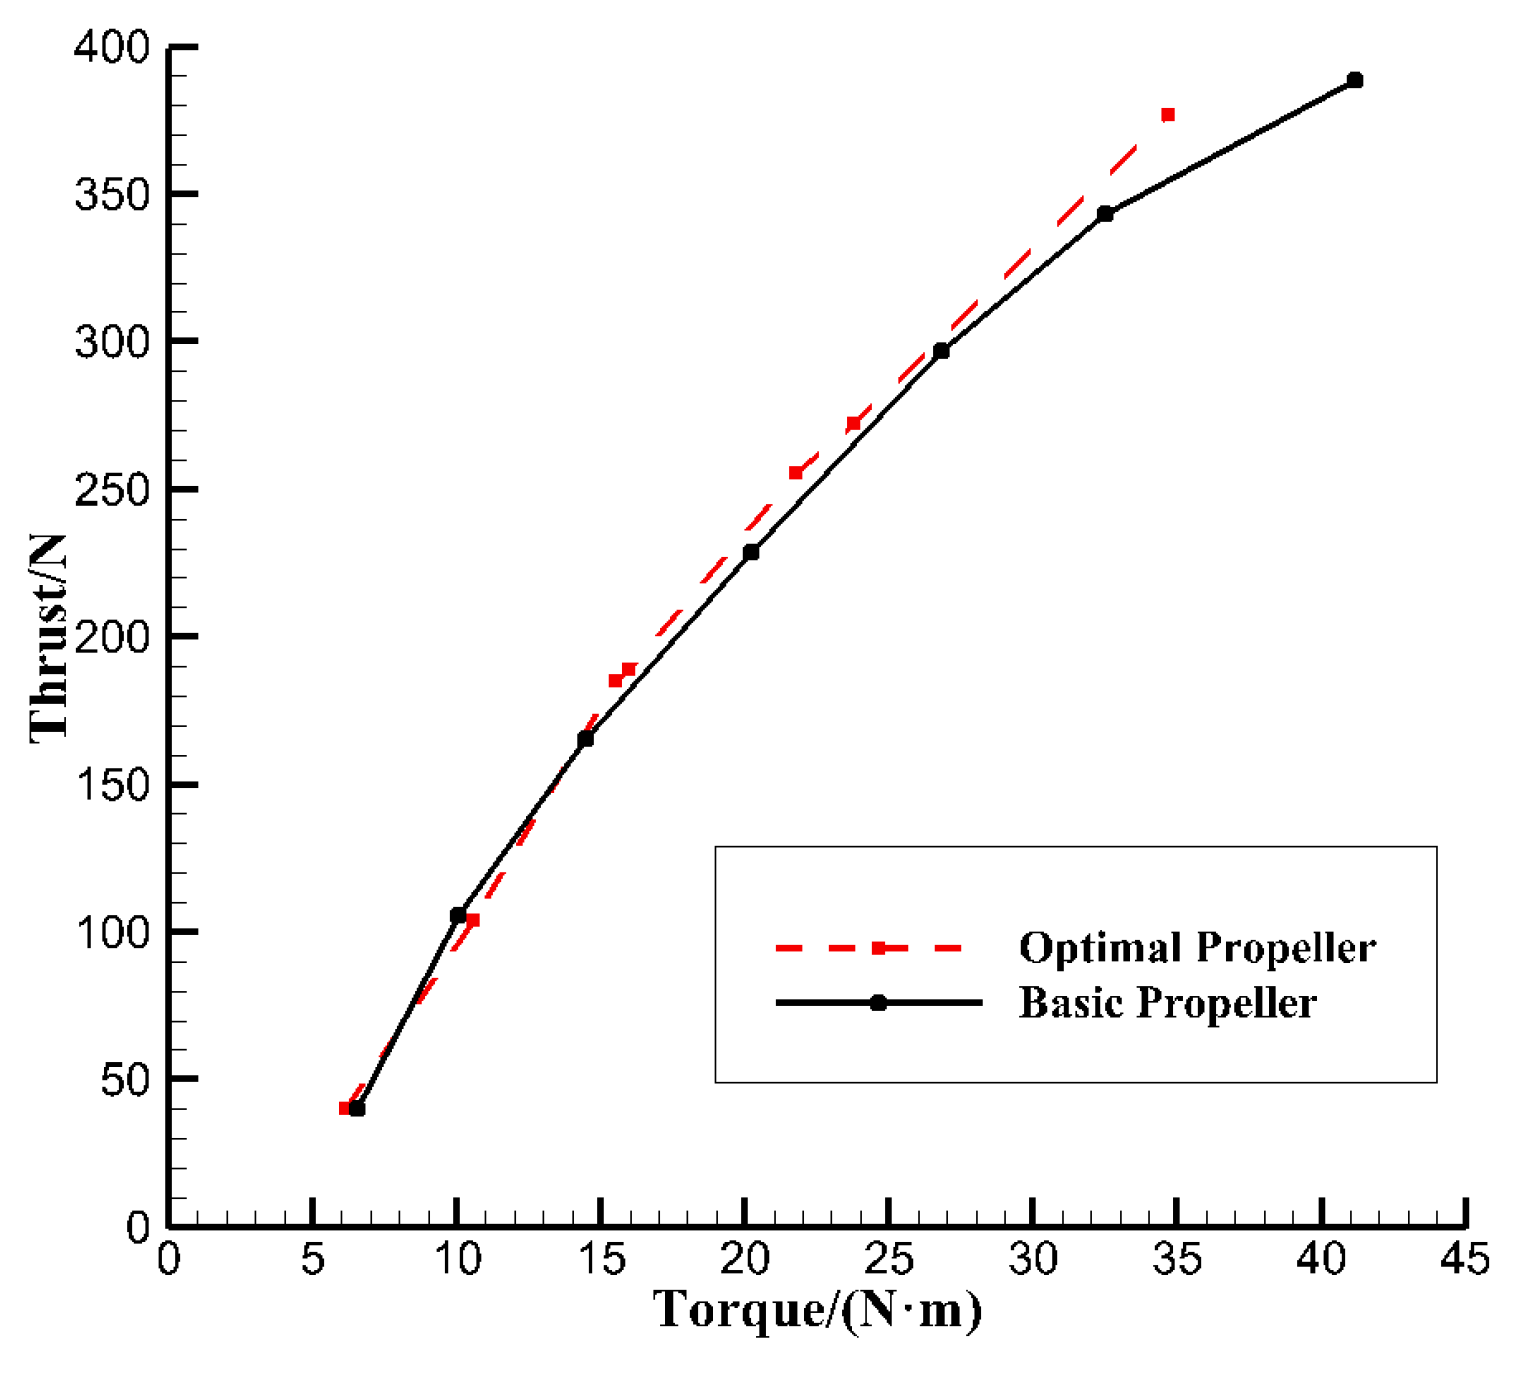
For a constant-speed propeller, under takeoff conditions, the speed of the propeller remains unchanged, and the flight speed is low. Here, the aerodynamic characteristics of the two sets of propellers under this working condition are further compared and analyzed.
Figure 10 shows the torque curve corresponding to different pitch angles/thrust when the inflow speed is 30 m/s. The torque required by the optimized propeller is lower when a large thrust is required above 150 N, that is, the efficiency of the optimized propeller is slightly higher than that of the original propeller. The specific numerical comparison between the two is shown in
Table 5. Under the given three working conditions (the original propeller thrust is 43 N, 230 N, and 350 N, in turn), the thrust and efficiency of the optimized propeller are improved (the thrust is increased by 6 N~12 N, and the efficiency is increased by 0.028~0.051). Thus, the aerodynamic performance of the optimized propeller is significantly higher than that of the original propeller.
4.2.2. Comparison and Verification of Acoustic Performance
The jet shear layer correction, atmospheric attenuation correction, measurement distance correction, and measurement direction angle correction are carried out for aeroacoustic data.
Here, the aeroacoustic characteristics of the two sets of propellers at different pitch angles are also compared and analyzed, with thrust as the variable.
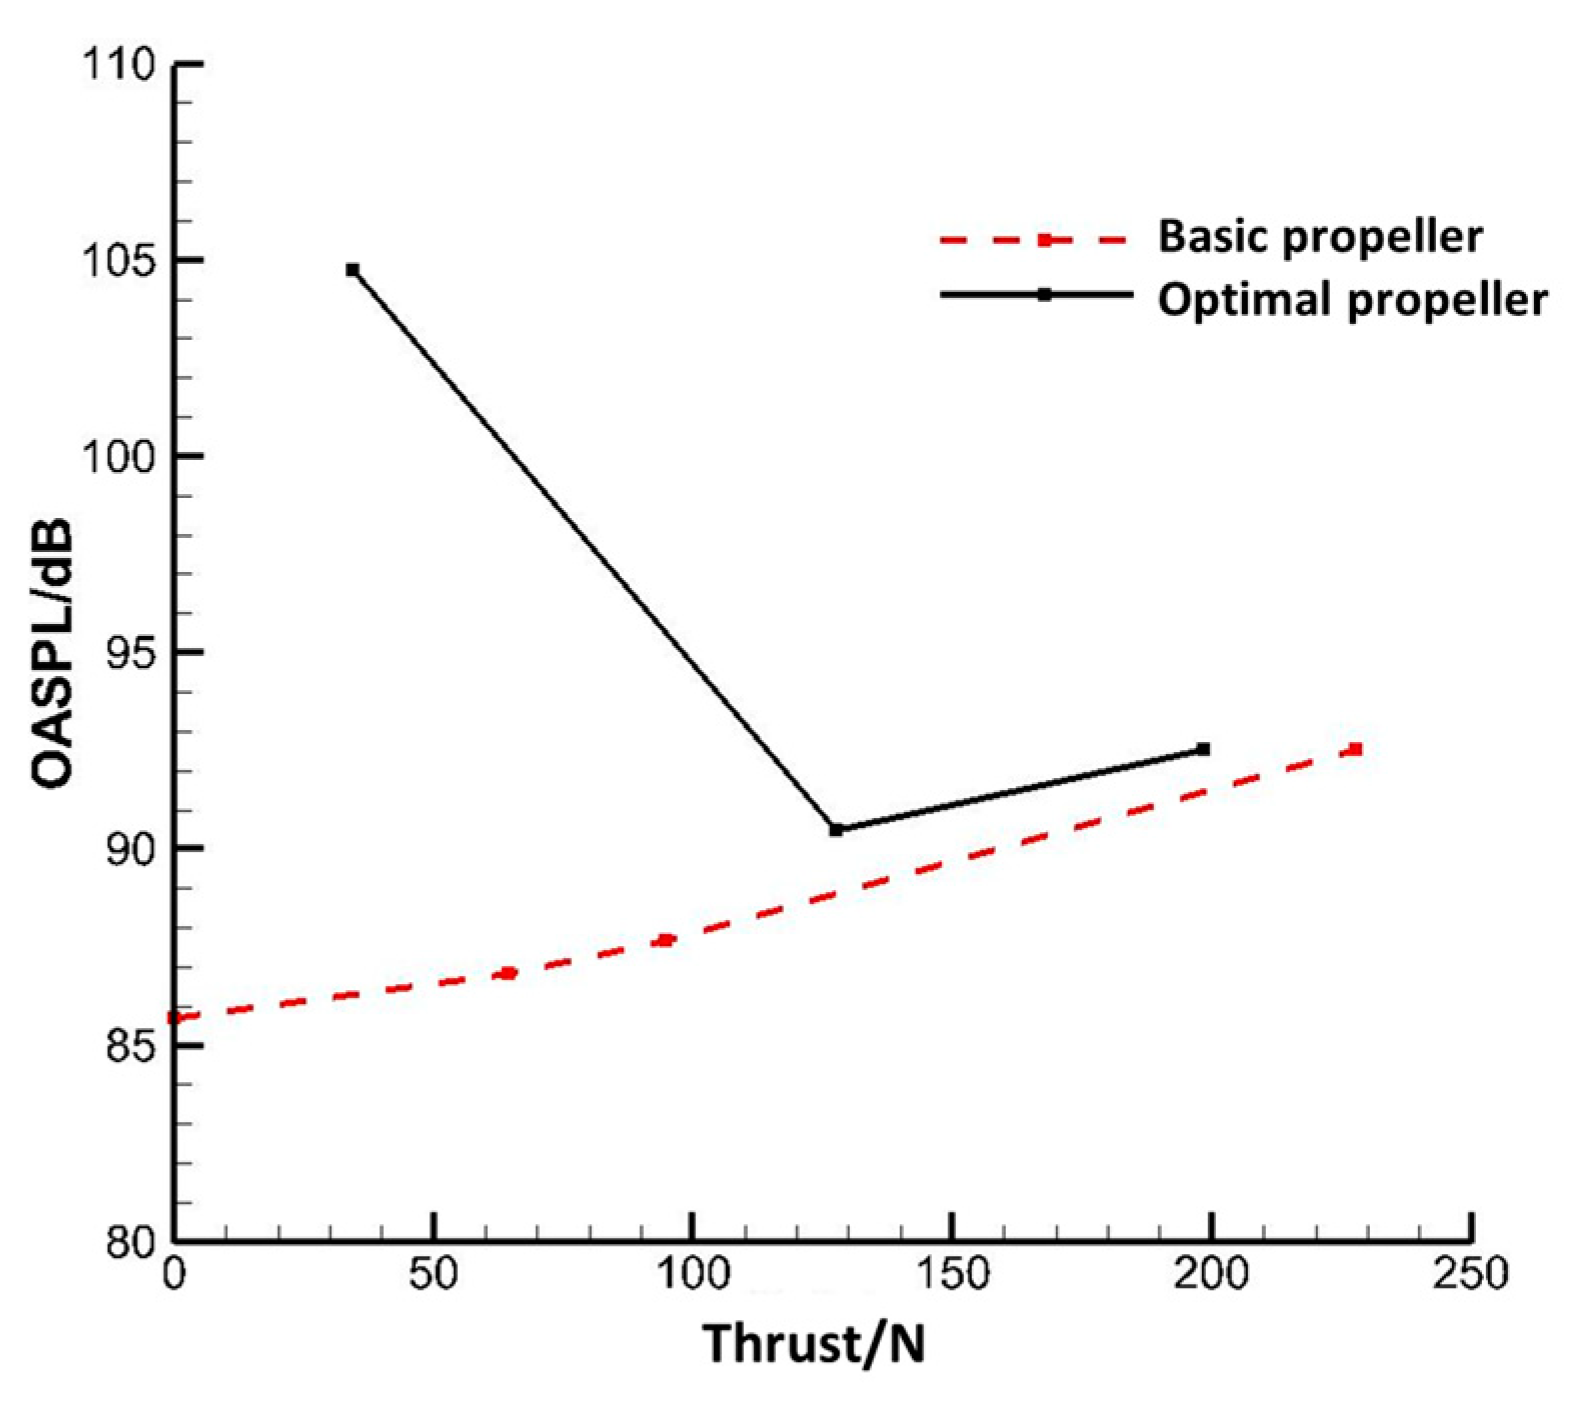
Figure 12 shows the comparison of the total sound pressure level (OASPL) at the far field at a propeller speed of 4811 r/min and an inflow speed of 50 m/s. The noise reduction characteristics are like those under 1 BPF because the dominant amount of the propeller’s spectrum is the noise of 1 BPF. Compared with the original propeller, the optimized propeller reduces the noise by 3 dB at the design condition, with a thrust of about 120 N. The noise reduction effect is more obvious with a lower thrust, and the maximum is 18 dB (thrust 35.4 N). The amount of noise reduction decreases with the increase in thrust, with a minimum of 1 dB (thrust 198 N).
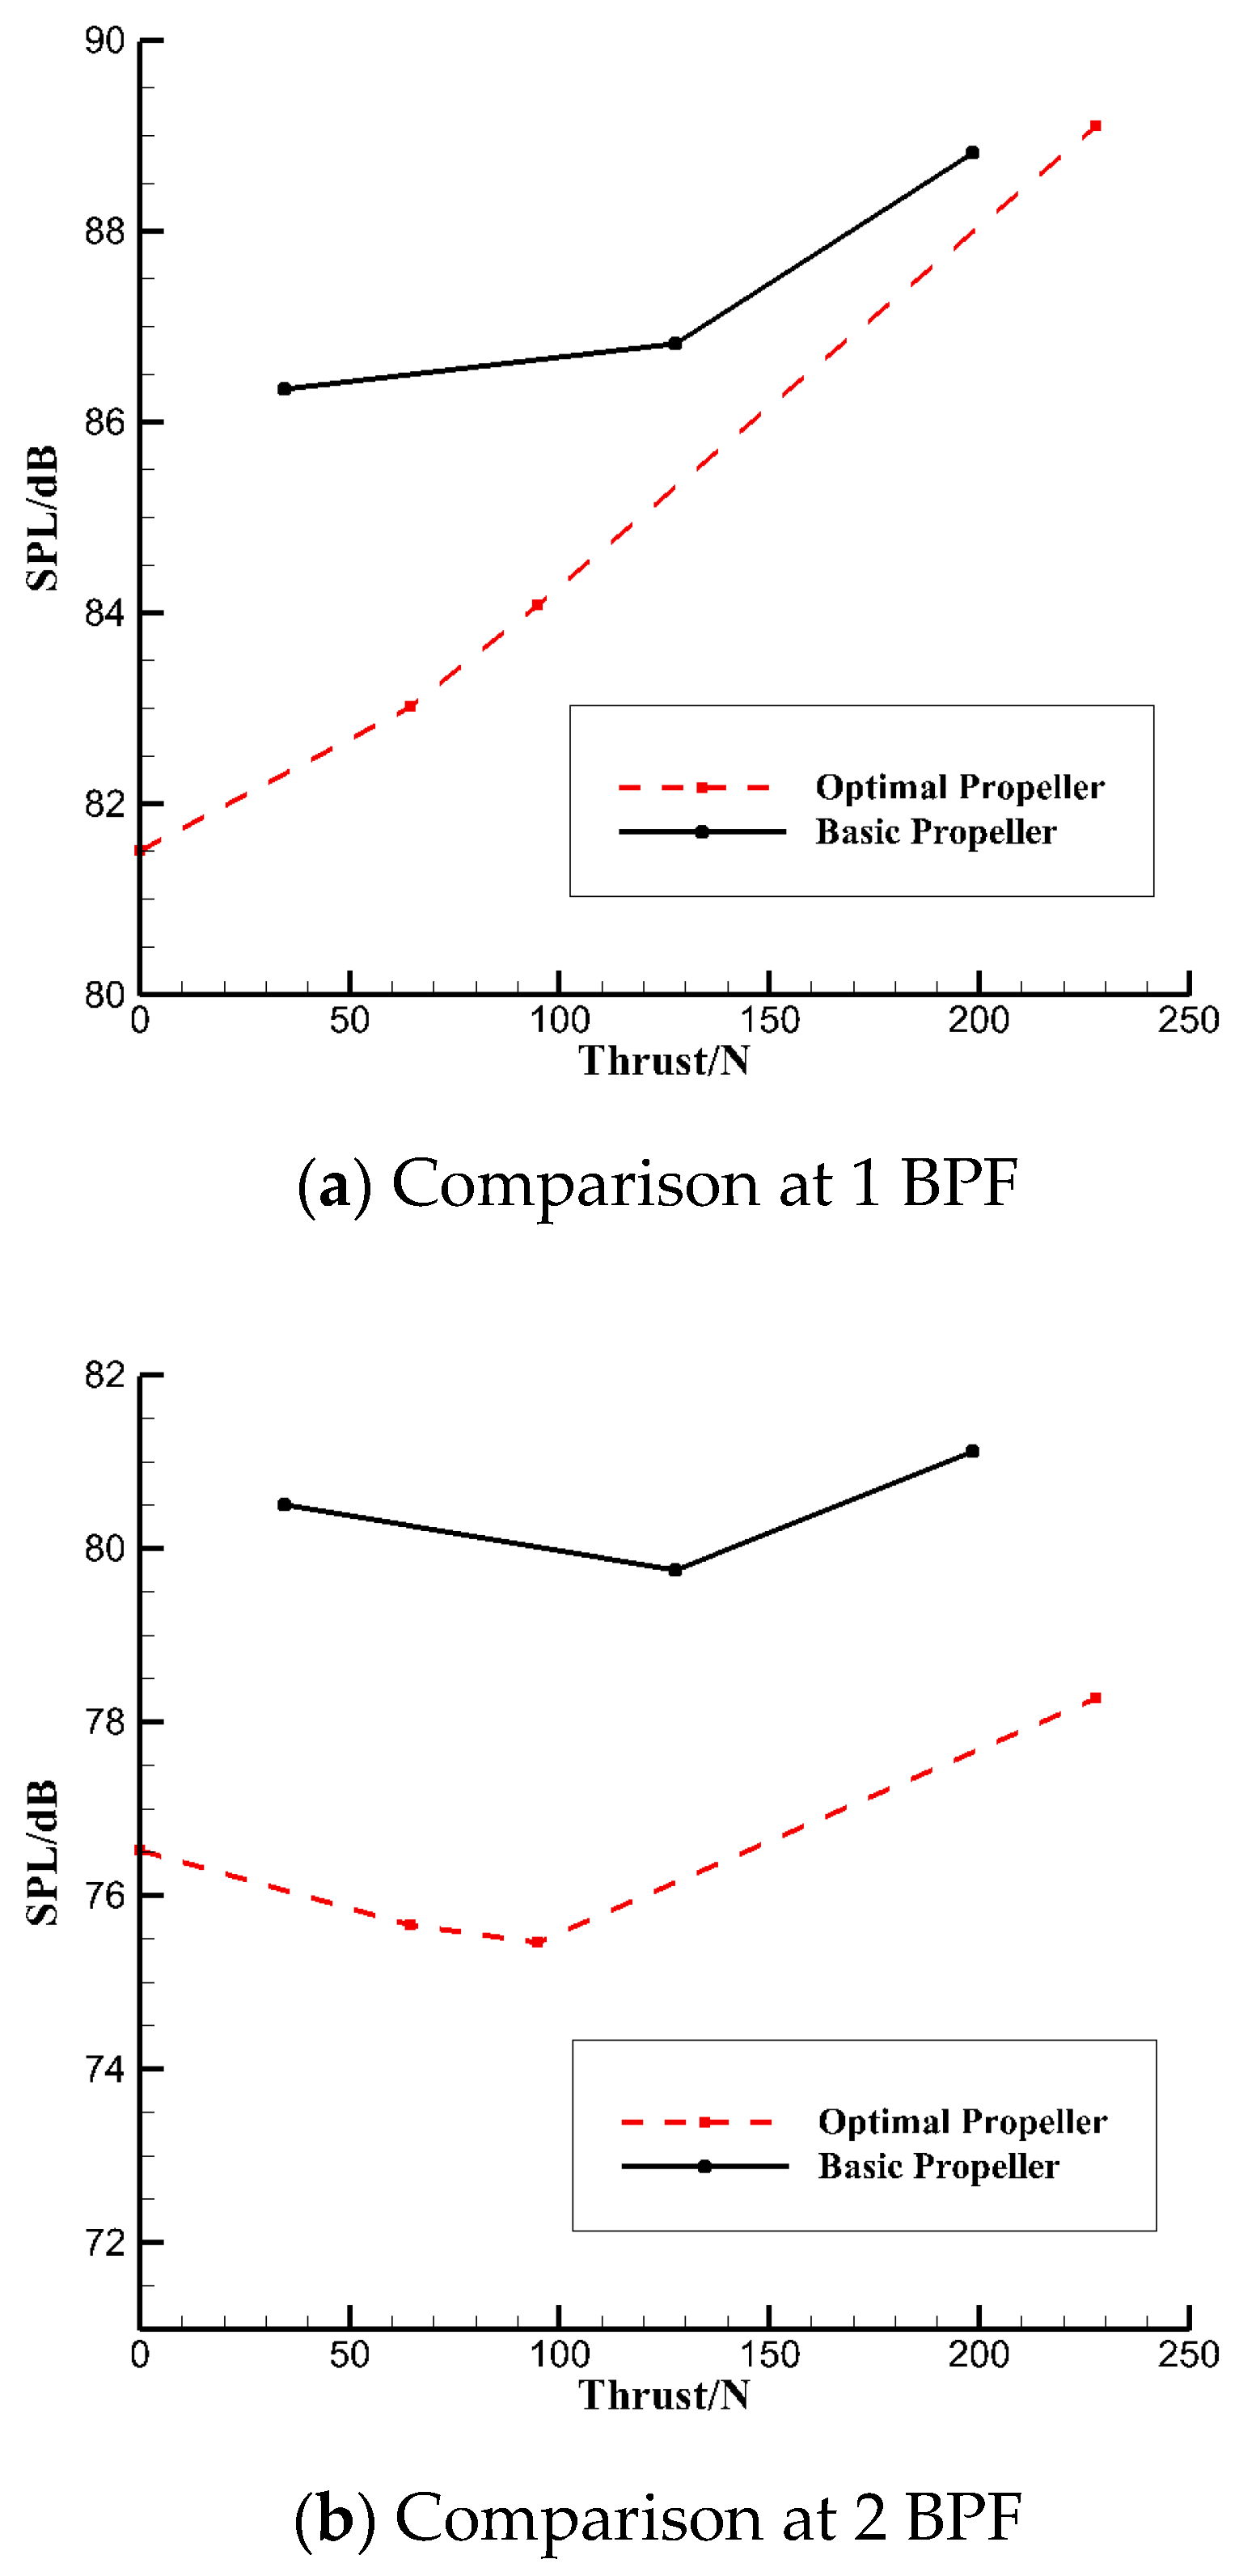
Figure 13a shows the comparison of far-field pointing peak values under design conditions (propeller speed 4811 r/min, inflow speed 50 m/s, 1 BPF). Compared with the original propeller, the noise of the optimized propeller is significantly reduced. The noise is reduced by 2.7 dB at the optimal operating point, with a thrust of about 120 N. The noise reduction effect is more obvious in the area with a lower thrust, up to 4 dB. The noise reduction decreases with the increase in thrust, with a minimum of 1 dB. Under the design condition, the optimization results show that (
Table 3) the noise of the optimized propeller is reduced by 5 dB. The actual test of the optimized propeller shows that the noise of the optimized propeller is reduced by 2.7 dB. It shows that the noise prediction error of 1 BPF is 2.3 dB. The calculation result is relatively accurate and consistent with the calculation accuracy conclusion in
Section 2.4.
Figure 13b shows the comparison of the far-field point SPL at a propeller speed of 4811 r/min, an incoming flow speed of 50 m/s, and 2 BPF. Compared with the original propeller, the noise of the optimized propeller is still significantly reduced. Compared with the noise reduction at 1 BPF, the noise reduction at 2 BPF is better, and the noise reduction amount under different pitch angles is more than 3.5 dB. The noise reduction effect under 2 BPF does not show the trend of the noise reduction amount decreasing with the increase in thrust under 1 BPF.
Therefore, the optimized propeller can effectively reduce the aeroacoustic performance of the propeller without reducing or even slightly improving the aerodynamic characteristics.


