1. Introduction
Facing increasingly prominent environment and energy supply issues, civil aircraft engines trend toward increased bypass ratio and overall pressure ratio to achieve lower fuel consumption and higher efficiency [
1]. Limited by the outer diameter of nacelles, the only approach to increase the bypass ratio is to reduce the core size, so the aspect ratio of axial compressor blades, especially for rear stages, becomes smaller for next-generation engines. With consideration of safety and manufacture, the clearance-to-span ratio trends toward larger in rear-stage axial compressors since the absolute clearance size does not decrease with the core size, resulting in a higher proportion of leakage loss in the overall efficiency penalty [
2]. Extensive research has shown that about a third of axial compressor loss can be attributed to the leakage flow [
3], and the local high incidence induced by the rotor tip leakage flow is closely related to the formation of the spike-type rotating stall [
4,
5]. Therefore, it is critical to further understand the mechanisms of axial compressor leakage flow and thereby alleviate its negative impact on axial compressor performance.
The past decades have seen increasingly rapid advances in the field of computational fluid dynamics (CFD) [
6,
7]. However, due to the strong unsteadiness and the multi-scale characteristics of axial compressor leakage flow [
8,
9], the CFD method of solving Reynolds-averaged Navier—Stokes (RANS) equations still has some inherent weaknesses, such as the inability to predict the accurate mechanisms of leakage flow in off-design conditions [
10]. Moreover, even in the design condition, the RANS method also cannot capture the primary behaviors to a satisfactory level of accuracy for the large clearance [
11,
12]. Scale-resolving simulations, such as the direct numerical simulation and large eddy simulation, are more precise for predicting complex flow, but their grid size scaled with the Reynolds number limits their widespread applications for industrial axial compressors with a high Reynolds number [
13,
14,
15,
16]. Consequently, there is an urgent demand to acquire experimental data on axial compressor leakage flow by advanced measurement technologies. The detailed experimental data not only can research the influence of the leakage flow on axial compressor performance but also can validate and develop CFD tools, thus further improving the accuracy level of the CFD method [
17].
It is challenging for real axial compressors to acquire leakage flow data with a high spatial and temporal resolution. The reasons can be attributed to the small clearance size, high-speed rotation, and confined space. Conventional methods for studying the leakage flow include: (1) embedding dynamic pressure sensors inside the casing to obtain dynamic pressure data, but the spatial resolution of this method usually is not high enough [
18,
19]; (2) opening an optical visualization window on the casing, then the particle image velocimetry (PIV) is used to capture the axial compressor leakage flow with a high spatial and temporal resolution [
20,
21]; and (3) utilizing a probe or hot wire measures the flow field downstream of the blade [
22,
23,
24]. Among the three methods, the first two methods are only applicable to the rotor tip leakage flow but cannot be applied to investigate the hub leakage flow of cantilevered stators. Because the hub is rotating at high speed and the stator clearance is located on the inner side of the passage, it is difficult for conventional methods to measure the details of the hub leakage flow. Further, in the field of axial compressor research, the experimental facility featuring high-speeding rotation is extremely complex and expensive, so it is not conducive to iterative design such as geometry optimization. Hence, simplified experimental facilities such as the linear axial compressor cascade with tip clearance or low-speed research axial compressor have become a common practice. However, the linear axial compressor cascade cannot account for the effect of moving the endwall with a high Mach number, and the low-speed research axial compressor ignores the shock wave and the compressibility of flow [
25].
Some studies have attempted to use a motor-driven belt to simulate the effect of the moving endwall, but this method is only suitable for low-speed conditions [
26]. Results from both experiments and simulations suggest that the moving endwall has a great influence on the development and stability of the axial compressor leakage flow [
26]. To gain an improved understanding of the axial compressor leakage flow, our group proposed a novel experimental facility that uses a large disk to replace the high-speed moving endwall. This experimental facility is low-cost and can simulate the relative motion between the blade and endwall for axial compressors. Full optical access can be achieved by the visualization windows of the disk. The paper demonstrates the feasibility of the novel experimental facility to study axial compressor leakage flow. In addition, the first-of-its-kind experimental results of axial compressor leakage flow between the static and moving endwall are presented. It is expected that the experimental facility will make more useful contributions to the understanding of axial compressor leakage flow in the future.
The paper is organized as follows. First of all, the design concept and relevant simplification procedures are introduced. Then, the effect of the disk radius is evaluated by single-passage simulations. Next, the effect of the axial velocity difference is evaluated by seven-blade passage simulations. In the end, preliminary experimental results of the axial compressor leakage flow between the static and moving endwall are presented.
2. Design Concept
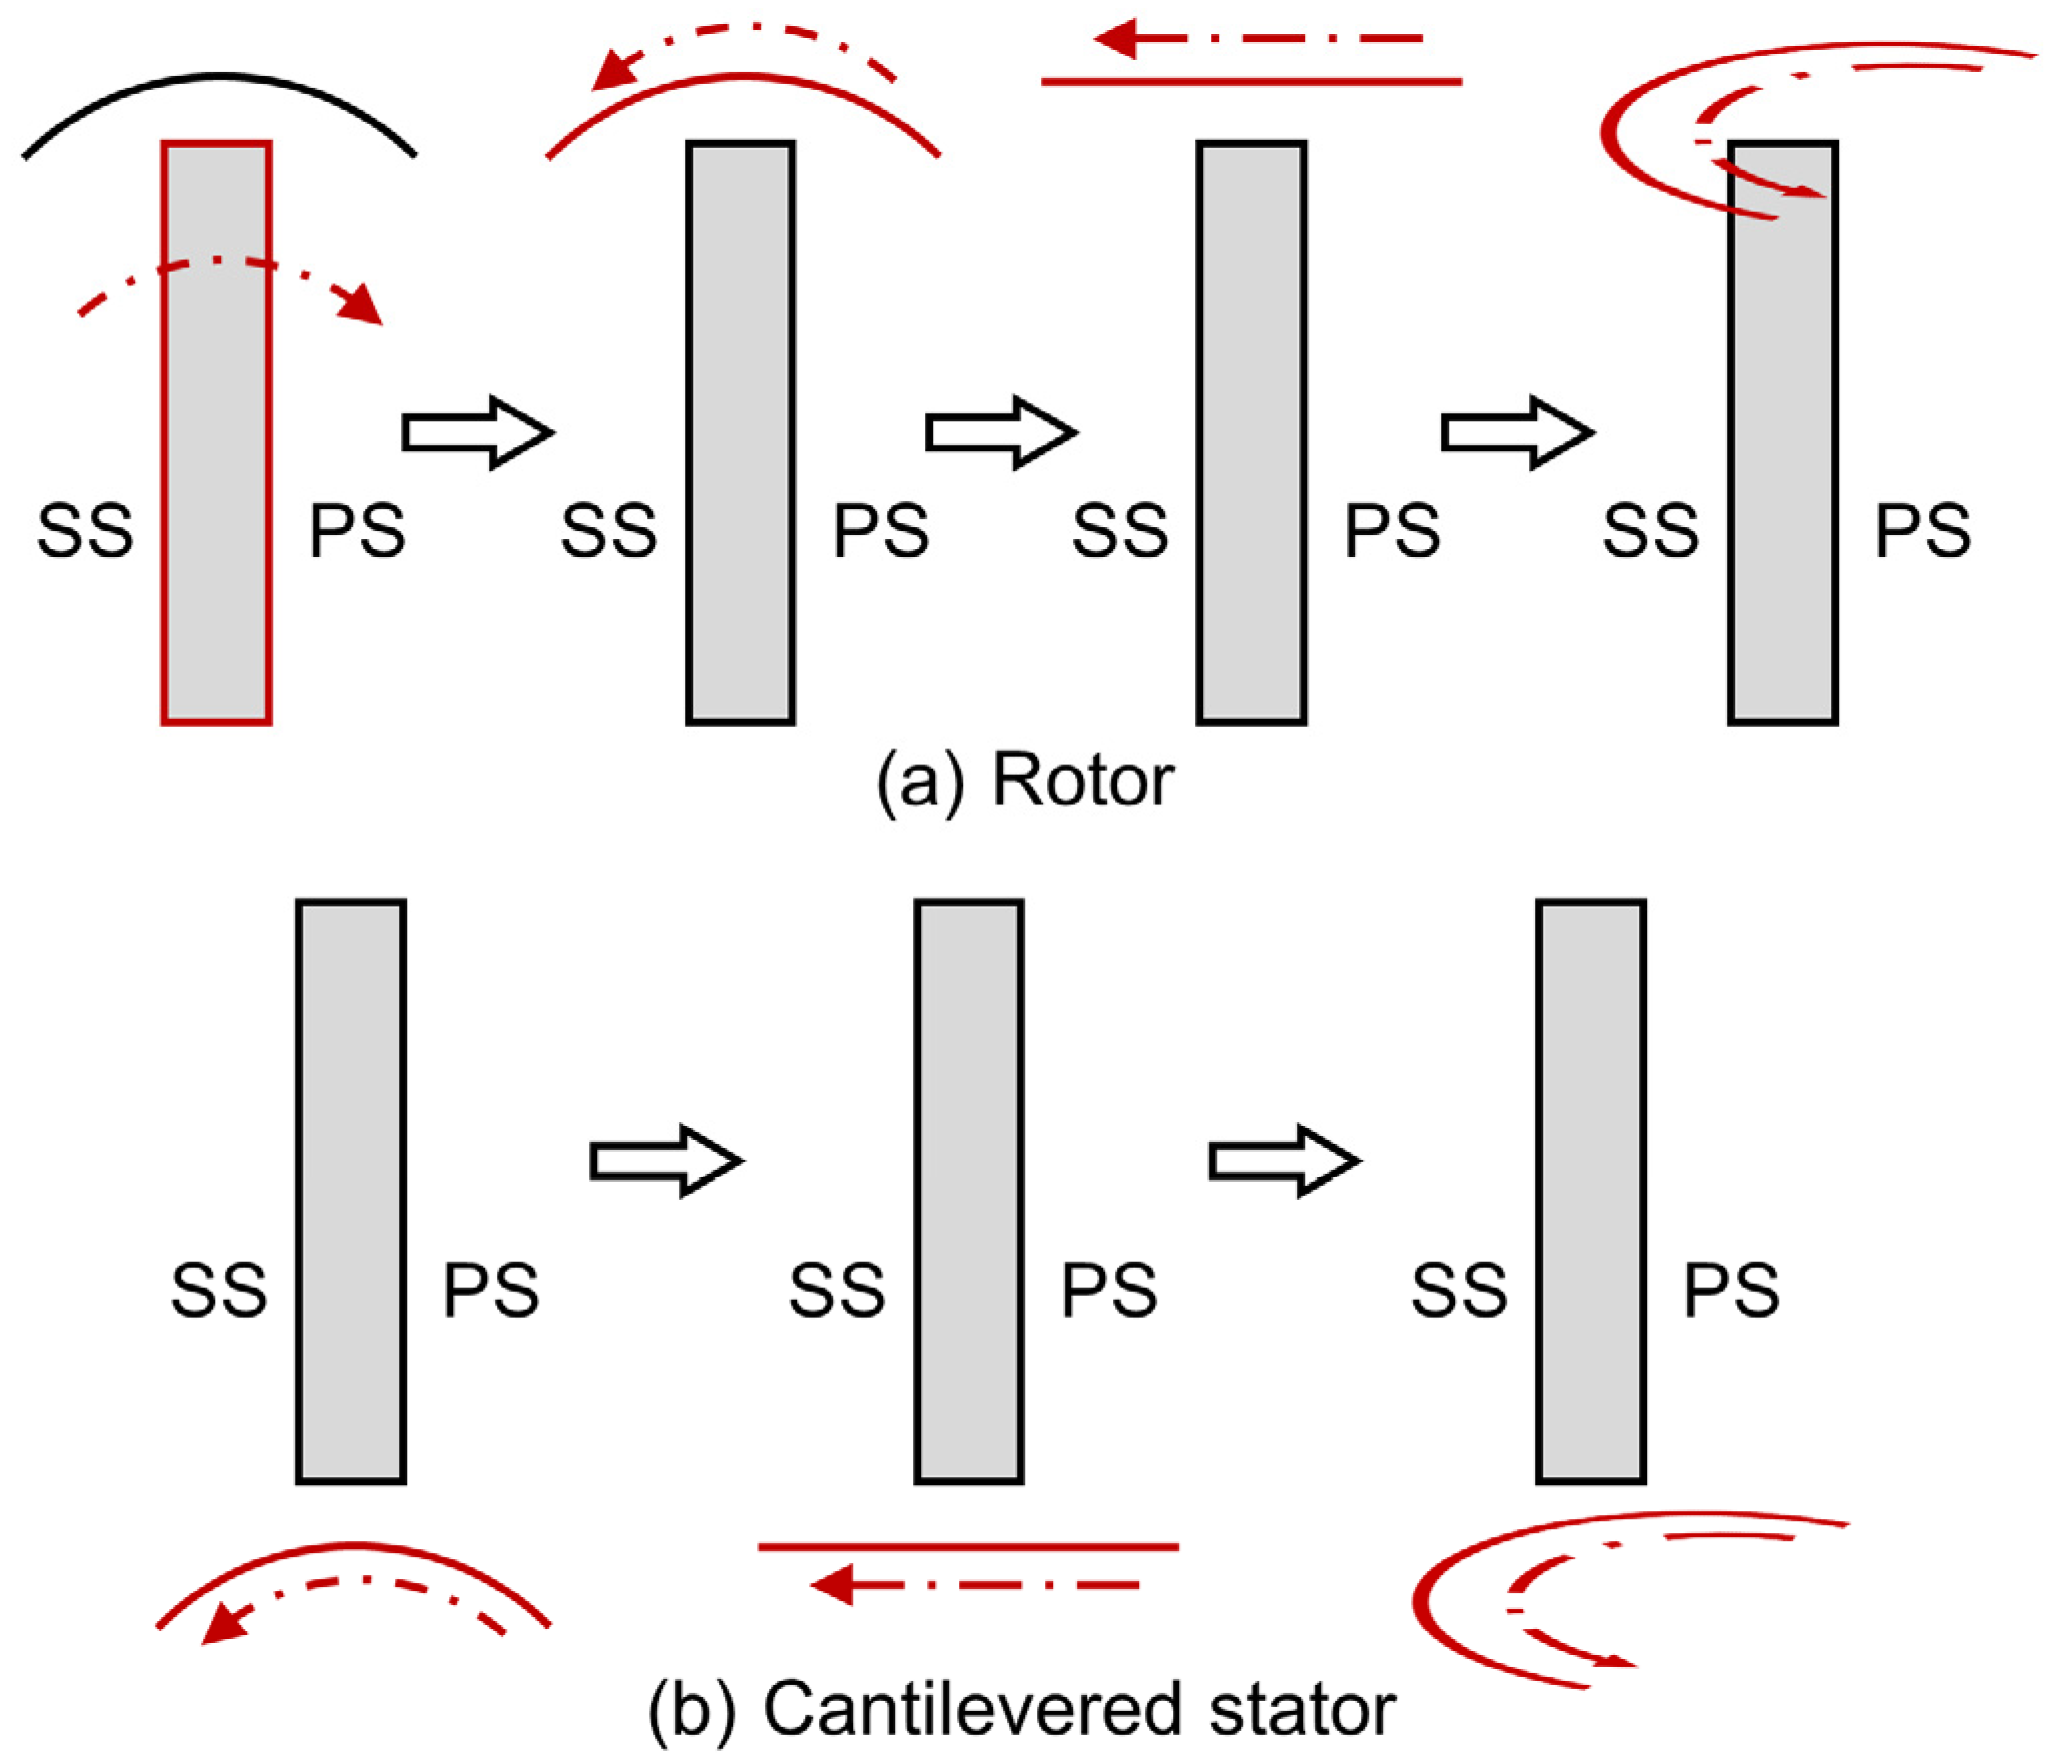
Figure 1 illustrates the simplification procedures of the design concept for the axial compressor rotor and cantilevered stator. The first step simplifies the rotor to a static blade but the casing is counter-rotating. Here, the Coriolis and centrifugal forces are neglected. However, for an axial compressor cantilevered stator, the first simplification step is not required as it is originally static. Then, in consideration of a linear axial compressor cascade, the curvature endwall is simplified to a flat plate, so the endwall transforms from the rotating motion to the translational motion. The early research has shown that the axial compressor cascade is a powerful tool for mechanisms’ investigation because it has the key features involved in real axial compressors. In this situation, it is not possible to consider the effect of the high-speed moving endwall since the conventional design of the moving belt cannot operate at a high speed. To overcome the high-speed issue, we proposed replacing the moving belt with a large radius disk. When the disk radius is large enough, the system errors due to the radius change will become small enough, so the key question for the simplification is to find a disk radius that meets the requirement of both the error and cost.
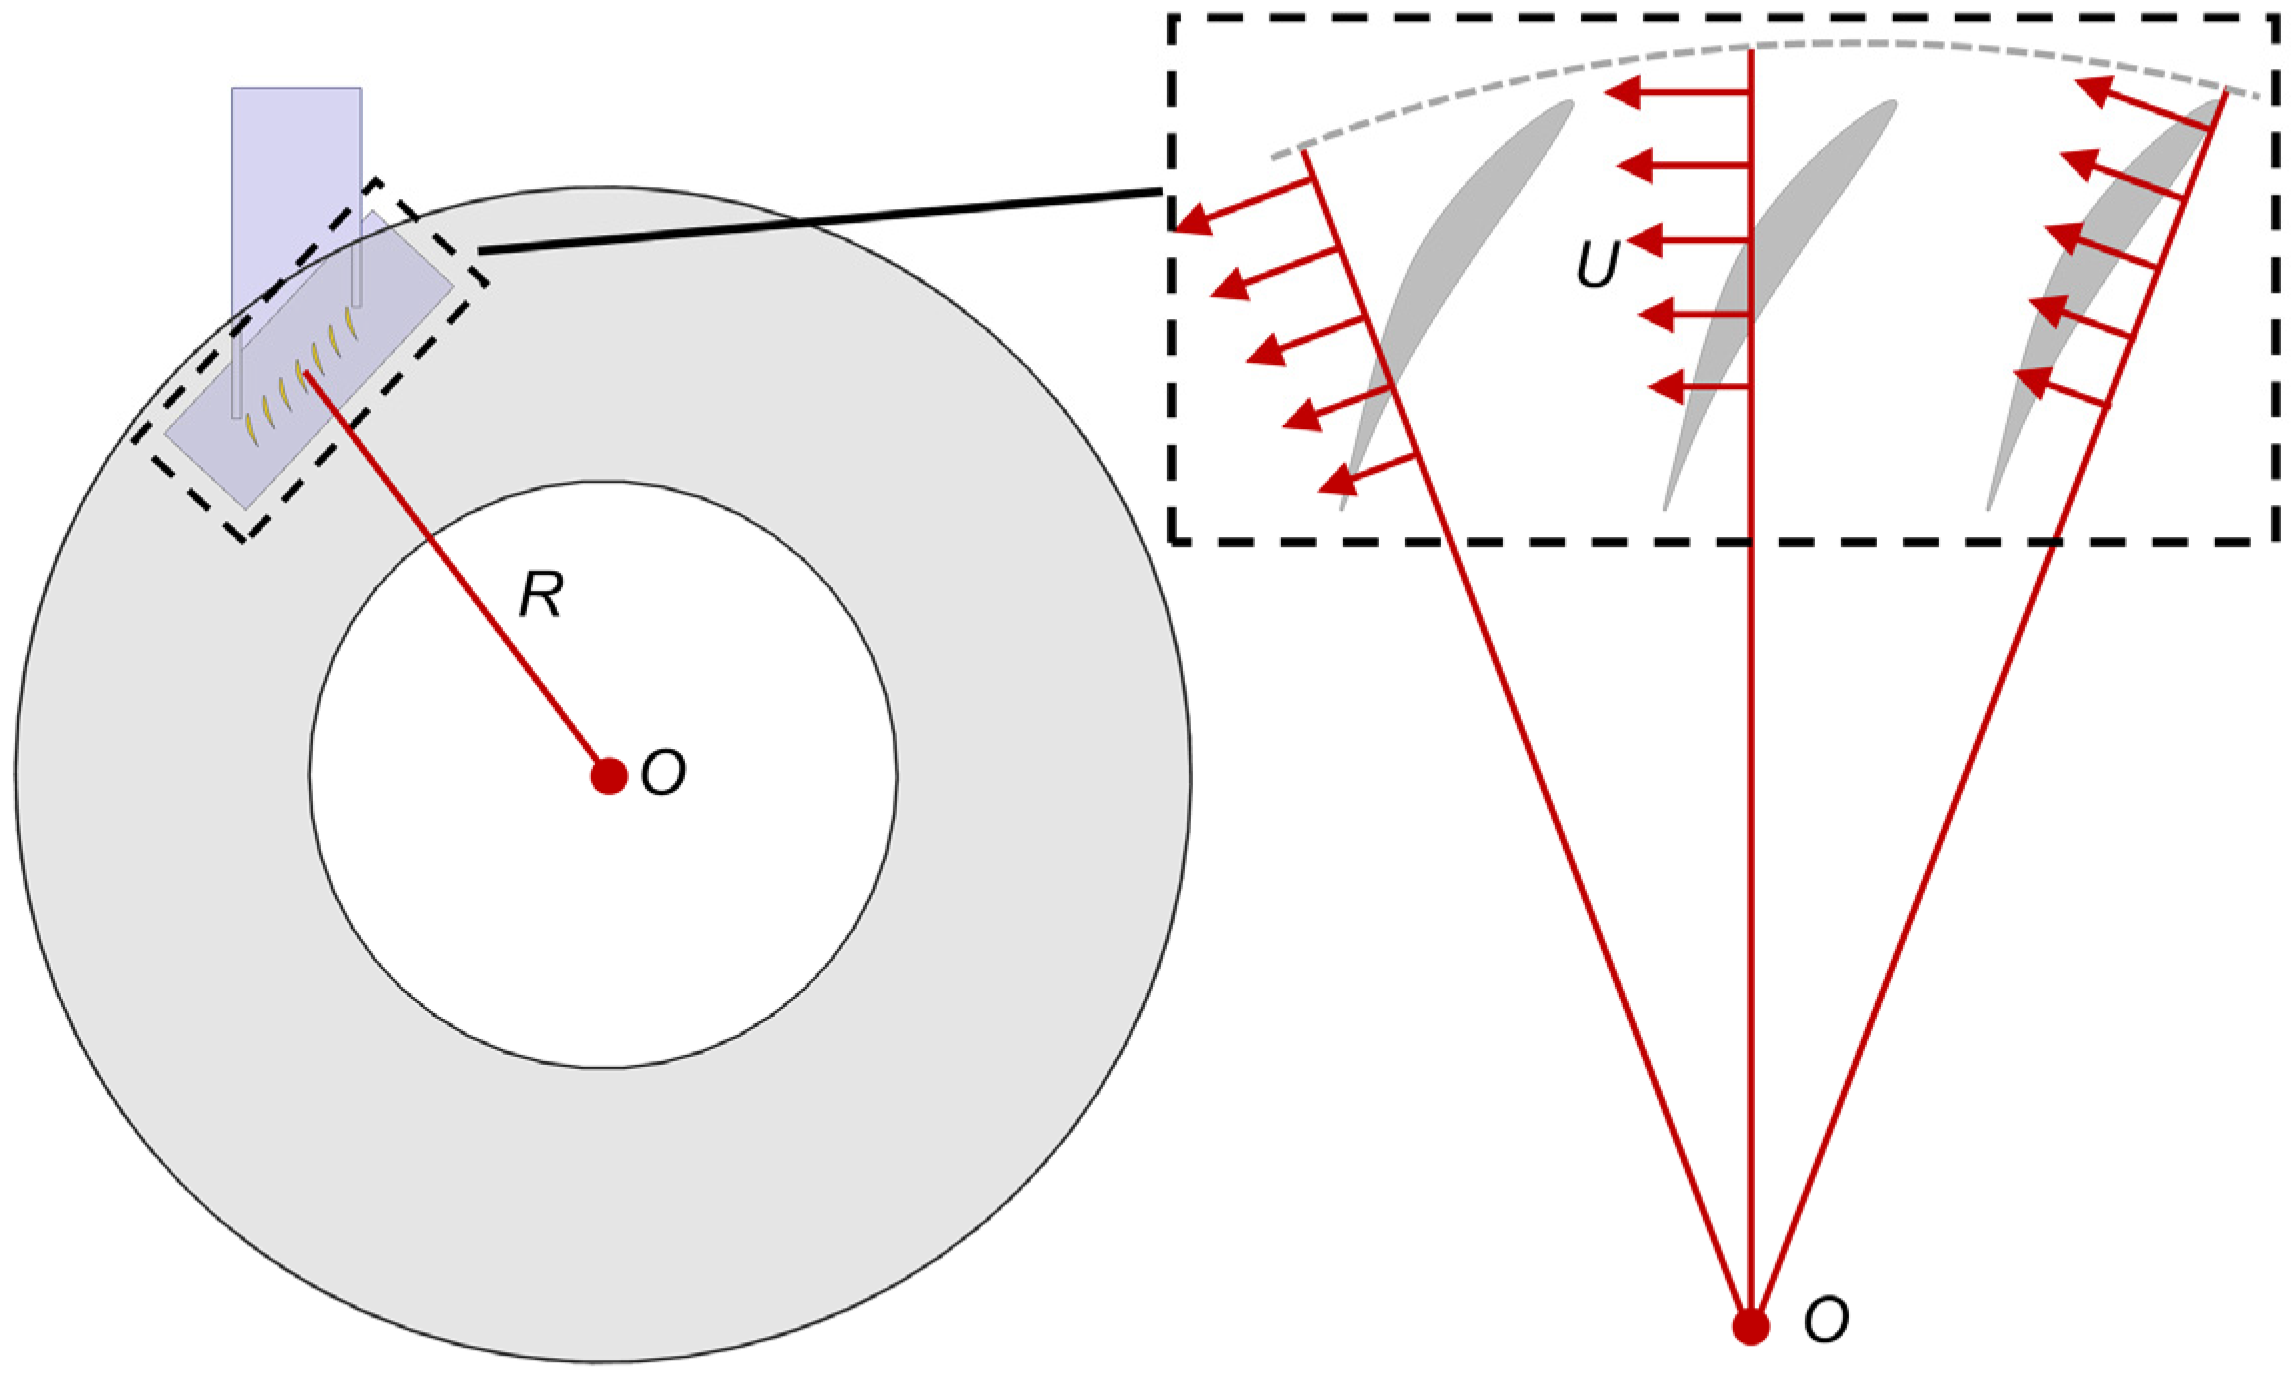
There are two system errors affected by the disk radius. One system error is that the linear velocity changes with the disk radius, shown in
Figure 2.
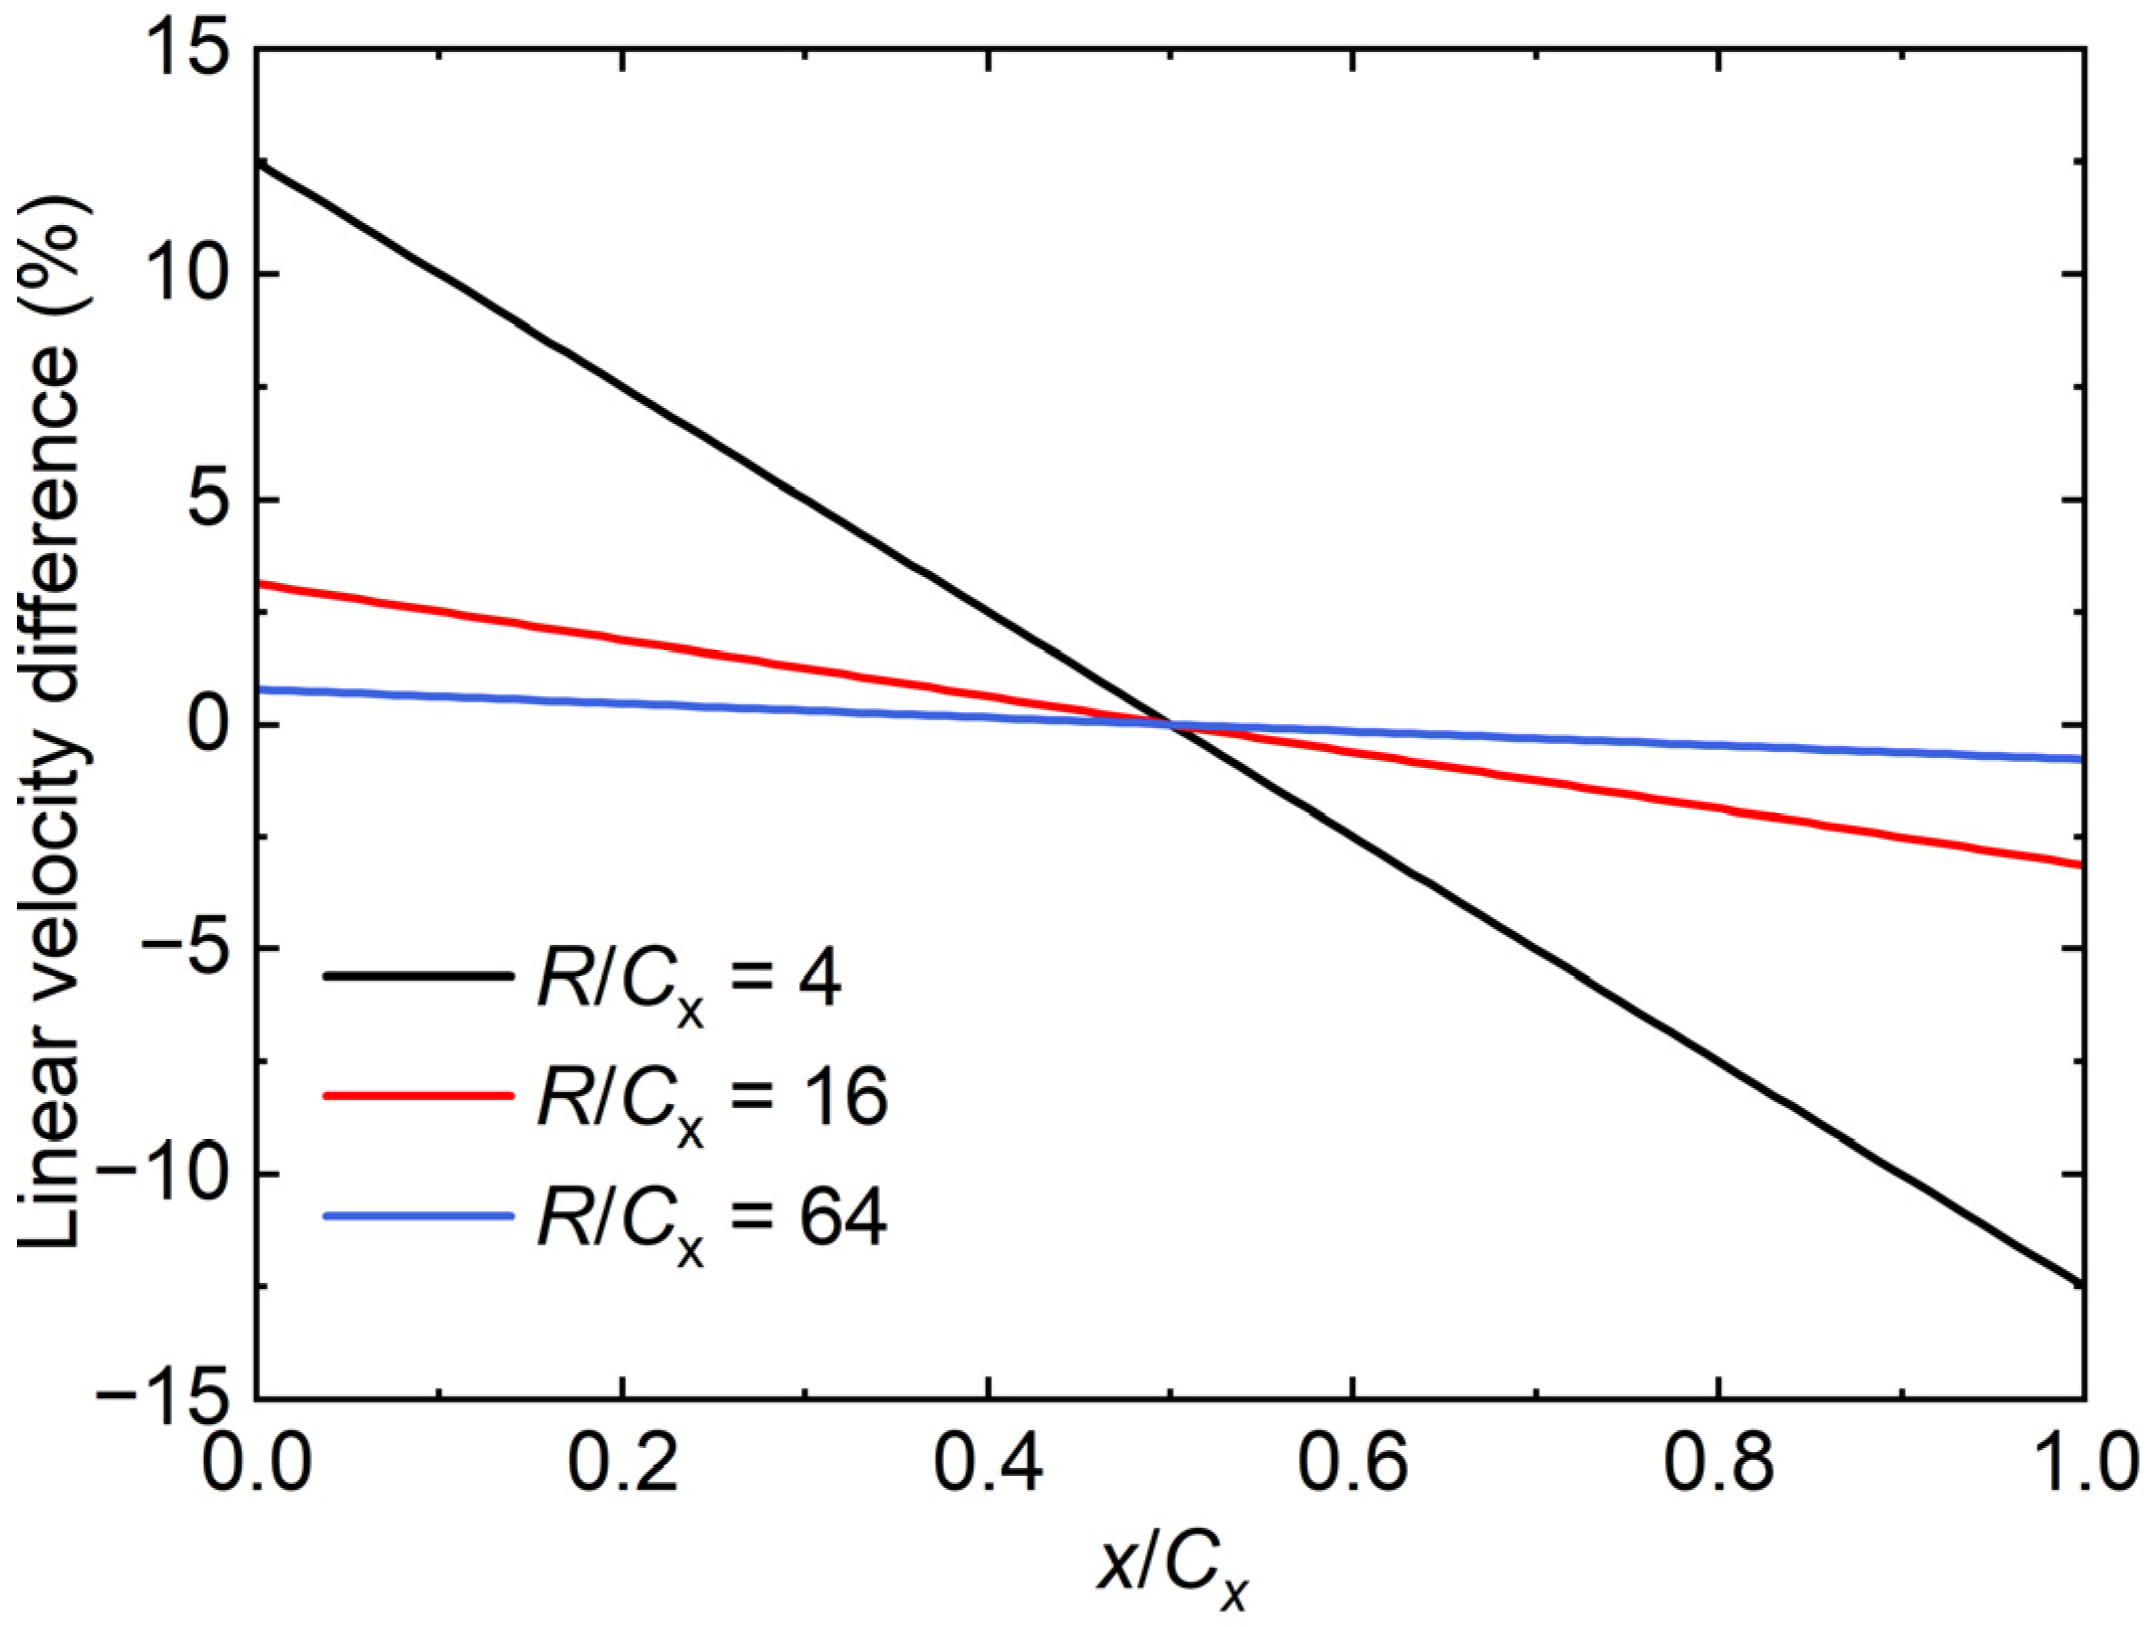
Figure 3 shows the linear velocity difference of various disk radii along the axial chord. Here, the reference is the mid-chord linear velocity, so the linear velocity difference is zero when
x/Cx = 0.5. As shown in
Figure 3, when
R/
Cx = 4, the maximum linear velocity difference at the leading edge (LE) and trailing edge (TE) can reach up to 12.5%. Increasing
R/Cx to 16, the maximum linear velocity difference is about 2.5%. To evaluate the effect of the linear velocity difference, the later discussion further compares the details of the flow field with various disk radii by using single-passage simulations.
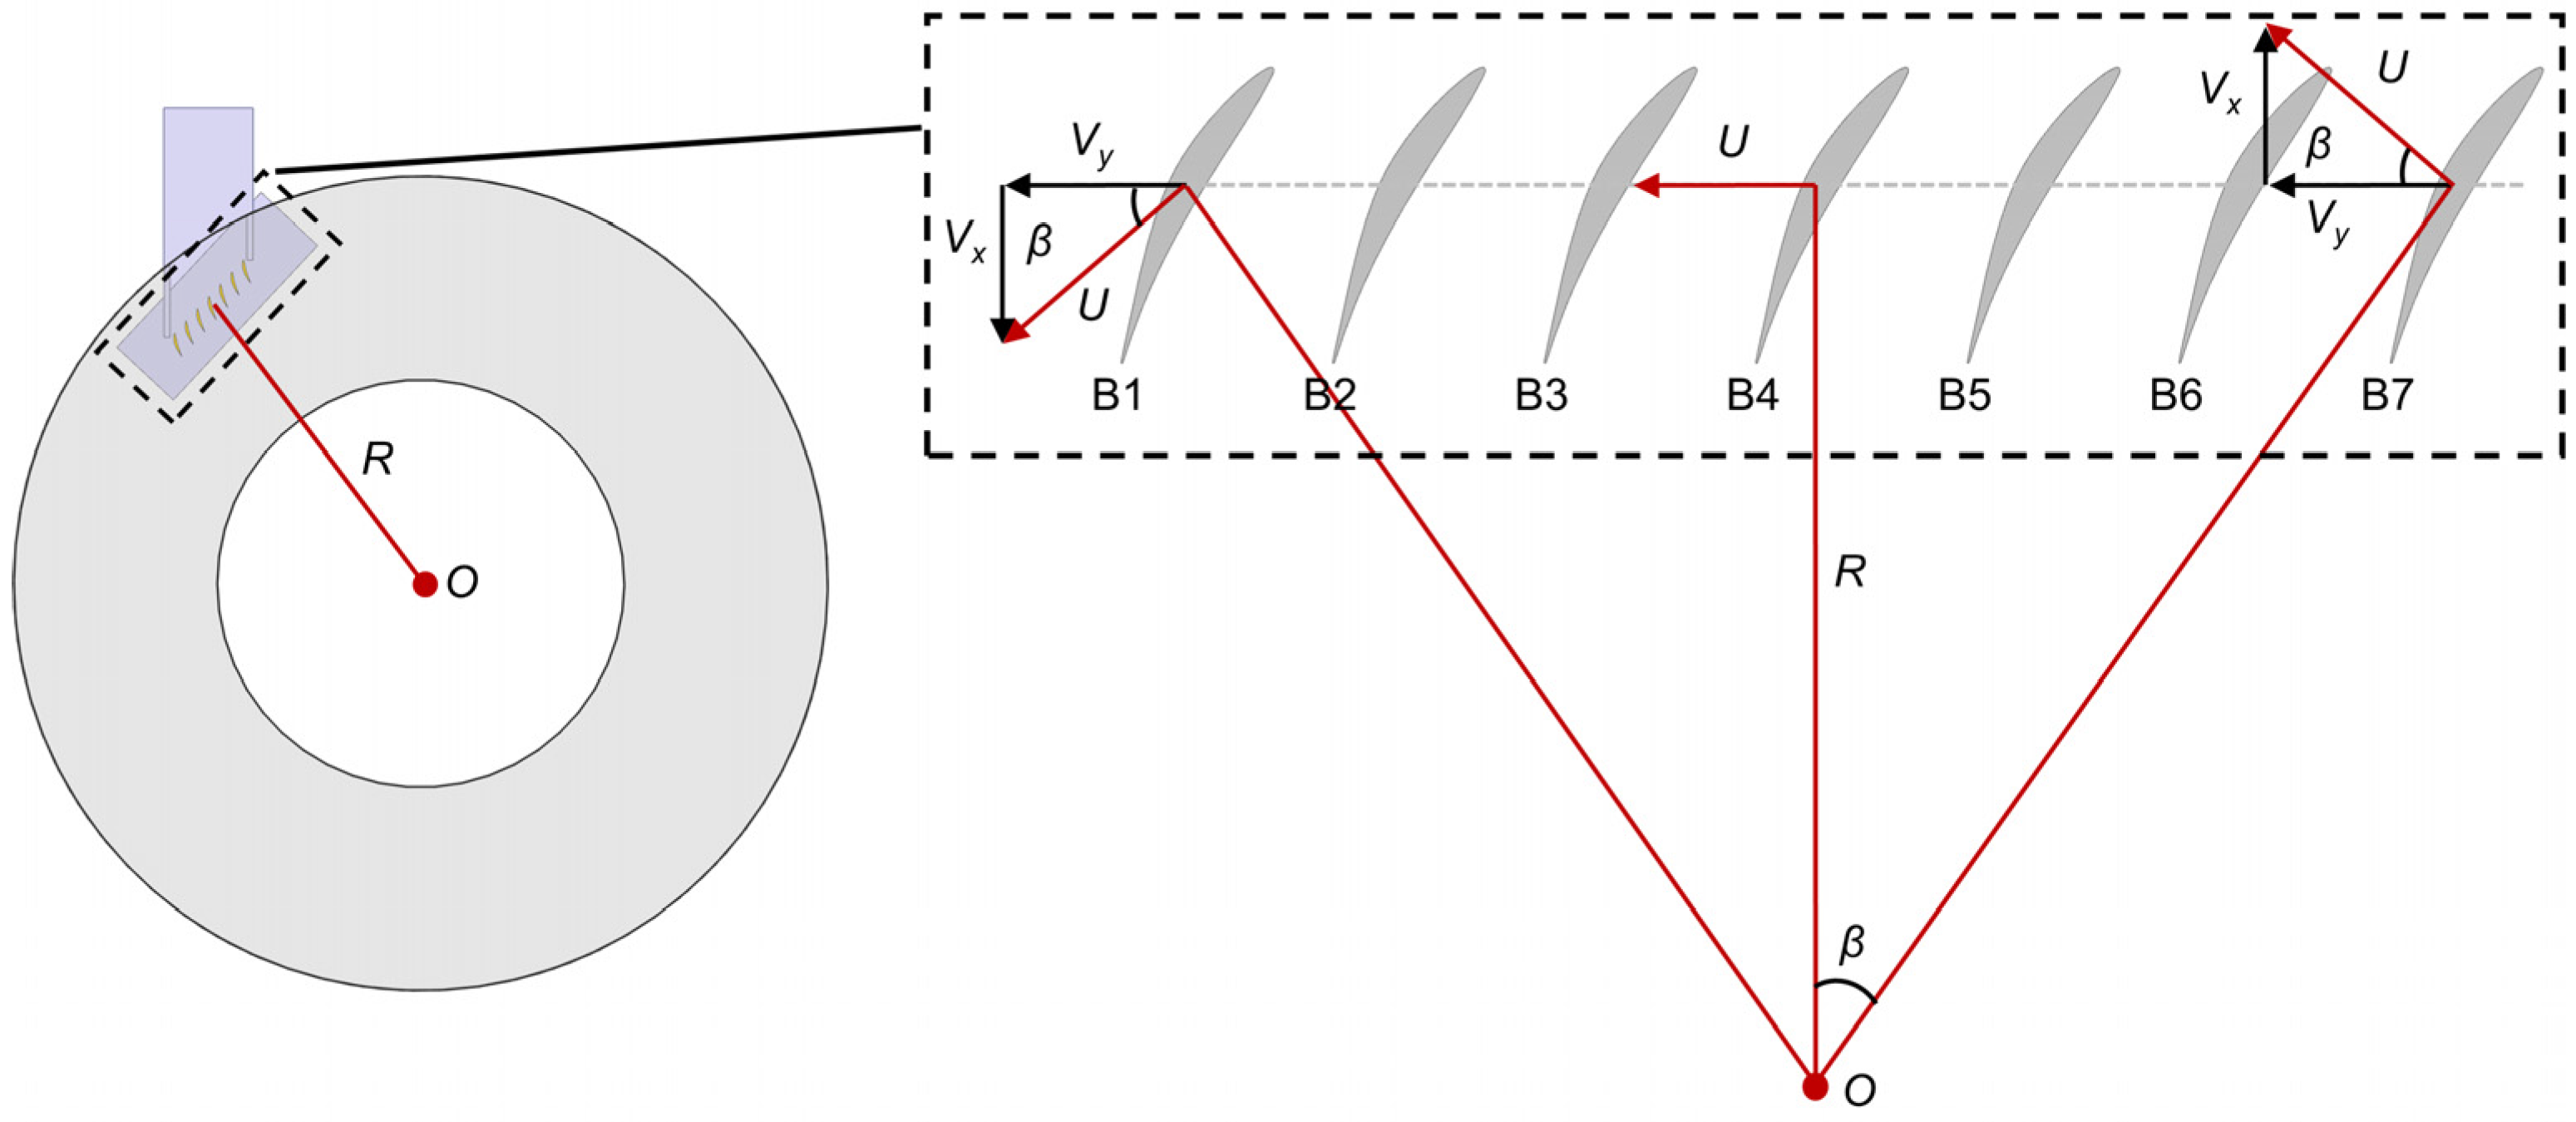
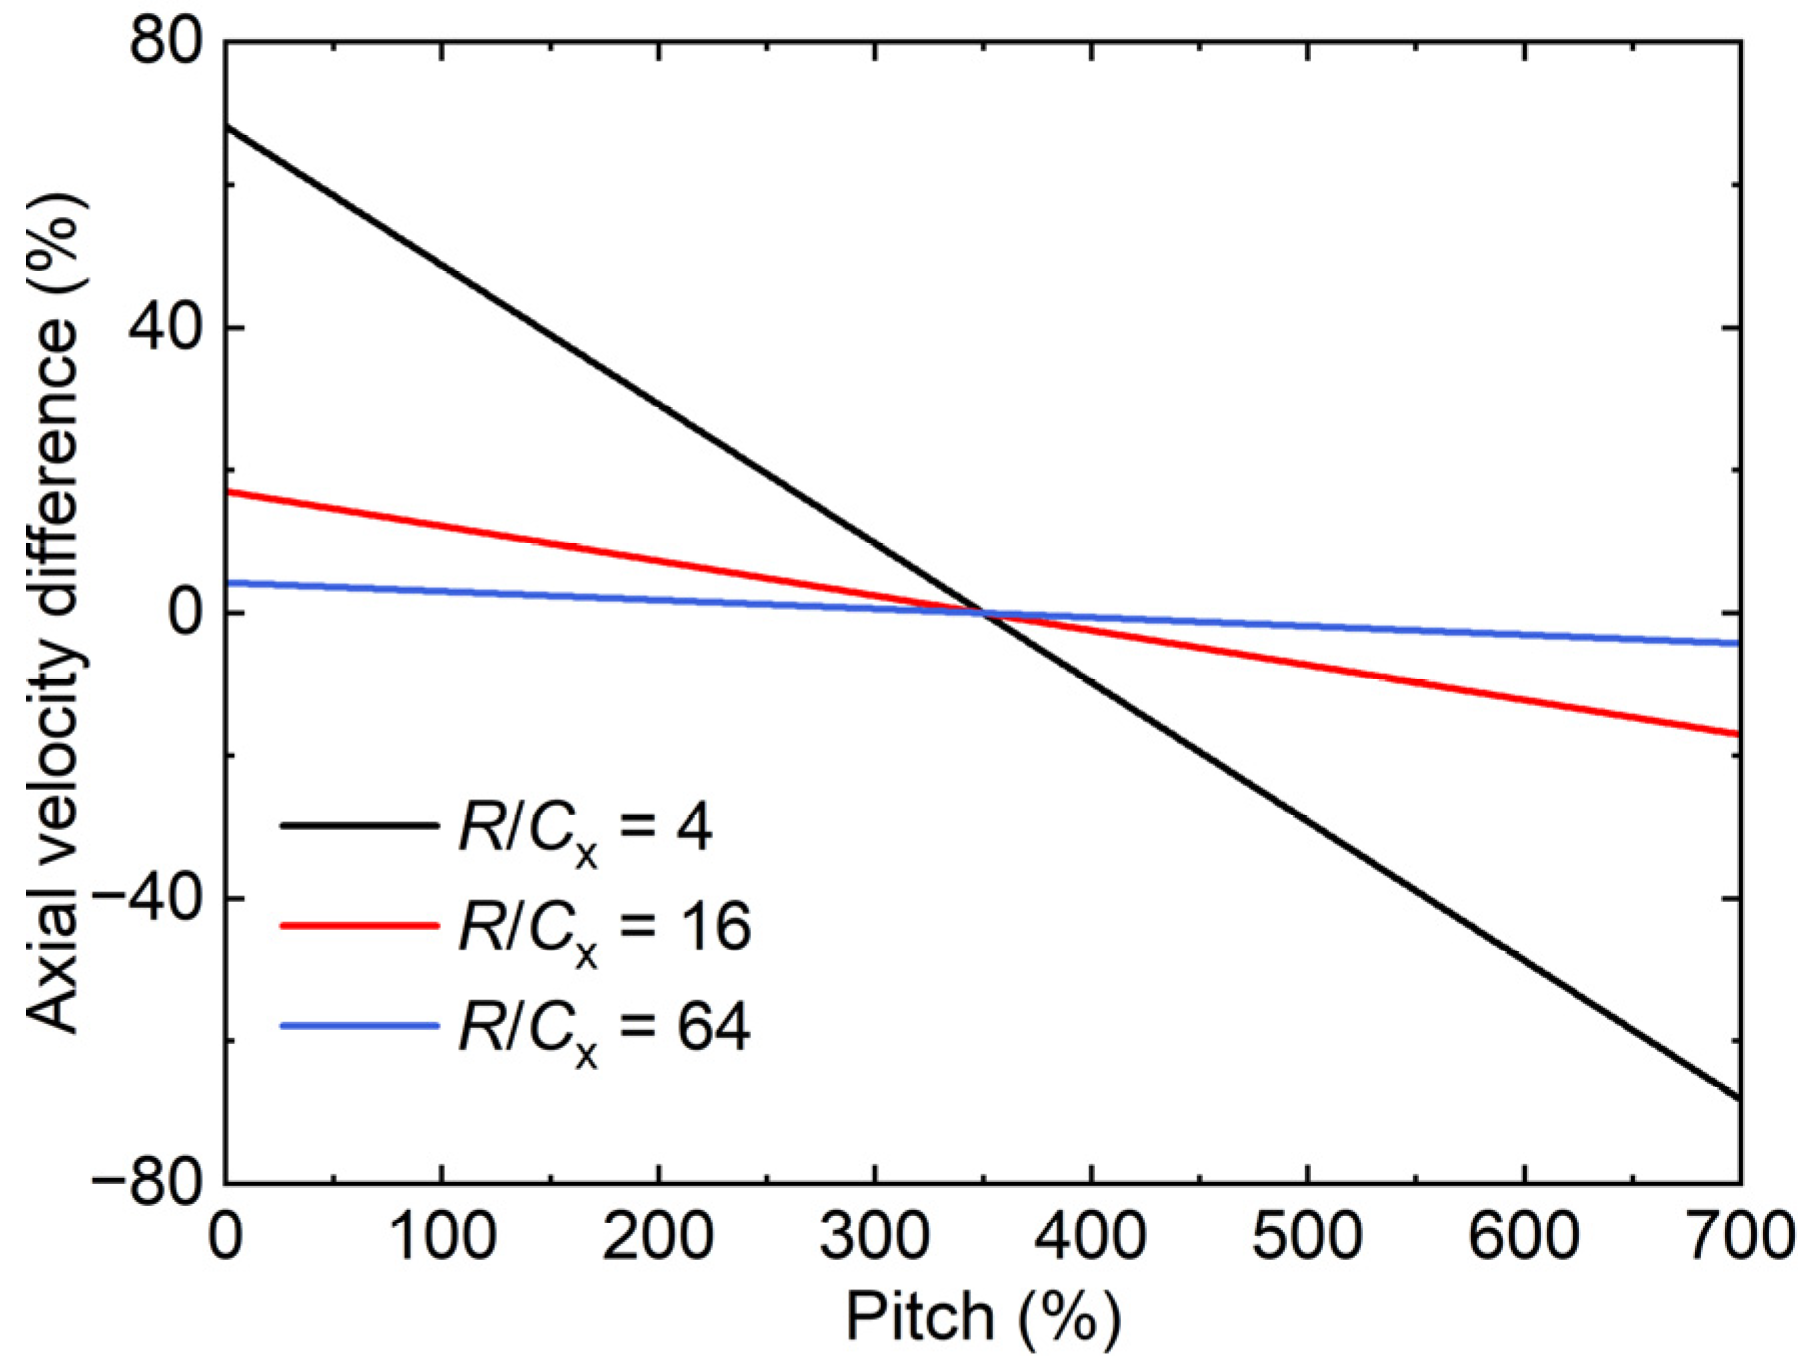
The other error is the axial velocity difference at different pitch locations, as depicted in
Figure 4. In order to obtain good periodicity, the linear axial compressor cascade usually consists of multiple blades. Here, the baseline configuration consists of seven blades with a controlled diffusion airfoil (CDA). At the same axial location, the endwall of these blade passages has the same circumferential velocity component, but its axial velocity is different, which is related to the pitch location. As shown in the figure, the disk linear velocity at the B4 center has only a circumferential component. However, the disk velocity of the two sides has additional axial components. On the left side (toward B1), the disk axial velocity is positive, while on the right side (toward B7), the disk axial velocity is negative.
Figure 5 quantitatively presents the axial velocity difference of various disk radii at different pitch locations, normalized by the disk circumferential velocity at the mid chord. For
R/
Cx = 16, the axial velocity difference is about 17% at 0% and 700% pitch, which is quite large. However, the outermost blades are only used to create the periodic condition and their performance is not that important. Observing the axial velocity difference of the mid-three passages, the maximum value of
R/
Cx = 16 is less than 5%. In the following discussion, the effect of the axial velocity difference will be analyzed by using seven-passage simulations.
3. Feasibility Evaluation
3.1. CFD Method
As mentioned above, the design concept has two system errors that need to be further evaluated. In this section, the unsteady RANS simulation is performed to evaluate the feasibility of the design.
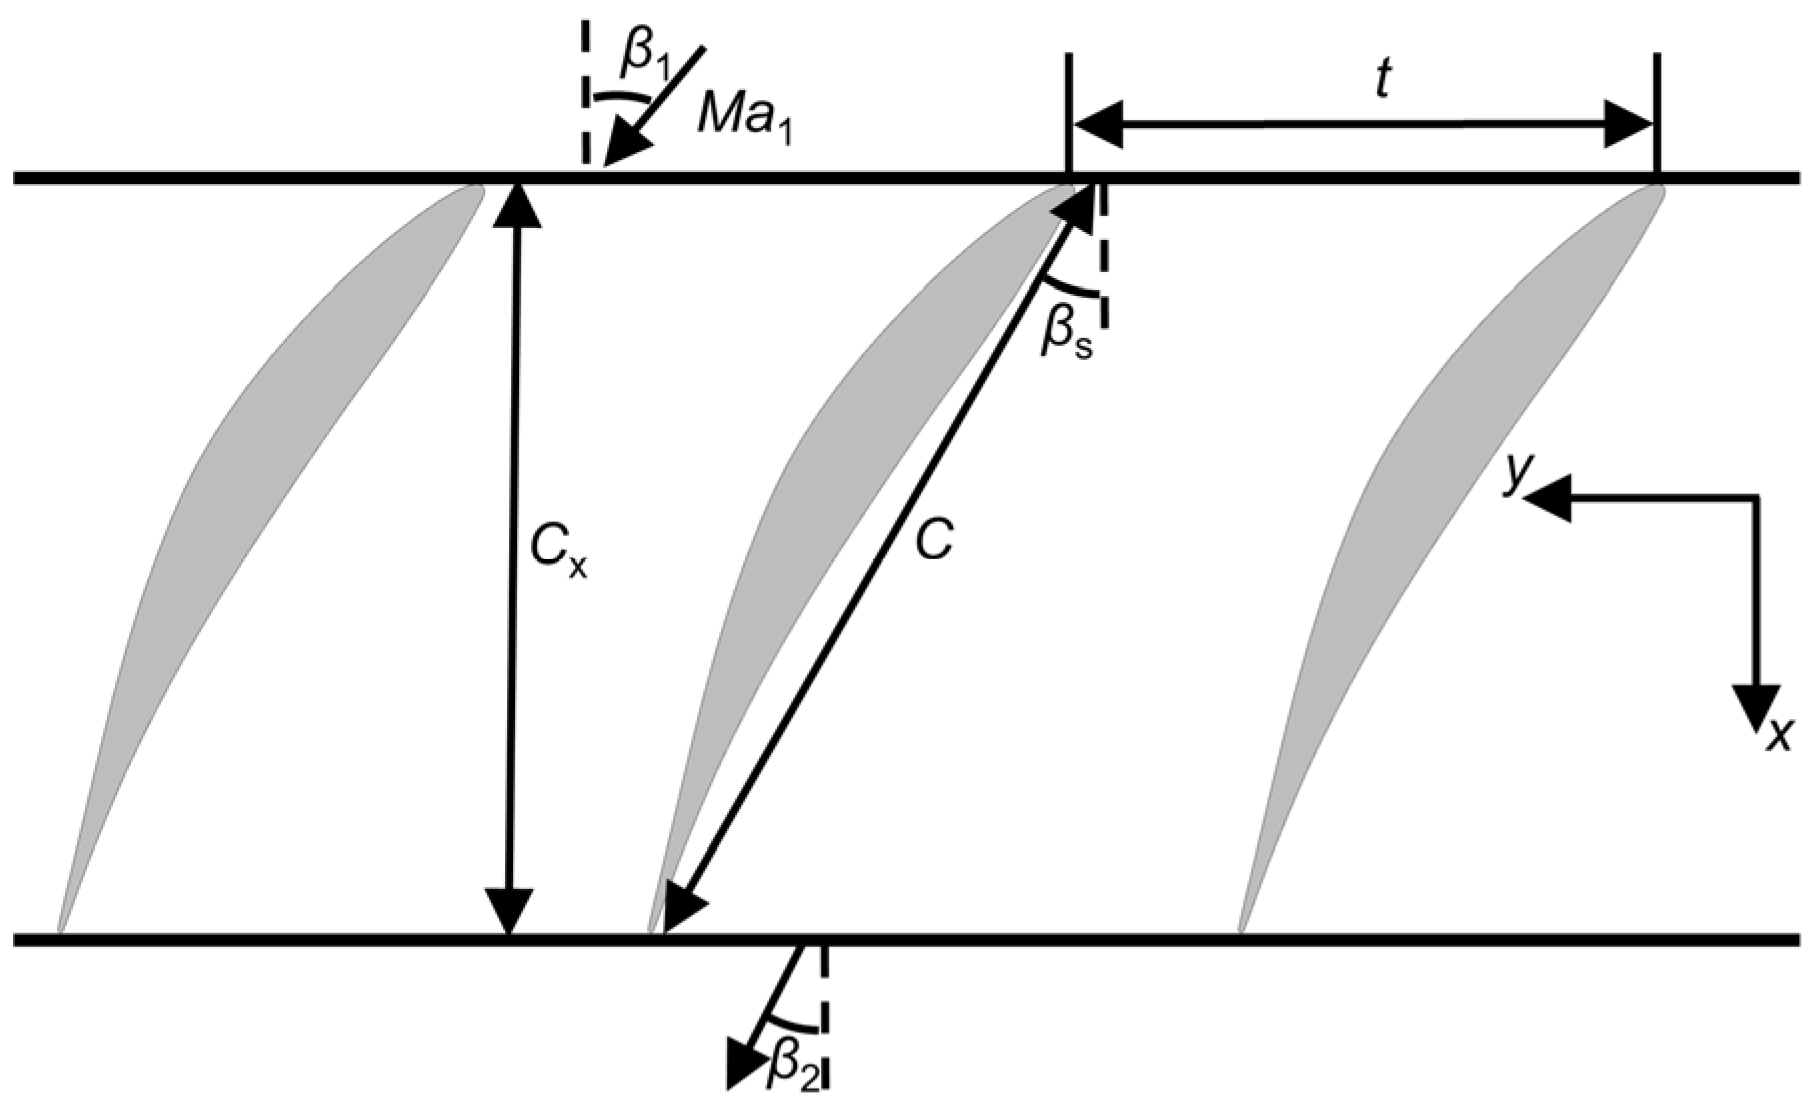
Figure 6 gives the schematic of the investigated axial compressor cascade consisting of CDA blades. The CDA blade featuring high loading can represent the design level of modern axial compressors. Its stagger angle and design inlet angle are 30° and 47°, respectively. Note the design inlet Mach number is 0.62, but in the present study, the inlet Mach number is 0.5 to reduce complexity in the preliminary design. More detailed parameters of the cascade can be found in
Table 1.
Numerical simulations are carried out by the commercial solver ANSYS CFX, solving the unsteady RANS equations, closed by the SST turbulence model. The advection and transient schemes are high resolution and second-order backward Euler, respectively. Unsteady simulations are initialized by the steady RANS simulation for convergence acceleration. Referring to previous studies, dual time-step technology is used with a physical time-step of 2 × 10⁻⁵ s and 5 pseudo time-steps for each physical time-step. The focus of the study is time-averaged performance, so the time-step sensitivity is not tested.
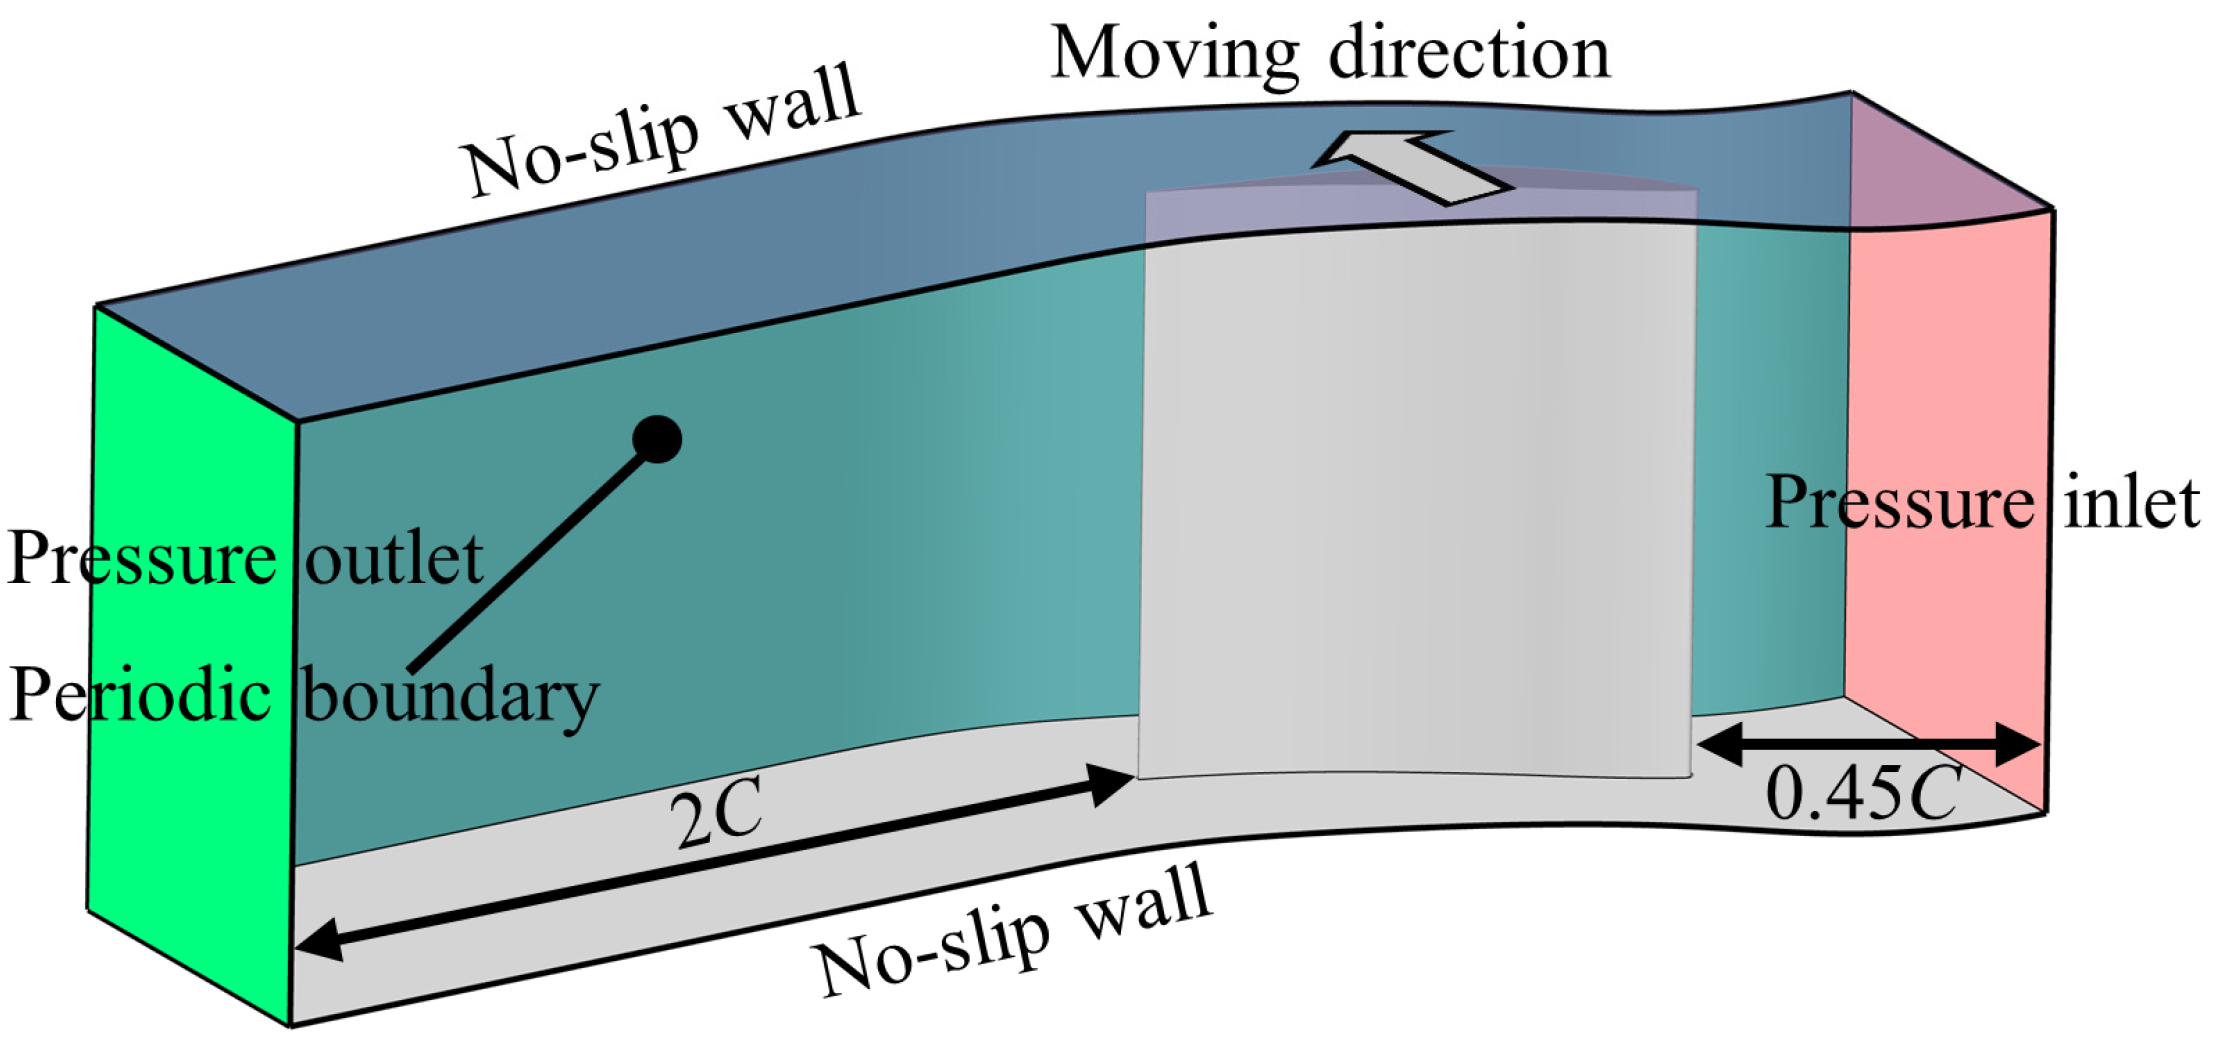
Figure 7 gives the computational domain of the single passage. The inlet is located 0.45
C upstream of the LE, whereas the outlet is located at 2
C downstream of the TE. In the design process, the clearance size is set to
s/h = 2.86%. The inlet is imposed a uniform total pressure without a boundary layer and a uniform total temperature to match the Mach number, whereas the outlet is imposed a static pressure. All solid walls are set as the no-slip wall boundary. First, single-passage simulations are performed to evaluate the effect of the velocity difference due to the disk radius variation. Then, with the suitable disk radius, seven-passage simulations are further performed to evaluate the effect of the axial velocity difference at different pitch locations. The computational domain is generated by translating six additional single passages.
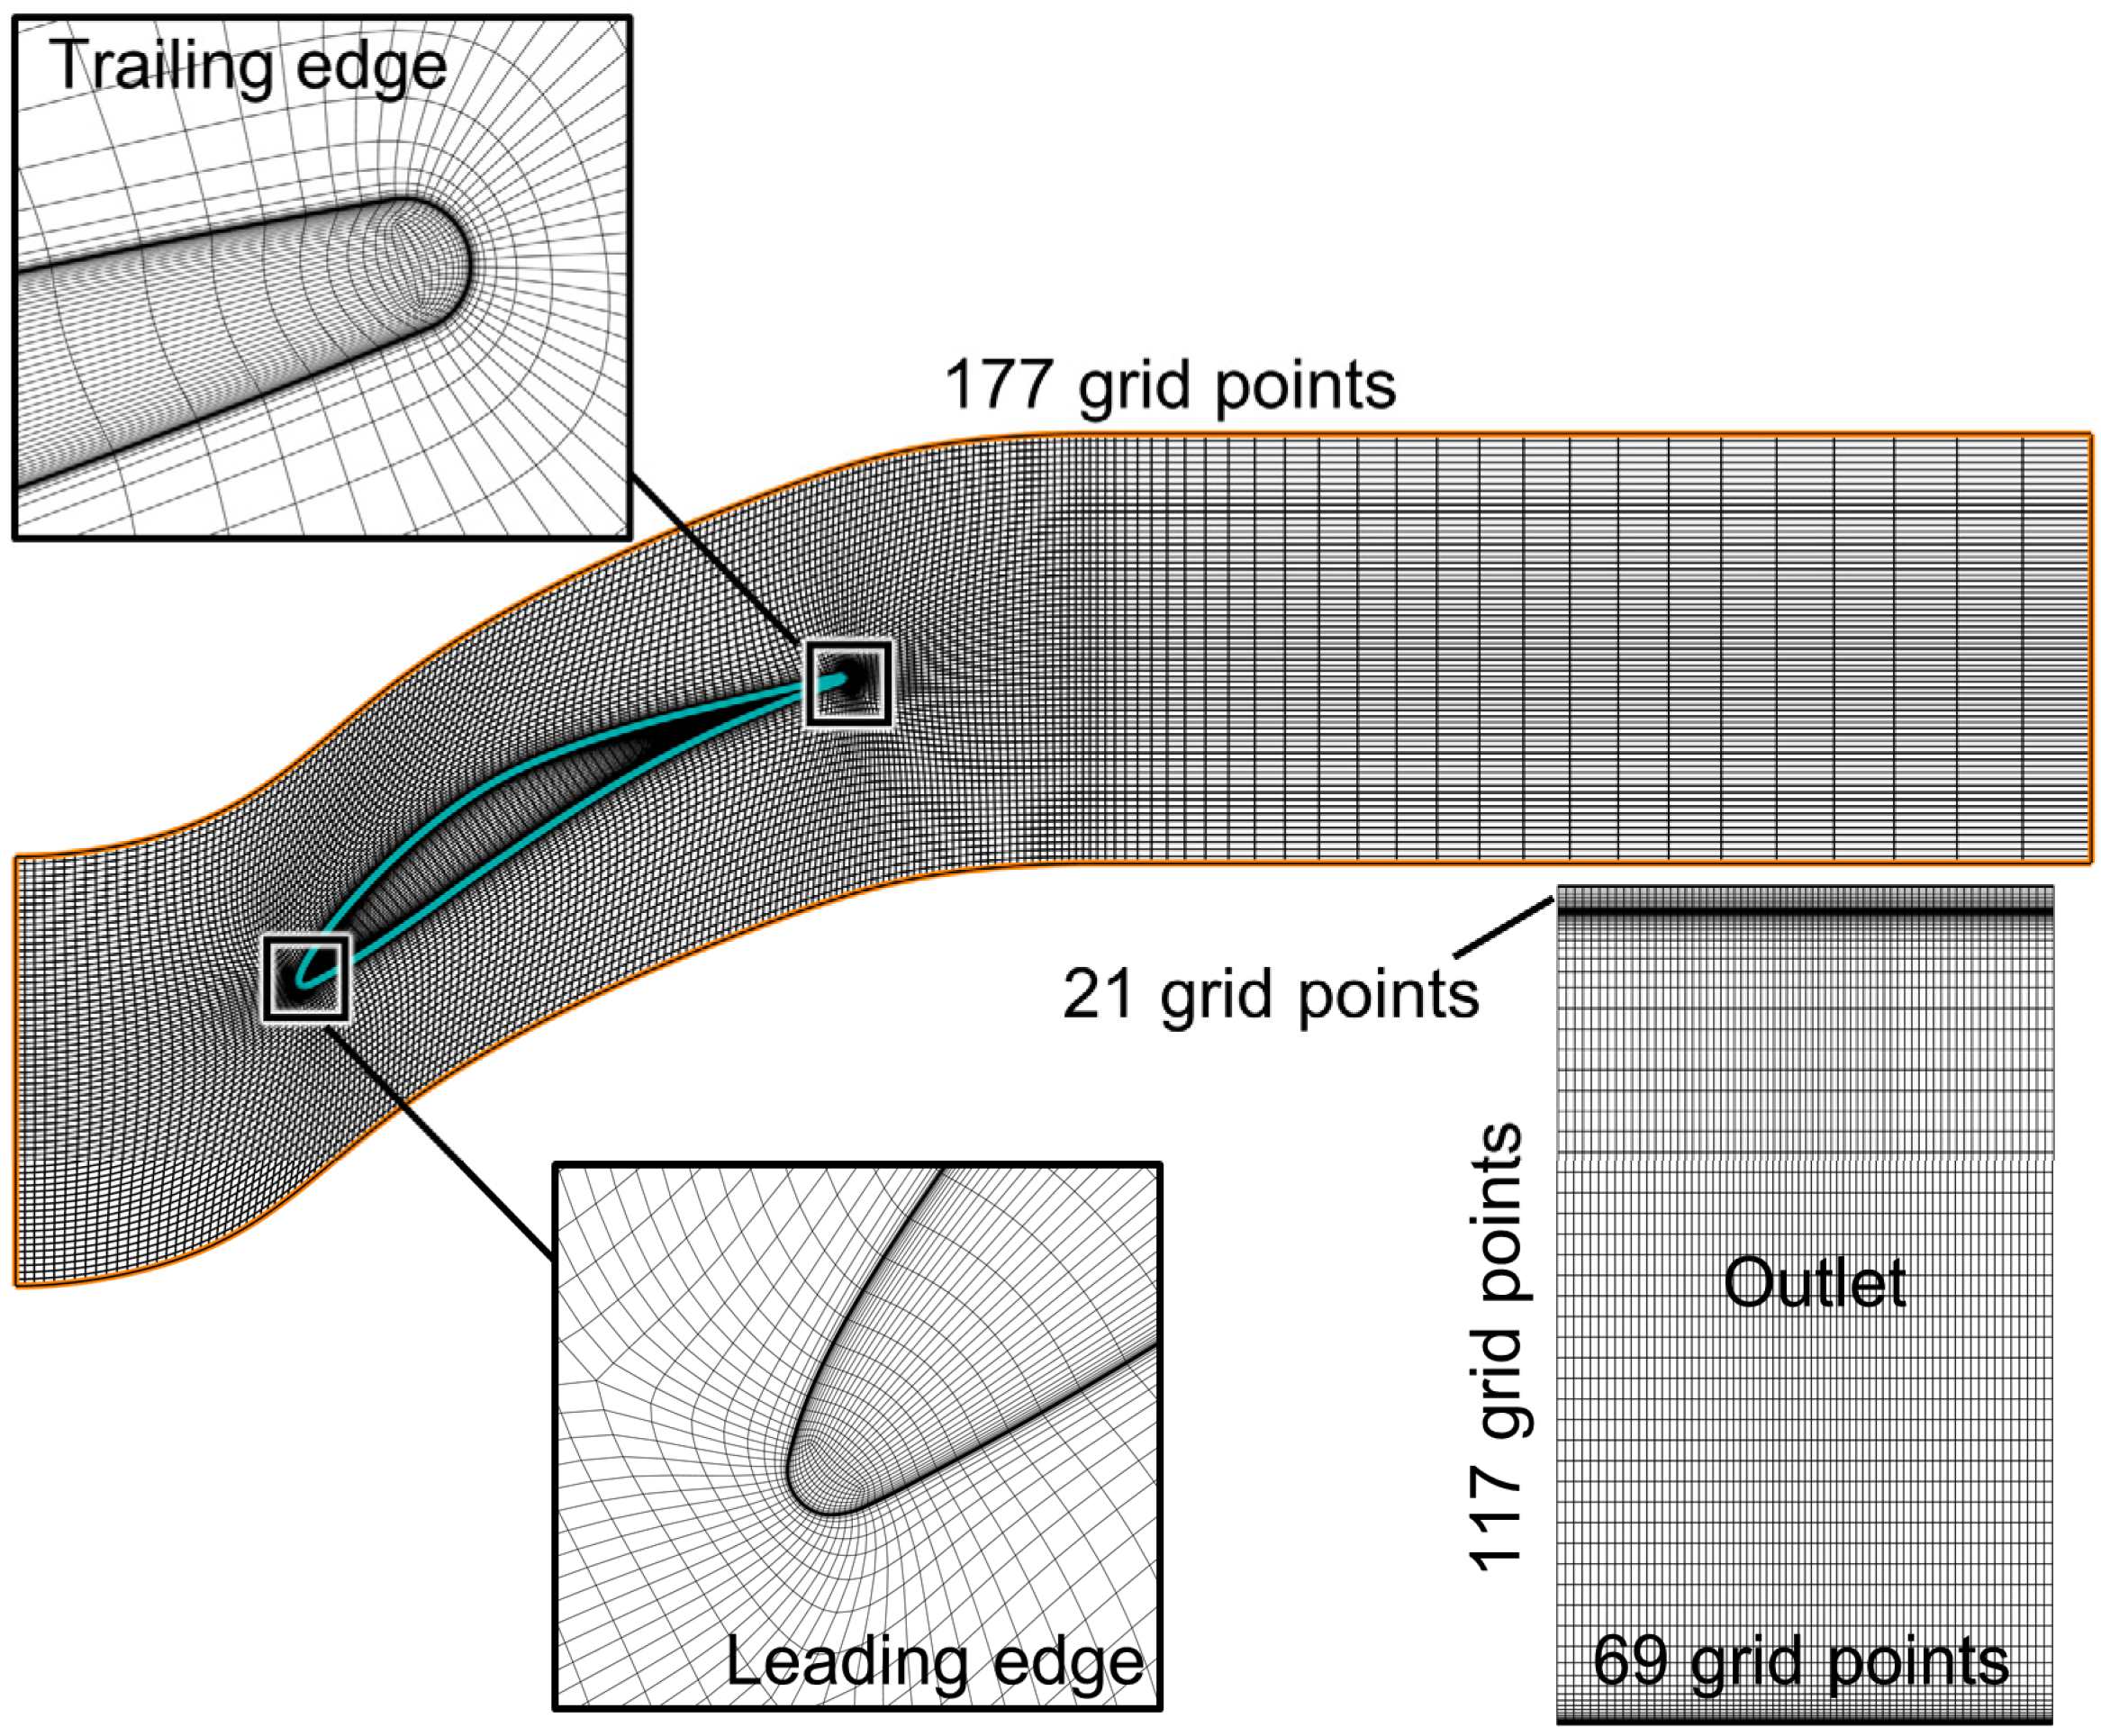
Block-structured grids with an O4H topology, as shown in
Figure 8, are generated by AutoGrid5. To meet the requirement of the SST turbulence model and capture the flow details, the height of the first layer grid near all walls is 1 × 10
−6 m, thus ensuring that the non-dimensional wall distance is less than 1. Before formal simulations, the grid sensitivity has been tested to reduce the simulation resource and the impact of the grid number.
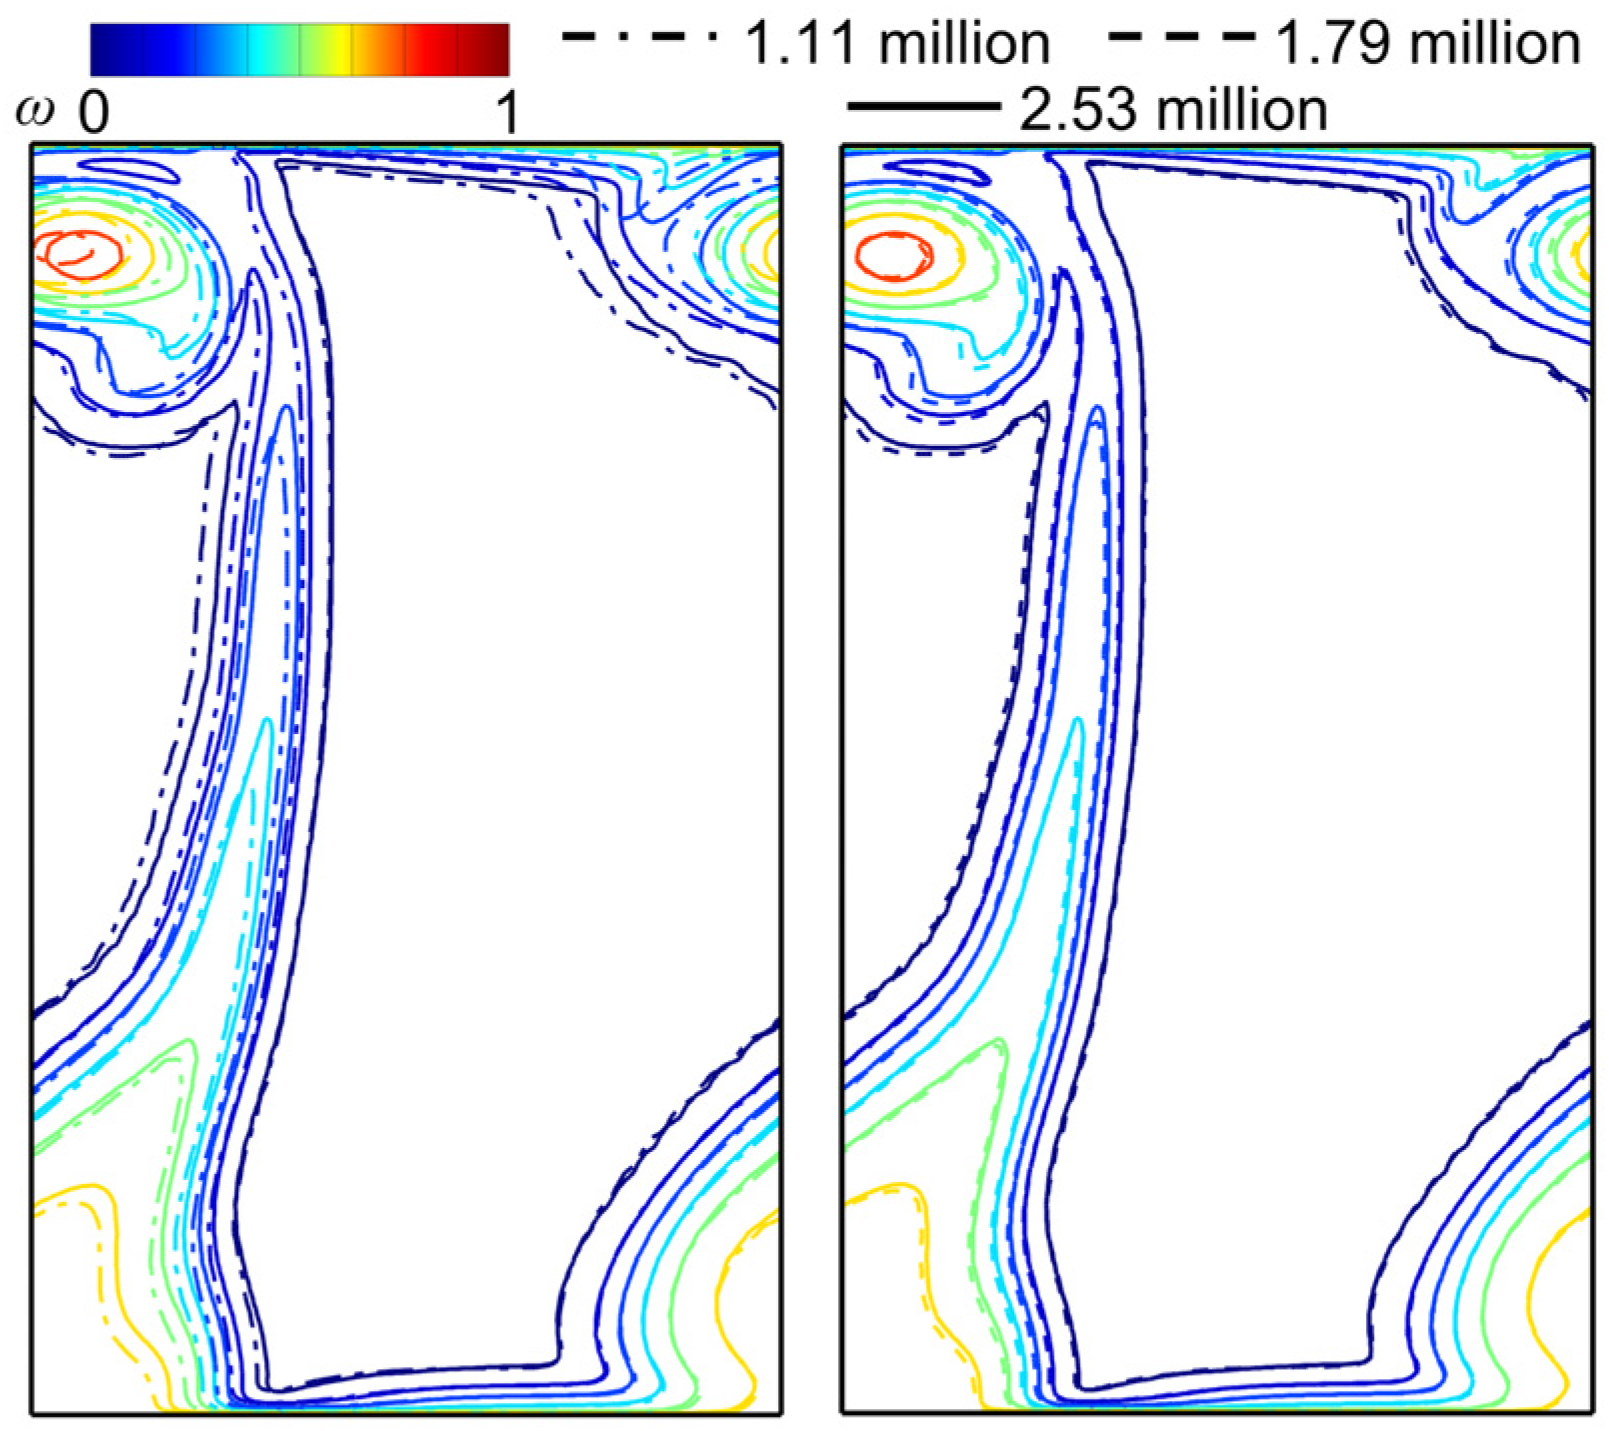
Figure 9 shows the total pressure loss contour obtained from three different grids (1.11 million cells, 1.79 million cells, and 2.53 million cells). Inspecting the contour visually, there is a distinct deviation in the simulation results between 1.11 million cells and 2.53 million cells, while the simulation results between 1.79 million cells and 2.53 million cells are quite similar, indicating that the impact of the grid number on the simulation results can be ignored. Hence, the grid of 1.79 million cells is chosen for the present study.
3.2. Evaluation of the Disk Radius
To evaluate the effect of the disk radius, two endwall speeds (89 m/s and 178 m/s) and three radii are considered.
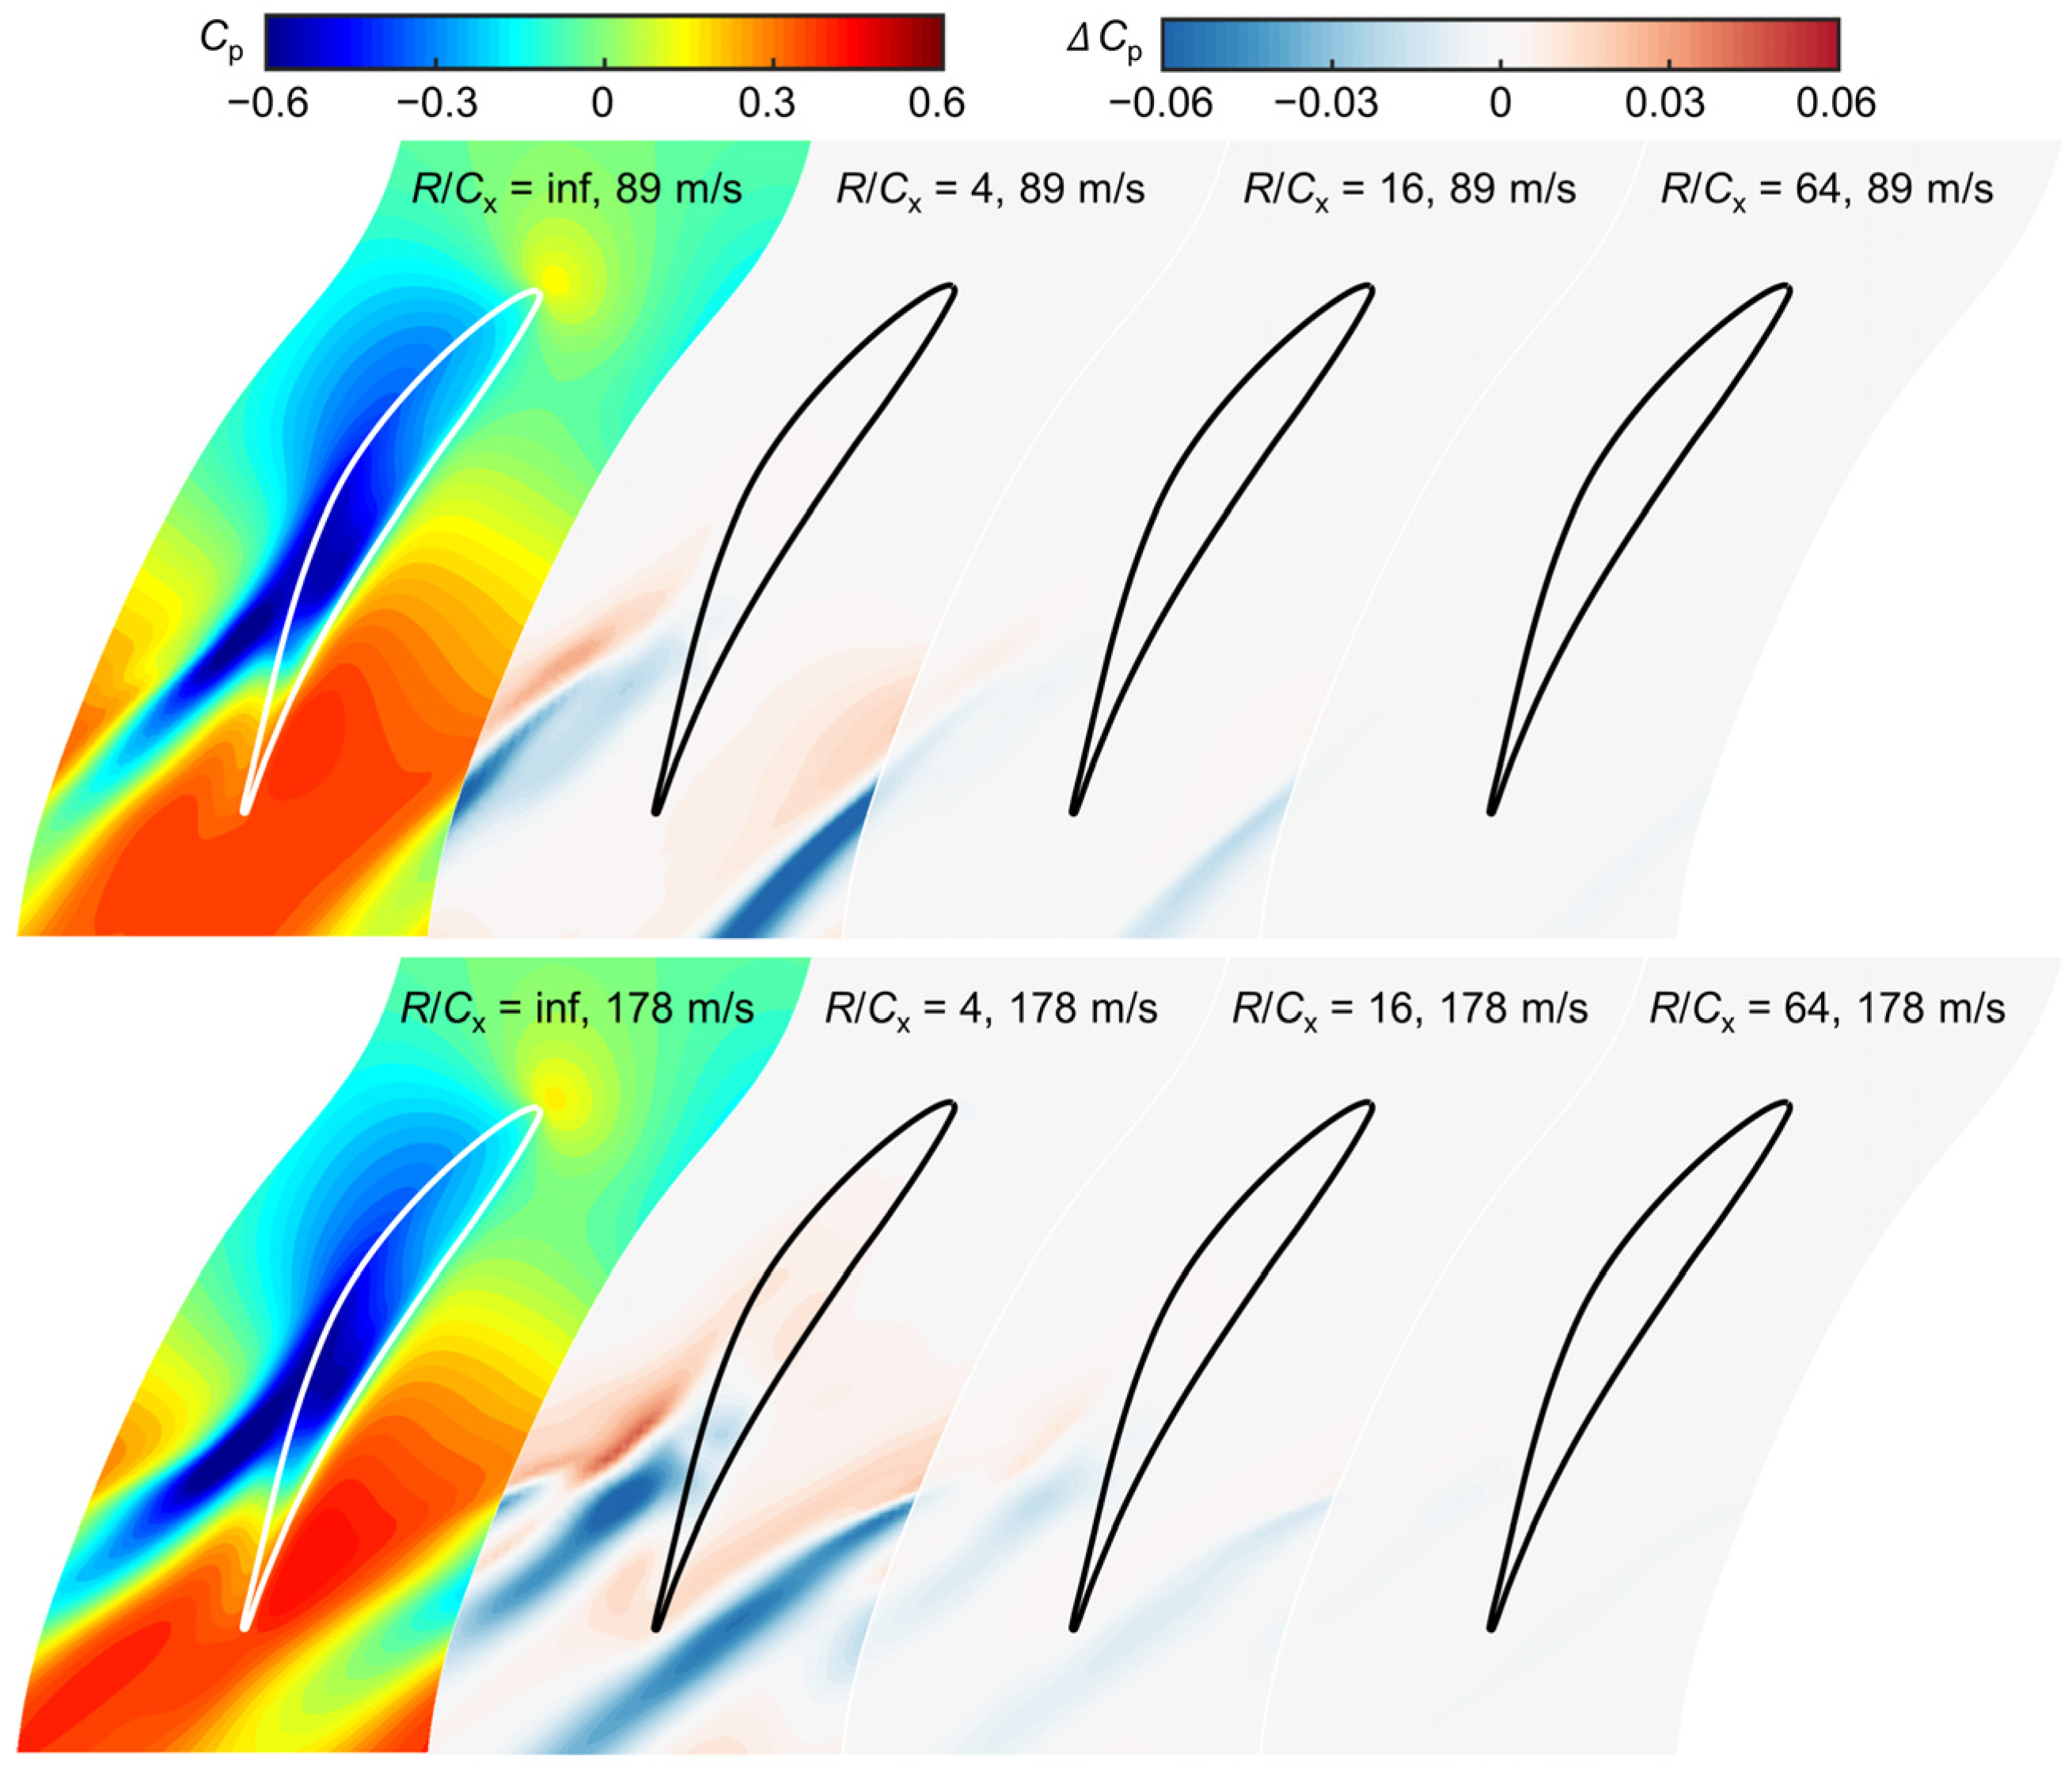
Figure 10 presents the endwall static pressure coefficient and its difference at various disk radii. As a reference, the translational motion configuration of
R/Cx = inf is also shown here, and the difference value is defined as the result of translational motion minus the rotating motion. For the translational motion, the leakage vortex began to be far away from the suction side (SS) at the aft passage. As the endwall speed increases, the circumferential displacement of the leakage vortex becomes larger. Note that the effect of the endwall speed on the endwall static pressure coefficient in the fore passage is nearly invisible. As analyzed above, the rotating motion will introduce some errors since the velocity change along the axial chord. These errors are mainly located at the aft passage where the leakage flow is more sensitive to the endwall speed. When
R/Cx = 4, the maximum static pressure coefficient difference near the leakage vortex trajectory is approximately 0.06, enabling the maximum deviation to be over 10%. Increasing
R/Cx to 16 or 64, the discrepancies can sharply decrease to an acceptable level of accuracy.
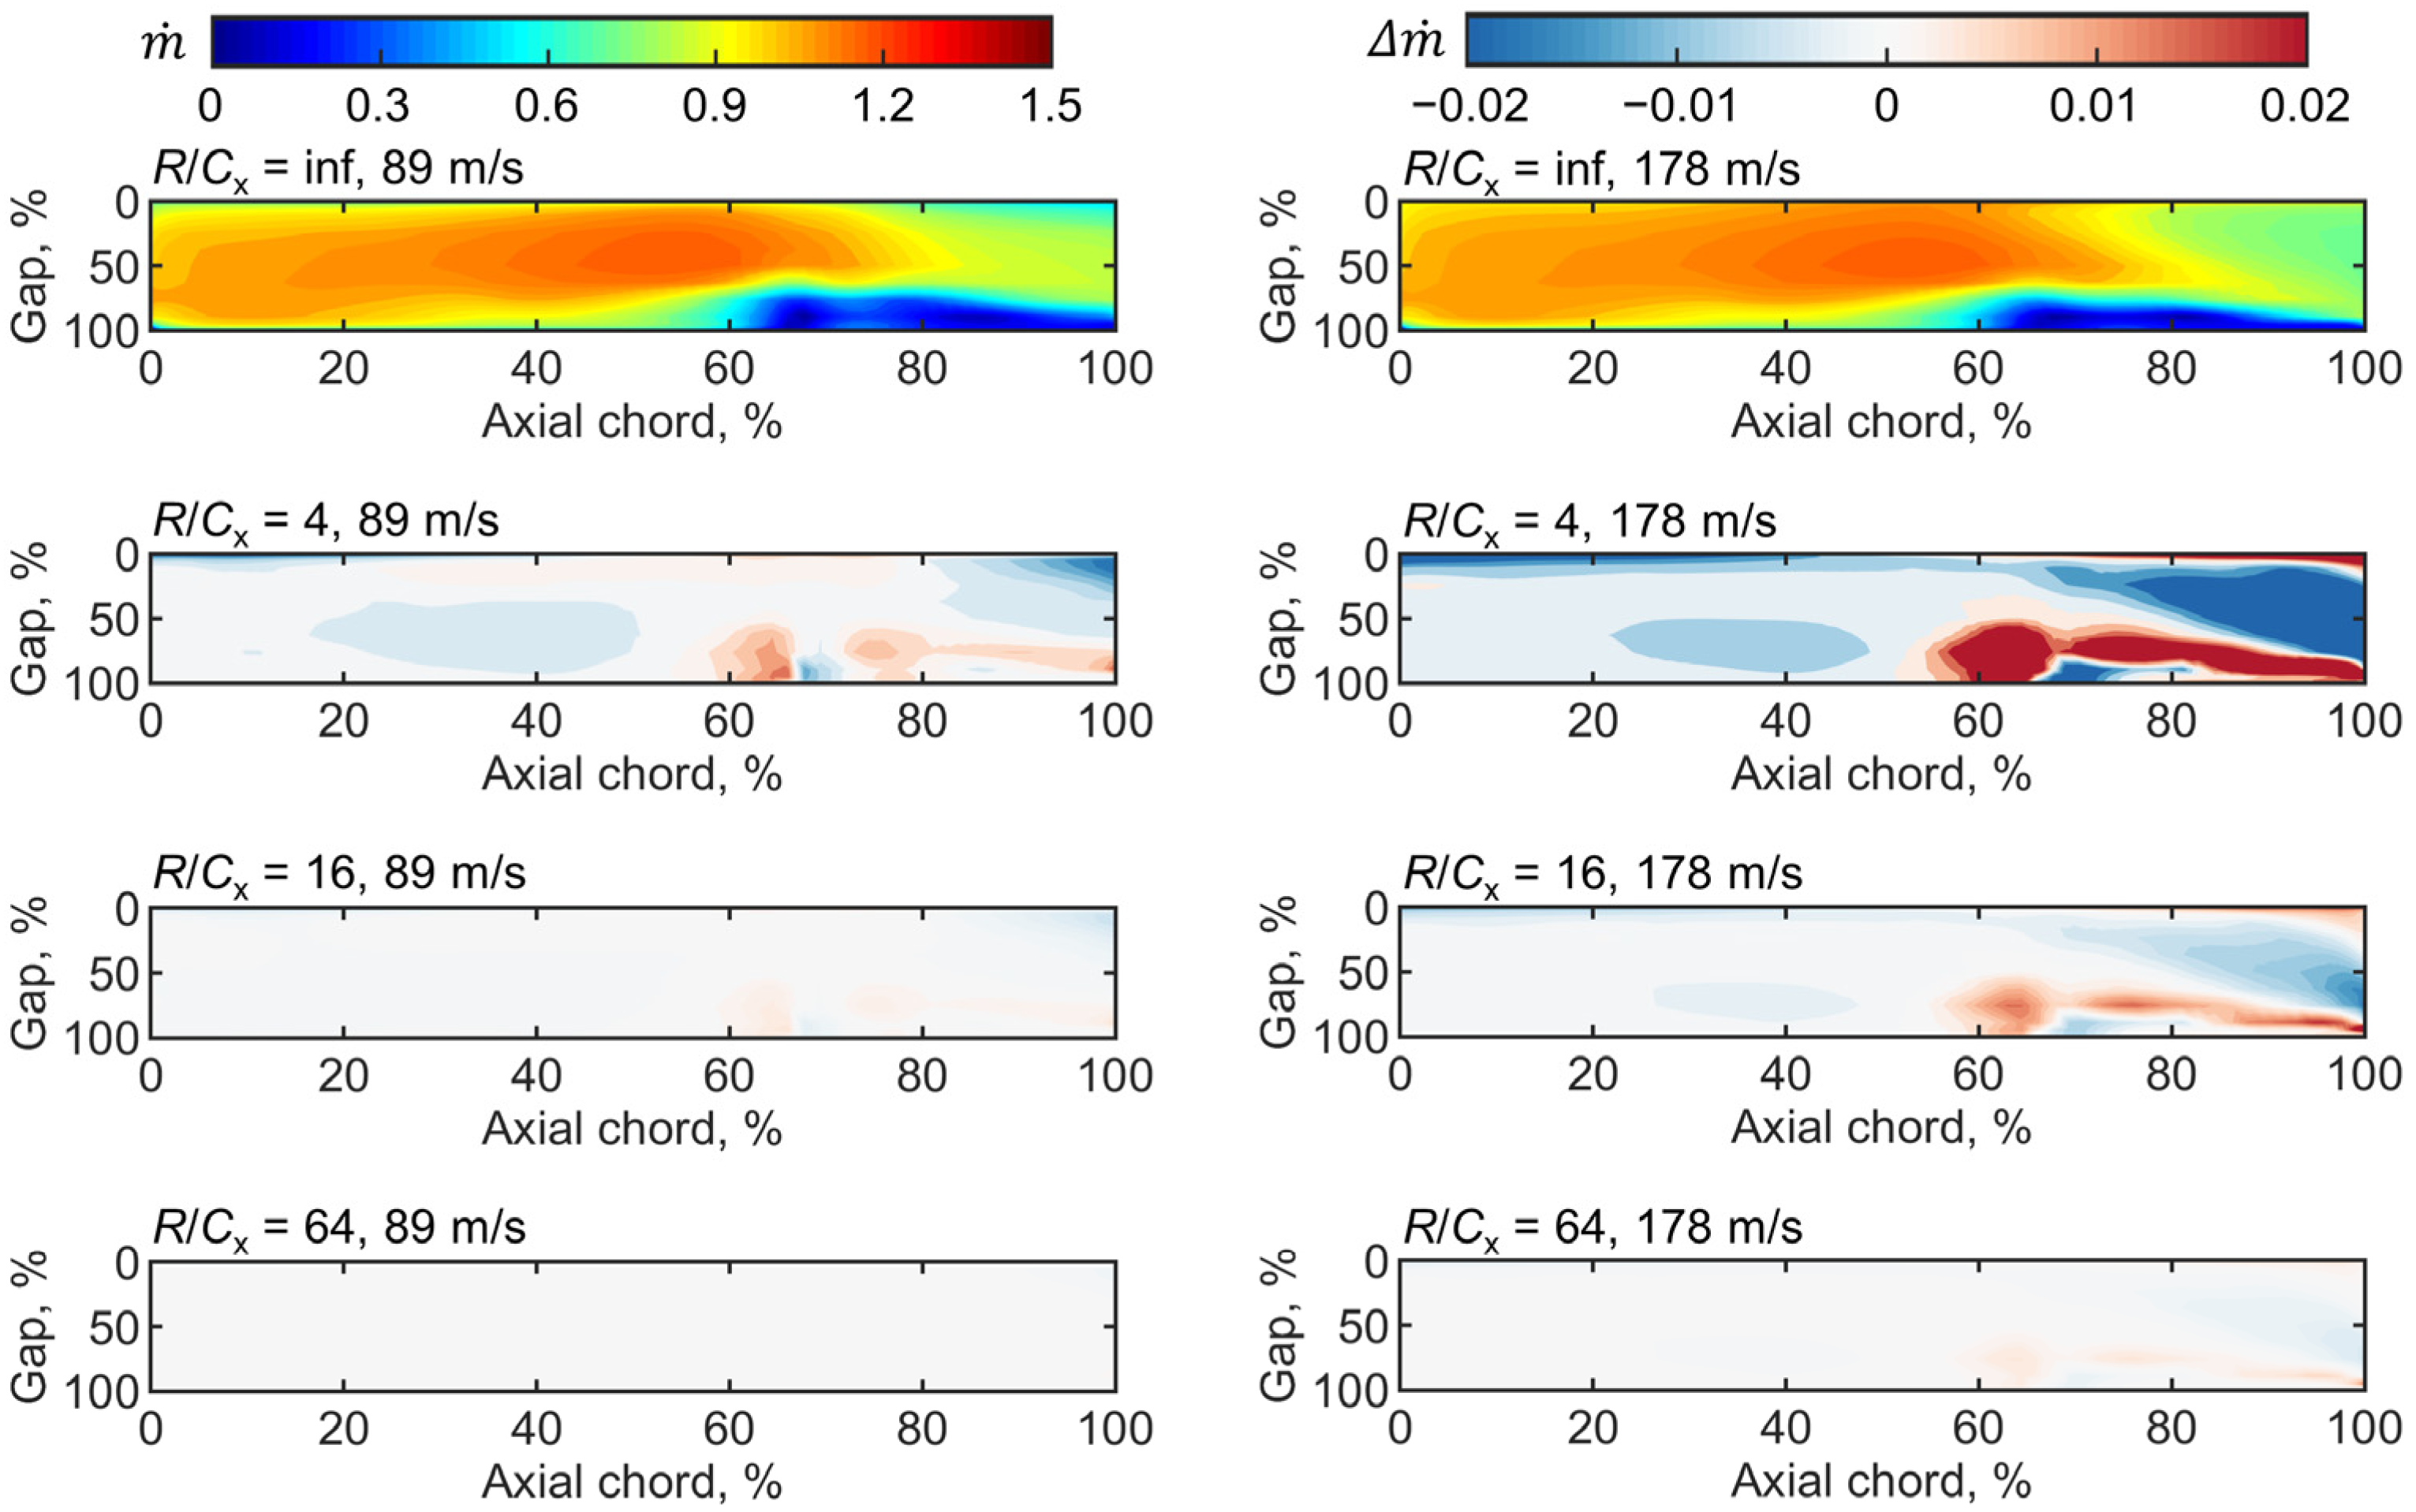
Figure 11 shows the density flow and its difference at various disk radii. These results are obtained from the cut plane inside the clearance along the camber line and normalized by the inlet density flow. The results show that the distributions of density flow vary slightly with the endwall speed, which indicates that it is dominated by the pressure difference, not the endwall speed. The major effect of the disk radius on the density flow difference is also located from 60% to 100% axial chord. It is evident that the density flow difference depends on the endwall speed. The large endwall speed results in a distinct density flow difference. The absolute value of density flow difference can be over 0.02 when
R/Cx = 4. Only when
R/Cx = 64, the density flow difference for the large endwall speed is nearly invisible.
Moreover, the total pressure loss coefficient and its difference at various disk radii are shown in
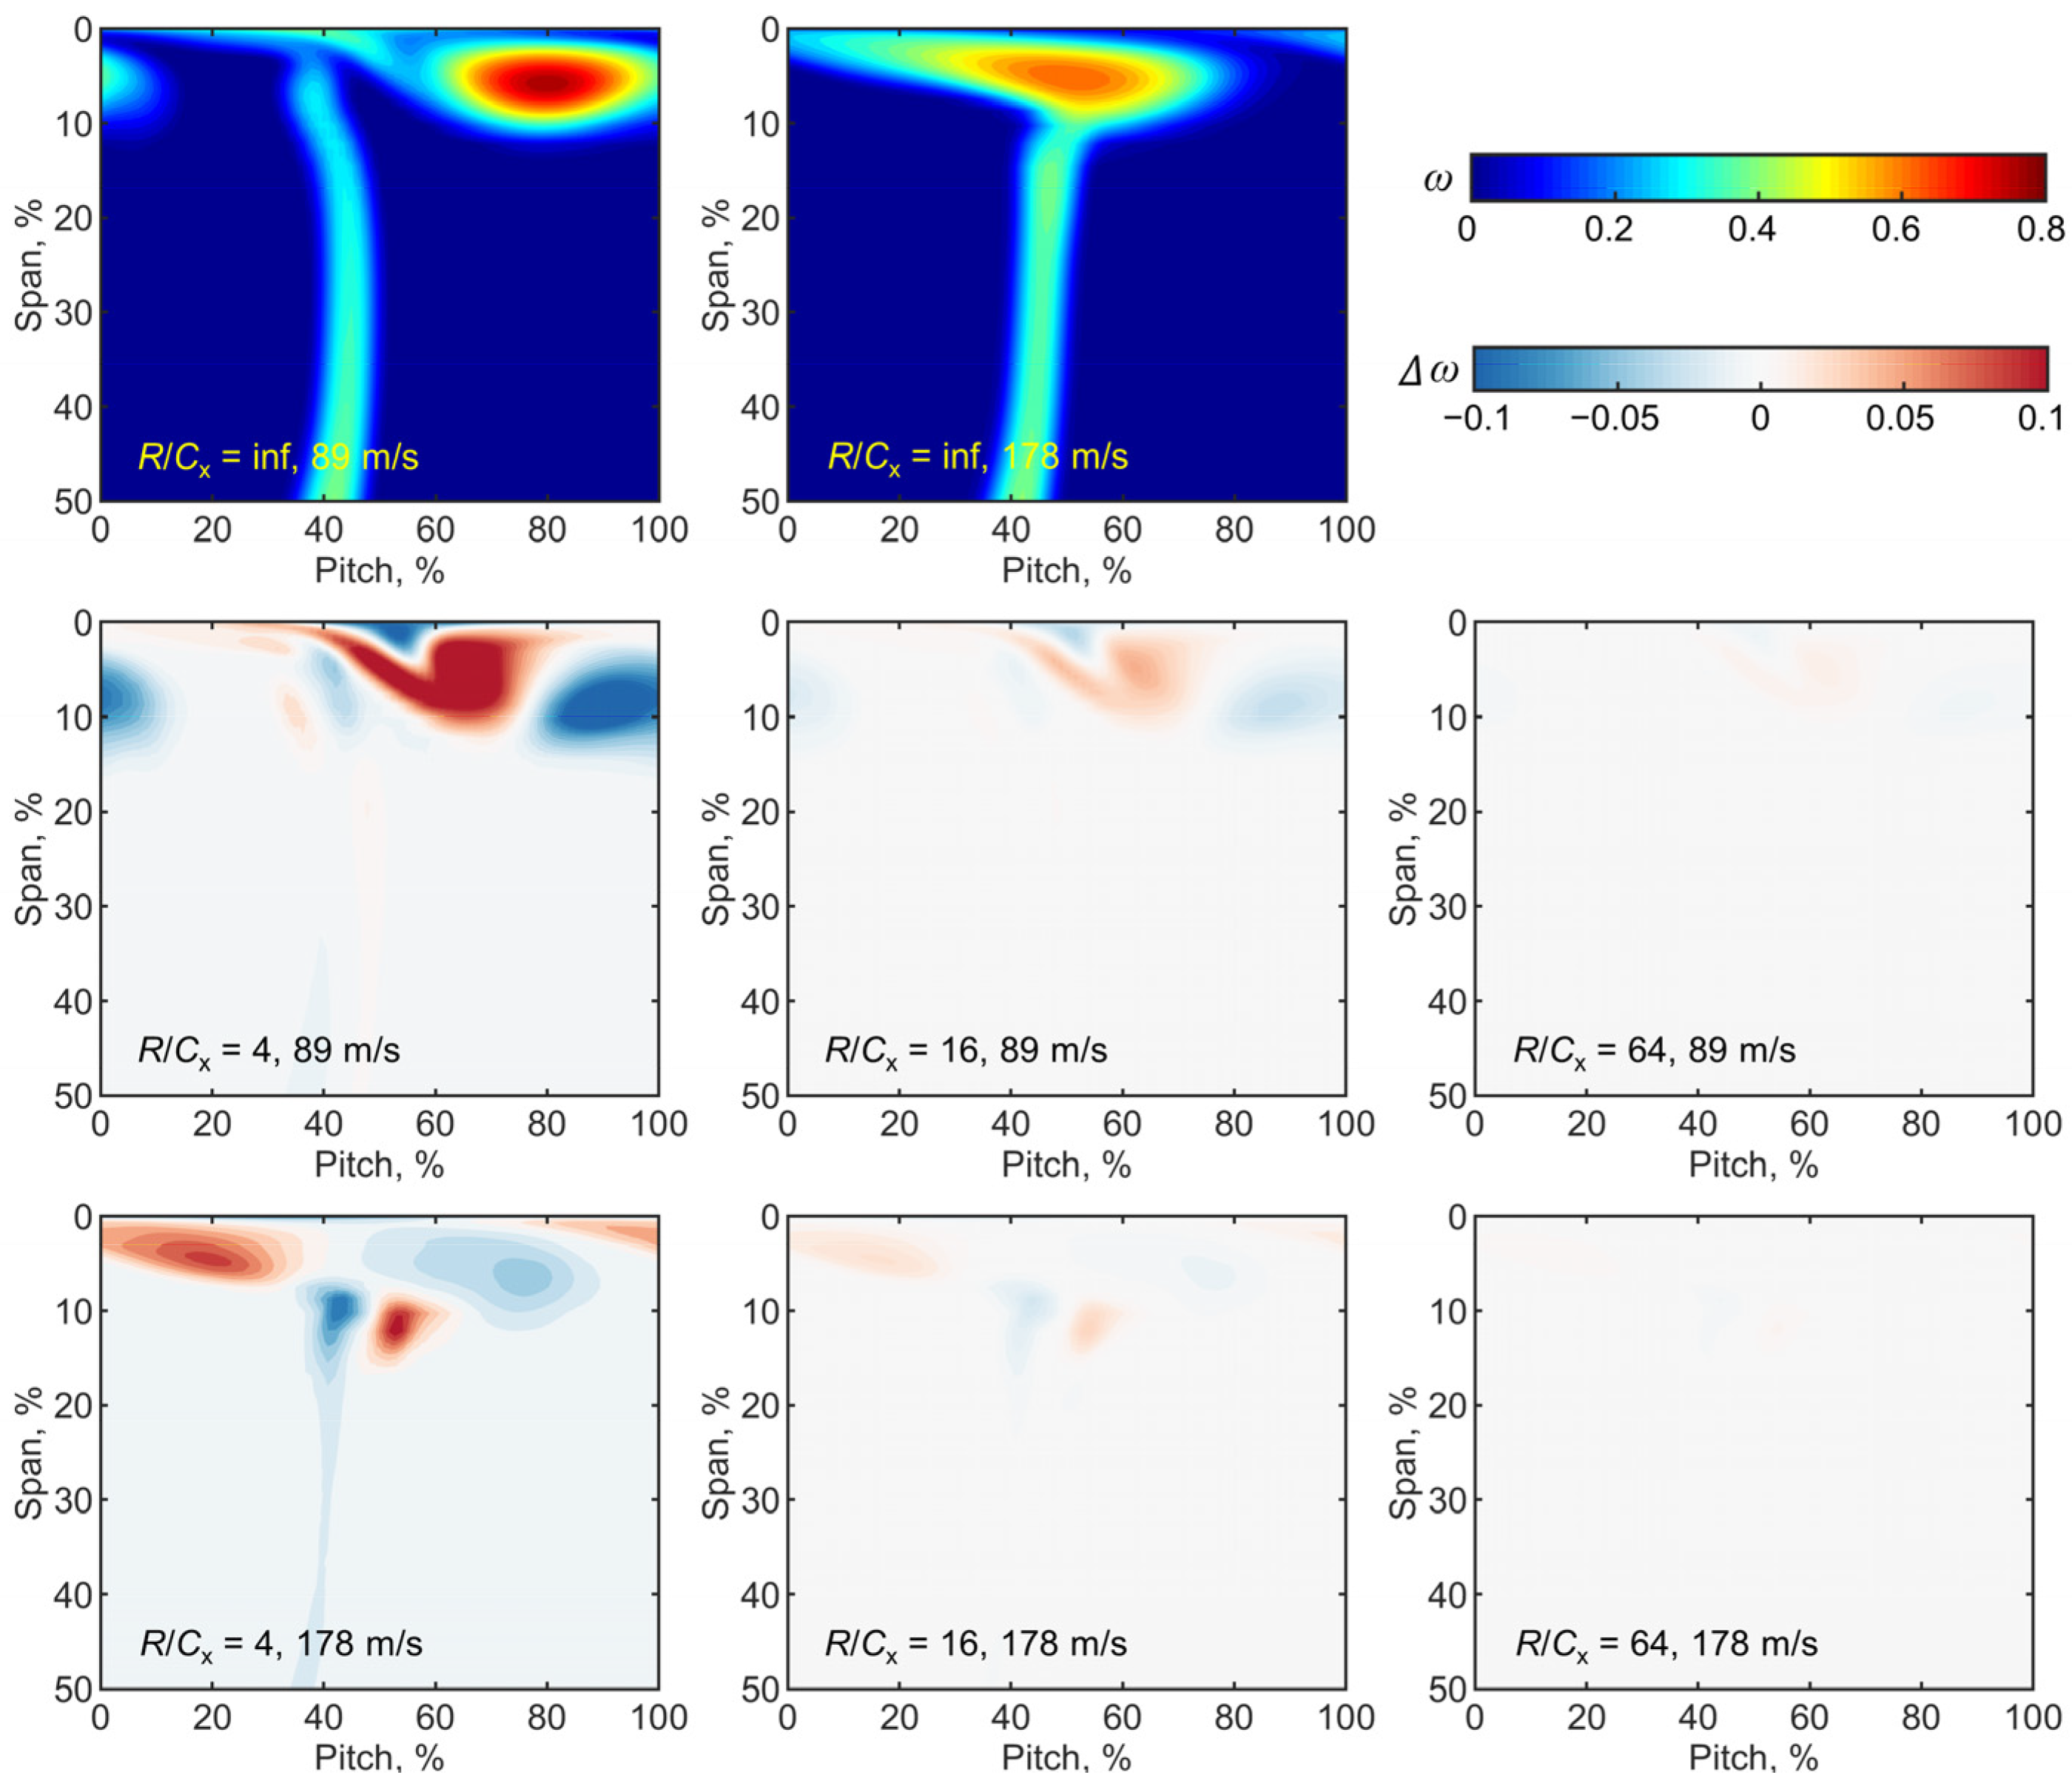
Figure 12. It is clear that the endwall speed has a great influence on the distribution and peak value of the total pressure loss coefficient, highlighting the necessity of the high-speed moving endwall. The major difference due to the disk radius occurs in the region of the leakage vortex core with a high total pressure loss coefficient. For
R/Cx = 4, except for the high difference near the core region, the wake region also appears visible discrepancies. For
R/Cx = 16, the discrepancies in the vicinity of the wake region are eliminated. Meanwhile, the discrepancies near the core region also become very small. Further increasing the disk radius to
R/Cx = 64, these discrepancies are almost zero.
The above analysis demonstrates that the system errors from the velocity difference can significantly decrease with the increase of the disk radius. However, considering the manufacture, the larger disk radius will cause a quite expensive cost, which is opposite to the initial design purpose, i.e., low cost. Though the results from R/Cx = 16 still show some visible errors, the error level is considered acceptable, especially for the total pressure loss coefficient which is an important parameter. Hence, the configuration of R/Cx = 16 (1000 mm) is selected for the later study. In this situation, the disk rotation speed of about 2000 rpm is capable of reaching the level of a real axial compressor. Note that the errors of this configuration are expected to be smaller with the reduction of the axial chord.
3.3. Effect of the Axial Velocity Difference
Subsequently, the effect of the axial velocity difference is evaluated for the configuration of
R/Cx = 16. Here, the results of the mid-location B4 are chosen as the reference since they would correspond to the experiment measurement.
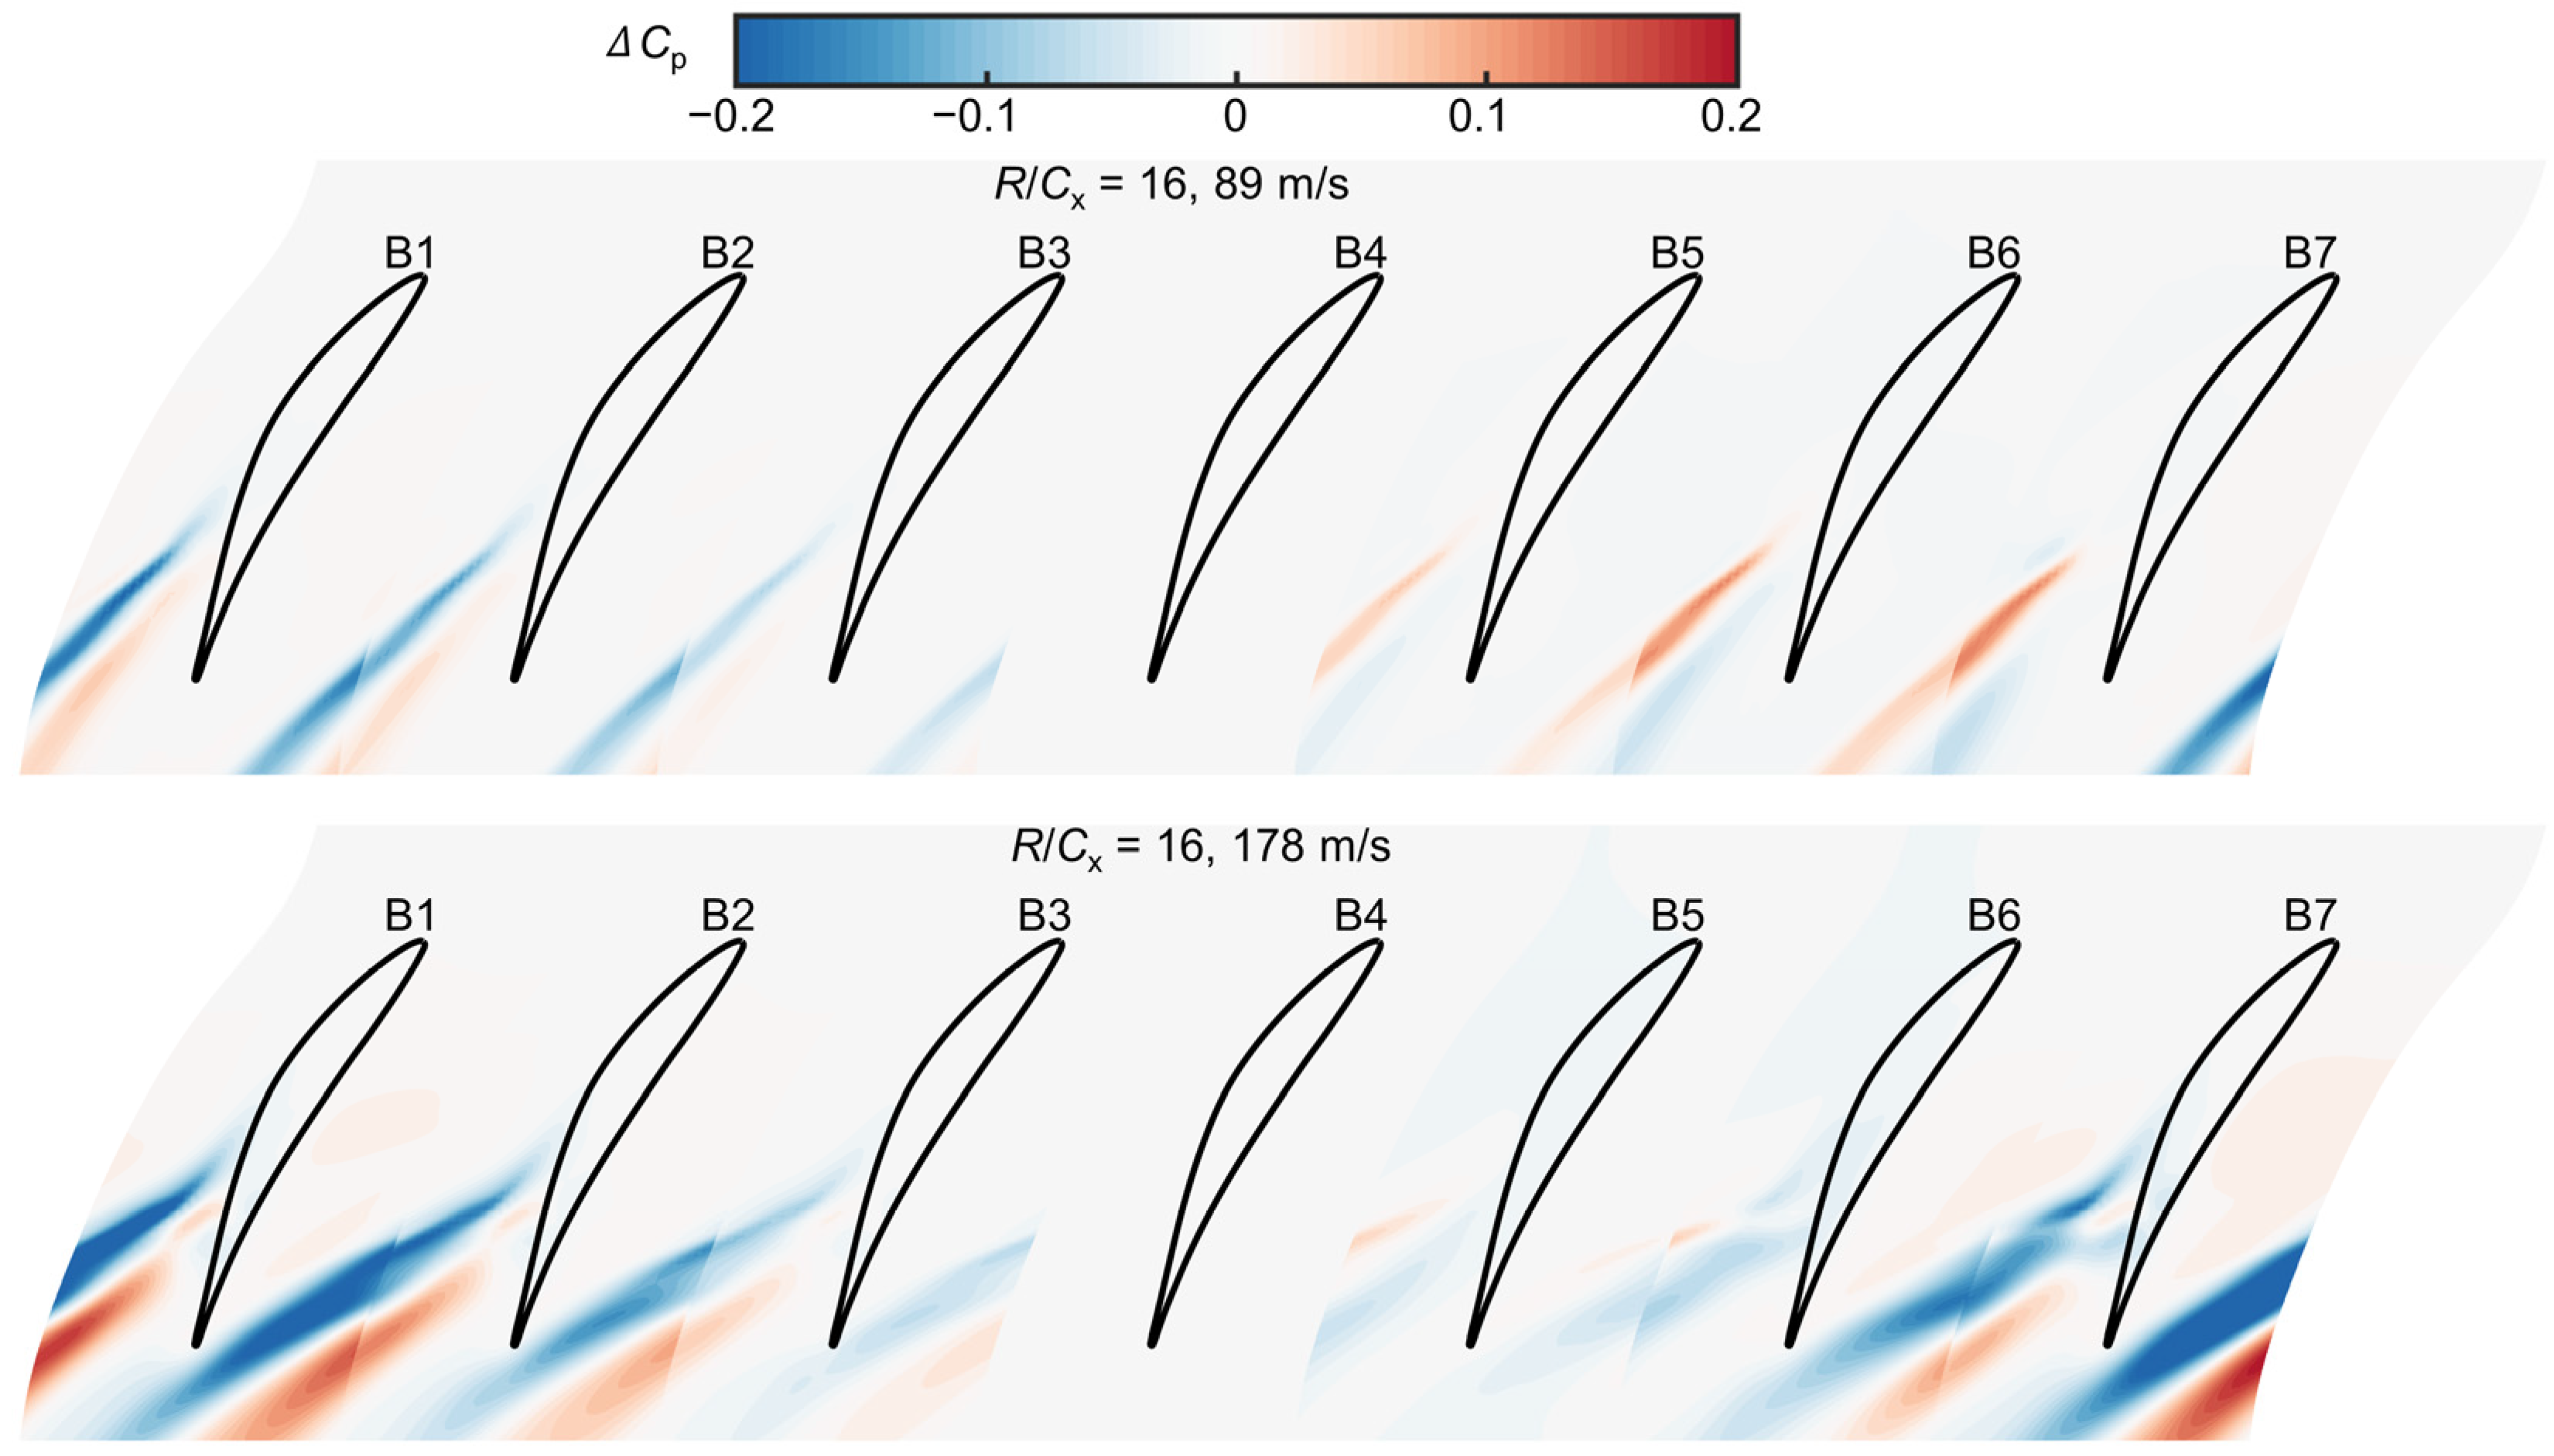
Figure 13 shows the endwall static pressure coefficient difference at different pitch locations. As expected, there are distinct differences between the mid passage and outer side passages. The region of the major difference is also located at the aft passage. Observing the figure, the endwall static pressure coefficient difference of the outer side passages (B1, B2, B6, and B7) reaches about 0.1 for the small endwall speed, while for the large endwall speed, the maximum difference is even over 0.2. Considering the mid-three passages, the maximum difference is below 0.09 at the two endwall speeds.
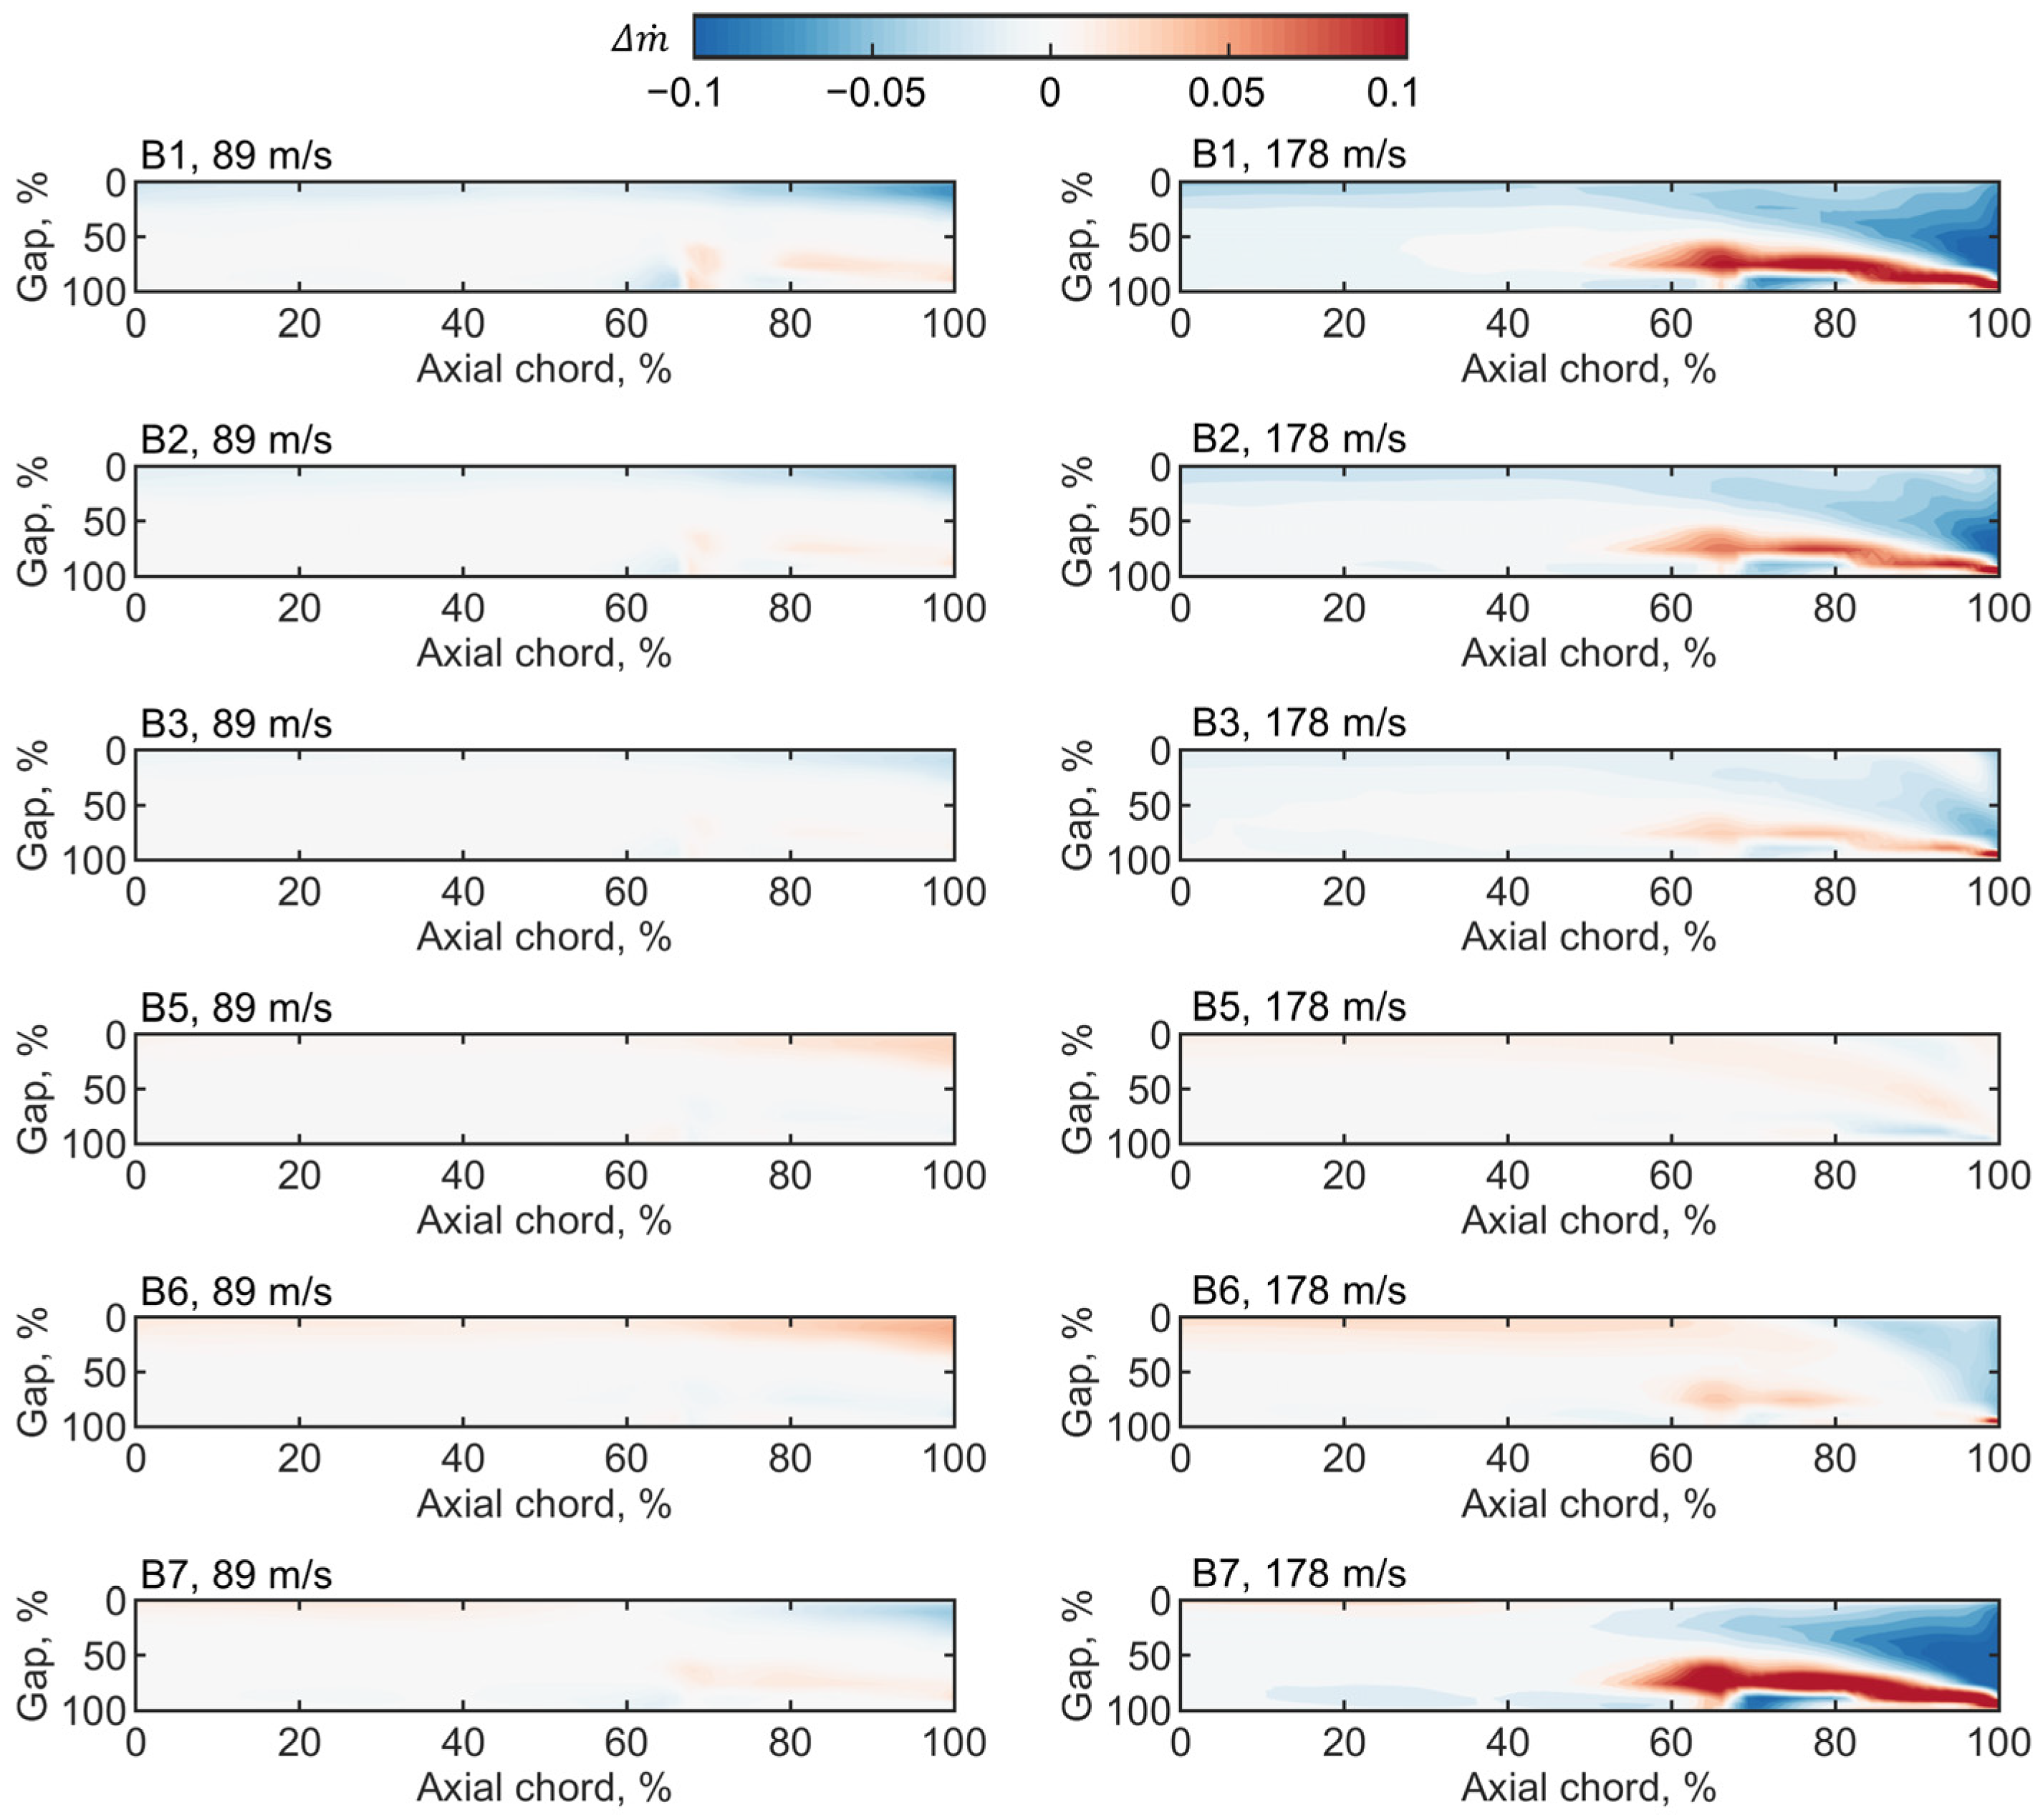
Figure 14 shows density flow differences at different pitch locations. The results suggest that the density flow distributions of the large endwall speed are much more sensitive to the axial velocity. Near the TE region, absolute density flow differences of both B1 and B7 can be over 0.1 for the large endwall speed, while that of B3 and B5 significantly decreases.
Figure 15 shows the total pressure loss coefficient difference at different pitch locations, which also indicates that the mid-three passages have a relatively small difference. These results obtained from the seven-passage simulations can further confirm the feasibility of the novel experimental facility to study the axial compressor leakage flow. Though the outer side region has obvious errors, the mid-three passages that are measured by the experiment can reach an acceptable level of accuracy.
4. Experimental Facility and Preliminary Results
After demonstrating the feasibility, it is confident to carry out the experimental investigation. Experiments were carried out in the high-speed disk cascade wind tunnel of Shanghai Jiao Tong University.
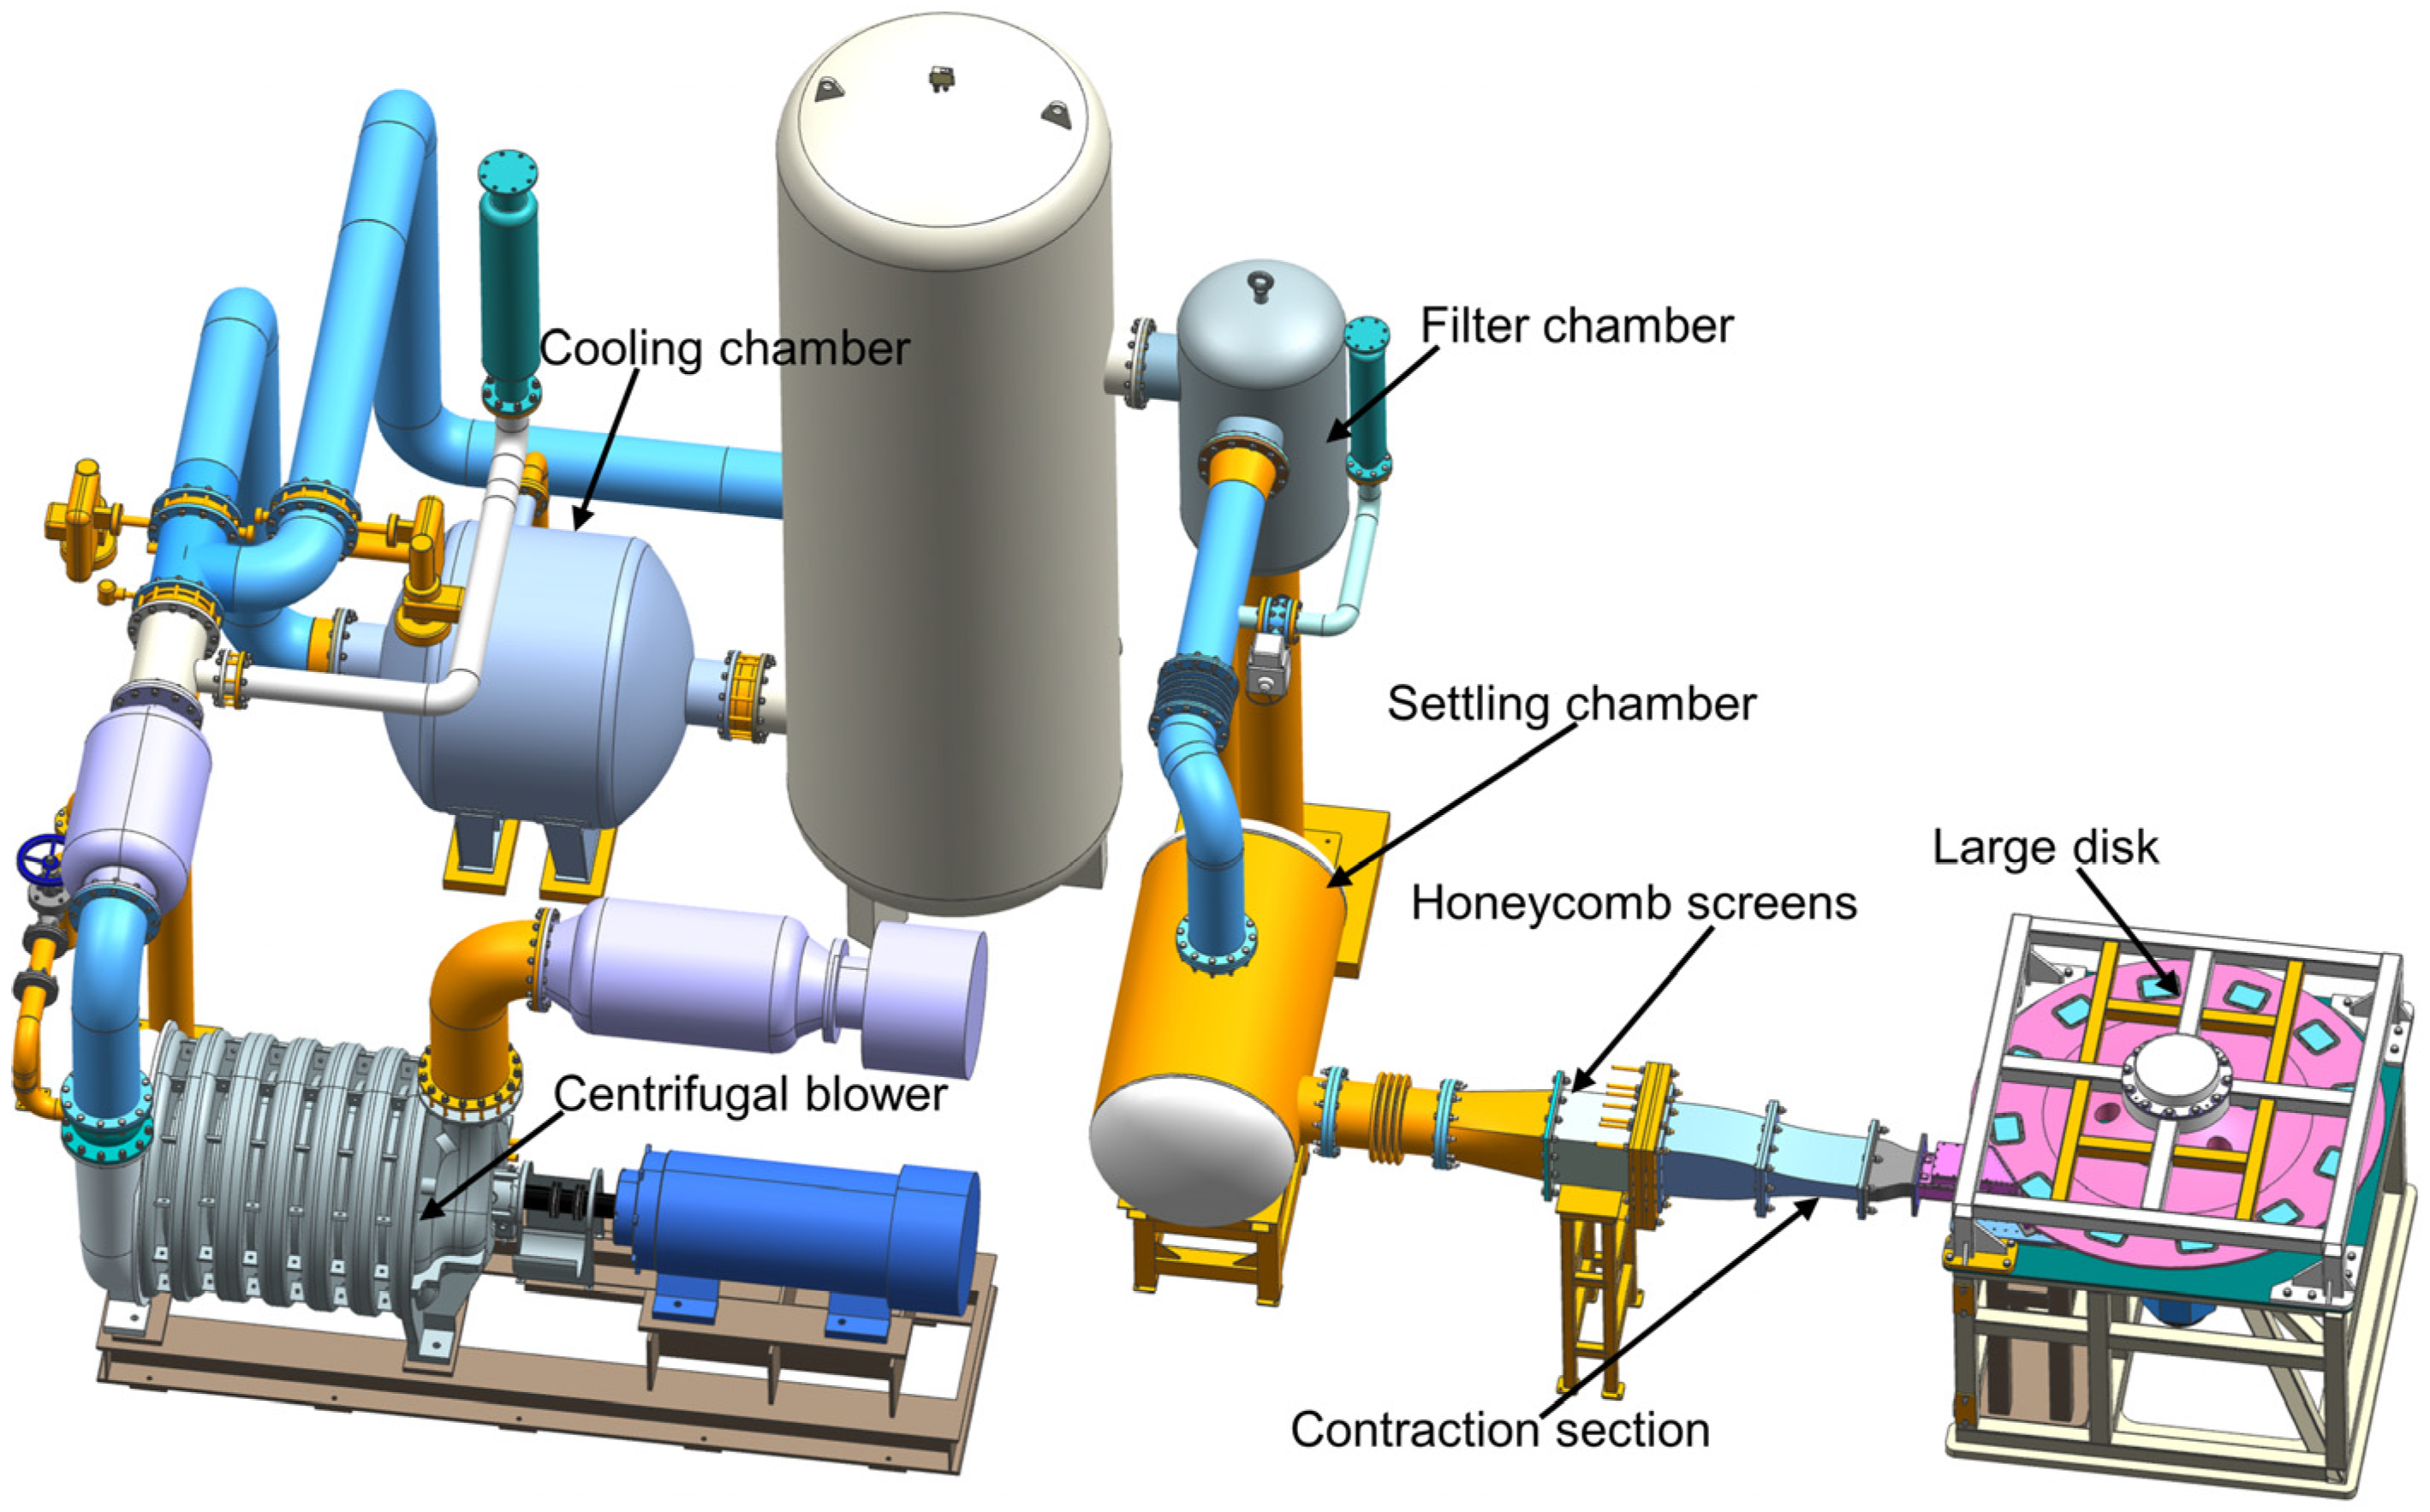
Figure 16 and
Figure 17 show the overall CAD model and photograph of the experimental facility, respectively. The experimental facility, powered by a 400-kW centrifugal blower, supplies compressed air to a settling chamber with 500 mm in radius and 1600 mm in length. Going downstream, honeycomb screens of 300 mm in width and height are installed to ensure airflow quality. The cross-section size of the experiment measurement would be customized as required. Note that the maximum mass flow and the pressure rise are 180 m
3/min and 0.2 MPa, which can meet the air requirement of high-speed conditions. During the experimental measurement, the maximum fluctuation of inflow total pressure is less than 1%.
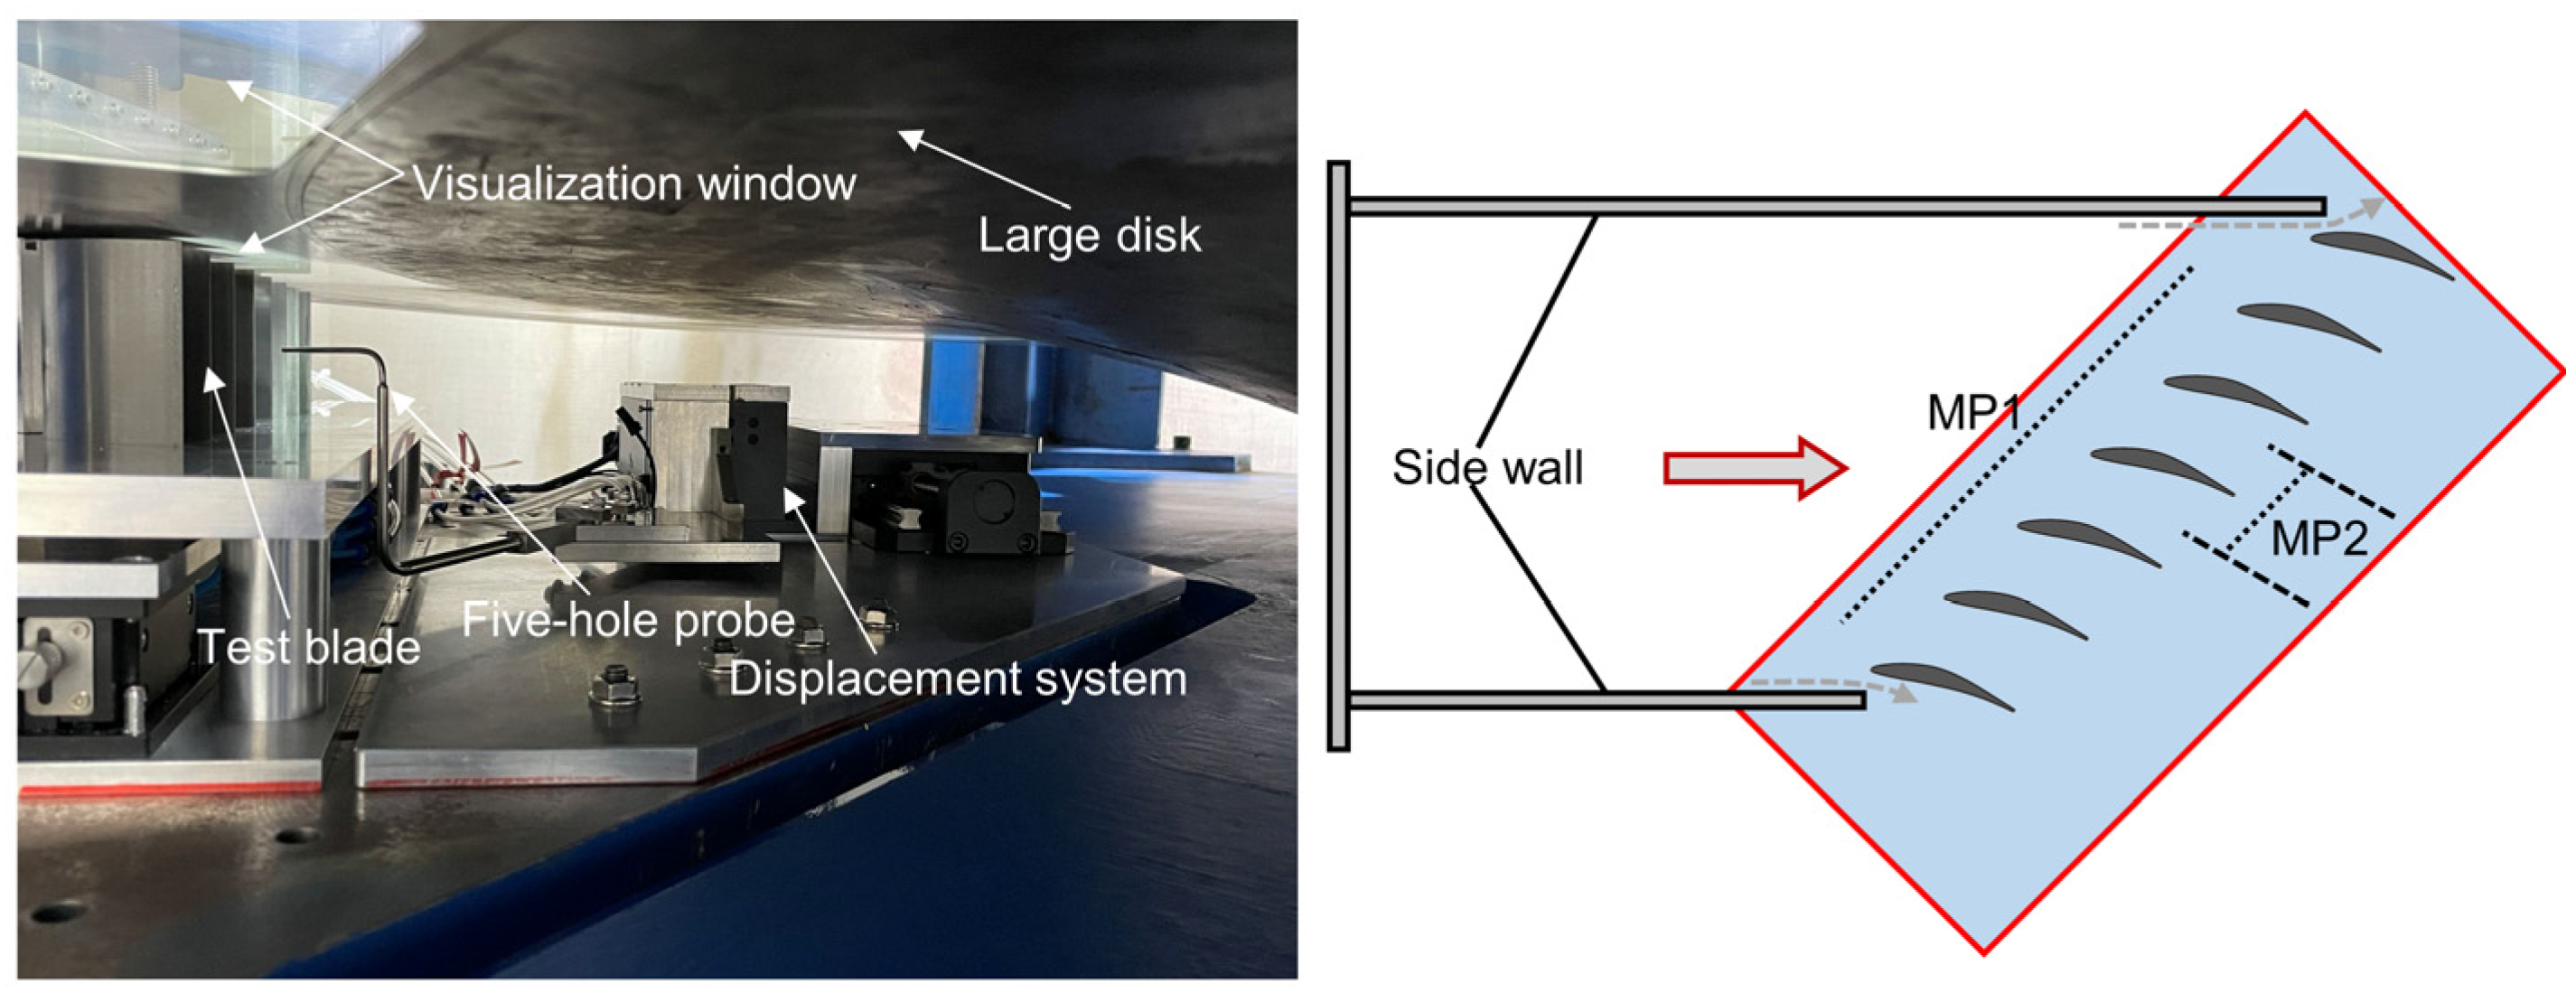
Further,
Figure 18 gives the details of the test section and instrumentation. As the same with the above simulations, the tested axial compressor cascade consists of seven blades with the CDA profile. The inflow condition is measured at 0.45
C upstream of the LE (MP1). At MP1, the inflow total pressure and endwall static pressure are measured by a Pitot tube and a series of pressure taps, thus determining the inlet Mach number. The double L-type five-hole probe with a diameter of 1.5 mm, fastened in a displacement system, is applied to measure the outlet flow field at 0.4
C downstream of the TE (MP2). The displacement system can freely move along both spanwise and pitchwise. The static pressure on the blade surface at different span locations is measured by a series of pressure taps. The diameter of these pressure taps is 0.5 mm. All pressure data are collected by NetScanner 9216.
The uncertainty of the inlet flow angle and outlet flow angle is ±0.3°. The pressure collection accuracy is 0.05% of the full scale. For the displacement system, its uncertainty is ±0.003 mm in spanwise and ±0.005 mm in pitchwise. During experiments, several vibration sensors are installed at the edge to monitor the disk vibration. It is found that the absolute vibration is less than 0.1 mm at various rotating speeds, ensuring an accurate clearance size measured in experiments. The pitchwise boundary layer is eliminated by the passive bypass to provide a more uniform incidence.
In the present study, the clearance size of s/h = 2.86% is measured. The inlet Mach number keeps a constant value of 0.5, corresponding to the Reynolds number of 0.65 × 10⁶ which is calculated based on the blade chord. Although the maximum design rotation speed of the disk is 2500 rpm, unfortunately, the experimental facility is being upgraded, so the rotation speed is 1000 rpm for the moving condition, corresponding to the translational motion of 89 m/s. A more detailed measurement at a higher speed will be performed in the future. Here, the main aim is to validate the feasibility of the novel experimental facility.
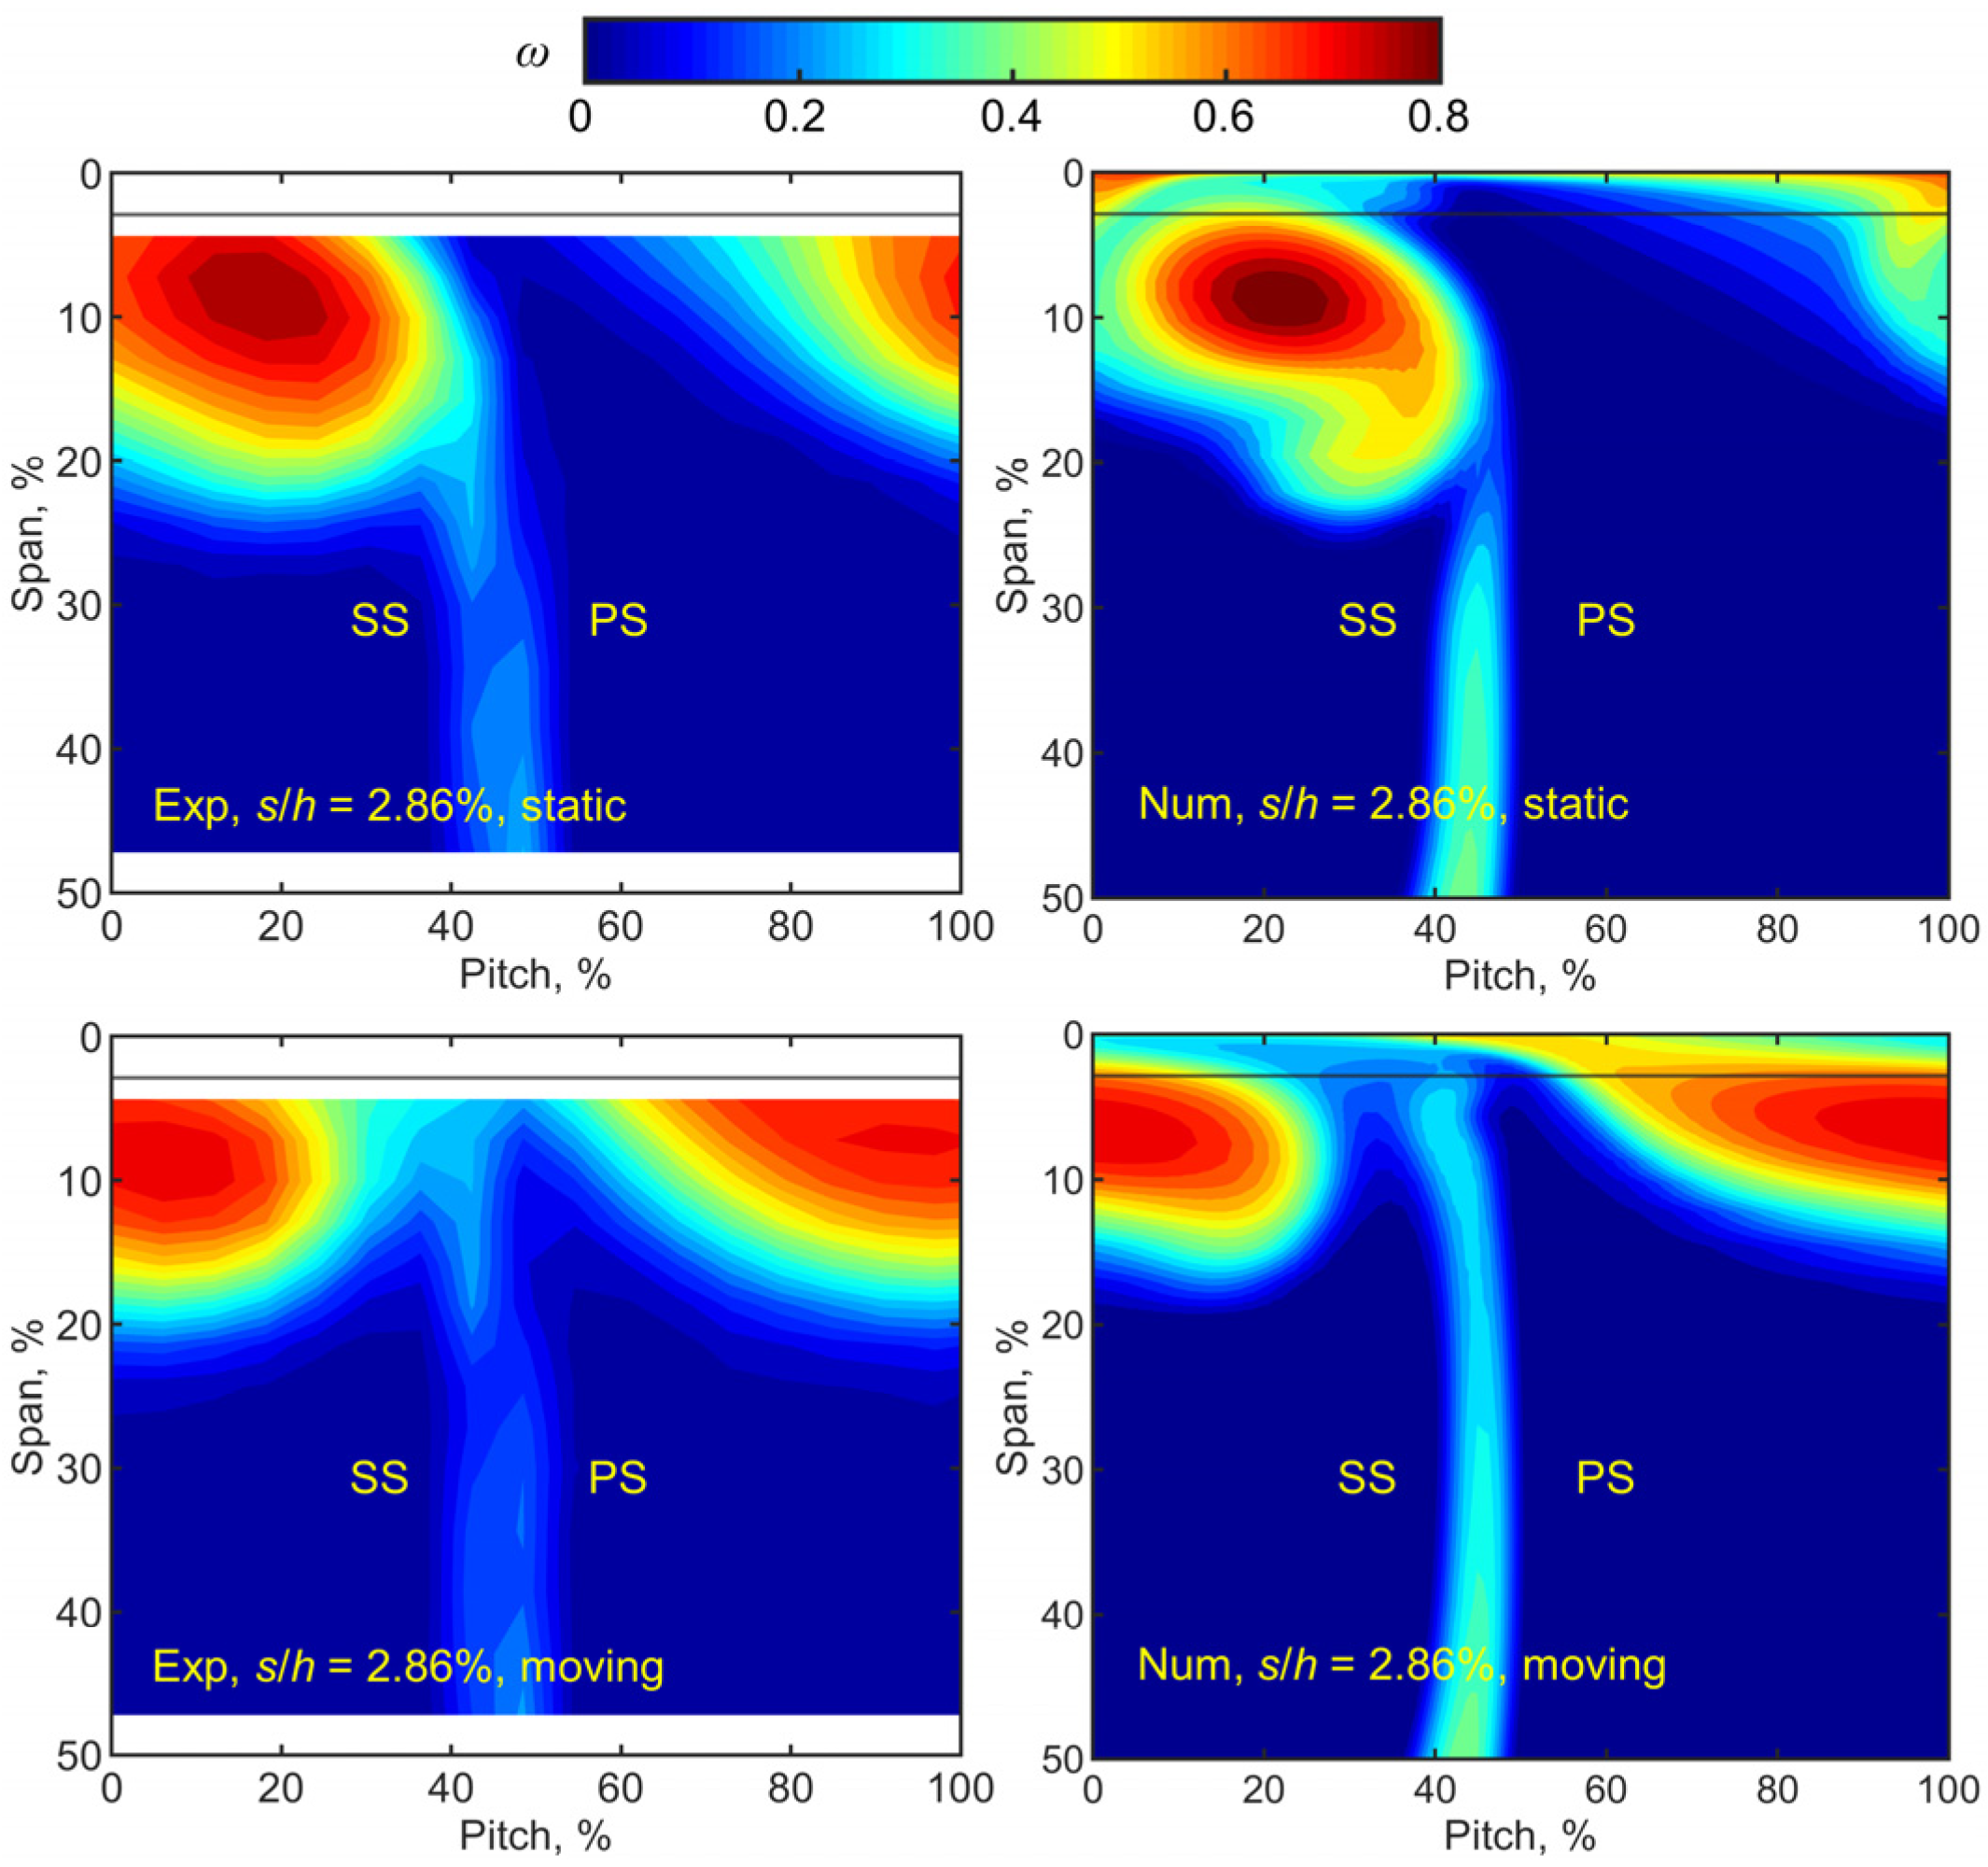
The left side of
Figure 19 shows the measured total pressure loss coefficient where the solid line represents the clearance location. The measurements are relatively conservative since such pneumatic experiments are first performed in this facility. Though there is a distance of 4.36% span between the five-hole probe and disk, the leakage vortex (high loss region) and the effect of moving endwall are still clearly visible. As a comparison, CFD results are shown on the right side of
Figure 19. The CFD method is the same as
Section 3, but here the inlet is imposed a total pressure profile with an inflow boundary layer. Comparing the results between the experiments and simulations, the simulations can capture key features, but there are some differences in the detailed flow.
For the static endwall, there is a clear leakage vortex core at which the total pressure loss coefficient is significantly higher than in other regions. Overall, the leakage vortex keeps close to the SS and thus merges with the blade wake at the region approximately below 25% span. For the moving endwall, pronounced changes in the leakage loss distributions can be observed. The leakage loss is almost stratified and its radial range is decreased, indicating that the leakage vortex is stretched along the pitchwise by the moving endwall. And the leakage vortex can detach the SS to a certain extent so that the blade wake becomes clear in the vicinity of the endwall. Due to the added energy by the moving endwall, the maximum loss of the core region decreases.
Table 2 gives the differences in averaged total pressure loss between the experiment and CFD. The static endwall shows a relative difference of 11.33% while the moving endwall shows a relative difference of 7.69%. These results are preliminary, so the difference level is acceptable. Future work will improve the measurement and simulation to capture a more detailed flow field.
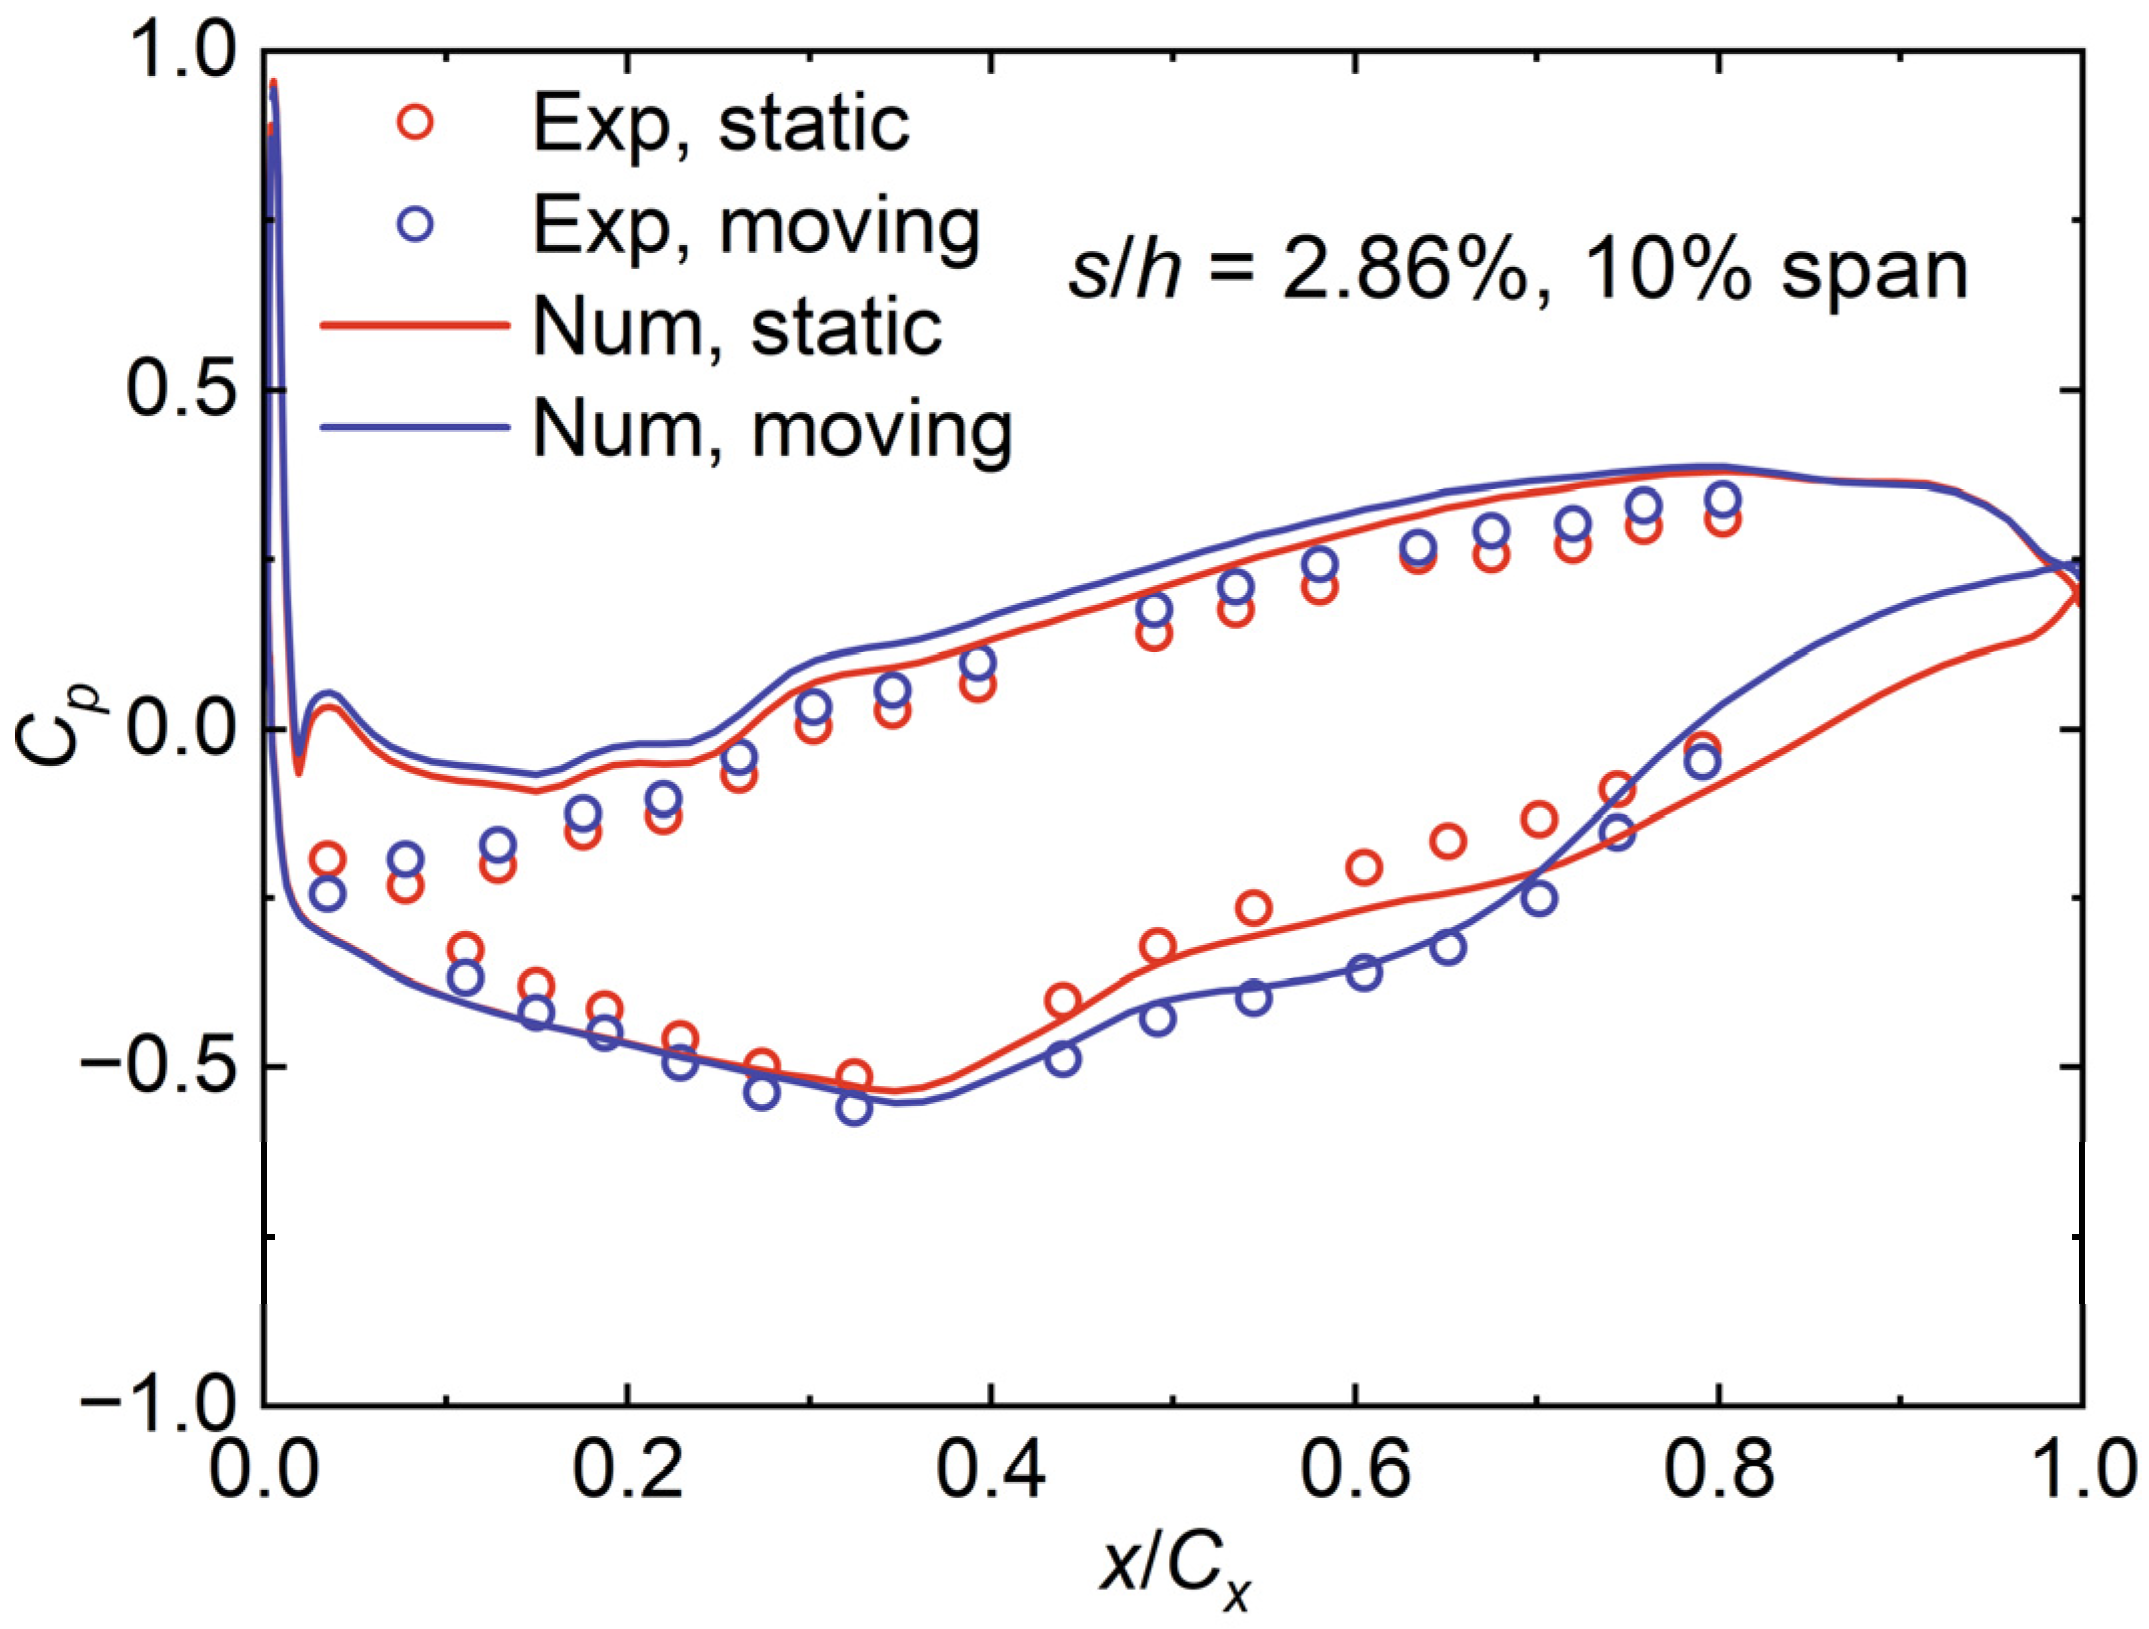
Figure 20 shows the distributions of the static pressure coefficient. On the PS, the moving endwall enables the static pressure coefficient to slightly increase on the whole axial chord due to the added kinetic energy. On the SS, the changes in the static pressure coefficient are complex. At the fore axial chord, the static pressure coefficient is very close for the two endwall conditions. The moving endwall only exhibits a slightly lower static pressure coefficient. Near the mid axial chord, the static pressure coefficient for moving endwall is significantly lower. Finally, at the aft axial chord, the moving endwall makes the static pressure coefficient higher.
5. Conclusions
In this paper, a novel experimental facility with a high-speed moving endwall for axial compressor leakage flow study is presented. The uniqueness of the design concept is that using a large disk simulates the high-speed endwall. Visualization windows can support full optical access to the leakage flow at high-speed conditions and, more importantly, overcome the shortcoming that measures the details of the hub leakage flow for conventional methods. Meanwhile, the experimental facility features low-cost convenient measurement and easily changing operating conditions, so it is conducive to the iterative design and mechanisms investigation.
There are two system errors for the experimental facility: linear velocity difference and axial velocity difference. The system errors significantly decrease as the disk radius increases. When R/Cx = 16, theoretical analysis shows that the maximum linear velocity difference is about 2.5% while the maximum axial velocity difference of the mid-three passages is less than 5%.
The feasibility of the novel design is evaluated by numerical simulations. Single-passage simulations show that the disk radius of R/Cx = 16 can achieve an acceptable accuracy in terms of static pressure, total pressure, and density flow. Based on the tradeoff between the low cost and high accuracy, the disk radius of 1000 mm is selected for the later study though the results of R/Cx = 64 have higher accuracy. Seven-passage simulations further confirm that the mid-three passages have small errors from the axial velocity difference. For the selected radius, the disk rotation speed of about 2000 rpm is capable of reaching the level of a real axial compressor. The errors of this configuration are expected to be smaller with the reduction of the axial chord and pitch.
Preliminary results obtained from the experimental facility are reported in the present study, which illustrates the significant effects of moving endwall on the axial compressor leakage flow. The leakage vortex is stretched along the pitchwise by the moving endwall so that the leakage loss is almost stratified. The relative difference in the averaged total pressure loss between the experiment and CFD is 11.33% and 7.69% for the static and moving endwall, respectively. At the same time, the distributions of the static pressure coefficient change accordingly.
So far, both the feasibility and preliminary results of the novel experimental facility are presented. Future work will include more detailed measurements such as PIV and dynamic pressure sensors over wider operating conditions. In addition, there will be measurements with different axial compressor blades.
Author Contributions
Conceptualization, H.D.; methodology, H.D. and S.L.; software, K.X. and X.Q.; writing—original draft preparation, H.D.; writing—review and editing, J.T. and M.Z.; supervision, J.T.; funding acquisition, J.T. All authors have read and agreed to the published version of the manuscript.
Funding
This work is supported by the Natural Science Foundation of China (No. 52076129, No. 51576124), the National Science and Technology Major Project (2017-II-0004-0017), the Shanghai Municipal Education Commission No. 2021-05-7, the United Innovation Center (UIC) of Aerothermal Technologies for Turbomachinery, and the Innovation Fund from the Engineering Research Center of Aerospace Science and Technology, Ministry of Education.
Data Availability Statement
Not applicable.
Conflicts of Interest
The authors declare no conflict of interest.
Nomenclature
| B | Blade |
| C | Chord |
| Cp | Static pressure coefficient |
| CDA | Controlled diffusion airfoil |
| CFD | Computational fluid dynamics |
| Cx | Axial chord |
| Exp | Experimental |
| h | Passage height |
| inf | Infinity |
| Ma1 | Inlet Mach number |
| MP | Measurement plane |
| Num | Numerical |
| LE | Leading edge |
| PIV | Particle image velocimetry |
| PS | Pressure side |
| R | Radius |
| RANS | Reynolds-averaged Navier—Stokes |
| s | Clearance size |
| SS | Suction side |
| t | Pitch |
| TE | Trailing edge |
| U | Linear velocity |
| Vx | Axial velocity |
| Vy | Circumferential velocity |
| x | Axial direction |
| y | Pitchwise direction |
| β1 | Design inlet angle |
| β2 | Design out angle |
| βs | Stagger angle |
| Total pressure loss |
References
- Suder, K.L. NASA’s role in gas turbine technology development: Accelerating technical progress via collaboration between academia, industry, and government agencies. J. Turbomach. 2021, 143, 011006. [Google Scholar] [CrossRef]
- Lord, W.K.; Suciu, G.L. Engine architecture for high efficiency at small core size. Am. Soc. Mech. Eng. 2016, 138, 52–53. [Google Scholar] [CrossRef] [Green Version]
- Denton, J.D. The 1993 IGTI scholar lecture: Loss mechanisms in turbomachines. J. Turbomach. 1993, 115, 621–656. [Google Scholar] [CrossRef]
- Pullan, G.; Young, A.M.; Day, I.J.; Greitzer, E.M.; Spakovszky, Z.S. Origins and structure of spike-type rotating stall. J. Turbomach. 2015, 137, 051007. [Google Scholar] [CrossRef]
- Hewkin-Smith, M.; Pullan, G.; Grimshaw, S.D.; Greitzer, E.M.; Spakovszky, Z.S. The role of tip leakage flow in spike-type rotating stall inception. J. Turbomach. 2019, 141, 061010. [Google Scholar] [CrossRef] [Green Version]
- Tyacke, J.; Vadlamani, N.R.; Trojak, W.; Watson, R.; Ma, Y.; Tucker, P.G. Turbomachinery simulation challenges and the future. Prog. Aerosp. Sci. 2019, 110, 100554. [Google Scholar] [CrossRef]
- Tucker, P.G.; Wang, Z.N. Eddy resolving strategies in turbomachinery and peripheral components. J. Turbomach. 2021, 143, 010801. [Google Scholar] [CrossRef]
- Wang, H.; Wang, Y.; Liu, H.; Xue, F.; Wang, Z. Multi-scale nature of non-blade-order propagating flow disturbances in axial compressors. Chin. J. Aeronaut. 2022, 35, 129–142. [Google Scholar] [CrossRef]
- He, X.; Zhao, F.; Vahdati, M. Detached eddy simulation: Recent development and application to compressor tip leakage flow. J. Turbomach. 2022, 144, 011009. [Google Scholar] [CrossRef]
- Liu, Y.; Zhong, L.; Lu, L. Comparison of DDES and URANS for unsteady tip leakage flow in an axial compressor rotor. J. Fluids Eng. 2019, 141, 121405. [Google Scholar] [CrossRef]
- Chen, X.; Koppe, B.; Lange, M.; Chu, W.; Mailach, R. Comparison of turbulence modeling for a compressor rotor at different tip clearances. AIAA J. 2021, 60, 1–13. [Google Scholar] [CrossRef]
- Evans, S.; Yi, J.; Nolan, S.; Joseph, L.; Ni, M.; Kulkarni, S. Modeling of axial compressor with large tip clearances. J. Turbomach. 2021, 143, 061007. [Google Scholar] [CrossRef]
- Gao, F.; Ma, W.; Boudet, G.J.; Ottavy, X.; Lu, L.; Shao, L. Large-eddy simulation of 3-D corner separation in a linear compressor cascade. Phys. Fluids 2015, 27, 085105. [Google Scholar] [CrossRef] [Green Version]
- Li, Z.; Jin, Y.; Du, J.; Zhang, H.; Niu, C. Physical mechanisms investigation of sharkskin-inspired compressor cascade based on large eddy simulations. J. Turbomach. 2021, 143, 061005. [Google Scholar] [CrossRef]
- Wheeler, A.P.S.; Dickens, A.M.J.; Miller, R.J. The effect of nonequilibrium boundary layers on compressor performance. J. Turbomach. 2018, 140, 101003. [Google Scholar] [CrossRef] [Green Version]
- Ventosa-Molina, J.; Lange, M.; Mailach, R.; Fröhlich, J. Study of relative endwall motion effects in a compressor cascade through direct numerical simulations. J. Turbomach. 2021, 143, 1–32. [Google Scholar] [CrossRef]
- Ju, Z.; Teng, J.; Zhu, M.; Ma, Y.; Qiang, X.; Fan, L.; Yang, Z. Flow characteristics on a 4-stage low-speed research compressor with a cantilevered stator. Aerosp. Sci. Technol. 2020, 105, 106033. [Google Scholar] [CrossRef]
- Pan, T.; Yan, J.; Yan, Z.; Sun, D.; Li, Q. Experiment investigation on the effect of inlet circumferential non-uniformity on the stall behaviours in a transonic axial compressor with axisymmetric stall precursor. Aerosp. Sci. Technol. 2022, 128, 107781. [Google Scholar] [CrossRef]
- Li, J.; Dong, X.; Sun, D.; Wang, Y.; Geng, C.; Sun, X. Stability enhancement and noise reduction of an axial compressor with foam metal casing treatment. Aerospace 2022, 9, 628. [Google Scholar] [CrossRef]
- Yu, X.; Liu, B.; Jiang, H. Characteristics of the tip leakage vortex in a low-speed axial compressor. AIAA J. 2007, 45, 870–878. [Google Scholar] [CrossRef]
- Brandstetter, C.; Wartzek, F.; Werner, J.; Schiffer, H.P.; Heinichen, F. Unsteady measurements of periodic effects in a transonic compressor with casing treatments. J. Turbomach. 2016, 138, 051007. [Google Scholar] [CrossRef]
- Zhong, J.; Han, S.; Lu, H.; Kan, X. Effect of tip geometry and tip clearance on aerodynamic performance of a linear compressor cascade. Chin. J. Aeronaut. 2013, 26, 583–593. [Google Scholar] [CrossRef] [Green Version]
- Smith, N.R.; Murray, W.L.; Key, N.L. Considerations for measuring compressor aerodynamic excitations including rotor wakes and tip leakage flows. J. Turbomach. 2016, 138, 031008. [Google Scholar] [CrossRef]
- Berdanier, R.A.; Key, N.L. Demonstrating multistage compressor blockage calculations using pressure measurements for large tip clearances. J. Propuls. Power 2018, 34, 281–290. [Google Scholar] [CrossRef]
- Wisler, D.C. Loss reduction in axial-flow compressors through low-speed model testing. J. Eng. Gas Turbines Power 1985, 107, 354–363. [Google Scholar] [CrossRef]
- Wang, Y.; Devenport, W.J. Wake of a compressor cascade with tip gap, part 2: Effects of endwall motion. AIAA J. 2004, 42, 2332–2340. [Google Scholar] [CrossRef]
Figure 1.
Simplification procedures for axial compressor rotor and cantilevered stator.
Figure 1.
Simplification procedures for axial compressor rotor and cantilevered stator.
Figure 2.
Schematic of linear velocity change with the radius.
Figure 2.
Schematic of linear velocity change with the radius.
Figure 3.
Evaluation of linear velocity difference.
Figure 3.
Evaluation of linear velocity difference.
Figure 4.
Schematic of axial velocity change with the pitch location.
Figure 4.
Schematic of axial velocity change with the pitch location.
Figure 5.
Evaluation of axial velocity difference.
Figure 5.
Evaluation of axial velocity difference.
Figure 6.
Schematic of the investigated axial compressor cascade.
Figure 6.
Schematic of the investigated axial compressor cascade.
Figure 7.
Computational domain.
Figure 7.
Computational domain.
Figure 8.
Computational grid of single passage.
Figure 8.
Computational grid of single passage.
Figure 9.
Validation of grid sensitivity.
Figure 9.
Validation of grid sensitivity.
Figure 10.
Endwall static pressure coefficient and its difference at various disk radii.
Figure 10.
Endwall static pressure coefficient and its difference at various disk radii.
Figure 11.
Density flow and its difference at various disk radii.
Figure 11.
Density flow and its difference at various disk radii.
Figure 12.
Total pressure loss coefficient and its difference at various disk radii.
Figure 12.
Total pressure loss coefficient and its difference at various disk radii.
Figure 13.
Endwall static pressure coefficient difference at different pitch locations.
Figure 13.
Endwall static pressure coefficient difference at different pitch locations.
Figure 14.
Density flow difference at different pitch locations.
Figure 14.
Density flow difference at different pitch locations.
Figure 15.
Total pressure loss coefficient difference at different pitch locations.
Figure 15.
Total pressure loss coefficient difference at different pitch locations.
Figure 16.
Overall CAD model of the experimental facility.
Figure 16.
Overall CAD model of the experimental facility.
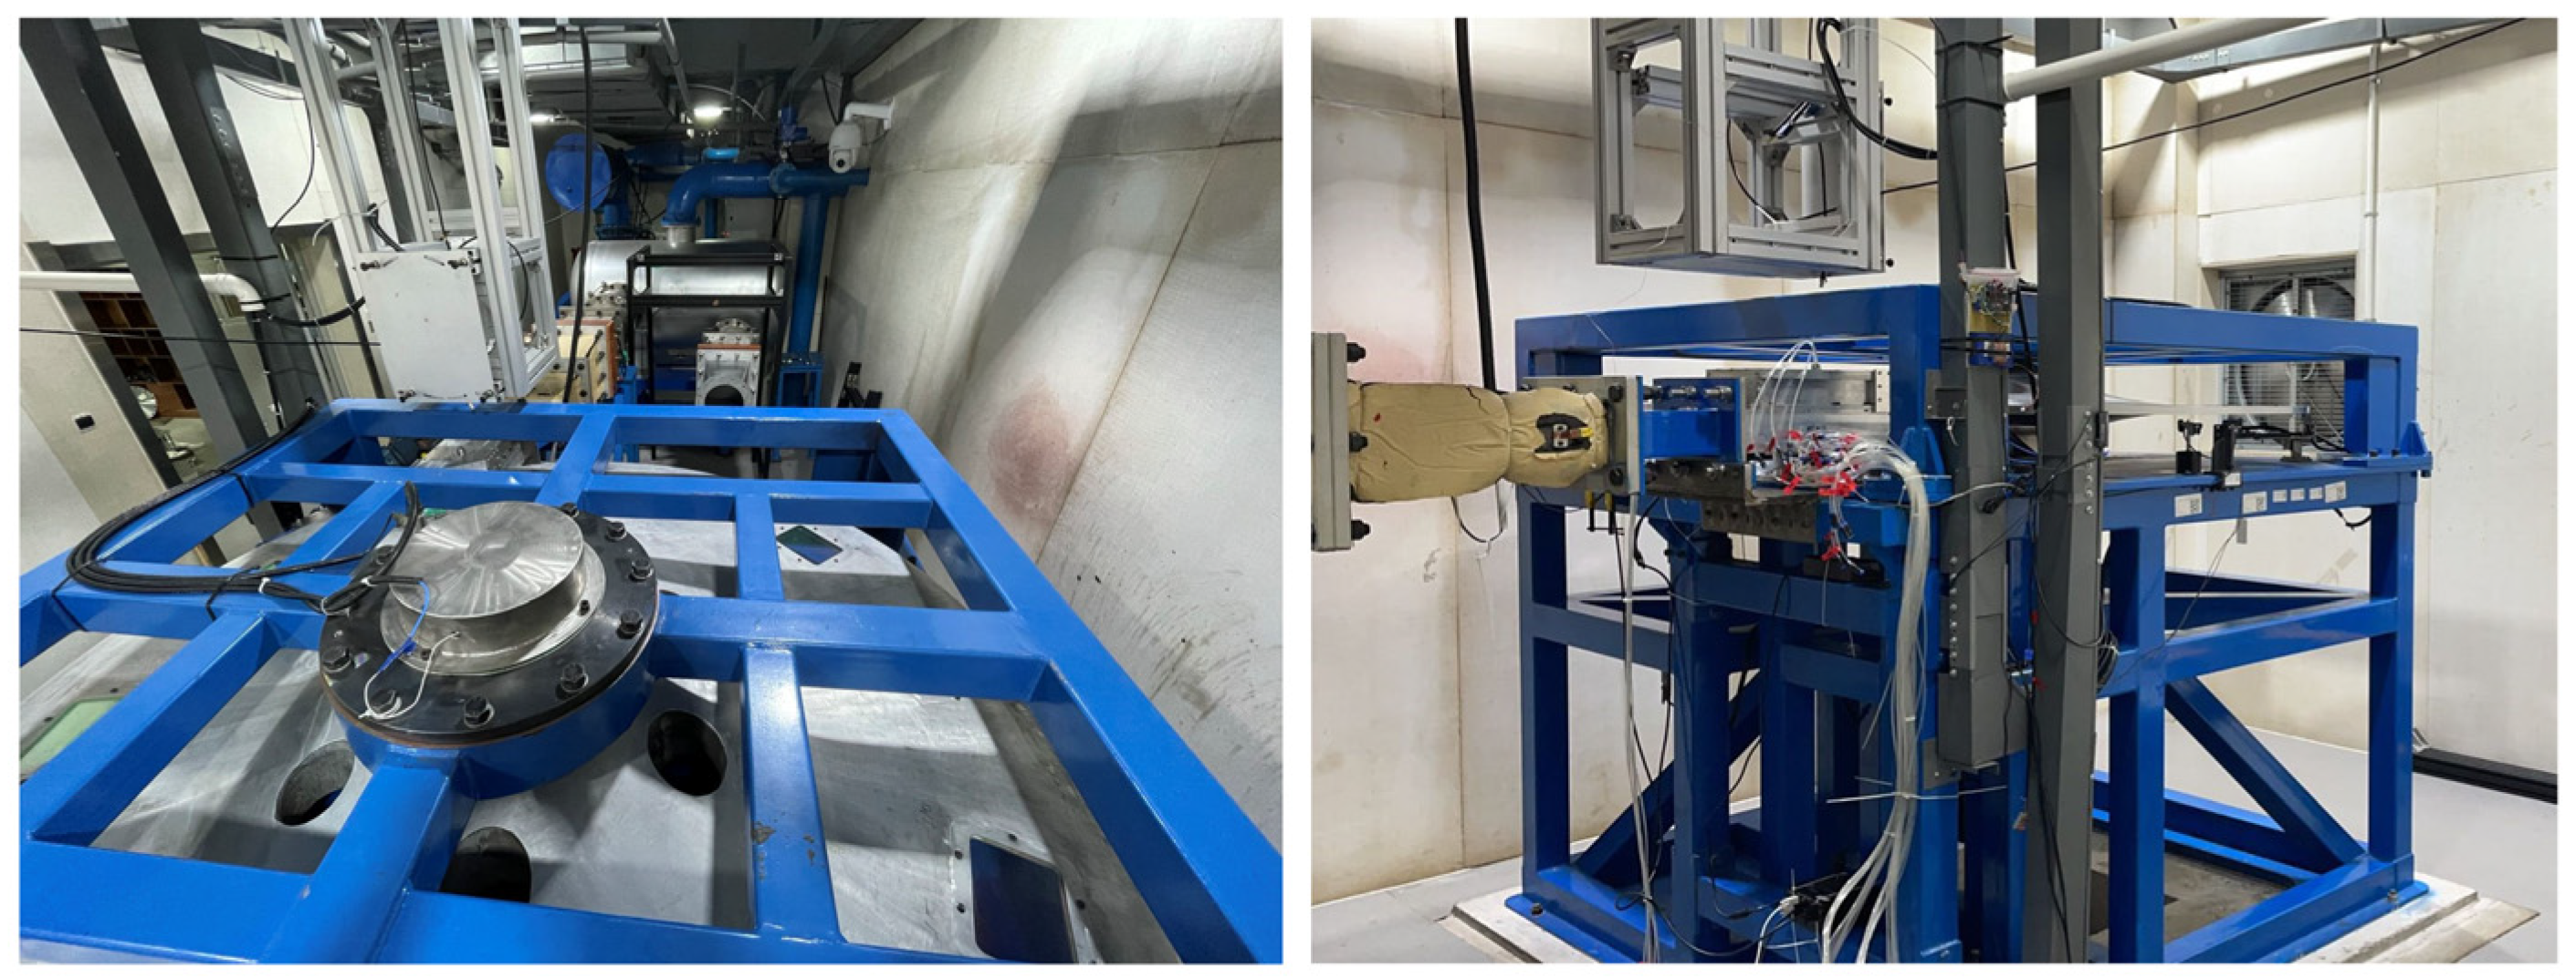
Figure 17.
Overall photograph of the experimental facility.
Figure 17.
Overall photograph of the experimental facility.
Figure 18.
Details of the test section and instrumentation.
Figure 18.
Details of the test section and instrumentation.
Figure 19.
Distributions of total pressure loss coefficient.
Figure 19.
Distributions of total pressure loss coefficient.
Figure 20.
Distributions of static pressure coefficient.
Figure 20.
Distributions of static pressure coefficient.
Table 1.
Parameters of investigated cascade.
Table 1.
Parameters of investigated cascade.
| Parameter | Value |
|---|
| Chord, C | 60 mm |
| Solidity, C/t | 1.45 |
| Aspect ratio, h/C | 1.17 |
| Design inlet angle, β1 | 47 deg |
| Stagger angle, βs | 30 deg |
| Inlet Mach number, Ma1 | 0.62 |
Table 2.
Differences in averaged total pressure loss between the experiment and CFD.
Table 2.
Differences in averaged total pressure loss between the experiment and CFD.
| Endwall Condition | Absolute Difference | Relative Difference |
|---|
| Static endwall | 0.0205 | 11.33% |
| Moving endwall | 0.0139 | 7.69% |
| Disclaimer/Publisher’s Note: The statements, opinions and data contained in all publications are solely those of the individual author(s) and contributor(s) and not of MDPI and/or the editor(s). MDPI and/or the editor(s) disclaim responsibility for any injury to people or property resulting from any ideas, methods, instructions or products referred to in the content. |
© 2023 by the authors. Licensee MDPI, Basel, Switzerland. This article is an open access article distributed under the terms and conditions of the Creative Commons Attribution (CC BY) license (https://creativecommons.org/licenses/by/4.0/).


