Article

Study of Gust Calculation and Gust Alleviation: Simulations and Wind Tunnel Tests

School of Aeronautic Science and Engineering, Beihang University, Beijing 100191, China
*
Author to whom correspondence should be addressed.
Aerospace 2023, 10(2), 139; https://doi.org/10.3390/aerospace10020139
Submission received: 4 January 2023 / Revised: 27 January 2023 / Accepted: 31 January 2023 / Published: 2 February 2023

Abstract

:
Feedforward gust alleviation control using gusts as input signals has received increasing attention in recent years. One of the most important issues in such a control scheme is how to obtain the high-quality gust information during an aircraft’s flight. In this study, a calculation method for obtaining gust information when an aircraft is flying with an arbitrary attitude is derived, based on which a simplified calculation method is established. A wind tunnel test was carried out to verify the gust calculation method. Numerical simulations were employed to investigate the influence of sensor characteristics on the gust calculation accuracy and gust alleviation performance. The results show that the time delay of the sensor has a very important influence and leads to decreases in the gust calculation accuracy and the alleviation effect. A five-hole probe was mounted on an aircraft model for gust sensing, and a gust alleviation wind tunnel test was conducted by combining the gust calculation with the feedforward gust alleviation system. The accurate calculation of the gust signal enables the feedforward gust alleviation system to achieve a 39.12% reduction of wing root bending moment and a 65.47% reduction of wingtip acceleration on average.

1. Introduction

Gusts have very pronounced effects on aircraft flight. Gust load is often considered to be a serious load condition encountered during aircraft flight, and its influence must be taken into account in the aircraft structure design process. Additionally, gusts cause vibrations and attitude changes, reducing the ride and flight quality of the aircraft. As aircraft structures become more lightweight, the influence of gusts on aircraft becomes more severe. Gust load alleviation (GLA) technology can be employed to significantly reduce these negative influences.
With the development of aviation science and technology, many studies have been performed on GLA. Some of these studies focused on structure device design [1,2], and some used morphing wing technology to achieve GLA [3,4,5]. Aside from these studies, gust alleviation through active control is a very important research branch. Depending on the type of the signal fed into the control system, the active control of the GLA can be divided into two categories: feedforward control, which uses the gust signal as the input, and feedback control, which uses the aircraft motion signal as the input. In the past few years, feedback control has been widely studied, including optimal control [6], robust control [7,8], predictive control [9], intelligent control [10], etc. There are also many experimental studies [11,12,13,14]. At present, gust alleviation control system based on feedback control has been applied to operational aircraft [15], such as the Airbus A380, Boeing B787, etc.
Although feedback control has been extensively studied and applied, it is a lag-compensated control method that only begins to work once the aircraft has been excited by the gust. Feedforward control system (FFCS) uses the gusts detected in advance as input signals and can drive control surface deflection before the gusts reach the aircraft’s main lifting surface, thus overcoming the above shortcoming. Another advantage of this control method is that it can maintain the dynamics and handling qualities of the aircraft unchanged and does not affect the stability of the existing flight control system.
To date, many feedforward controller design methods have been developed. As feedforward control is an open-loop control method, it is sensitive to changes in the flight condition and the aircraft’s variation. Therefore, some adaptive feedforward controller design methods [16,17] have been investigated. There are also other control methods that have been applied to feedforward gust alleviation, such as model predictive control (MPC) [18] and robust control [19]. In these studies, it is usually assumed that the gusts can be perfectly measured. There are also experimental studies on feedforward control, an adaptive feedforward controller flight test was conducted on an ATTAS aircraft [20] using the signal from a flight log sensor as a reference for atmospheric turbulence. The results of this experiment showed that the feedforward controller reduced the power spectral density of the wing bending vibration acceleration by 20%. Some researchers [21,22] have used the response excited by aircraft control surface deflection to simulate the gust response and fed the excitation signal into FFCS to conduct gust alleviation flight tests. Similarly, several studies [23,24] used the command signal driving the gust generator as the input of FFCS for gust alleviation in wind tunnel tests. Obviously, feedforward gust alleviation wind tunnel test would be better conducted through direct gust measurement. The author’s team [25] carried out a feedforward gust alleviation wind tunnel test on a single wing by using a five-hole probe to measure the gusts. The designed feedforward controller achieved a maximum alleviation rate of more than 80% for the wing root bending moment (WRBM). Zhao et al. [26] carried out the wind tunnel test of feedforward control using a full aircraft model. However, these tests used a probe fixed inside the wind tunnel to measure the gusts and did not perform gust alleviation tests using the gust sensor mounted on the airframe. Thus, they missed the gust calculation step that considers aircraft motion, which is indispensable for actual feedforward gust alleviation.
It is very important to obtain accurate gust disturbance signals for feedforward control. There are two main types of gust signal acquisition equipment in the current research. The first is based on light detection and ranging (LIDAR) sensors which detect particles in the air to obtain wind field information. German researchers [27,28,29] have carried out a lot of research on this kind of sensor. A newly developed direct detection Doppler wind LIDAR (DD-DWL) is capable of measuring wind speeds at close range with an accuracy of 0.5 m/s. The Japan Aerospace Exploration Agency also [30,31] carried out a similar project, called ”Safeavio”, which developed an airborne Doppler LIDAR capable of detecting turbulence at distances of 10–20 km to support pilots in bypassing turbulent areas. However, this detection distance is too large for gust alleviation control. This project will further reduce the LIDAR’ detection distance in subsequent research. Although LIDAR sensors can provide more accurate gust information, they are usually expensive, large, and heavy.
The second type of gust sensors are airflow sensors, such as multi-hole probe or flow vane. Multi-hole probe can measure the flow angle by sensing the pressure difference from different holes. Flow vane, also called pivoted vane, is a mass-balanced wind vane that automatically aligns itself with the direction of the incoming flow and then measures the angle between the flow vane and a reference line on the aircraft [32]. At present, the technology of such sensors is relatively mature, and the equipment is inexpensive and small. There has been relatively little research on gust calculation method using LIDAR or airflow sensors. Nicolas from DLR [33] studied the LIDAR-based wind field reconstruction algorithm, which can be realized through simple operation and therefore can obtain results with a low computational cost. Some gust calculation methods based on simplified flight dynamics [34,35] have also been studied. Through this kind of method, vertical gusts to trigger the FFCS are obtained. Through reviewing the existing research, it can be found that there are few in-depth studies on gust calculation. There is also a lack of experimental research combining gust calculation and feedforward gust alleviation. Such research is necessary to further promote the practical applications of feedforward gust alleviation.
In this paper, a gust calculation method based on the airflow sensor for the three-dimensional case is first described; On this basis, the gust calculation method in the longitudinal plane of aircraft motion, which is of major interest, is simplified. Based on the simplified method, a set of two degrees-of-freedom motion device was used to verify the gust calculation method in wind tunnel test. The effects of sensor time delays and measurement errors on the accuracy of gust calculation and the effect of gust alleviation are also investigated through numerical simulations. Finally, a gust alleviation wind tunnel test based on the gust calculation is carried out on a half-model aircraft.

2. Gust Calculation Method

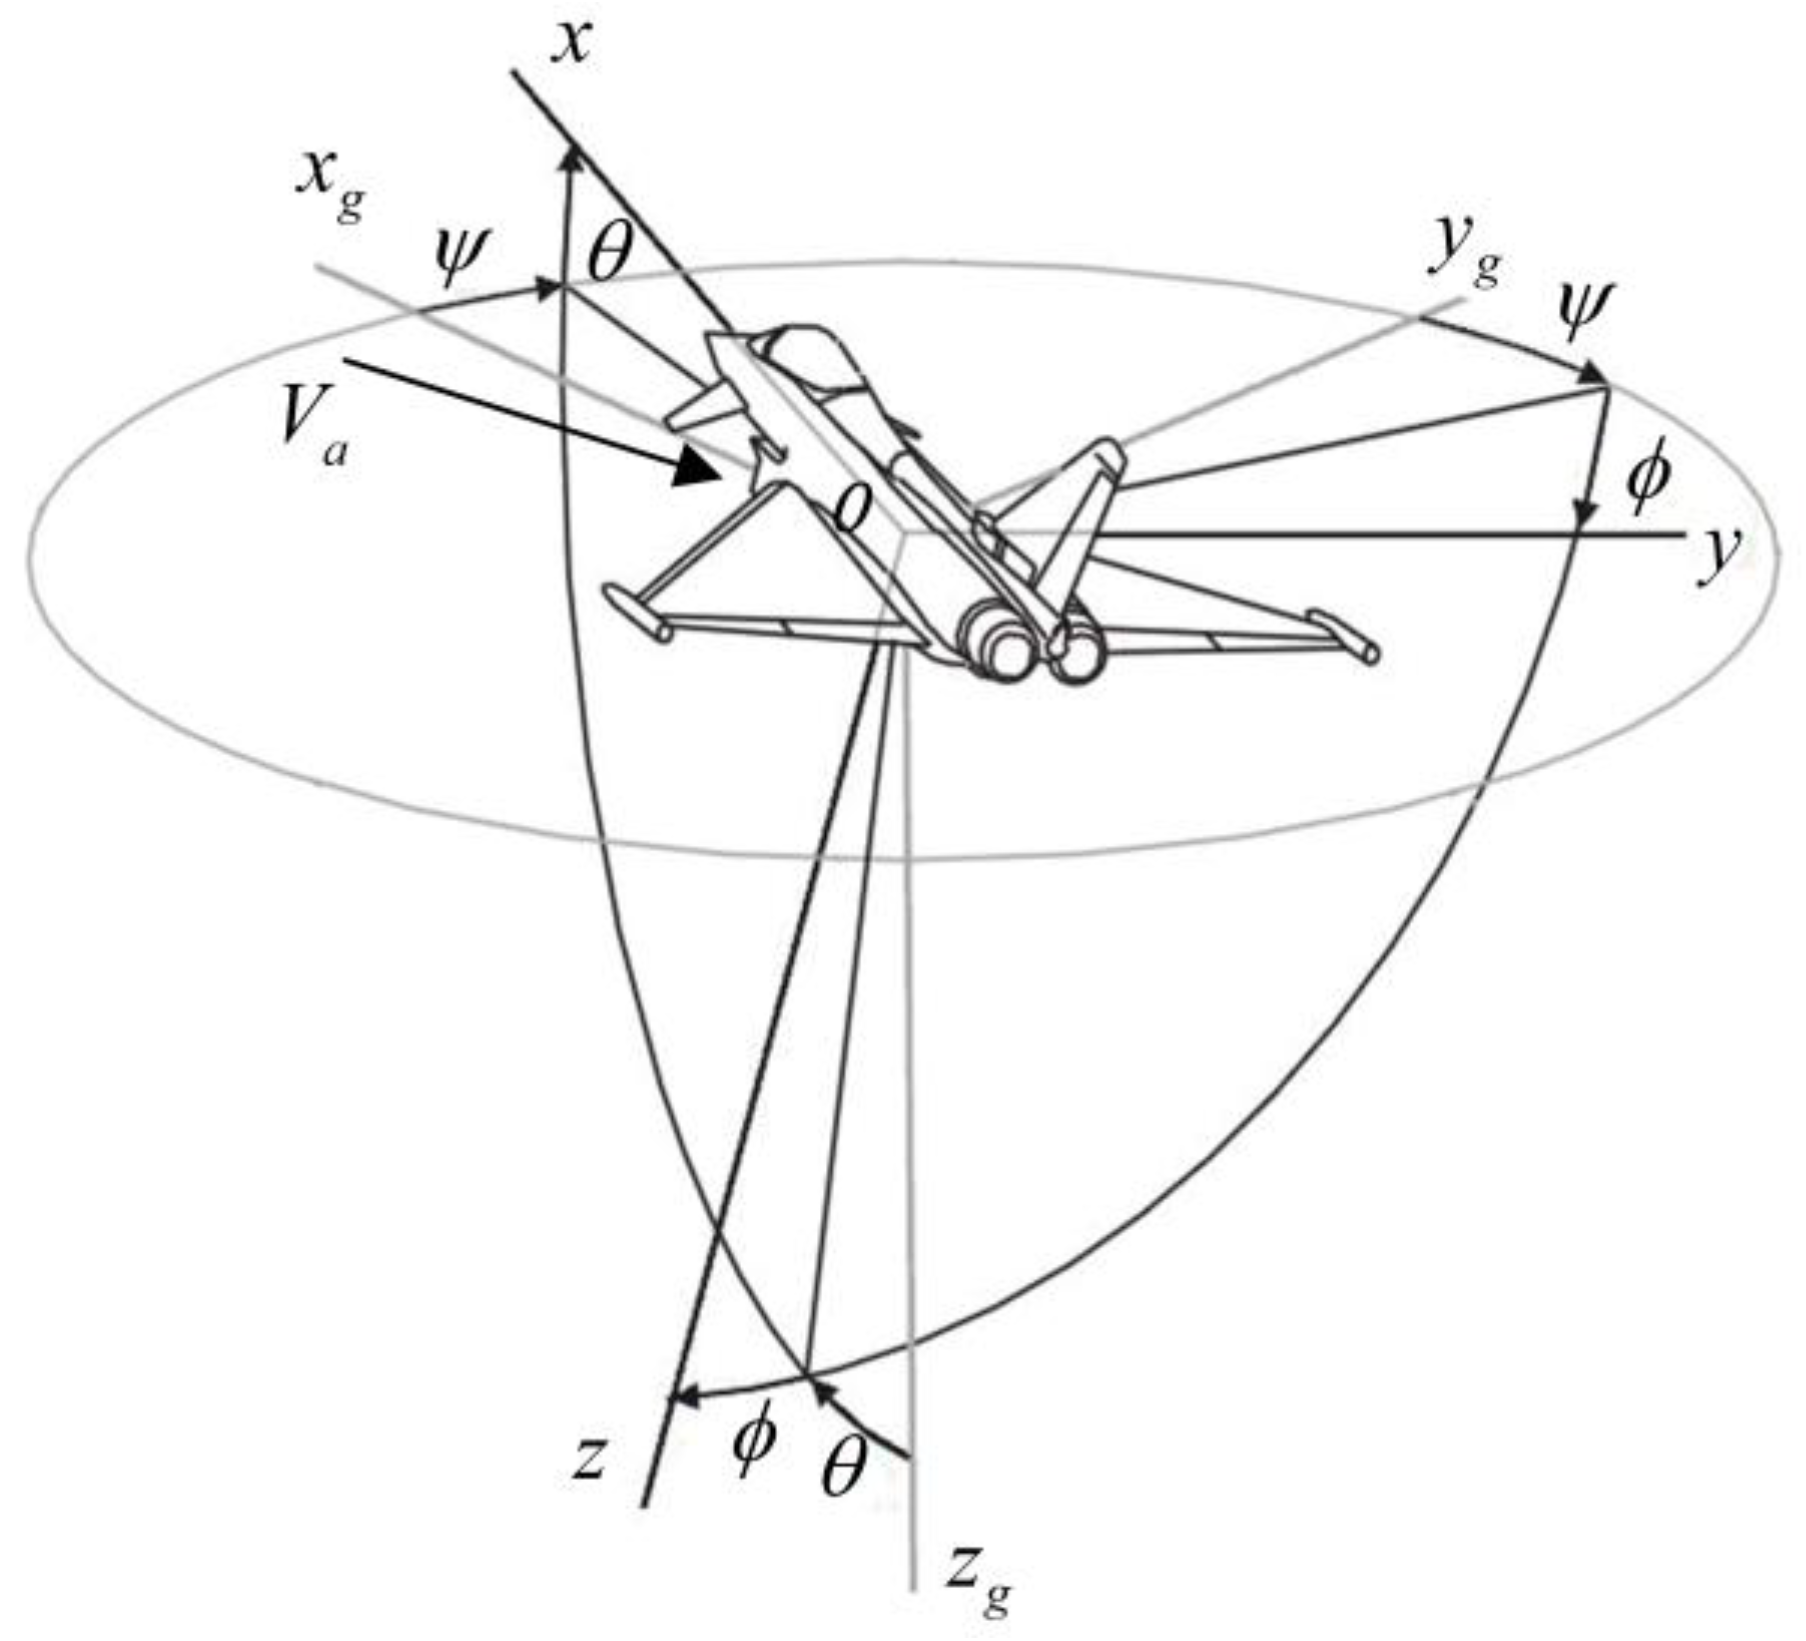
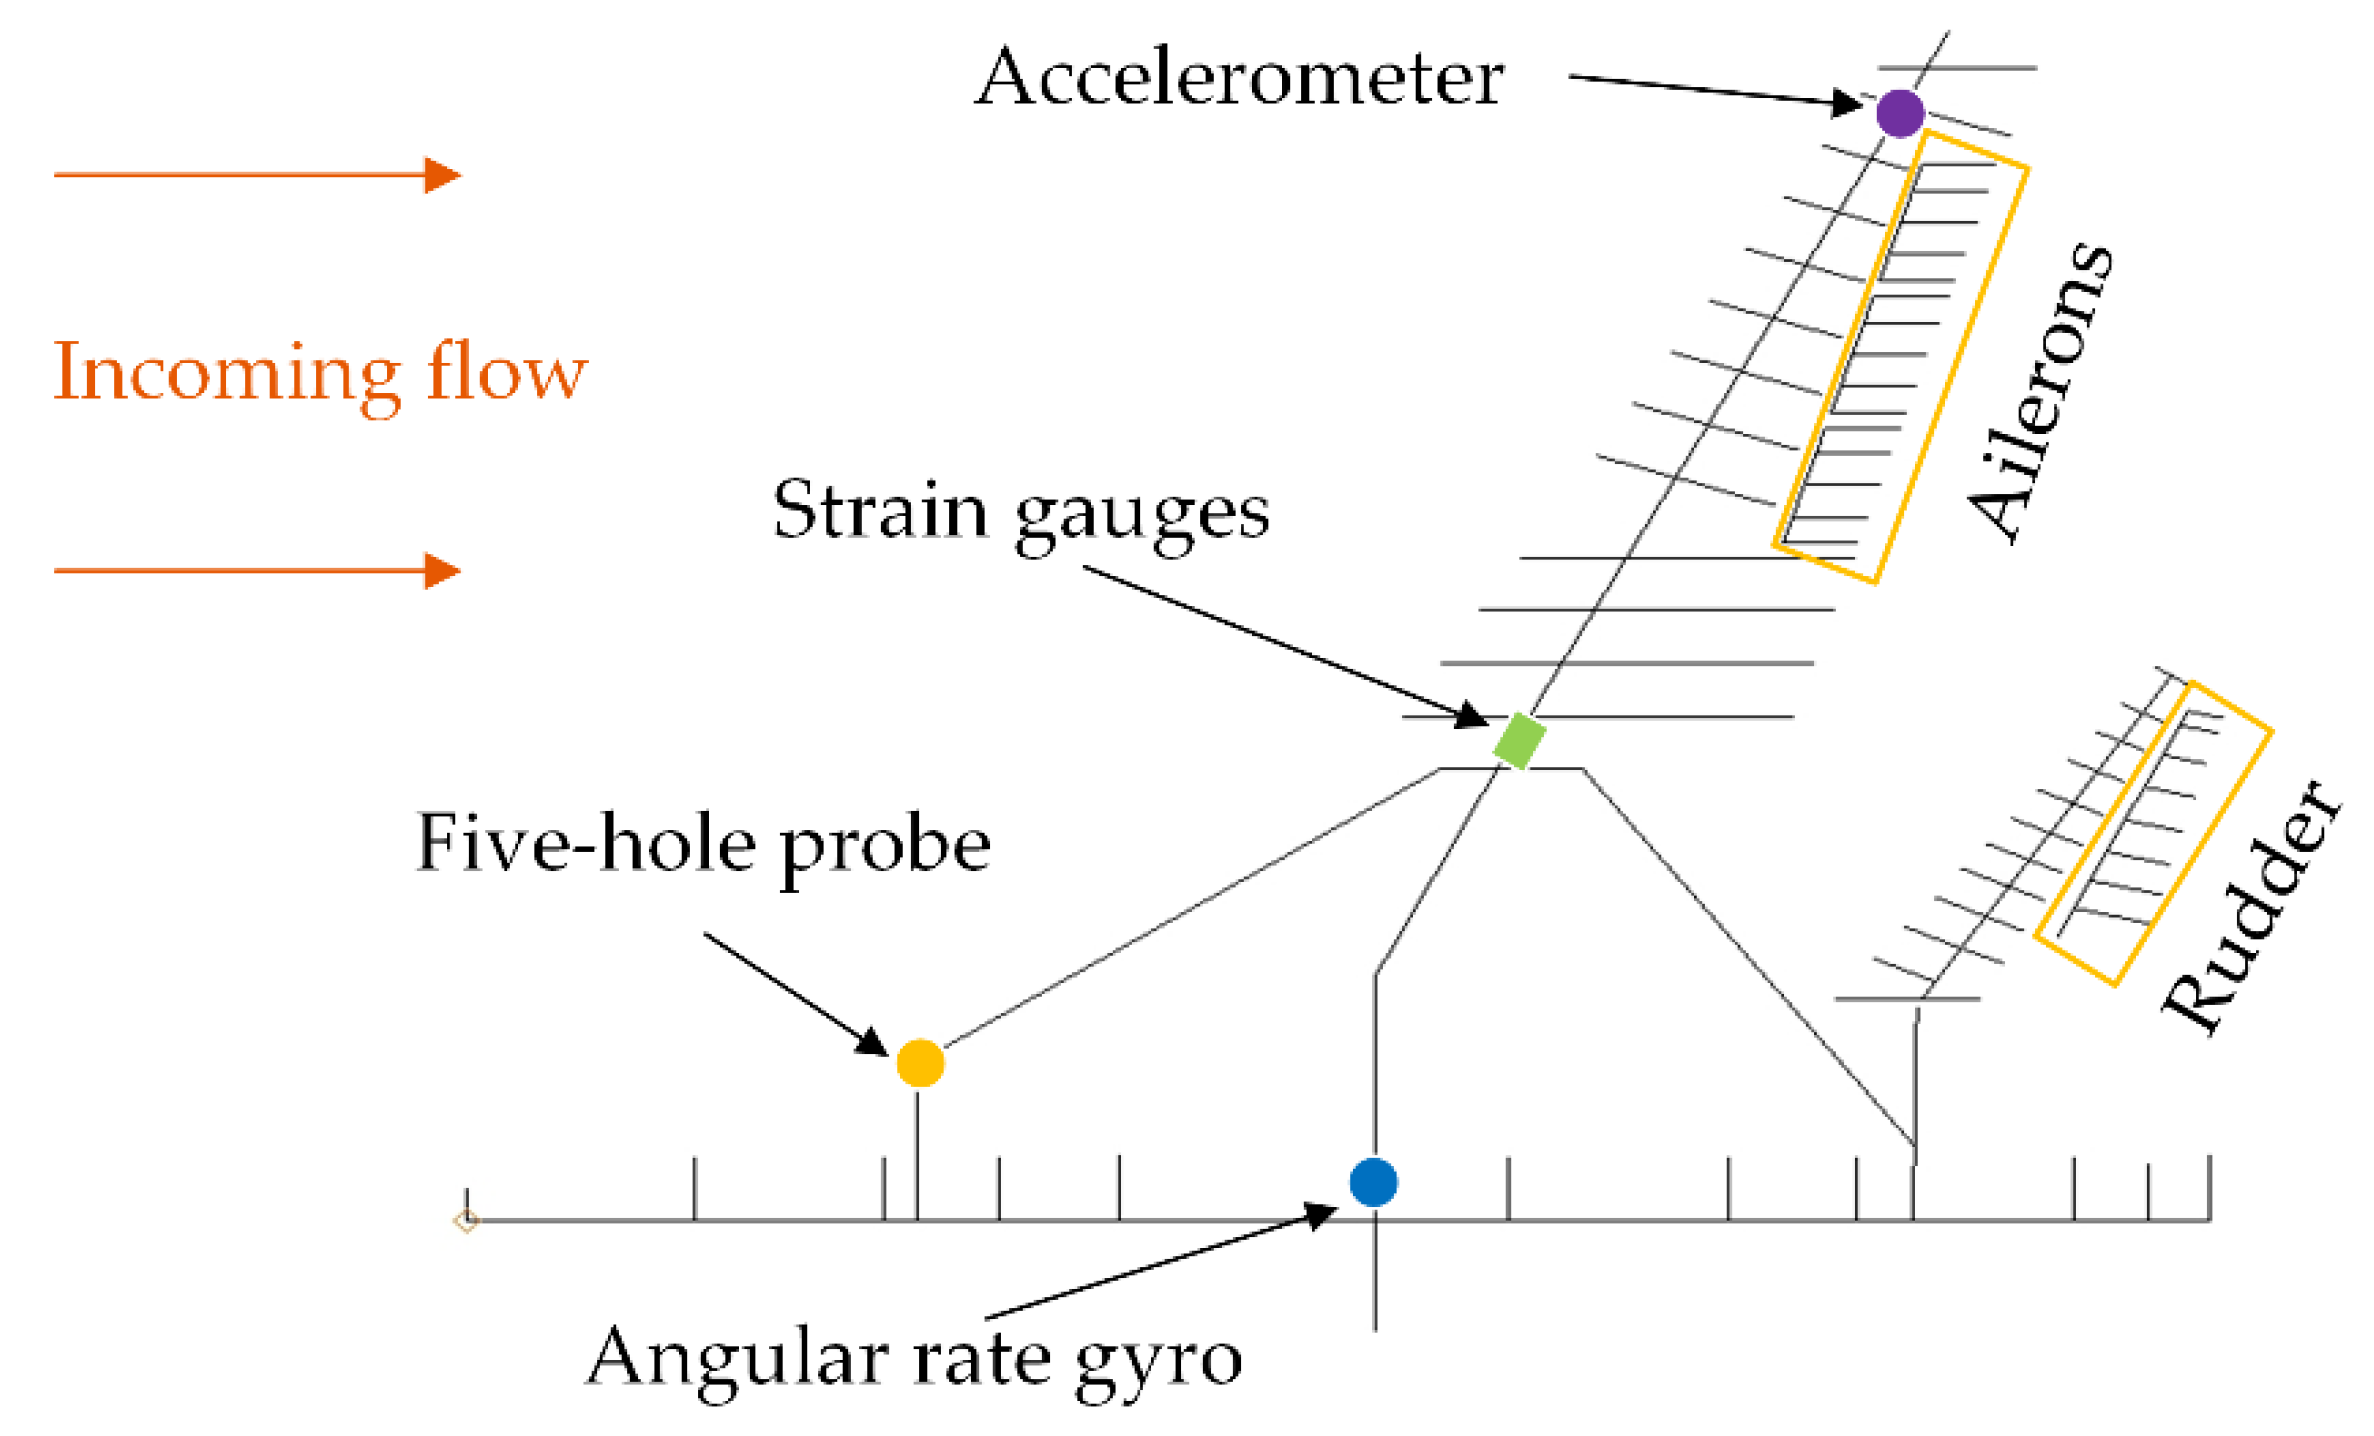
The aerodynamic forces on an aircraft are mainly determined by the relative motion between the aircraft and the atmosphere. As shown in Figure 1, consider an aircraft flying in the air with an arbitrary attitude, the airspeed V a is at a certain angle with respect to the aircraft body. The body frame is O - x y z , the ground frame is O - x g y g z g , and the attitude angles between the body frame and the ground frame are ψ , θ , and ϕ .
For a changing wind field, the change in wind speed can be regarded as the superposition of the average wind and the fluctuating wind. The average wind changes relatively slowly, and its direction and wind speed can be considered as basically unchanged within a certain period of time [36]. For the problem of gust alleviation, the main study is the influence of the fluctuating wind, i.e., gusts, on the aircraft. The wind speed of the changing wind field is expressed as V w , which can be written as
V w = V w 0 + V w g
Each component of the above equation is expressed in the ground frame, where V w 0 is the average wind speed, and V w g is the gust velocity.
During the flight, the following relationship exists between the airspeed of the aircraft V a , the ground speed V g and the wind speed of the atmosphere V w :
V a = V g V w = V g V w 0 V w g
where all variables are expressed in the ground frame. The sum of the ground speed and the average wind speed is called the steady-state airspeed V a 0 :
V a 0 = V g V w 0
To study the aerodynamic force of the aircraft, it is necessary to represent the airspeed under the body frame. The coordinate transformation matrix from the ground frame to the body frame, denoted as L b g , is expressed as follows:
L b g = cos θ cos ψ cos θ sin ψ - sin θ cos ϕ sin ψ + cos ψ sin ϕ sin θ cos ϕ cos ψ + sin ϕ sin θ sin ψ cos θ sin ϕ sin ϕ sin ψ + cos ϕ cos ψ sin θ cos ψ sin ϕ + cos ϕ sin θ sin ψ cos ϕ cos θ
The components of steady-state airspeed in the body frame can be obtained by
V x b 0 V y b 0 V z b 0 = L b g V a 0
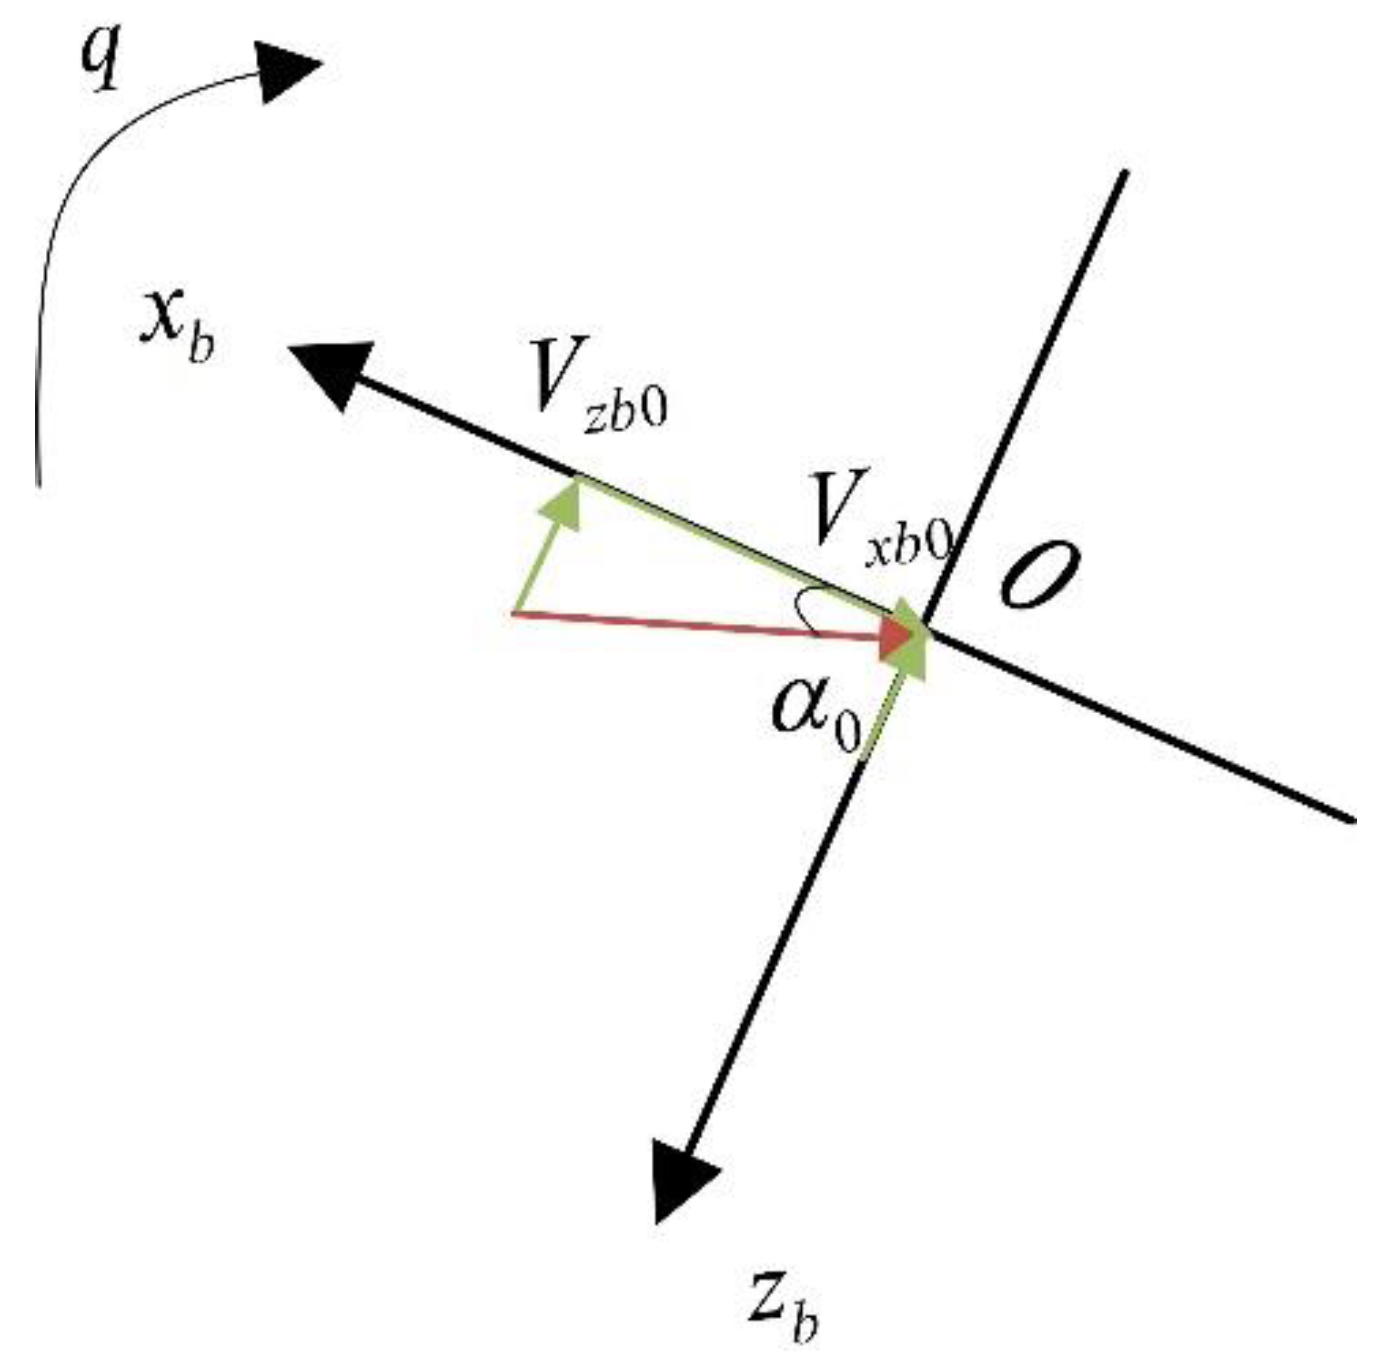
To simplify the problem, the effect of atmospheric disturbances on the aircraft can be decomposed into the longitudinal symmetry plane and the lateral plane of the aircraft. First, in the longitudinal plane, the aircraft’s angle of attack (AOA) sensor is usually mounted on the nose, and the measured aerodynamic AOA α s incorporates the effects of the steady-state airspeed, gust disturbances and aircraft pitching motion. The influence of the steady-state airspeed is expressed as α 0 and the components of the steady-state airspeed in the longitudinal plane are shown in Figure 2. The influence of gusts on the aircraft is represented by the gust AOA α w g . Due to the rotational motion of the aircraft, the AOA measured by the sensor is α r . Note that the influence of translation motion has been included in α 0 . The AOA due to gusts in the longitudinal plane can then be obtained from the following relationship:
α w g = α s α 0 α r
where α s is the local AOA measured directly by the AOA sensor mounted on symmetrical plane of the aircraft nose, and
α 0 = arctan ( V z b 0 V x b 0 )
where V x b 0 and V z b 0 are the components of V a 0 along the x-axis and z-axis of the body frame, respectively. If the additional AOA caused by the pitch rate is small, there is
α r = q x A O A V x b 0
where q is the pitch rate and x A O A is the distance from the AOA sensor to the aircraft center of gravity.
Similar to the derivation process for the longitudinal plane, the angle of sideslip (AOS) due to gusts in the lateral plane of the aircraft is:
β w g = β s arctan ( V y b 0 V x b 0 ) + r x A O S V x b 0
where V y b 0 is the component of V a 0 along the y-axis of the body frame; r is the yaw rate, and x A O S is the distance from the AOS sensor to the aircraft center of gravity.
When the aircraft is in flight, if the mean speed of the wind field is small compared to the speed of flight, then the effect of the mean wind can be ignored. Equation (3) can thus be written as
  V a 0 = V g = V g x V g y V g z
Assuming that the pitch angle of the aircraft is small and there is no roll motion (in fact, this is a very typical flight condition), then there is:
V x b 0 = cos θ cos ψ V g x + cos θ sin ψ V g y - sin θ V g z
V z b 0 = cos ψ sin θ V g x + sin θ sin ψ V g y + cos θ V g z
V = V g x 2 + V g y 2
where V is the projection of ground speed in the horizontal plane. Furthermore,
V z b 0 V x b 0 = sin θ V + cos θ V g z cos θ V sin θ V g z tan θ + V g z V
because the pitch angle is small and V g z is usually much smaller than V. Thus, Equation (7) can be rewritten as
α 0 = θ + V g z V
This equation implies that the steady-state AOA of the aircraft is composed of the pitch attitude of the aircraft and the AOA induced by the vertical motion. If the height of the aircraft is represented by H , then there is V g z = H ˙ . Thus, the final simplified method of gust calculation in the longitudinal plane of the aircraft can be expressed as
α w g = α s θ + H ˙ V + q x A O A V
In this paper, the gust calculation method determined by this equation will be used as the basis for the research.

3. Wind Tunnel Test of Gust Calculation
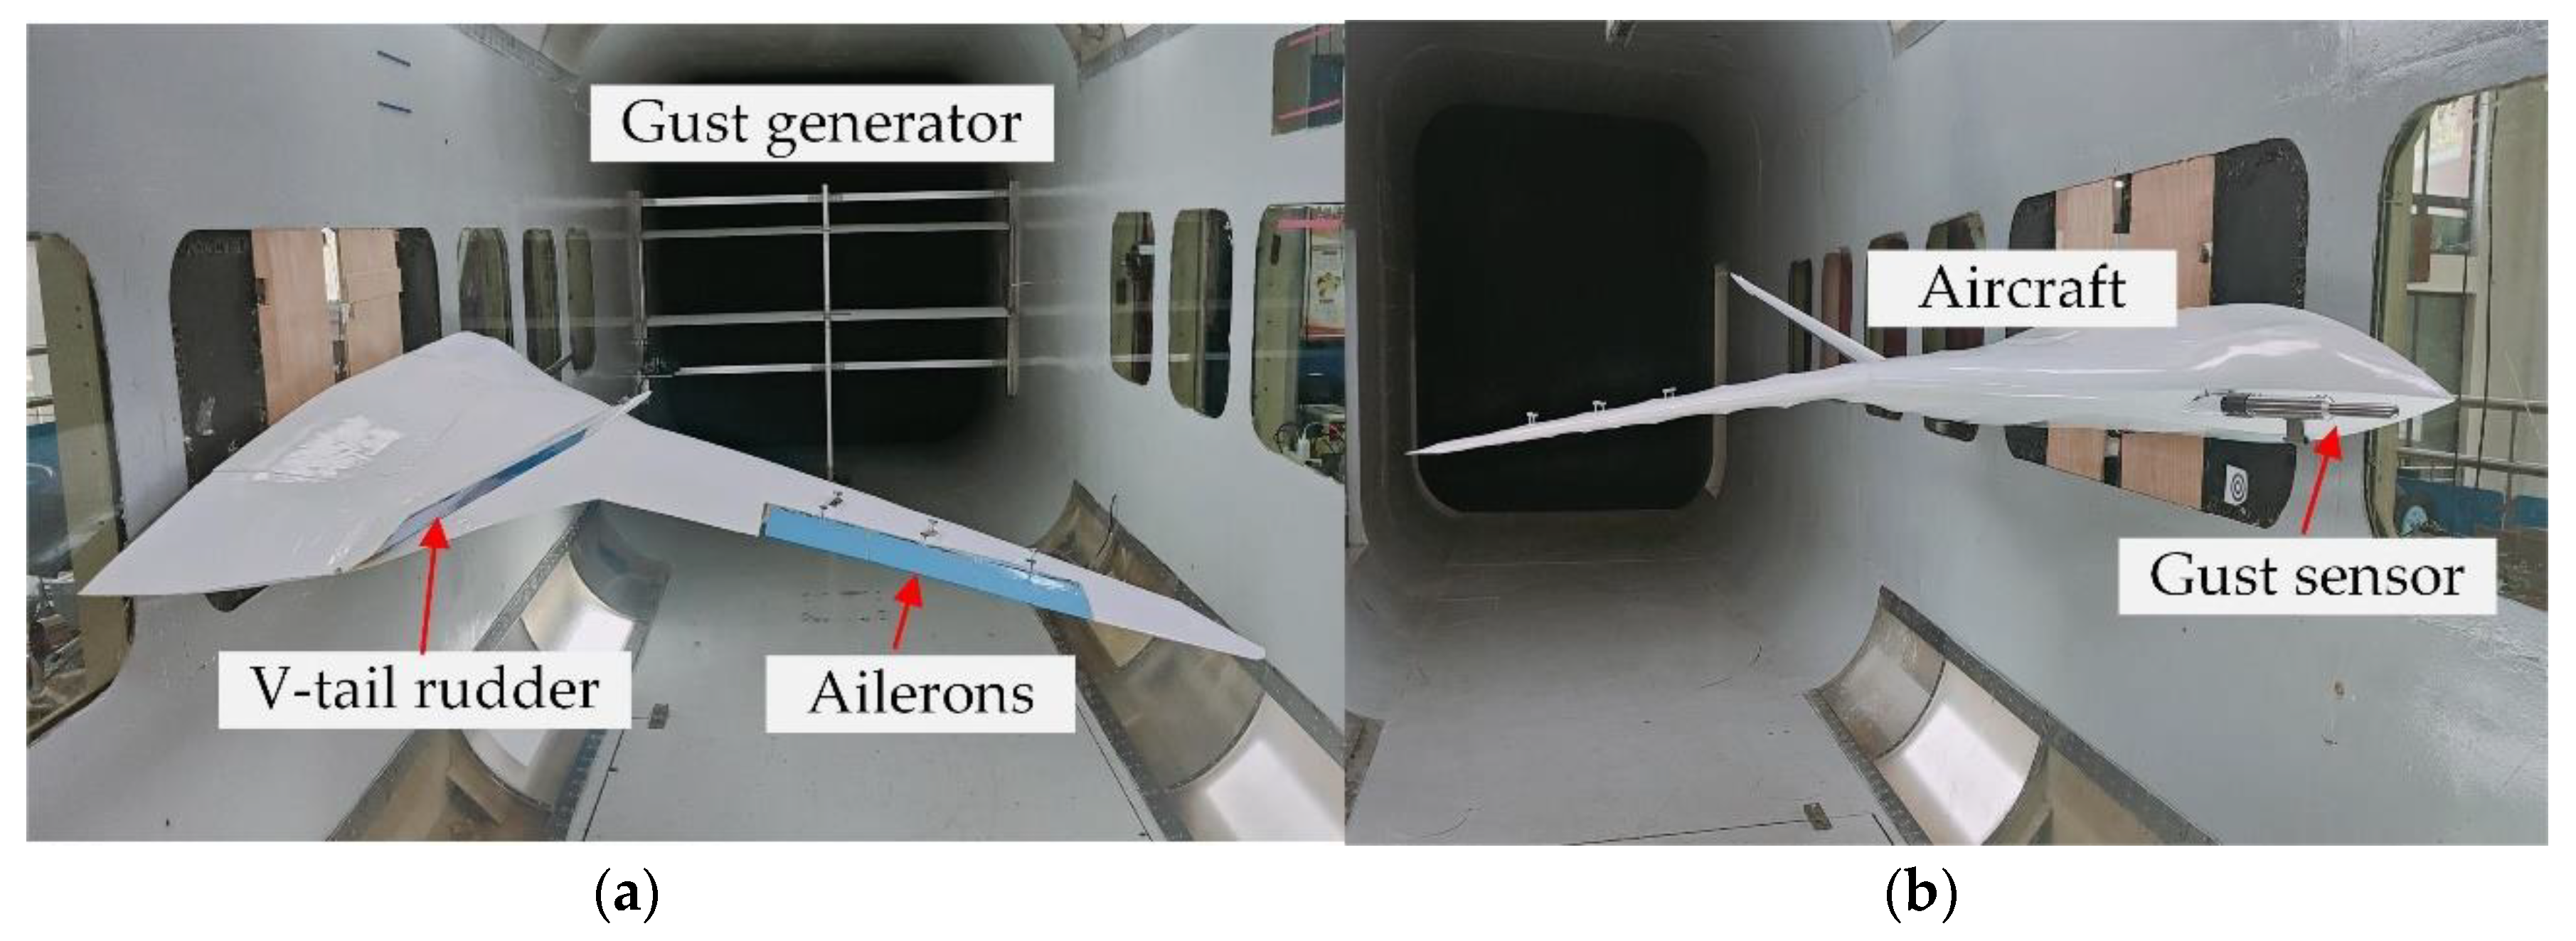
As shown in Figure 3, a wind tunnel test was designed to demonstrate the gust calculation method described in Equation (16). The main equipment includes a gust generator; a five-hole probe, which is used to measure flow field parameters such as AOA and wind speed, and a plunging–pitching motion device, which is used to provide rigid body motion to simulate the plunging and pitching motion of the aircraft. The motion speed could be freely controlled by a computer.

3.1. Gust Generator Design

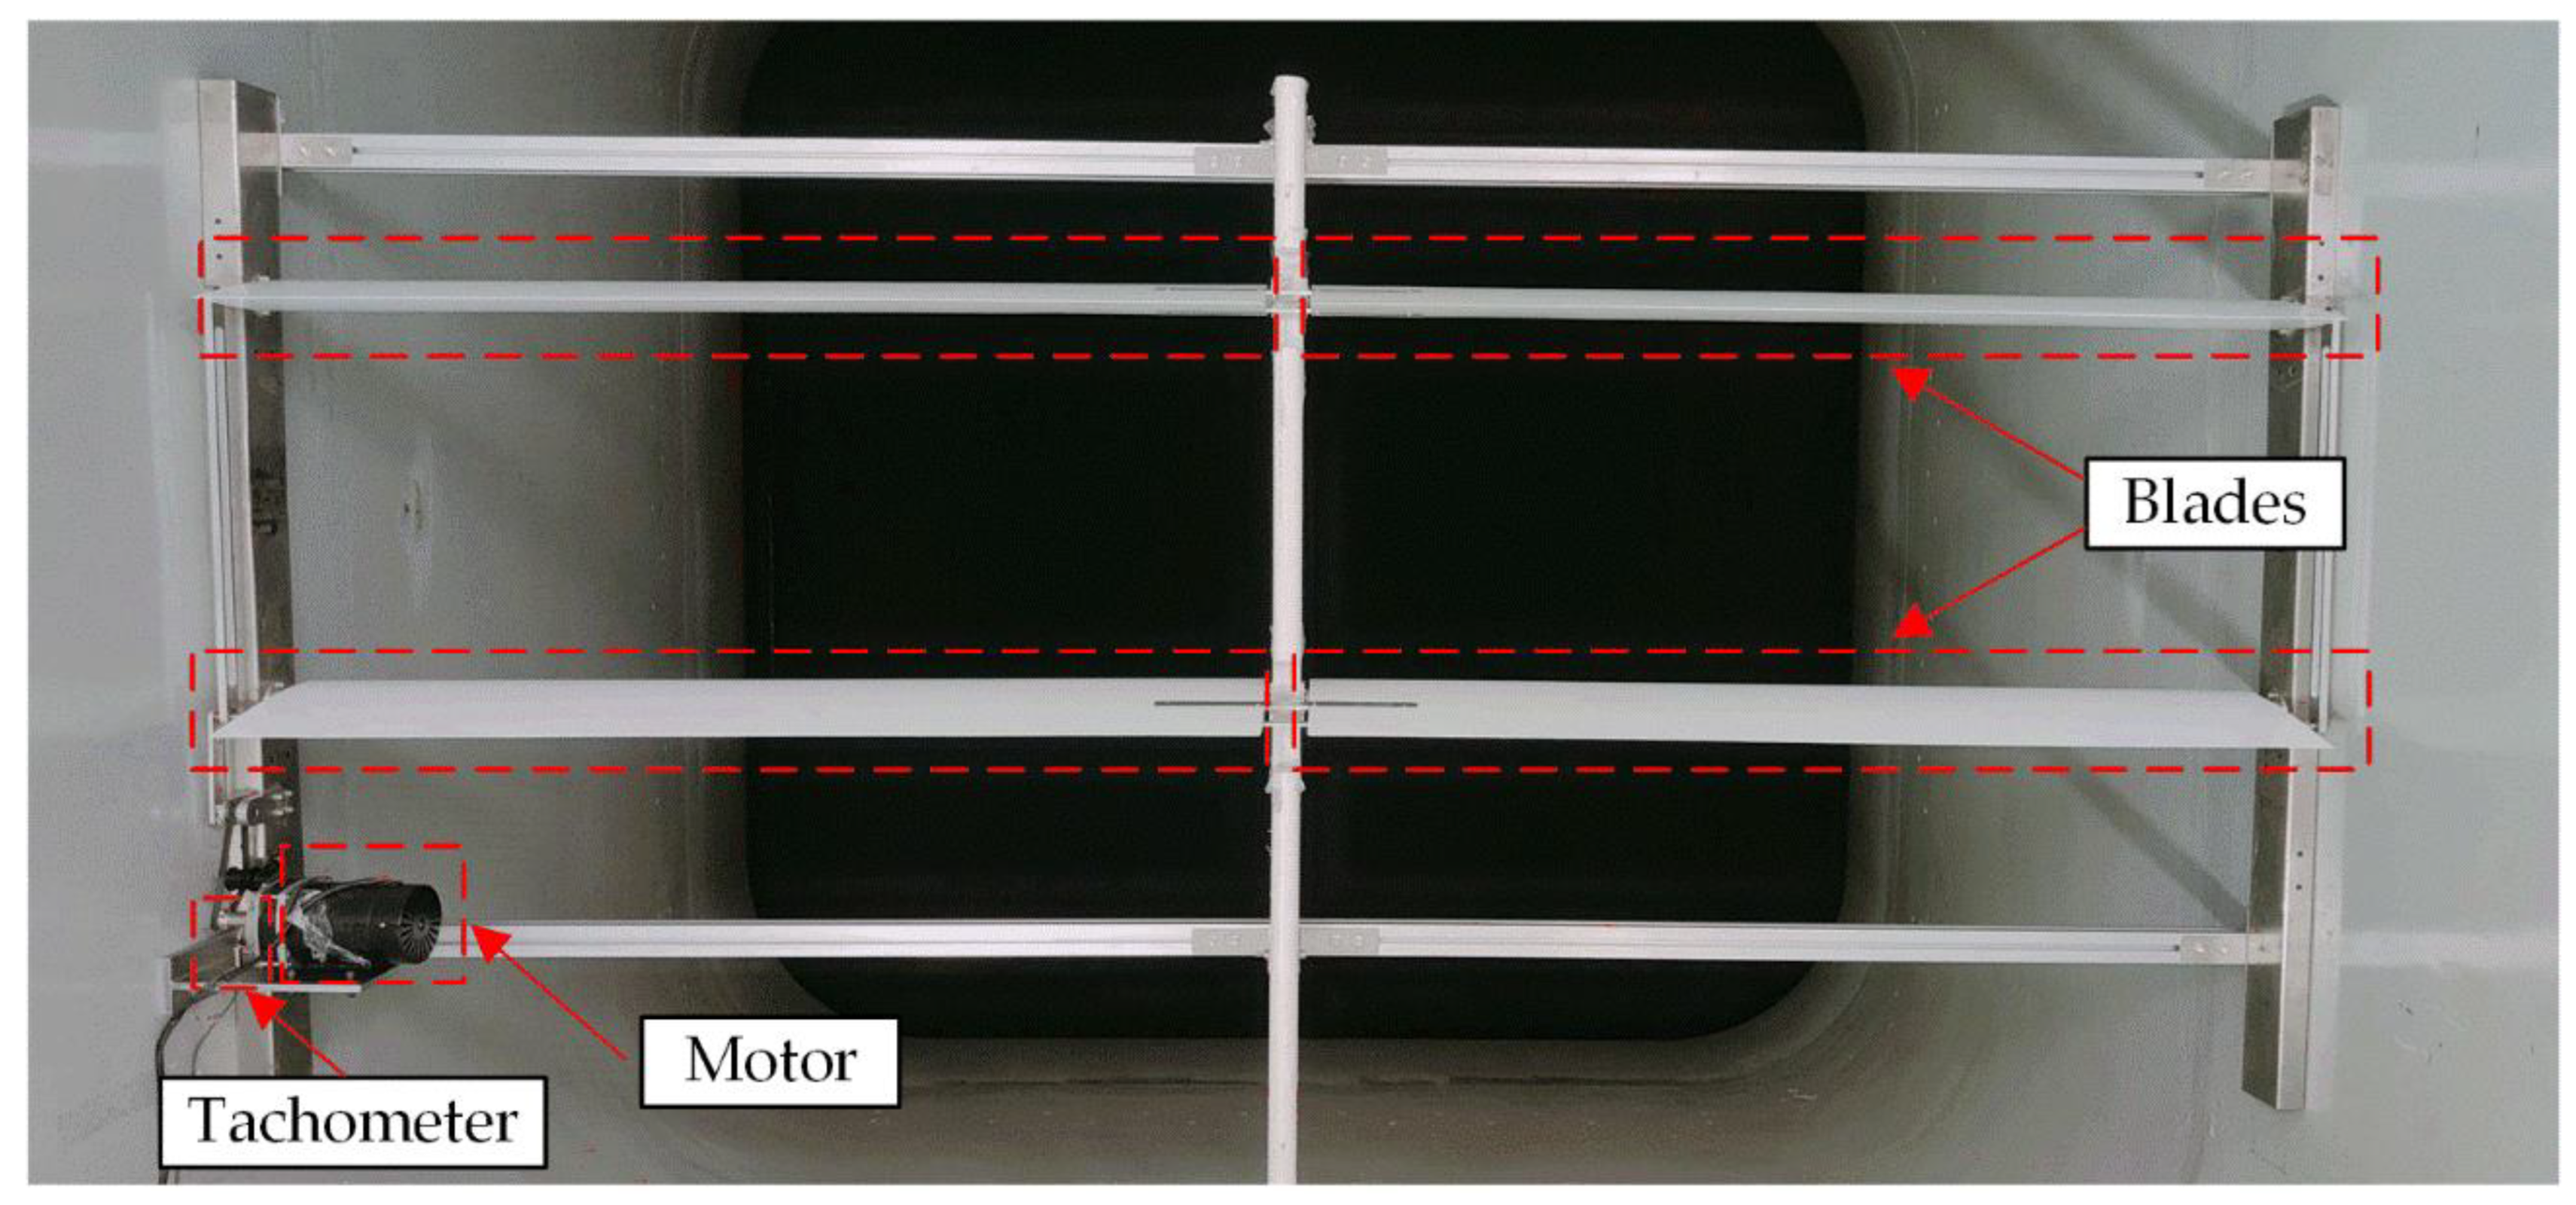
In the wind tunnel testing, a gust generator was designed to disturb the flow field. The main components of the gust generator (Figure 4) disturbing the flow field are four blades, which are divided into upper and lower groups. The blade profile is made of honeycomb composite material, and the blade shaft is a carbon-fiber cylinder. The application of composite material results in a lighter mass and a lower rotational inertia of the blades. Each blade has a span of 1.40 m, the airfoil follows the NACA0015 profile, the chord length is 0.30 m, and the total width of the gust generator is 2.80 m. A DC motor drives the blade deflection to disturb the flow field, and a tachometer to measure the rotational speed is installed near the motor. The designed gust generator was positioned 5.3 m ahead of the five-hole probe in the wind tunnel test. It can generate harmonic gusts with a frequency range of 1–6 Hz. The mathematical expression of such gusts is
w g = w m sin ( 2 π f t )
where w m is the gust amplitude and f is the gust frequency. 
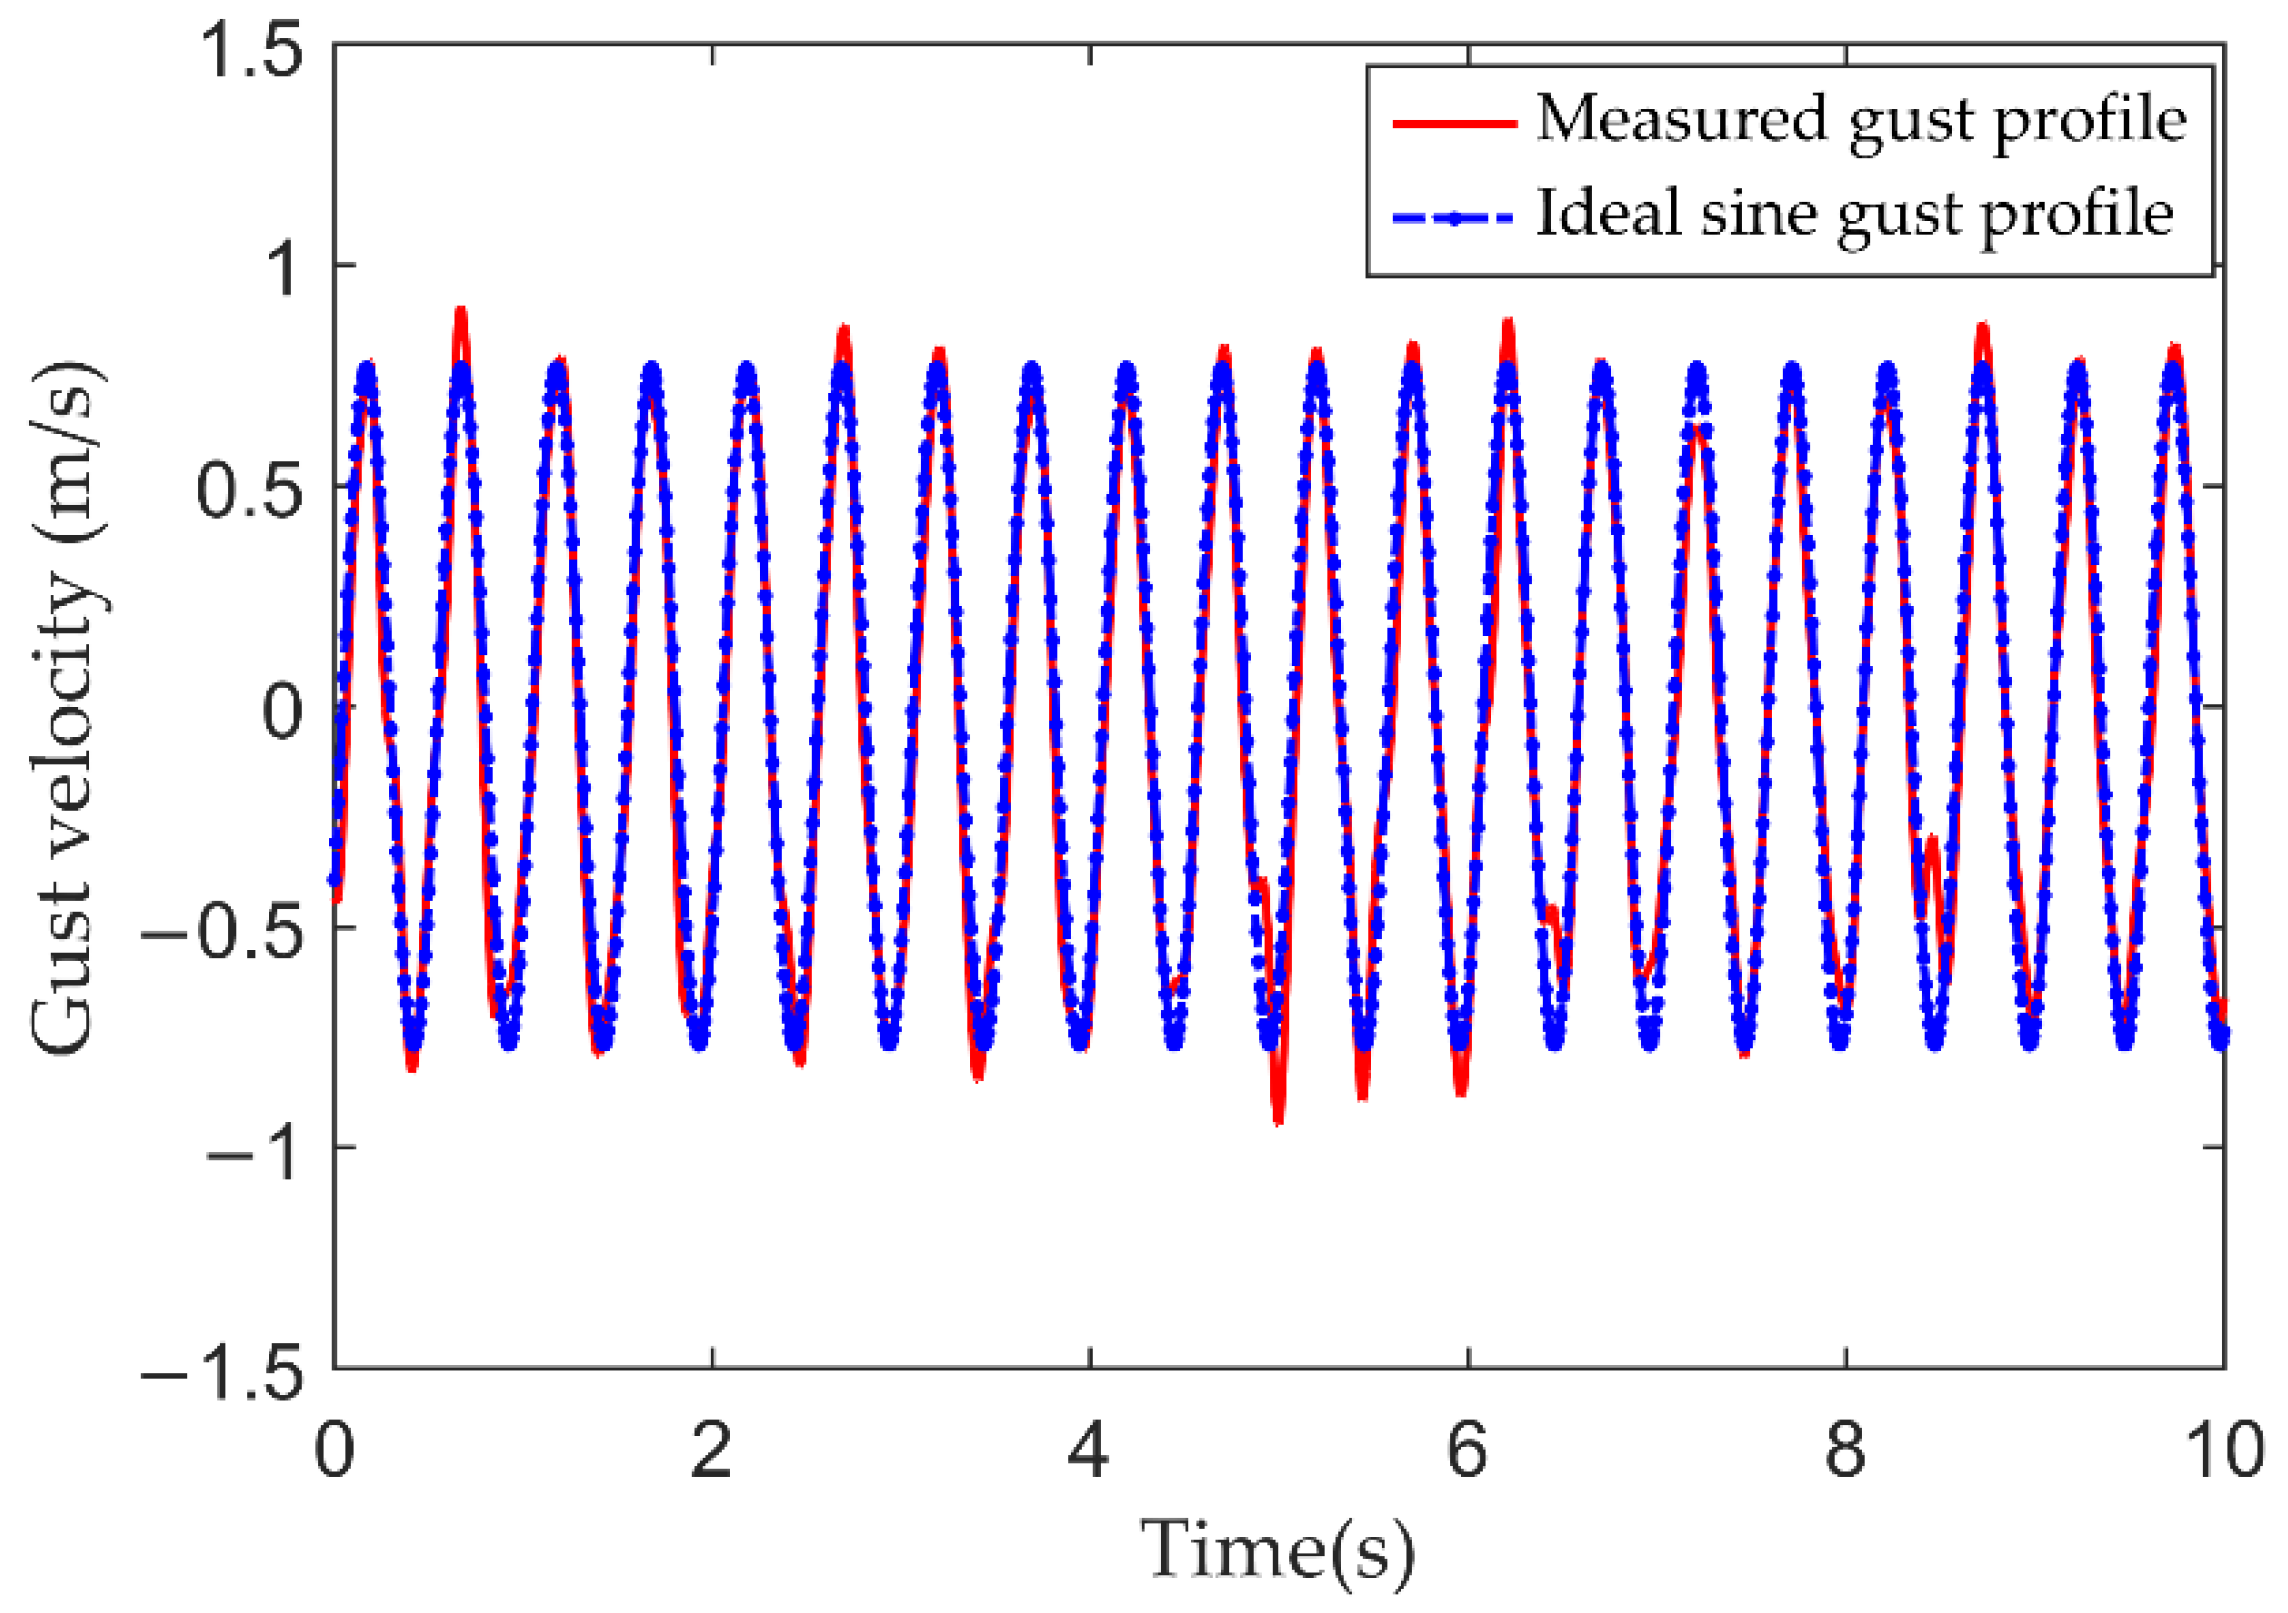
Figure 5 shows the ideal sine gust profile and measured gust profile with a frequency of 2.0 Hz. The actual gust variation trend is very close to a sine curve of the same frequency. The gust amplitude fluctuates, mainly because the incoming flow velocity of the wind tunnel is not strictly constant.

3.2. Gust Sensor and Plunging–Pitching Motion Device

During the test, a five-hole probe (Figure 6) was used to measure the gusts in the wind tunnel flow field. The measured gusts were processed and used as the input signal for the FFCS. The five-hole probe is capable of measuring various aerodynamic parameters, such as the AOA, AOS, and wind speed. When compared with flow vane sensors, this type of device has no mechanical friction and rotation overshoot, so it has higher measurement accuracy and faster dynamic characteristics, making it more suitable for measuring rapidly changing gusts.
The longitudinal motion of the aircraft can be divided into plunging motion and pitching motion. The main objective of the gust calculation is to remove the AOA caused by these two types of motions from the measured AOA, thereby obtaining a pure gust AOA. To simulate both types of motion, a device with rotational and translational degrees-of-freedom was designed. To minimize the interference of the motion device on the flow field at the location of the five-hole probe, and to simulate the probe being installed on the nose of aircraft, the five-hole probe was connected to the two-degrees-of-freedom motion device using a bracket. The plunging–pitching motion device is shown in Figure 7.
The plunging–pitching motion device is composed of a sliding platform and a rotating disc. A DC servo motor drives the sliding platform up and down through a screw, and the motion displacement is measured by a pull-wire displacement gauge. A disc is installed on the sliding platform and is driven by another motor. The angle of rotation is measured by a built-in angular displacement sensor. The device has a maximum travel of 450 mm in the plunging direction and a maximum speed of 60 mm/s; the pitch angle could be set arbitrarily as desired, with a maximum pitch rate of 30 ° / s . The plunging motion and pitching motion could be controlled independently to enable different combinations of plunging movements and pitching movements.
At the same time, to calibrate the measurement accuracy of the five-hole probe and verify the gust calculation accuracy, a hot-wire anemometer was used. A double-wire X-type probe was installed on the motion device. It is capable of measuring the wind speed in two directions simultaneously: the horizontal incoming wind speed and the vertical wind speed. The hot-wire probe is at the same height as the head of the probe and at the same distance from the gust generator.

3.3. Sensors Signals Fusion Method

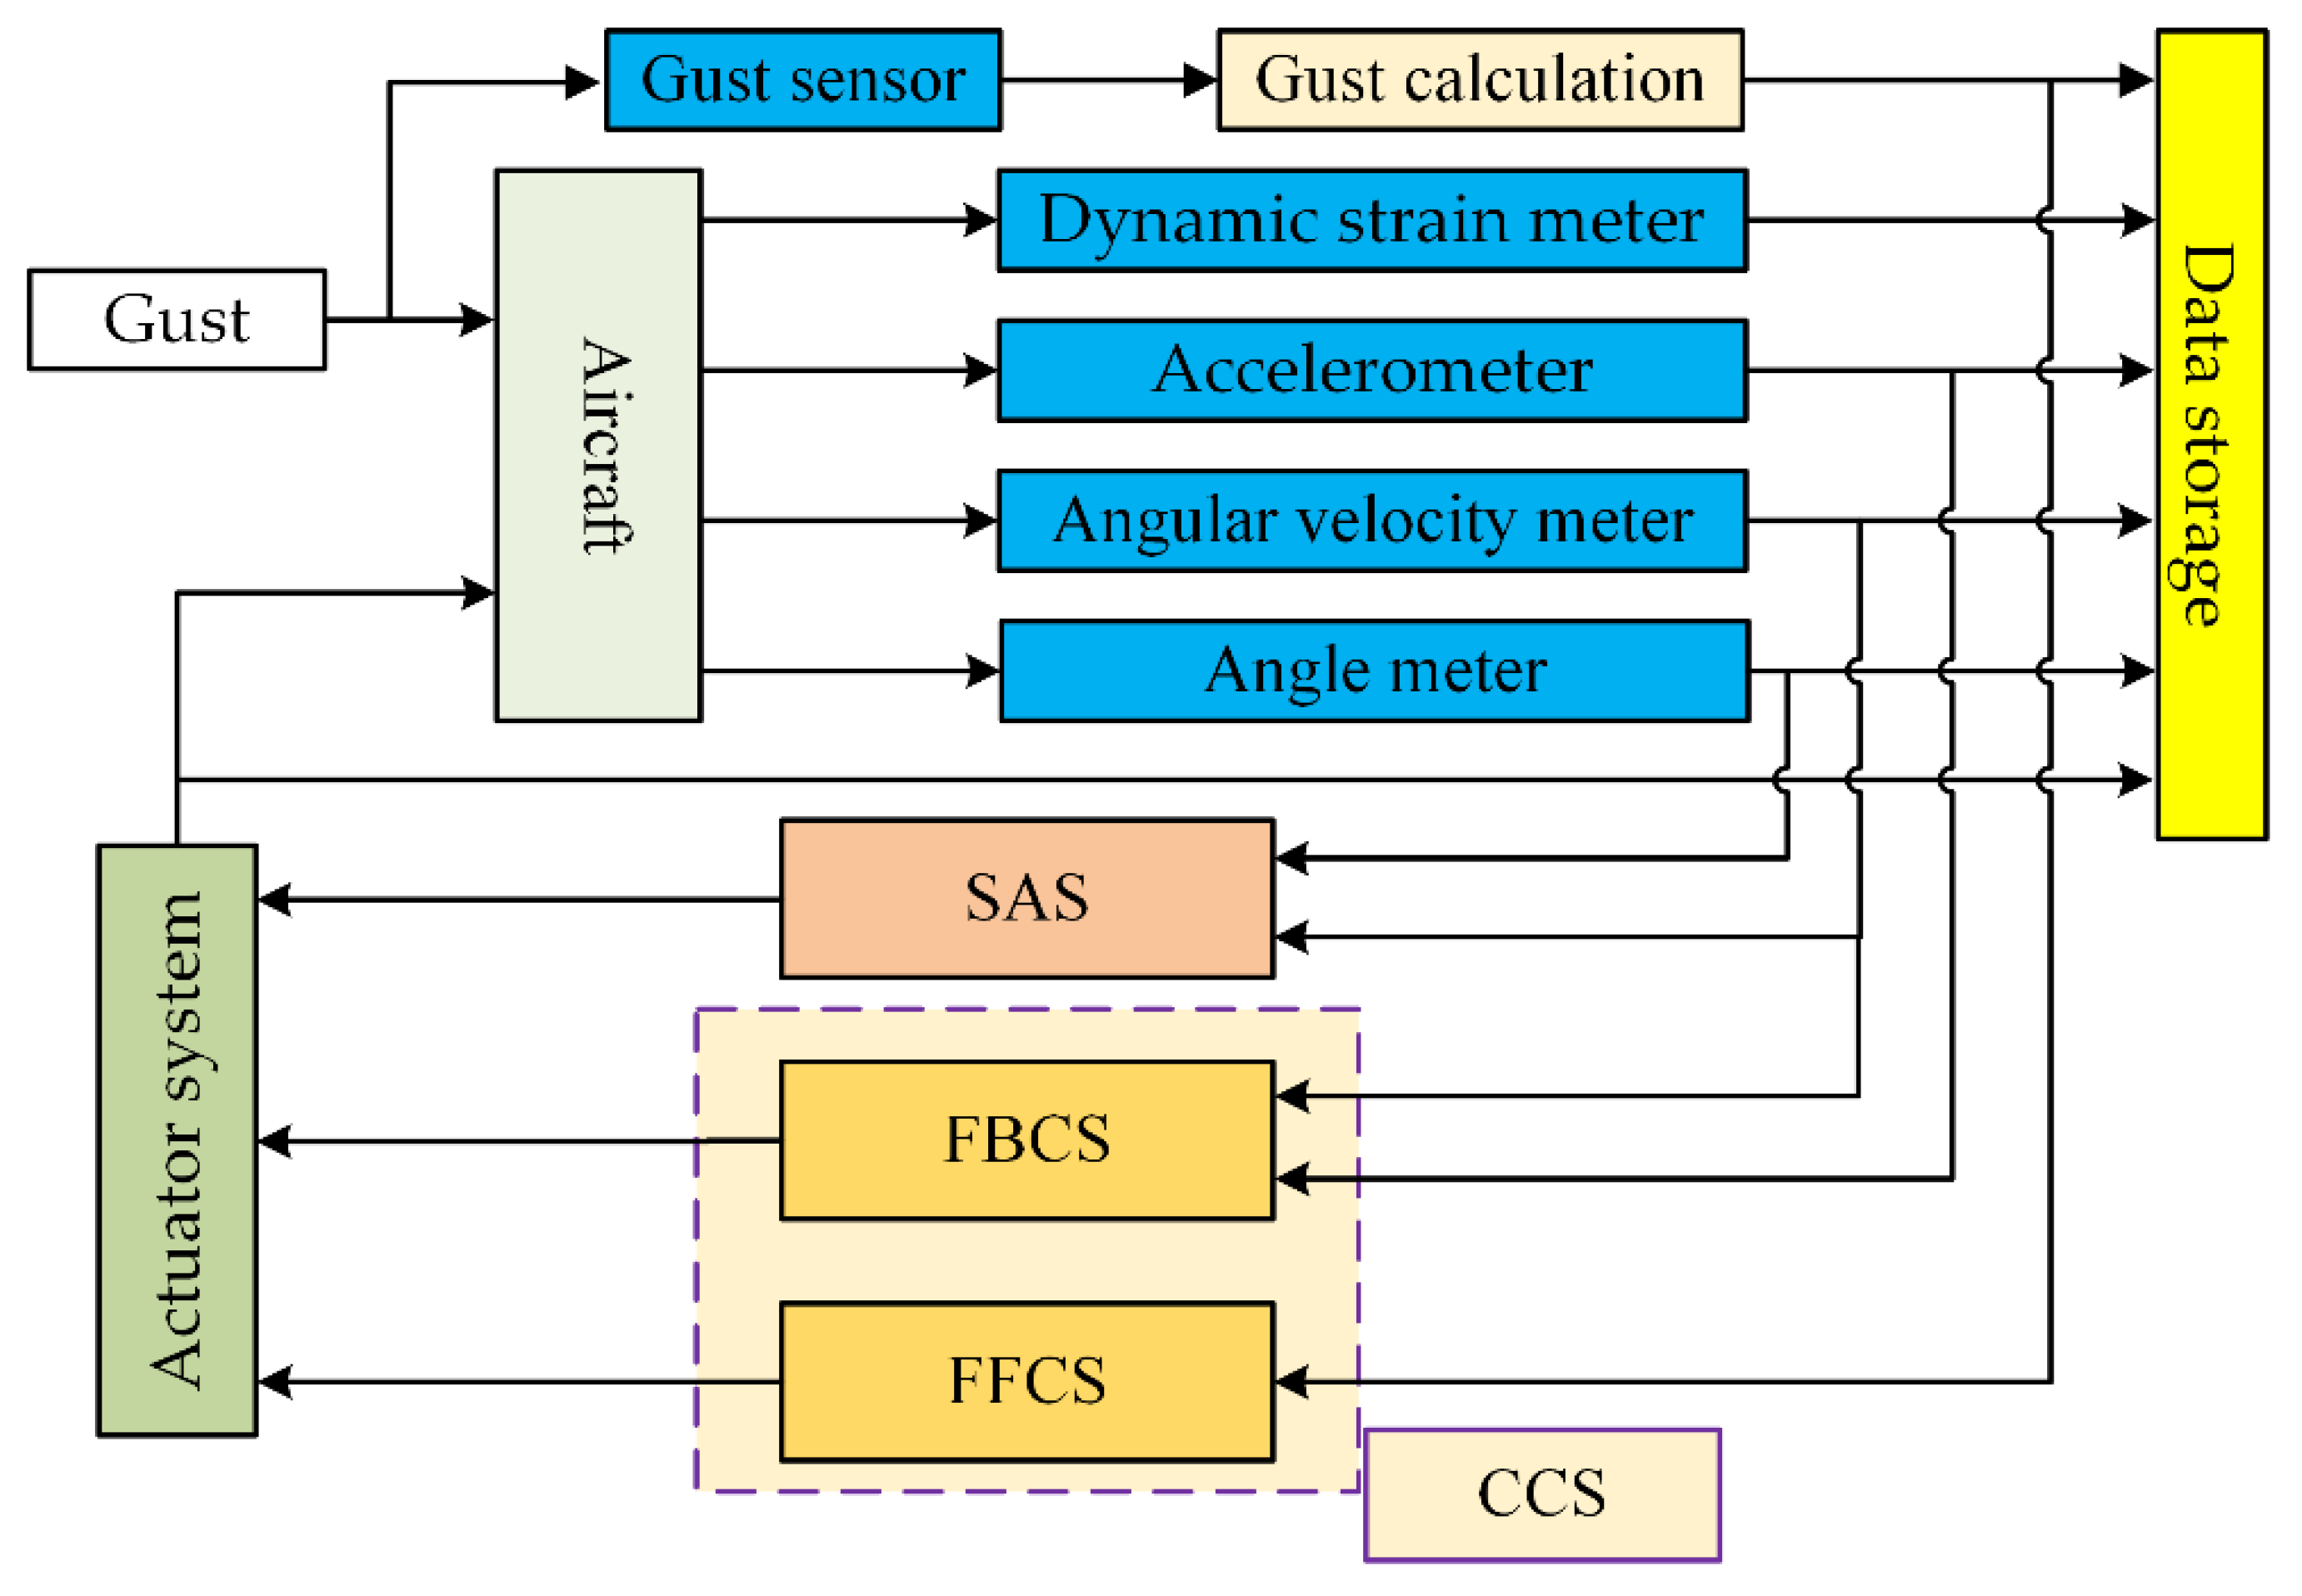
For the actual implementation of the gust calculation, the calculation method based on Equation (16) requires further processing. 
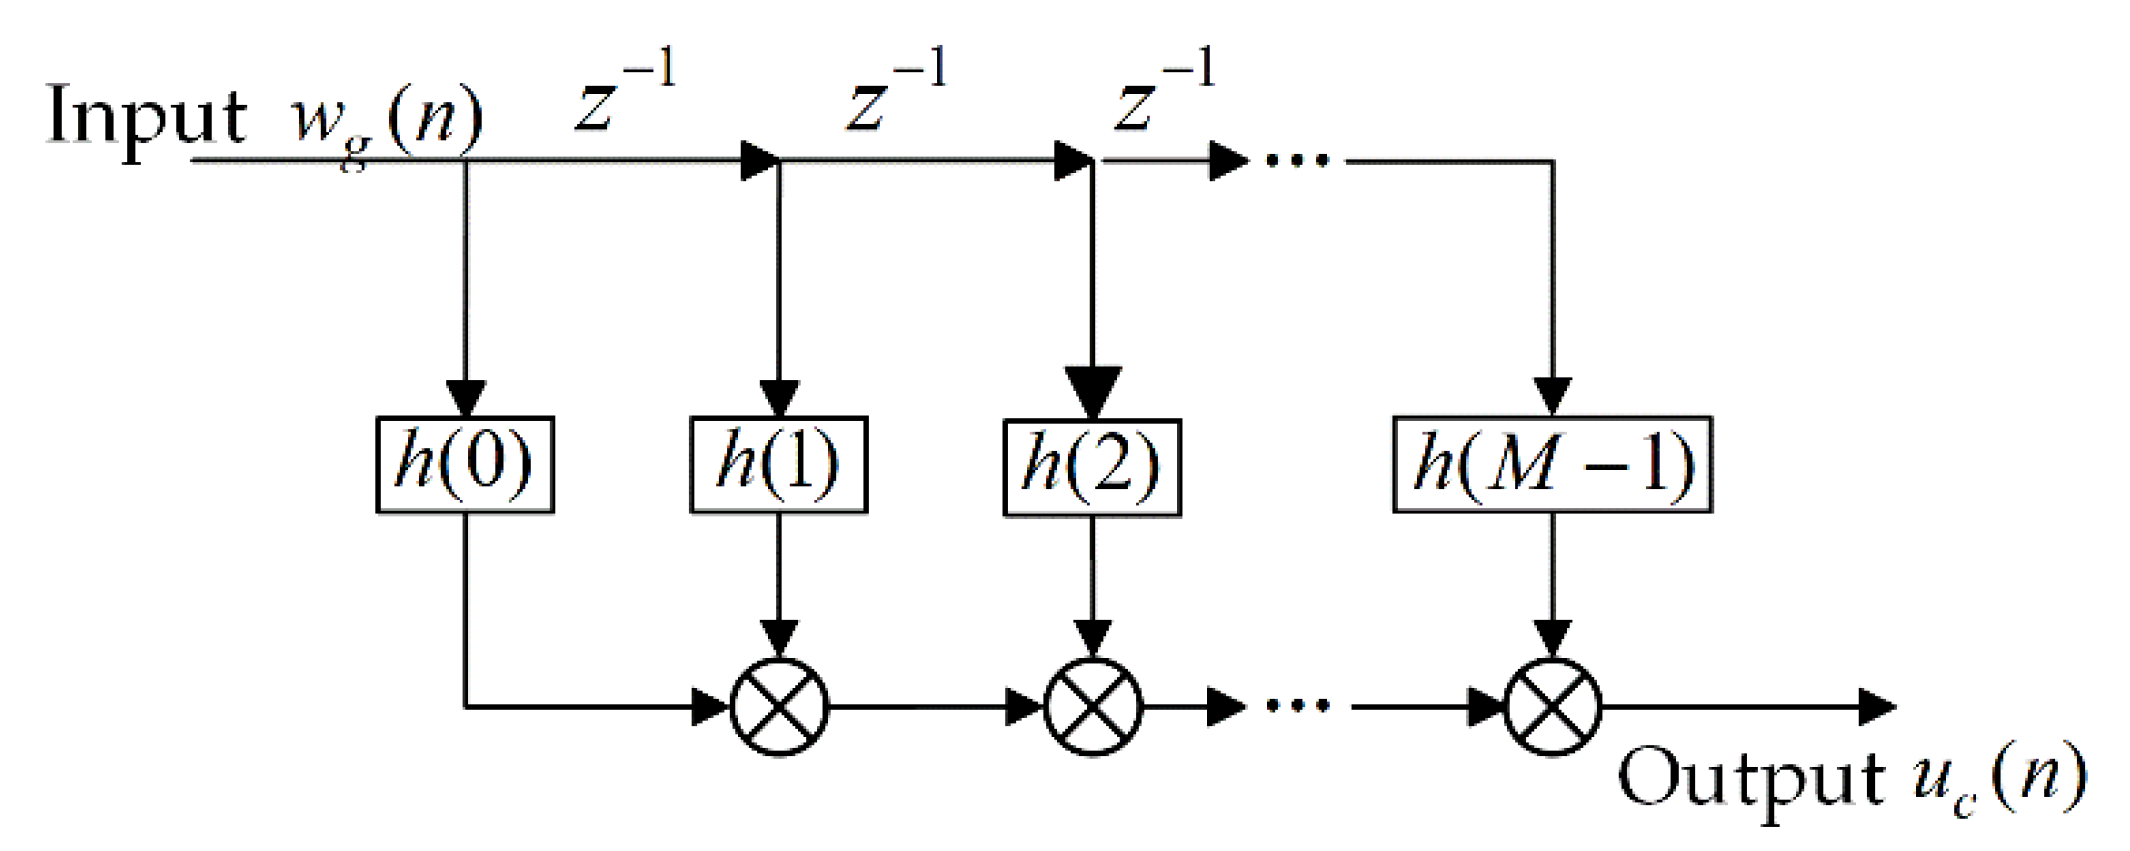
Figure 8 provides a detailed block diagram of the gust calculation, showing the physical quantities involved in the calculation and the corresponding measurement sensors. After obtaining data from the sensors, it is necessary to filter the signals and synchronize them in the temporal dimension. L i ( s ) represents the low-pass filter used to filter out unexpected high-frequency components, such as noise. The sensor used to detect the gusts is usually installed at the nose of the aircraft, so the measured signal may be affected by the bending mode of the fuselage. However, the frequency of the bending mode of the fuselage is generally higher than the gust frequency of concern. The influence of the bending mode of the fuselage can be eliminated by setting the appropriate parameters of the filter L 1 ( s ) .
Due to the independent acquisition of each channel of the measurement and control system, especially the different characteristics of various sensors, the collected signals will not be fully synchronized. For gust calculation, it is essential to synchronize the measured signals before fusing them for calculation. T d i represents the delay module that coordinates the time difference between the signals collected by the individual sensors, by which the multiple signals measured remain synchronized in the computer system, thus ensuring the accuracy of the calculated gust signal.
In this study, the cross-correlation method is used to determine the delay between the various signals, and thus to synchronize the signals. For two related signals, x ( n ) and y ( n + m ) , where m is an integer, their cross-correlation function λ ( n , m ) [37] is
λ ( n , m ) = r x y ( n , m ) r x x ( n ) , r y y ( n + m )
where
r x y ( n , m ) = p = 0 n x ( p ) y ( p + m )
r x x ( n ) = p = 0 n x 2 ( p )
r y y ( n + m ) = p = 0 n y 2 ( p + m )
The cross-correlation function reaches its maximum when m corresponds to the time-delay τ between two signals. That is, the time delay can be estimated as
τ ^ = arg { max m [ λ ( n , m ) ] }
The closer the value of the cross-correlation coefficient is to 1, the more correlated the two signals are and the closer the signals are to being in phase.

3.4. Analysis of Gust Calculation Test Results

In the gust calculation testing, the five-hole probe transmits the pressure difference between the holes at the head of the probe into the internal pipe, and then converts the pressure signal to an electrical signal. This process leads to a relatively large delay. The delays of other sensors are generally small (of the order of microseconds), and the signals measured among these sensors can be considered synchronized. Due to pitch, the AOA in the test is the largest proportion of the total AOA measured by the probe, and the general trend of the change of the AOA measured by the probe is basically consistent with the pitch angle. From the perspective of phase, the AOA output by the probe lags behind the pitch angle output by the angular sensor. To determine this time difference exactly, it is necessary to calculate the correlation coefficients, between the pitch angle and the AOA, corresponding to different time delay step numbers (TDSN), as shown in Figure 9.
Different TDSNs are assigned to the T d 1 in Figure 8 to calculate the gust AOA, and the root mean square J of the calculated gust AOA in a certain time range is used as an index for measuring the quality of the calculation. Smaller value of the index indicates that the calculated gust AOA is closer to the true gust AOA. The index is obtained by:
J = 1 N i = 1 N α w g 2 ( i )
where α w g ( i ) is the calculated gust AOA at the i -th time step.
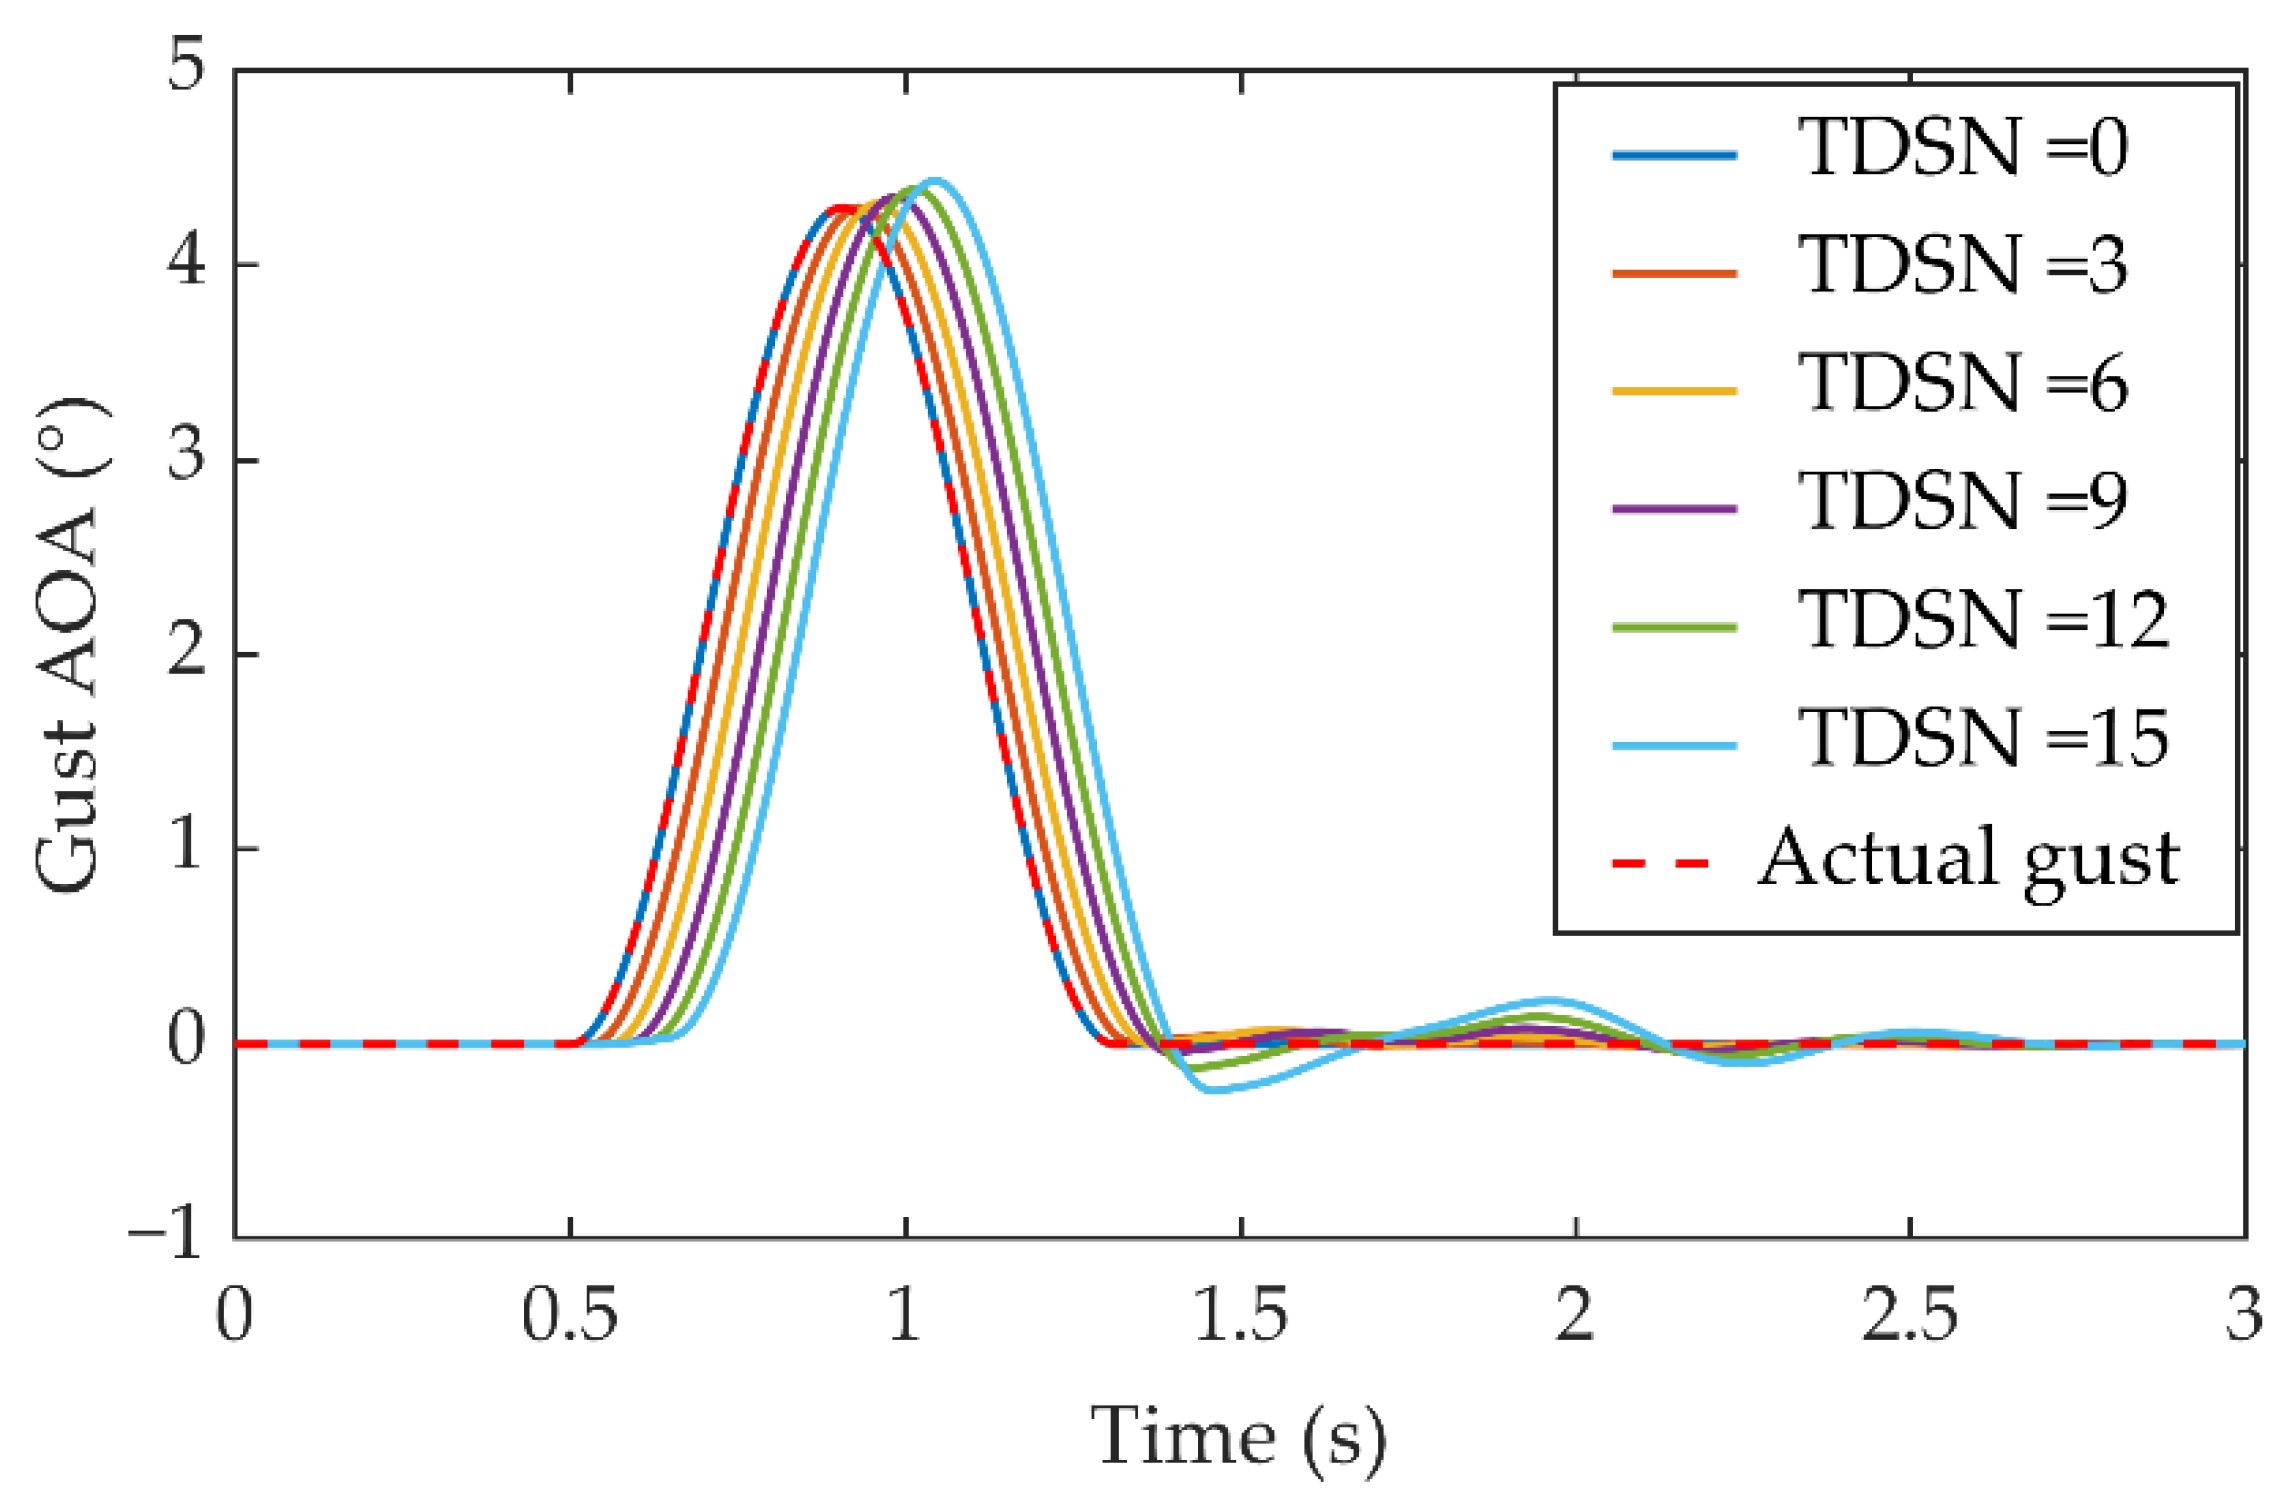
Figure 9 also shows the gust calculation index values corresponding to different TDSNs. Note that both the correlation coefficient and gust calculation index are normalized based on their respective maximum values. It can be seen that when the correlation coefficient is at its maximum, the corresponding TDSN is 10 (indicated by a magenta diamond marker); at this point, the gust calculation index is at its minimum, and the gust calculation quality is the best. At other time delays, as the correlation coefficient decreases, the calculation index becomes larger, and the gust calculation quality becomes worse.
When the undisturbed flow speed is 20 m/s and the gust frequency is 2.0 Hz, the pitch angle, the plunging displacement of the plunging–pitching motion device, the AOA measured by the probe, the calculated gust AOA, and the actual gust AOA measured by the hot-wire anemometer are shown in Figure 10. From 16 to 72 s, the motion device only has pitching motion, and the five-hole probe is in different pitch conditions; From 78 to 108 s, the motion device is at different vertical positions; From 110 to 170 s, the device has both plunging motion and pitching motion. Since the hot-wire anemometer was fixed in the wind tunnel flow field, it directly measures the actual gust AOA, which changing trend is very close to a sinusoidal pattern with zero-mean value. The AOA measured by the probe varies with different motion states, while the calculated gust AOA remains almost unchanged at all times and is very close to the measured actual gust AOA. This demonstrates the accuracy of the gust calculation method.
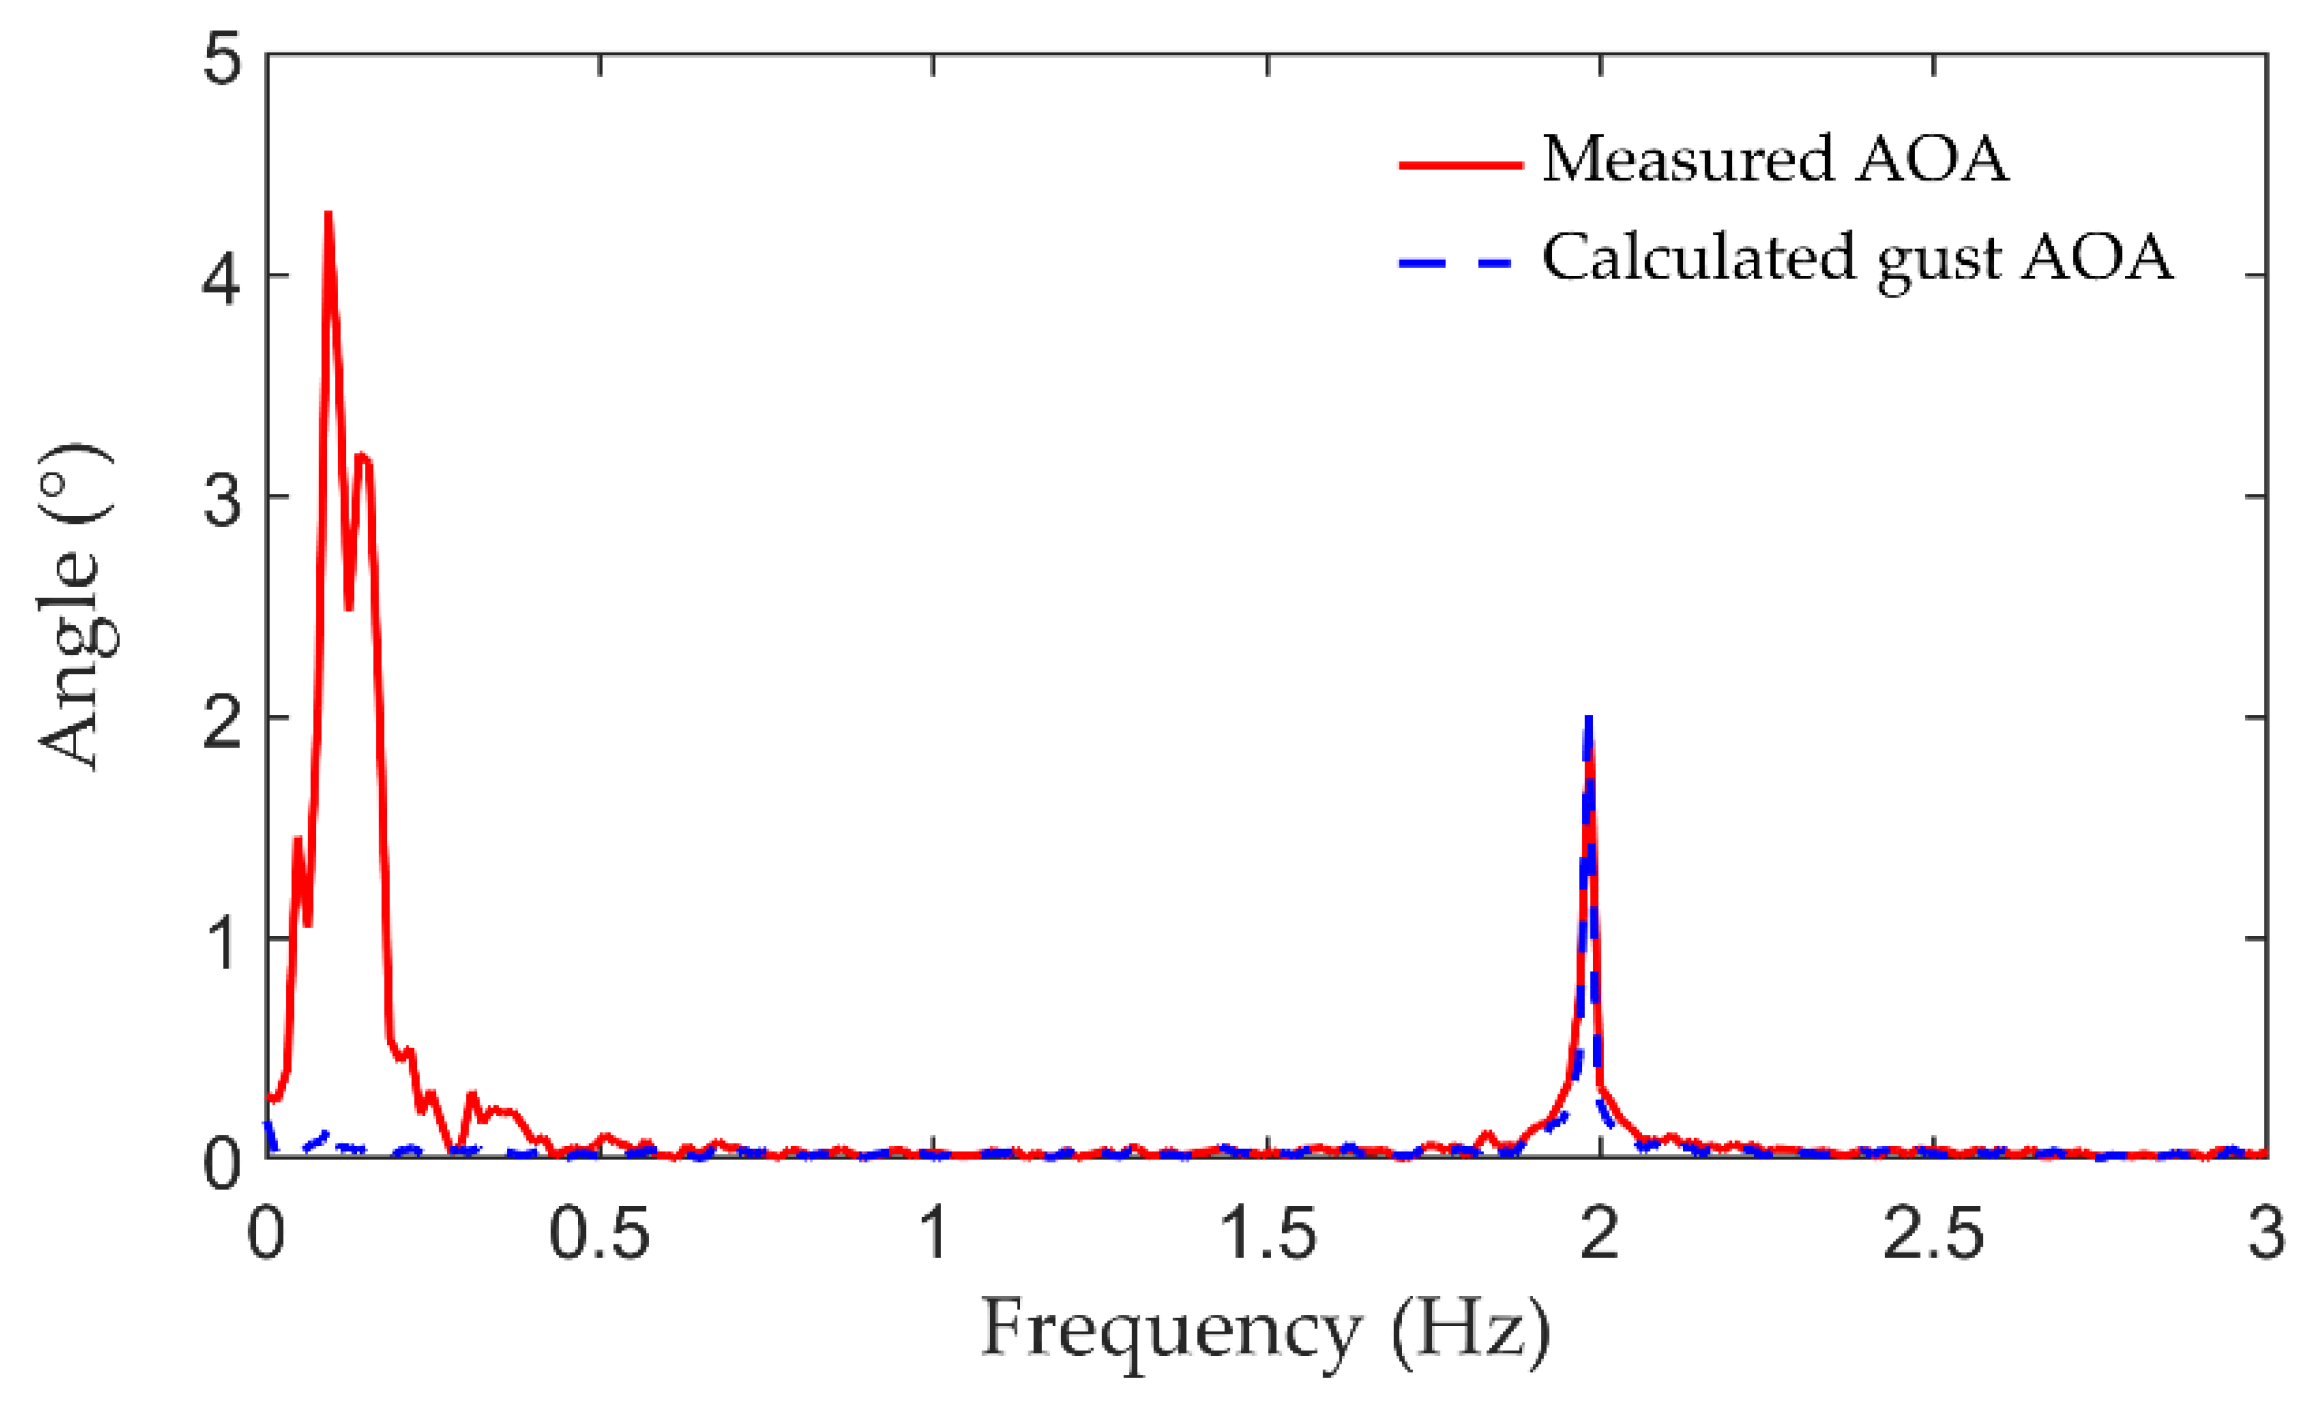
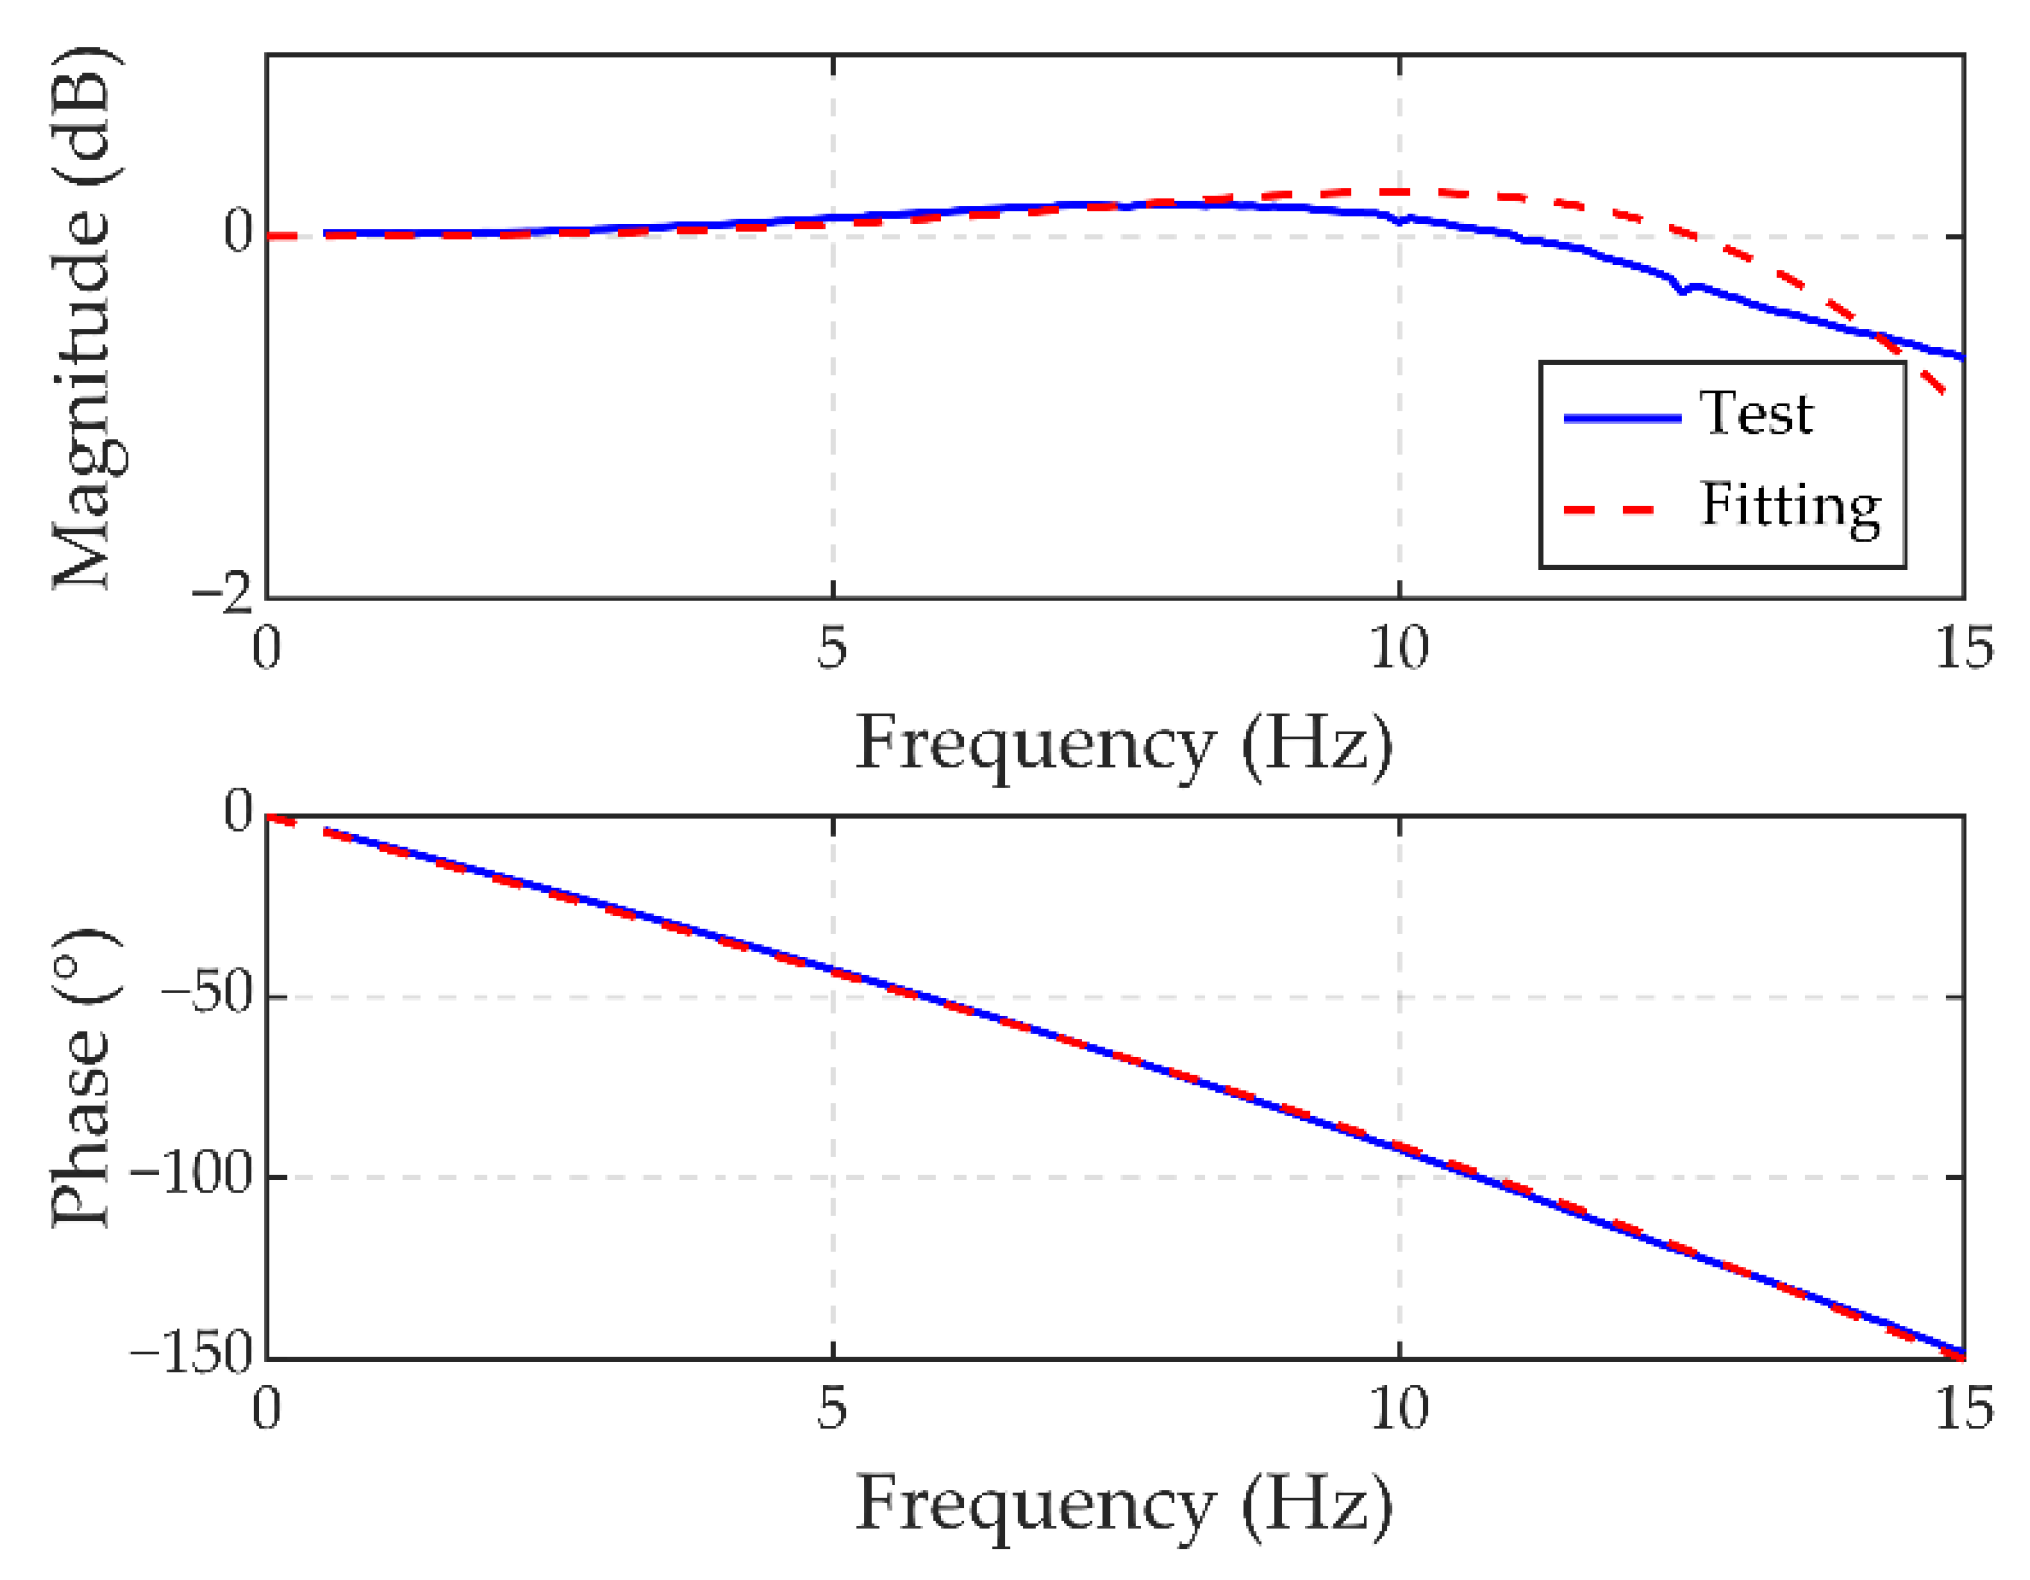
Figure 11 presents a spectrum analysis of the measured AOA and the calculated gust AOA. It can be seen that the measured AOA has both the low-frequency components caused by the motion and the high-frequency components caused by the gust. The calculated gust AOA has no low-frequency component because the AOA caused by motion is eliminated by the gust calculation process, and only the gust component in the flow field is retained.
In the wind tunnel test, each signal related to the gust calculation can be measured with high quality by the sensors mounted on the motion device. High-quality gust information can be obtained through the gust calculation method in the wind tunnel environment. However, for the actual flights, the measured signal will contain more errors. For example, the vertical velocity of an aircraft is generally obtained by measuring atmospheric pressure or by a GPS, and the measured velocity is affected by multiple sensor errors. Also, when the aircraft flying with an arbitrary attitude that does not satisfy the simplification conditions, the gust information needs to be obtained by the non-simplified gust calculation method, which requires more signals, and the quality of the calculated result will be affected by more errors. The time delays of each signal also have a great influence on the gust calculation quality. These are important factors that require focus when applying the gust calculation method to actual flights. In this study, these problems are investigated through simulations.

4. Influence of Sensor Characteristics on Gust Calculation and Gust Alleviation

4.1. Mathematical Model Building

(1)
State-space model
The dynamic equation of an aeroelastic system with gust excitation can be formulated in the frequency domain as [38]:
ω 2 M ξ ξ + i ω C ξ ξ + K ξ ξ q ω 2 M ξ δ δ = F ( ω )
where M ξ ξ , M ξ δ , C ξ ξ , and K ξ ξ are generalized matrixes corresponding to the aircraft mass, inertial mass of control surfaces, damping and stiffness, respectively. q is the generalized displacement matrix, δ is the vector of control surface deflection angles, and F ( ω ) is the generalized aerodynamic matrix, expressed as
F ( ω ) = 1 2 ρ V 2 Q ξ ξ ( ω ) q + 1 2 ρ V 2 Q ξ δ ( ω ) δ + 1 2 ρ V 2 Q g ( ω ) w g
where Q ξ ξ , Q ξ δ , and Q g are generalized aerodynamic matrixes corresponding to generalized displacement, deflection angle of the control surfaces and the gust velocity, respectively. w g is the gust velocity, ρ is the air density, and V is the flight speed.
To perform gust response analysis and gust alleviation control system design in the time domain, Equation (24) needs to be converted into the time domain. The detailed derivation process can be found in Ref. [25]. The state-space equation of a flexible aircraft can be obtained in the following form:
x ˙ a e y a e = A a e C a e x a e + B a e D a e δ a e + B w D w w ¯ g
where
x a e = q q ˙ x a , δ a e = δ δ ˙ δ ¨ , w ¯ g = w g w ˙ g
Generally, the aircraft control surfaces are driven by electric actuators or electro-hydraulic servo actuators, and the transfer function of the actuator can usually be expressed as
δ u c = a 0 s 3 + a 2 s 2 + a 1 s + a 0
where u c is the command output by the control system. Regarding multiple actuators, corresponding to Equation (27), the state-space form of the actuators’ input–output is:
δ ˙ a e = A a c δ a e + B a c u c δ a e = δ a e
(2)
Feedforward controller design
The input signal of the feedforward controller is the gust signal, which is obtained in advance through the gust calculation system. The controller assigns different weights to the gust signals at different times and adds them together to obtain the final control command. The controller structure is shown in Figure 12. In the time domain, the feedforward control law is expressed as follows:
u c ( t ) = k = 0 M 1 h ( k ) w g ( t k Δ T )
where u c is the control command, h ( k ) is control weight values, w g is the gust velocity, Δ T is the sampling period of the digital computer system, and M is the order of the controller; in this study, M = 1. Usually, several methods can be used to obtain the control weights. The present work used the RLS method. The details regarding the specific derivation process of this method can be found in Ref. [25].

4.2. Model Description

Figure 13 shows the finite element model of the aircraft in this paper. All components of the model are established by beam elements, and the mass of the aircraft is modelled by means of concentrated masses distributed at several finite nodes. The total weight of the model is about 19.6 kg, the longitudinal length of the fuselage is about 2.76 m, and the spanwise length is about 2.34 m. In the simulation, the plunging mode, pitching mode and the first two wing bending modes are considered. To obtain the dynamic characteristics of the aircraft model and correct the finite element model, a ground modal test was carried out. The experimental values of the first two bending modal frequencies are compared with the theoretical values in Table 1.

4.3. Influence of Sensor Delay on Gust Calculation and Gust Alleviation

To implement the gust calculation method given in Equation (16), a variety of sensors are needed to measure different physical quantities. The different measurement principles of the various sensors result in their outputs having different time delays. As described in Section 3.4, the five-hole probe sensor has relatively large delays; the sensors used to measure the aircraft motion and attitude signal have a very short delay time, usually on the order of several microseconds. The influence of the delay caused by the airflow angle sensor (i.e., five-hole probe sensor) on the gust calculation signal and the gust alleviation effect is mainly studied here.
In the simulation, 1-cos discrete gust model is used, this kind of gust is commonly used in various specifications and papers. The gust profile is defined as
w g = w m 2 ( 1 cos 2 π ( V t x ) L ) , x V t ( x + L ) V 0 , others
where w m is the gust amplitude, V is the flight speed, and L is the gust scale.
Consider the situation that the aircraft flight speed is 20 m/s, the 1-cos discrete gust amplitude is 1.5 m/s, and the gust scale is 25 times the aircraft reference chord length. As shown in Figure 14, when the five-hole probe has no delay, i.e., the TDSN of the total AOA is zero, the calculated gust AOA is exactly the same as the actual gust AOA. For the TDSN varying from 3 to 15, the calculated gust AOA will differ from the actual gust signal, not only in terms of amplitude but also in terms of phase and gust waveform. As the TDSN increases, the error becomes more obvious. Note that the time step here corresponds to the sampling period of the digital computer.
The delay of the sensor not only affects the quality of the gust calculation, but also has influences on the gust alleviation effect. The gust alleviation rate η is defined as
η = σ o σ c σ o × 100 %
where σ o and σ c are the maximums of the gust response for the open-loop and closed-loop conditions, respectively.
The FFCS with different calculated gust AOAs (as shown in Figure 14) as input signals leads to different responses of the aircraft. Figure 15 and Figure 16 show the gust response of the wingtip acceleration (WTA) and the WRBM under the open-loop condition and different feedforward control, respectively. It can be clearly seen that with the increase of delay, the gust calculation quality deteriorates, the closed-loop gust response also increases, and the controller alleviation efficiency decreases. For example, when the sensor has no delay, the WTA alleviation rate reaches 46.67% and the WRBM alleviation rate reaches 45.59%. When the TDSN of the sensor increases to 15, the controlled WTA and WRBM increase by 17.78% and 16.67%, respectively, compared to the uncontrolled case, and the gust response is not alleviated. Table 2 lists the decrease of gust alleviation rate caused by other TDSNs. The sensor delay clearly has a very important influence on the gust calculation and gust alleviation effect.

4.4. Influence of Sensor Measurement Error on Gust Calculation and Gust Alleviation

Due to the characteristics of the sensor and the presence of external noise, there will be errors between the data measured by the sensor and the actual measured object. The influence of errors on the accuracy of the gust calculation and the efficiency of the gust alleviation are now investigated. The case in which there is an error in a single sensor output and the case in which all sensor outputs have errors are both considered. Assuming that the actual signal being measured is s ( t ) and the measured value is s m ( t ) , the relationship between them is as follows:
s m ( t ) = s ( t ) ( 1 + Δ )
where Δ is zero-mean random white noise with a variance of 0.25.
Figure 17 shows the gust calculation results when there are errors in different sensors. Error 1 ~ Error 4 correspond to the measured values of the AOA sensor, pitch angle sensor, pitch rate sensor and vertical velocity sensor containing random errors, respectively. Error 5 corresponds to all sensors’ measurements containing random errors. It can be seen that the sensor errors mainly affect the amplitude of the calculated gust AOA. Error 1 and Error 5 have the greatest influence on the accuracy of gust calculation, these are mainly due to the error caused by the AOA sensor. The influence of the errors of other sensors is relatively small. In terms of gust alleviation, sensor errors also lead to different degrees of reduction in the gust alleviation rate. As shown in Figure 18, when compared with the gust alleviation rate of WTA without sensor error, Error 1 and Error 5 lead to a greater reduction in the WTA alleviation rate, which is reduced to 13.65% and 9.7%, respectively. The errors of other sensors also lead to different degrees of reduction of the alleviation rate for WTA.
Regarding WRBM, the sensor errors have little influence on the gust alleviation effect. This is because the feedforward control scheme in this study uses three ailerons on the wing as the gust alleviation control surfaces, and the change in the calculated gust signal directly affects the aileron deflection. The deflection of the aileron has a large effect on the aerodynamic force on the wing. The WRBM is influenced by the rigid body motion of the aircraft in addition to the force distribution on the wing, while the WTA is more strongly influenced by the distributed forces on the wing, resulting in a more sensitive WTA response to the change in aileron deflection. Small changes in the calculated gust signal are therefore more clearly reflected by changes in the WTA.
Based on the above analysis, both the delay and measurement errors of the sensors impact the gust calculation quality and the gust alleviation effect. In comparison, the delay has a more important impact and therefore requires more attention.

5. Wind Tunnel Test of Gust Alleviation

5.1. Test Model

The main load-bearing structure of the aircraft model was made of aluminum alloy and the fuselage surface was shaped using heat-shrinkable film to reduce the total weight of the fuselage. The aircraft shape is shown in Figure 19. The test model has three ailerons on the wing and a rudder on the V-tail. All the control surfaces were made of foam sandwich composite material and driven by Maxon DC actuators. The aircraft model was supported in the wind tunnel through a rotation device, which provides the pitching rigid motion for the model, and an angle sensor was installed on the device to measure the pitch angle of the aircraft. Without considering the aerodynamic force, a frequency response characteristic test of the actuator was carried out on the ground, and a transfer function was fitted using the least square method based on the test data. From the Bode diagram shown in Figure 20, it can be seen that the bandwidth of the actuator is beyond 6.0 Hz. The fitted transfer function is as follows:
H ( s ) = e 0.005 s 1.01 e 6 s 3 + 183.10 s 2 + 1.89 e 4 s + 1.01 e 6

5.2. Measurement and Control System

(1)
Overall structure
The measurement and control system of the wind tunnel test includes various sensors, actuators, control systems and data acquisition and storage module. As shown in Figure 13, a five-hole probe is installed on the aircraft model to measure the AOA and the wind speed of the flow field, and the gust AOA is obtained by the gust calculation module. A single-axis accelerometer is positioned at the wingtip of the aircraft to measure the vertical vibration acceleration of the wing. An angular rate gyro is installed inside the middle of the fuselage to measure the pitch rate of the aircraft. At the same time, strain gauges are installed on the wing root to measure the WRBM. The data acquisition and storage module is used to store all sensor signals and command signals for the subsequent analysis of the test results. The control system includes stability augmentation system (SAS) and gust alleviation system (GAS). The GAS can be divided into FFCS, FBCS and combined control system (CCS). The SAS and GAS are independent of each other. They could be turned on and off independently, and their parameters could be adjusted separately. The relationship between the modules in the measurement and control system is shown in Figure 21.
(2)
Stability augmentation system
The purpose of the SAS is to ensure that the aircraft maintains a suitable AOA during the test, and after being disturbed by the gust, the pitching motion will not be too large if the gust alleviation system is off. The SAS uses the rudder on the V-tail as the control surface, and uses the pitch angle and pitch rate as the feedback signals. The control law is:
δ e l e v = K θ θ + K q q
where θ is the pitch angle, q is the pitch rate; K θ and K q are the control gain parameters.
(3)
Gust alleviation system
The FFCS uses the gust signal as input to produce control commands, and the feedforward control law used in the wind tunnel test is as described in Section 4.1.
Regarding the FBCS, the proportional–integral–derivative control law is used. Due to its simple structure, ease of implementation, and obvious physical meaning, this approach has been widely used in practical projects.
In the wind tunnel testing, the FBCS uses the rudder on the V-tail and the ailerons on the wing as control surfaces. The control law is as follows:
u b a = K p 1 a w + K i 0 t a w ( τ ) d τ
u b r = K p 2 q
where u b a and u b r are the control commands of the FBCS to the ailerons and rudder, respectively. a w is the WTA, and q is the pitch rate.
The CCS is the combination of the FFCS and FBCS. From the perspective of the control mechanism, the feedforward control is closely related to the external excitation, whereas the feedback control is based on the response of the aircraft to the excitation. For example, for gust alleviation of the WRBM, feedforward control takes the gust signal as the input, representing the effect of additional aerodynamic forces on the wing caused by the gusts, while feedback control takes the WTA as the input, representing the effect of inertial forces of the wing. The combination of feedforward control and feedback control helps to achieve a better alleviation control effect.

5.3. Analysis of Gust Alleviation Test Results

As the first bending frequency of the wing is 2.13 Hz when the pitch freedom is released, the gust response is the most serious when the gust excitation frequency is close to this value. Therefore, the gust frequencies of 2.0 Hz and 2.5 Hz were selected to carry out the wind tunnel test. Three different values of wind speed were considered: 20 m/s, 22 m/s and 24 m/s. The gust alleviation effects of the FFCS, FBCS, and the CCS were studied under these conditions.
In the gust alleviation wind tunnel test, the AOA directly measured by the five-hole probe and the gust AOA calculated are shown in Figure 22. The average value of the measured AOA is about 9°. When the GAS is off and on, the measured AOA is not the same due to the different gust responses of the aircraft. Through the gust calculation process, the motion effect of the aircraft can be stripped from the measured AOA, leaving only the signal of AOA caused by the gusts, which was then used for feedforward gust alleviation.
Figure 23 and Figure 24 show the alleviation rate of the FFCS at different wind speeds and gust frequencies. It can be seen that the FFCS based on the gust calculation achieves an effective gust response suppression for gust excitations of both frequencies, with the alleviation effect being more evident in the case of the 2.0 Hz gust excitation. For example, when the wind speed is 20 m/s, the alleviation rate of the WRBM reaches 68.67%, which reduces the load at the root of the wing; the alleviation rate of the WTA is reduced by 85.29%, which reduces the vibration of the wing. The alleviation rate of the pitch rate reaches 67.87%, which makes the aircraft pitch attitude more stable. This good feedforward gust alleviation performance is due to accurate gust calculation results and suitable feedforward controller.
Combining feedforward control and feedback control was also investigated in the wind tunnel test. It can be seen from Figure 23 and Figure 24 that the FBCS also has a good gust alleviation effect, and the CCS composed of FFCS and FBCS provides the best alleviation effect. Table 3 lists the average alleviation rate of the three control systems for different gust responses under all conditions. The FFCS achieves, on average, a load alleviation rate of 39.12%, a WTA alleviation rate of 65.47%, and a pitch rate alleviation rate of 41.14%. The alleviation rate of CCS reaches more than 65% for all three responses.
Figure 25 shows the time-domain curve of the WRBM in the open-loop condition and different closed-loop conditions when the wind speed is 20 m/s and the gust frequency is 2.0 Hz. From 0 to 25 s, the aircraft is in the open-loop condition. During this time interval, only the SAS is turned on, and the V-tail rudder is deflected. From 25 to 50 s, the FFCS is turned on, the rudder on the V-tail only acts as the stability augmentation control surface, and the three ailerons provide feedforward gust alleviation. During this time interval, the WRBM is obviously reduced. From 50 to 75 s, the FBCS is turned on, all ailerons are deflected with the same angle, and the V-tail rudder receives commands from the SAS and the FBCS at the same time. The WRBM is reduced compared to the open-loop condition. From 75 to 100 s, the CCS is turned on, and the WRBM is reduced most significantly. The spectrum analysis of the WRBM is also carried out in the frequency domain. The results are shown in Figure 26. The main frequency components of the WRBM are close to the gust excitation frequency of 2.0 Hz in the open-loop and closed-loop conditions. This main component is significantly reduced after the gust alleviation system is turned on.

6. Conclusions

This paper investigated the gust calculation method and feedforward gust alleviation. Firstly, the gust calculation method was derived and a simplified formula in the longitudinal axis was given. The influence of sensor characteristics on gust calculation accuracy and the gust alleviation effect was studied through numerical simulations. The test systems were also developed, including a gust generator, a two degrees-of-freedom motion device, an aircraft model, aircraft support device, and measurement and control system, based on which gust calculation and gust alleviation wind tunnel tests were carried out.
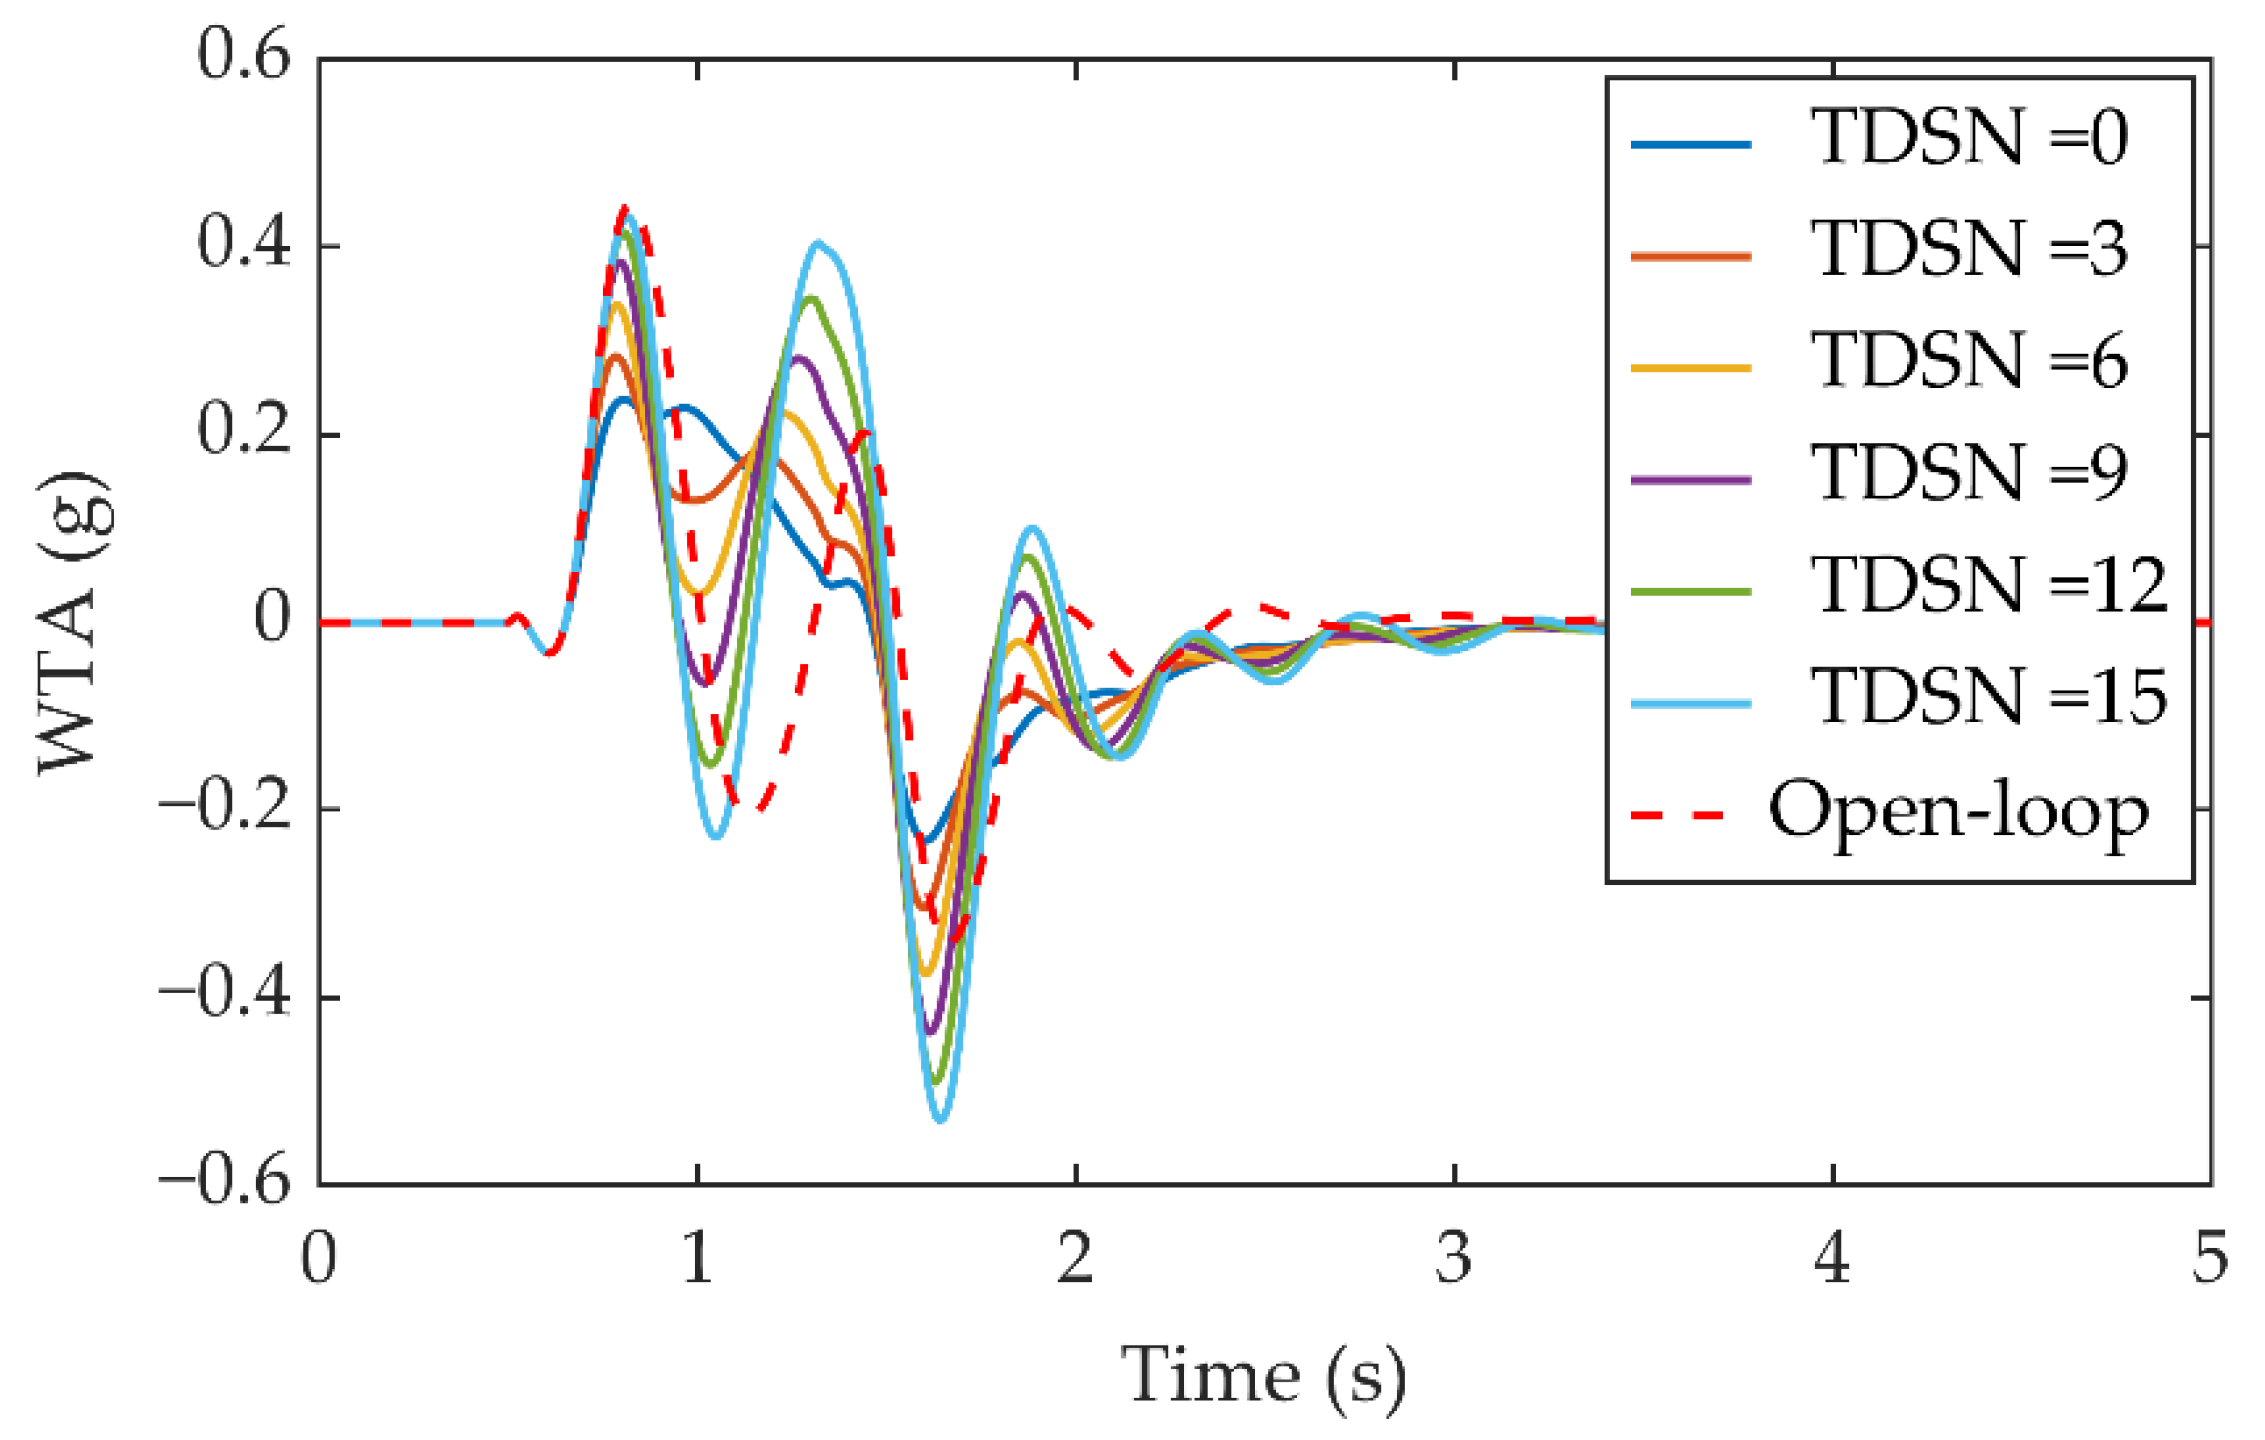
The gust calculation wind tunnel test results verified the effectiveness of the gust calculation method. The gust information obtained by the gust calculation system can truly reflect the actual gust in the wind tunnel flow field. Numerical simulations show that the sensor characteristics have an important influence on the accuracy of gust calculation and the effect of gust alleviation. In particular, excessive sensor delays will lead to a decrease of gust calculation accuracy and a deterioration of the gust alleviation effect. For example, a delay of nine sampling periods renders the gust alleviation system almost ineffective. The influence of sensor errors is relatively small. The FFCS based on gust calculation exhibits a good alleviation effect. For example, for the gust excitation at relevant frequencies (2.0 Hz and 2.5 Hz), the average alleviation rate of the WTA reaches 65.47%. Combining feedback control and feedforward control can achieve a better gust alleviation effect.
In the current work, the simplified gust calculation method has been verified by the wind tunnel test. In future work, it will be considered to verify the more complex three-dimensional gust calculation method through flight test, which is a more challenging and meaningful work and will lay a more solid foundation for practical applications. Second, the feedforward gust alleviation, based on gust calculation, is sensitive to the variation of the aircraft, and the adaptive feedforward controller design method also deserves in-depth study.

Author Contributions

Conceptualization, Z.W.; methodology, Z.W. and Y.Z.; software, Y.Z.; validation, Z.W. and Y.Z.; formal analysis, Y.Z.; writing—original draft preparation, Y.Z.; writing—review and editing, Z.W.; supervision, C.Y.; project administration, C.Y. All authors have read and agreed to the published version of the manuscript.

Funding

This research received no external funding.

Institutional Review Board Statement

Not applicable.

Informed Consent Statement

Not applicable.

Data Availability Statement

Not applicable.

Conflicts of Interest

The authors declare no conflict of interest.

Nomenclature

C ξ ξ Damping matrix F Generalized aerodynamic matrix
f Gust frequency H Aircraft height
J Root mean square of the calculated gust AOA K Control system gain
K ξ ξ Stiffness matrix L Gust scale
L b g Coordinate transformation matrix M Mass matrix
q Generalized displacement matrix q Pitch rate
Q Generalized aerodynamic influence coefficient matrix r Yaw rate
u c Command output by control system V Flight speed
V a Airspeed vector V g Ground speed vector
V w Wind speed of the changing wind field V w g Gust velocity vector
w g Gusts velocity value w m Gust amplitude
x A O A Distance from center of gravity to AOA sensor x A O S Distance from center of gravity to AOS sensor
α Angle of attack α w g Gust angle
β Angle of sideslip β w g Angle of sideslip due to gust
δ Control surface deflection angle ω Angle frequency
η Gust alleviation rate θ Pitch angle
λ Cross-correlation function ρ Air density
ϕ Roll angle ψ Yaw angle
σ c Maximum gust response value with control σ o Maximum gust response value without control
τ Time delay

Abbreviations

AOAAngle of attack
AOSAngle of sideslip
CCSCombined control system
FBCSFeedback control system
FFCSFeedforward control system
GASGust alleviation system
GLAGust load alleviation
SASStability augmentation system
TDSNTime delay step number
WRBMWing root bending moment
WTAWingtip acceleration

References

  1. Moulin, B.; Karpel, M. Gust loads alleviation using special control surfaces. J. Aircr. 2007, 44, 17–25. [Google Scholar] [CrossRef]
  2. Castrichini, A.; Siddaramaiah, V.H.; Calderon, D.E.; Cooper, J.E.; Wilson, T.; Lemmens, Y. Nonlinear folding wing tips for gust loads alleviation. J. Aircr. 2016, 53, 1391–1399. [Google Scholar] [CrossRef]
  3. Cooper, J.E.; Chekkal, I.; Cheung, R.C.M.; Wales, C.; Allen, N.J.; Lawson, S.; Peace, A.J.; Cook, R.; Standen, P.; Hancock, S.D.; et al. Design of a morphing wingtip. J. Aircr. 2015, 52, 1394–1403. [Google Scholar] [CrossRef]
  4. Bernhammer, L.; Teeuwen, S.P.; De Breuker, R.; Van Der Veen, G.J.; Van Solingen, E. Gust load alleviation of an unmanned aerial vehicle wing using variable camber. J. Intell. Mater. Syst. Struct. 2014, 25, 795–805. [Google Scholar] [CrossRef]
  5. Hu, Y.; Dai, Y.; Wu, Y.; Yang, C. Time-domain feedforward control for gust response alleviation based on seamless morphing wing. AIAA J. 2022, 60, 5707–5722. [Google Scholar] [CrossRef]
  6. Liu, X.; Sun, Q. Improved LQG method for active gust load alleviation. J. Aerosp. Eng. 2017, 30, 04017006. [Google Scholar] [CrossRef]
  7. Aouf, N.; Boulet, B.; Botez, R.M. Robust gust load alleviation for a flexible aircraft. Can. Aeronaut. Space J. 2000, 46, 131–139. [Google Scholar]
  8. Cook, R.G.; Palacios, R.; Goulart, P. Robust gust alleviation and stabilization of very flexible aircraft. AIAA J. 2013, 51, 330–340. [Google Scholar] [CrossRef]
  9. Haghighat, S.; Liu, H.H.T.; Martins, J.R.R.A. Model-predictive gust load alleviation controller for a highly flexible aircraft. J. Guid. Control Dyn. 2012, 35, 1751–1766. [Google Scholar] [CrossRef]
  10. Shao, K.; Yang, C.; Wu, Z.; Liu, H.; Wen, B. Design of a gust-response-alleviation online control system based on neuro-fuzzy theory. J. Aircr. 2013, 50, 599–609. [Google Scholar] [CrossRef]
  11. Winther, B.A.; Shirley, W.A.; Heimbaugh, R.M. Wind-tunnel investigation of active controls technology applied to a dc-10 derivative. J. Guid. Control 1981, 4, 536–542. [Google Scholar] [CrossRef]
  12. Matsuzaki, Y.; Ueda, T.; Miyazawa, Y.; Matsushita, H. Gust load alleviation of a transport-type wing: Test and analysis. J. Aircr. 1989, 26, 322–327. [Google Scholar] [CrossRef]
  13. Wu, Z.; Chen, L.; Yang, C. Study on gust alleviation control and wind tunnel test. Sci. China-Technol. Sci. 2013, 56, 762–771. [Google Scholar] [CrossRef]
  14. Disney, T.E. C-5A active load alleviation system. J. Spacecr. Rockets 1977, 14, 81–86. [Google Scholar] [CrossRef]
  15. Regan, C.D.; Jutte, C.V. Survey of Applications of Active Control Technology for Gust Alleviation and New Challenges for Lighter-Weight Aircraft; NASA/TM-2012-216008; NASA: Dryden Flight Research Center: Edwards, CA, USA, 2012. [Google Scholar]
  16. Zeng, J.; Moulin, B.; De Callafon, R.; Brenner, M.J. Adaptive feedforward control for gust load alleviation. J. Guid. Control Dyn. 2010, 33, 862–872. [Google Scholar] [CrossRef]
  17. Zhao, Y.; Yue, C.; Hu, H. Gust load alleviation on a large transport airplane. J. Aircr. 2016, 53, 1932–1946. [Google Scholar] [CrossRef]
  18. Liu, X.; Sun, Q.; Cooper, J.E. LQG based model predictive control for gust load alleviation. Aerosp. Sci. Technol. 2017, 71, 499–509. [Google Scholar] [CrossRef]
  19. Fournier, H.; Massioni, P.; Pham, M.T.; Bako, L.; Vernay, R.; Colombo, M. Robust gust load alleviation of flexible aircraft equipped with lidar. J. Guid. Control Dyn. 2021, 45, 58–72. [Google Scholar] [CrossRef]
  20. Wildschek, A.; Maier, R.; Hahn, K.-U.; Leissling, D.; Press, M.; Zach, A. Flight Test with an Adaptive Feed-Forward Controller for Alleviation of Turbulence Excited Wing Bending Vibrations. In Proceedings of the AIAA Guidance, Navigation, and Control Conference, Chicago, IL, USA, 10–13 August 2009; p. 6118. [Google Scholar]
  21. Hamada, Y. Flight test results of disturbance attenuation using preview feedforward compensation. IFAC-Pap. 2017, 50, 14188–14193. [Google Scholar] [CrossRef]
  22. Li, F.; Wang, Y.; Ronch, A.D. Flight Testing Adaptive Feedback/Feedforward Controller for Gust Loads Alleviation on a Flexible Aircraft. In Proceedings of the AIAA Atmospheric Flight Mechanics Conference, Washington, DC, USA, 13–17 June 2016; p. 3100. [Google Scholar]
  23. Hamada, Y.; Saitoh, K.; Kobiki, N. Gust alleviation control using prior gust information: Wind tunnel test results. IFAC-Pap. 2019, 52, 128–133. [Google Scholar] [CrossRef]
  24. Wildschek, A.; Maier, R.; Hoffmann, F.; Steigenberger, J.; Kaulfuss, K.-H.; Breitsamter, C.; Allen, A.; Adams, N.; Baier, H.; Giannopoulos, T.; et al. Wind Tunnel Testing of an Adaptive Control System for Vibration Suppression on Aircraft. In Proceedings of the AIAA Guidance, Navigation and Control Conference and Exhibit, Hilton Head, SC, USA, 20–23 August 2007; p. 6331. [Google Scholar]
  25. Zhou, Y.; Wu, Z.; Yang, C. Gust alleviation and wind tunnel test by using combined feedforward control and feedback control. Aerospace 2022, 9, 225. [Google Scholar] [CrossRef]
  26. Zhao, D.; Yang, Z.; Zeng, X.; Yu, J.; Gao, Y.; Huang, G. Wind tunnel test of gust load alleviation for a large-scale full aircraft model. Chin. J. Aeronaut. 2022, in press. [Google Scholar] [CrossRef]
  27. Schmitt, N.P.; Rehm, W.; Pistner, T.; Zeller, P.; Diehl, H.; Navé, P. The AWIATOR airborne lidar turbulence sensor. Aerosp. Sci. Technol. 2007, 11, 546–552. [Google Scholar] [CrossRef]
  28. Fezans, N.; Schwithal, J.; Fischenberg, D. In-flight remote sensing and identification of gusts, turbulence, and wake vortices using a doppler lidar. CEAS Aeronaut. J. 2017, 8, 313–333. [Google Scholar] [CrossRef]
  29. Vrancken, P.; Herbst, J. Development and Test of a Fringe-Imaging Direct-Detection Doppler Wind Lidar for Aeronautics. In Proceedings of the 29th International Laser Radar Conference, Hefei, China, 24–28 June 2020. [Google Scholar]
  30. Inokuchi, H.; Akiyama, T.; Sasaki, K. Flight Demonstration of a Long Range Onboard Doppler Lidar. In Proceedings of the 31st Congress of the International Council of the Aeronautical Sciences, Belo Horizonte, Brazil, 9–14 September 2018. [Google Scholar]
  31. Matayoshi, N.; Iijima, T.; Yoshikawa, E.; Entzinger, J.O.; Uemura, T.; Akiyama, T.; Inokuchi, H. Development and Flight Demonstration of a New Lidar-Based Onboard Turbulence Information System. In Proceedings of the 31st Congress of the International Council of the Aeronautical Sciences, Belo Horizonte, Brazil, 9–14 September 2018. [Google Scholar]
  32. Tian, P.; Chao, H.; Rhudy, M.; Gross, J.; Wu, H. Wind sensing and estimation using small fixed-wing unmanned aerial vehicles: A survey. J. Aerosp. Inf. Syst. 2021, 18, 132–143. [Google Scholar] [CrossRef]
  33. Fezans, N.; Joos, H.-D. Combined Feedback and LIDAR-Based Feedforward Active Load Alleviation. In Proceedings of the AIAA Atmospheric Flight Mechanics Conference, Denver, CO, USA, 5–9 June 2017. [Google Scholar]
  34. Britt, R.; Volk, J.; Dreim, D.; Applewhite, K.A. Aeroservoelastic Characteristics of the B-2 Bomber and Implications for Future Large Aircraft; Structural Aspects of Flexible Aircraft Control; RTO of NATO: Ottawa, ON, Canada, 2000. [Google Scholar]
  35. Hahn, K.-U.; Schwarz, C. Alleviation of Atmospheric Flow Disturbance Effects on Aircraft Response. In Proceedings of the 26th Congress of the International Council of the Aeronautical Sciences, Anorchorage, AK, USA, 14–19 September 2008. [Google Scholar]
  36. Jin, C.; Xiao, Y. Flight Principle in Atmospheric Disturbance; National Defence Industry Press: Beijing, China, 1993. [Google Scholar]
  37. Benesty, J.; Chen, J.; Huang, Y. Time-delay estimation via linear interpolation and cross correlation. IEEE Trans. Speech Audio Process. 2004, 12, 509–519. [Google Scholar] [CrossRef]
  38. Karpel, M.; Moulin, B.; Chen, P.C. Dynamic response of aeroservoelastic systems to gust excitation. J. Aircr. 2005, 42, 1264–1272. [Google Scholar] [CrossRef]
Figure 1. Coordinate systems of the aircraft.
Aerospace 10 00139 g001
Figure 2. Motion and velocity in the longitudinal plane of the aircraft.
Aerospace 10 00139 g002
Figure 3. Wind tunnel test schematic for gust calculation.
Aerospace 10 00139 g003
Figure 4. Gust generator.
Aerospace 10 00139 g004
Figure 5. Comparison between measured gust profile and ideal sine gust profile.
Aerospace 10 00139 g005
Figure 6. Five-hole probe.
Aerospace 10 00139 g006
Figure 7. Plunging–pitching motion device for gust calculation test.
Aerospace 10 00139 g007
Figure 8. Sensor signals’ fusion for gust calculation.
Aerospace 10 00139 g008
Figure 9. Comparison between the correlation coefficient and gust calculation index.
Aerospace 10 00139 g009
Figure 10. Plunging–pitching motion device movement process and gust calculation result.
Aerospace 10 00139 g010
Figure 11. Spectrum analysis of the gust calculation.
Aerospace 10 00139 g011
Figure 12. Structure of feedforward controller.
Aerospace 10 00139 g012
Figure 13. Top view of finite element model and sensor installation locations.
Aerospace 10 00139 g013
Figure 14. Calculated gust AOA corresponding to different TDSNs of gust sensor.
Aerospace 10 00139 g014
Figure 15. WTA corresponding to different TDSNs of gust sensor.
Aerospace 10 00139 g015
Figure 16. WRBM corresponding to different TDSNs of gust sensor.
Aerospace 10 00139 g016
Figure 17. Calculated gust AOA corresponding to different sensor errors.
Aerospace 10 00139 g017
Figure 18. Influence of sensor errors on gust alleviation rate.
Aerospace 10 00139 g018
Figure 19. Aircraft model installed in wind tunnel. (a) Rear view of model and (b) front view of model.
Aerospace 10 00139 g019
Figure 20. Bode plot of actuator.
Aerospace 10 00139 g020
Figure 21. Measurement and control system structure.
Aerospace 10 00139 g021
Figure 22. Calculated gust AOA of gust alleviation wind tunnel test.
Aerospace 10 00139 g022
Figure 23. Gust alleviation rates of three control systems (gust frequency is 2.0 Hz).
Aerospace 10 00139 g023
Figure 24. Gust alleviation rates of three control systems (gust frequency is 2.5 Hz).
Aerospace 10 00139 g024
Figure 25. Gust response of WRBM and control surface deflection angle.
Aerospace 10 00139 g025
Figure 26. Frequency spectrum analysis of WRBM.
Aerospace 10 00139 g026
Table 1. Comparison between measured and theoretical values of modal frequencies.
Modal Name of AircraftModal Frequency (Hz)
Experimental Value Theoretical Value
Plunging mode--0.0
Pitching mode--0.0
First-order bending 2.132.14
Second-order bending5.395.49
Table 2. Influence of sensor delay on gust alleviation rate.
TDSNWTAWRBM
Open-Loop (g) Closed-Loop (g)Alleviation Rate (%)Open-Loop (g)Closed-Loop (g)Alleviation Rate (%)
00.450.2446.6726.3914.3645.59
30.3033.3315.8340.02
60.3717.7818.6029.52
90.442.2222.2915.54
120.49−8.8926.48−0.34
150.53−17.7830.79−16.67
Table 3. Comparison of gust alleviation rates.
ResponseAlleviation Rate (%)
FFCSFBCSCCS
WRBM39.1233.5465.31
WTA65.4737.9167.89
Pitch rate41.1446.3070.13
Disclaimer/Publisher’s Note: The statements, opinions and data contained in all publications are solely those of the individual author(s) and contributor(s) and not of MDPI and/or the editor(s). MDPI and/or the editor(s) disclaim responsibility for any injury to people or property resulting from any ideas, methods, instructions or products referred to in the content.

