1. Introduction
In recent years, the capability and performance of satellites, especially micro- and nanosatellites, have greatly improved. With increasing performance, the energy requirement also increases, demanding more solar panel area when satellite design—especially the fundamentals of the electrical power subsystem, for example, the battery energy density [
1], the solar cell energy conversion efficiency [
2], and the architecture of the electrical power controller—has stayed the same for years. Although more energy efficient architecture for electrical power controllers exists, few satellites employ it. It is the same for more efficient solar cells and higher energy density batteries, either for cost reasons or for endurance or reliability. Furthermore, few satellite solar panels have special considerations to reduce solar panel temperature in the sunlight portion of the orbit, while keeping the solar panels warm in the shaded portion. As a result, the solar panels’ temperature can rise to nearly 100 °C in direct sunlight and drop as low as minus 100 °C in the shaded area.
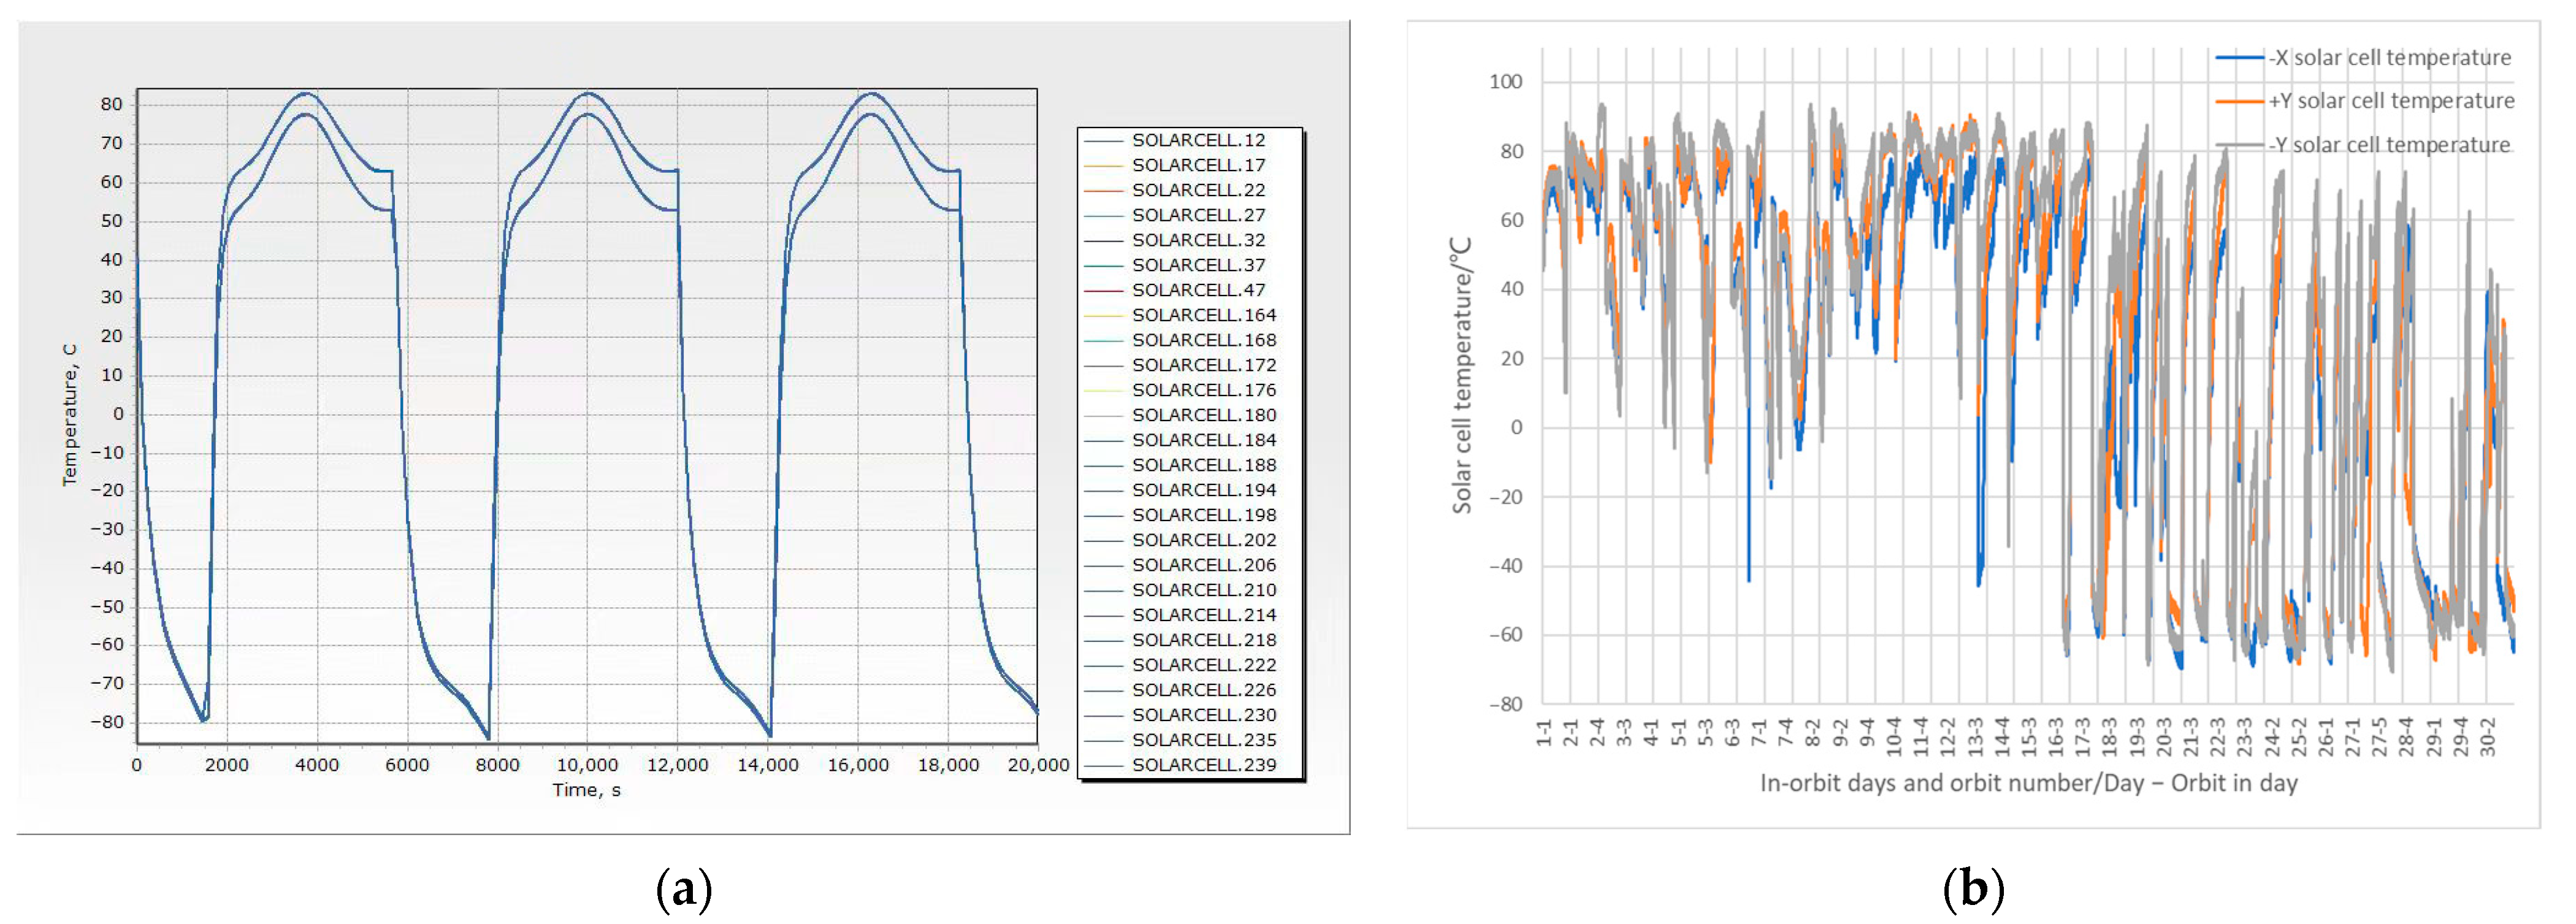
Figure 1 shows a small satellite solar cell temperature simulation result and in-orbit data, as well as the confirmation in [
3].
Such a large temperature range causes problems within the solar panel structure, such as bumping into the polyimide film (the underlying structure beneath the solar cell), causing the solar cell to crack, or early aging of the adhesive. Moreover, the high temperature of the solar panel also decreases the total output power, wasting the effective area of the solar panel.
Table 1 shows the parameter values of the current most-widely used solar cells.
From
Table 1, we can see that as temperature rises, the output voltage drops and the current rises. The output power is equal to voltage times current; thus, as temperature rises, the output power for a single cell drops. Each 10 °C increase in temperature results in a 3–4% decrease in efficiency.
Since there are tight requirements for the weight and size of the micro- and nanosatellites and high demand for power and thermal control, there needs to be a way to relieve the problems by increasing output power and reducing the temperature of the solar panel. Lowering the temperature of the solar panel must not only increase the output power, but also prolong the life of the material beneath the solar cell.
There are studies on improving the output power of solar cells, and for satellites commonly using GaInP/GaAs/GaInAs solar cells, the highest efficiency up to now is 37.8%, manufactured by MicroLink Devices [
4]. The main improvements compared to the current 3J GaAs solar cell include epitaxial structures, anti-reflection coating (ARC), and grid metal patterns, resulting in both Voc and Jsc improvements [
5]. While such methods improve the power generated, the fundamental material characteristics stay the same and do not improve the solar spectrum utilization efficiency. Another type of solar cell, the Si solar cell, has gained attention recently in commercial satellites for its low cost and acceptable conversion efficiency, as well as for its possible employment in Starlink satellites [
6]. The highest efficiency for Si solar cells up to now is 26.8% [
7], and its main limiting factor is the absorption rate in short (300–400 nm) and long (900–1200 nm) wavelength ranges [
8]. Due to the theoretical efficiency limit of the material, the maximum efficiency for a Si solar cell is 29.1%. Compared to a multi-junction GaAs solar cell, the spectrum utilization efficiency is lower, meaning more energy from the sun is converted to heat, causing a temperature rise in the solar cell.
There has not been much research on lowering solar cell and solar panel temperatures; neither has there been on solar cell thermo-electric designs. Tae-Yong Park et al. [
9] proposed a satellite design that utilized solar panel heat to keep other instruments inside the satellite warm, but did not reduce the heat the solar panel generated. Boris Yendler et al. proposed a thermal management system [
10] for a small satellite capable of emitting up to 1 kW of heat, consisting of a deployable radiator, an integrated heat pipe, and phase-change material. In addition, a deployable radiator could be integrated into the solar panel, helping to dissipate heat not only from inside the satellite, but also from the solar panel. Lin Yang et al. proposed a quasi-all-passive thermal control system for small satellites [
11] combining mainly heat insulation and heat conduction, which is what the majority of small satellites do for thermal control. Emanuel Escobar [
12], Ahmed Elhefnawy [
13], and Chen Yang [
14] et al. proposed methods and analyses for designing and prototyping satellite thermal control systems. Alejandro M. Gomez-San-Juan et al. [
15] analyzed a solar panel thermoelectric model with different altitude modes to optimize power generation and altitude control for a direct energy transfer (DET) solar cell controller. Bin Zhao et al. [
16] and Ke Wang et al. [
17] proposed a modified solar cell with enhanced radiative cooling by applying polydimethylsiloxane (PDMS) film on the surface of the solar cell to reduce its temperature. The results of their terrestrial experiment showed little improvement when compared to the results without the PDMS film; one possible reason for this is that the emissivity was relatively high, and increasing the emissivity has little effect. Nevertheless, extraterrestrial applications should be further studied.
In solar cell research, solar cell efficiency is usually increased by optimizing cell materials and developing new materials. The methods are effective, but for satellite applications, the cost, reliability, and performance for long-term operation, especially in a radiation environment, become problems that need to be considered. Far fewer studies focus on thermal control for solar panels, with the majority focusing on thermal analysis of solar panels. Based on satellite failure analysis [
18,
19] and the several satellites we have designed and launched, solar panels are the most common cause of failure, and high temperature is one of the primary causes of output power degradation.
In this study, a novel way to increase the output power and reduce the temperature of solar cells is proposed. Since solar cells used in solar panels cannot fully utilize energy from the sun, a method for eliminating the portion of energy that solar cells cannot utilize was proposed, hoping to reduce the total energy the solar cells receive, thus reducing temperature. This paper is organized as follows: firstly, the characteristics of different types of solar cells are analyzed, including the commonly used triple junction GaAs solar cell. Then, calculations and analyses are made to calculate the balanced temperature of the currently available solar cell and the proposed solar cell. Finally, experimentation and discussion are presented, as well as the conclusions.
2. Solar Cell Spectrum Characteristics
There are several types of solar cells. Every step is remarkable: beginning with a solar cell prototype with copper and copper oxide [
20], to the first practical single-crystal silicon solar cell with 8% efficiency, to the first satellite using solar cell as its main power [
21], to the most advanced triple junction GaAs solar cell now widely used on satellites, to the leading efficiency 4-junction and 5-junction GaAs solar cells in laboratories.
Among the different types of solar cells, the triple junction GaAs (TJ GaAs) solar cell is widely used on satellites for its high efficiency [
2], which is about 30% to 34%, and its affordable price. The high efficiency reduces the area required for satellites, resulting in less weight and volume. The temperature rises as the satellite is exposed to direct sunlight in order to generate electricity. The high temperature in turn reduces efficiency, further increasing the temperature. When the solar panel is directly mounted onto the satellite body, heat transfers into the main body of the satellite, causing problems.
To reduce the temperature of a solar panel, first we had to examine the structure of the solar cell and its spectrum characteristics [
22,
23,
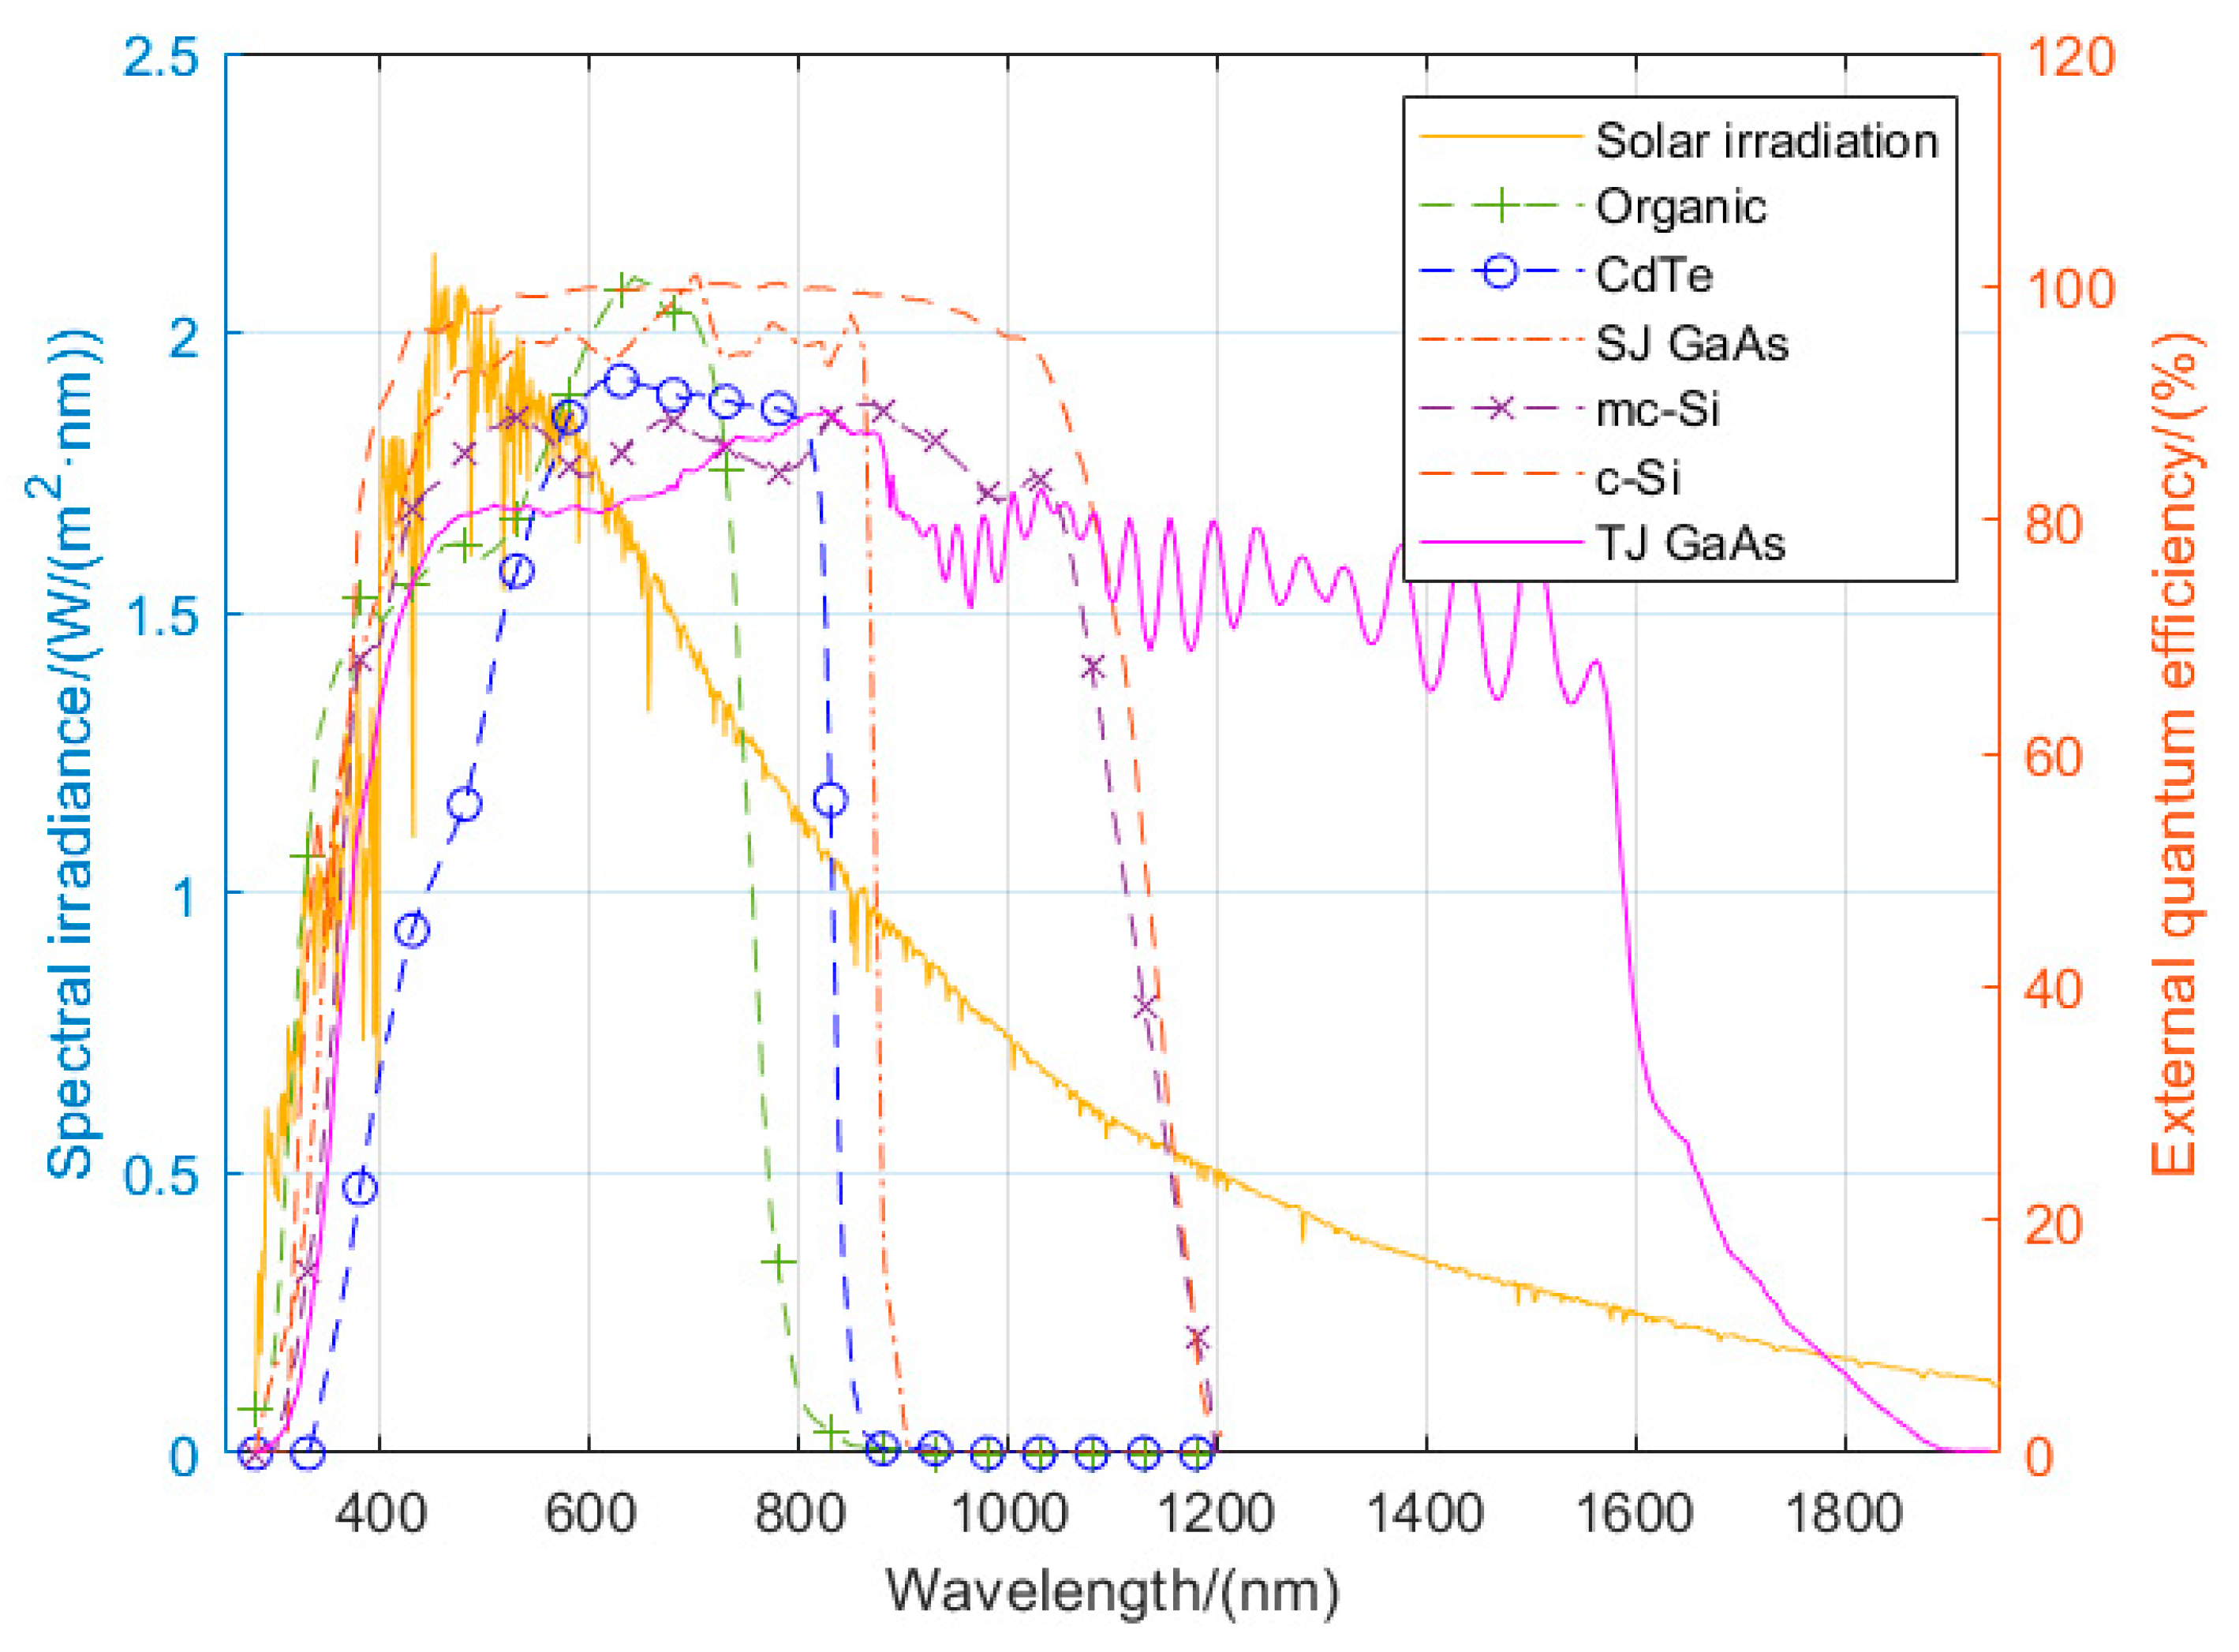
24]. The spectrum response of the TJ GaAs solar cell is shown in
Figure 2, along with several other types of solar cells.
Combining the solar irradiation spectrum and solar cell spectrum response, we can see that starting at 1550 nm, the TJ GaAs solar cell external quantum efficiency (EQE) descends rapidly. The EQE of other types of solar cells decreases earlier as the wavelength increases. At 1600 nm, the EQE of the TJ GaAs solar cell is 52.7%, and when it reaches 1800 nm, the EQE drops to 5.6%. A significant part of the solar irradiation exists above 1600 nm. It can be calculated that the solar irradiation energy from 1600 nm upwards is 141 W/m2, accounting for 10.49% of total solar energy. For other types of solar cells, this percentage is even larger. This portion of solar energy cannot be utilized by the solar cell; it only causes the temperature to rise, decreasing efficiency.
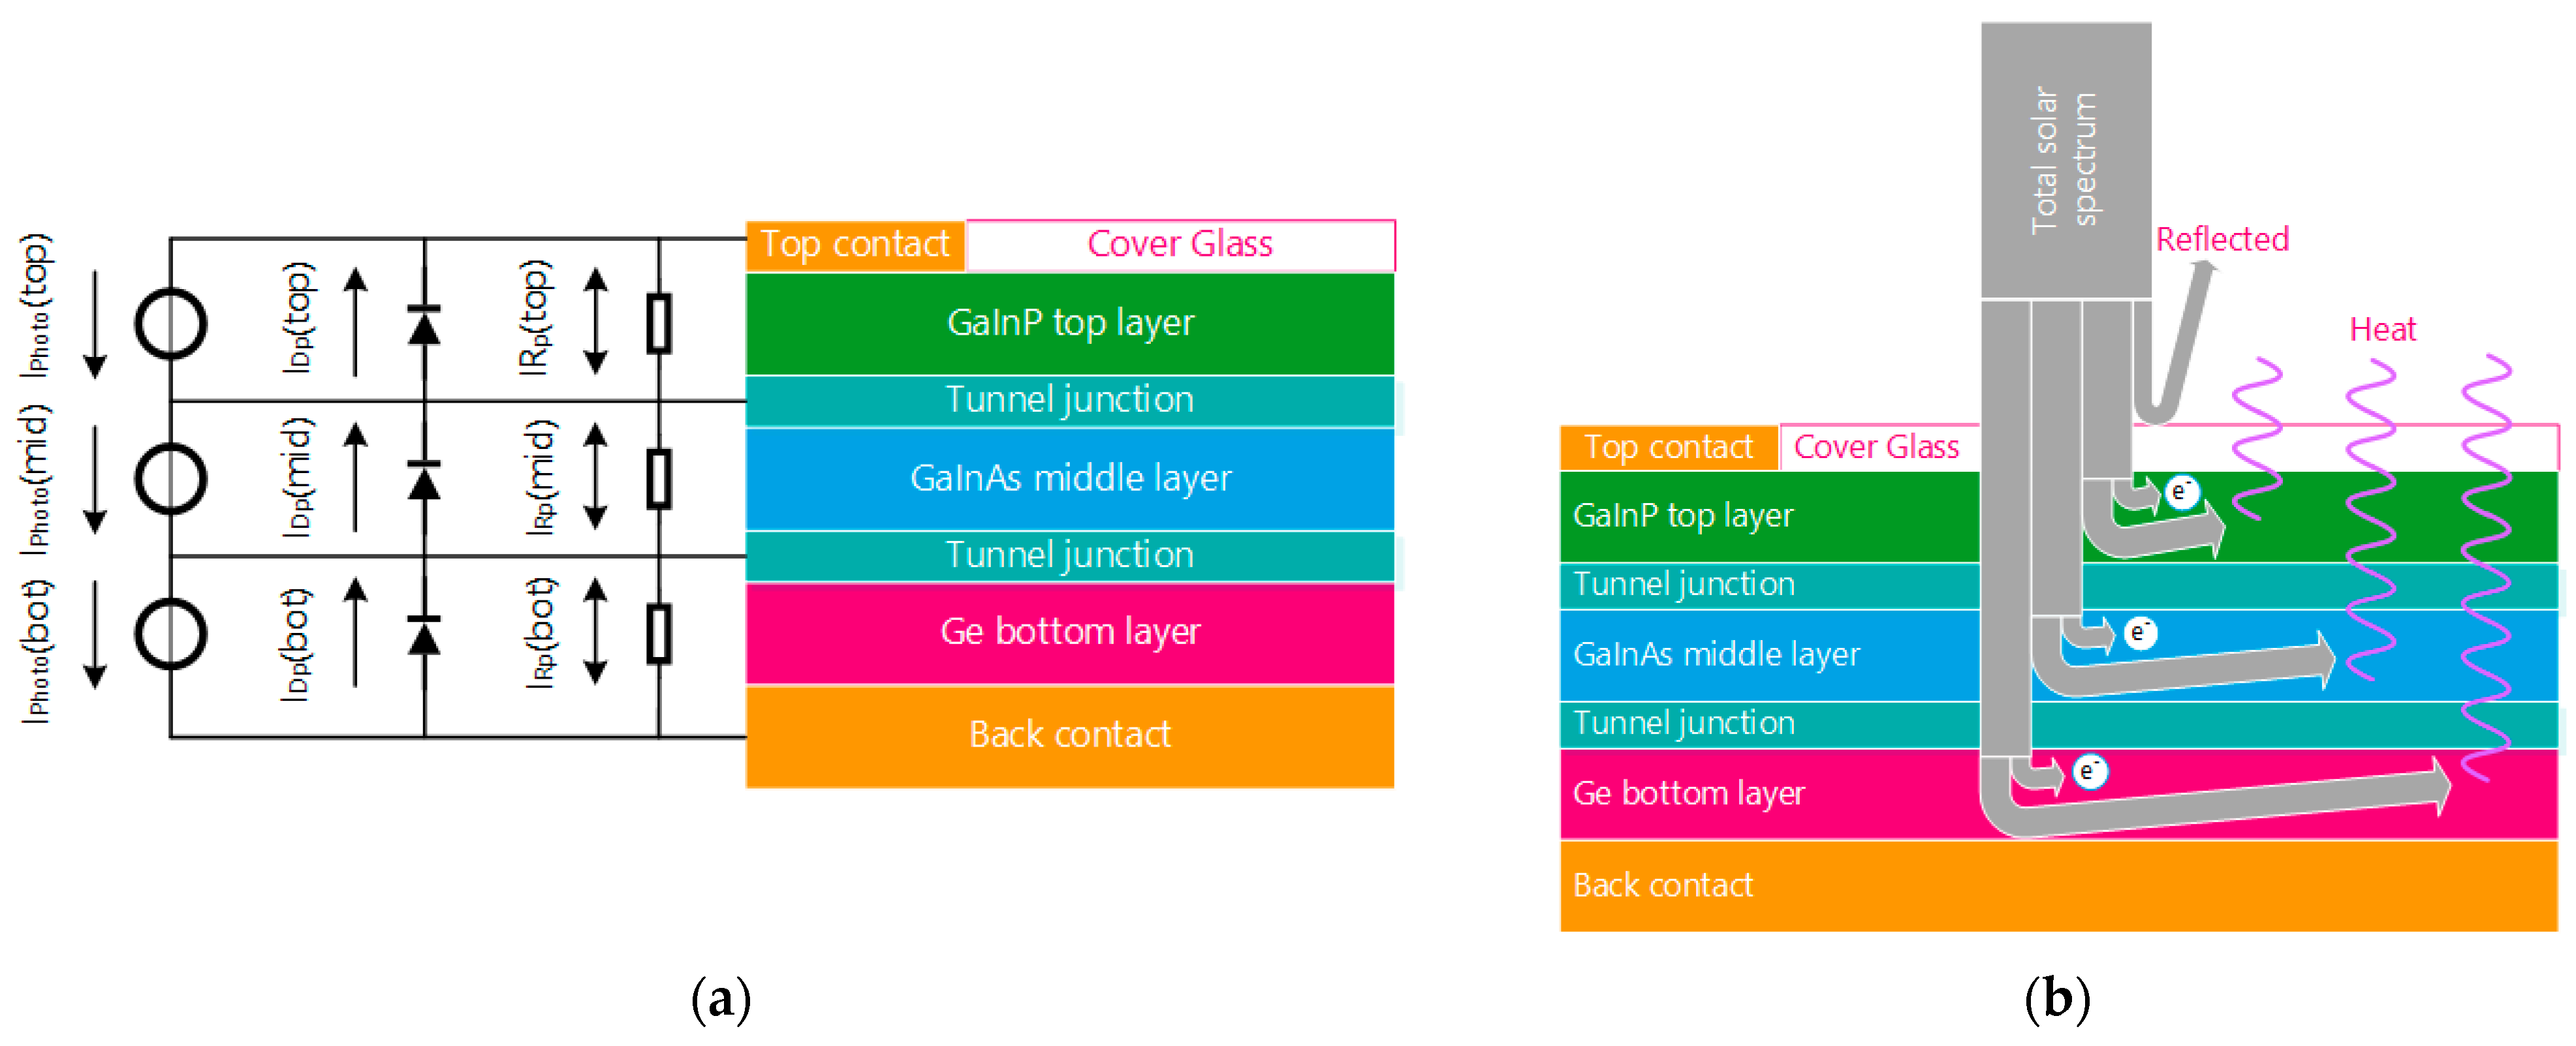
A further dip into the solar cell shows that different layers of the TJ solar cell contribute different percentages of total output power [
25]. For the TJ GaInP/GaInAs/Ge solar cell, the three different layers contribute different quantities of total power. The top GaInP layer absorbs photons with the highest energy of the three layers. The middle GaInAs layer absorbs photons with less energy, and the bottom Ge layer absorbs long-wavelength photons. The different photon energies contribute different voltage levels to the total output, of which the top layer contributes the most voltage, the middle layer less, and the bottom layer the least. Since the three layers are stacked together and connected in series, they contribute the same current to the total output current. The bottom layer contributes the least to the total output voltage and thus, the least to the total output power. Given that a portion of the Ge layer’s responsive spectrum is filtered out, it should have little effect on the total output power of the solar cell.
3. Solar Cell Thermal Balance Analysis
The absorbed solar energy can be divided into several parts. First, a minor part of the energy is reflected by the cover glass. Then, each layer of the sub-cells absorbs part of the energy within its responsive spectrum region, where about 30% of the total absorbed energy is converted to electricity. The rest of the solar energy is converted to heat, resulting in temperature rises in the solar cell. Due to its relatively low efficiency, about 70% of the solar energy is converted to heat.
Figure 3 shows the series model of a TJ GaAs solar cell and the distribution of solar irradiation [
22,
26].
For solar cell types other than TJ GaAs, the model is different, but the absorbed energy can similarly be divided into two parts, namely, the part that is converted to electricity and the part that is converted to heat.
The 30% TJ GaAs solar cell mentioned above can be used as an example. Its characteristics are shown in
Table 1. Using the energy balance formula, we derived:
where
is the total energy received at the surface of the solar cell,
is the absorption co-efficiency of the solar cell,
is the energy portion converted to electricity, and
is the energy portion converted to heat.
According to Stefan-Boltzmann’s Law, the radiated energy of objects in a vacuum environment can be expressed as:
where
is heat transfer per unit time (in watts),
is the Stefan-Boltzmann Constant is equal to 5.6703 × 10
−8 (W/m
2K
4),
is temperature in kelvin (K),
is area of the emitting body (in square meters), and
is the emissivity coefficient of the object. When
equals 1, the radiated energy equals that of a black body.
Combining the equations above, we calculated the balanced temperature of the solar cell in an outer space environment. It was assumed that the solar cell was glued to a carbon fiber panel, with the carbon fiber panel having the same area as the solar cell. The absorption co-efficiency and emissivity of the carbon fiber panel were both 0.85. Direct sun irradiation to the solar cell with no filter condition was assumed to fully utilize solar irradiation. The solar radiation energy was 1348 W/m
2, according to [
24]. In an actual space environment, the reflected energy from the earth and the earth radiation cannot be omitted. As an experience value, the energy reflected by the earth is 0.3 times that of the sun, and the earth’s radiation energy is 237 W/m
2 [
26]. The equation above can then be expressed as:
where
is the effective area of the solar cell,
is the absorption co-efficiency of the carbon fiber panel, and, since no generated electricity is used,
equals 0. Thus, the solar cell temperature could be calculated. The result was 96.3 °C when it was at balance, which was close to the simulation result using a thermal simulation software. Then, when the output power of the solar cell reached its maximum, Pmp, the balanced temperature was 73.5 °C. This result was reasonable since some of the energy was consumed outside the solar cell in the form of electricity.
Next, a real satellite solar panel was considered. Since solar cells are connected through interconnected tabs and the solar panel needed to be mounted to the satellite body through screws and bolts, there were prefabricated structures and mounting holes on the panel. The structure of the solar panel is shown in
Figure 4. For this reason, the effective area of the solar panel was smaller than that of the solar cell. The ratio of the effective area of the solar panel to the total area is the fill factor of the solar panel, which is usually around 0.8. The main characteristics of solar panels are shown in
Table 2. The equation is expressed as:
where
is the area of the solar panel, which equals
. The temperature of the solar panel, with no output electricity and with Pmp output, was 95.2 °C and 77.2 °C, respectively. The reason for the temperature difference between the bare solar cell and the solar cell on the solar panel was the slight difference in absorption co-efficiency and emissivity, and the results matched the thermal simulation data.
The calculation above does not take into account the temperature factor. As described above, the solar cell efficiency decreased by 3 to 4 percent for each 10 degree rise in temperature. When accounting for this, the equation calculating temperature for a real satellite solar panel changes to:
where
is temperature co-efficiency of the solar cell. When considering the effect of temperature on electricity conversion efficiency and Pmp output power, the balanced temperature for solar cells and satellite solar panels was 76.1 °C and 79.3 °C, respectively. If not considering temperature co-efficiency, the actual temperature rose by 2.6 °C and 2.1 °C, respectively, which shows that temperature has a notable influence on the efficiency of the electricity conversion of the solar cell. The calculation results are summarized in
Table 3.
4. Filtered Solar Cell Temperature and Output Current
Based on the calculations above, it is clear that the solar cell temperature was lower when generated electricity was used, and the relationship between solar irradiation and the solar cell temperature can be described quantitatively. In addition, when mounted onto a solar panel, the temperature of the solar panel was slightly higher than that of a bare solar cell. This is because there is some “dead area” on the solar panel that cannot generate electricity. As described in the previous section, among the solar irradiation spectrum, there is a part that cannot be utilized by the solar cell, which accounts for more than 10 percent of the total energy. To reduce solar panel temperature, the idea of adding a long-wave cut-off filter to the surface of the solar cell was proposed. Before we could turn the concept into reality, we first needed to understand the relationship between the solar irradiation spectrum and the electricity generated by the solar cell. As is known, the commonly used triple junction GaAs solar cell consists of three layers: GaInP, GaInAs, and Ge. It is difficult to calculate the actual energy output of each layer using a TJ GaAs solar cell. However, for actual GaInP/GaInAs/Ge solar cells, as analyzed above, the three layers are connected in series, so the output current of the three layers is always the same [
27,
28]. The open circuit voltage can be measured using a specially manufactured single layer solar cell, and the spectral response can be measured using monochromatic light. Based on these conditions, the relationship between short circuit current
and quantum efficiency
can be expressed as [
29,
30]:
where
is the total short circuit current generated by three layers of sub-cell, at a given wavelength
,
is the photon flux of the incident light, and
is elementary charge. The formula above is more experimental than theoretical, as real quantum efficiency is hard to calculate for real materials, but it is enough for solar cell output power calculations. The short-circuit current of a solar cell under direct solar irradiation can be calculated as:
where
and
indicate the integration range of the solar spectrum. Using the formula above, solar cell spectrum response data from [
23], and solar spectral irradiation data from [
24], we calculated the output power of each sublayer. The calculated
from equation above under AM0 was 15.95 mA/cm
2, close to the measured typical value of 16.7 mA/cm
2 and confirming the correctness of the formula.
Using the formula above, the relationship between the solar irradiation spectrum and the output power and temperature of the solar cell could be calculated. Since the Ge sublayer has the widest spectrum response and the lowest electricity generation, we assumed that all parts of the spectrum of the solar irradiation that can be responded to by the Ge sublayer were filtered out. Using the equation above and setting
to the beginning spectrum of the Ge sublayer, which was 900 nm, the current density could be calculated. The result was 9.9875 mA/cm
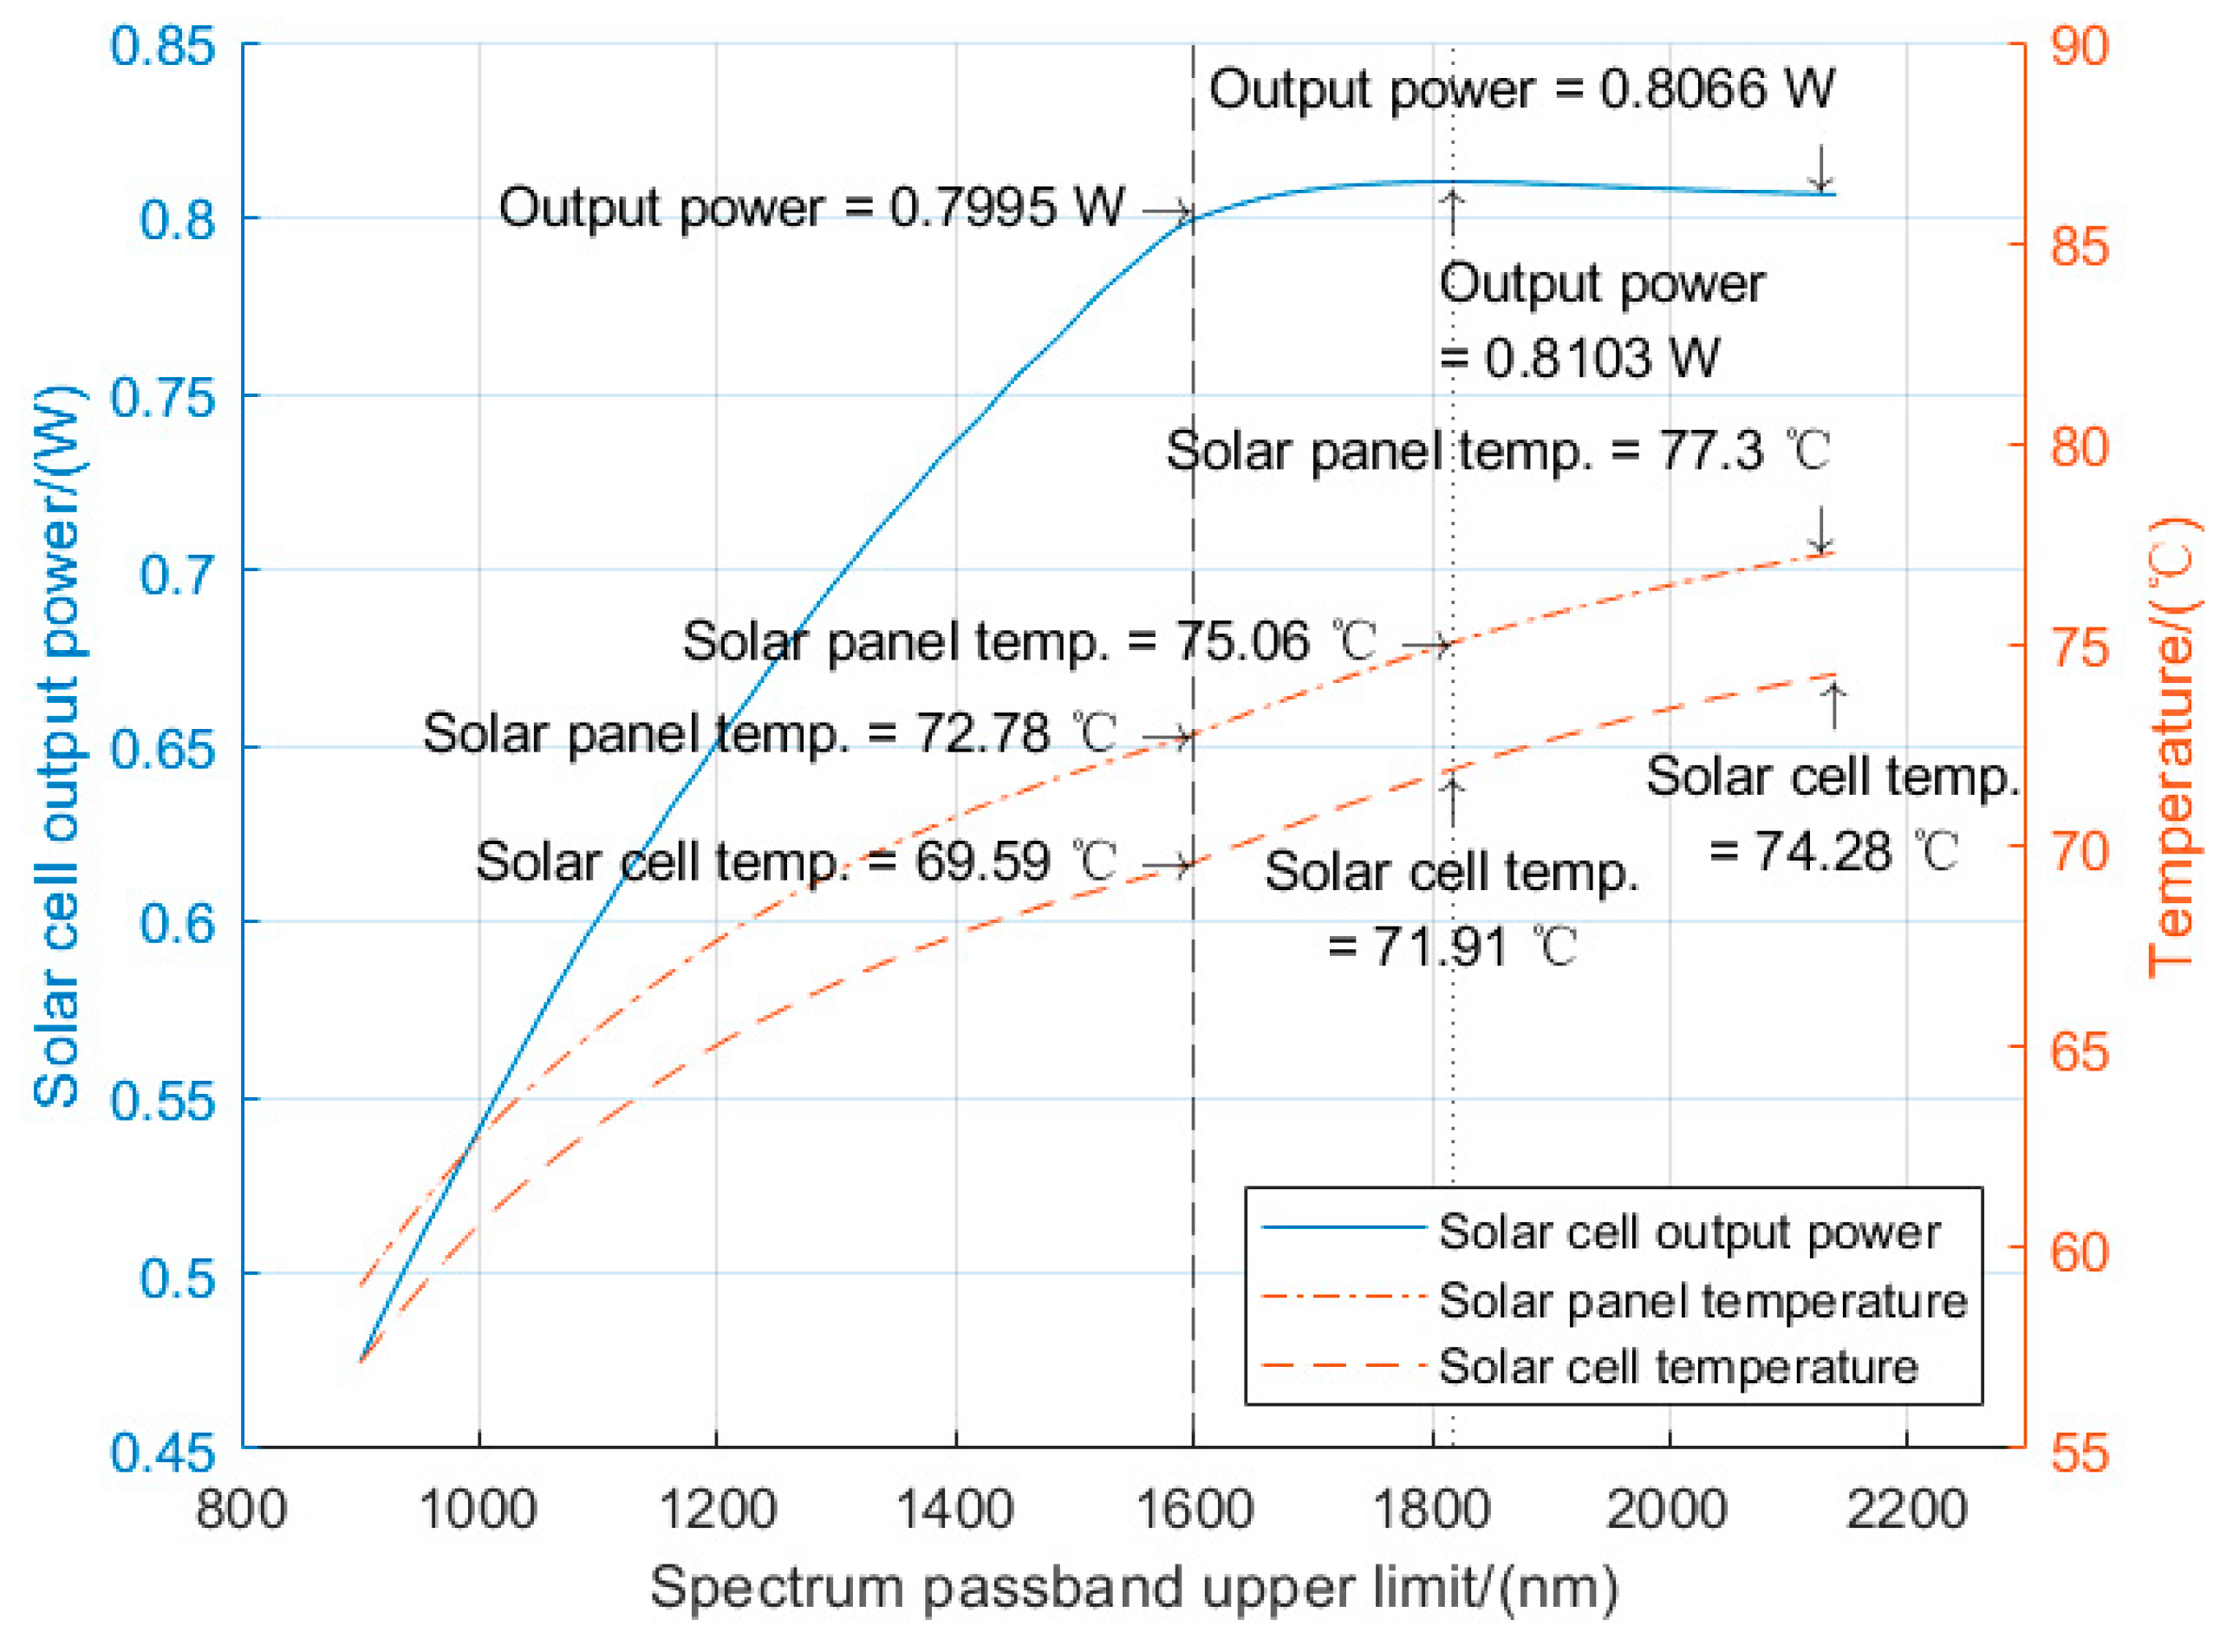
2, well below that of the full solar spectrum. Then, by increasing the integration range of the solar irradiation spectrum from the beginning of the Ge sublayer to the full solar spectrum, we obtained the relationship between the solar irradiation spectrum and solar cell output current density. The curves of solar cell output power, solar cell and solar panel temperature are shown in
Figure 5.
The comparison between solar cell temperature, solar cell output power, and solar panel temperature (assuming a fill factor of 0.8) is illustrated in
Figure 5. We can observe that the output power at 1600 nm was 0.7995 W, and reached maximum at 1818 nm. Further increasing the cut-off wavelength caused the output power to drop to 0.8066 W at 2140 nm. Since part of the solar energy exists beyond the computation range of 2140 nm, it was expected that the output power of a solar cell would be lower than 0.8066 W with the full solar spectrum. Using Stefan-Boltzmann’s equation described in the previous chapter, we obtained the temperature of the solar cell with its maximum output power, Pmp, and the temperature of the solar panel, as shown in
Figure 5. Contrary to output power, both solar cell and solar panel temperatures rose after 1818 nm, where the solar cell generated maximum output power. The temperature rose from 71.9 °C to 76.1 °C for solar cells and from 75.1 °C to 79.3 °C for solar panels, shown in
Table 3. The temperature reduction for solar panels was less effective compared to solar cells, since the base panel was not covered with long-wave cut-off filter, and all the solar irradiation was absorbed. If the base panel comes with fully reflective film on the surface, the temperature can be further reduced. In spite of this, the temperature reduction was obvious.
The calculated result was verified by Chang’e−4 satellite in-orbit data [
31], which showed that the solar panel’s high temperature was about 76.8 °C. The difference was mainly due to the large measurement precision (about 5 °C) of the thermistor used in the solar panel.
For other types of solar cells, such as single junction GaAs, c-Si, mc-Si, CdTe, and organic solar cells, the same results also apply.
Table 4 shows the parameters of some of the different types of solar cells.
The major parameters used were maximum power voltage, maximum power current, and solar spectral response, the last of which is shown in
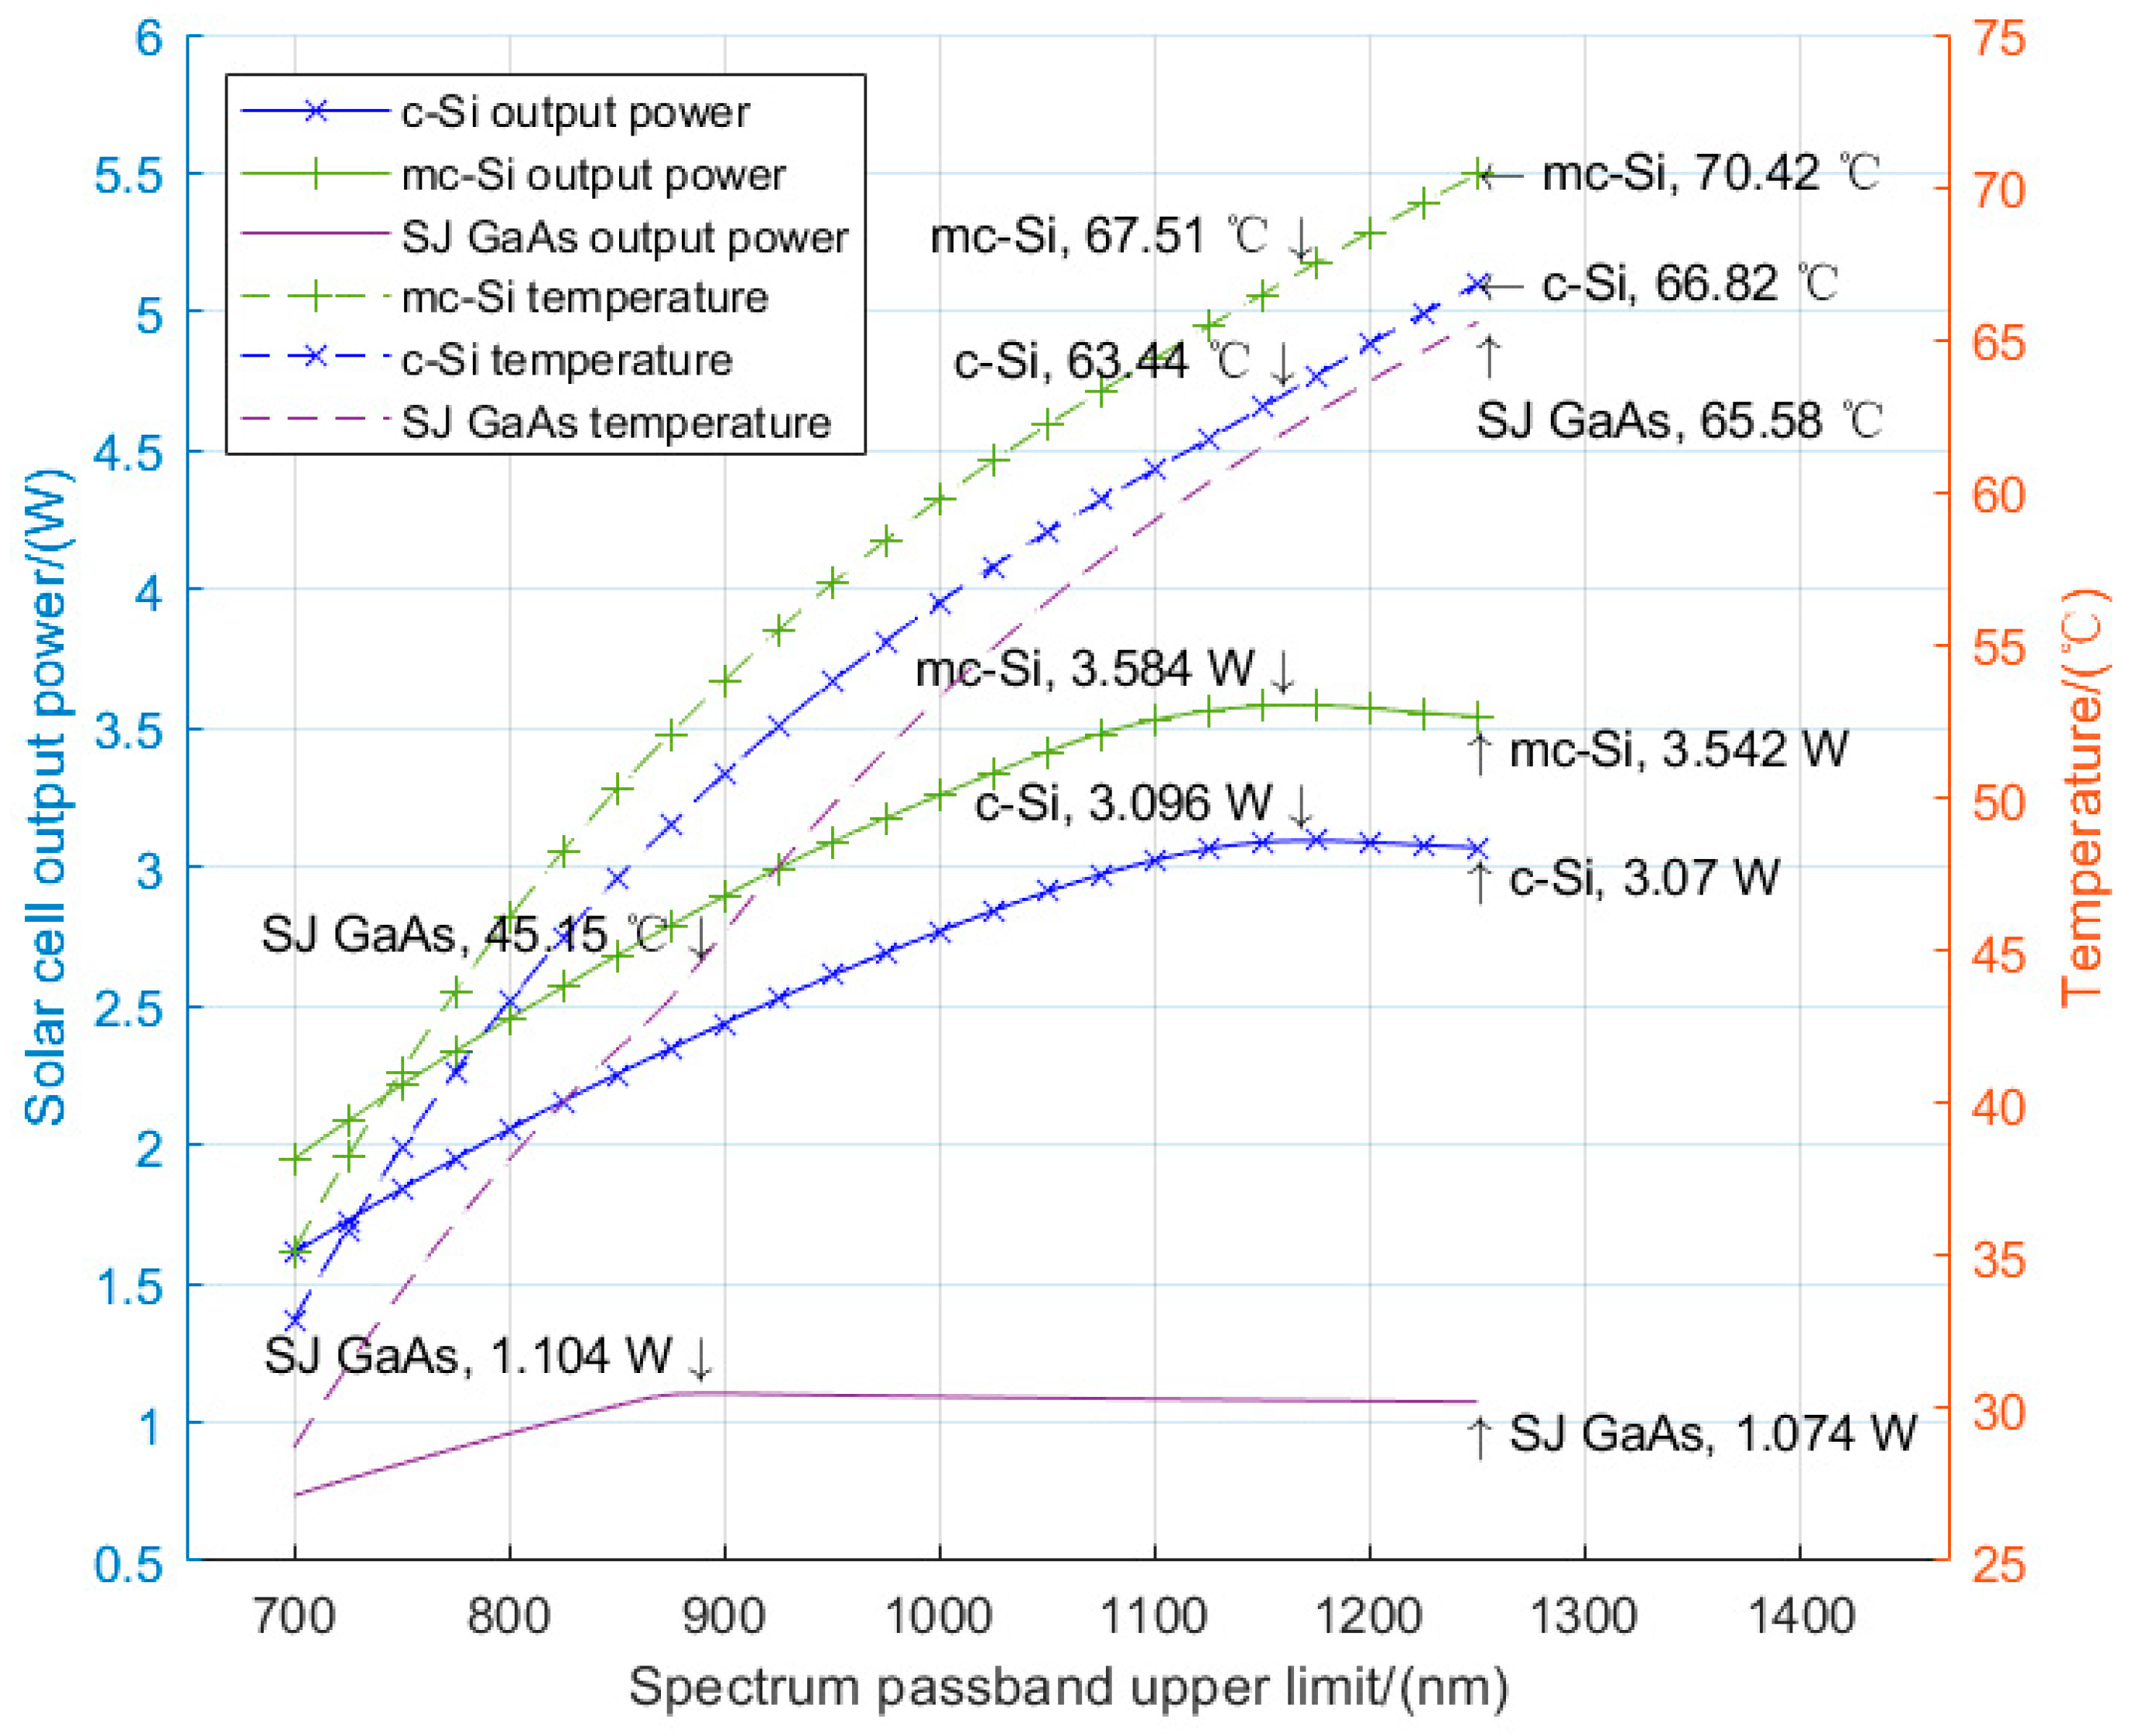
Figure 2. Using the same method for calculating the TJ GaAs solar cell, the relationship between the long-wave cut-off filter passband and the current density and solar cell temperature was calculated. The result is shown in
Figure 6. Furthermore, when there was no filter, the solar cell’s temperature was 84.75 °C for SJ GaAs, 86.15 °C for the c-Si solar cell, and 89.23 °C for the mc-Si solar cell.
For different types of solar cells, the calculation of current density and voltage was different [
32,
33], therefore the comparison mainly focused on the output power and temperature beyond the solar cell spectral response range. From
Figure 6, we observed that the output power peaked at the wavelength where the solar cell response range ended, after which point the output power dropped while the temperature kept rising, as confirmed by [
34]. Compared to the temperature with the full solar spectrum and suitable filter, the temperature decreased by 39.6 °C for the SJ GaAs solar cell, 22.71 °C for the c-Si solar cell, and 21.71 °C for the mc-Si solar cell.
5. Experimental Verification
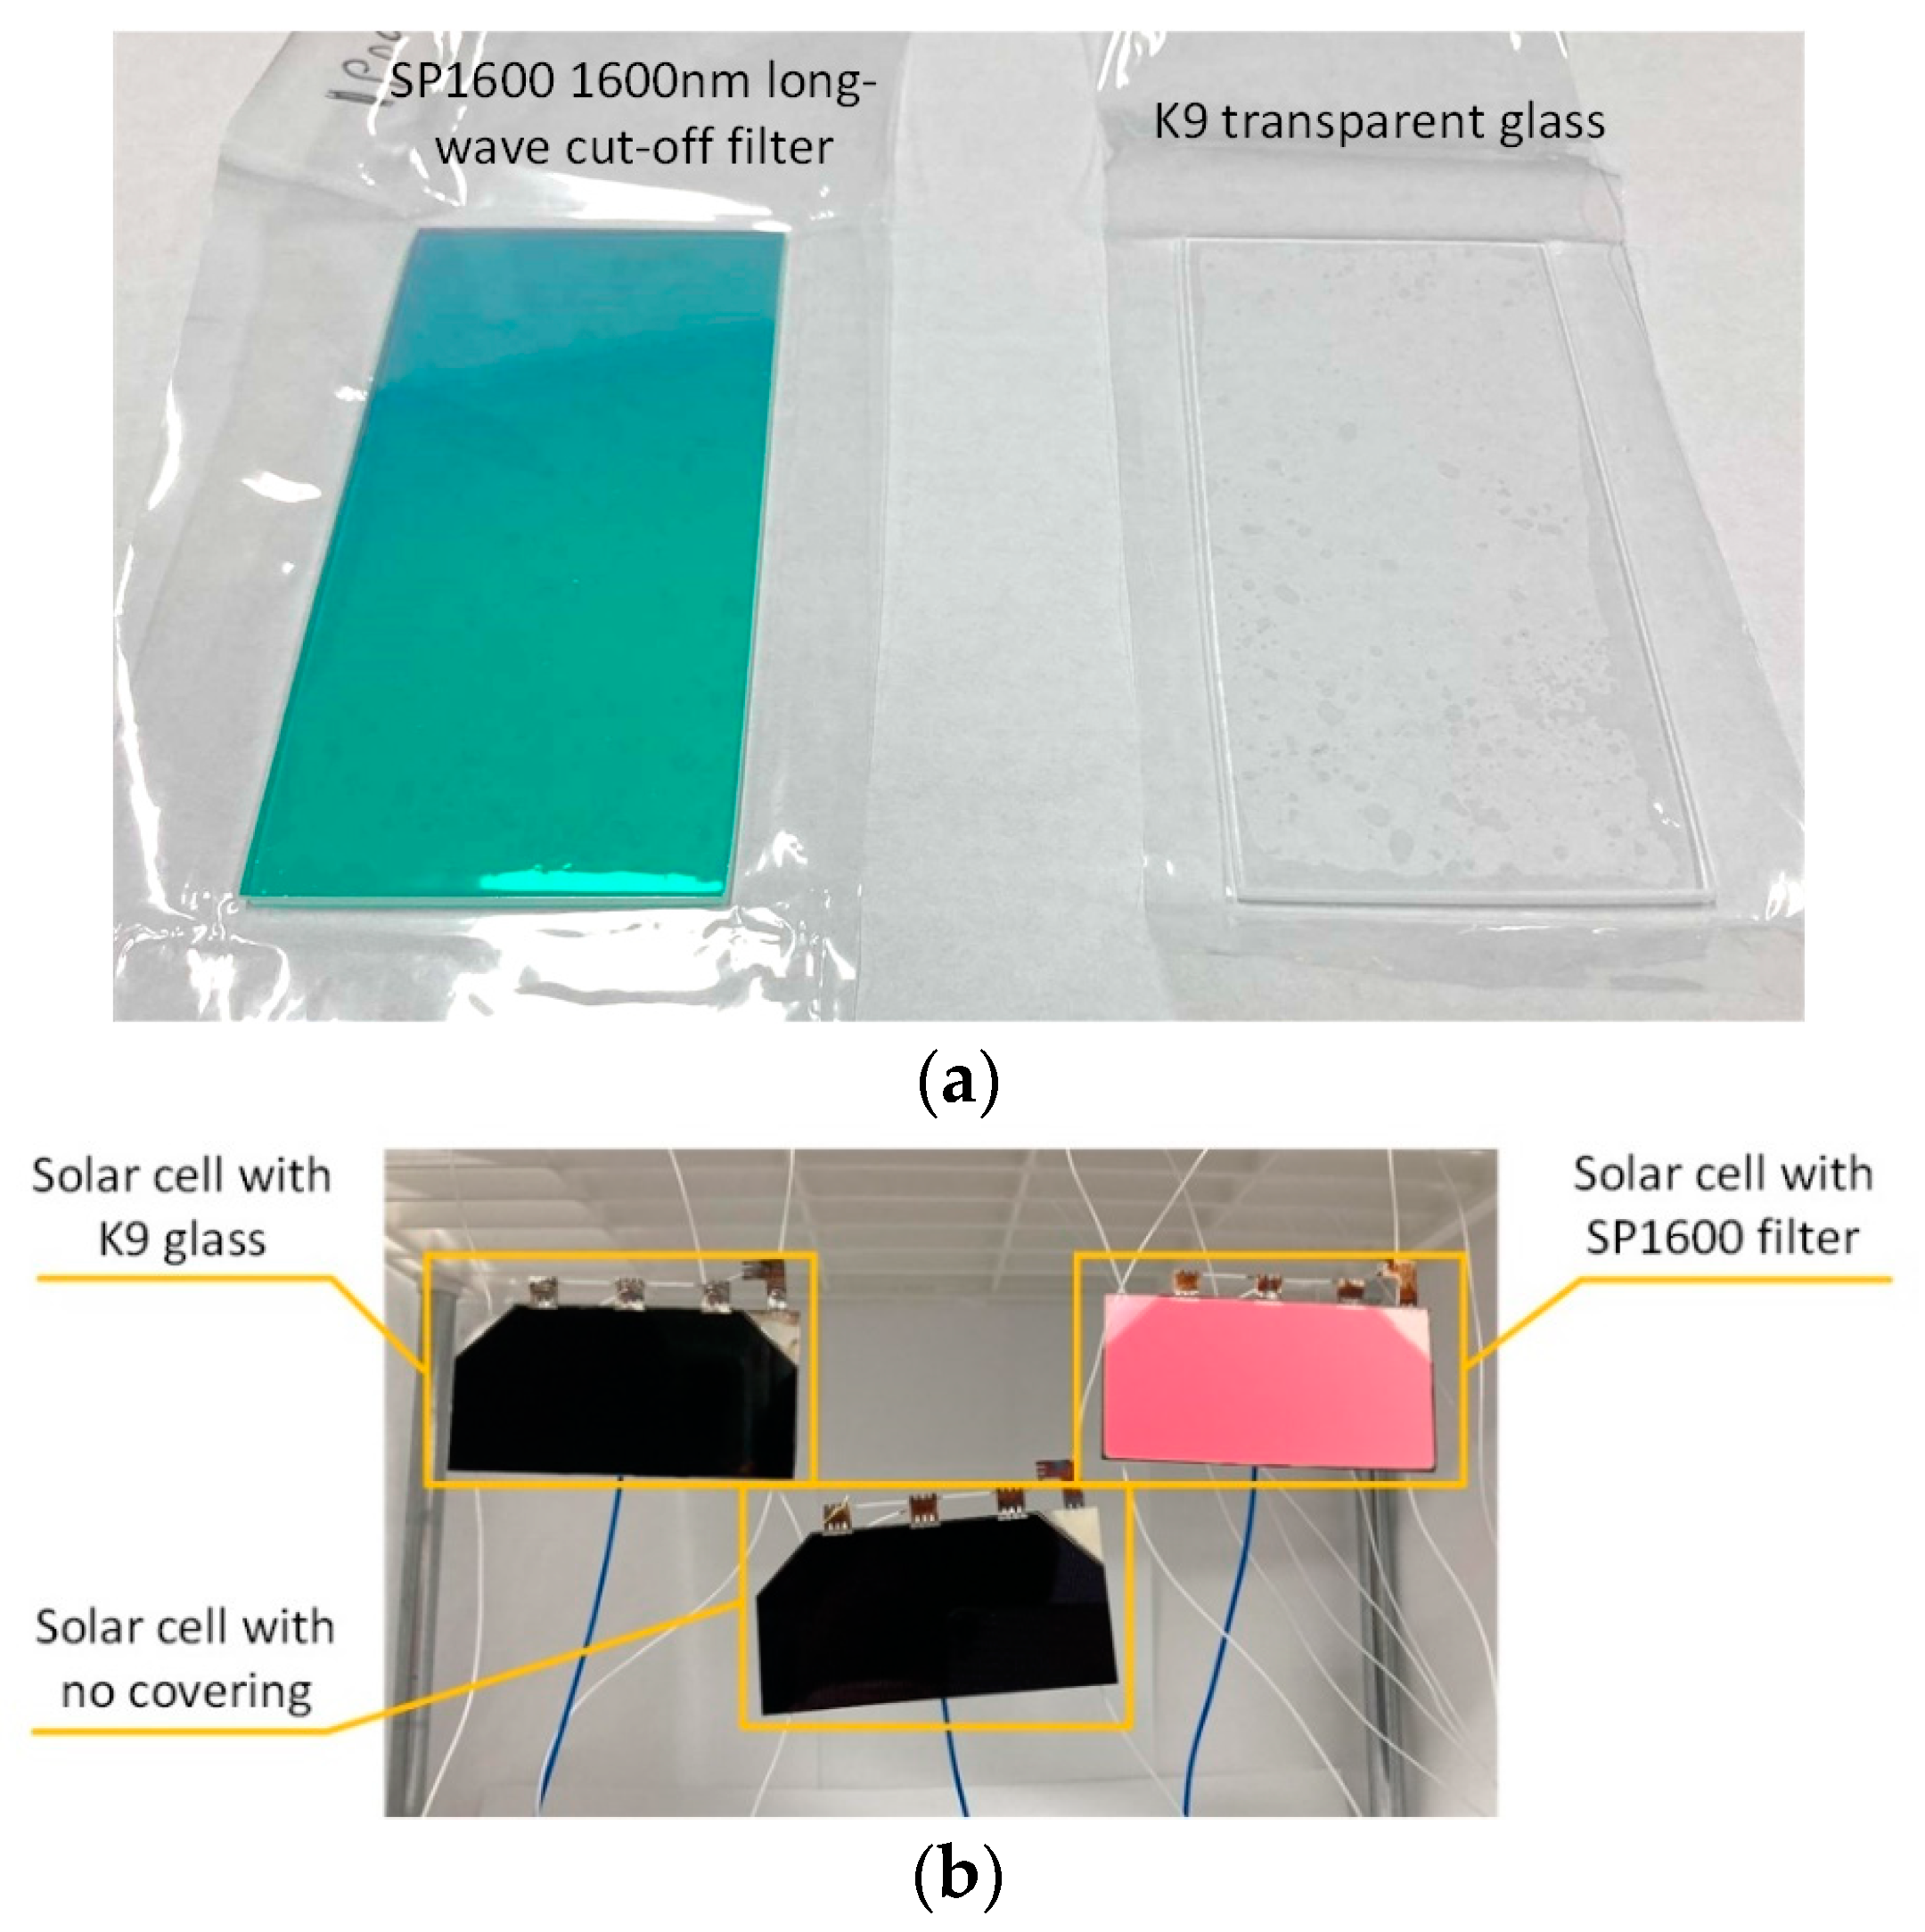
Due to equipment limitations, the experimental verification was designed and conducted in a clean room to qualitatively and preliminarily verify the proposed method to reduce solar cell temperature and increase efficiency. The main goal of the experiment was to validate the feasibility of the proposed method, and because the environmental conditions in a clean room and a vacuum are different, more research and testing should be conducted for a more accurate results. The materials used in the test are shown in
Figure 7, the parameters of the materials in
Table 5, and the parameters of the equipment in
Table 6.
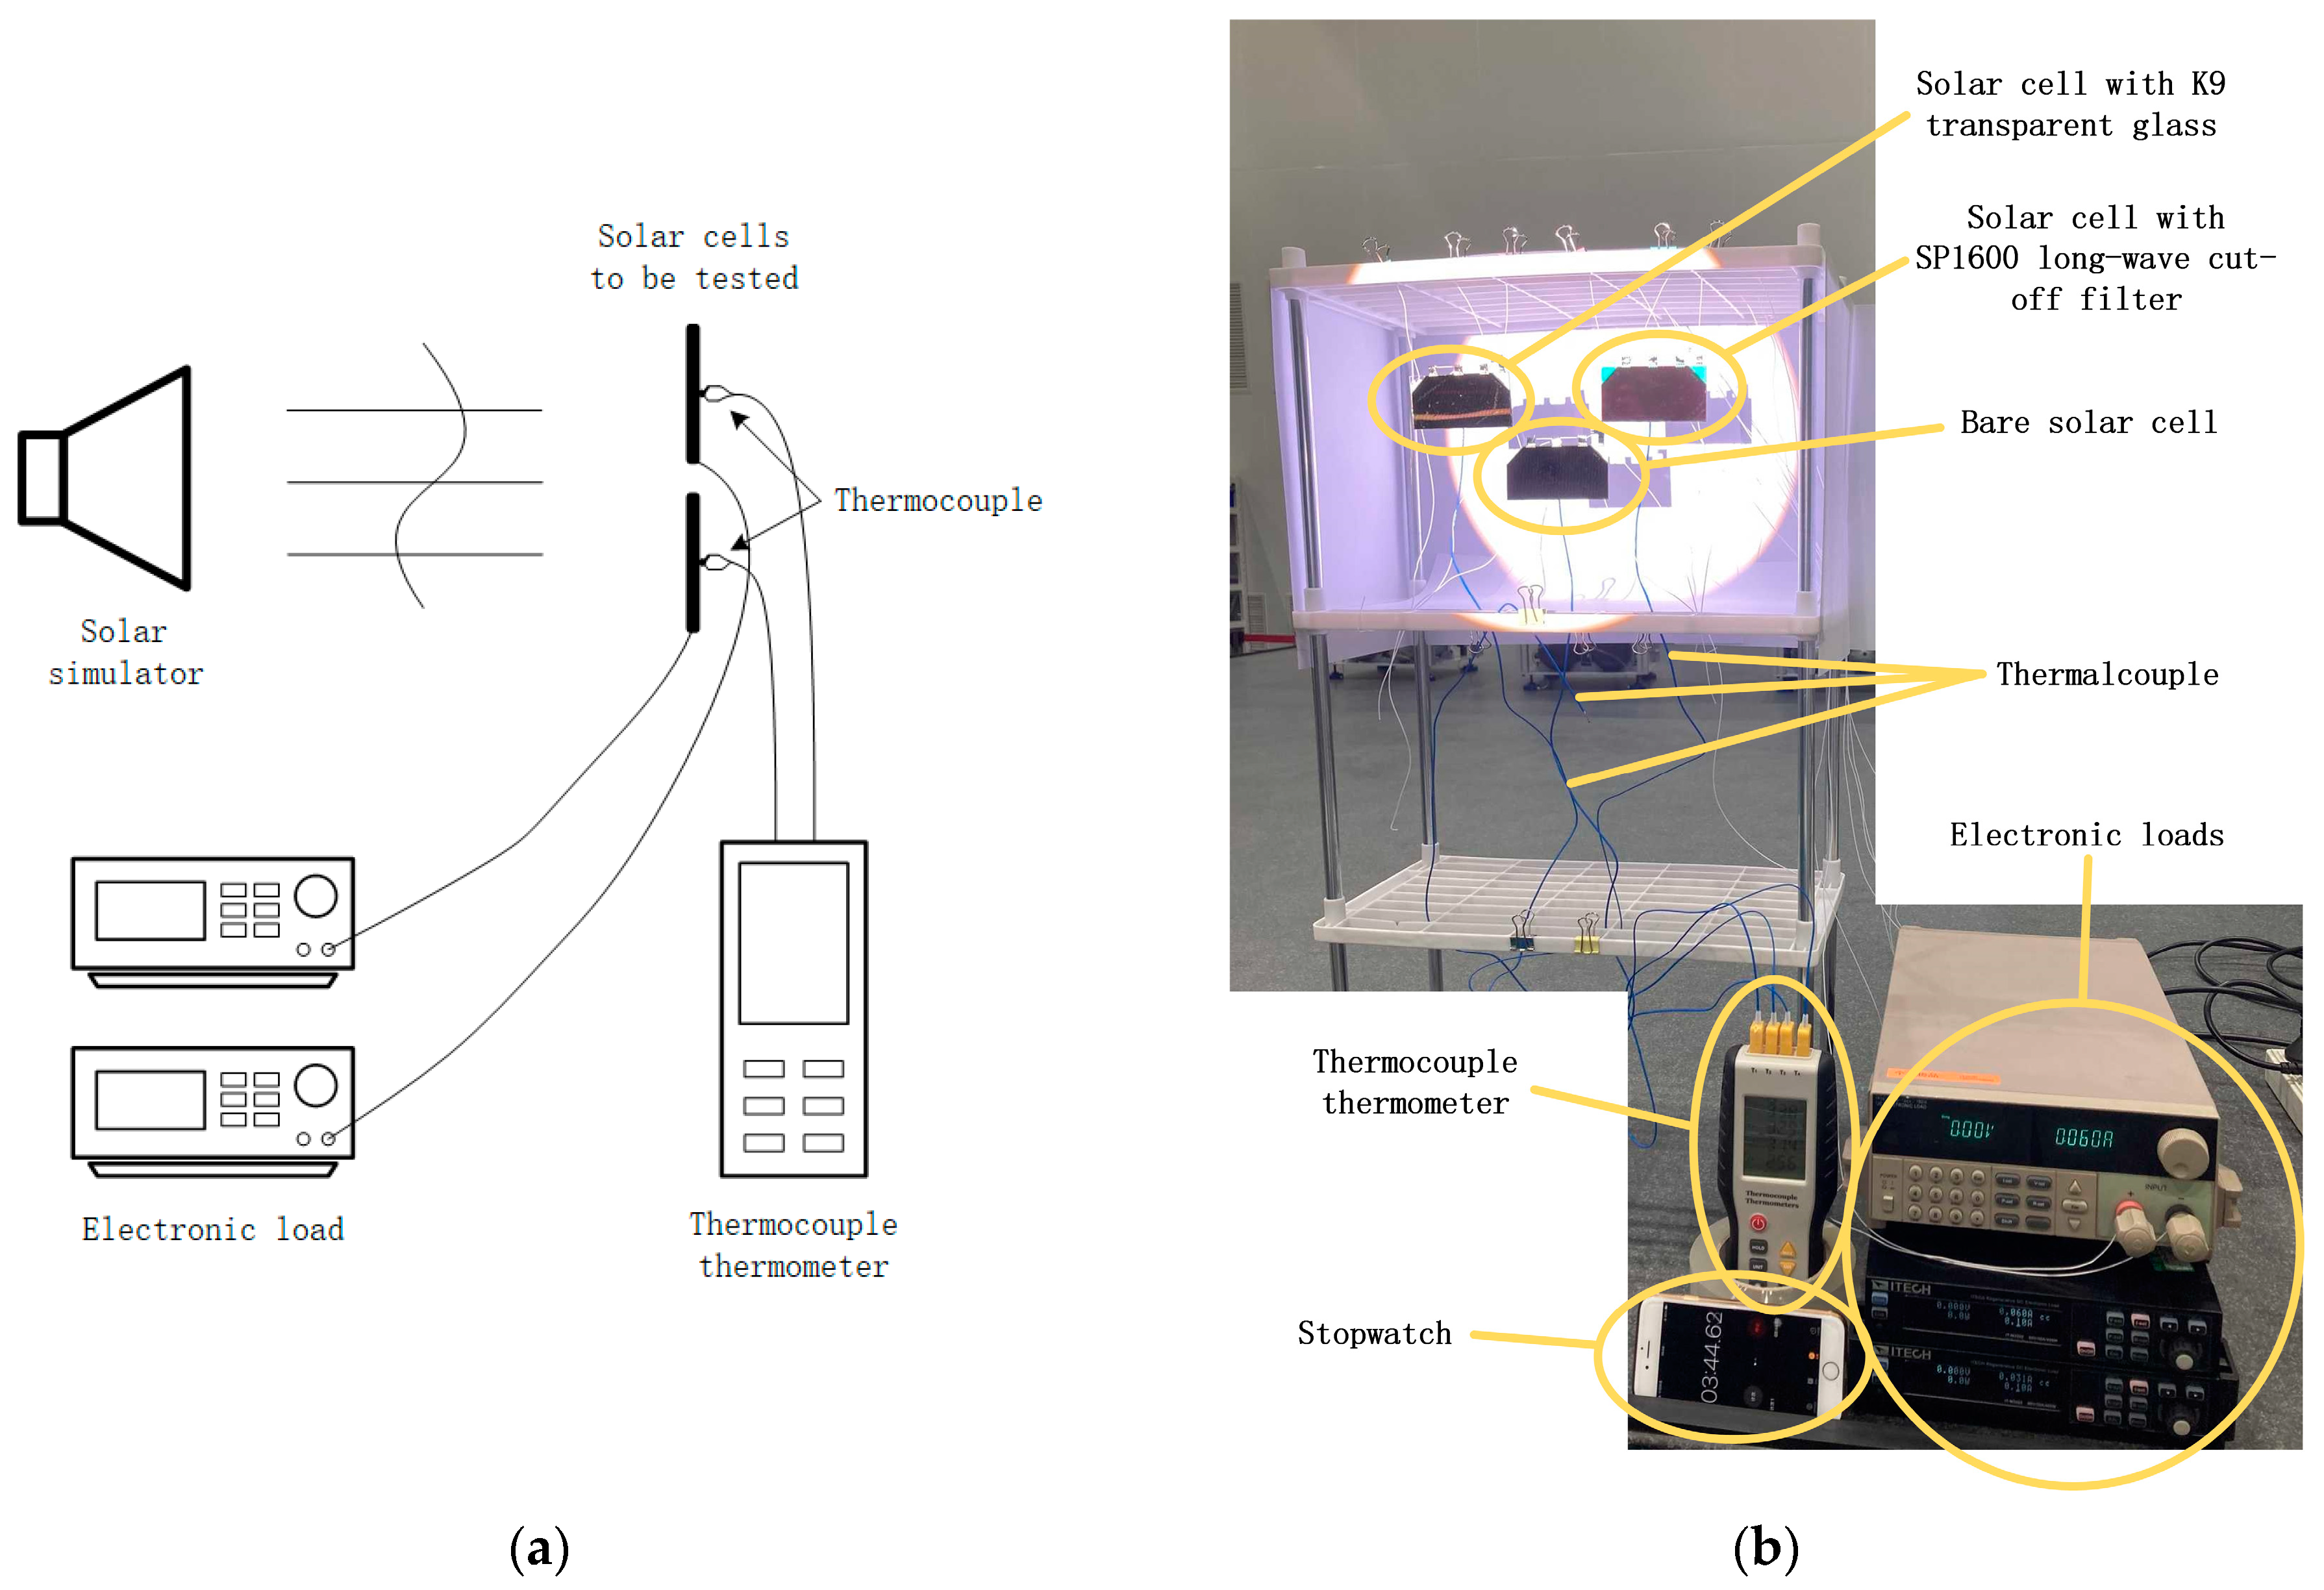
Figure 8 depicts the test setup, which included a solar cell with a SP1600 1600nm long-wave cut-off filter, a solar cell with a K9 transparent glass, and a solar cell with neither a filter nor a glass, with the light beam incident directly at a 90-degree angle. The blue wires were thermocouple temperature sensors that measured the temperature of each solar cell and room temperature.
Figure 8 shows how each solar cell was connected to one electronic load to measure the generated current and voltage. The three electronic loads, from top to bottom, were connected to a bare solar cell, a solar cell with K9 glass, and a solar cell with a SP1600 filter, respectively. The thermocouple thermometer was used to calculate temperature rise by measuring the temperature of each solar cell and the ambient temperature. Temperatures were shown in the order of channel 1 to channel 4 from top to bottom of the display; these measured the temperature of the bare solar cell, the solar cell with K9 glass, the solar cell with SP1600 filter, and ambient temperature, respectively. A cellular phone was used as a stopwatch. A short arc xenon lamp was used to illuminate the sun simulator, which was surrounded by mirrors and lenses to create collimated light. The light intensity was 0.2 sun, which is about 270 W/m
2, and the light spectrum was not the same as that of the sun, which made it difficult to compare the results, and will be discussed later on.
The test was conducted in two steps. First, all the solar cells were connected to electronic loads, and the electronic loads were set to constant current mode with a current greater than the solar cell could generate to measure temperature and short-circuit current. Then, the electronic loads were set to OFF, to measure temperature and open-circuit voltage. During both steps, ambient temperature was also measured to calculate the temperature rise of the three solar cells. Both steps were performed long enough to obtain steady-state temperature data. The test data are shown in
Table 7.
From
Table 7, we can observe that when the electronic loads were on, the solar cell with the long-wave cut-off filter had a lower temperature compared to the one with glass, and the solar cell with no cover had the highest temperature of all. Considering the transmission rate of glass, the difference is reasonable. However, the solar cell with the filter only generated half the current when compared to that of the solar cell with no cover or with glass. The reason may be because of the spectrum difference between a xenon lamp and the sun and the transmission rate of the filter.
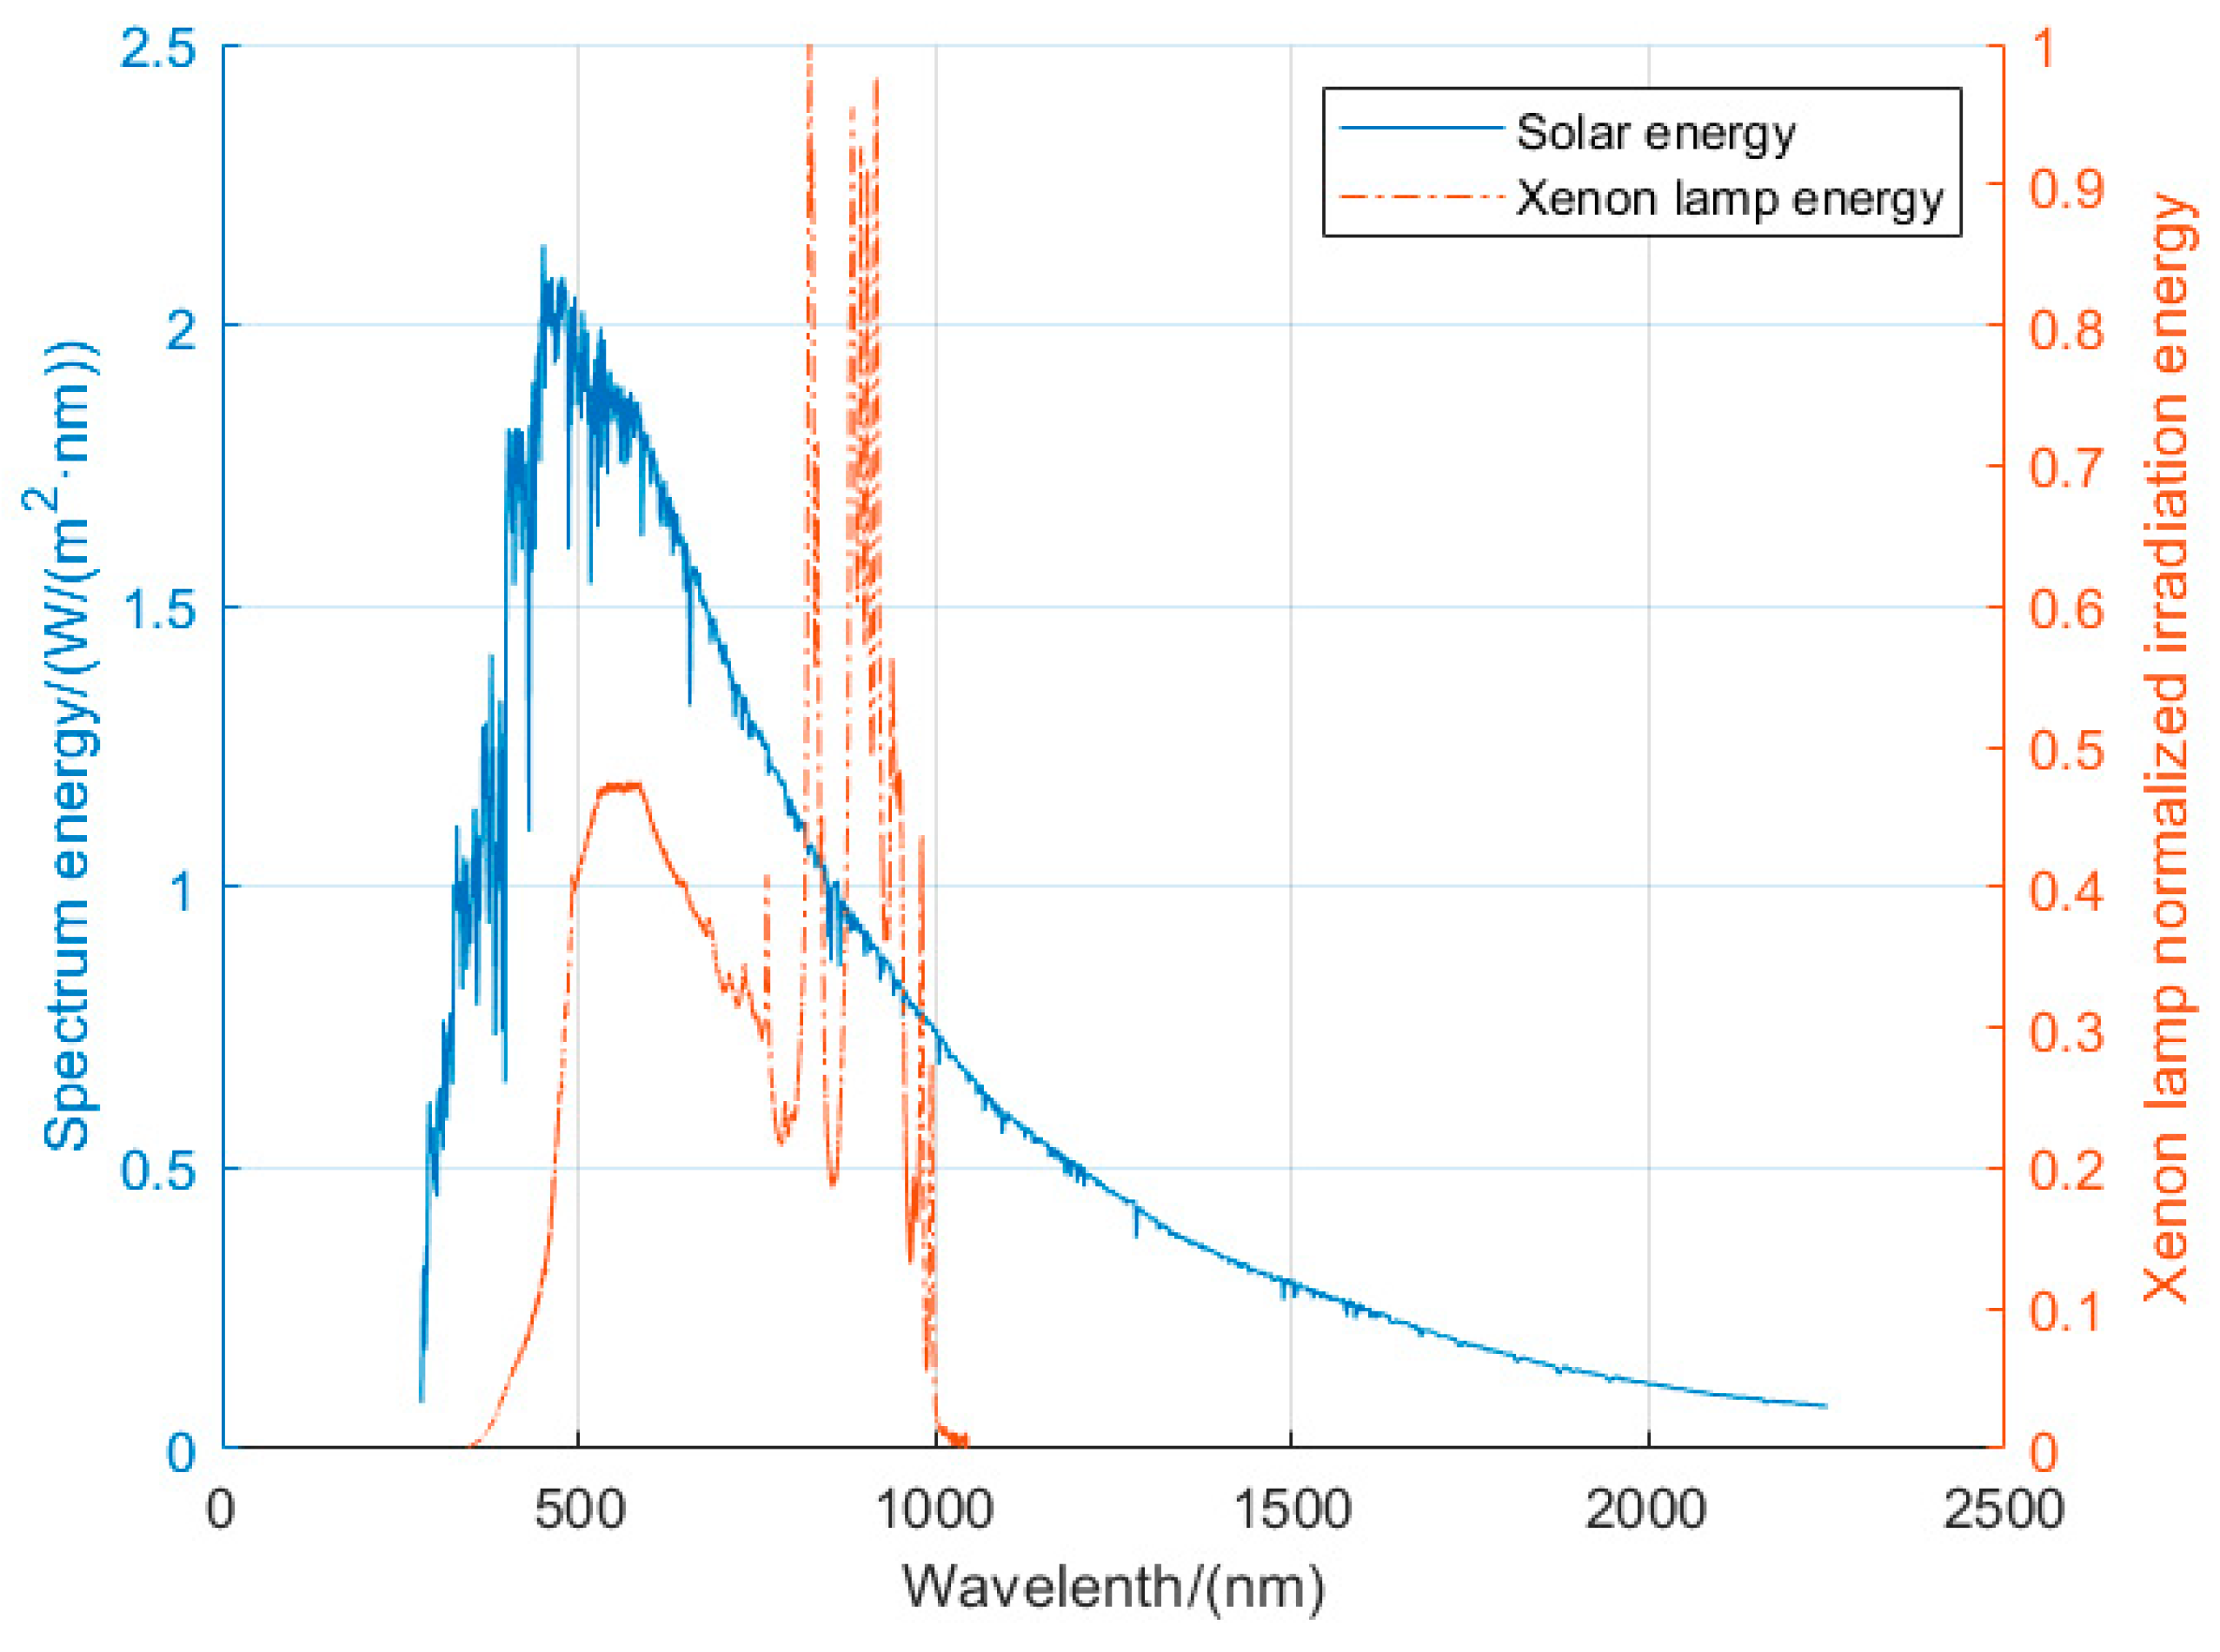
By measuring the spectral energy distribution of a xenon lamp used in the solar simulator, we found that there were several high-energy spikes in the xenon lamp spectrum, of which the energy was much higher than that of the sun, as shown in
Figure 9. Due to instrument limitations, the xenon lamp energy was measured from 350 nm to a little more than 1000 nm, which was narrower than the solar and xenon lamp spectrums, yet the difference was still obvious.
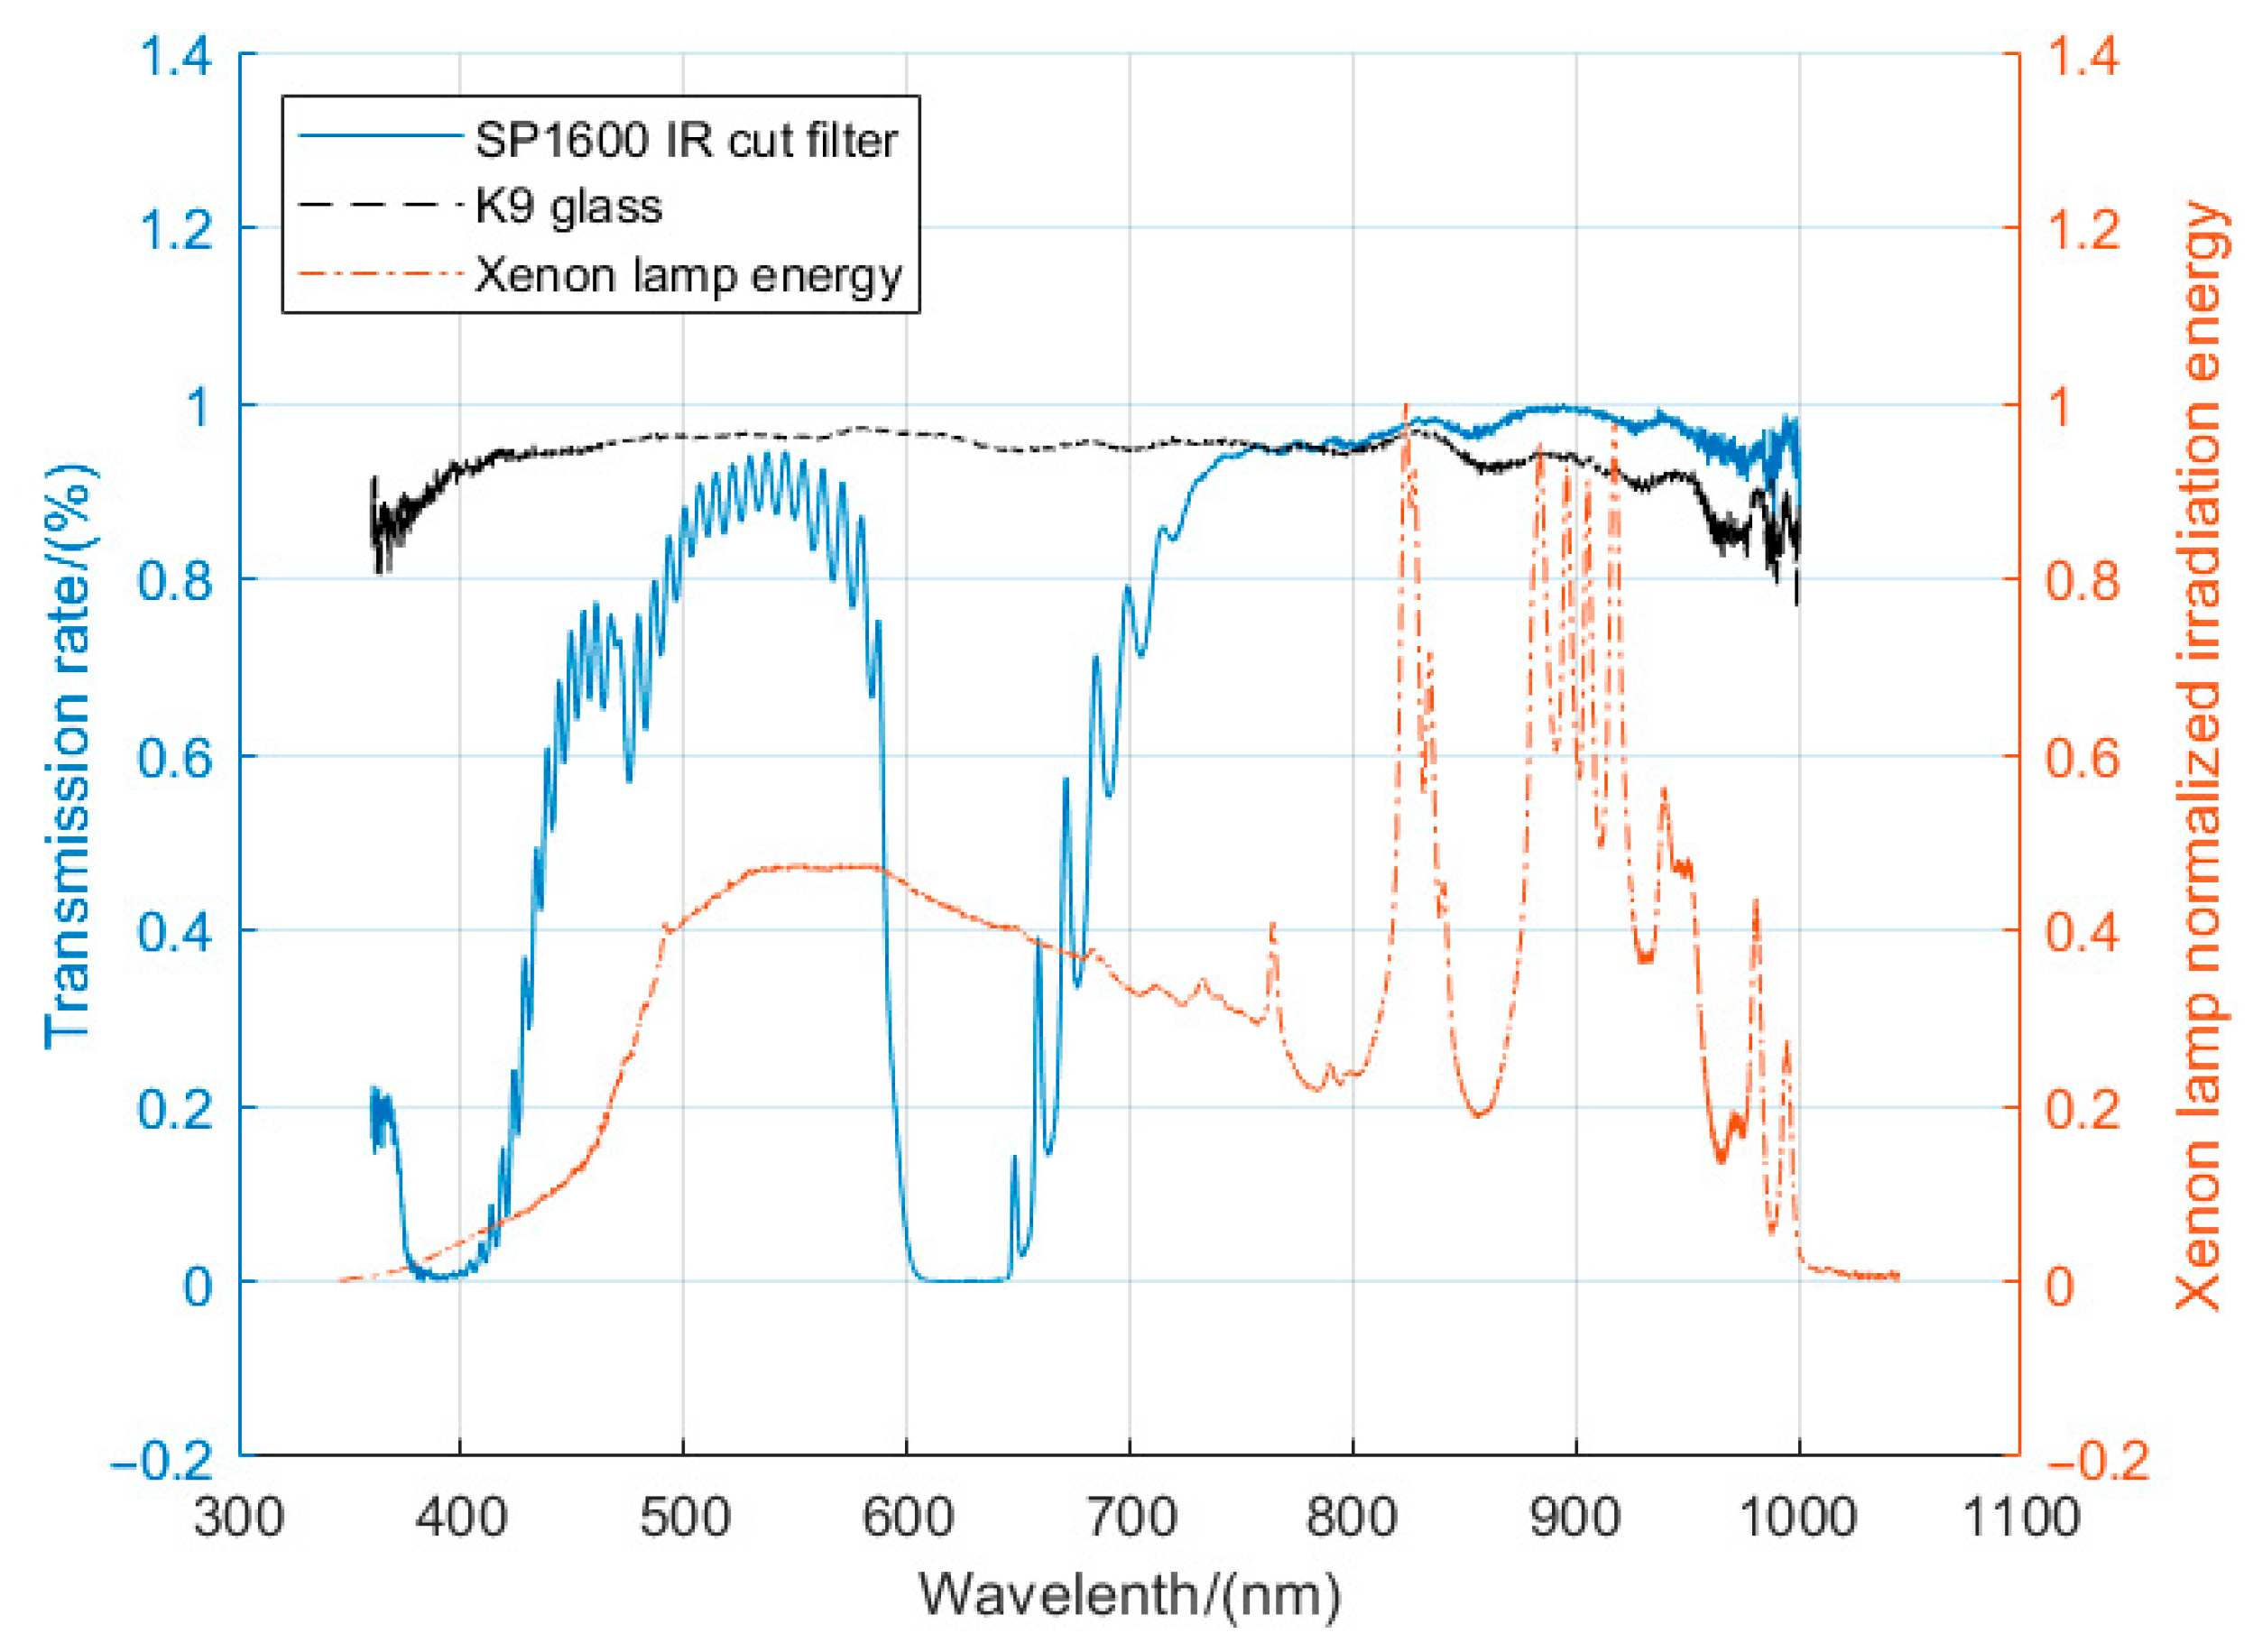
Furthermore, the transmission rate of the long-wave cut-off filter contributed to the low-output current of the filtered solar cell. The filter used in this test was the commercial off-the-shelf 1600 nm long-wave cut-off filter. Its transparency curve is shown in
Figure 10. While its cut-off wavelength was 1600 nm, its transmission rate from 350 nm to 1000 nm was not as flat, with some transmission rates as low as nearly 0. Its low transmission rate in the shortwave region fell into the GaInP/GaInAs response spectrum, which caused little electricity generation. Since the three layers were connected in series, the high current generated by the Ge layer was limited by the GaInP/GaInAs layer, limiting overall current output. The above two factors together contributed to the low output current of the solar cell with filter. Meanwhile, the transmission rate of K9 transparent glass was relatively flat in the same range, making the output current of the compared solar cell nearly the same as that of the solar cell with no covering.
6. Discussion and Conclusions
The characteristics of the widely used triple junction GaInP/GaInAs/Ge solar cell were first analyzed. The spectrum response of a triple junction GaInP/GaInAs/Ge solar cell showed that it cannot utilize solar irradiation above 1818 nm, and the total energy of such a section took up about 10% of the total solar irradiation energy. The calculations and simulation proved that if part of the solar spectrum is filtered out, more specifically wavelength longer than 1818 nm, the solar cell temperature can decrease from 76.1 °C to 71.9 °C with increased output power. This is because the output power-temperature co-efficiency of the solar cell was negative. In addition, several other types of solar cells were analyzed for comparison, showing similar results that only differed in cut-off wavelength.
The experiment, however, showed that while the temperature decreased, the output current of the solar cell with filter decreased by half. The reason for the decrease in output current is that the long-wave cut-off filter used had a relatively low transmission rate in the short-wave region, and the xenon lamp in the sun simulator had a different spectrum than that of the sun. The spectral strength of the sun simulator in the GaInP/GaInAs responsive region was lower than that of the sun, resulting in low current output. Meanwhile, the temperature difference was not as ideally calculated, since the light irradiation strength was only 1/5 that of the sun.
While this experiment verified some of the assumptions above, further experiments could be conducted with the following improvements: (1) Improving the long-wave cut-off filter transmission rate in the short-wave range with multi-layer coating and direct coating to solar cell, rather than adding a layer of filter, to achieve a high and flat transmission rate in the GaInP/GaInAs/Ge responsive region; (2) Testing under the sun rather than using a sun simulator, or adding an extra filter between the sun simulator and the tested solar cell to form a light irradiation with a spectrum similar to that of the sun.


