Article

Medium-Energy Proton Detector Onboard the FY-4B Satellite

1
National Space Science Center, Chinese Academy of Sciences, Beijing 100190, China
2
Beijing Key Laboratory of Space Environment Exploration, Beijing 100190, China
3
Key Laboratory of Space Weather, National Satellite Meteorological Center, China Meteorological Administration, Beijing 100081, China
4
Innovation Center for Fengyun Meteorological Satellite, Beijing 100081, China
5
Shanghai Institute of Satellite Engineering, Shanghai 201109, China
*
Author to whom correspondence should be addressed.
Aerospace 2023, 10(10), 889; https://doi.org/10.3390/aerospace10100889
Submission received: 27 August 2023 / Revised: 11 October 2023 / Accepted: 13 October 2023 / Published: 18 October 2023
(This article belongs to the Special Issue Meteorological Satellites Data Analysis)

Abstract

:
This work introduces the instrument design of the medium-energy proton detector (MEPD, detection range: 30 keV–5 MeV) mounted on the Chinese Fengyun-4B (FY-4B) satellite. Compared to a similar detector on the Fengyun-3E (FY-3E) satellite, this instrument has undergone significant changes due to the different orbital radiation environment and solar lighting conditions. Based on the calculation of the radiation model AP8, the geometrical factor is reduced to 0.002 cm2sr, while that of the MEPD on the FY-3E satellite is 0.005 cm2sr. Another difference is that the sensors in some directions are exposed to direct sunlight for 80 min every day on this orbit, depending on the attitude angle of the satellite, which is much worse than that on the FY-3E satellite. According to the calculation results of transmittance of photons through different materials, a 100 nm thickness nickel film is added in front of the sensors to eliminate light pollution completely. The test using a solar simulator shows that the measure is effective and the detector has no error count when the solar irradiance coefficient is 1.0. In addition, the Geant4 software is applied to simulate the particle transportation process under complete machine condition to check the contamination of electrons in the sensors in all directions after magnetic deflection. The data obtained in orbit show that the instrument works properly, and the data are in good agreement with the AP8 model. The observations of the MEPD on board the FY-4B satellite can provide important support for the safety of spacecraft and theoretical research related to space weather.

1. Introduction

Located at the geostationary orbit, the Fengyun-4 series of satellites is the second generation of meteorological satellite of China. The observation data from FY-4 are real-time and continuous, so it is an ideal platform for space environment monitoring and alarm service, including numerical weather prediction, disaster weather warning, ecological environment monitoring, communication and navigation safety, and other fields. Launched on 3 June 2021, the FY-4B satellite is the first operational satellite of this series, on which many payloads in the space environment monitoring instrument package are newly added or optimized compared to the FY-4A satellite, such as medium-energy proton detectors (MEPDs), medium-energy electron detectors (MEEDs), high-energy particle detectors (HEPDs), plasma analyzer, fluxgate magnetometer and radiation dosimeter. Together with the FY-4A satellite, the double-star network [1] will further meet the service needs of China and countries and regions along the Belt and Road [2] for meteorological monitoring and forecasting, as well as emergency disaster prevention and mitigation. Figure 1 shows all the detectors in the space environment instrument package.
The FY-4B satellite is located in a stationary orbit over the equator at 133° east longitude, with an orbital altitude of 36,000 km. This orbit lies at the edge of the outer radiation belt and it has a strong electron radiation background (Figure 2), which disturbs frequently [3]. The particle sources in this orbit include radiation belt particles, solar energetic charged particles and galactic cosmic ray particles [4,5,6].
Joint observation of medium- and high-energy particles on this orbit can realize seamless and precise measurement of the full spectrum with a high resolution so as to monitor the transport and distribution of particles, which is extremely meaningful for studying the energy transport from the magnetotail to the Earth and global radiation environment modeling [7]. The MEPD on FY-4B satellite is equipped with two components, detector A and detector B, both of which are installed on the top panel of the satellite. The field of view (FOV) of each detector is a 180° × 20° sector (composed of nine 20° × 20° FOVs), which is parallel to the equatorial plane for detector A and parallel to the meridian plane for detector B. Figure 3 shows the overall layout of the satellite (left) and the partial enlarged view of the installation diagram of the two detectors (right).
This article is organized as follows: Section 2 introduces the mission requirements, mainly scientific indicators of the MEPD. Section 3 briefly describes the detector design as a whole and focuses on the geometrical factor design and light-blocking layer design. Section 4 discusses the calibration and the testing results on the ground. Section 5 provides some results of in-orbit detection during the initial launch phase to verify the performance of the instrument.
The ground calibration results indicate that these two detectors exhibit excellent performance, and the design of the detector meets the requirements of detection tasks. Preliminary on-orbit observations show that the proton spectra measured are in good agreement with the results obtained from the radiation belt model AP8.

2. Mission Requirements

The task of the MEPD on the FY-4B satellite is to achieve a wide energy spectrum detection of 30 keV–1 MeV particles in 18 directions, including 9 directions divided along the meridian plane and another 9 directions divided along the equatorial plane, and to divide them into 12 energy channels in each direction. The actual measurement range is consistent with the detector on the FY-3E satellite [8,9], which is 30 keV–5 MeV. Detailed scientific indicators are shown in Table 1.

3. Instrument Design

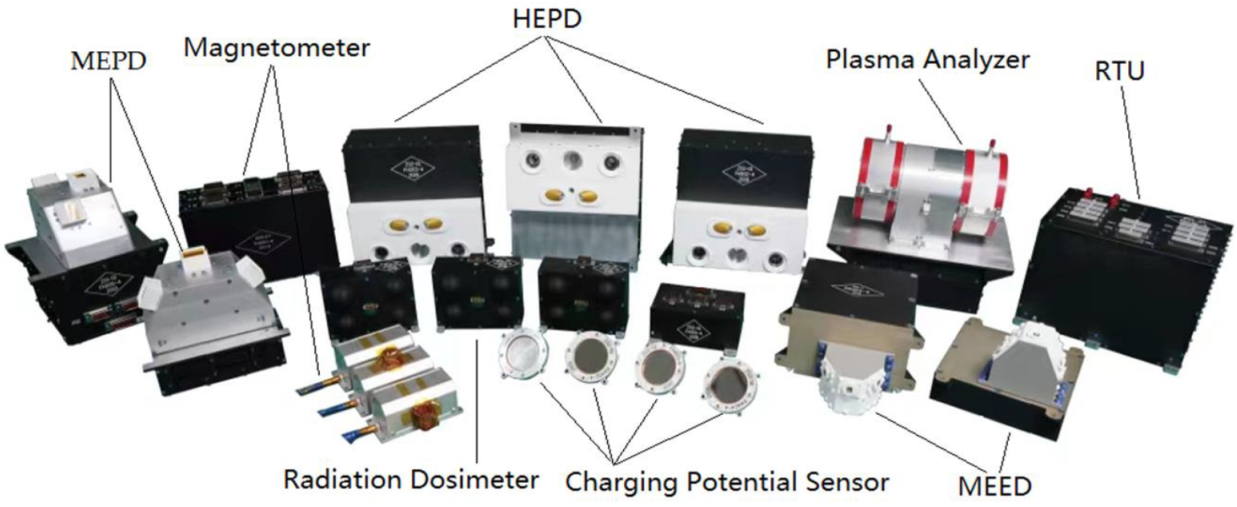
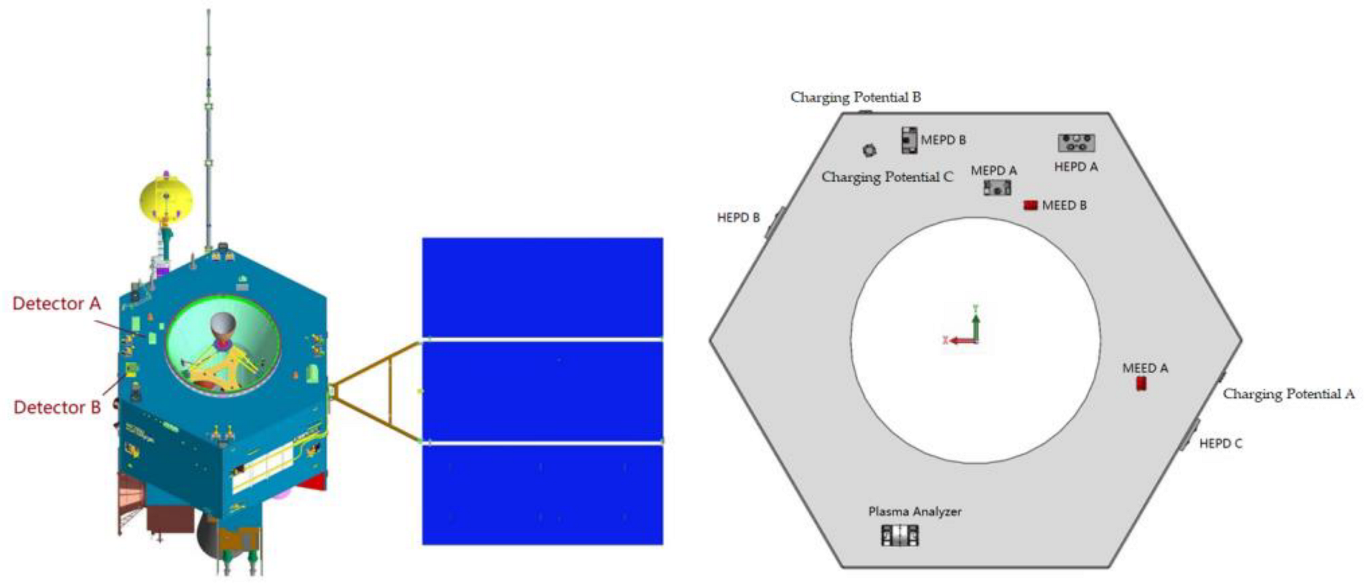
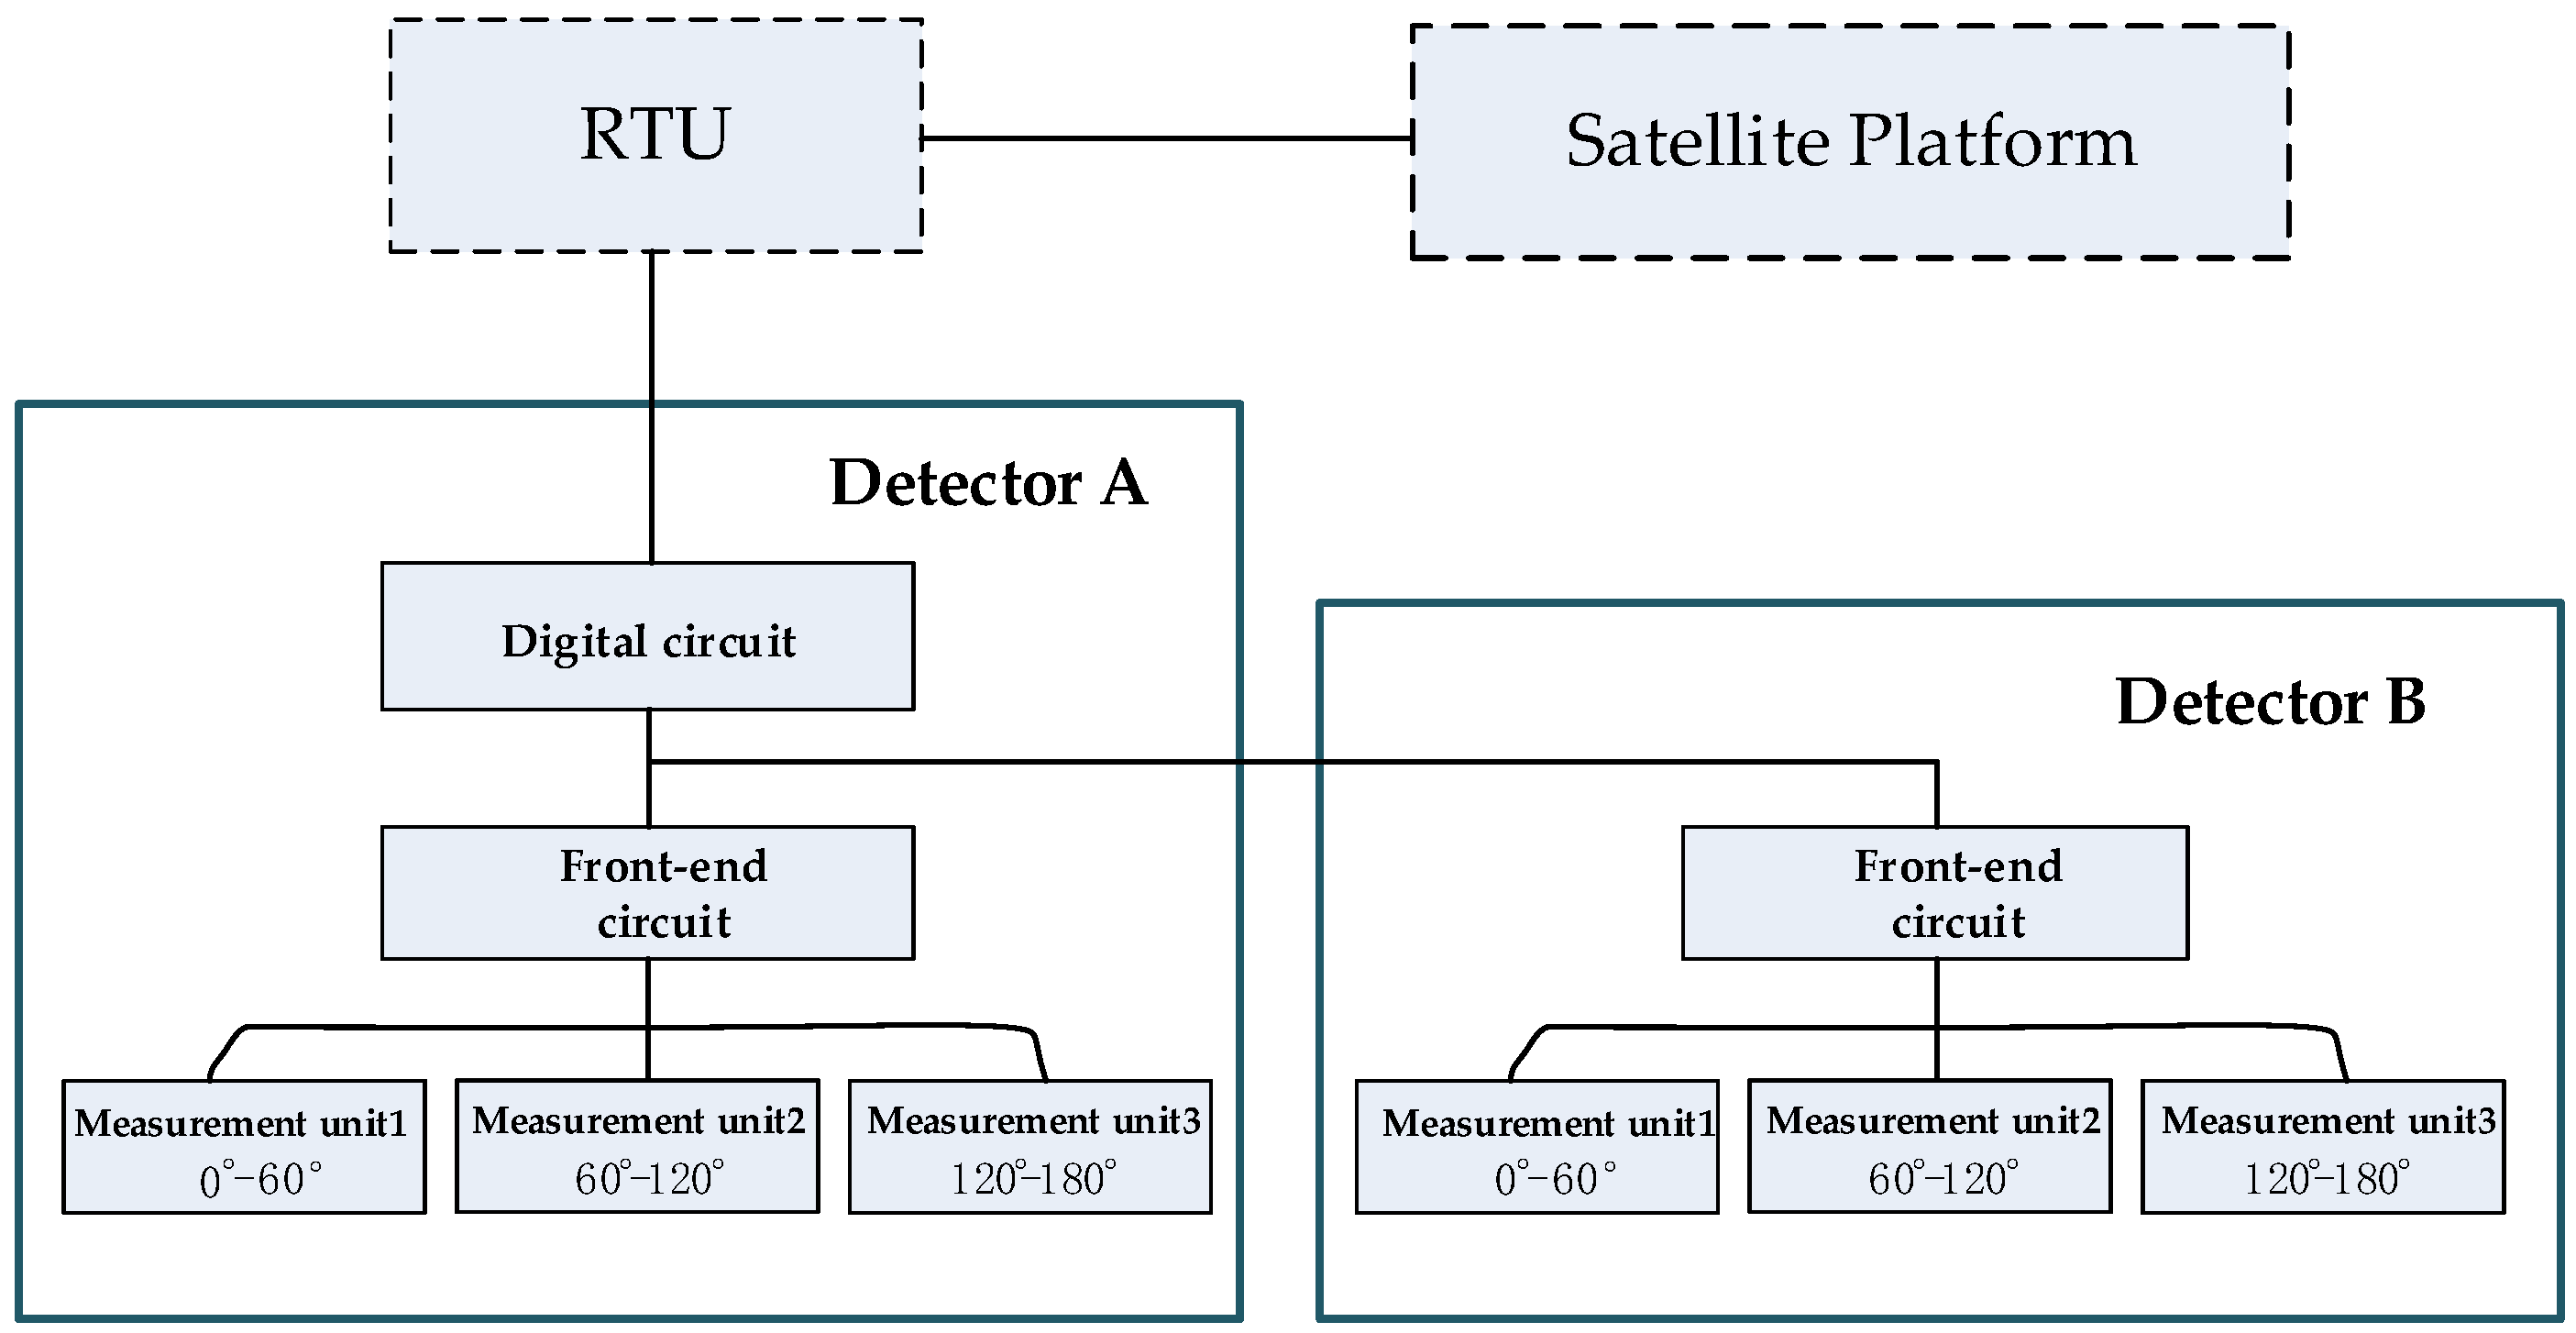
3.1. System Composition

Similar to the MEPD on the FY-3E satellite, this instrument consists of two parts, and the connection relationship is shown in Figure 4, in which detector A includes a digital circuit for data acquisition and data processing besides the three measurement units and their matching front-end circuit, and detector B only includes three measurement units and their matching front-end circuit. The data packet including data of the two detectors is transmitted to an RTU (Remote Terminal Unit, responsible for communication between detectors and satellite platform) via the communication interface of detector A.
Each component is composed of three measurement units, and each measurement unit has three groups of sensors organized in a fan-shaped arrangement. The internal structure of a measurement unit is shown in Figure 5. Each measurement unit has three groups of sensors (two sensors in each group, namely D1 and D2), and the field of view of each group of sensors is 20° × 20°, so the field of view of each measurement unit is 20° × 60°.

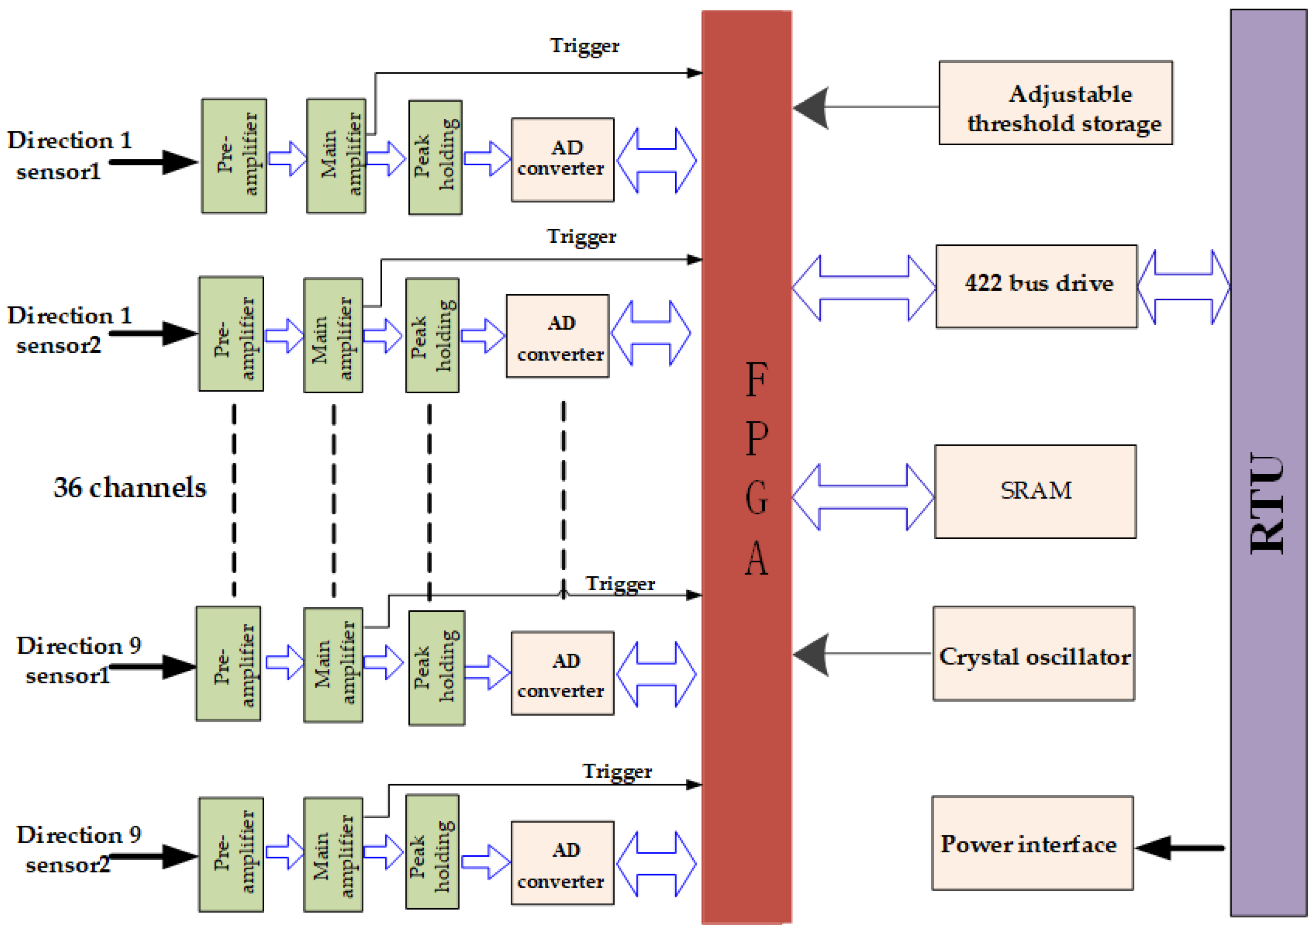
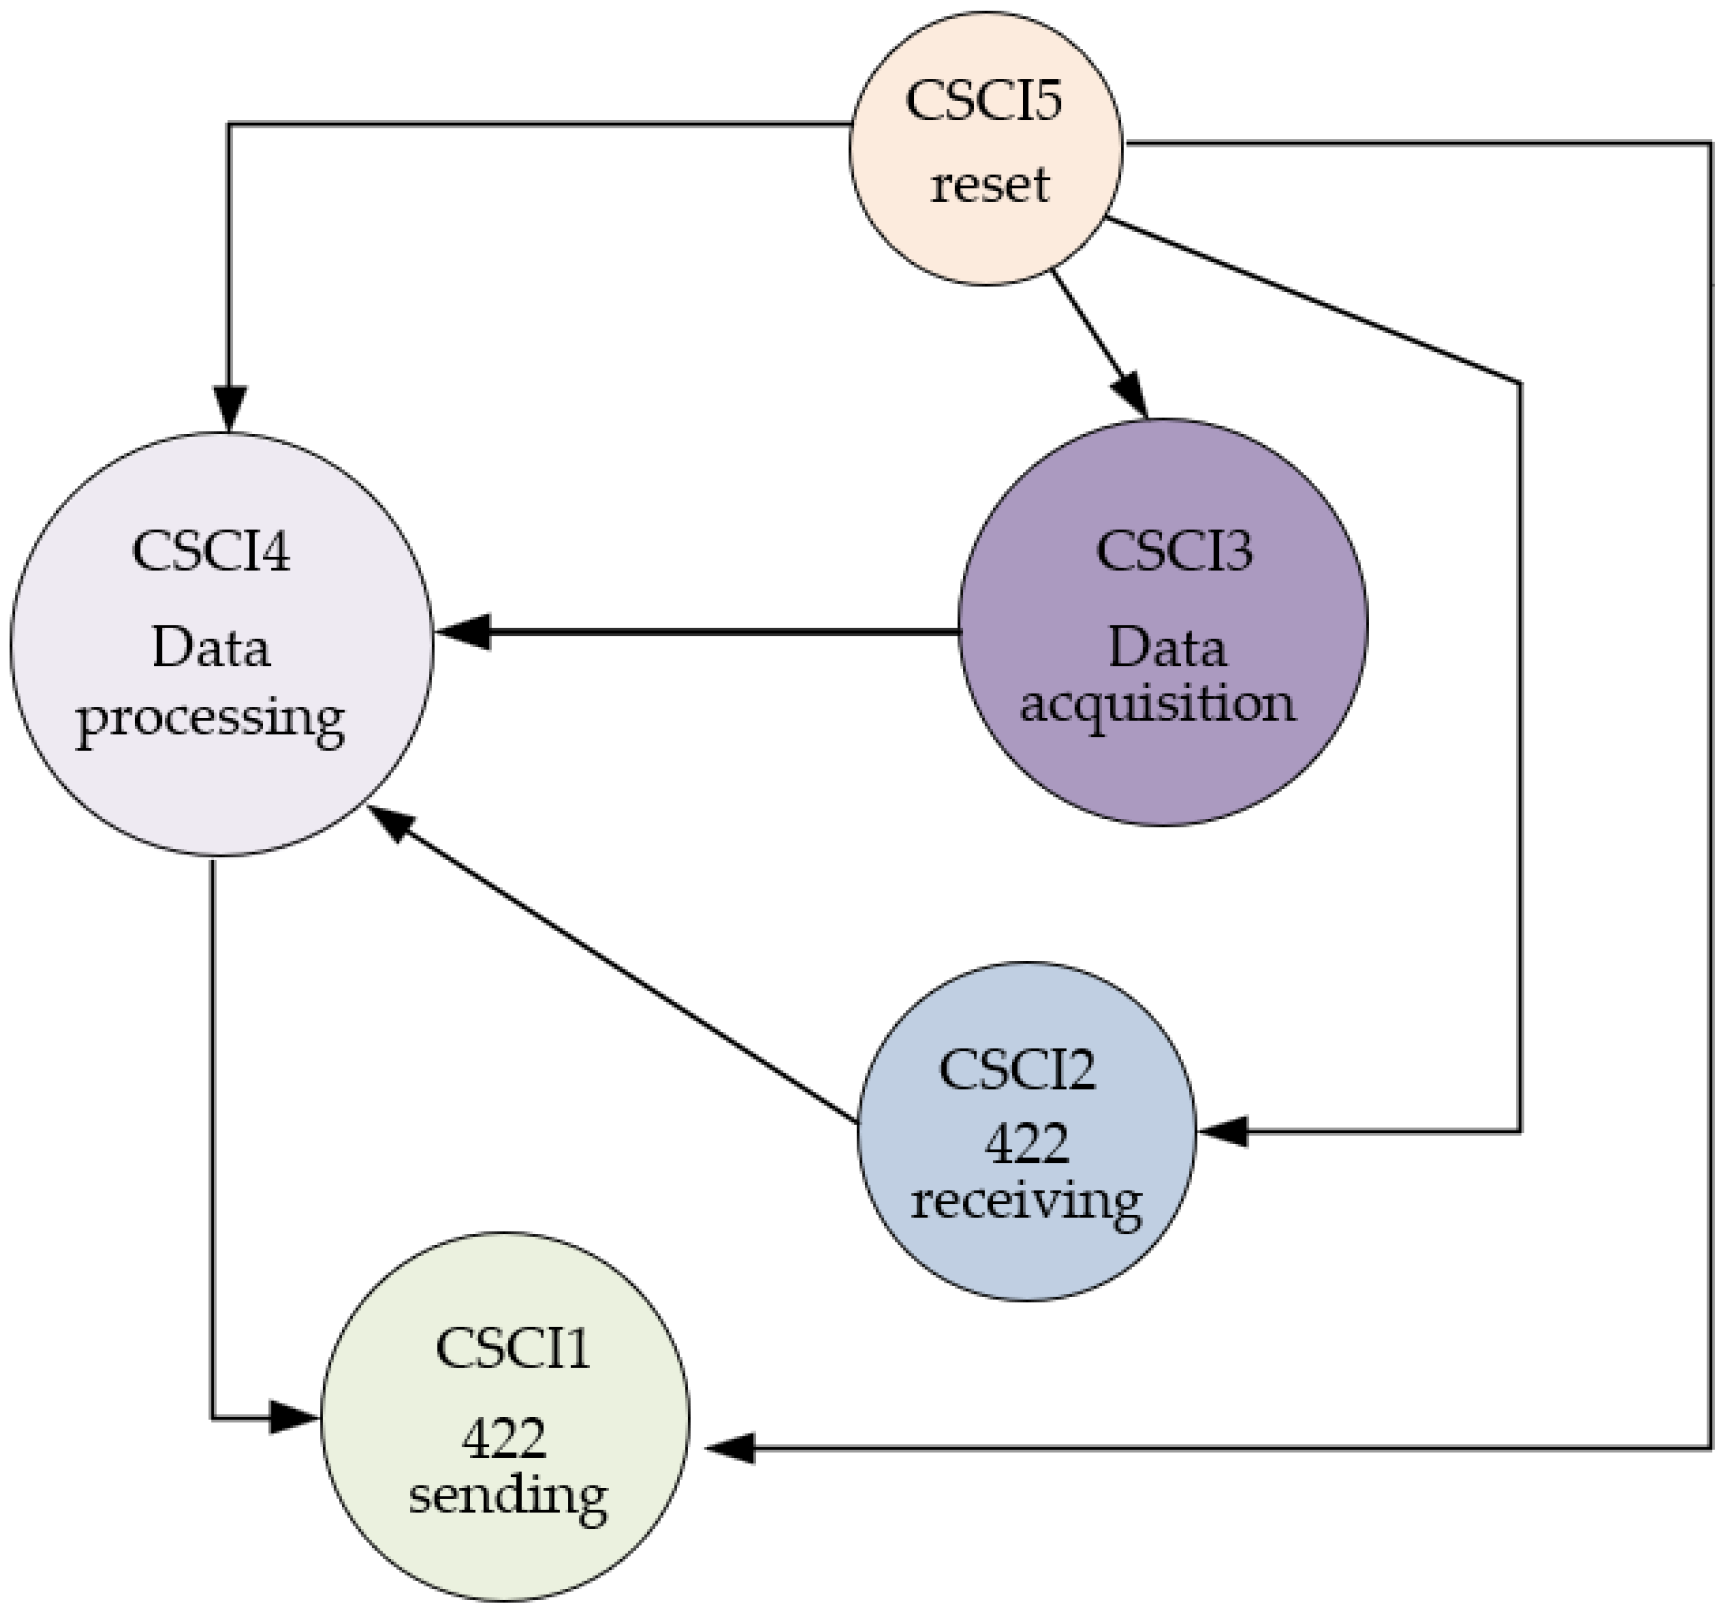
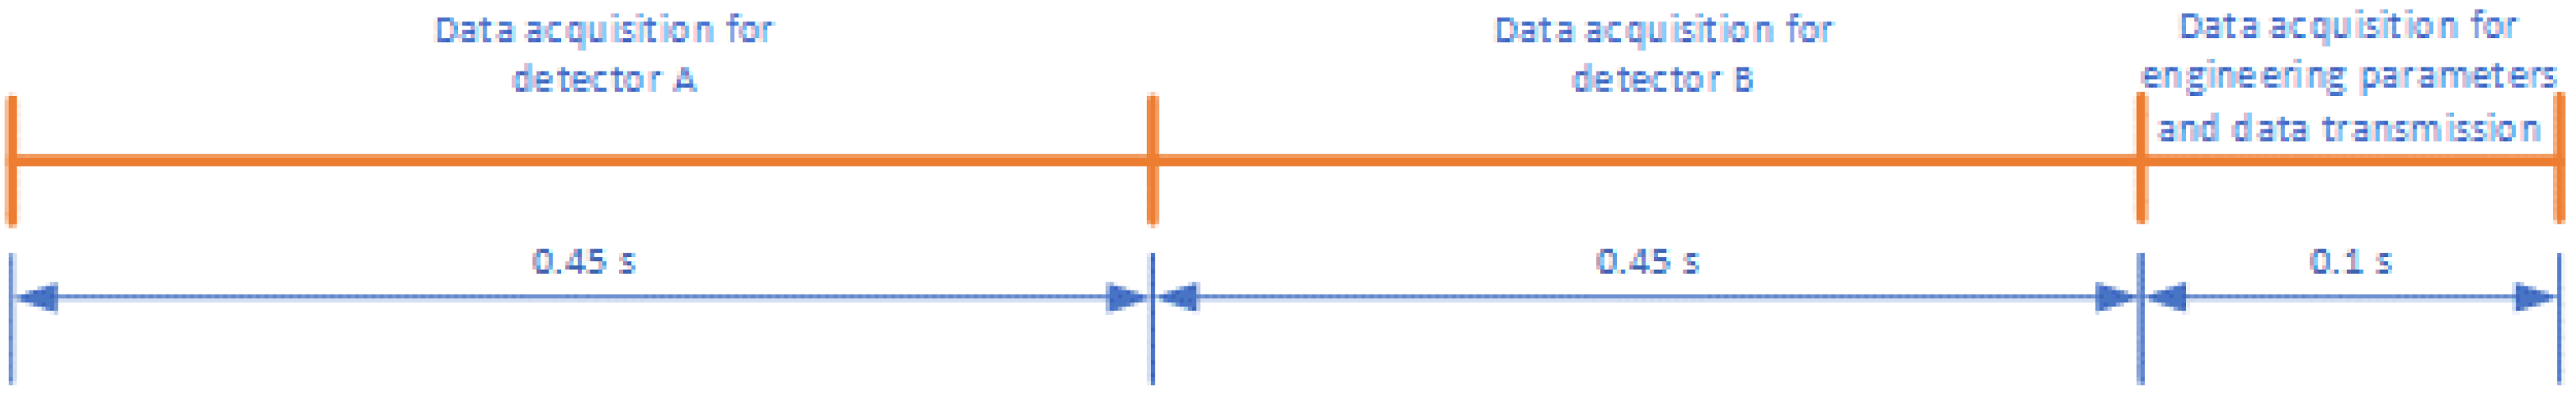
3.2. Electronic Design
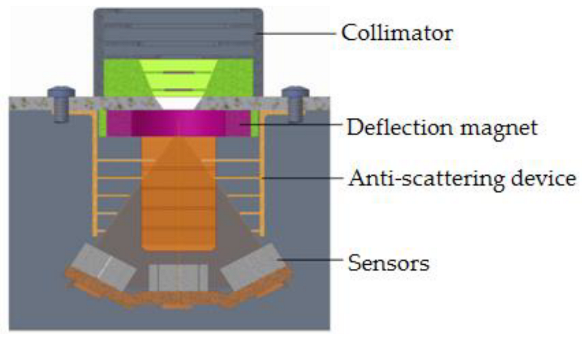
Two sensors form a group, which realizes the proton detection of one direction, and each sensor is connected to an independent front-end signal processing circuit. Thus, the whole instrument has a total of 36 front-end electronics circuits, which include pre-amplifier circuits, main amplifier circuits and peak-holding circuits. Besides the front-end circuits, the electronic system also includes AD (analog-to-digital) acquisition circuits, FPGA data processing module, communication circuits and a power module. The working principle block diagram of detector A is shown in Figure 6.
An FPGA (Field-Programmable Gate Array) device AX1000-1CQ352M is used to realize logical control. In the software design, five function modules are included: reset module, science data and engineering parameter acquisition module, data processing module, 422 bus receiving module and 422 bus sending module [10,11]. Figure 7 shows the relationship of the function modules, in which the CSCI is the abbreviation of the computer software configuration item.
The software workflow is as follows: 422 bus receives the data acquisition command, which marks the beginning of a 1 s cycle, then the six analog-to-digital converters (ADC128S, eight channels in each device) start to work in a trigger mode under the time-sharing strategy (Figure 8), which means that 18 sensor signals from detector A are acquired in the first 0.45 s and 18 sensor signals of detector B are acquired in another 0.45 s, so time factor should be considered when normalizing the data. After that, in the following 0.1 s, the engineering parameters, such as sensor noise monitoring signals and power supply voltages’ monitoring signals of 5 V and ±12 V, are collected and stored into an SRAM. Then, the FPGA waits for the “data sending” command and clears the SRAM after sending the data. Every two ADs are responsible for a measurement unit (three directions), and the priority for each direction depends on the sequence of the incoming trigger signals.

3.3. Sensor System

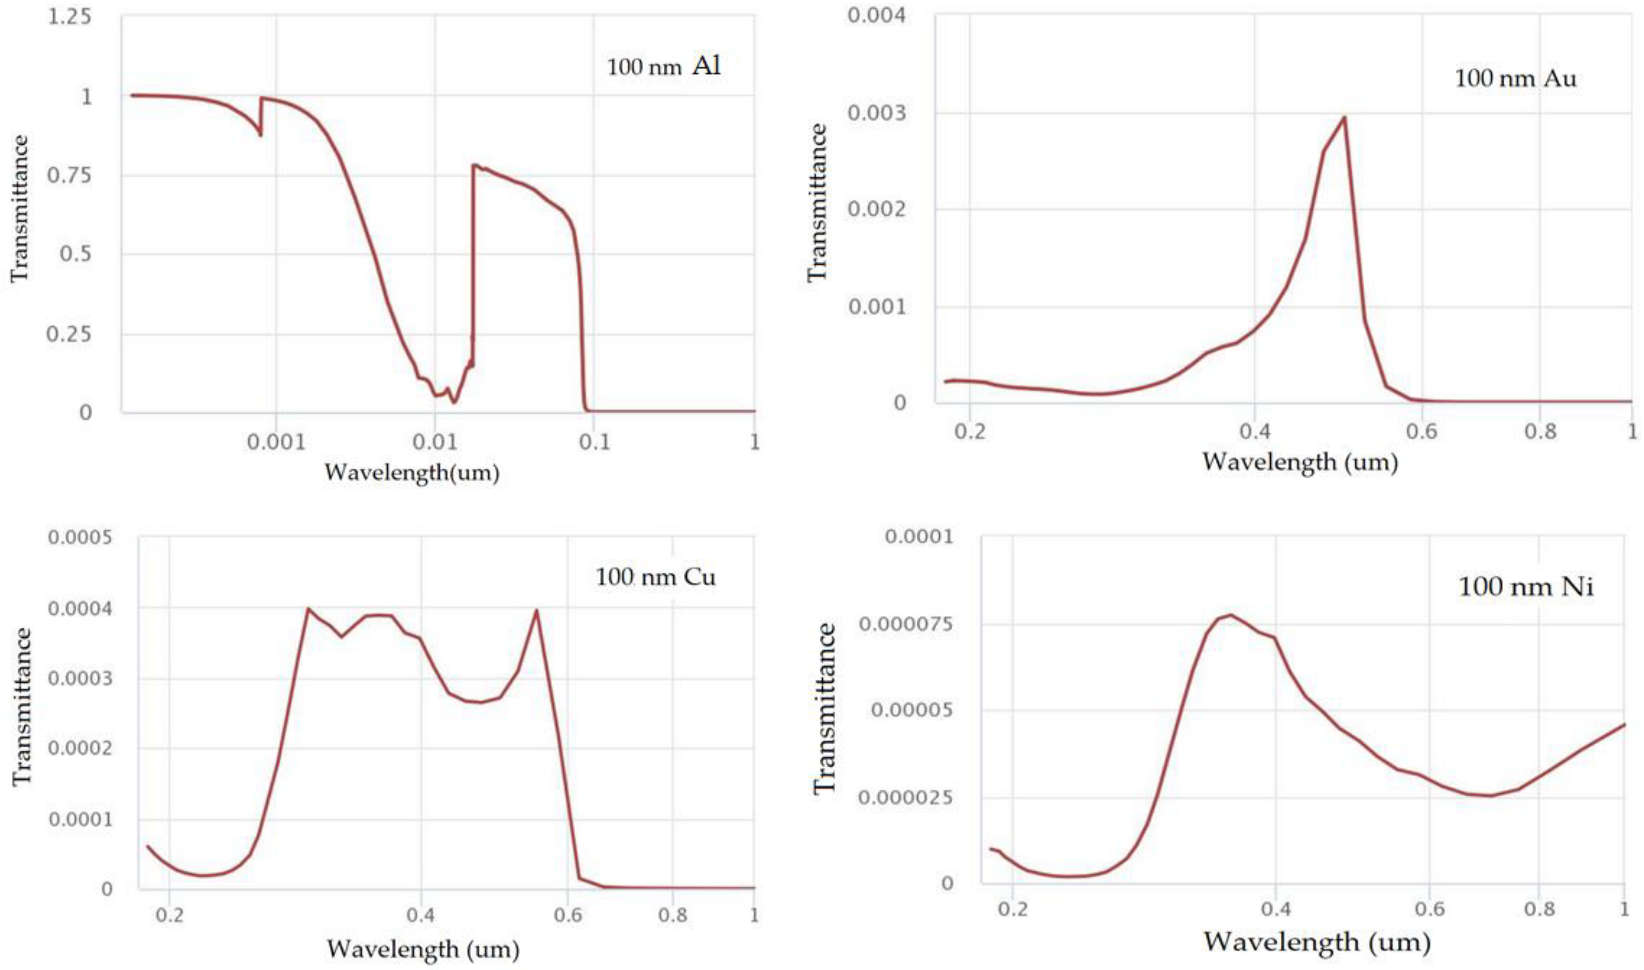
3.3.1. Light-Blocking Layer

The commonly used light-blocking layer is not applicable here because it can greatly reduce the energy of incoming protons, especially when the energy of incident protons is low; thus, the MEPD on the FY-3E satellite uses a layer of aluminum coating with a thickness of 100 nm on the surface of the sensor to shield from the interference of visible light. When sunlight does not directly enter the sensors (like the MEPD on the FY-3E satellite, on which the two detectors are installed in the −X direction and +Y direction, respectively. Note that in the satellite coordinate system, “+X” points to the heading direction of the satellite, “+Z” points to the center of Earth, and “+Y” is determined by the right-hand rule), the thickness of the aluminum plate is enough to prevent stray light from entering the sensors, and the influence of sunlight on the detection results can be ignored. But in the FY-4 orbit, according to the satellite trajectory simulation, sensors in certain directions are exposed to direct sunlight for 80 min every day. A scenario of the sensors being illuminated by sunlight is shown in Figure 9, in which the red arrow points to the forward direction of the FY-4B satellite and the green arrow points to the Sun. As the satellite moves in orbit, there must be a sensor’s field of view sweeping over the Sun. Figure 10 shows that on the FY-3E satellite, neither detector of the MEPD has a chance to be exposed to sunlight directly. Both arrows point from Earth to the Sun in Figure 10.
From the simulation, it can be seen that the time of the sensors being exposed to direct sunlight is not negligible. According to the experimental results of a detector on a solar simulator in a vacuum tank, there is interference counting output in channel P1 and channel P2, and this may be caused by uneven coating thickness of the super thin aluminum film. The lighting interference counting greatly affects the use of scientific data on the one hand, and on the other hand, lighting will reduce the lifespan of the sensors, so extra measures must be taken to shield them from sunlight.
Compared to other materials, nickel film has superior shading performance. Figure 11 shows a comparison of the light-blocking ability of four materials: Al, Au, Cu and Ni (the data were obtained from https://refractiveindex.info/ (accessed on 8 March 2020). As can be seen from the figure, when the wavelength of light is less than 100 nm, Cu and Ni have a lower light penetration rate, and at a wavelength greater than 100 nm, Al and Ni perform better. Considering the blocking effect of these materials on protons, nickel is the best light barrier material, so besides the aluminum coating, another 100 nm nickel film light barrier is added in front of the sensors in each direction.
After adding the nickel film in front of the sensors, a lighting test of the MEPD was carried out under the illumination of the solar simulator, which is provided by Beijing Institute of Spacecraft Environment Engineering. Adjusting the angle between the parallel light beam and the normal direction of the sensor sensitive surface to 0°, 30°, 60° and 90°, there is no counting output in all the energy channels of the detector. Figure 12 shows the lighting test scenario of the MEPD.
However, using the 100 nm thickness nickel film in front of the sensors to block sunlight reduces the detection efficiency greatly, especially for channel P1 and channel P2. Figure 13 shows the transmittance of protons with or without the addition of another 100 nm nickel film.
As shown in Figure 13, when a 100 nm nickel film is added, the detection efficiency significantly decreases in channel P1 and channel P2, so it is necessary to make corrections when using data of these two channels.

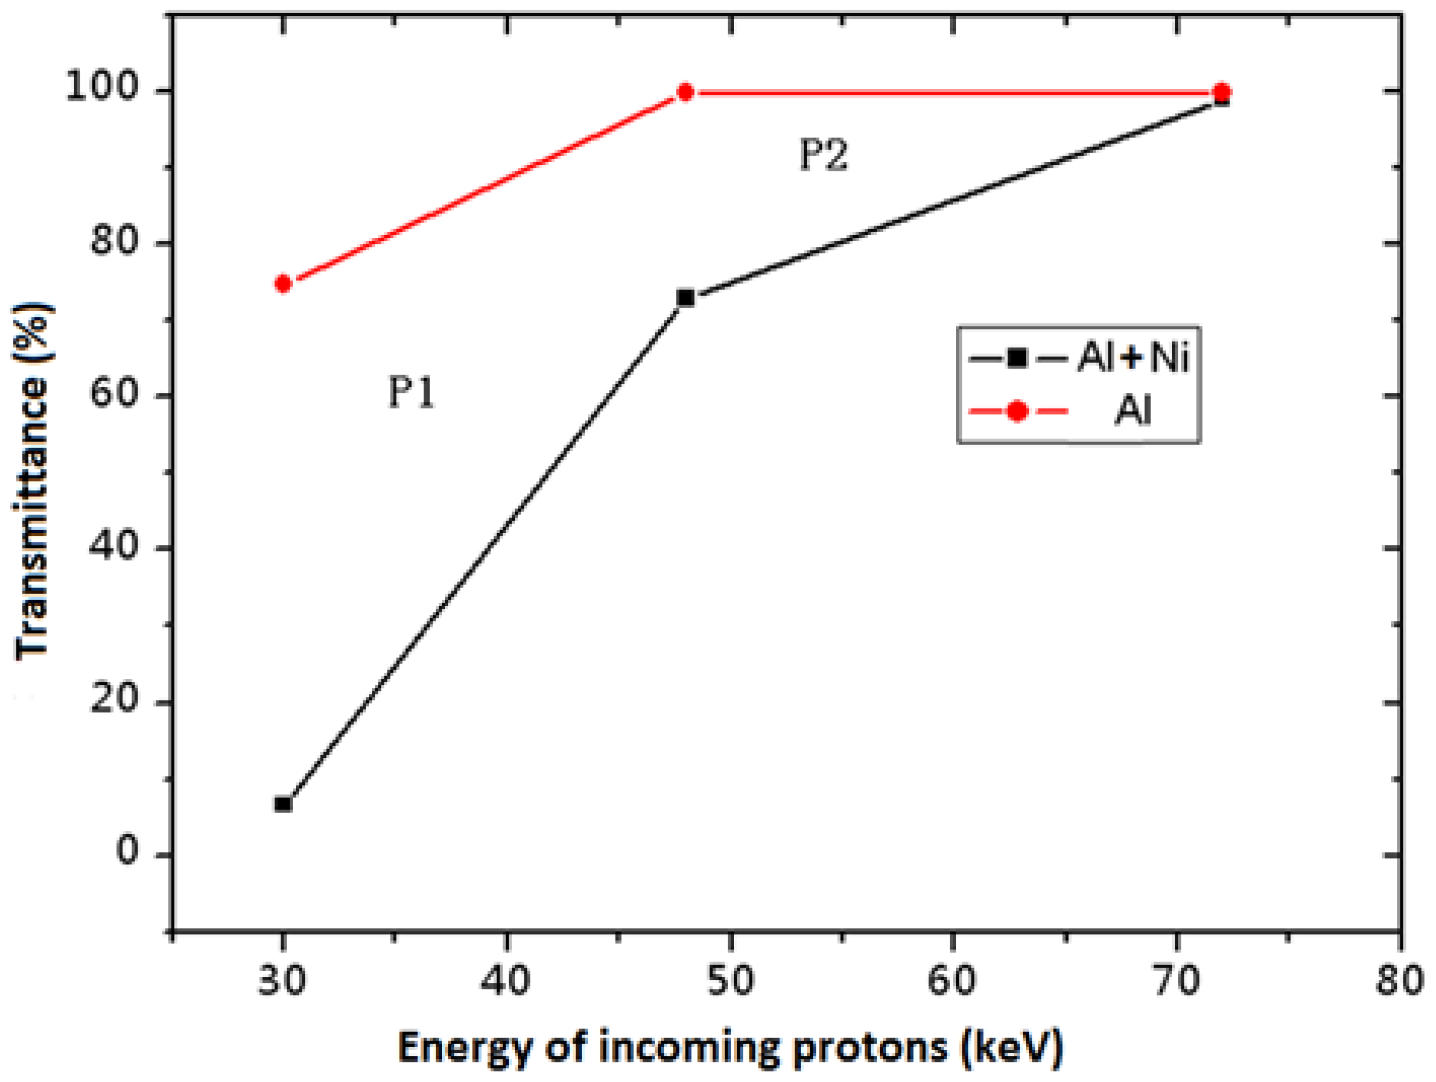
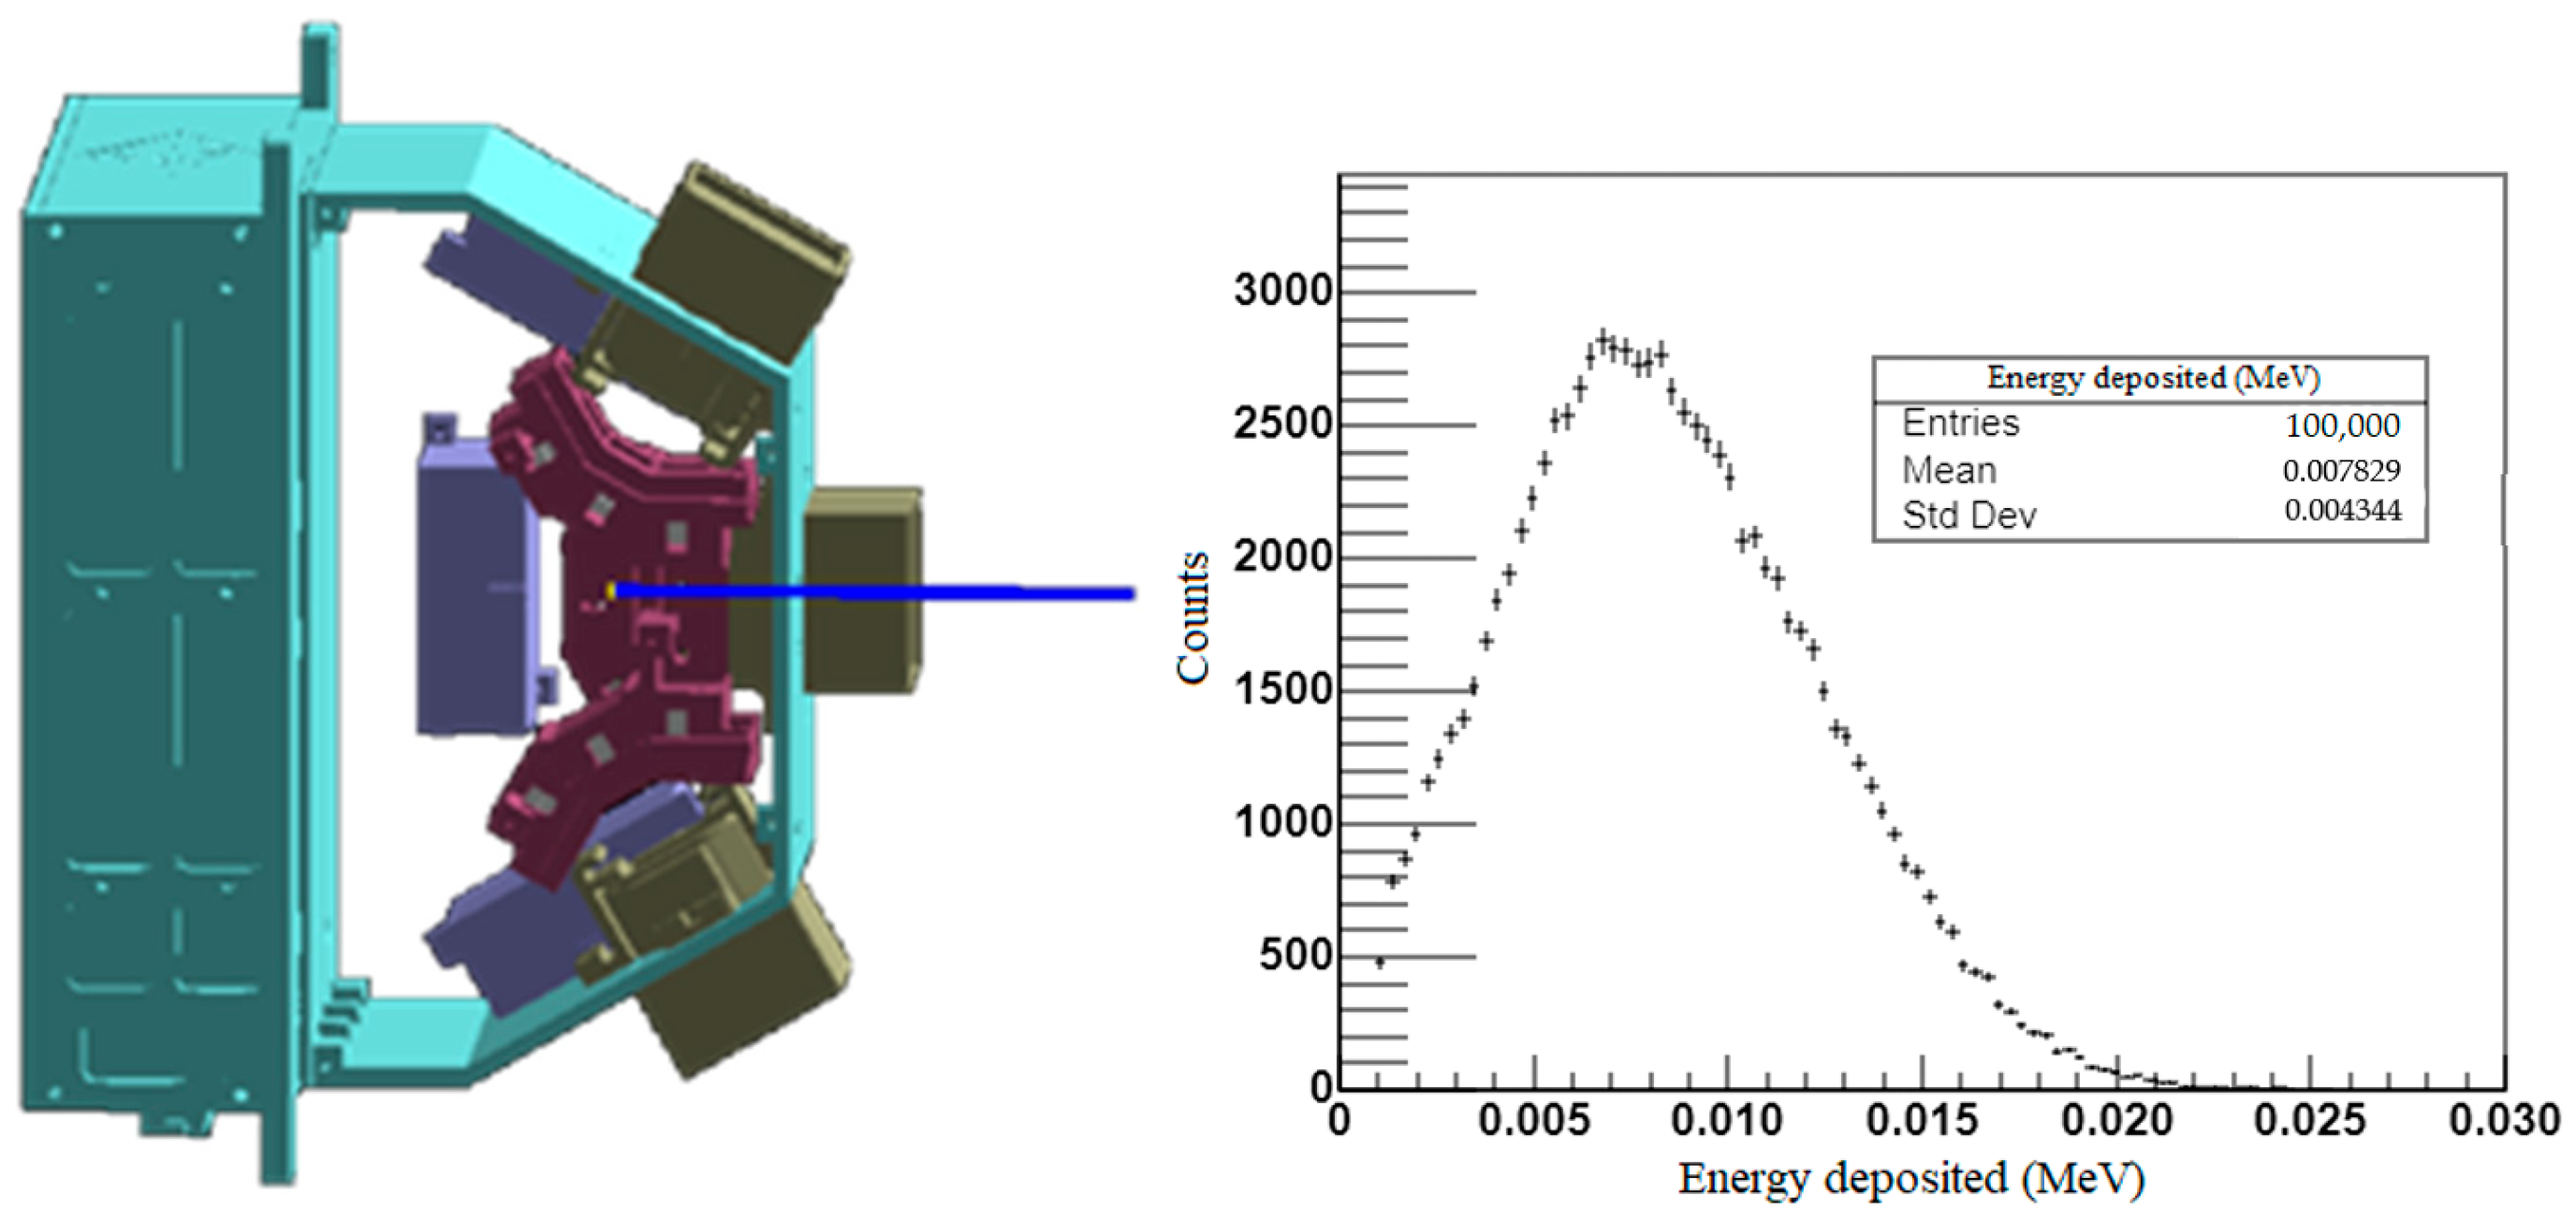
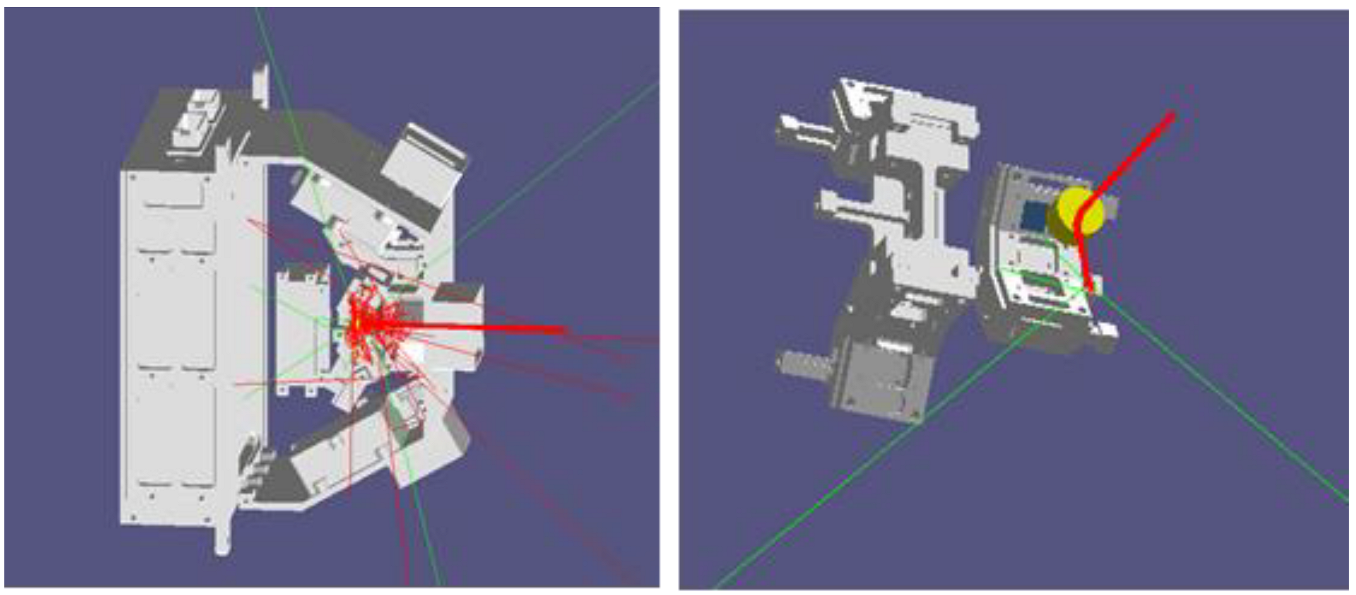
3.3.2. Proton Transportation Simulation

Similar to the MEPD on the FY-3E satellite, ion-implantation-type semiconductor sensors are used in the detectors. The sensors are 300 um thick and the sensitive area is 8 mm × 8 mm, with a 100 nm thickness aluminum coating. In each direction, sensor D1 is used as a pulse amplitude analyzer for energy division, and D2 is used as an anti-coincidence detector to exclude the interference of high-energy protons and high-energy electrons. Due to the wide dynamic range, the output signal of D1 is amplified in two stages to output to the energy channels P1-P6 and P7-P12, respectively.
In front of the sensors in each direction, there are a 100 nm thick nickel film and 100 nm thick aluminum coating. Using the Geant4 software [12,13,14], Figure 14 presents the simulation results of the energy deposit of 30 keV protons in the silicon sensors after passing through the above-mentioned materials.
We can see that with these light-blocking materials, the mean energy left for 30 keV protons is only about 7.8 keV, almost half of the deposited energy when a 30 keV proton is incident on the MEPD sensor of the FY-3E satellite, which is 14.2 keV.

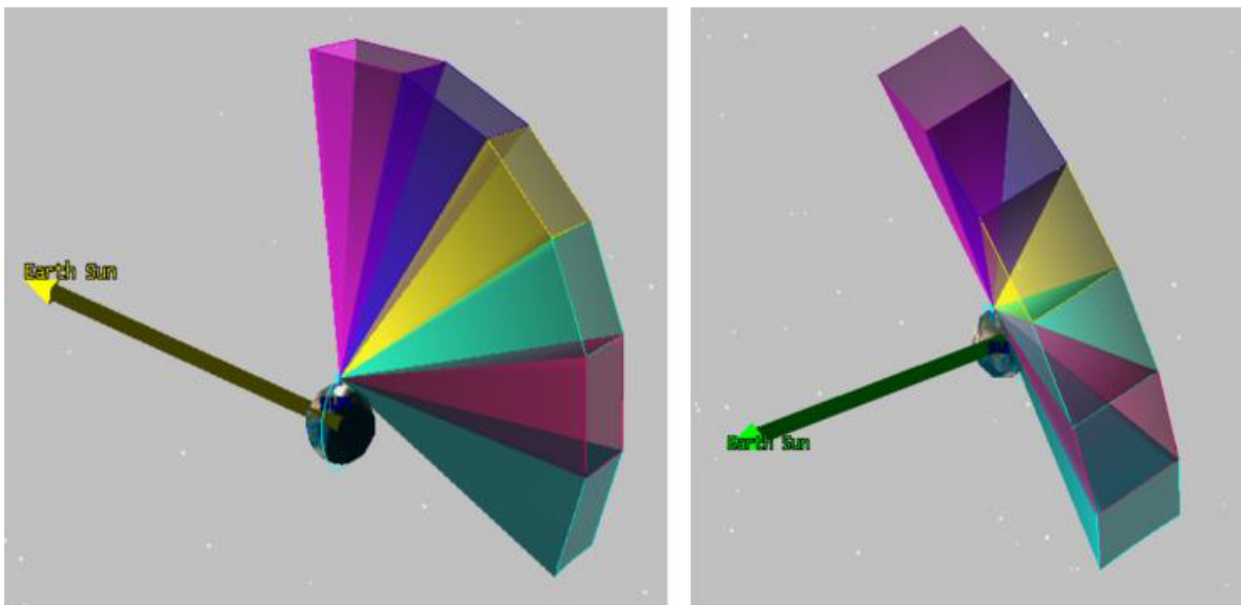
3.3.3. Deflecting Magnet

The function of a deflecting magnet is to exclude the interference of medium- and low-energy electrons [15]. For medium-energy protons and electrons of the same energy, their energy loss in the silicon semiconductor sensor is almost the same, and they cannot be identified by the circuit. Therefore, a deflecting magnet is used inside the collimator to deflect these electrons so that they cannot come into the silicon sensor. The deflecting magnet used here is a permanent annular magnet structure, which can exclude electronic interference below 1.5 MeV. Due to the elastic scattering of electrons, deflected electrons may enter the sensors in other directions, causing interference with the measurements in other directions. The Geant4 software was used to establish a model of the entire machine and simulate the trajectory of electrons to obtain the proportion of deflected electrons entering the sensors from other directions. The simulation results show that the interference ratio is far less than 1% within the full energy range; thus, the influence of deflected electrons on other sensors can be ignored. The deflection scenario of 1.5 MeV electrons passing through the magnetic field is shown in Figure 15, in which the red lines represent the trajectory of electron and the green lines represent the trajectory of photons generated by electron bremsstrahlung.
Electrons with higher energy (>1.5 MeV) still have a certain probability to enter the detector after being deflected by the magnetic field. The interference ratio of electrons to medium-energy protons can be effectively reduced to be within 2% by the anti-coincidence sensor. This is why two sensors are used in each direction.

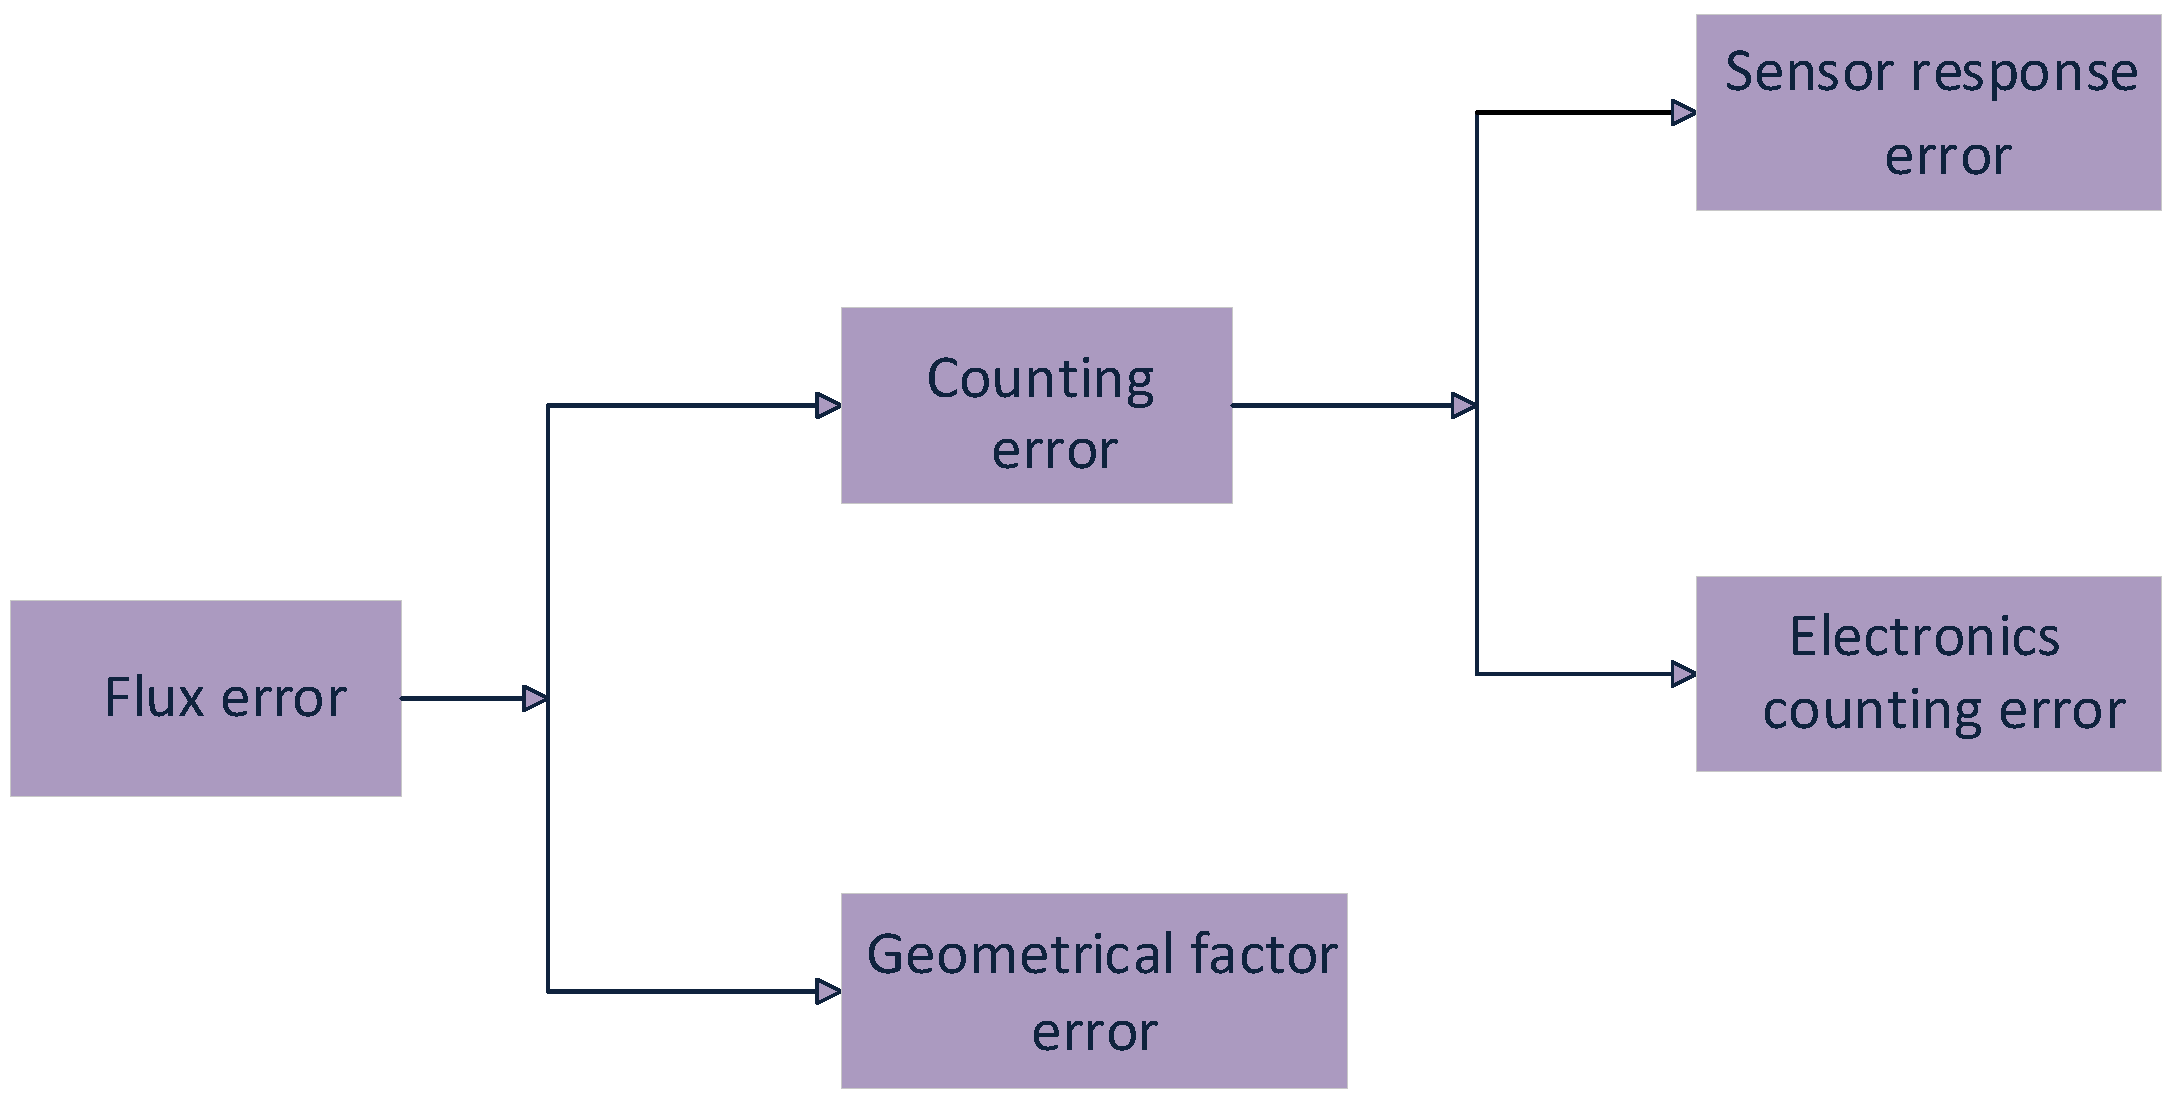
3.4. Geometrical Factor

The geometrical factor is decided by the structure of the sensor system. The field of view (FOV), which mainly depends on the collimator, is a key factor to determine the geometrical factor. A good collimator can provide shielding conditions to prevent the interference of particles being obliquely incident from the side to a sensor [16,17]. According to the radiation model AP8-MAX, the omni-directional integrated flux of protons above 100 keV is up to 2 × 106 cm−2s−1 (equals to 1.6 × 105 cm−2 sr−1s−1) in the FY-4B satellite orbit, as shown in Figure 16. At present, there is no available model or measured data for reference for medium-energy protons with energy lower than 100 keV. Extrapolation was carried out according to the model, and within a certain margin, the integral proton flux greater than 30 keV is approximately 107 cm−2 sr−1s−1. Since the maximum suitable counting rate of the electronics is 5 × 10⁴/s, the geometrical factor can theoretically be set to 0.005 cm2sr at most. Considering the counting error of electronics at high counting rates, we set the geometrical factor to 0.002 cm2sr in order to ensure that these electronics have an appropriate counting rate.

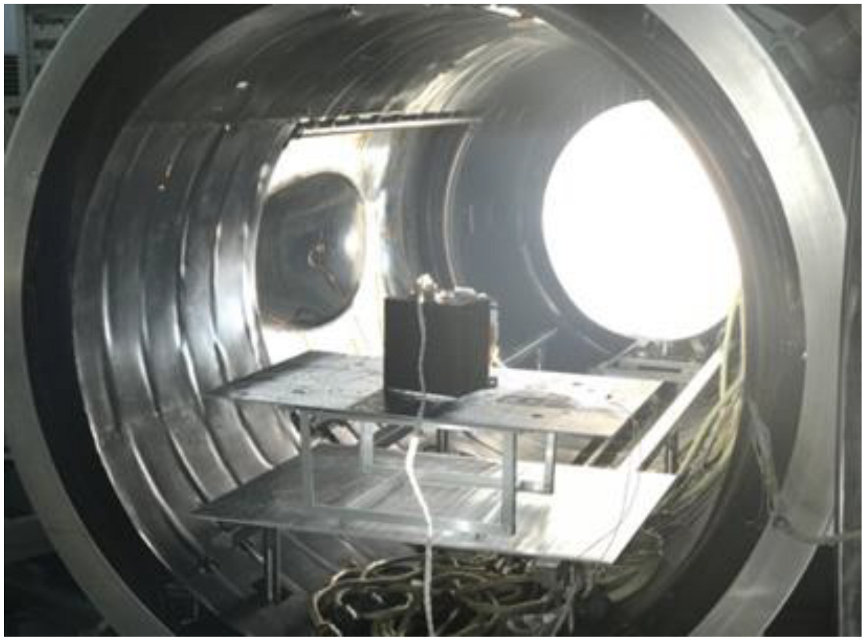
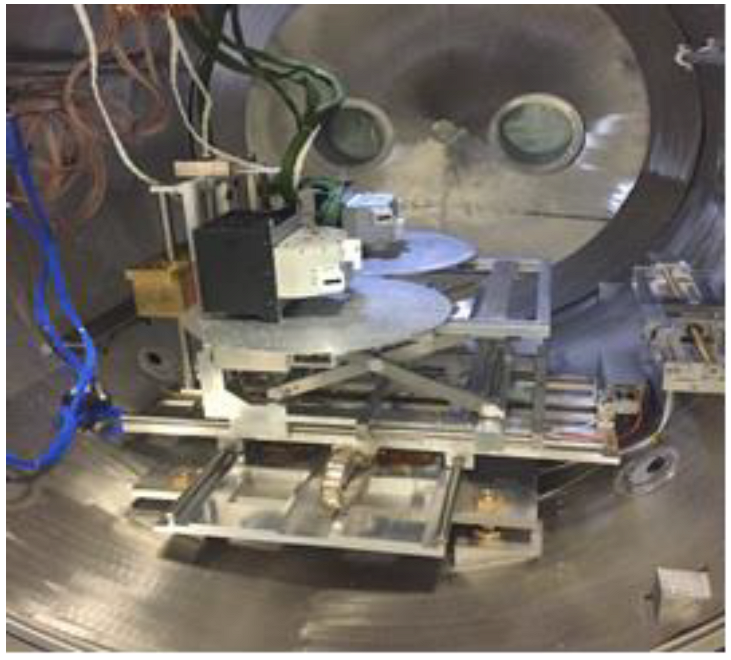
4. Ground Calibration

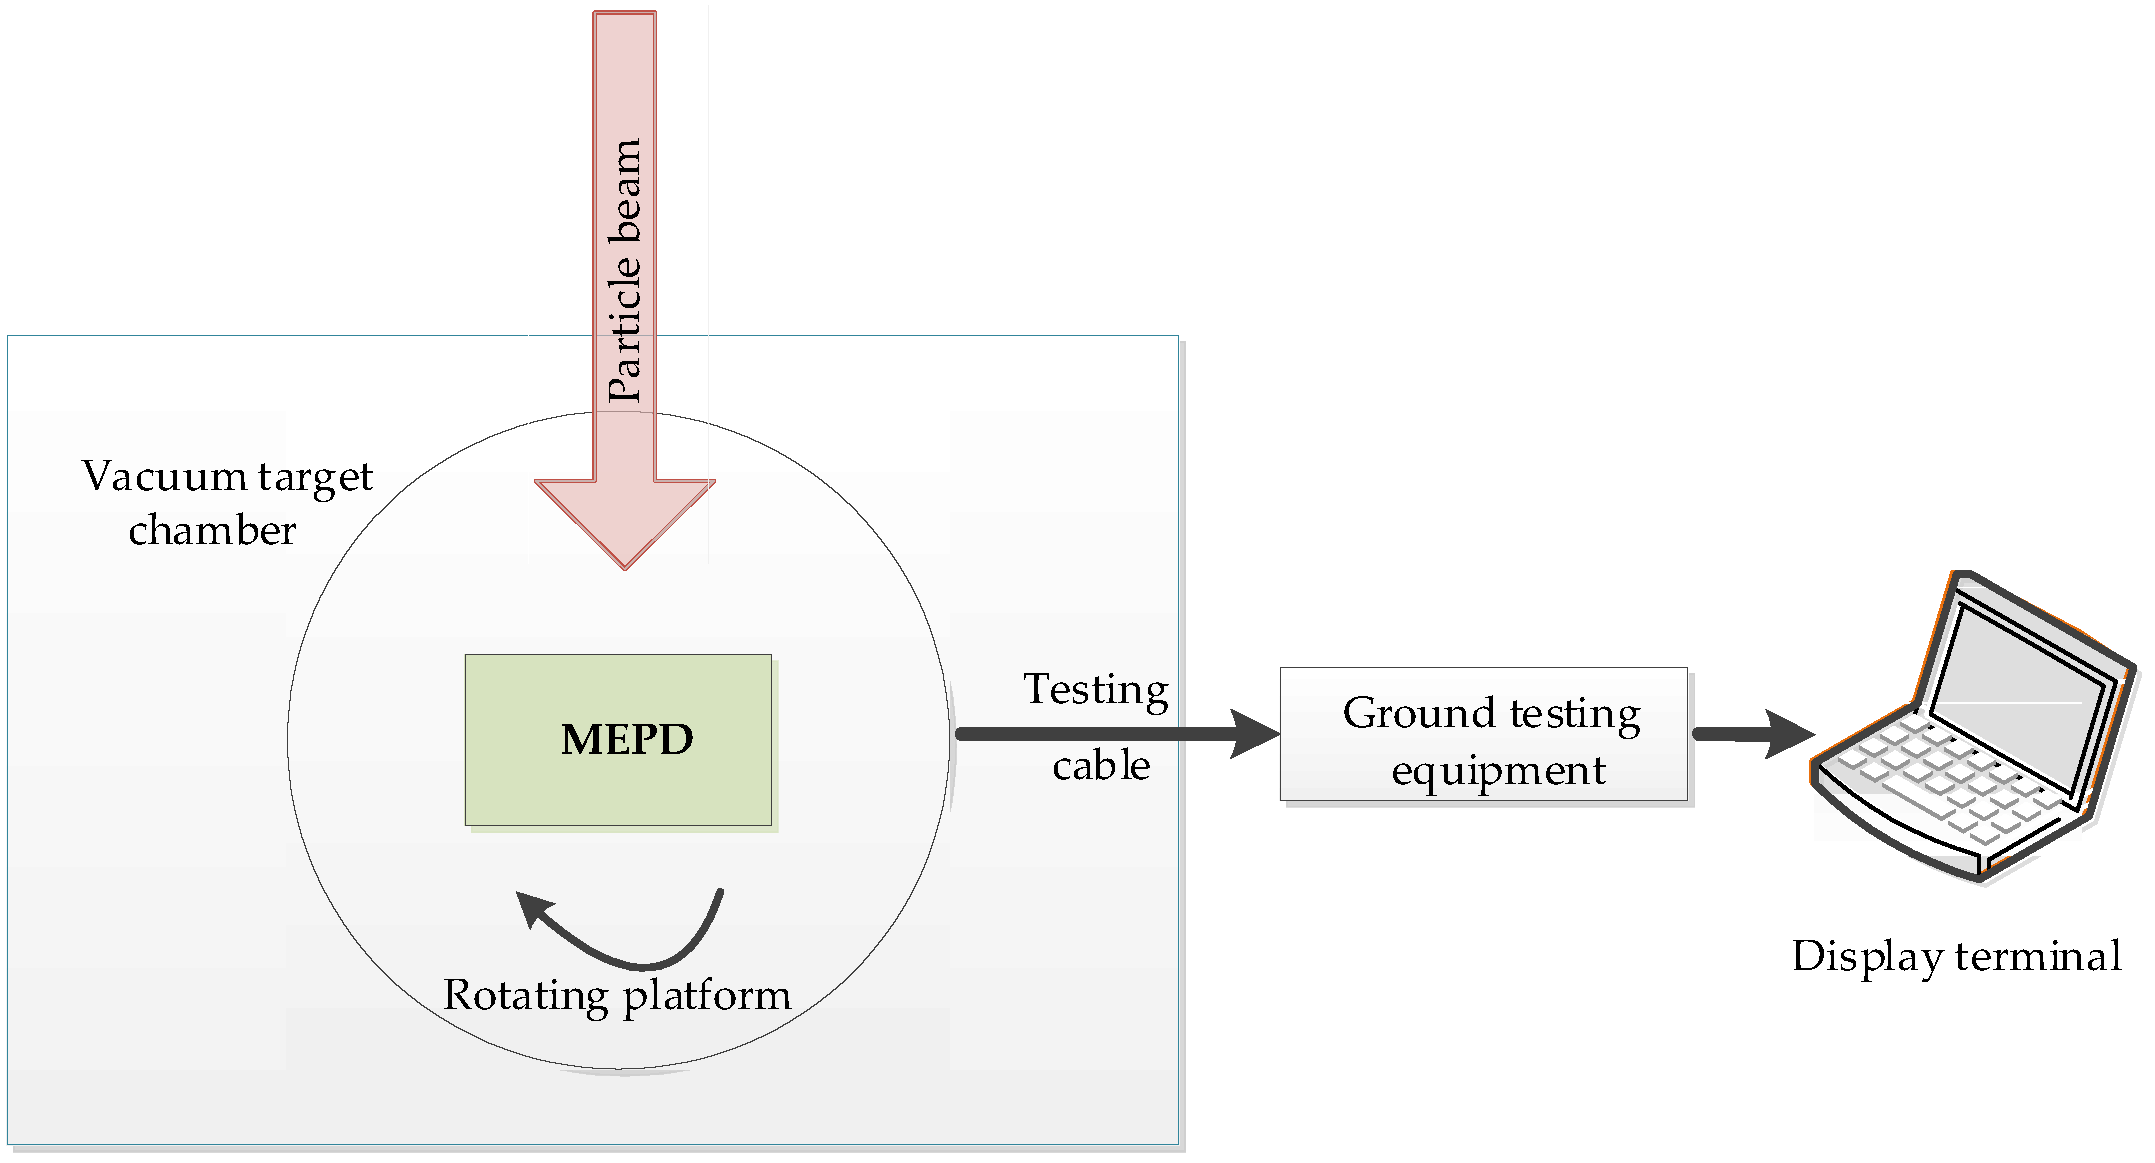
4.1. Calibration Method

The calibration method is the same as that of similar particle detectors [18,19,20,21,22]. The calibration items include the energy spectral range, energy linearity, energy resolution, particle flux accuracy and a test of sensor thickness, size, field of view and particle identification capability. A detailed introduction of the calibration method and test contents can be found in ref. [9]. The calibration was carried out on the 200 keV and 2 MeV accelerators of the “Space Payload Test and Calibration Platform” in Huairou District, Beijing, China. The block diagram and calibration scenario of the calibration testing system are shown in Figure 17 and Figure 18. The main calibration results are given here in this article.

4.2. Calibration Results

Since the calibration results of the 18 directions of the MEPD are highly consistent in terms of the energy spectral range, linearity and energy resolution, the ground testing results of the MEPD in direction one are given here to verify its performance.

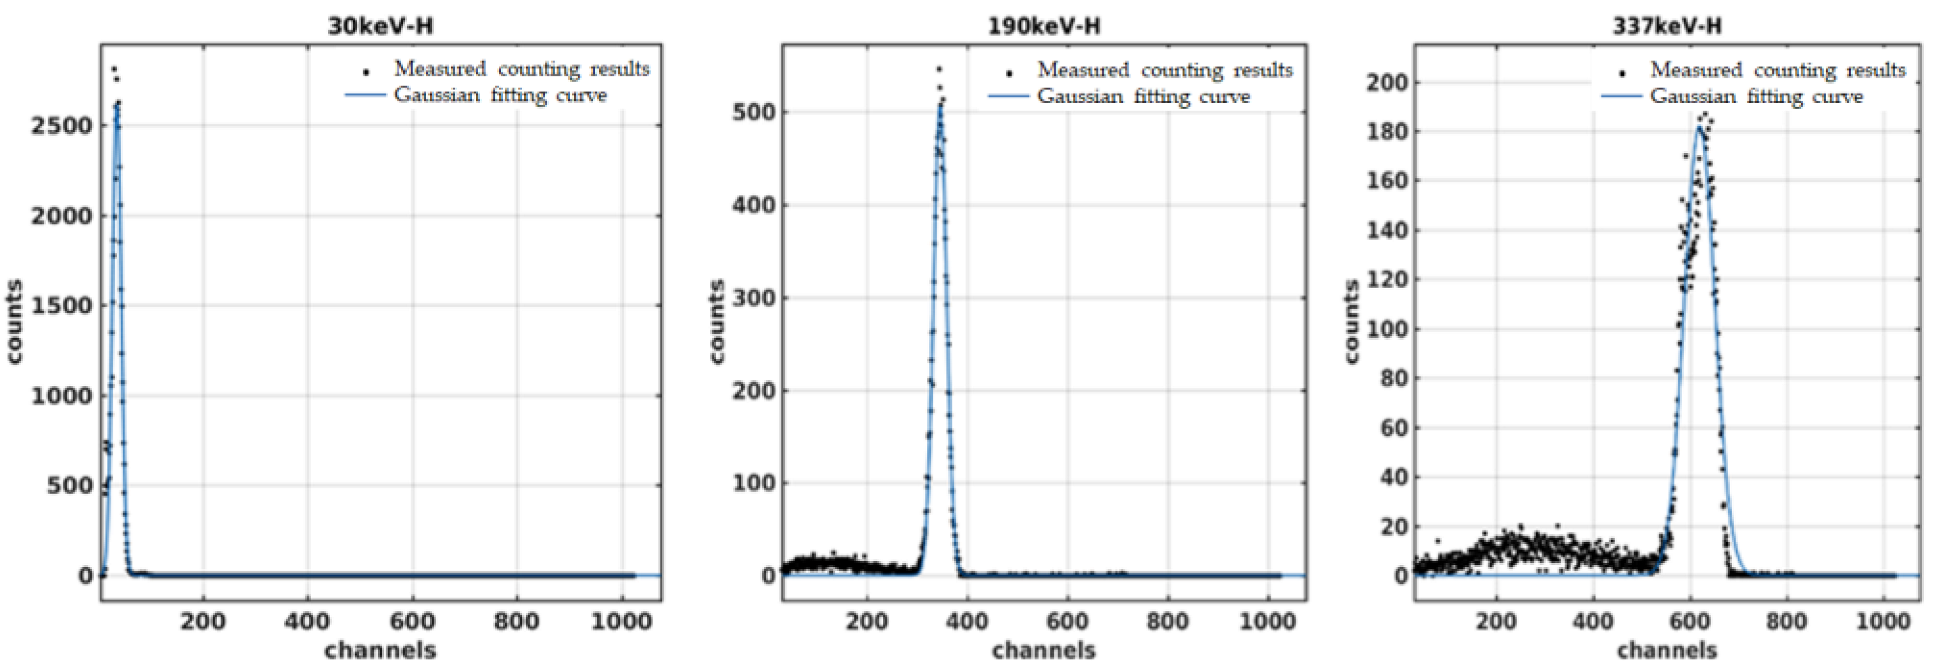
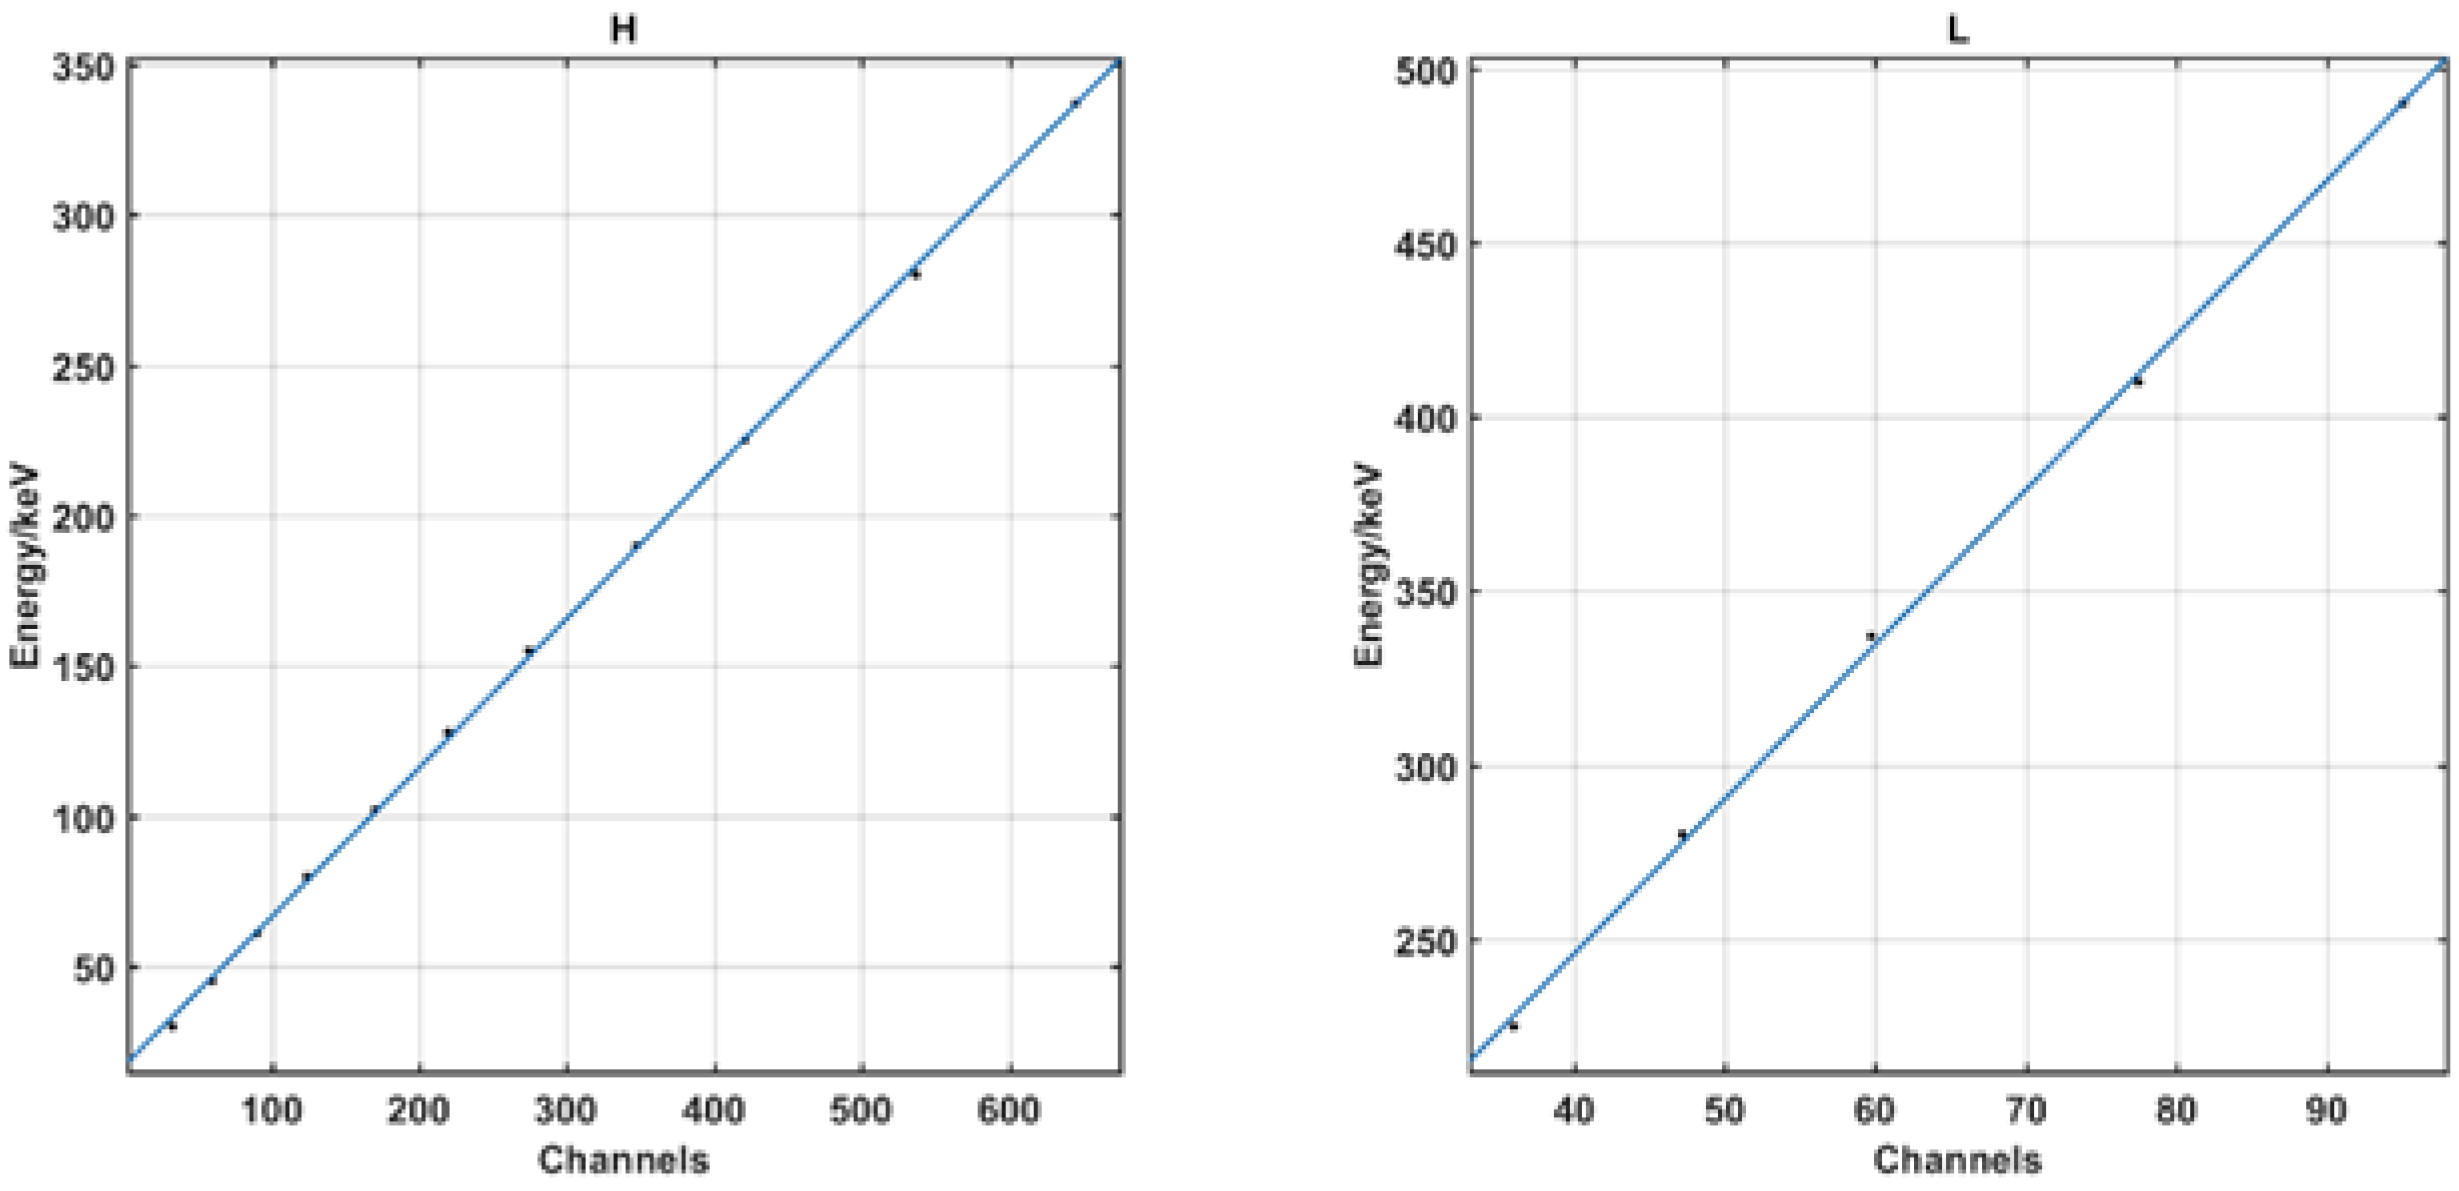
4.2.1. Energy Linearity and Energy Resolution

The energy linearity is obtained according to the following steps. Firstly, an electron beam with determined energy E i for incident electrons is selected, and the energy deposition spectrum of electrons in the silicon sensor is recorded via a multi-channel system. Then, using the multi-channel measurement results, Gaussian fitting is adopted to obtain the center value λ i. Meanwhile, through Geant4 simulation, the energy loss ( E i ) of incident electrons with the energy of E i is obtained. After that, a series of E i and λ i results ( n points, n > 5) is used for linear fitting based on the formula y = k x + b . Finally, energy linearity χ for each direction can be calculated as follows:
χ = 1 n i = 1 i = n Δ E i y i Δ E i
Energy resolution refers to the energy broadening measured by the detector for particles with fixed energy, and it is equal to the ratio of the full width at half maximum (FHWM) to the center value, as shown in Equation (2):
η = Δ λ λ 0 × 100 %
In Equation (2), λ 0 is the abscissa of the Gaussian peak position and Δ λ is the FHWM of the Gaussian fitting curve.
Part of the Gaussian fitting results of the measured data of the low-energy sections (30 keV, 190 keV, 337 keV) in the multi-channel analysis mode in direction one is shown in Figure 19, where the ordinates of the black points are the multi-channel counting data corresponding to the fixed incident electron energy, the abscissa is the channel number, and the blue curve is the fitting result.
The linear fitting results for the energy bands with incident particle energy <350 keV and energy bands with energy >350 keV are shown in Figure 20, respectively. The linear fitting formula for the low-energy section (high gain) is y = 0.5827 x + 16.07 and for the high-energy section (low gain) is y = 6.651 x + 81.86 , where x is the channel position and y is the energy loss in keV. Table 2 lists the calibration results of energy resolution and energy linearity in all directions.

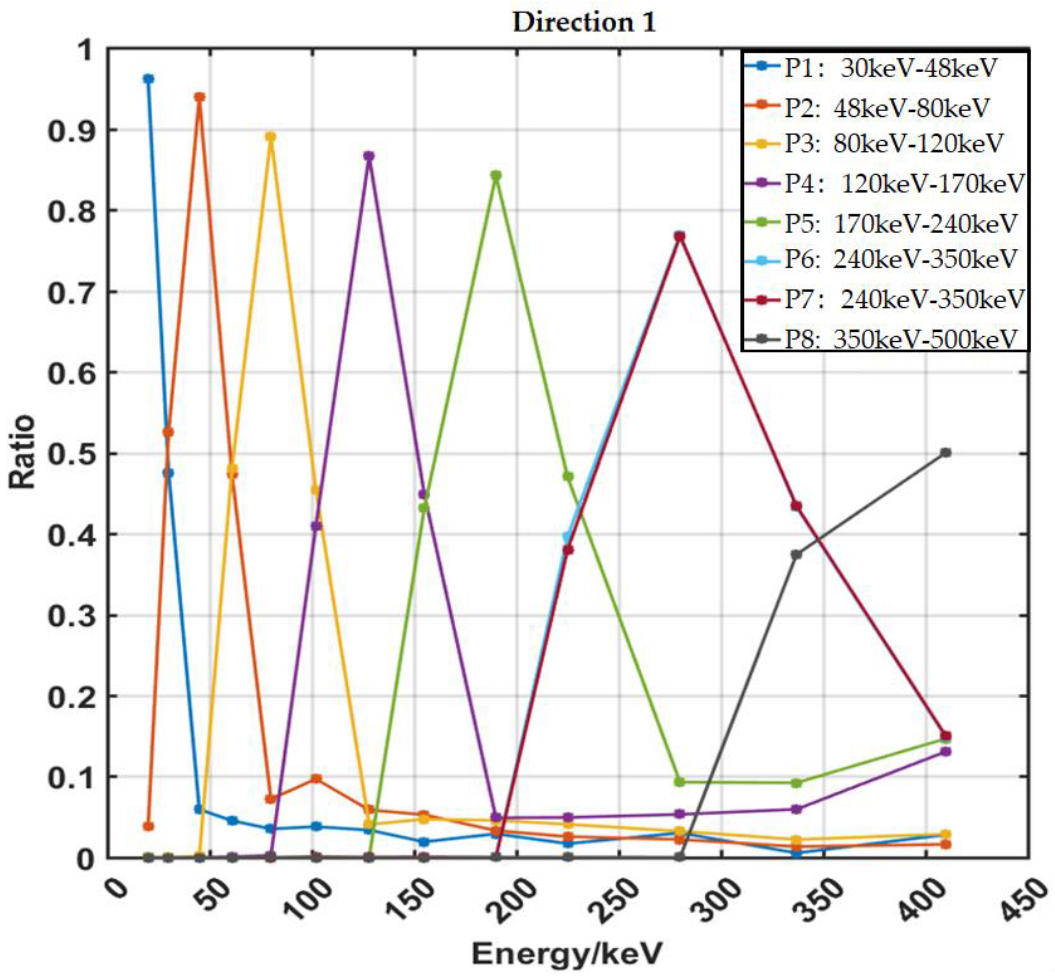
4.2.2. Energy Channel Division

The actual demarcation points of the energy channels are determined by the count change between two adjacent energy channels. By normalizing the counts of two energy channels to obtain the proportion of counts in each energy channel, the central intersection point can be found according to the changing trend of the counting ratio. The actual obtained boundary values are shown in Table 3. The error range of energy channel division is calculated based on Equation (3):
δ = |Ca − Cd|/Cd.
In the formula, Ca is the actual energy boundary position, Cd is the designed energy boundary position, and δ is the error range.
According to the results of energy channel division in Table 3, we set the threshold voltage corresponding to the actual energy boundary in the software. Then, we removed the deflecting magnet of measurement unit 1 and selected electrons at the energy demarcation points on the accelerator to test the detector (no medium-energy proton accelerators available for detector calibration during the development phase). The response of each energy channel of the detector accords with the design, especially the energy channels P6 and P7, which almost completely overlap (see Table 1), as shown in Figure 21. This test verified the detector’s energy response performance. In Figure 21, the curve of each color represents the response of certain energy particles in all energy channels.

4.2.3. Flux Calibration

Flux calibration was used to correct the in-orbit counting rate measurement results and verify the instrument response under high flux conditions. Figure 22 shows the composition of the flux error.
According to the system error transfer function,
σ y 2 = i ( y x ) 2 σ x i 2
The total flux error is calculated as follows:
σ F 2 = σ s 2 + σ E 2 + σ G 2
where σ F is the flux error, σ s is the sensor response error, σ E is the electronic counting error, and σ G is the geometrical factor error.
The calculation method of the geometrical factor can be found in reference [16]. Because this process is a calculation method based on random numbers, there will inevitably be computational errors. The specific calculation method is to obtain a series of geometrical factor values G i through multiple identical calculations and calculate the average to obtain the final geometrical factor. The variance in the geometrical factor sample is the accuracy of the geometrical factor. Due to the use of large-sample sampling simulation, the simulation shows that the calculation accuracy of the geometrical factor is better than 3%.
The detector counting error consists of the sensor response error and electronic counting error, based on which the counting error can be calculated according to formula 4. The electronic counting error mainly depends on the time required for the detector to process a single particle. The time resolution of the detector is 6µs. When the time interval between incident particles is less than 6µs, the detector will not be able to distinguish between two particle signals, which will result in count loss. The relationship between the number of incident particles and the output count is simulated, as shown in Figure 23.
By fitting the simulation results, the relationship between the output counts and the number of incident particles can be obtained as follows:
y = 2.17 × 10 6 x 2 + 0.9644 x + 380
in which x is the incident particle number and y is the fitting result of the average output counts.
The true value of the incident particle number can be obtained by inferring from the fitted curve, with a maximum electronic counting error of 1.57%.
When calculating the sensor response error, we used 207Bi radiation source to irradiate the sensor multiple times and recorded the total count n i per unit time. The counting response error of the sensors is obtained by calculating the standard deviation:
σ s = 1 n 1 i = 1 n ( n i n ¯ ) 2
The sensor response error is 4.8% in this case.
According to Formula (4), the total flux error of the MEPD is 9.37%.

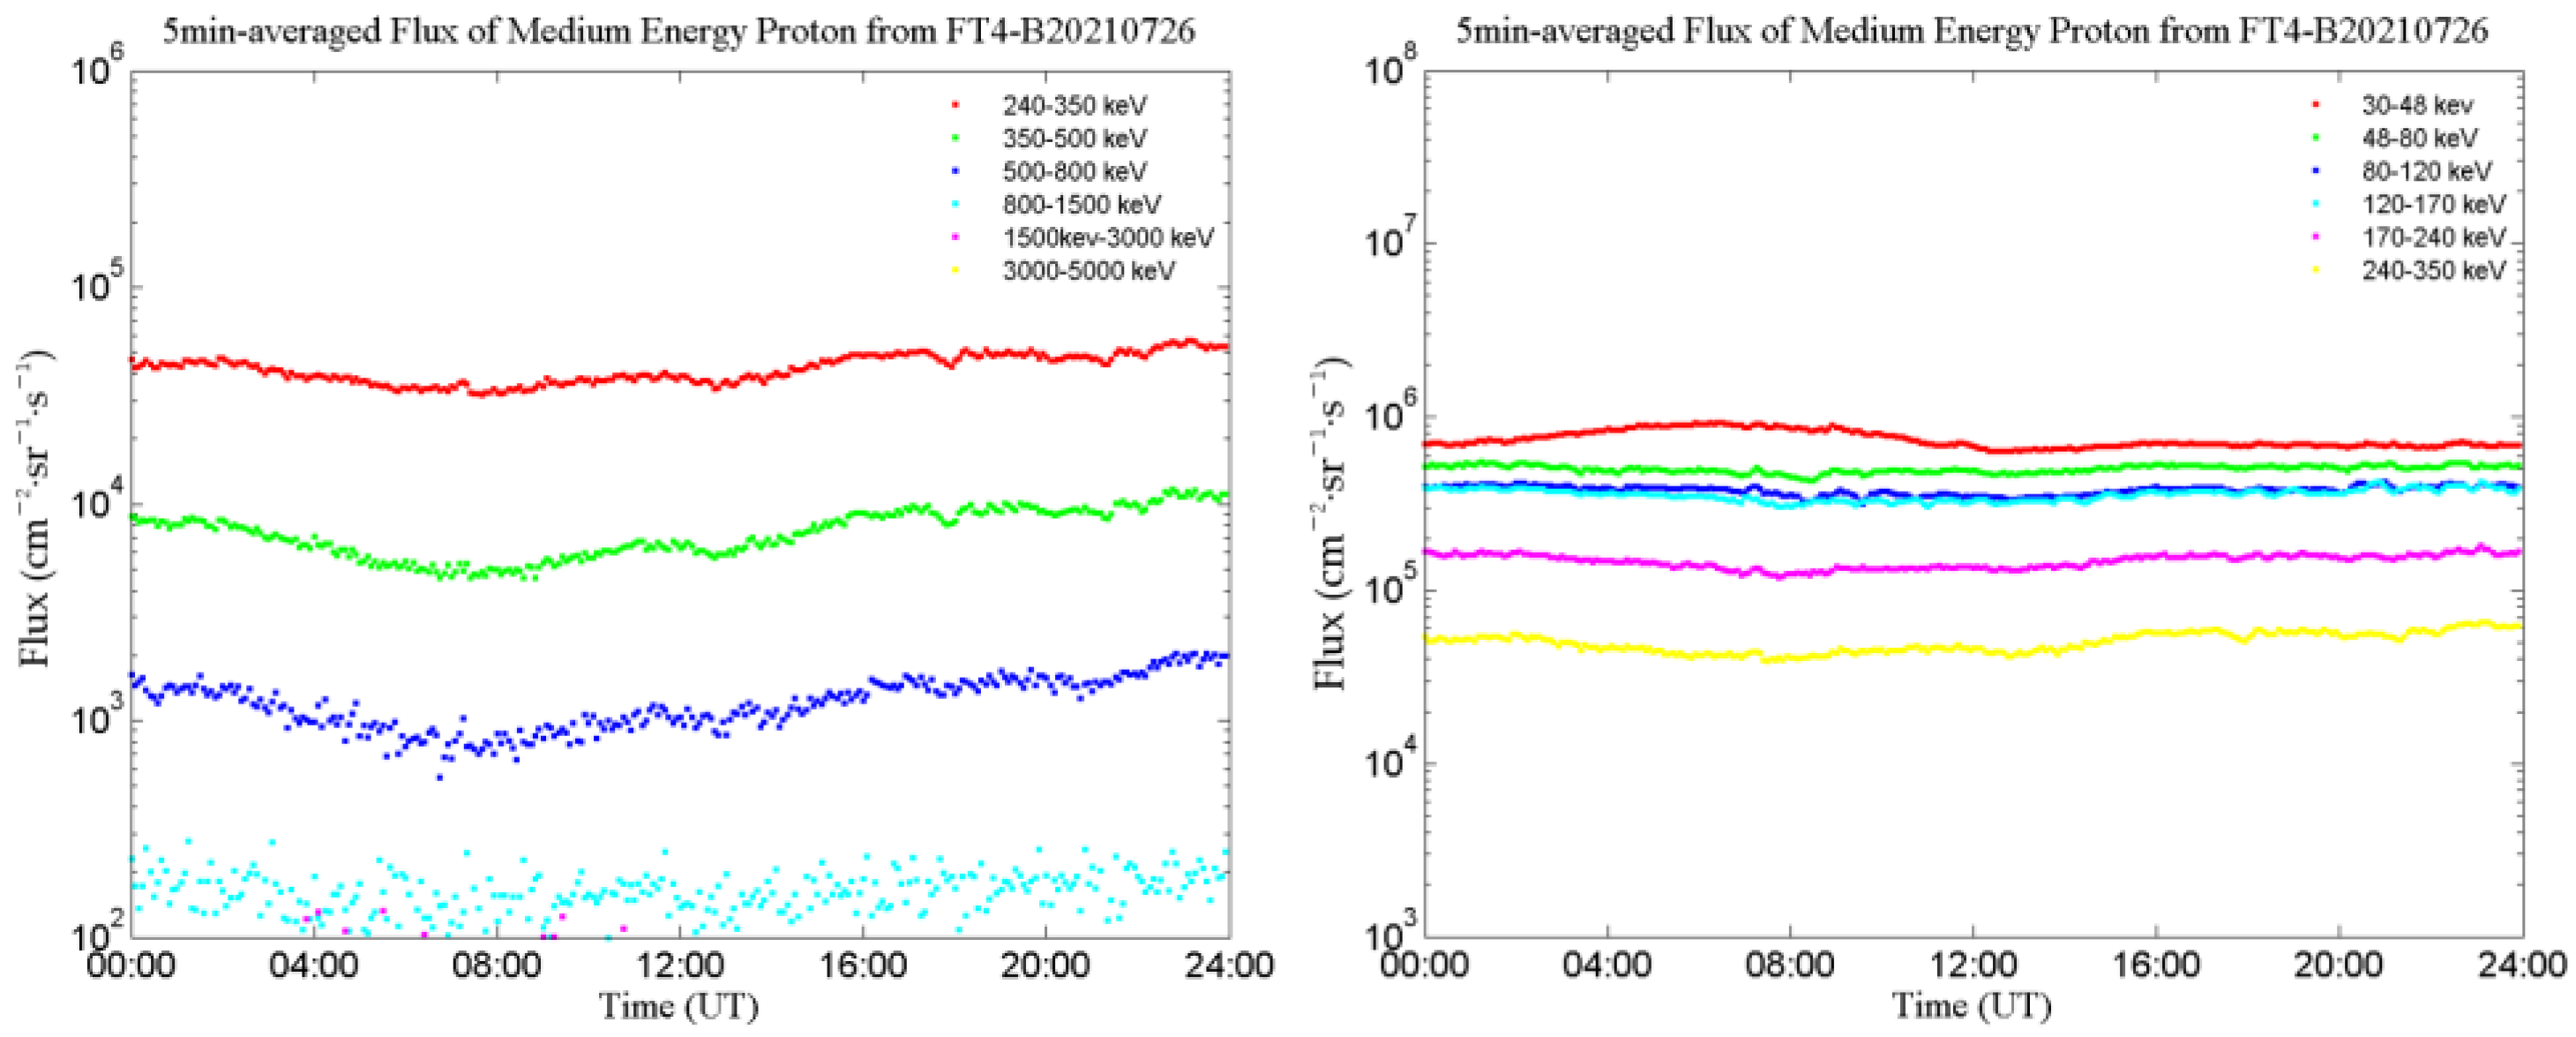
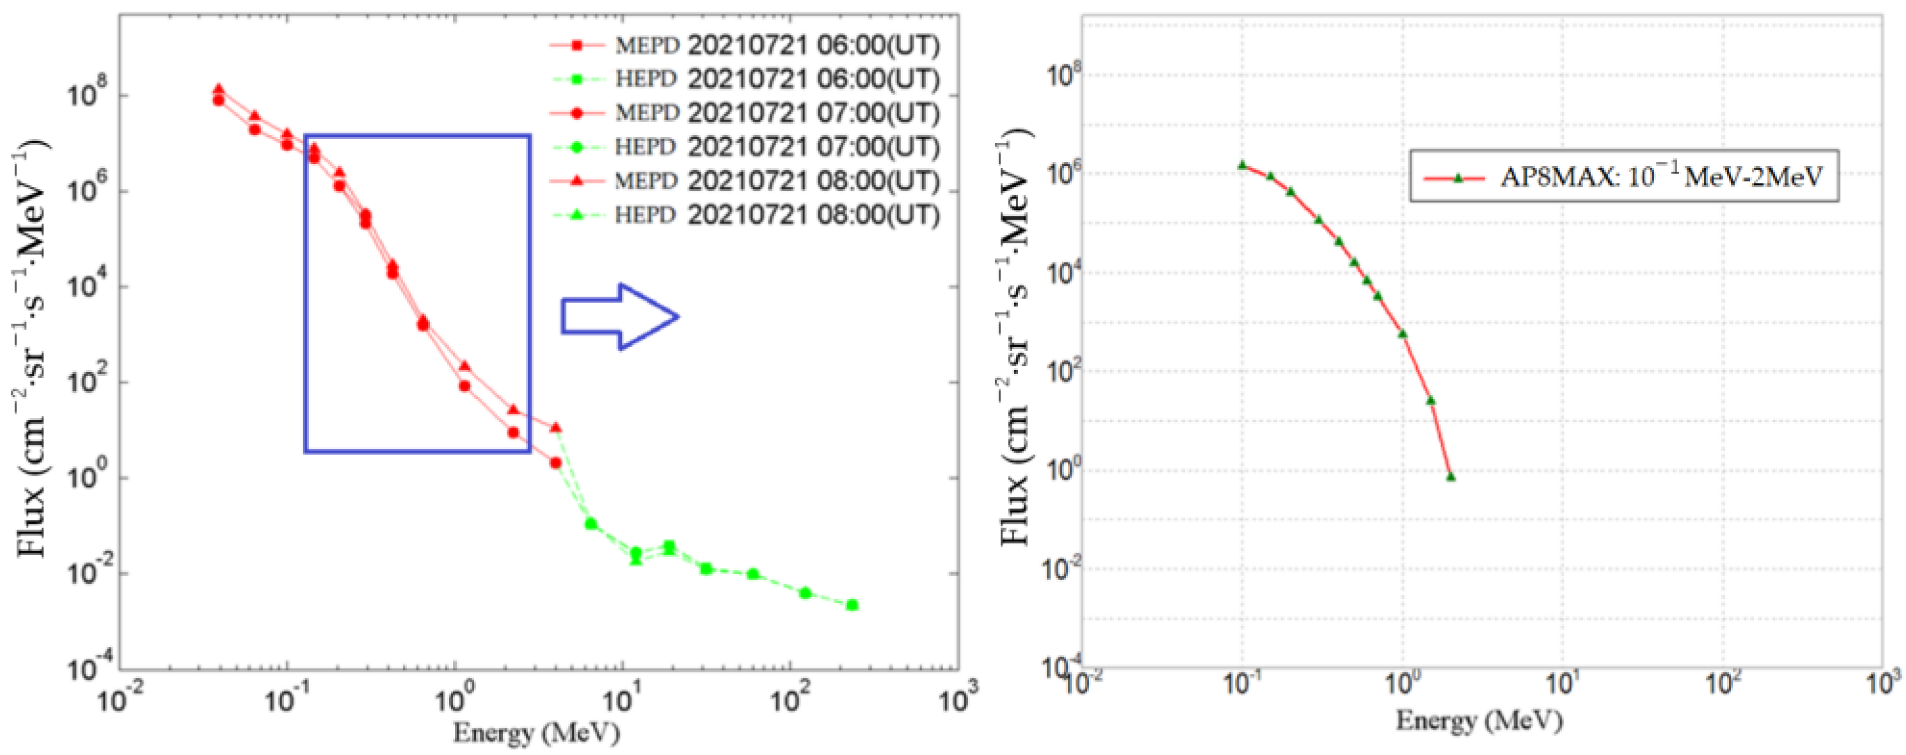
5. Observation Results in Orbit

After the launch of the FY-4B satellite in June 2021, the first-hand data obtained show that the distribution of medium-energy protons is consistent with the AP8 model [23]. Electron mixing and light pollution have been well suppressed.
Figure 24 shows the proton flux observation results for each channel in direction 5. As shown in the figure, the flux of each energy channel in this direction shows temporal changes at different time scales, indicating that the detector can continuously observe the flux of energetic protons in space, and fully realize the function of medium-energy proton detection.
Combined with the results of high-energy proton detection by the satellite, data of protons with a wide energy spectrum spanning 4 orders of magnitude (30 keV~300 MeV) were obtained for the first time in China (shown in Figure 25 left).
As a comparison, we normalized the differential data in Figure 16 (noting that the differential data in the figure needs to be divided by 4π for normalization) and redrew the data on the right part of Figure 25. It can be seen that there are delicate differences between the differential flux obtained from actual observations and the AP8 model results, but they are consistent in order of magnitude.

6. Conclusions

This paper discusses the design and development of the electronic system and sensor system of the MEPD on the FY-4B satellite in detail. Compared to the MEPD on the FY-3E satellite, the ability to eliminate light pollution is further improved by using a 100 nm nickel film. The experiment under the lighting of a solar simulator shows that all proton channels are not contaminated by photons. The geometrical factor is redesigned according to the characteristics of the orbital radiation environment. The data obtained in orbit show that this instrument works properly and the data are in good agreement with the results calculated using the AP8 model.

Author Contributions

Conceptualization, H.Z. and S.Z.; Methodology, H.Z.; Validation, S.Z.; Formal analysis, G.S.; Software, X.Z.; Data Curation, W.Z., J.G. and A.C.; Investigation, L.Z.; Supervision, G.S.; Resources, R.Z.; Project Administration, X.Z.; Writing—Original Draft Preparation, H.Z., S.Z., G.S., X.Z., W.Z., J.G., A.C., L.Z. and R.Z.; Writing—Review & Editing, H.Z., S.Z., G.S. and X.Z. All authors have read and agreed to the published version of the manuscript.

Funding

This work was supported by the China National Space Administration (CNSA D050103).

Data Availability Statement

No new data were created or analyzed in this study. Data sharing is not applicable to this article.

Acknowledgments

We thank the following facilities and personnel for supporting the calibration of the MEPD: NSSC-SEF (National Space Science Center-Space Electron Facility), China; Irradiation Facility dedicated to Heavy Ion-Induced Single-Event Effect, CIAE (China Institute of Atomic Energy), China; and HIRFL Heavy Ion Research Facility in Lanzhou, China. We thank Gang Guo/CIAE, Qiming Zhang/CIAE, Ping Zhou/NSSC-SEF, Wentao Ji/NSSC-SEF and Jie Liu/HIRFL for providing the service of calibration.

Conflicts of Interest

The authors declare no conflict of interest.

References

  1. Lu, F.; Zhang, X.H.; Chen, B.Y.; Liu, H.; Wu, R.H.; Han, Q.; Feng, X.H.; Li, Y.; Zhang, Z.Q. FY-4 geostationary meteorological satellite imaging characteristics and its application prospects. J. Mar. Meteorol. 2017, 37, 1–12. (In Chinese) [Google Scholar] [CrossRef]
  2. Wang, L.G.; Wang, J.B.; Xie, L.H. A Brief Introduction to the Belt and Road Initiative; China Intercontinental Press: Beijing, China, 2019; ISBN 9787508534220. [Google Scholar]
  3. Chang, Z.; Wang, Y.; Tian, T.; Pan, Y. Causal Analysis between Geosynchronous Satellite Anomalies and Space Environment. J. Astronaut. 2017, 38, 435–442. [Google Scholar] [CrossRef]
  4. Matéo-Vélez, J.-C.; Sicard, A.; Payan, D.; Ganushkina, N.; Meredith, N.P.; Sillanpäa, I. Spacecraft surface charging induced by severe environments at geosynchronous orbit. Space Weather 2018, 16, 89–106. [Google Scholar] [CrossRef]
  5. Nagai, T.; Shinohara, I.; Singer, H.J.; Rodriguez, J.; Onsager, T.G. Proton and Electron Injection Path at Geosynchronous Altitude. J. Geophys. Res. Space Phys. 2019, 124, 4083–4103. [Google Scholar] [CrossRef]
  6. Tsurutani, B.; Arballo, J.; Zhou, X.-Y.; Galvan, C.; Chao, J. Electromagnetic electron and proton cyclotron waves in geospace: A cassini snapshot. COSPAR Colloq. Ser. 2002, 12, 97–125. [Google Scholar] [CrossRef]
  7. Baker, D.N.; Belian, R.D.; Higbie, P.R.; Hones, E.W., Jr. High-Energy Magnetospheric Protons and Their Dependence on Geomagneticand Interplanetary Conditions. J. Geophys. 1979, 84, 7138–7154. [Google Scholar] [CrossRef]
  8. Shen, G.; Zhang, X.; Wang, J.; Huang, C.; Li, J.; Zhang, S.; Zhang, X.; Yang, Y.; Zhang, P.; Sun, Y. Development and Calibration of a Three-Directional High-Energy Particle Detector for FY-3E Satellite. Aerospace 2023, 10, 173. [Google Scholar] [CrossRef]
  9. Zhang, H.; Zhang, X.; Wang, J.; Huang, C.; Li, J.; Zong, W.; Shen, G.; Zhang, S.; Yang, Y.; Zhang, P. Design and Development of Medium Energy Proton Detector Onboard FY-3E Satellite. Aerospace 2023, 10, 321. [Google Scholar] [CrossRef]
  10. Ren, L.; Liu, W. Design of RS-422 Bus Data Processing Software. Meas. Control Technol. 2012, 31, 90–92. [Google Scholar] [CrossRef]
  11. Zheng, J.; Zhang, N.; Xian, J. Design and implementation of time synchronization system of 1553B and RS-422 bus. Electron. Meas. Technol. 2018, 41, 86–90. (In Chinese) [Google Scholar]
  12. Geant4 Collaboration. Geant4’s Guide for Application Developers, Version Geant4.10.0. 2013. Available online: https://geant4.web.cern.ch/ (accessed on 7 May 2020).
  13. Geant4 Collaboration. Physics Reference Manual, Version Geant4.9.1. 2007. Available online: https://geant4.web.cern.ch/ (accessed on 7 May 2020).
  14. Allison, J.; Amako, K.; Apostolakis, J.; Arce, P.; Asai, M.; Aso, T.; Bagli, E.; Bagulya, A.; Banerjee, S.; Barrand, G.; et al. Recent developments in Geant4. Ann. Nucl. Energy 2015, 82, 19–28. [Google Scholar] [CrossRef]
  15. Zhang, S.Y.; Wang, S.J. Design of the sweeping magnet in the space particle detector. Chin. J. Geophys. 2007, 50, 684–690. (In Chinese) [Google Scholar] [CrossRef]
  16. Zhang, S.Y.; Zhang, X.G.; Wang, C.Q.; Shen, G.; Jing, T.; Zhang, B.; Sun, Y.; Zhu, G.; Liang, J.; Zhang, X.; et al. The geometrical factor of high energy protons detector on FY-3 satellite. Sci. China Earth Sci. 2014, 57, 2558–2566. [Google Scholar] [CrossRef]
  17. Yando, K.; Millan, R.M.; Green, J.C.; Evans, D.S. A Monte Carlo simulation of the NOAA POES Medium Energy Proton and Electron Detector instrument. J. Geophys. Res. Earth Surf. 2011, 116. [Google Scholar] [CrossRef]
  18. Hou, D.; Zhang, S.; Zhang, X.; Zong, W. Design Optimization of Novel Collimator for Detector of Space High Energy Electron: A Simulation Study. Chin. J. Vac. Sci. Technol. 2020, 10, 965–970. [Google Scholar]
  19. Grupen, C.; Shwartz, B. Particle Detectors (Cambridge Monographs on Particle Physics, Nuclear Physics and Cosmology, Series Number 26), 2nd ed.; Cambridge University Press: Cambridge, UK, 2011. [Google Scholar]
  20. Mcfadden, J.P.; Evans, D.S.; Kasprzak, W.T.; Brace, L.H.; Chornay, D.J.; Coates, A.J.; Dichter, B.K.; Hoegy, W.R.; Holeman, E.; Kadinsky-Cade, K.; et al. In-flight instrument calibration and performance verification. ISSI Sci. Rep. 2007, SR–007, 277–385. [Google Scholar]
  21. Rodriguez, J.V.; Michael, H.D.; Henderson, M.G. On-orbit calibration of geostationary electron and proton flux observations for augmentation of an existing empirical radiation model. J. Space Weather Space Clim. J. 2020, 10, 28. [Google Scholar] [CrossRef]
  22. Jo, G.-B.; Sohn, J.; Choi, C.R.; Yi, Y.; Min, K.-W.; Kang, S.-B.; Na, G.W.; Shin, G.-H. Development of High Energy Particle Detector for the Study of Space Radiation Storm. J. Astron. Space Sci. 2014, 31, 277–283. [Google Scholar] [CrossRef]
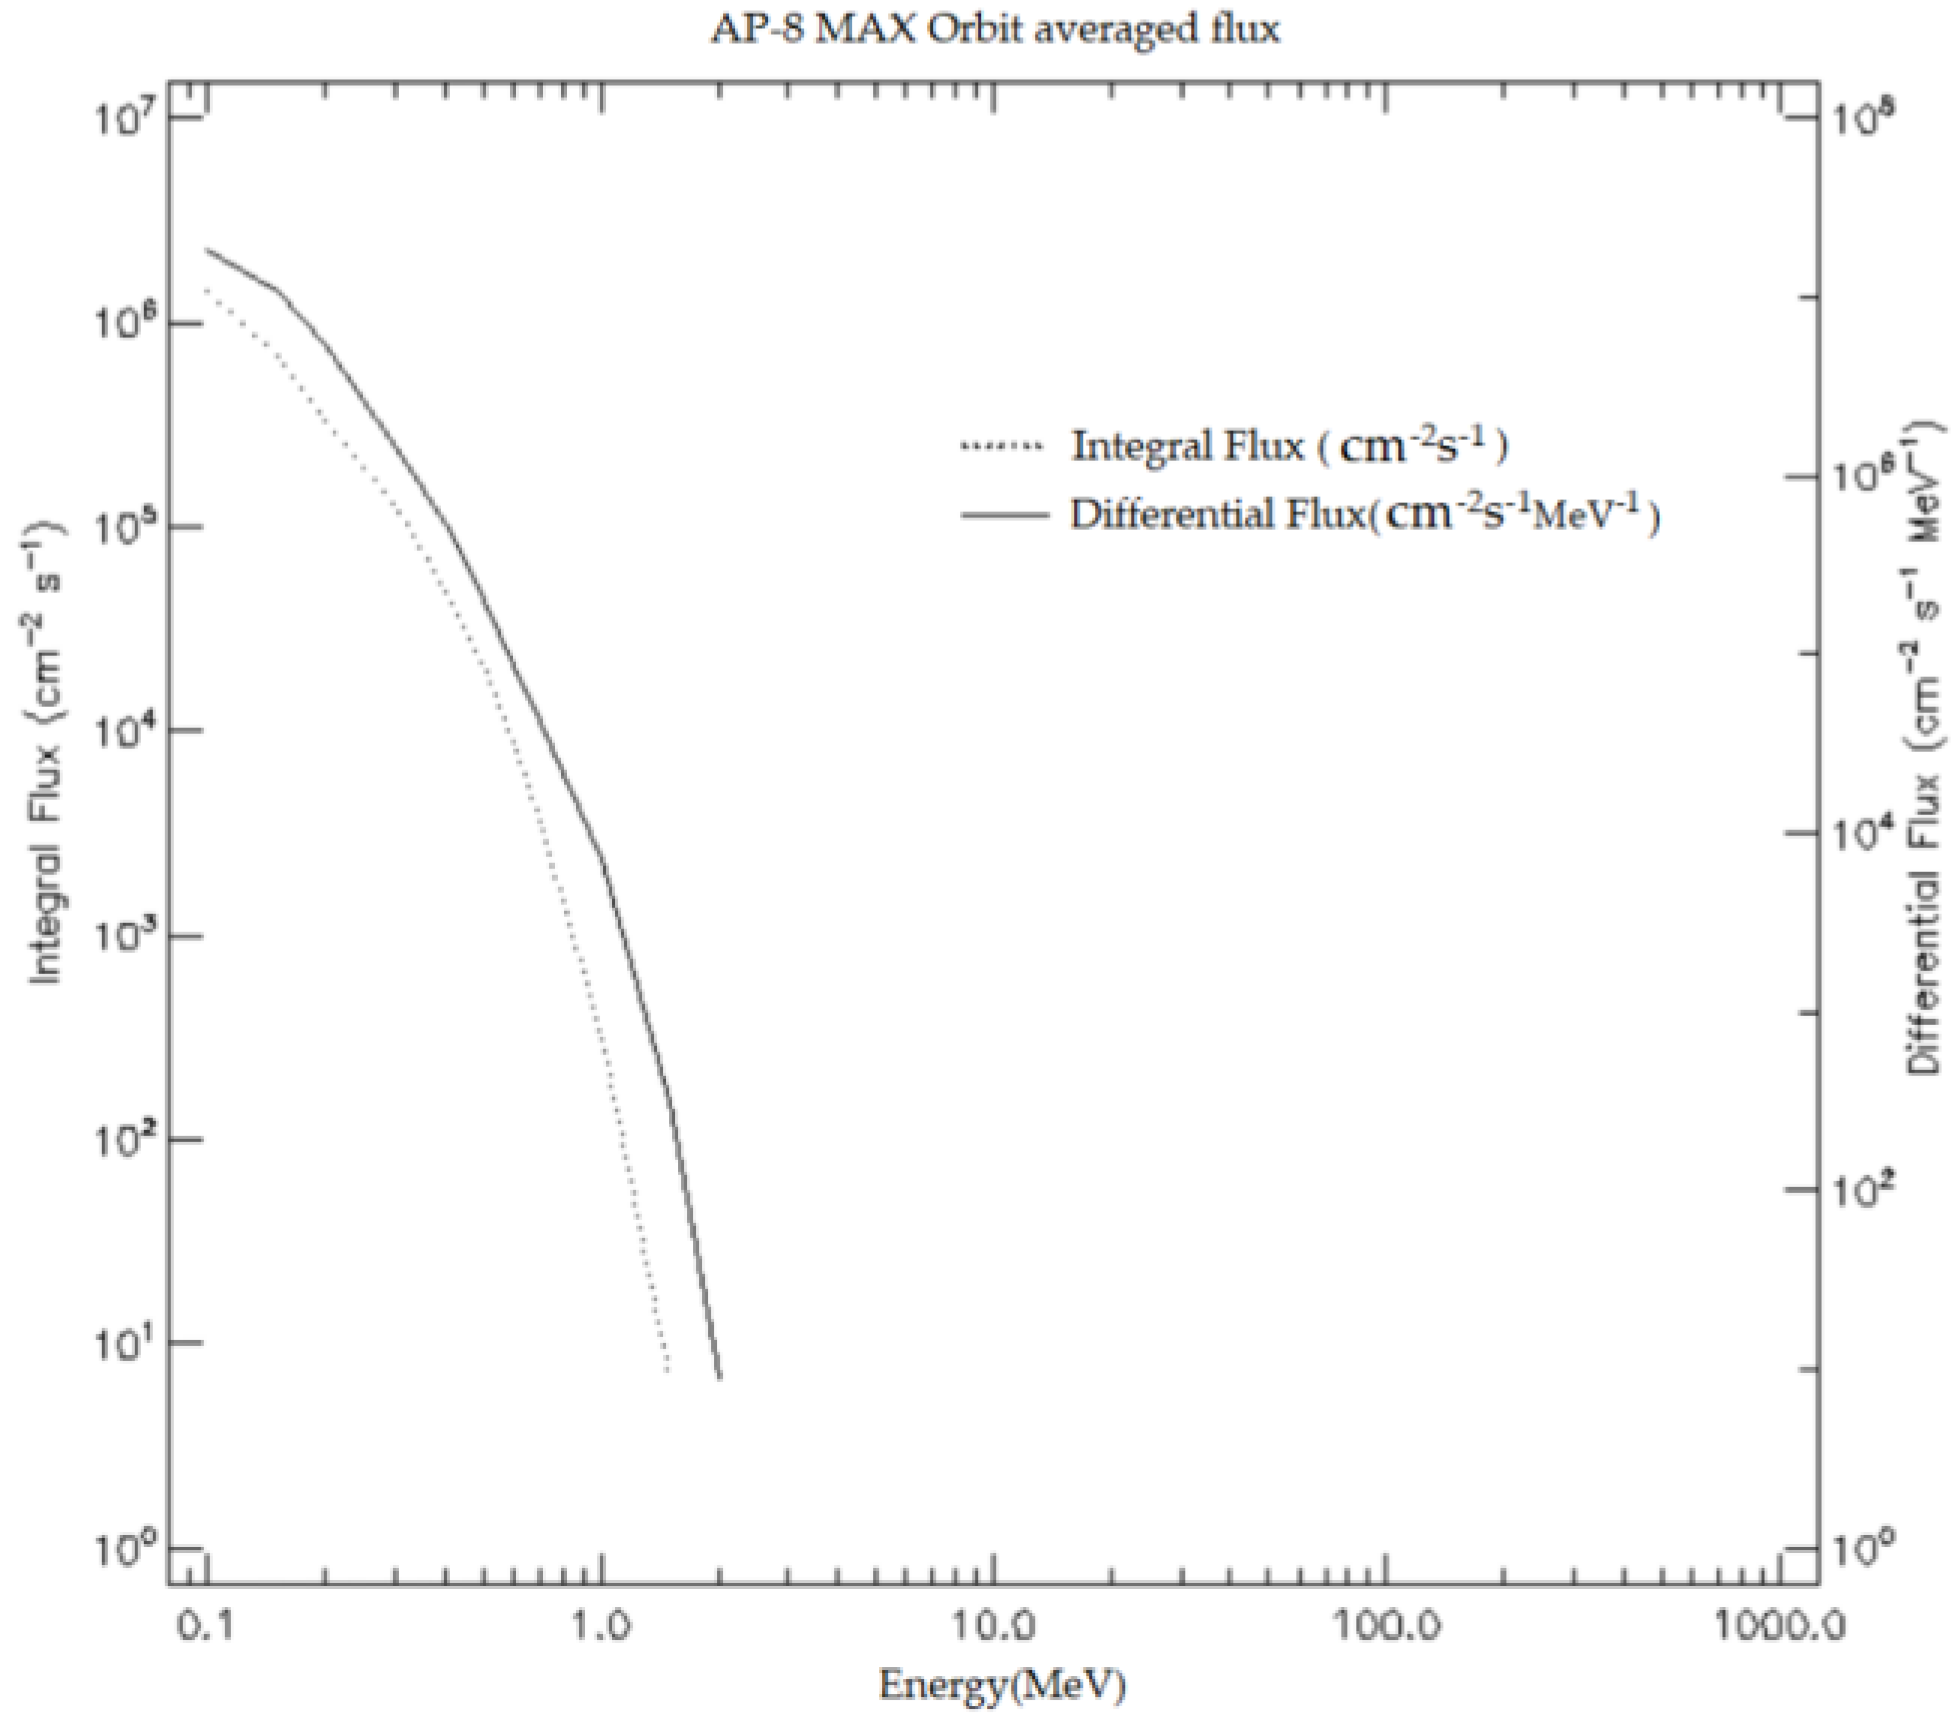
  23. Morton, T. Estimation of The Radiation Environment Based On The NASA Ap-8 and Ae-8 Models. In Proceedings of the 5th International Workshop on Radiation Effects on Semiconductor Devices for Space Applications, Takasaki, Japan, 9–11 October 2002. [Google Scholar]
Figure 1. Detectors onboard FY-4B satellite.
Aerospace 10 00889 g001
Figure 2. Space environment on FY-4 satellite orbit.
Aerospace 10 00889 g002
Figure 3. The MEPD installation on FY-4B satellite.
Aerospace 10 00889 g003
Figure 4. Connection diagram of the MEPD.
Aerospace 10 00889 g004
Figure 5. Internal structure of a measurement unit.
Aerospace 10 00889 g005
Figure 6. Schematic diagram of detector A.
Aerospace 10 00889 g006
Figure 7. FPGA modules and their function relationship.
Aerospace 10 00889 g007
Figure 8. Time division of software workflow.
Aerospace 10 00889 g008
Figure 9. Simulation of the exposure of MEPD sensors to the Sun on the FY-4B orbit.
Aerospace 10 00889 g009
Figure 10. Simulation of the exposure of MEPD sensors to the Sun on the FY-3E orbit.
Aerospace 10 00889 g010
Figure 11. Comparison of photon transmittance of four 100 nm metal films.
Aerospace 10 00889 g011
Figure 12. Lighting test of MEPD with solar simulator in vacuum tank.
Aerospace 10 00889 g012
Figure 13. Transmittance of protons with (black line) or without (red line) the addition of the 100 nm nickel film.
Aerospace 10 00889 g013
Figure 14. Geant4 simulation of energy deposition of 30 keV protons in Si sensors.
Aerospace 10 00889 g014
Figure 15. Deflection scenario of 1.5 MeV electrons passing through the magnetic field.
Aerospace 10 00889 g015
Figure 16. The integral/differential proton flux on the FY-4 orbit calculated by the AP8 model.
Aerospace 10 00889 g016
Figure 17. The block diagram of the calibration testing system.
Aerospace 10 00889 g017
Figure 18. The calibration scenario of the MEPD.
Aerospace 10 00889 g018
Figure 19. The Gaussian fitting results of the accelerator test data.
Aerospace 10 00889 g019
Figure 20. The linear fitting results of energy loss and multi-channel addresses.
Aerospace 10 00889 g020
Figure 21. Energy response performance testing.
Aerospace 10 00889 g021
Figure 22. Composition diagram of flux error.
Aerospace 10 00889 g022
Figure 23. Detector-measured counts vs. input particle number.
Aerospace 10 00889 g023
Figure 24. Observations of medium-energy proton flux in direction 5.
Aerospace 10 00889 g024
Figure 25. Observational results of medium-to-high-energy protons (30 keV–300 MeV) on FY-4B satellite (left) and calculation result of medium-energy protons (100 keV–2 MeV) using AP8MAX model (right).
Aerospace 10 00889 g025
Table 1. Scientific indicators of MEPD.
No.ParameterMEPD on FY-4BRemarks
1Energy range30 keV–5 MeV
12 channels:
Low energy section:
P1: 30 keV–48 keV;
P2: 48 keV–80 keV;
P3: 80 keV–120 keV;
P4: 120 keV–170 keV;
P5: 170 keV–240 keV;
P6: 240 keV–350 keV.
High energy section:
P7: 240 keV–350 keV;
P8: 350 keV–500 keV;
P9: 500 keV–800 keV;
P10: 800 keV–1500 keV;
P11: 1500 keV–3000 keV;
P12: 3000 keV–5000 keV.
Channel P6 and channel P7 are overlapping in order to verify the long-term consistency of the two energy sections
2Detection directions
and field of view
18
(20° × 20° for each direction)
Detector A: directions 1–9
Detector B: directions 10–18
Table 2. Calibration results of energy resolution and energy linearity.
DetectorDirectionEnergy LinearityEnergy Resolution
A11.69%4.55% (@280 keV)
21.57%4.62% (@280 keV)
31.54%4.27% (@280 keV)
42.43%4.19% (@280 keV)
53.57%8.16% (@280 keV)
62.19%5.08% (@280 keV)
71.67%4.11% (@280 keV)
83.94%7.42% (@280 keV)
91.74%4.2% (@280 keV)
B101.10%4.86% (@280 keV)
110.79%6.50% (@280 keV)
121.11%6.27% (@280 keV)
132.78%10.56% (@280 keV)
141.84%6.44% (@280 keV)
150.94%6.72% (@280 keV)
161.20%5.98% (@280 keV)
170.40%4.77% (@280 keV)
180.76%4.86% (@280 keV)
Table 3. Energy demarcation points and error range.
Energy
Channel
Designed Boundary (keV) Actual Boundary (keV) Error Range (%)
P130–4848.20.42%
P248–8048.2–79.90.42%/0.12%
P380–12079.9–120.90.21%/0.75%
P4120–170120.9–171.80.75%/1.06%
P5170–240171.8–243.61.06%/1.50%
P6240–350243.6–355.81.50%/1.66%
P7240–350244.2–356.31.75%/1.80%
P8350–500356.3–502.31.80%/0.46%
P9500–800502.3–790.70.46%/1.16%
P10800–1500790.7–1495.81.16%/0.28%
P111500–30001495.8–2997.50.28%/0.08%
P123000–50002997.5–4996.30.08%/0.03%
Disclaimer/Publisher’s Note: The statements, opinions and data contained in all publications are solely those of the individual author(s) and contributor(s) and not of MDPI and/or the editor(s). MDPI and/or the editor(s) disclaim responsibility for any injury to people or property resulting from any ideas, methods, instructions or products referred to in the content.

