Article

Automated Model Hardening with Reinforcement Learning for On-Orbit Object Detectors with Convolutional Neural Networks

1
Innovation Academy for Microsatellites of Chinese Academy of Sciences, Shanghai 201306, China
2
University of Chinese Academy of Sciences, Beijing 100039, China
*
Author to whom correspondence should be addressed.
Aerospace 2023, 10(1), 88; https://doi.org/10.3390/aerospace10010088
Submission received: 7 December 2022 / Revised: 12 January 2023 / Accepted: 13 January 2023 / Published: 16 January 2023
(This article belongs to the Special Issue Advances in Aerospace Software Engineering)

Abstract

:
On-orbit object detection has received extensive attention in the field of artificial intelligence (AI) in space research. Deep-learning-based object-detection algorithms are often computationally intensive and rely on high-performance devices to run. However, those devices usually lack space-qualified versions, and they can hardly meet the reliability requirement if directly deployed on a satellite platform, due to software errors induced by the space environment. In this paper, we evaluated the impact of space-environment-induced software errors on object-detection algorithms through large-scale fault injection tests. Aside from silent data corruption (SDC), we propose an extended criterial SDC-0.1 to better quantify the effect of the transient faults on the object-detection algorithms. Considering that a bit-flip error could cause severe detection result corruption in many cases, we propose a novel automated model hardening with reinforcement learning (AMHR) framework to solve this problem. AMHR searches for error-sensitive kernels in a convolutional neural network (CNN) through trial and error with a deep deterministic policy gradient (DDPG) agent and has fine-grained modular-level redundancy to increase the fault tolerance of the CNN-based object detectors. Compared to other selective hardening methods, AMHR achieved the lowest SDC-0.1 rates for various detectors and could tremendously improve the mean average precision (mAP) of the SSD detector by 28.8 in the presence of multiple errors.

1. Introduction

There is growing interest in the research on artificial intelligence (AI) applied to space in recent years. With the deployment of AI algorithm types such as deep learning, the autonomy level of the satellite can be tremendously increased. The on-orbit analysis of Earth observation satellite (EOS) payload data is one of the most-important applications of AI in the area of space. The capability of EOSs is often limited by the uplink and downlink bandwidth combined with ground station availability [1]. A convolutional neural network (CNN) can serve as a good feature extractor and is well suited for the analysis of remote sensing data. Running deep learning (DL) algorithms on-orbit allows for data consumption at the source rather than on the ground and, thus, requires only a tiny fraction of the downlink bandwidth that would be otherwise required. Successful demonstrations of DL applications in EOSs include weather monitoring [2], land cover classification [3,4], and object detection [5].
To enable the efficient inference of the deep neural network (DNN), devices such as application-specific hardware accelerators or graphic processing units (GPUs) are utilized. However, most of these devices only provide commercial off-the-shelf (COTS) versions, which are not space-qualified. When applied to space, the devices face challenges due to the ionizing radiation. Transient effects such as a single-event effect (SEU) can either manifest as single-bit upset or a multiple-bit upset software errors. The SEU can flip bits in the control logics and memory and might eventually cause silent data corruption (SDC), meaning the final output will deviate from the expected detection result, as shown in Figure 1. On the other hand, experimental results have shown that the accuracy of a DL-based classification algorithm can drastically drop due to the impact of soft errors [6].
To mitigate the risk of a transient fault, space-borne devices often feature information redundancy techniques such as triple modular redundancy (TMR), which increases the complexity of the design at the expense of performance [7]. For the DL algorithms, selective hardening of the DNN models has become a feasible choice [8,9,10]. This method provides fine-grained modular-level redundancy and achieves a balance between system performance and robustness. However, most of the current works have focused on DL-based classification algorithms, increasing the fault tolerance of DL-based object-detection algorithms, which remains an important, but unsolved issue.
This paper focuses on the EOS mission of on-orbit object detection in remote sensing images (RSIs) and is aimed at a fault-tolerant solution for object detectors with CNNs. We first evaluated the impact of the software errors caused by the SEU through massive fault injection tests. Our fault injection tests covered most representative deep-learning-based object detectors, including both region-proposal-based and regression-based algorithms. Aside from SDC, an extended criterial SDC-0.1 is proposed to better quantify the effect of transient faults on the object-detection algorithms, with a detailed description given in Section 3.3.
We further propose a novel automated model hardening with reinforcement learning (AMHR) framework, which provides a general solution to quickly search for the most error-sensitive kernels in various CNN structures. AMHR formulates the search for sensitive kernels as a sequential decision process and trains a deep deterministic policy gradient (DDPG) agent [11] to solve the problem. The agent observes the state of each layer and outputs the ratio of sensitive kernels as the action. The weight-sum method [12] is then applied to pinpoint the exact positions of the sensitive kernels. This two-stage searching pattern extremely compresses the search space. We propose two different fault-tolerance-evaluation methods as the reward functions. The experimental results showed that our AMHR method can effectively reduce the model’s SDC-0.1 rate by over 3.3×, with a computational overhead of less than 2×. In the presence of multiple errors, the mean average precision (mAP) of the AMHR hardening SSD detector was tremendously improved by more than 53.4 compared to the original model.
We made the following major contributions in this paper:
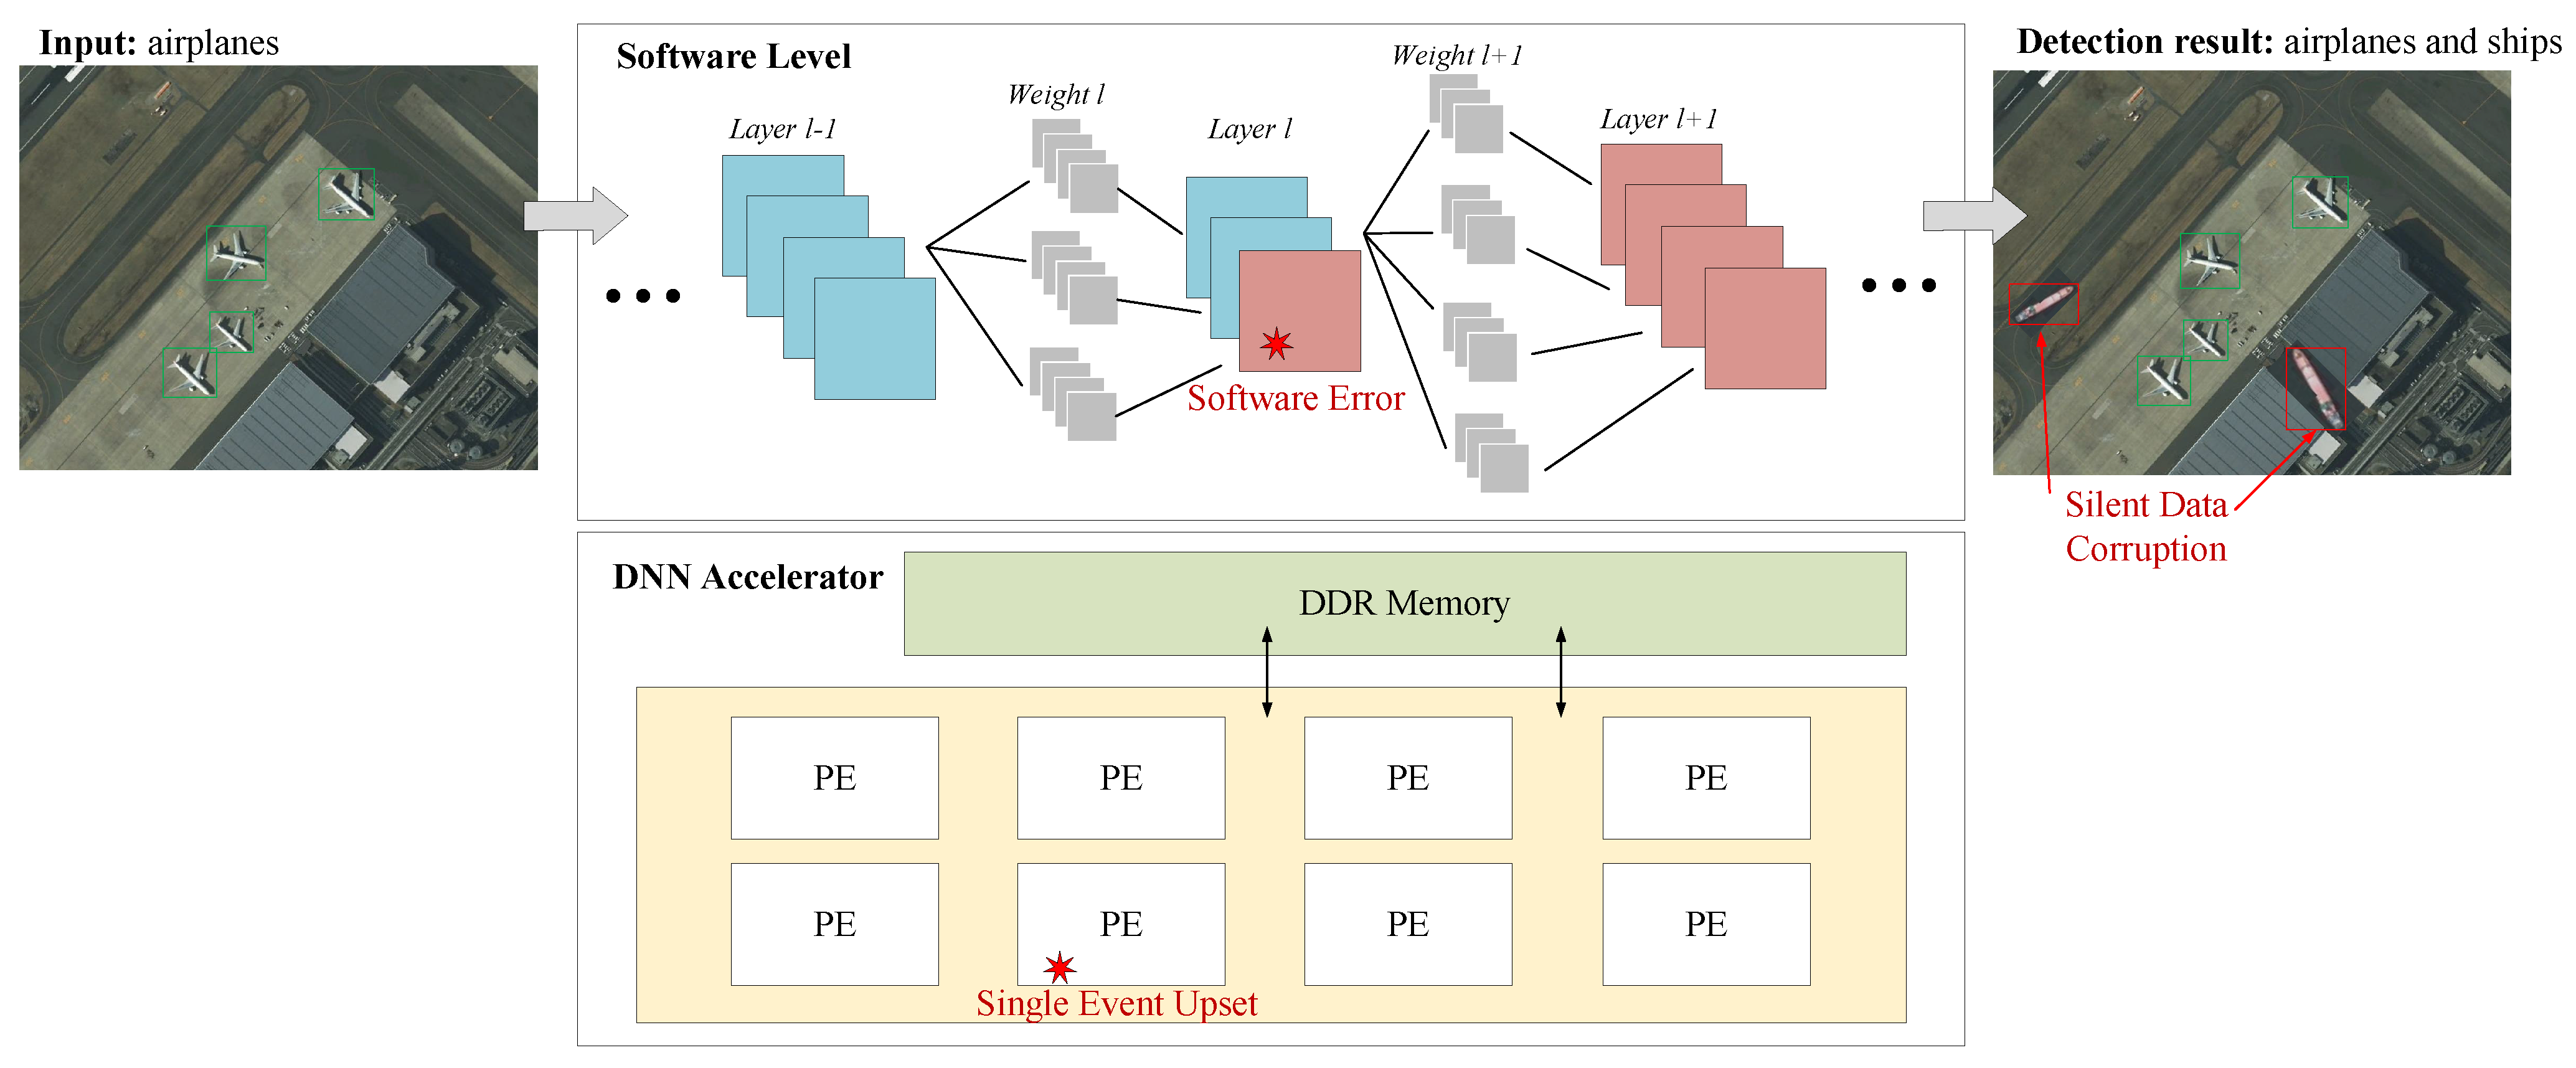
  • We performed a large-scale fault injection study for representative DL-based object-detection algorithms. We compared the SEU-caused error propagation behaviors based on the detection frameworks, the CNN structures, the position of the layers, and the data types. The performance losses of the object detectors in the presence of multiple errors were also evaluated, providing a practical insight into the vulnerability of DL applications;
  • We propose a novel AMHR framework to effectively perform model hardening for CNN-based object-detection algorithms. The usefulness of our AMHR method was evaluated with the SSD and Faster R-CNN detectors. The experimental results showed that the fault tolerance of models hardened with AMHR outperformed the models with other selective hardening strategies.

2. Related Works

2.1. Space AI Applications in EOS

Currently, hundreds of EOSs are operating on-orbit, producing a huge amount of high-resolution observation data. Many agencies have conducted space AI application test, allowing EOSs to analyze raw data on-orbit and only download those with maximum scientific value. The Earth Observing 1 spacecraft deployed three machine learning algorithms, including two cloud detectors and an unsupervised novelty detector [13]. Spacecraft Supercomputing for Image and Video Processing (SSIVP) was a payload aboard the International Space Station. A TensorFlow Lite framework for onboard classification and prototype models for land-cover classification were deployed on SSIVP [3,14]. Phi-sat 1 ran a neural network dedicated to cloud detection, which greatly enhanced the scouting capability of the satellite [15]. The onboard image processing payload of the HISEA-1 satellite is able to perform real-time ship detection and the detection of ground changes [16].

2.2. Object Detection with CNN

DL-based object-detection algorithms have made seen improvement thanks to the innovation of network structures, optimized detection frameworks, and model training strategies. DL-based object-detection algorithms normally fall into two categories: region-proposal-based and regression-based. Region-proposal-based algorithms follow the traditional object detection task flow; they first generate regions of interest and then classify these region proposals. Some influential works include the R-CNN [17], Faster R-CNN [18], FPN [19], and Mask R-CNN [20]. Regression-based algorithms consider the object detection task as a regression problem; they directly calculate the locations and classes of targets from the input image data. Representative works include SSD [21] and the YOLO series [22,23,24]. DL-based detectors also achieve excellent performances when applied to the RSI object detection task [25,26,27].
The CNN is the most-popular backbone network model for object-detection algorithms. Common CNN models include VGG [28], ResNet [29], MobilNet [30], etc. A CNN model consists of multiple convolutional layers, and Figure 2 shows the general structure of a convolutional layer. Each convolutional layer can be represented as a 4D tensor. Let W l be the convolutional kernels of layer l, with its shape C l + 1 × C l × U l × V l , where C ( l + 1 ) is the number of output feature map channels, corresponding to the number of convolutional kernels in the current layer. C ( l ) is the number of input feature map channels. U l × V l is the size of a single convolutional kernel. Let F ( l ) be the input feature map for W l , with its shape C l × M l × N l , where M l × N l is the size of the single-input feature map. The convolutional layer would first obtain a 3D tensor A l + 1 , with each element calculated using Equation (1).
a k , x , y ( l + 1 ) = c = 0 C ( l ) 1 u = 0 U ( l ) 1 v = 0 V ( l ) 1 f c , x + u , y + v ( l ) · w k , c , u , v ( l ) 0 k C ( l + 1 ) , 0 x M ( l + 1 ) , 0 y N ( l + 1 ) .
In Equation (1), M l + 1 × N l + 1 is the size of the single-output feature map. Finally, a ReLU activation function is utilized to calculate the output feature map of layer l: F l + 1 = m a x 0 , A l + 1 .

2.3. Model-Layer Fault Tolerance for Deep Learning System

In order to mitigate the influence of transient faults on the DNN system, a number of approaches from various angles have been proposed. Since the fault-tolerant deep learning design in the architecture layer or the circuit layer usually comes at a great expense, model-level fault tolerance techniques are preferred. To exploit a fault-tolerant solution for the DNN system, one should first understand the behavior of the DNN models with computational faults by conducting neuron sensitivity analysis [31]. We divide sensitivity analysis methods into two types: simulation-based methods and sensitivity estimation methods.
Simulation-based methods conduct large-scale fault injection tests to empirically measure the error sensitivity for different parts [9,32,33]. To obtain statistically meaningful results, a large number of fault injection tests have to be performed, and this process could be very time consuming for large-scale networks. Sensitivity estimation methods try to derive neuron sensitivity values analytically. Reference [10] proposed a bit-flip resilience evaluation metric and conducted a sensitivity analysis of each individual neuron. Reference [34] designed multiple ranking methods to measure the order of importance among neurons and evaluated the improvement in the accuracy of a DNN in the presence of errors. However, as the working mechanism of the DNN is not yet fully understood, the above sensitivity estimation methods often lack a theoretical basis, and their validity requires further rigorous proof.
Our AMHR method overcomes the limitations of existing methods by combining both simulation-based and sensitivity estimation methods: we borrowed the idea of sensitivity estimation to guide the search for error-sensitive kernels within a network layer to compress the search space, and we empirically verified the fault tolerance of the model hardening through fault injection tests.

3. Fault Tolerance Analysis of CNN-Based Object Detectors

3.1. Exploration of Design Space

This paper focused on the mission of EOSs’ on-orbit object detection and conducted a large-scale fault injection tests for pre-trained object detectors with a CNN. We sought to understand how SEU causes software errors to propagate in a CNN model and to quantitatively measure the fault tolerance of some widely used object detectors. To estimate the SDC rate, we ran fault injection tests multiple times to count the number of times SDC occurs. Our fault injection tests mainly focused on the following aspects:
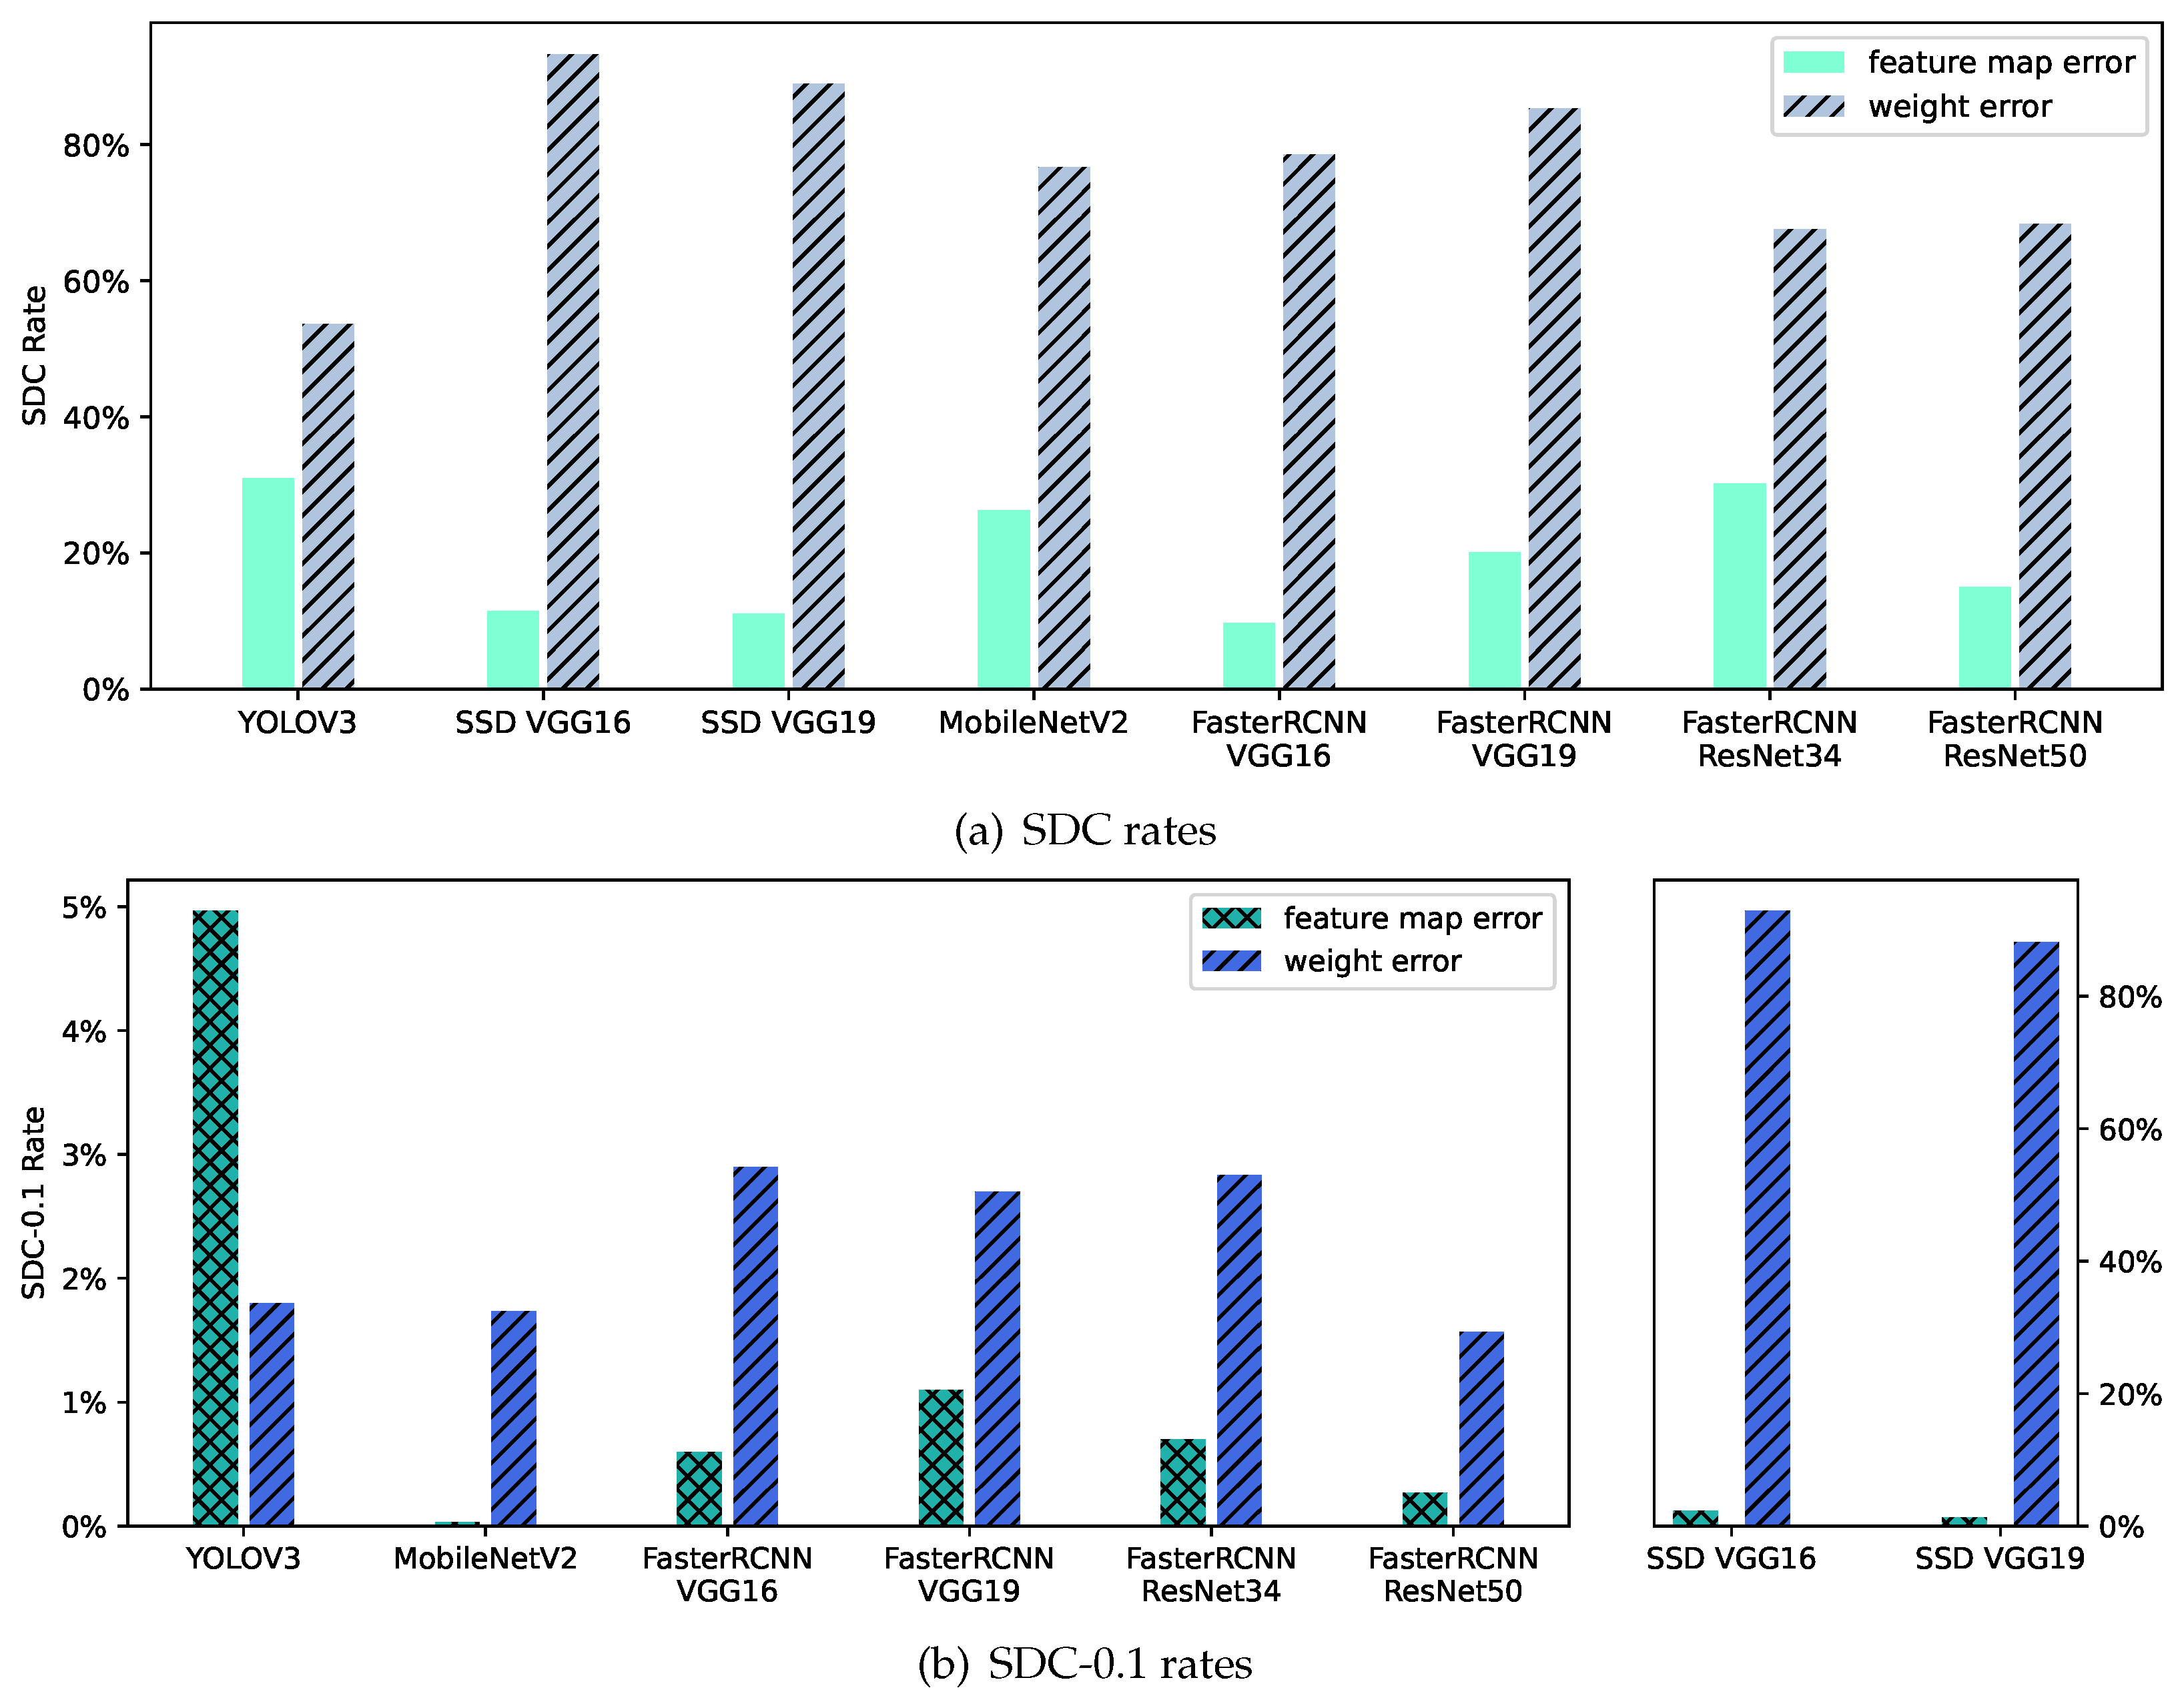
  • Detection framework and network structure: Each object detector has its own distinct work flow and backbone network structure, which may affect the error propagation. We compared the overall SDC rates of various detectors to explore the impact of the detector frameworks and network structures on the fault tolerance.
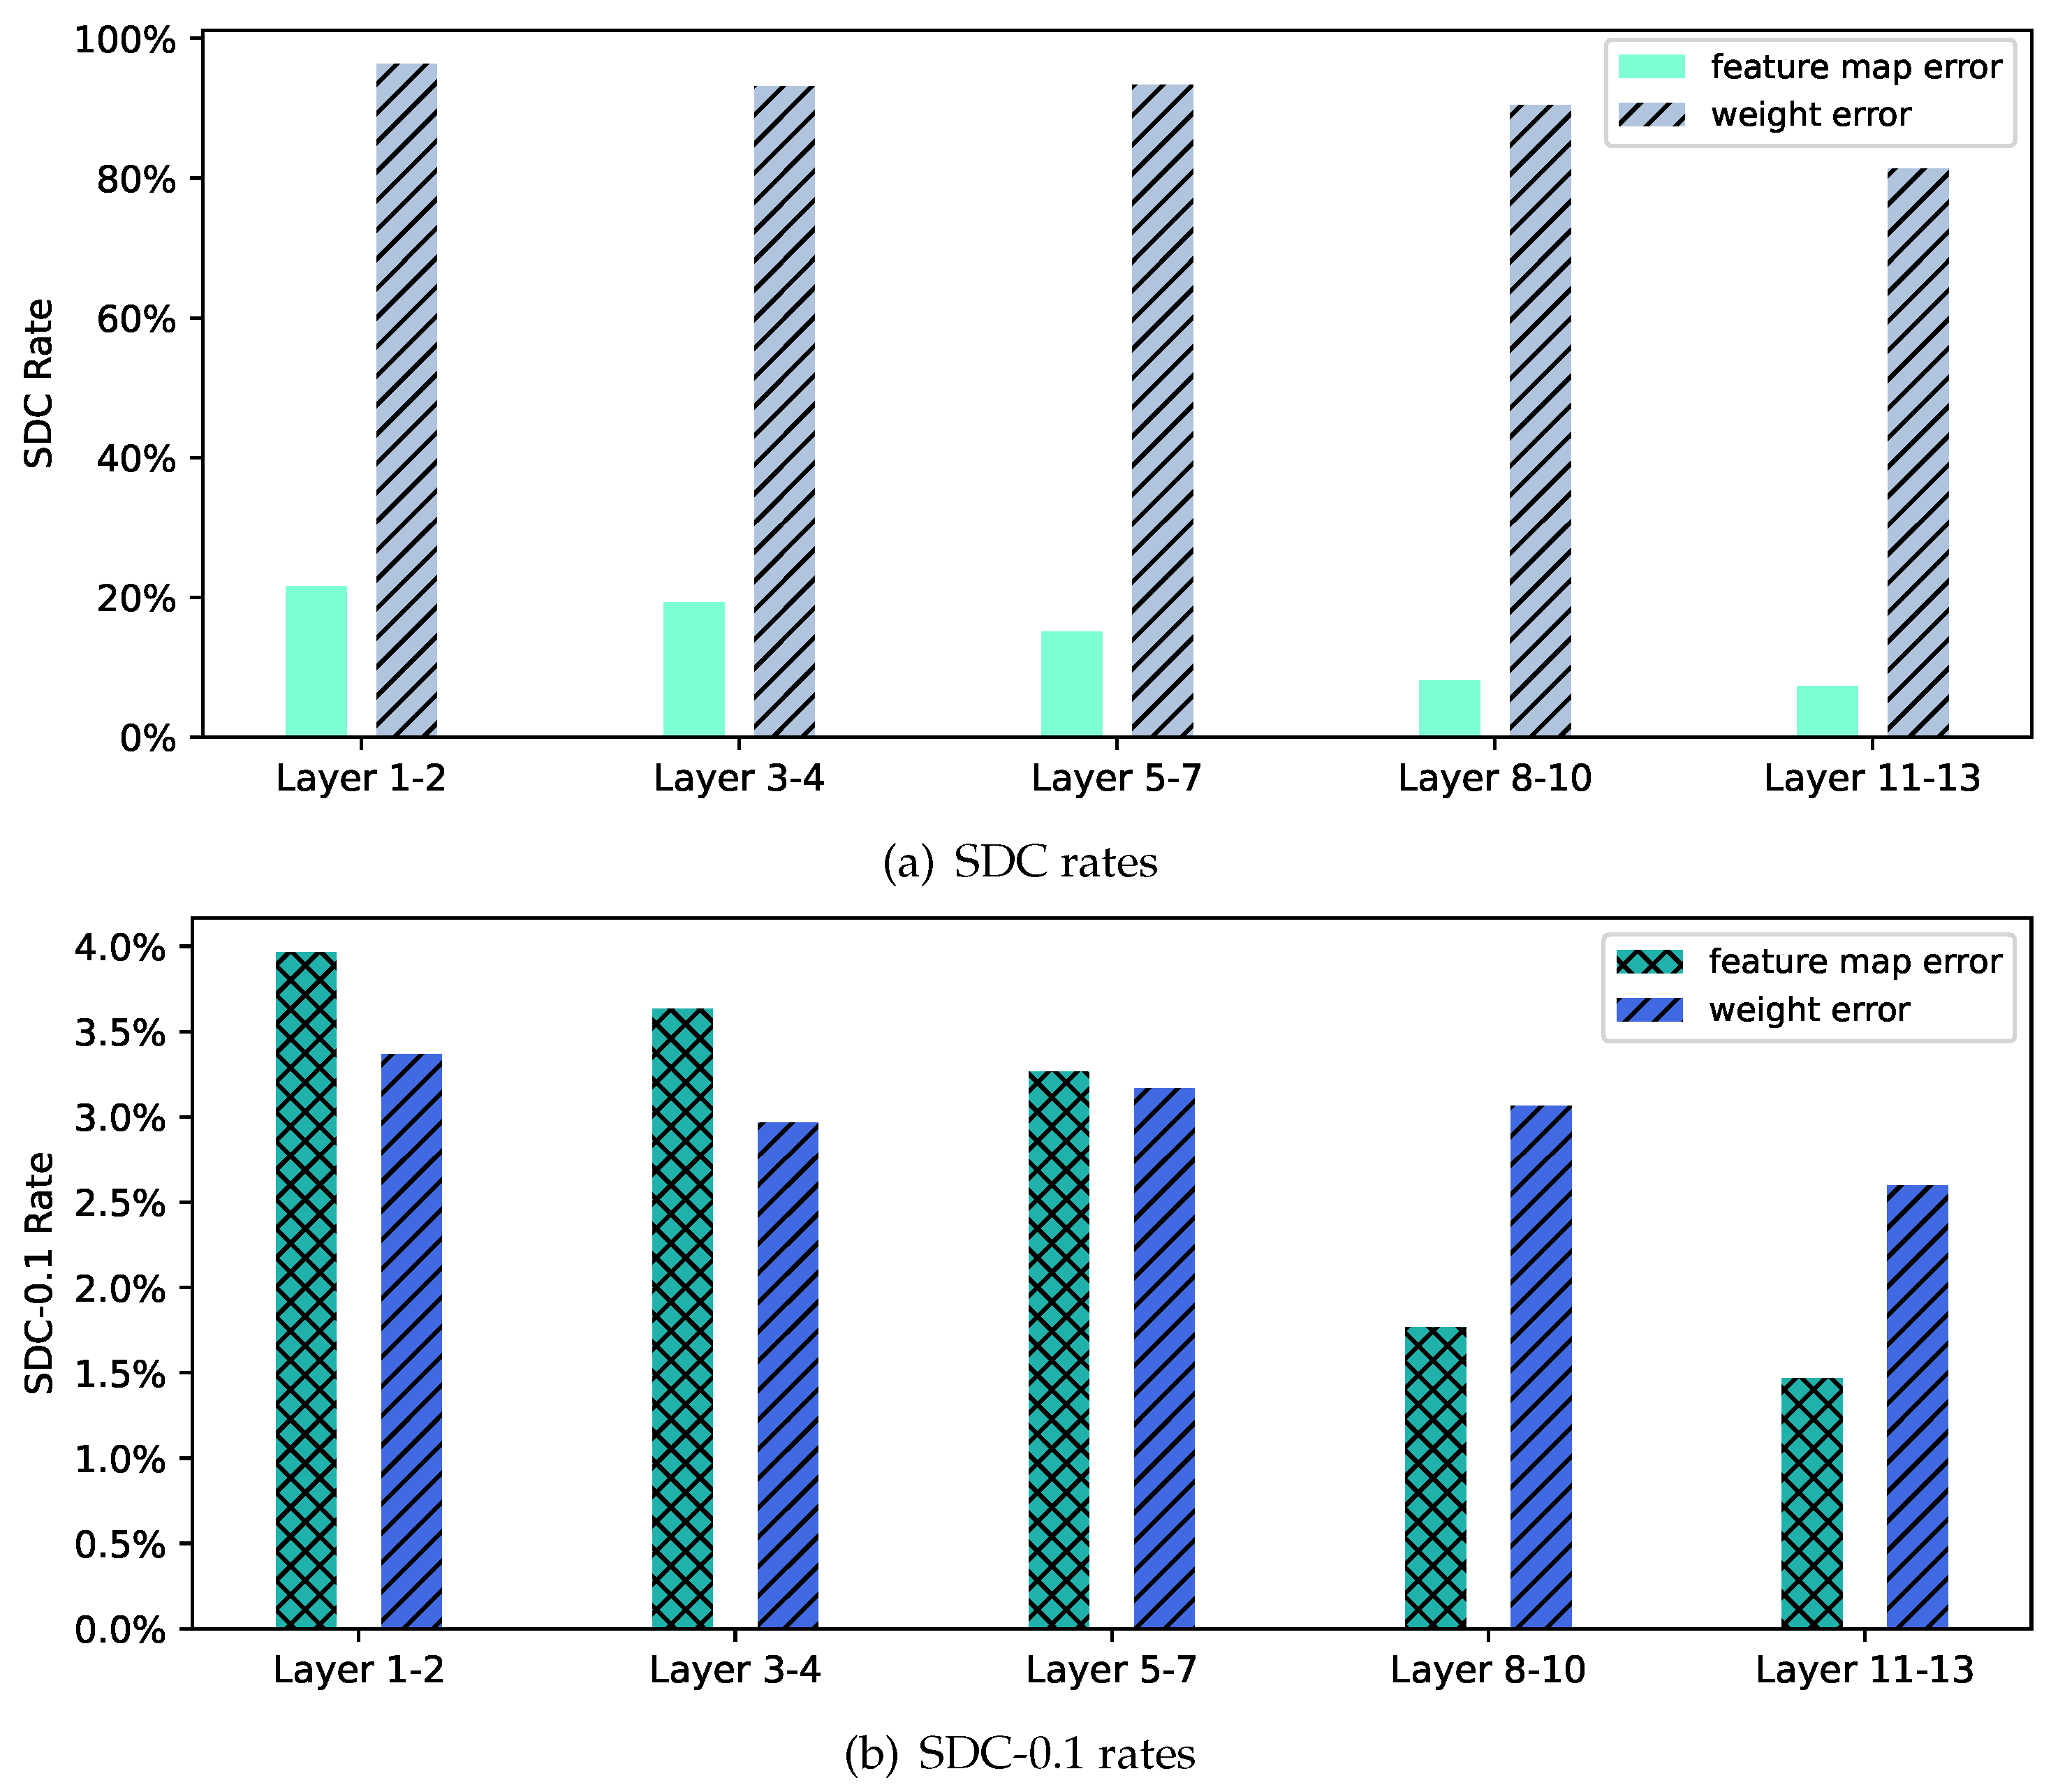
  • Network layers: Network layers could have different fault tolerance capabilities, since the position and characteristic of a network layer may affect the error propagation. We wanted to understand how the SDC probabilities vary among the convolutional layers in the CNN.
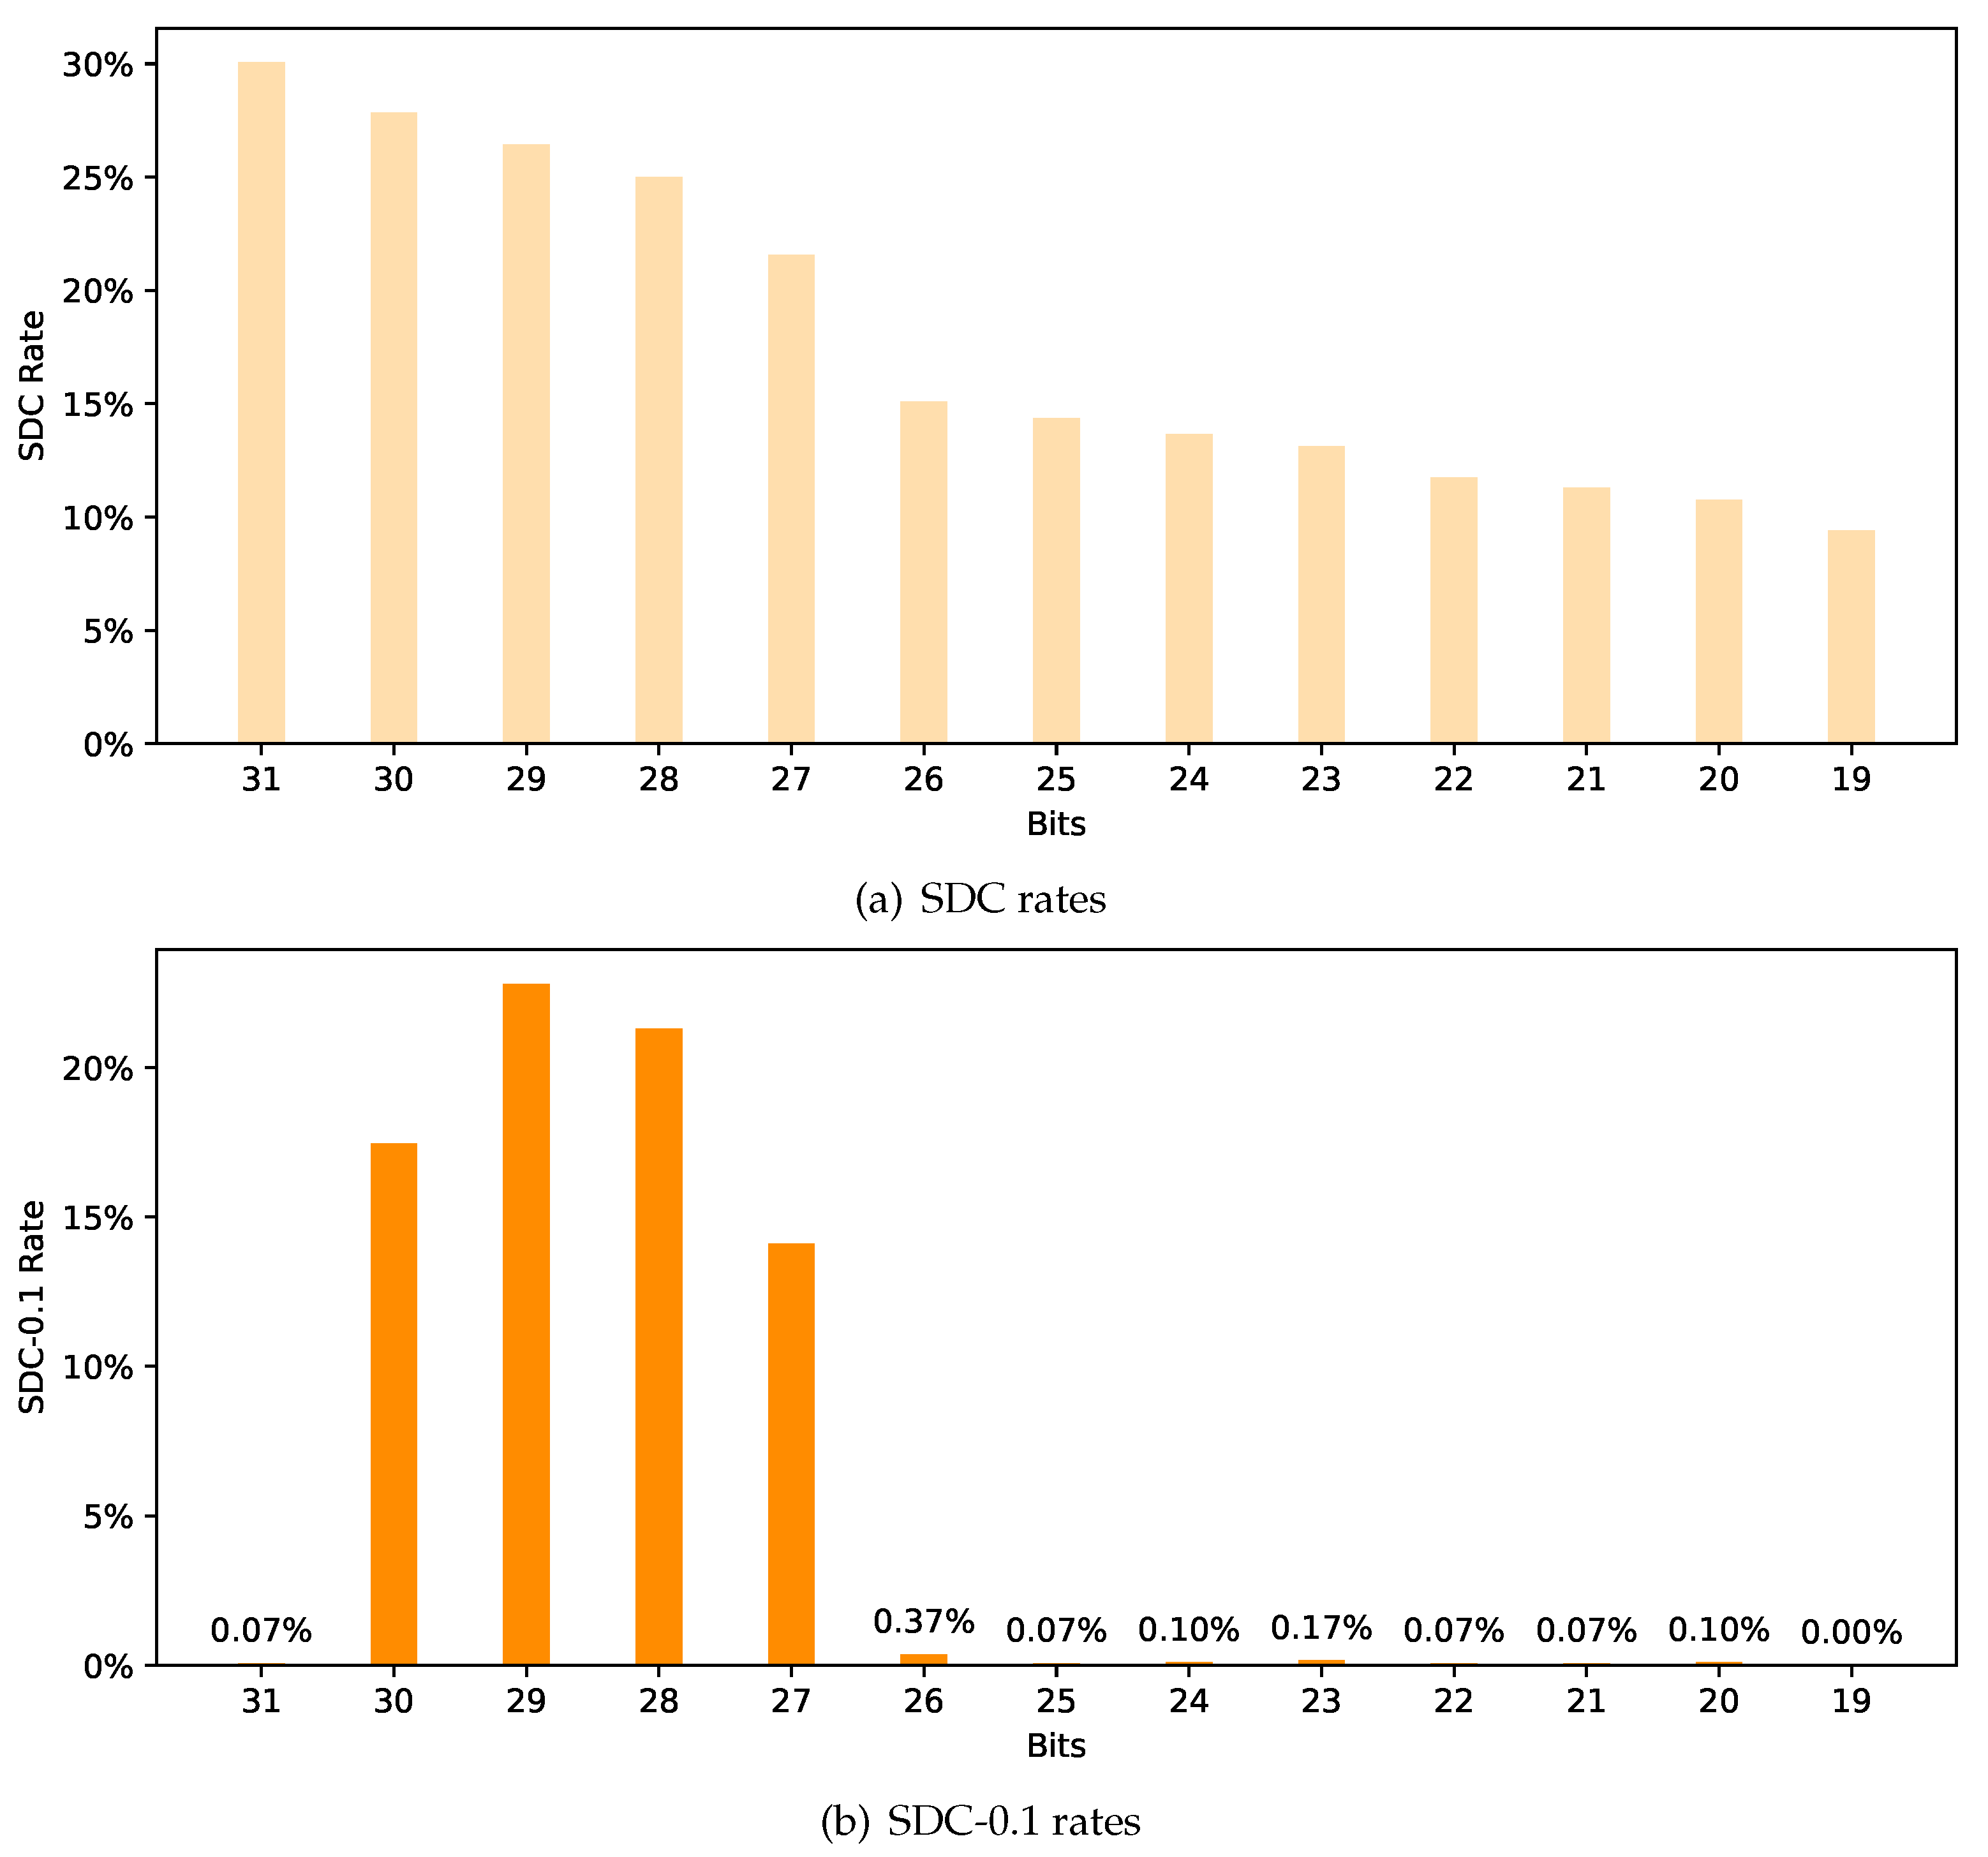
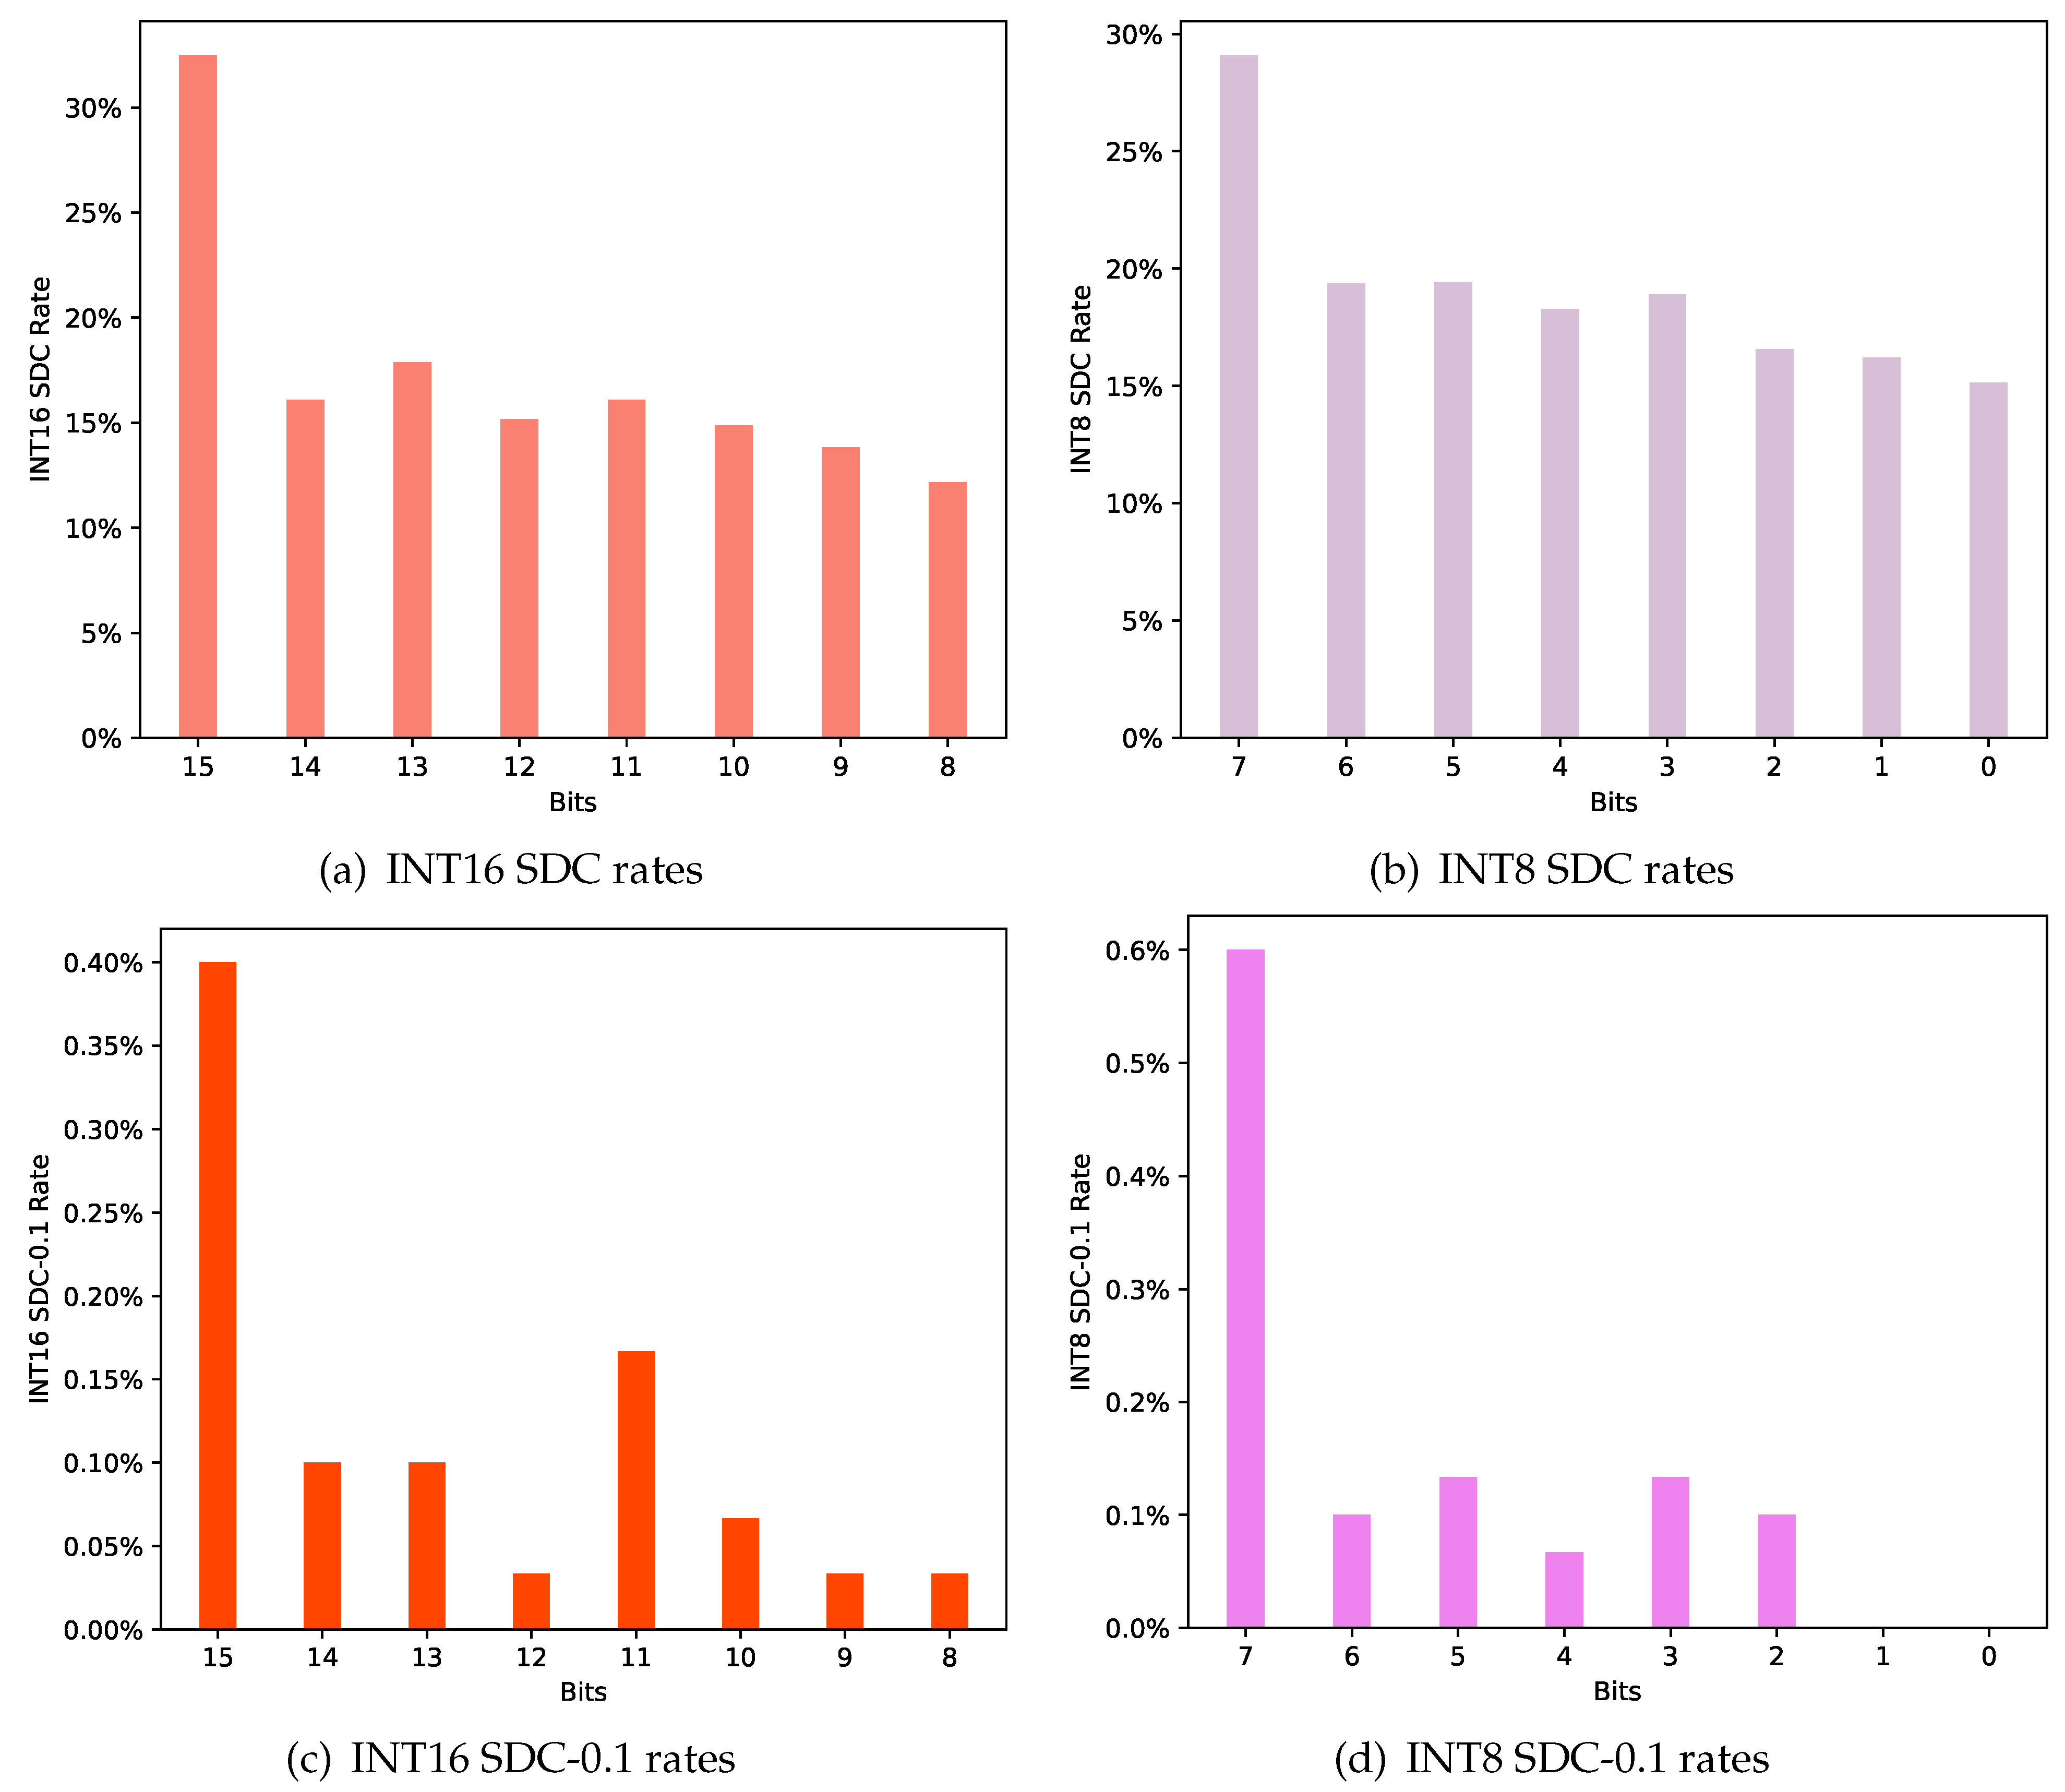
  • Data type and bit position: The sensitivity of each bit position is also different due to the different significances. As CNN models can use multiple data types in their implementations, we examined the SDC rate of each bit position with different data types. We sought to find the critical bits for each data type in terms of fault tolerance.
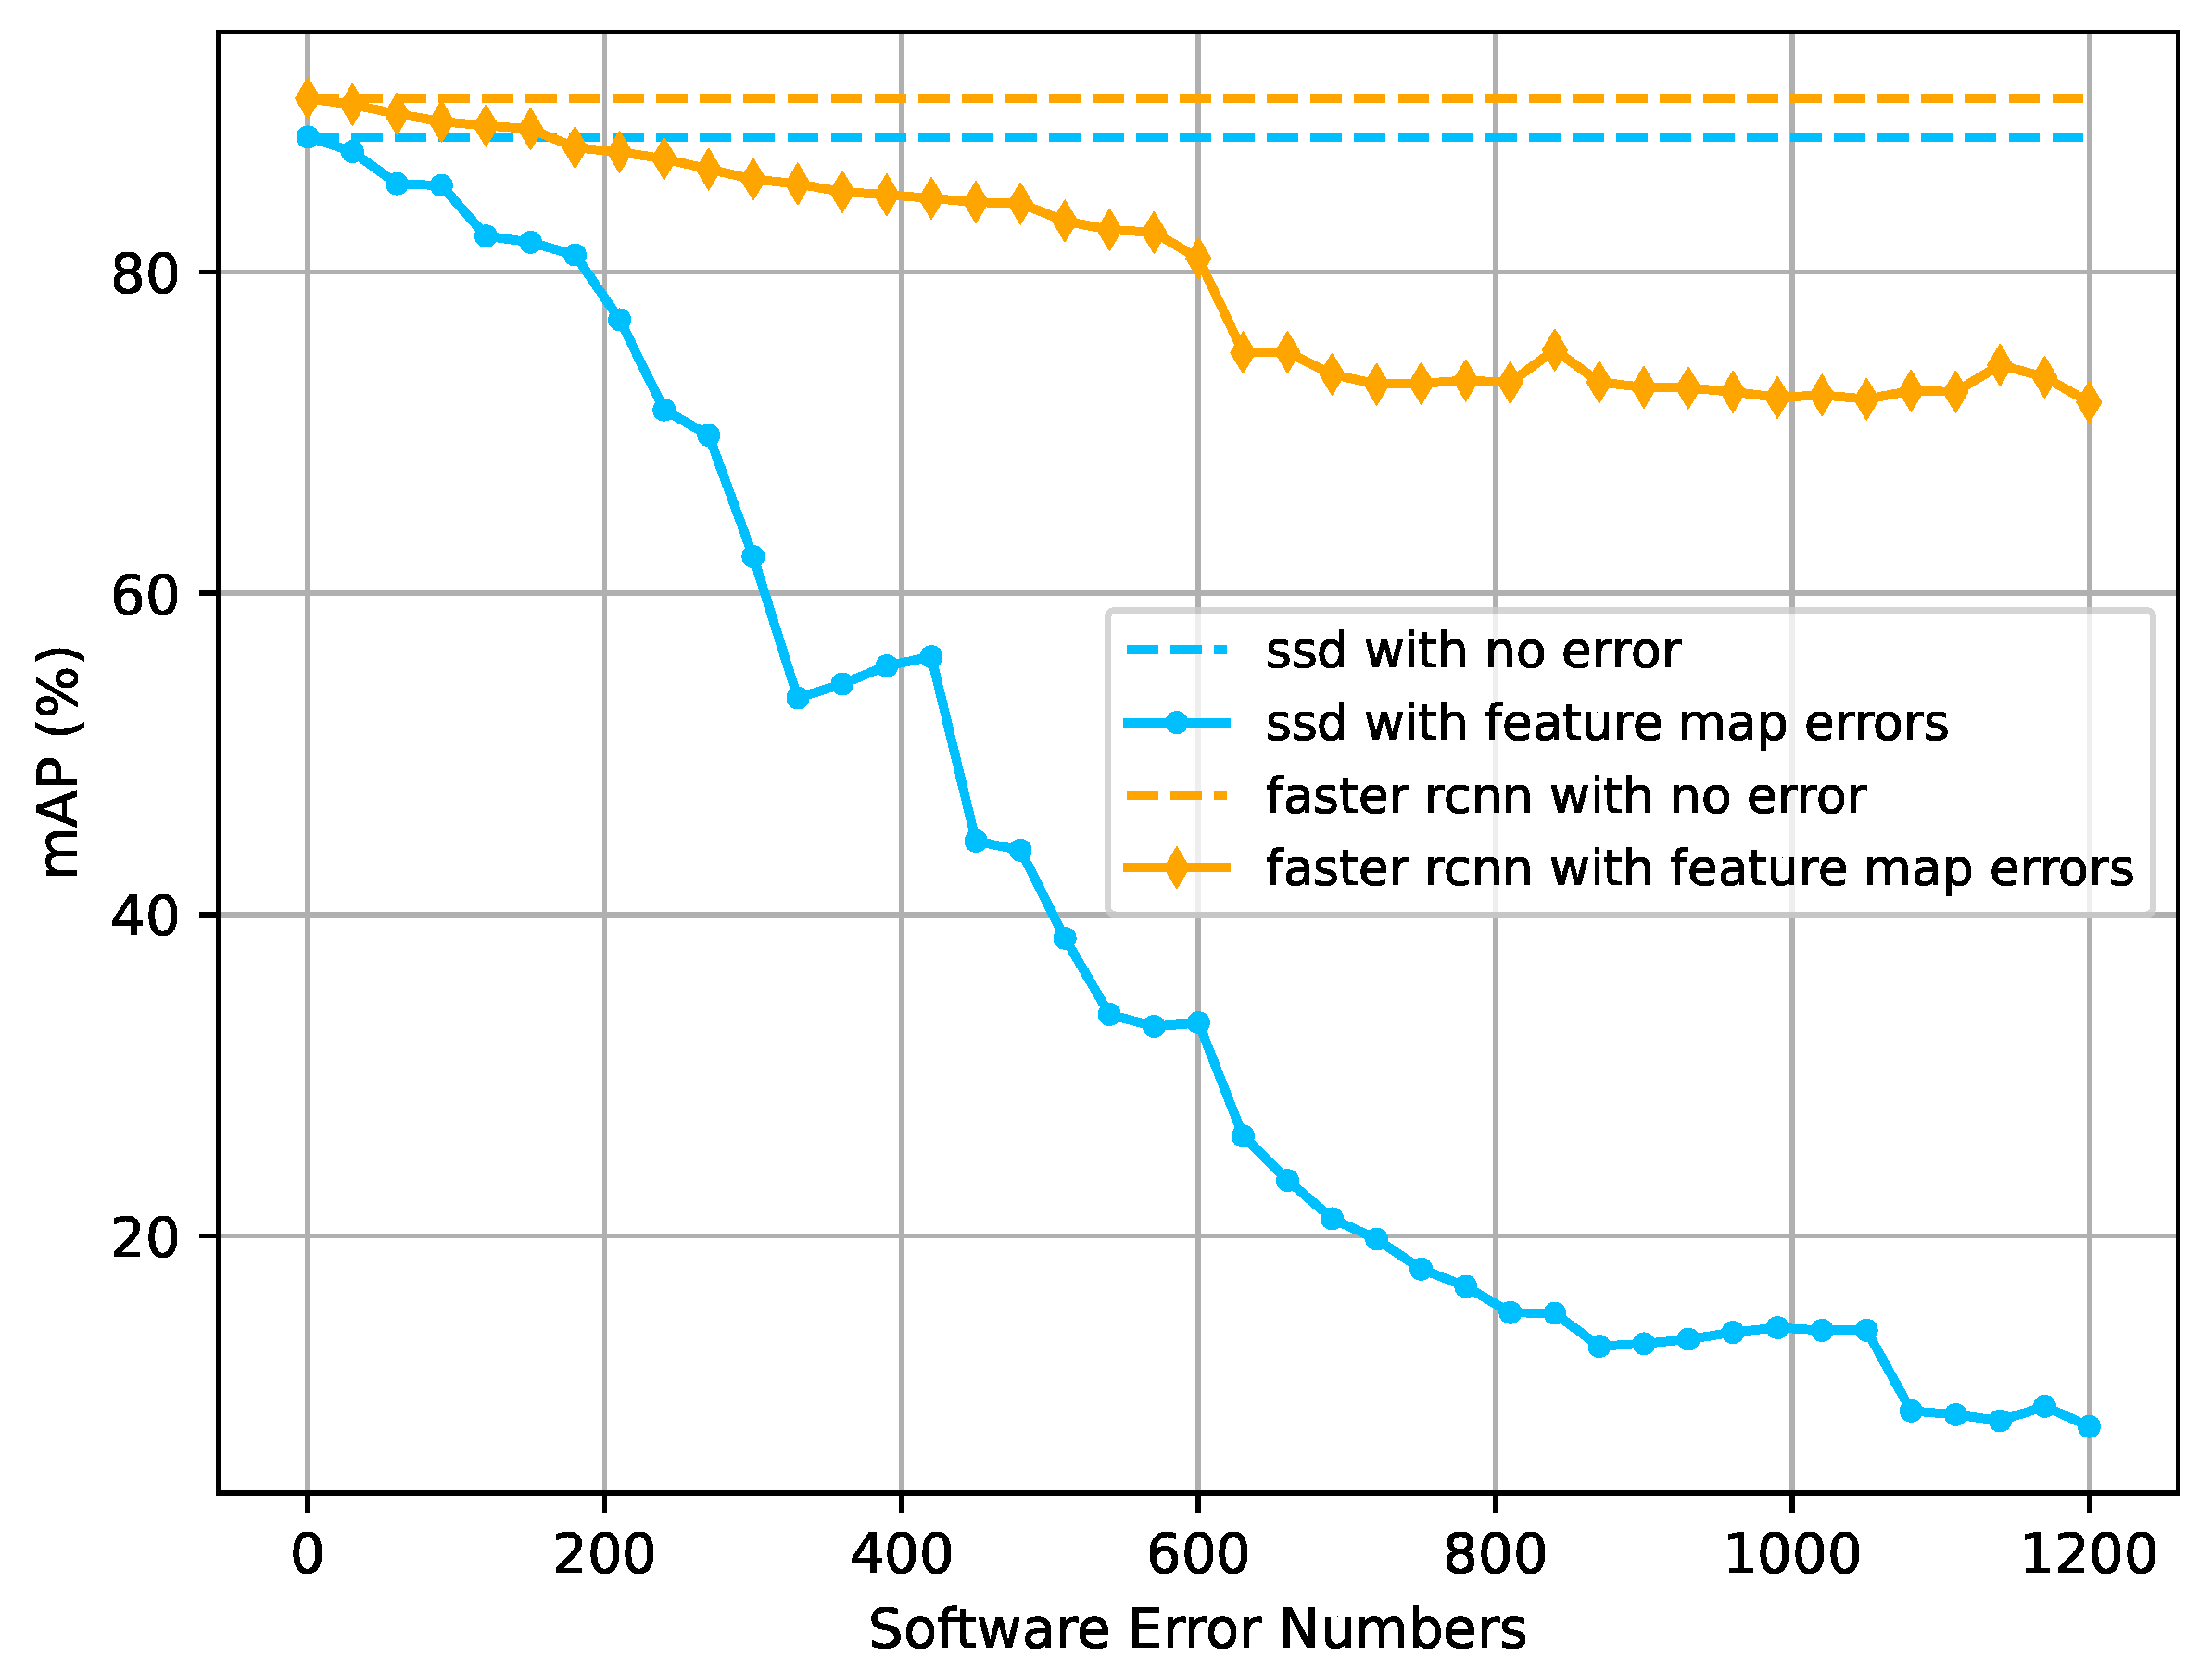
  • Multiple errors: Multiple SEUs can have a devastating impact on object detectors. We evaluated the effect of this extreme case through multiple bit-flip error injections into different detectors. We analyzed their performance losses to understand the vulnerability of both region-proposal-based detectors and regression-based detectors.

3.2. Fault Model

The SEU causes bit-flips in the registers or memories, which is one of most-common transient effects that poses a challenge to space-borne devices [35,36]. Though software errors can be mitigated by techniques such as an error correction code (ECC) or cyclic redundancy check (CRC), these mechanisms do not cover all failure modes such as transient faults in the compute or control logic [37]. In this paper, we considered random bit-flip errors caused by SEUs in a CNN. As the inference result of a CNN depends on the convolution result between the kernel weight and input feature map, we considered errors of two types: weight error and feature map error.

3.3. Experiment Setup

To simulate the EOSs’ on-orbit object detection mission, we first chose some of the most-representative DL-based object detectors and trained these models with the NWPU VHR-10 RSI dataset [38]. We randomly picked 70% of the images from NWPU VHR-10 as the training set and used the remaining 30% as the test set. The detectors were implemented with MMDetection [39], which is an open-source object detection toolbox based on PyTorch.
We conducted fault injection tests using PyTorchFI [40], which is a runtime DNN perturbation tool for the PyTorch platform. Based on PyTorchFI, we developed our customized SEU fault model by performing random bit-flips on the weights or feature maps of the CNN at runtime.
In a typical program, SDC means a failure outcome, which deviates from the golden output, and it is normally used to quantify the fault tolerance of a system. However, for object detection tasks, we observed that many software errors could corrupt the detection results, but with a negligible effect (a very tiny shift of the target bounding box for instance). Taking the Faster R-CNN detector as an example, the fault injection result showed 97.6% the SDCs end up with a small shift of the target bounding box, with the intersection over union (IoU) still being larger than 0.9 compared to the golden output. In this case, the SDC rate would be misleading as it might overestimate the impact of a software error. We extended the concept of SDC and define a new criterial SDC-0.1 to indicate a severe detection result corruption caused by software errors.
SDC-0.1: In a failure result, there exists at least one target bounding box that is inconsistent with the one in the golden result, and the IoU between those two bounding boxes is less than 0.1.

3.4. Detection Framework and Network Structure

We first explored the impact of the detection frameworks and network structures on the fault tolerance. Some of the most-influential DL-based detectors were selected for the fault injection tests, with the most widely used backbone networks. The data type was FLOAT for all detectors. Table 1 lists the detailed information of the selected object detectors.
For each detector, we repeatedly performed 3000 feature map error injection tests and 3000 weight error injection tests and calculated the SDC rate and SDC-0.1 rate, respectively. The layer, the position in the feature map/kernel, and the bit position of each injected error were randomly selected. The result is shown in Figure 3.
The test results showed that the SDC rates varied across different detection frameworks and network architectures. The second observation was that a weight error can cause SDC with a much higher probability compared to the feature map error. The feature map error caused the SDC rates of various detectors to range from 9% to 31%, while the weight errors caused the SDC rates of all detectors were higher than 50%. Though the SDC rates of the detectors seem relatively high, the SDC-0.1 rates were at a low level, normally less than 5%, which indicates serious detection result corruption is still very rare. The exception cases were the SSD detectors: we noticed that the SSD detectors were extremely vulnerable to weight errors, with SDC-0.1 rates higher than 88%.

3.5. Network Layer

The positions of the software errors in a CNN have a huge impact on the overall SDC probability. It is commonly believed that the outputs of some neurons will not contribute much to the final result due to the redundancy of a CNN model itself. As a result, the error sensitivities of the kernels in different network layers may vary significantly. We calculated the SDC rates of different convolutional layers in a CNN to evaluate the error sensitivities of different positions. VGG16 was taken as the experimental network model, as it is one of the most-representative CNNs. We divided the 13 convolutional layers of VGG16 into 5 blocks [28] and report the SDC and SDC-0.1 rates of each block for 3000 repeated fault injections, as we did in previous experiments.
The experimental result is shown in Figure 4. For feature map errors, both the SDC and SDC-0.1 probabilities showed a clear declining trend from the bottom to the top layers. The SDC and SDC-0.1 rates were 22.47% and 3.97%, respectively, for the errors in the bottom layers (Layers 1–2), while for the top layers (Layers 11–13), the corresponding probabilities were 7.3% and 1.47%. This indicates a higher error sensitivity for the bottom layers in the CNN. For the weight errors, this declining trend from the bottom to the top still held, but it was not that significant.

3.6. The Data Type and Bit Position

The data type could have a significant impact on the model’s fault tolerance [8]. The study in [41] showed that quantization could be an effective method to increase the fault tolerance of a model. In this section, we evaluate the feature map error tolerance of the SSD detectors implemented with three different data types: FLOAT, INT16, and INT8.
It is obvious that the significance of each bit position varies based on the data type, so the errors in different bit positions would naturally have various SDC rates. We evaluated the SDC and SDC-0.1 rates of different bit positions for the FLOAT, INT16, and INT8 models, respectively. Figure 5 shows the experimental result of the SSD-VGG16 FLOAT model. Based on the definition of the FLOAT data type, we analyzed the feature map errors in the sign bit (31), exponent bits (30–23), and high data bits of significand precision (22–19). The first observation was that there was a declining trend of the SDC rates with the data bits from high to low. For SDC-0.1, we observed that the high data bits of the exponent bits, namely bits 30–27, were extremely vulnerable compared to the other data bits. The probabilities of the SDC-0.1 rates could be as high as 22.8% for those vulnerable bits. Errors in the sign bits or significand precision were negligible with an SDC-0.1 rate less than 0.1%.
The experimental results of the fault injections into the INT16 and INT8 models are shown in Figure 6. We analyzed the high 8 data bits in the INT16 model and all bits in the INT8 model. The results showed better fault tolerance for the quantized models, with the SDC-0.1 rates of all bits being less than 0.7%. This is in line with the conclusion in [8]. The MSBs of both the INT16 and INT8 models reported relatively high SDC-0.1 rates around 0.6%; for all the other bits, the SDC-0.1 rates were lower than 0.2%.

3.7. Multiple Errors

We also evaluated the impact of multiple errors on the detectors by multiple bit-flip injections. Though multiple SEUs seem unlikely as the inference time of a detector is very short, still, we wanted to push the detectors to their limits and check their fault tolerance under extreme conditions. We gradually increased the number of injected feature map errors and compared the performance losses of the SSD and Faster R-CNN detectors on the NWPU VHR-10 test set. Both detectors used VGG16 as the backbone network.
Figure 7 shows the performance losses caused by multiple errors. The SSD detector suffered huge performance losses when confronted with multiple errors. With 1200 feature map errors injected, the resulting mAP of SSD drastically dropped from 87.5 to 9.1. The Faster R-CNN maintained an acceptable detection accuracy when confronted with multiple errors, with the result mAP dropping from 90.4 to 71.9. This may indicate the robustness of region-proposal-based two-step detectors. The experimental result showed that multiple software errors were fatal for some detectors, and this would cause a complete failure under extreme conditions.

4. Methodology

4.1. Problem Description
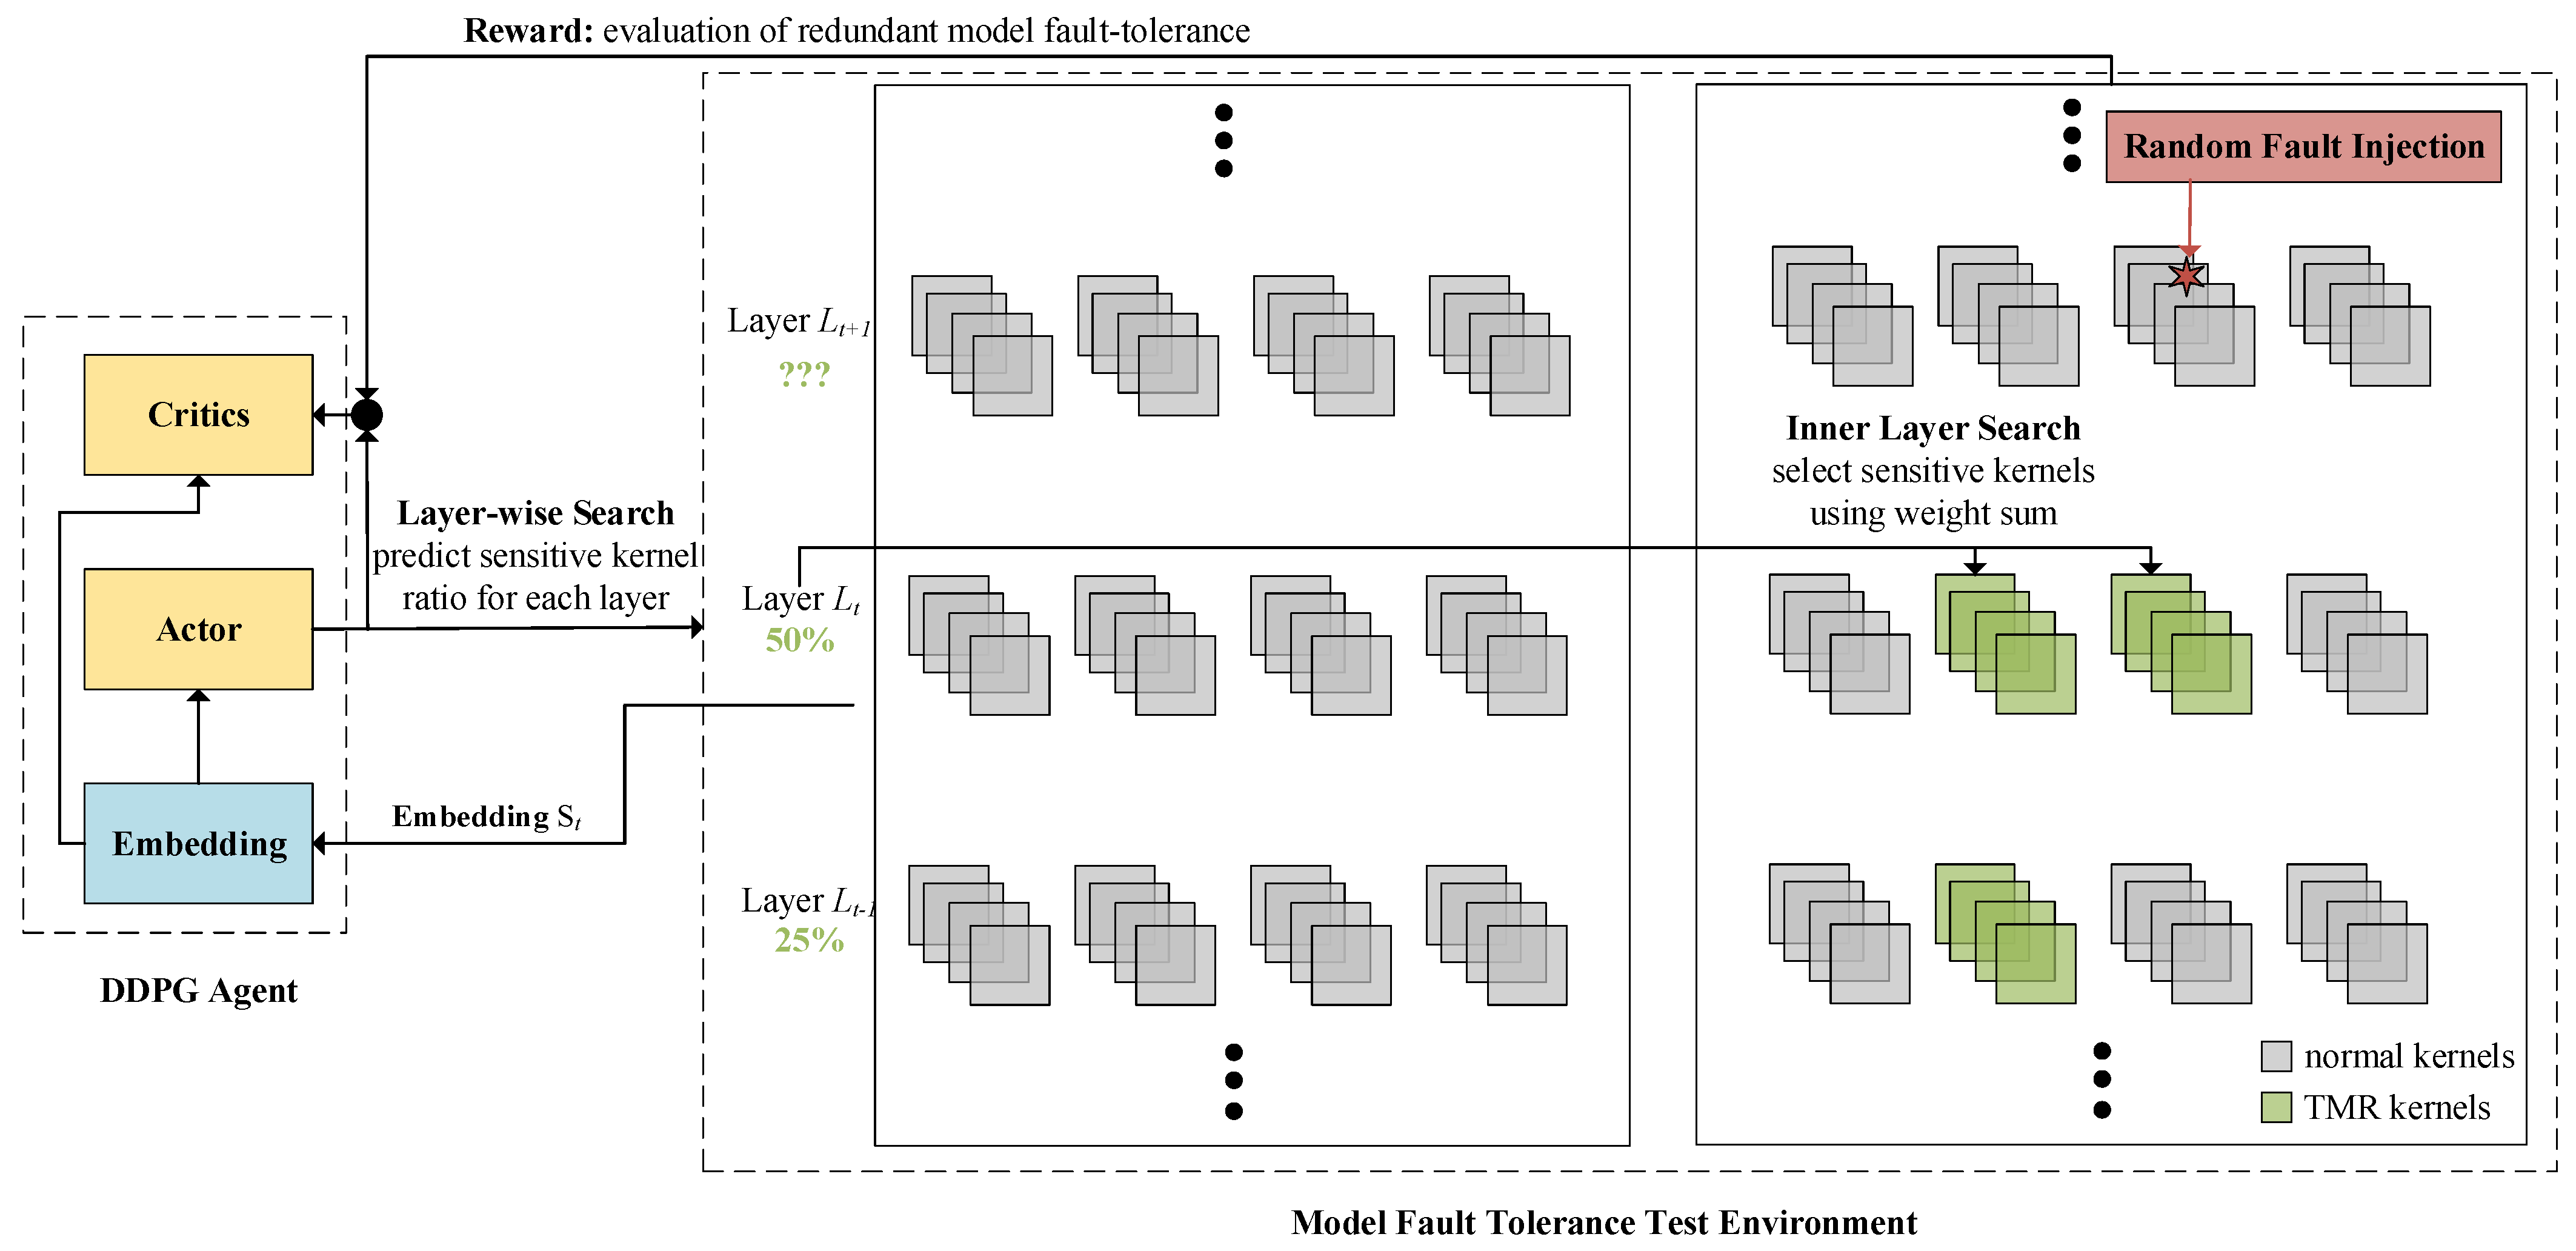
According to the fault injection experimental results in Section 3, the algorithm frameworks, the architectures of the CNNs, and the positions of the software errors all played import roles in the SDC probability. This indicates the different distributions of the error-sensitive kernels among various detection frameworks and CNNs. The major challenge for the model selective hardening is to propose a general searching method for error-sensitive kernels in detectors with various frameworks and network architectures. This problem can be further described as follows: given a detector with the backbone CNN M 0 and fault tolerance test environment E t and given the target redundancy ratio α , our goal was to search for a set of kernels K in model M 0 and perform the TMR backup for each kernel k K , such that the fault tolerance performance of redundant model M h is optimized in the test environment, and the selected set K meets constraint k K F L O P s k α · W a l l , where W a l l is the FLOPs of the original model.

4.2. AMHR Framework

A typical CNN consists of numerous convolutional kernels, and the search space for error-sensitive kernels is quite large. Searching for sensitive kernels through repeated fault injection tests would be quite time consuming, which is infeasible for large-scale CNN models. According to the fault injection experimental results, the SDC rates varied from the bottom to the top layers in the network. This observation inspired us to first explore the distribution of sensitive kernels among layers to increase the searching efficiency. The problem now is how to estimate the distribution among the layers. We propose AMHR and utilized a DDPG agent to solve this problem, the framework of which is shown in Figure 8. For each layer, the agent first performs a layerwise search to predict the ratio of sensitive kernels in the current layer, then the inner layer search is performed using the weight-sum method [12] to pinpoint the exact positions of the sensitive kernels. After all the layers are traversed, we made the TMR for all the selected kernels and sent the model to the test environment. The result of the fault tolerance test was taken as the reward, which motivated the agent to update the policy and further perform the TMR backup for the most-important kernels to optimize the fault tolerance of the model. The main advantages of our AMHR framework are two-fold. First, instead of directly searching for sensitive kernels, AMHR first tries to find the distribution of the sensitive kernels layerwise. This two-stage searching pattern extremely compresses the search space. Second, a DDPG agent is utilized to predict the ratio of sensitive kernels in each layer through trial and error, which further increases the searching efficiency.
Reinforcement learning is fundamental in the AMHR framework. Reinforcement learning is a branch of machine learning. The algorithm learns the action policies by interacting with the environment to maximize the obtained reward. A common model for reinforcement learning is the standard Markov decision process, which can be represented using the following quintuple: S , A , P a , R a , γ . Here, S is the state space, which represents the feedback from the environment that the agent can perceive. A is the action space, and it is a finite set of actions that the agent can perform. P a represents a state transition probability matrix. R a is the reward function, which defines the goal for the agent to learn. γ 0 , 1 represents the discount factor of the reward function.
The essence of AMHR is applying the reinforcement learning framework to solve the error-sensitive kernel search problem. The detailed information of each component in reinforcement learning is explained in the following sections.

4.3. State Space

For each network layer L t , we define the following state space s t , referring to [42]:
t , n , c , h , w , s t r i d e , k , W t , W u s e d , W r e s t , a t 1
where t is the index of the current layer and n × c × k × k is the dimensions of the convolutional kernels. The dimensions of the input feature maps are n × h × w . W t represents the FLOPs of layer L t . W u s e d represents the total FLOPs of the kernels selected in the previous layers. W r e s t represents the rest of the FLOPs allowed in the following layers, according to the total computation budget. a t 1 is the action taken for layer L t 1 . Before being passed to the agent, they are scaled within [0, 1].

4.4. Action Space

The action of the agent is to predict the ratio of sensitive kernels to perform the TMR backup in each layer. We define a continuous action space a t [ 0 , 1 to enable fine-grained adjustment of redundant kernels. To ensure the action sequence meets the constraint of the target redundancy ratio α , we further limited the action in each step. We define a minimum redundancy ratio a m i n for each layer. When we expect the action sequence would still exceed the computation budget even with the minimum ratio a m i n applied for all the rest layers, the action a t for the current layer will be clipped. This strategy can be described using the following equations:
W a l l o w α · W a l l a m i n · W f o l l o w W u s e d a t m a x a t , a m i n a t m i n a t , W a l l o w / W t
Here, W a l l o w represents the allowed FLOPs for the current layer and W f o l l o w is the total FLOPs for all the remaining layers.

4.5. Reward Function

The reward function should accurately reflect the fault tolerance of a model. Based on the space-environment-induced fault model, we propose two evaluation methods for the models’ fault tolerance.
SDC fault tolerance: We repeatedly performed T-times random bit-flip error injection tests and used the SDC-0.1 probability to measure the SEU-induced fault tolerance of a model. We also set the injected errors in exponent bits to check the fault tolerance of a model in the worst cases. To motivate the agent to minimize the SDC-0.1 rate, we define the following reward function R s d c :
R s d c = 1 × S D C 0.1 r a t e
Multiple error fault tolerance: We injected M random bit-flip errors into the model. The performance of the detector was then evaluated in the test set. We tested the detector with K different sets of errors to calculate the average value mAP a v e r a g e and minimum value mAP m i n . We define the following reward function R m e r r to comprehensively consider both the average and worst performances.
R m e r r = θ · mAP a v e r a g e + 1 θ · mAP m i n , 0 θ 1

4.6. Training of a DDPG Agent

DDPG is an actor–critic, model-free algorithm based on a deterministic policy gradient, which can operate over a continuous action [11]. In AMHR, we adopted multilayer perceptron (MLP) as the actor network and critic network.
The search for the error-sensitive kernels was achieved through the training procedure of a DDPG agent, and the action sequence obtaining the best reward is taken as the final output to harden the model. The training procedure of DDPG is fully explained in the pseudo code in Algorithm 1. First, the actor network μ s | θ μ and critic network Q s , a | θ Q are initialized, together with their corresponding target networks. We initialized the replay buffer R as well. The agent receives embedding s t from layer L t and outputs action a t . As DDPG takes a deterministic policy, the output action cannot fully explore the environment, and random noise is therefore needed to enhance the exploration capability of the agent. We utilized the truncated normal distribution μ s t T N μ s t | θ t μ , σ 2 , 0 , 1 as the output action with random noise.
The agent then moves to the next layer L t + 1 , receives the state from the environment, and outputs action a t + 1 . This procedure repeats until all layers in the model have been traversed. We executed the model hardening based on the action sequence in this epoch and evaluated its fault tolerance performance to obtain reward r f . Following the Block-QNN [43], the transitions s t , a t , r f , s t + 1 obtained in this epoch are stored in the replay buffer R. A minibatch of N transitions is sampled to update the policy of the agent.
In the policy update stage, the target critic network Q is used to calculate y i , then the critic network updates its parameters by minimizing the mean-squared error (MSE) loss between y i and Q. During the update, the baseline reward b is subtracted to reduce the variance of the gradient estimation, which is an exponential moving average of the previous rewards [44]. The actor is updated by applying the chain rule to the expected return from the start distribution J with respect to the actor parameters. Finally, the target networks are updated by having them slowly track the trained networks.
Algorithm 1: DDPG training procedure.
  Aerospace 10 00088 i001

5. Experimental Results

5.1. Experiment Setup

We applied AMHR for the model hardening of several pre-trained detectors. Then, the effectiveness of AMHR was evaluated by testing the fault tolerance of the hardened models. The key hyperparameters of the model hardening process were set as follows: The total number of training epochs for the DDPG agent was set to 800, with the first 100 epochs using random strategies to fill in the replay buffer. The learning rate of critic network l r c was set to 0.001, and for the actor network, the learning rate l r a was 0.0001. For the random noise, the initial value of σ was set to 0.5, and after each epoch, σ would decay exponentially with a rate of 0.99. The size of minibatch N was set to 64. We set the discount factor of reward function γ to 1 to avoid over-prioritizing short-term rewards [45]. For the target networks’ updating, τ was set to 0.01.
Based on the hardware resources of spaceborne devices, we can set the target redundancy ratio α to a proper level to obtain the hardened model that meets the computational constraints. For each layer, we set the minimum redundancy ratio a m i n to 1%, and the maximum redundancy ratio a m a x was set to 95%.
To demonstrate the effectiveness of our AMHR method, we compared the fault tolerance performance of the AMHR-hardened models to the models hardened with the following selective hardening methods:
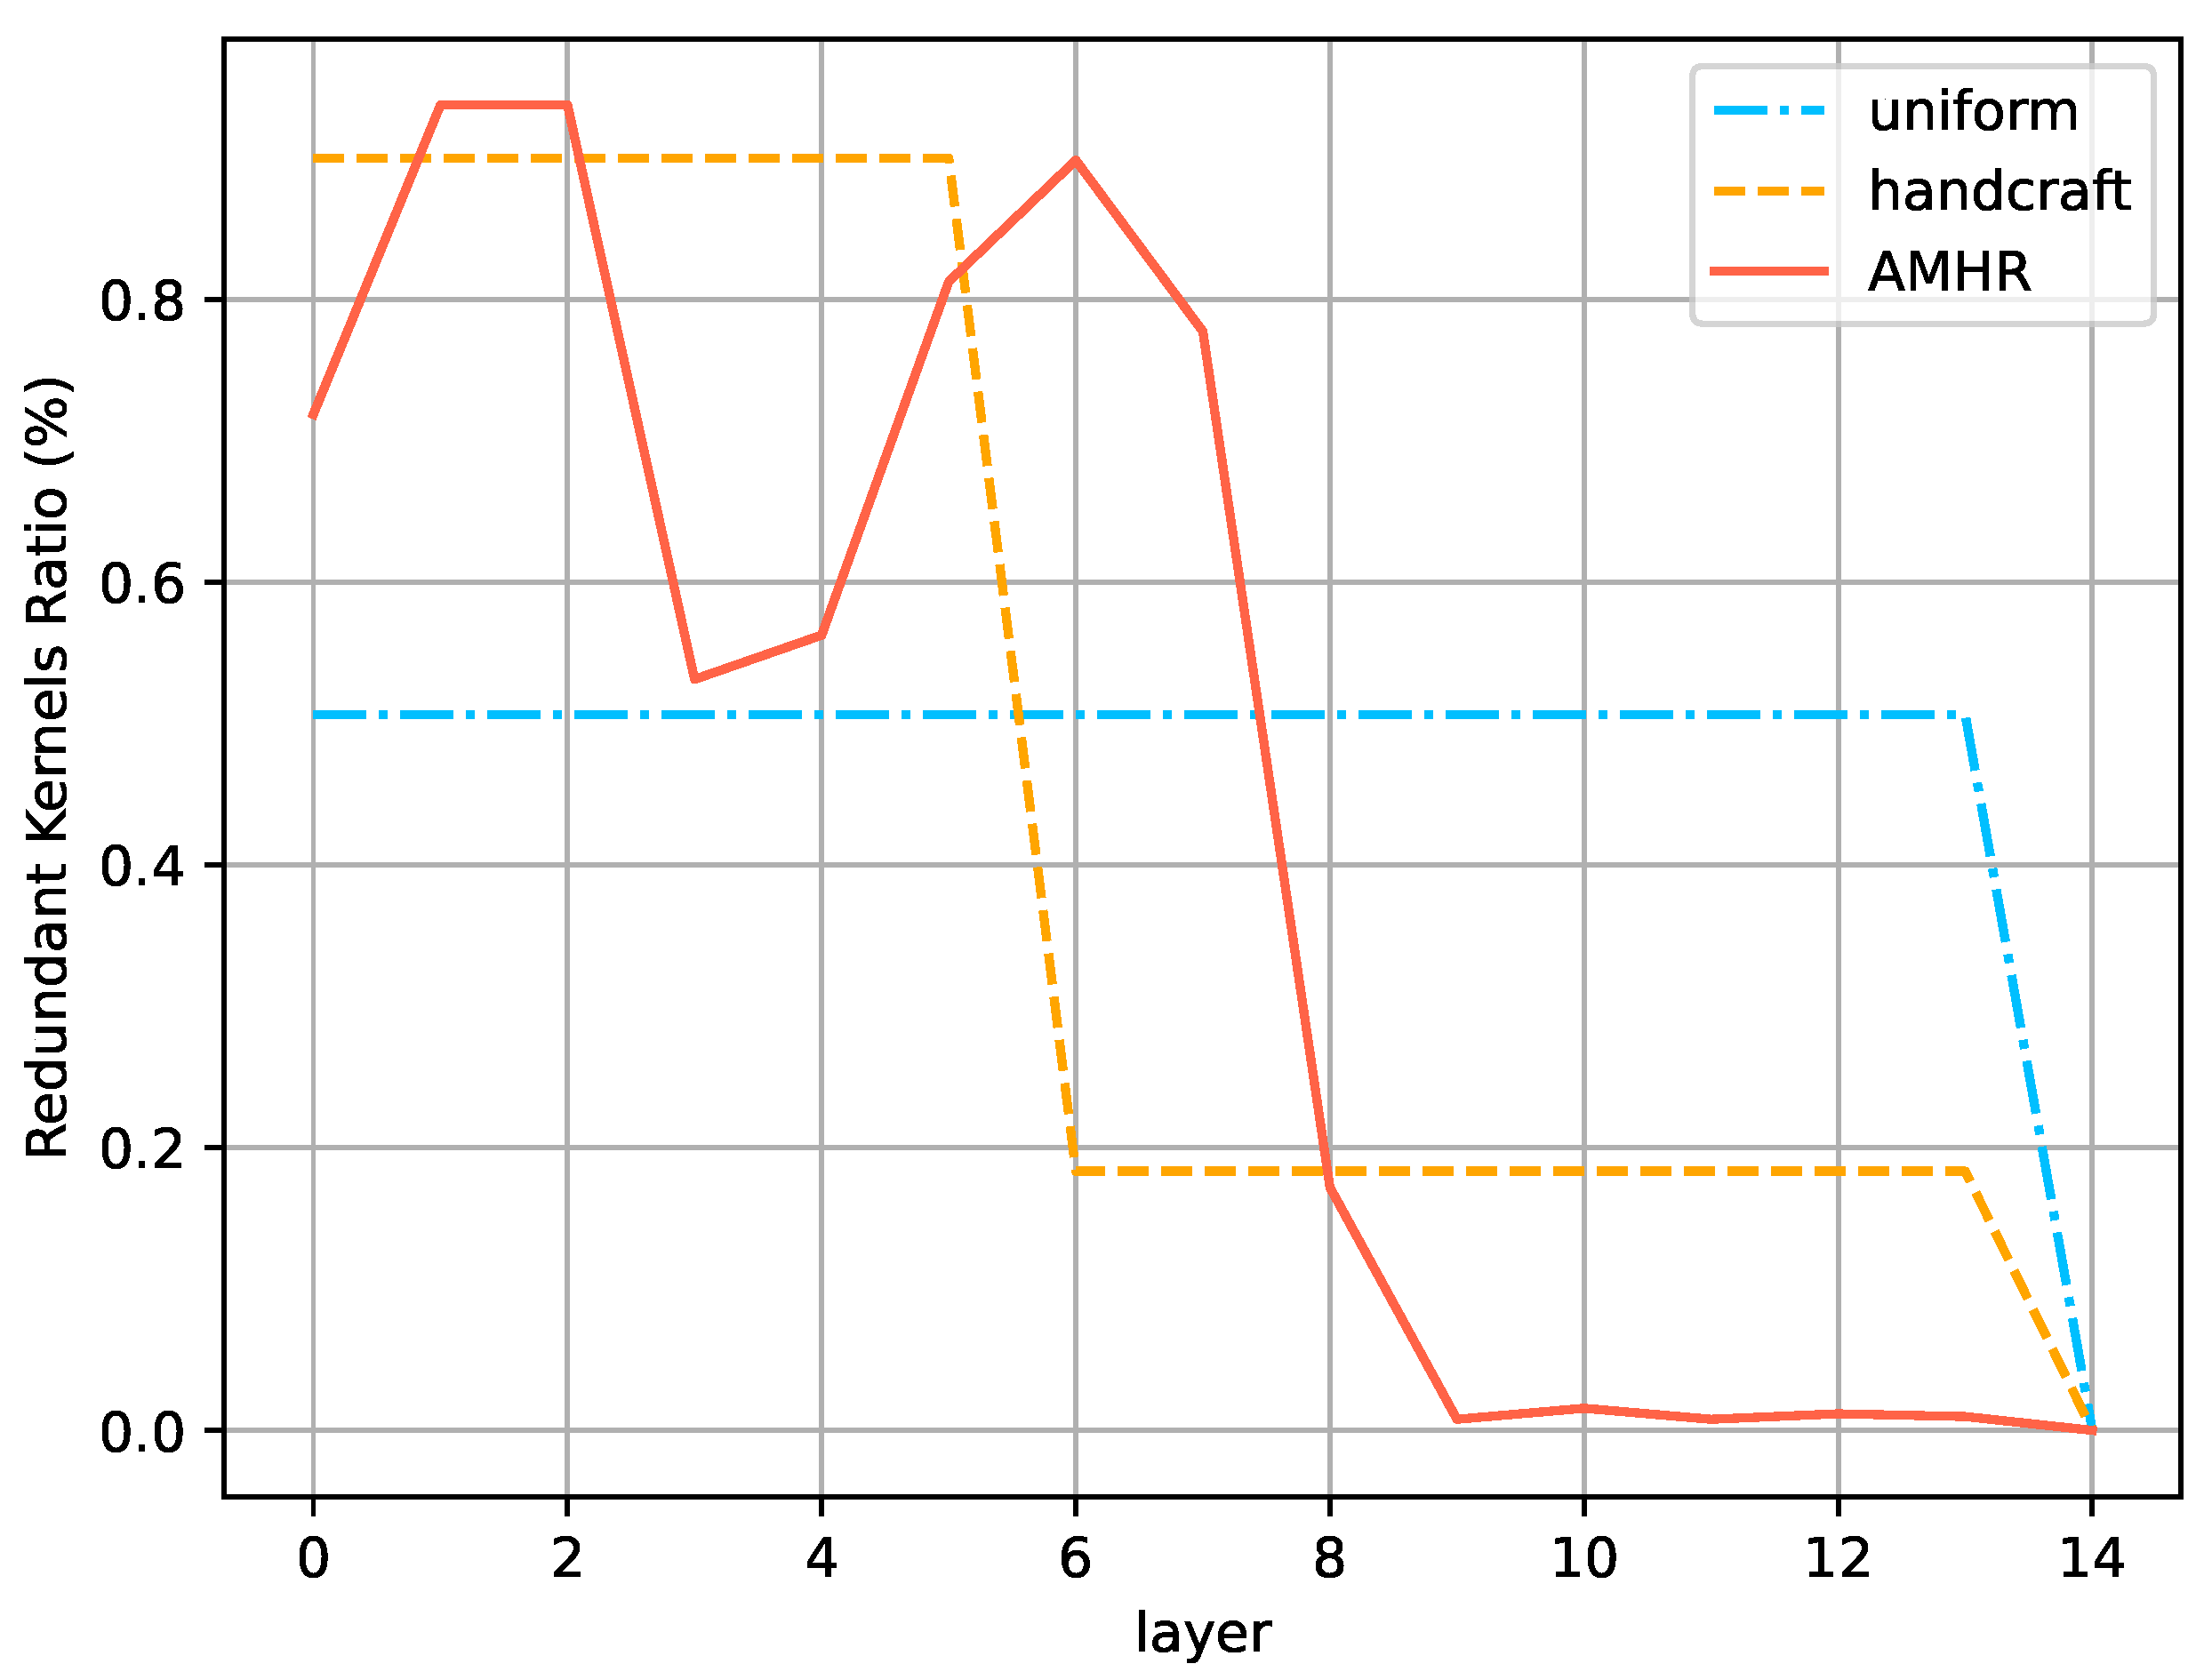
  • uniform: Assume error-sensitive kernels are uniformly distributed among layers, and use the weight-sum method to select kernels made redundant in each layer. This uniform assumption is in line with the weight-sum ranking method in [34];
  • handcrafted: We manually set the redundancy ratio of each layer based on our knowledge of the network model. For instance, based on the experimental results in Section 3.5, we argue that the bottom few layers in a VGG16 network would have higher importance, and we set higher ratios for those layers accordingly.
Take the model hardening of a VGG16 network in the SSD detector as an example. Figure 9 shows the redundant kernels ratio of each layer in models hardened with uniform, handcrafted, and AMHR. The target redundancy ratio α was set to 0.5. We noticed that the policy given by AMHR made a fine-grained adjustment of the redundant kernels ratio in each layer and resembled the bottleneck of the VGG16 network.

5.2. Single Bit-Flip Error Tolerance Analysis

We first examined the fault tolerance of detectors’ hardening with different methods. Repeated feature map error injection tests were performed to evaluate the single bit-flip error tolerance of the hardened models. To meet the requirements of diverse application scenarios, we considered slightly hardened models and deeply hardened models, with target redundancy ratios α set to 0.2 and 0.5, respectively. For AMHR, we used R s d c as the reward function, and we practically set error injection test repeat time T to 500 to obtain a statistically meaningful result. The SDC and SDC-0.1 rates of the original model and the hardened models are shown in Figure 10.
In this experiment, we set the data flipping in the exponent bits to evaluate the fault tolerance of a model in the worst case, so the SDC-0.1 rate was relatively high at this time. The resulted showed that our AMHR method could significantly mitigate the impact of a flip-bit error. Taking SSD-VGG19 as an example, the original model reported an SDC-0.1 rate of 14.97%, while the model hardening using AMHR achieved SDC-0.1 rates of 8.47% for the slightly hardened model and 4.43% for the deeply hardened model, which is over a 3.3× reduction compared to the original model. Furthermore, the experimental results showed that AMHR achieved a lower SDC-0.1 rate compared to the uniform and handcrafted hardening methods for the VGG16 and VGG19 networks, in both the slightly hardened and deeply hardened settings. This shows the effectiveness of AMHR for various CNN networks.
To further illustrate the effectiveness of AMHR, we made an in-depth study of bit-flip errors masked by the TMR backup in each hardened model. Table 2 shows the detailed information of the masked errors in the hardened VGG16 models.
From the data, we noticed AMHR had the highest masked SDC-0.1 ratio in both the slightly hardened model and the deeply hardened model. This indicates models hardened by AMHR protect more error-sensitive kernels compared to the others. AMHR fully explores the distribution of sensitive kernels among layers through the DDPG learning process and makes the TMR backup for sensitive kernels as good as possible to optimize the fault tolerance of the hardened models.

5.3. Multiple-Error Tolerance Analysis

We also evaluated the multiple-error tolerance of the AMHR-hardened models. The SSD and Faster R-CNN detectors were selected to perform this test, both taking the hardened VGG16 as the backbone network. The target redundancy ratio α was set to 0.5 for all hardening methods. For AMHR, we injected 2000 random bit-flip errors into the model and test detector with 5 different sets of errors in each training epoch. We used R m b u as the reward function, and θ was set to 0.8. We gradually increased the number of feature map errors and observed the detection accuracy loss of each model. For Faster R-CNN, we set all software errors in the exponent bits. The tests were run multiple times for each model, and the results are shown in Figure 11. Each curve in the figure represents the average of the mAPs from multiple tests, with the corresponding shadow showing the variation of the mAPs.
From the results, we noticed that AMHR can greatly improve the fault tolerance for multiple-error cases. For the SSD detector with 950 software errors, the average mAP of the original model was only 11.1, while the average mAP of the AMHR-hardened model was 64.5, which was tremendously increased by 53.4. Furthermore, it is easy to see that models hardened by AMHR showed superiority over other selective hardening methods in terms of performance with multiple errors. The AMHR-hardened model showed an over 28.8 mAP increase compared to the uniformly hardened model, and it improved the detection performance by a large margin.
For the Faster R-CNN with 500 exponent bit-flip errors, the results were quite similar. The average mAP of the original model was 48.9, and for the AMHR-hardened model, the value was 81.8, which was increased by 32.9. AMHR also reported an over 6.3 mAP improvement compared to the handcrafted method. This proves the general validity of AMHR for both regression-based and region-proposal-based detectors.

6. Conclusions

Transient effects such as SEUs caused by the space environment severely restrict the reliability of EOSs’ on-orbit object detection missions. In this paper, we introduced a new criterial SDC-0.1 and performed large-scale fault injection tests to quantify the effect of transient faults on CNN-based object detectors. The results showed that SEU-induced bit-flip errors could result in output corruption or even the complete failure of object detectors. A novel AMHR framework was further proposed to harden the most-sensitive kernels in a CNN, which effectively increased the fault tolerance of the detectors. The experimental results showed that AMHR reduced the SDC-0.1 rate of SSD-VGG19 by 3.3× and tremendously improved the mAP of SSD-VGG16 by 53.4 in the presence of multiple errors, with a computational overhead less than 2×. AMHR also showed better fault tolerance performance over other selective hardening methods, and it achieved the lowest SDC-0.1 rates for both the VGG16 and VGG19 networks and reported an over 28.8 mAP increase for the SSD detector with multiple errors. We believe the effectiveness of the AMHR framework could be further improved by combining other neuron sensitivity estimation methods such as the second-order derivative or the entropy-based approach. Furthermore, with appropriate modification, AMHR has the potential to be applied to other types of network layers such as fully connected layers. These are left as our future works.

Author Contributions

Conceptualization, Q.S. and L.L.; methodology, Q.S. and L.L.; software, Q.S.; validation, Q.S.; writing—original draft preparation, Q.S.; writing—review and editing, J.F., L.L. and J.Y.; visualization, Q.S.; supervision, W.C. and J.Y.; project administration, J.Y. All authors have read and agreed to the published version of the manuscript.

Funding

This research received no external funding.

Institutional Review Board Statement

Not applicable.

Informed Consent Statement

Not applicable.

Data Availability Statement

Not applicable.

Conflicts of Interest

The authors declare no conflict of interest.

References

  1. Furano, G.; Meoni, G.; Dunne, A.; Moloney, D.; Ferlet-Cavrois, V.; Tavoularis, A.; Byrne, J.; Buckley, L.; Psarakis, M.; Voss, K.O.; et al. Towards the use of artificial intelligence on the edge in space systems: Challenges and opportunities. IEEE Aerosp. Electron. Syst. Mag. 2020, 35, 44–56. [Google Scholar] [CrossRef]
  2. Wimmers, A.; Velden, C.; Cossuth, J.H. Using deep learning to estimate tropical cyclone intensity from satellite passive microwave imagery. Mon. Weather Rev. 2019, 147, 2261–2282. [Google Scholar] [CrossRef]
  3. Manning, J.; Langerman, D.; Ramesh, B.; Gretok, E.; Wilson, C.; George, A.; MacKinnon, J.; Crum, G. Machine-Learning Space Applications on Smallsat Platforms with Tensorflow. 2018. Available online: https://digitalcommons.usu.edu/cgi/viewcontent.cgi?article=4270&context=smallsat (accessed on 1 January 2023).
  4. Paoletti, M.; Haut, J.; Plaza, J.; Plaza, A. Deep learning classifiers for hyperspectral imaging: A review. ISPRS J. Photogramm. Remote Sens. 2019, 158, 279–317. [Google Scholar] [CrossRef]
  5. Guirado, E.; Tabik, S.; Rivas, M.L.; Alcaraz-Segura, D.; Herrera, F. Whale counting in satellite and aerial images with deep learning. Sci. Rep. 2019, 9, 1–12. [Google Scholar] [CrossRef] [Green Version]
  6. Khoshavi, N.; Broyles, C.; Bi, Y. A survey on impact of transient faults on bnn inference accelerators. arXiv 2020, arXiv:2004.05915. [Google Scholar]
  7. Sterpone, L.; Azimi, S.; Du, B. A selective mapper for the mitigation of SETs on rad-hard RTG4 flash-based FPGAs. In Proceedings of the 2016 16th European Conference on Radiation and Its Effects on Components and Systems (RADECS), Bremen, Germany, 19–23 September 2016; pp. 1–4. [Google Scholar]
  8. Libano, F.; Wilson, B.; Wirthlin, M.; Rech, P.; Brunhaver, J. Understanding the impact of quantization, accuracy, and radiation on the reliability of convolutional neural networks on FPGAs. IEEE Trans. Nucl. Sci. 2020, 67, 1478–1484. [Google Scholar] [CrossRef]
  9. Libano, F.; Wilson, B.; Anderson, J.; Wirthlin, M.J.; Cazzaniga, C.; Frost, C.; Rech, P. Selective hardening for neural networks in FPGAs. IEEE Trans. Nucl. Sci. 2018, 66, 216–222. [Google Scholar] [CrossRef]
  10. Schorn, C.; Guntoro, A.; Ascheid, G. Accurate neuron resilience prediction for a flexible reliability management in neural network accelerators. In Proceedings of the 2018 Design, Automation & Test in Europe Conference & Exhibition (DATE), Dresden, Germany, 19–23 March 2018; pp. 979–984. [Google Scholar]
  11. Lillicrap, T.P.; Hunt, J.J.; Pritzel, A.; Heess, N.; Erez, T.; Tassa, Y.; Silver, D.; Wierstra, D. Continuous control with deep reinforcement learning. arXiv 2015, arXiv:1509.02971. [Google Scholar]
  12. Li, Y.; Liu, Y.; Li, M.; Tian, Y.; Luo, B.; Xu, Q. D2nn: A fine-grained dual modular redundancy framework for deep neural networks. In Proceedings of the 35th Annual Computer Security Applications Conference, San Juan, PR, USA, 9–13 December 2019; pp. 138–147. [Google Scholar]
  13. Wagstaff, K.L.; Altinok, A.; Chien, S.A.; Rebbapragada, U.; Schaffer, S.R.; Thompson, D.R.; Tran, D.Q. Cloud filtering and novelty detection using onboard machine learning for the EO-1 spacecraft. In Proceedings of the IJCAI Workshop AI in the Oceans and Space, Melbourne, Australia, 19–25 August 2017; Available online: https://www.semanticscholar.org/paper/Cloud-Filtering-and-Novelty-Detection-using-Onboard-Schaffer-Thompson/4a76832603f0a585bfd85278b34e0ec6d5732cad (accessed on 1 January 2023).
  14. Gillette, A.; Wilson, C.; George, A.D. Efficient and autonomous processing and classification of images on small spacecraft. In Proceedings of the 2017 IEEE National Aerospace and Electronics Conference (NAECON), Dayton, OH, USA, 27–30 June 2017; pp. 135–141. [Google Scholar]
  15. Giuffrida, G.; Diana, L.; de Gioia, F.; Benelli, G.; Meoni, G.; Donati, M.; Fanucci, L. CloudScout: A Deep Neural Network for On-Board Cloud Detection on Hyperspectral Images. Remote Sens. 2020, 12, 2205. [Google Scholar] [CrossRef]
  16. Xu, P.; Li, Q.; Zhang, B.; Wu, F.; Zhao, K.; Du, X.; Yang, C.; Zhong, R. On-board real-time ship detection in HISEA-1 SAR images based on CFAR and lightweight deep learning. Remote Sens. 2021, 13, 1995. [Google Scholar] [CrossRef]
  17. Girshick, R.; Donahue, J.; Darrell, T.; Malik, J. Rich feature hierarchies for accurate object detection and semantic segmentation. In Proceedings of the IEEE Conference on Computer Vision and Pattern Recognition, Washington, DC, USA, 23 June 2014; pp. 580–587. [Google Scholar]
  18. Ren, S.; He, K.; Girshick, R.; Sun, J. Faster r-cnn: Towards real-time object detection with region proposal networks. Adv. Neural Inf. Process. Syst. 2015, 28. [Google Scholar] [CrossRef] [PubMed] [Green Version]
  19. Lin, T.Y.; Dollár, P.; Girshick, R.; He, K.; Hariharan, B.; Belongie, S. Feature pyramid networks for object detection. In Proceedings of the IEEE Conference on Computer Vision and Pattern Recognition, Honolulu, HI, USA, 21–26 July 2017; pp. 2117–2125. [Google Scholar]
  20. He, K.; Gkioxari, G.; Dollár, P.; Girshick, R. Mask r-cnn. In Proceedings of the IEEE International Conference on Computer Vision, Venice, Italy, 22–29 October 2017; pp. 2961–2969. [Google Scholar]
  21. Liu, W.; Anguelov, D.; Erhan, D.; Szegedy, C.; Reed, S.; Fu, C.Y.; Berg, A.C. SSD: Single shot multibox detector. In Proceedings of the European Conference on Computer Vision; Springer: Cham, Switzerland, 2016; pp. 21–37. [Google Scholar]
  22. Redmon, J.; Divvala, S.; Girshick, R.; Farhadi, A. You only look once: Unified, real-time object detection. In Proceedings of the IEEE Conference on Computer Vision and Pattern Recognition, Las Vegas, NV, USA, 27–30 June 2016; pp. 779–788. [Google Scholar]
  23. Redmon, J.; Farhadi, A. YOLO9000: Better, faster, stronger. In Proceedings of the IEEE Conference on Computer Vision and Pattern Recognition, Honolulu, HI, USA, 21–26 July 2017; pp. 7263–7271. [Google Scholar]
  24. Bochkovskiy, A.; Wang, C.Y.; Liao, H.Y.M. Yolov4: Optimal speed and accuracy of object detection. arXiv 2020, arXiv:2004.10934. [Google Scholar]
  25. Zhong, Y.; Han, X.; Zhang, L. Multi-class geospatial object detection based on a position-sensitive balancing framework for high spatial resolution remote sensing imagery. ISPRS J. Photogramm. Remote Sens. 2018, 138, 281–294. [Google Scholar] [CrossRef]
  26. Yang, X.; Yang, J.; Yan, J.; Zhang, Y.; Zhang, T.; Guo, Z.; Sun, X.; Fu, K. Scrdet: Towards more robust detection for small, cluttered and rotated objects. In Proceedings of the IEEE/CVF International Conference on Computer Vision, Seoul, Republic of Korea, 27 October–2 November 2019; pp. 8232–8241. [Google Scholar]
  27. Xu, Z.; Xu, X.; Wang, L.; Yang, R.; Pu, F. Deformable convnet with aspect ratio constrained nms for object detection in remote sensing imagery. Remote Sens. 2017, 9, 1312. [Google Scholar] [CrossRef] [Green Version]
  28. Simonyan, K.; Zisserman, A. Very deep convolutional networks for large-scale image recognition. arXiv 2014, arXiv:1409.1556. [Google Scholar]
  29. He, K.; Zhang, X.; Ren, S.; Sun, J. Deep residual learning for image recognition. In Proceedings of the IEEE Conference on Computer Vision and Pattern Recognition, Las Vegas, NV, USA, 27–30 June 2016; pp. 770–778. [Google Scholar]
  30. Howard, A.G.; Zhu, M.; Chen, B.; Kalenichenko, D.; Wang, W.; Weyand, T.; Andreetto, M.; Adam, H. Mobilenets: Efficient convolutional neural networks for mobile vision applications. arXiv 2017, arXiv:1704.04861. [Google Scholar]
  31. Liu, C.; Gao, Z.; Liu, S.; Ning, X.; Li, H.; Li, X. Fault-Tolerant Deep Learning: A Hierarchical Perspective. arXiv 2022, arXiv:2204.01942. [Google Scholar]
  32. Li, G.; Hari, S.K.S.; Sullivan, M.; Tsai, T.; Pattabiraman, K.; Emer, J.; Keckler, S.W. Understanding error propagation in deep learning neural network (DNN) accelerators and applications. In Proceedings of the International Conference for High Performance Computing, Networking, Storage and Analysis, Denver, CO, USA, 12–17 November 2017; pp. 1–12. [Google Scholar]
  33. Gao, Z.; Zhang, H.; Yao, Y.; Xiao, J.; Zeng, S.; Ge, G.; Wang, Y.; Ullah, A.; Reviriego, P. Soft Error Tolerant Convolutional Neural Networks on FPGAs with Ensemble Learning. IEEE Trans. Very Large Scale Integr. (VLSI) Syst. 2022, 30, 291–302. [Google Scholar] [CrossRef]
  34. Baek, I.; Chen, W.; Zhu, Z.; Samii, S.; Rajkumar, R. FT-DeepNets: Fault-Tolerant Convolutional Neural Networks with Kernel-based Duplication. In Proceedings of the IEEE/CVF Winter Conference on Applications of Computer Vision, Waikoloa, HI, USA, 3–8 January 2022; pp. 975–984. [Google Scholar]
  35. Gaitonde, T.; Wen, S.J.; Wong, R.; Warriner, M. Component failure analysis using neutron beam test. In Proceedings of the 2010 17th IEEE International Symposium on the Physical and Failure Analysis of Integrated Circuits, Singapore, 5–9 July 2010; pp. 1–5. [Google Scholar]
  36. Johnston, A.H. Scaling and Technology Issues for Soft Error Rates. 2000. Available online: https://doi.org/2014/16240 (accessed on 1 January 2023).
  37. Li, S.; Farooqui, N.; Yalamanchili, S. Software Reliability Enhancements for GPU Applications. In Proceedings of the Sixth Workshop on Programmability Issues for Heterogeneous Multicores, Berlin, Germany, 21–23 January 2013. [Google Scholar]
  38. Su, H.; Wei, S.; Yan, M.; Wang, C.; Shi, J.; Zhang, X. Object detection and instance segmentation in remote sensing imagery based on precise mask R-CNN. In Proceedings of the IGARSS 2019-2019 IEEE International Geoscience and Remote Sensing Symposium, Yokohama, Japan, 28 July–2 August 2019; pp. 1454–1457. [Google Scholar]
  39. Chen, K.; Wang, J.; Pang, J.; Cao, Y.; Xiong, Y.; Li, X.; Sun, S.; Feng, W.; Liu, Z.; Xu, J.; et al. MMDetection: Open mmlab detection toolbox and benchmark. arXiv 2019, arXiv:1906.07155. [Google Scholar]
  40. Mahmoud, A.; Aggarwal, N.; Nobbe, A.; Vicarte, J.R.S.; Adve, S.V.; Fletcher, C.W.; Frosio, I.; Hari, S.K.S. Pytorchfi: A runtime perturbation tool for dnns. In Proceedings of the 2020 50th Annual IEEE/IFIP International Conference on Dependable Systems and Networks Workshops (DSN-W), Valencia, Spain, 29 June–2 July 2020; pp. 25–31. [Google Scholar]
  41. Goldstein, B.F.; Srinivasan, S.; Das, D.; Banerjee, K.; Santiago, L.; Ferreira, V.C.; Nery, A.S.; Kundu, S.; França, F.M. Reliability evaluation of compressed deep learning models. In Proceedings of the 2020 IEEE 11th Latin American Symposium on Circuits & Systems (LASCAS), San Jose, Costa Rica, 25–28 February 2020; pp. 1–5. [Google Scholar]
  42. He, Y.; Lin, J.; Liu, Z.; Wang, H.; Li, L.J.; Han, S. Amc: Automl for model compression and acceleration on mobile devices. In Proceedings of the European Conference on Computer Vision (ECCV), Munich, Germany, 8–14 September 2018; pp. 784–800. [Google Scholar]
  43. Zhong, Z.; Yan, J.; Liu, C.L. Practical Network Blocks Design with Q-Learning. arXiv 2017, arXiv:1708.05552. [Google Scholar]
  44. Cai, H.; Chen, T.; Zhang, W.; Yu, Y.; Wang, J. Reinforcement Learning for Architecture Search by Network Transformation. arXiv 2017, arXiv:1707.04873. [Google Scholar]
  45. Baker, B.; Gupta, O.; Naik, N.; Raskar, R. Designing neural network architectures using reinforcement learning. arXiv 2016, arXiv:1611.02167. [Google Scholar]
Figure 1. Demonstration of an on-orbit object detection anomaly caused by a transient fault. The SEU flips a register bit in the processing element, which causes a software error in the feature map. This error eventually leads to a corrupted object detection result.
Aerospace 10 00088 g001
Figure 2. General structure of a convolutional layer. Convolutional kernels are first applied to the input feature map, and then, a nonlinear activation function is utilized to calculate the output feature map.
Aerospace 10 00088 g002
Figure 3. Feature map error and weight error injection test results for various detectors: (a) shows the SDC rates for the detectors under test; (b) shows the SDC-0.1 rates for the detectors under test. The SSD detectors report extremely high SDC-0.1 rates for weight errors, so the results are shown with a different scale.
Aerospace 10 00088 g003
Figure 4. Feature map error and weight error injected into different convolutional layers in a VGG16 network: (a) shows the SDC rates for errors injected into different layers; (b) shows the SDC-0.1 rates for errors injected into different layers.
Aerospace 10 00088 g004
Figure 5. Feature map error injected into different bit positions in an SSD-VGG16 FLOAT model; the sign bit (31), exponent bits (30–23), and high data bits of significand precision (22–19) are considered. (a) shows the SDC rates for the errors injected into various bit positions; (b) shows the SDC-0.1 rates for errors injected into d various bit positions.
Aerospace 10 00088 g005
Figure 6. Feature map error injected into different bit positions for SSD-VGG16 quantized models. (a) shows the SDC rate for errors injected into the higher 8 bits in the INT16 model; (b) shows the SDC rate for errors injected into different bits in the INT8 model; (c) shows the SDC-0.1 rate for errors injected into the higher 8 bits in the INT16 model; (d) shows the SDC-0.1 rate for errors injected into different bits in the INT8 model.
Aerospace 10 00088 g006
Figure 7. SSD and Faster R-CNN detectors’ performance losses caused by multiple feature map errors.
Aerospace 10 00088 g007
Figure 8. Demonstration of the AMHR framework. The DDPG agent first performs a layerwise search to predict the ratio of error-sensitive kernels for each layer, and the inner layer search then follows to pinpoint the exact positions of the kernels with the weight-sum method. The fault tolerance of the hardened model is evaluated in a fault injection test environment.
Aerospace 10 00088 g008
Figure 9. Redundant kernels ratio among layers in SSD-VGG16 using different hardening methods.
Aerospace 10 00088 g009
Figure 10. Fault tolerance analysis for detectors with different hardening methods: (a) shows SDC and SDC-0.1 rates for hardened SSD-VGG16 models; (b) shows SDC and SDC-0.1 rates for hardened SSD-VGG19 models.
Aerospace 10 00088 g010
Figure 11. Performance losses of hardening detectors with multiple errors: (a) shows the mAP drops with increased feature map errors for hardened SSD detectors; (b) shows the mAP drops with increased feature map errors for hardened Faster R-CNN detectors.
Aerospace 10 00088 g011
Table 1. Object detectors with various backbone networks selected for fault injection test.
DetectorTypeBackbone Network
YOLOv3Regression-basedDarknet53
SSDRegression-basedVGG16
VGG19
MobileNetV2
Faster R-CNNRegion-proposal-basedVGG16
VGG19
ResNet34
ResNet50
Table 2. Detailed information of masked errors.
Model Hardening MethodMasked
Software
Error Counts
Masked
SDC
Counts
Masked
SDC-0.1
Counts
Masked
SDC
Ratio (%)
Masked
SDC-0.1
Ratio (%)
slightly hardened modeluniform51513710026.619.42
handcraft60522611837.3617.2
AMHR56420413236.1723.4
deeply hardened modeluniform129332623225.2117.94
handcrafted128838123929.5818.56
AMHR131141225831.4319.68
Disclaimer/Publisher’s Note: The statements, opinions and data contained in all publications are solely those of the individual author(s) and contributor(s) and not of MDPI and/or the editor(s). MDPI and/or the editor(s) disclaim responsibility for any injury to people or property resulting from any ideas, methods, instructions or products referred to in the content.

