
A Data-Driven Method for Arrival Sequencing and Scheduling Problem


Abstract
:1. Introduction
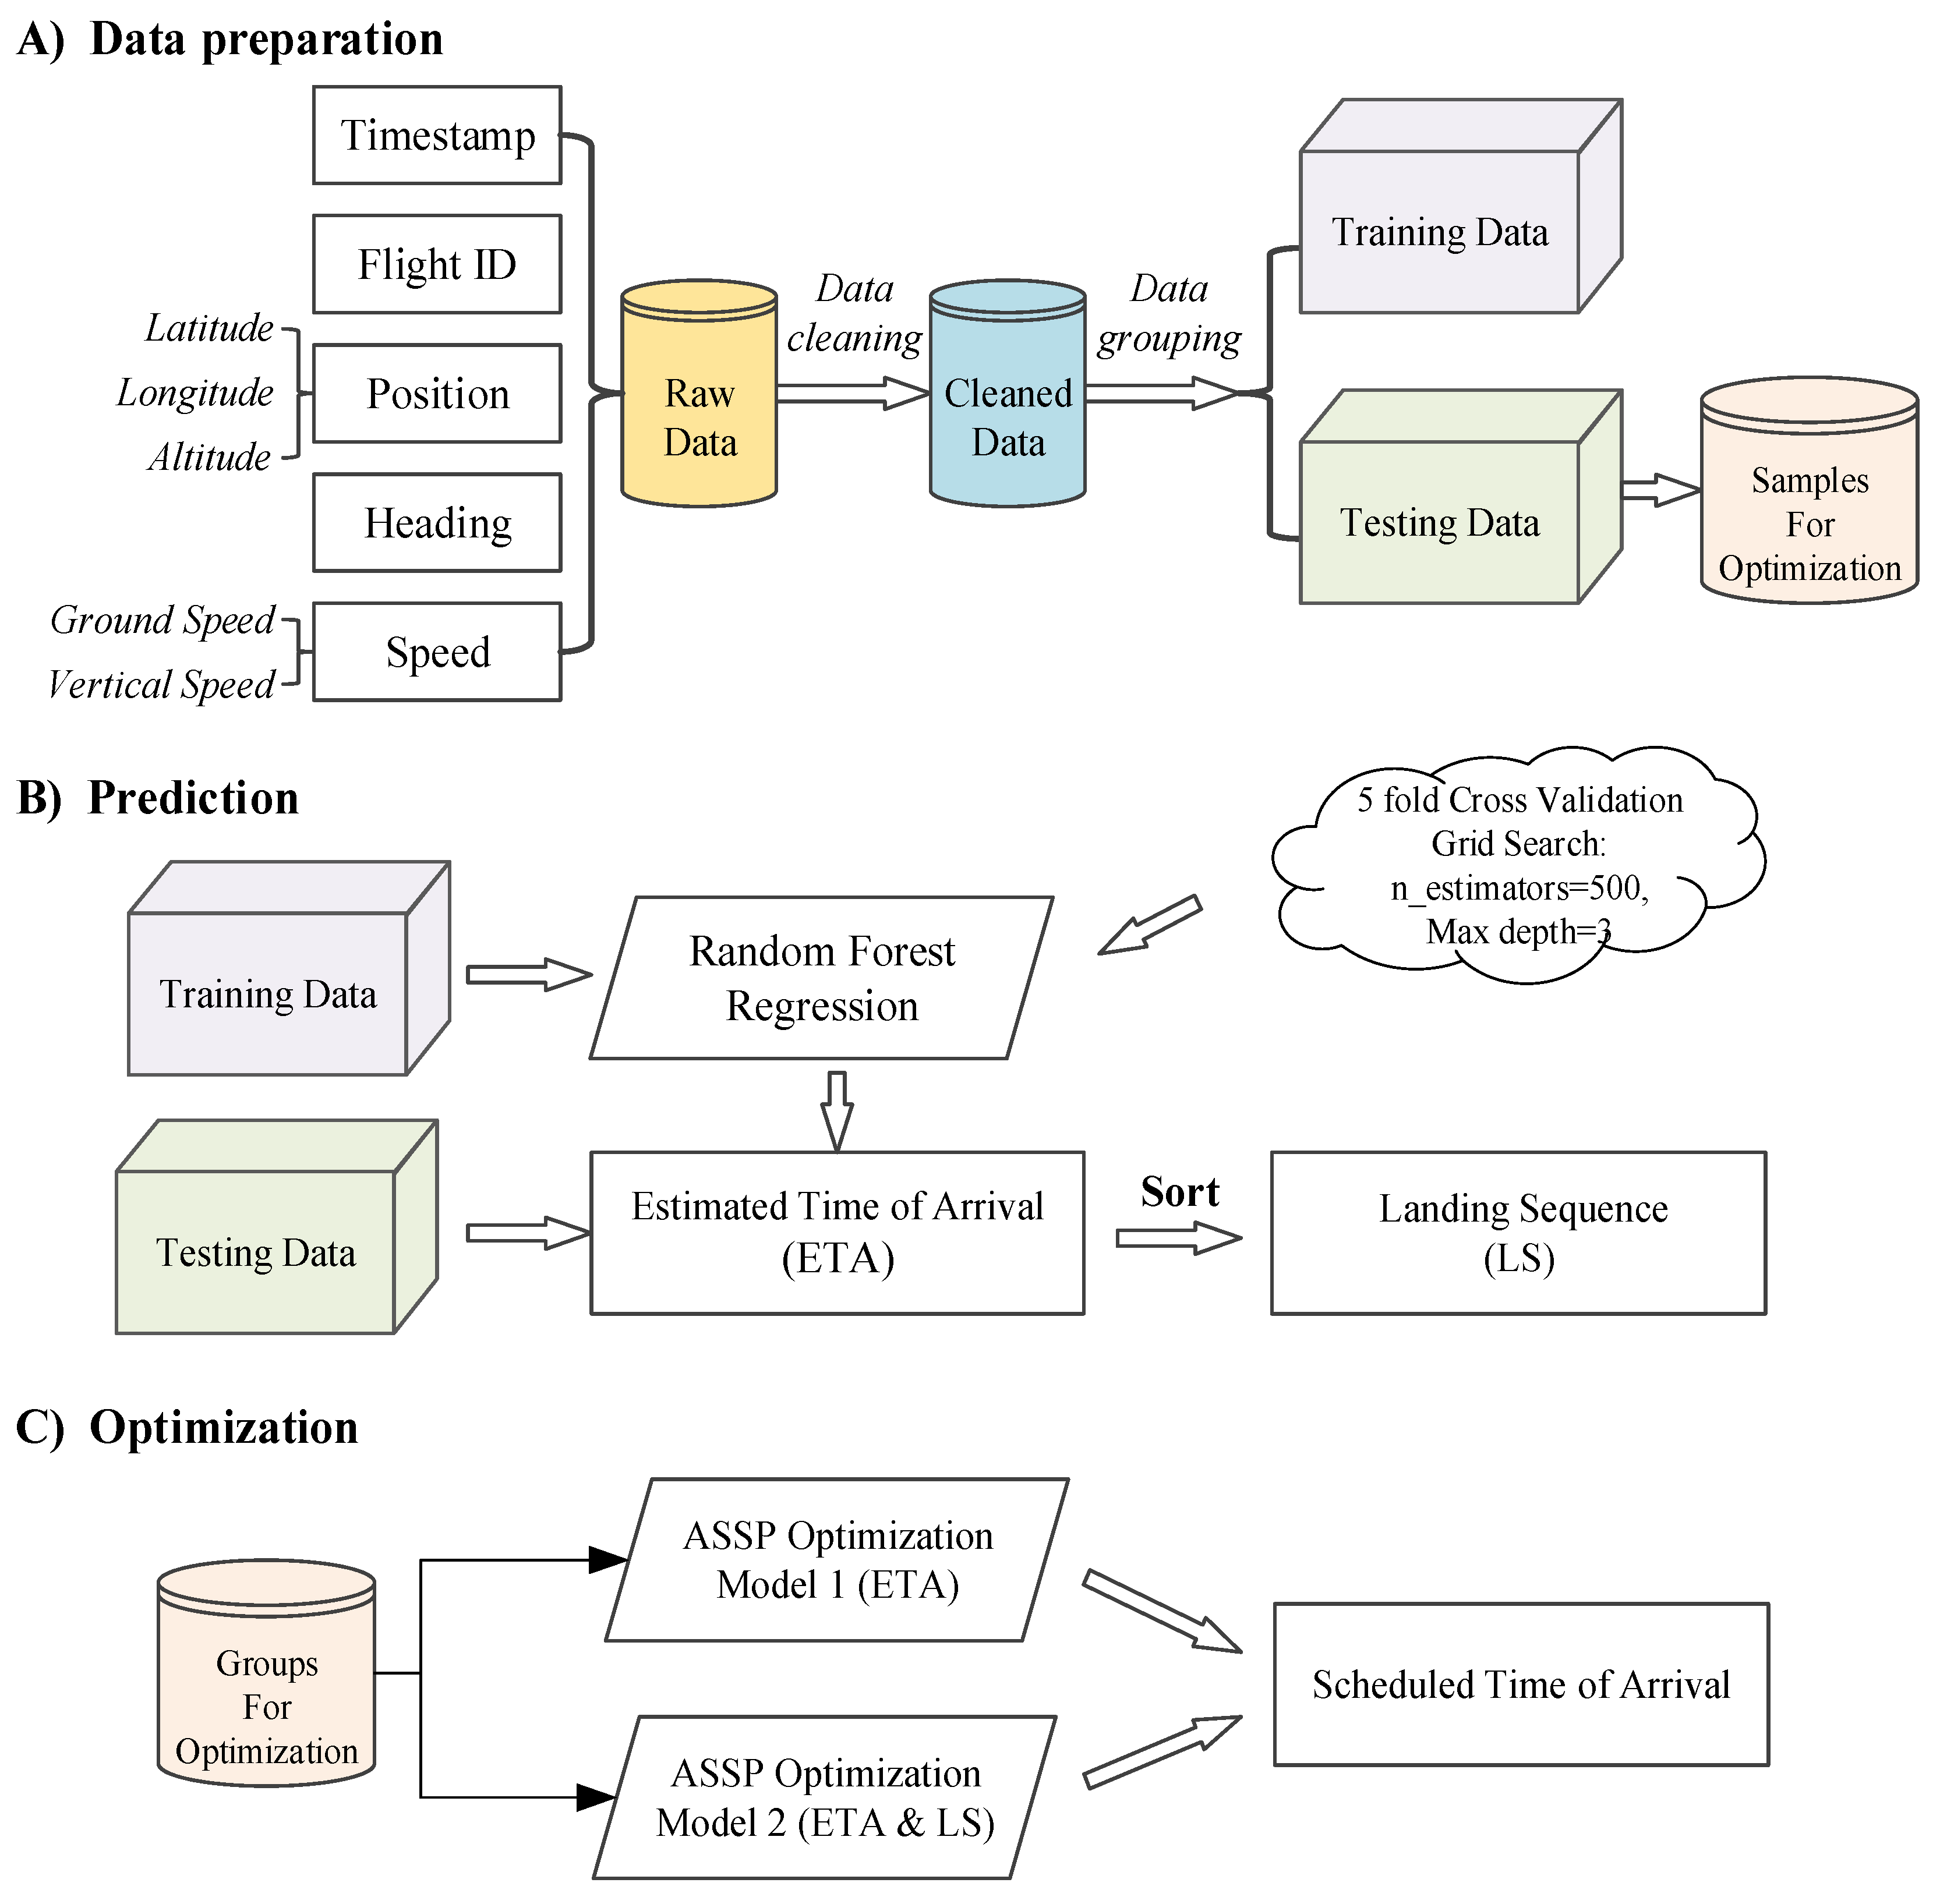
2. Methodology
- Prepare and preprocess the historical aircraft trajectories, detailed in Section 2.1.
- Divide the preprocessed data into training and testing subsets, and construct a random-forest-based ETA prediction model. The ETA is predicted using the model for the testing data subset, detailed in Section 2.2.
- After the landing sequence is sorted, an optimization model is proposed in Section 2.3 to obtain the STAs, and another optimization model using only the predicted ETA is constructed for comparison.
2.1. Data Preparation
- Data decoding: The raw data are aircraft track messages received from Surveillance Data Processing System (SDPS). Based on the Eurocontrol Standard Document (Category 062), aircraft trajectory information could be obtained by decoding the track messages.
- Data partitioning: The aircraft trajectories within the TMA could belong to departure, overflight, or arrival aircraft. Our concern in this paper is the arrival trajectories, which could be partitioned based on the flight plan information.
- Data cleaning: This step eliminates abnormal data, such as the trajectories of testing flights. Accordingly, the remaining data are referred to as the cleaned data.
- Data grouping: After data cleaning, the remaining data are grouped into training and testing sets for further ETA prediction and STA optimization.
2.2. ETA Prediction
2.2.1. Model of ETA Prediction
2.2.2. Evaluation of ETA Prediction
2.3. STA Optimization
2.3.1. Optimization Based on Predicted ETAs
2.3.2. Optimization Based on Predicted ETA and Landing Sequence
2.3.3. Performance of Optimization
3. Case Studies
4. Results and Discussion
4.1. Results of Arrival Scheduling
- 1.
- Comparison between the FCFS strategy and our proposed methods. Our proposed methods outperform the FCFS in the operation efficiency indicators (average delay, average dwell time, maximum delay, and maximum dwell time) and the operation complexity indicators (Kendall rank correlation and position shift ).
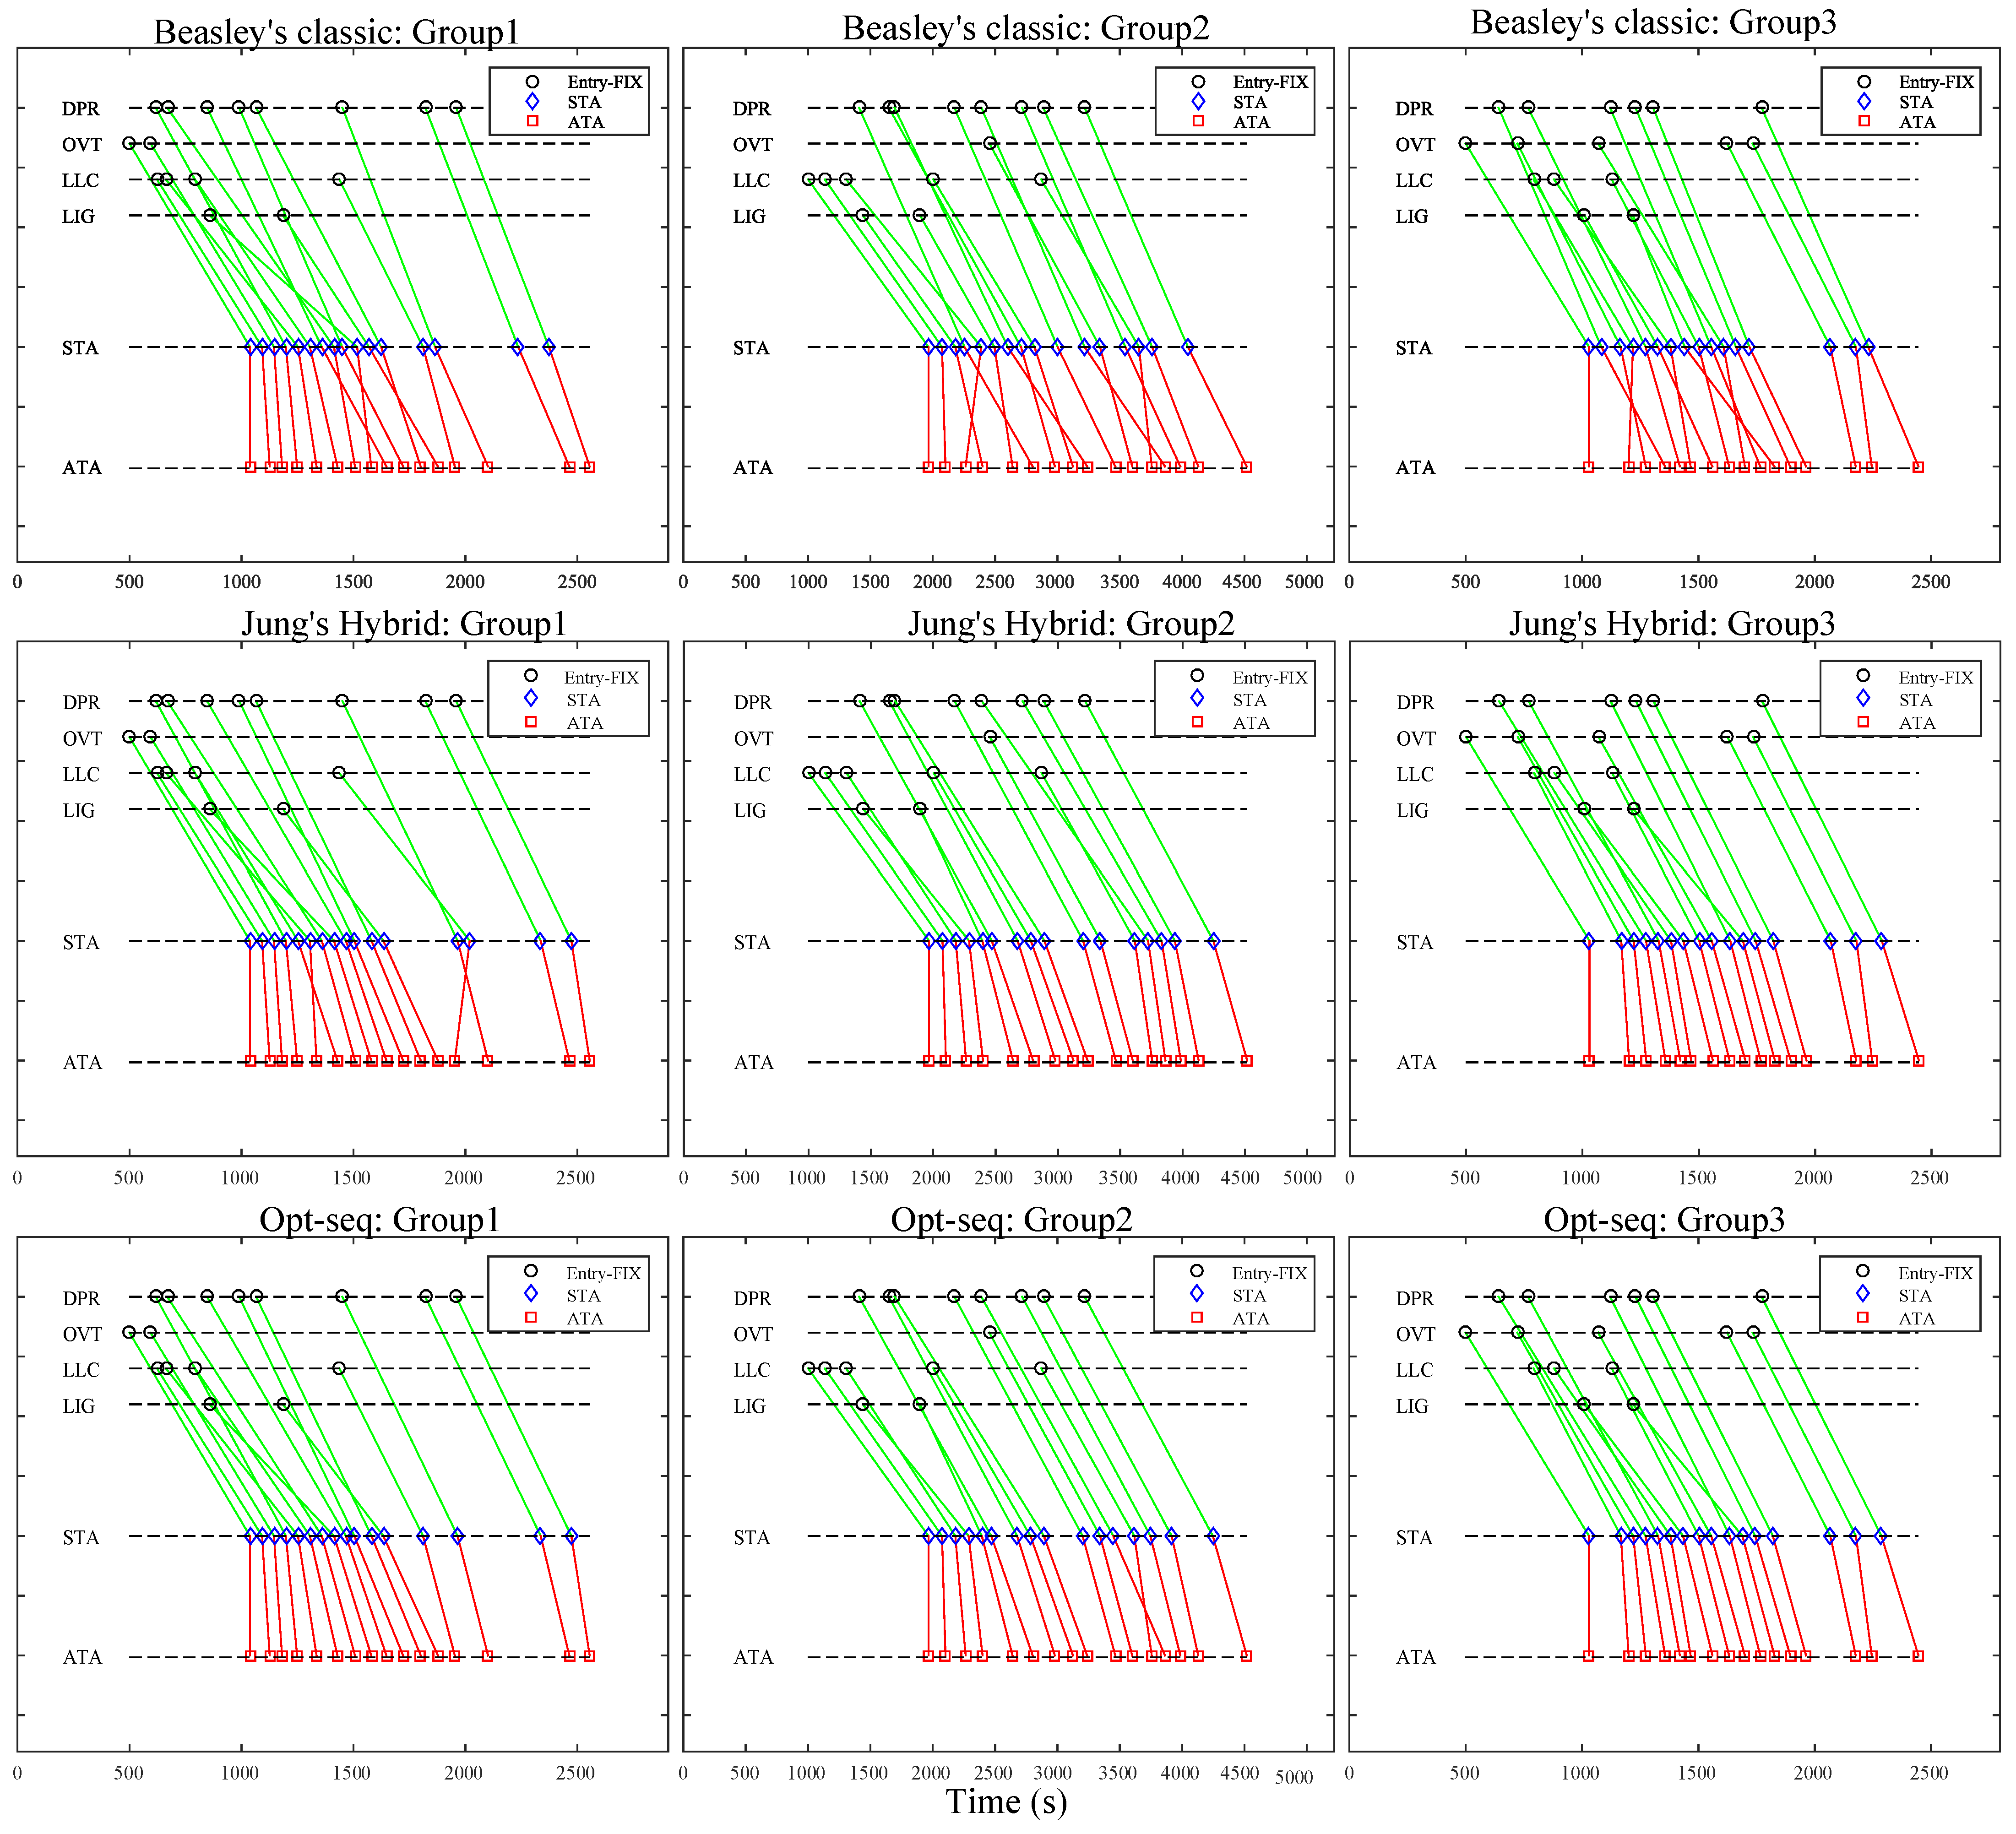
- 2.
- Comparison between the classic method and the opt-pETA method. These two scheduling methods are both based on the model of Equations (7)–(15). The difference lies in the ETAs since the former ETAs are obtained by statistical analysis, while the latter is by random forest models. The opt-pETA strategy outperforms the classic strategy in most indicators except for the maximum dwell time in Group 2. This result demonstrates the importance of ETA prediction accuracy, indicating that the proposed ETA prediction method could improve scheduling performance. It is all due to the fact that our proposed opt-pETA method could improve the predicting accuracy by considering the dynamic traffic situation and the human working experience.
- 3.
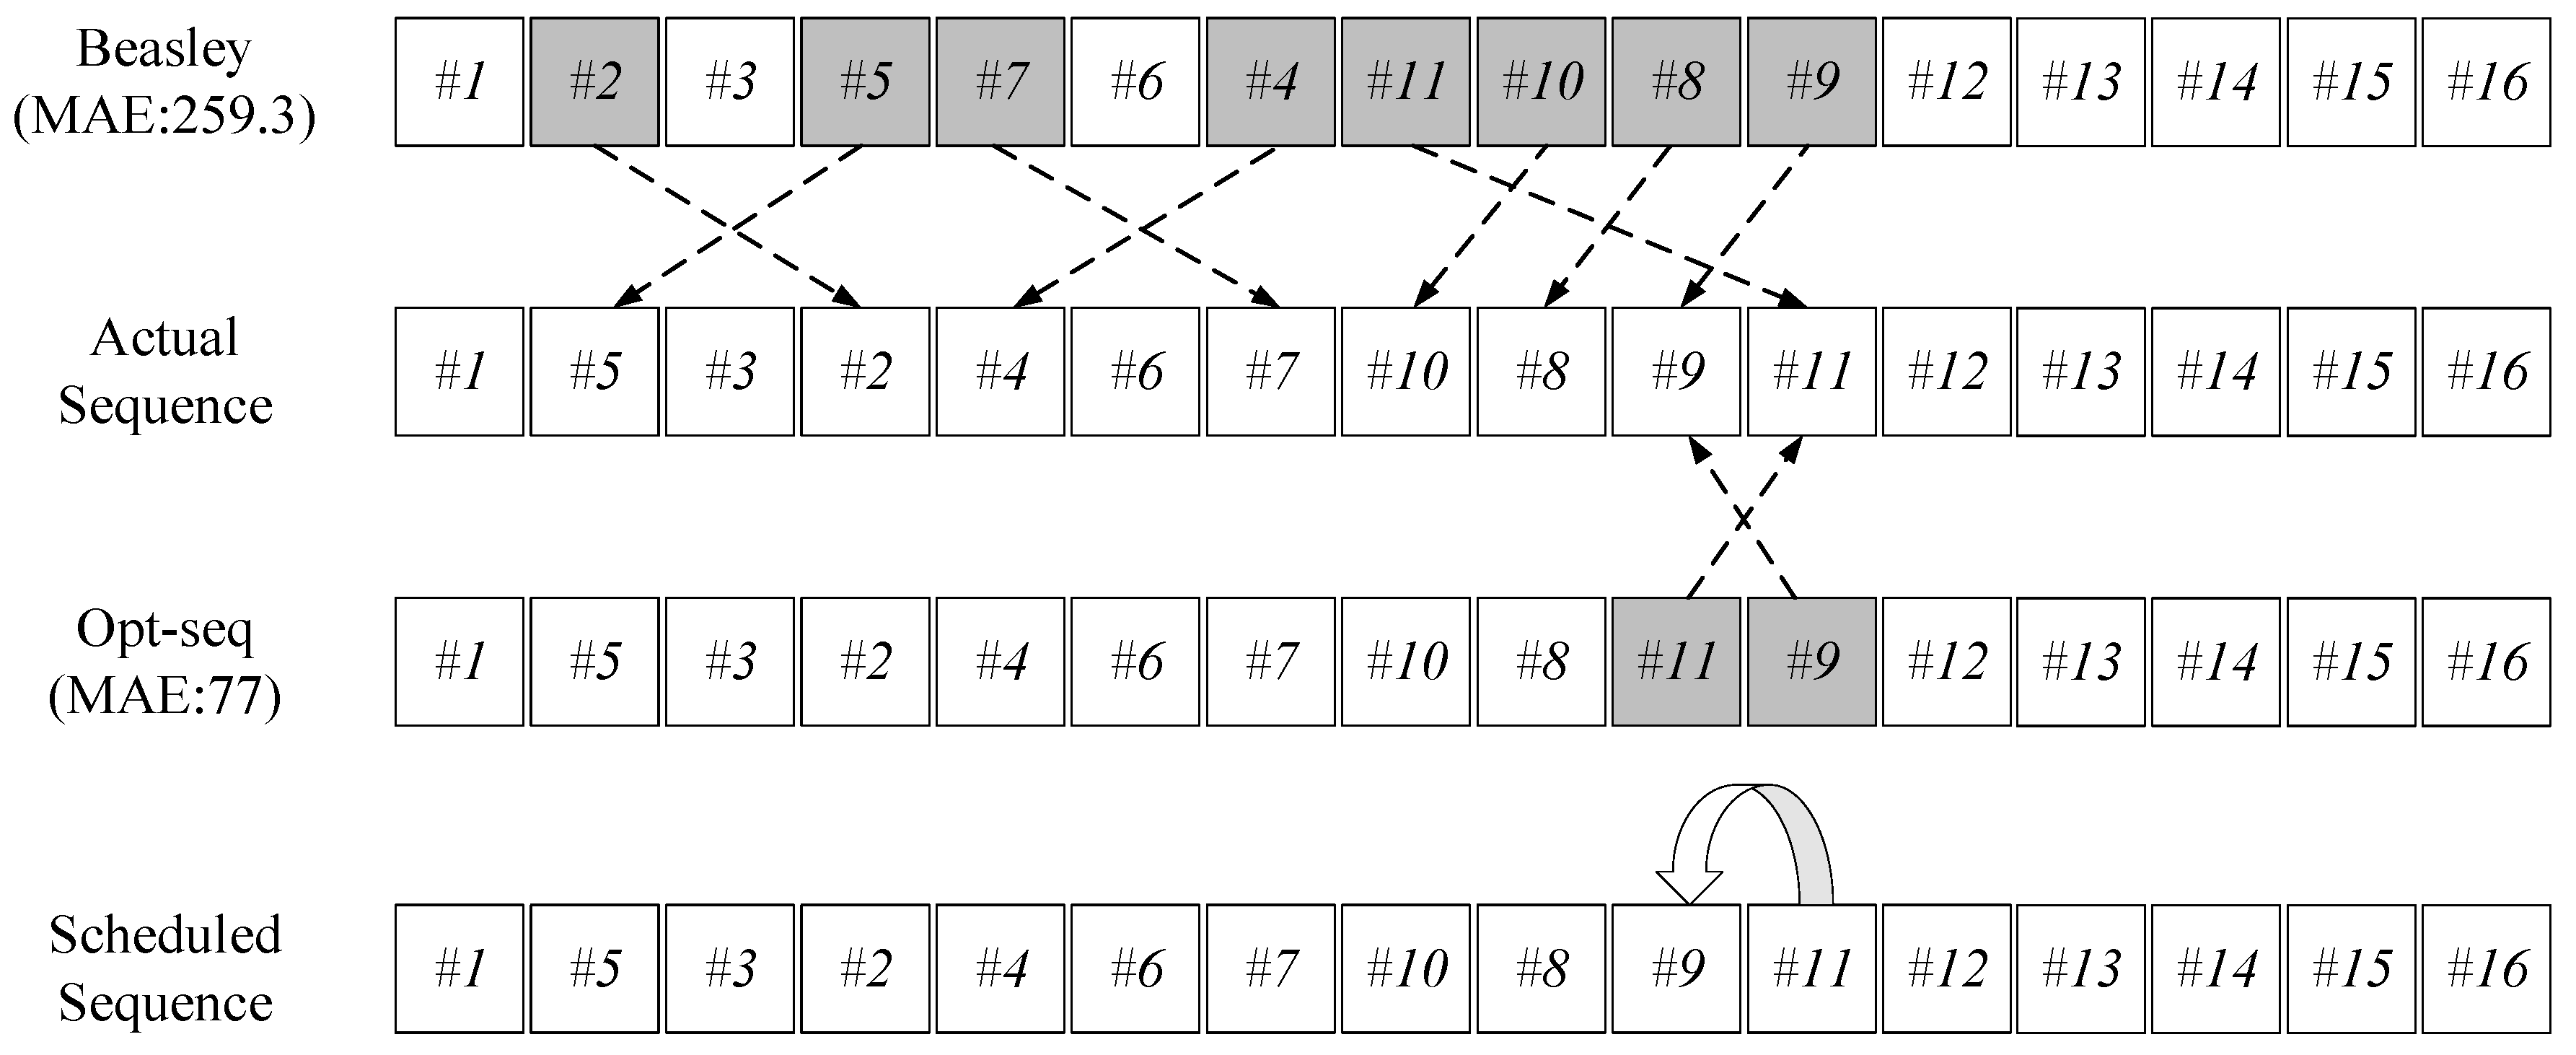
- Comparison between Jung’s hybrid method and the proposed opt-seq method. These two scheduling methods are both based on the model of Equations (17)–(24). The difference lies in the landing sequence since the former landing sequence is obtained by a preference learning approach, while the latter is by sorting the predicted ETAs. The opt-seq method outperforms Jung’s hybrid method in most situations except for the Kendall rank correlation and position shift in group 2.
- 4.
- Comparison between our proposed two methods. These two methods take the same predicted ETAs using random forest models. However, the opt-pETA needs to optimize the landing sequence and STAs simultaneously, while the opt-seq only needs to optimize the STAs based on a given landing sequence (Equation (16)). Therefore, as to the operation efficiency-related indicators, the opt-pETA strategy is a better choice; as to the operation complexity-related indicators, the opt-seq strategy is a better choice. Moreover, in terms of problem-solving efficiency, the opt-seq strategy is undoubtedly more capable of real-time performance.
4.2. Analysis of Opt-pETA Method
4.3. Analysis of Opt-seq Method
5. Conclusions
Author Contributions
Funding
Data Availability Statement
Conflicts of Interest
References
- Bennell, J.A.; Mesgarpour, M.; Potts, C.N. Airport runway scheduling. Ann. Oper. Res. 2013, 204, 249–270. [Google Scholar] [CrossRef]
- Ikli, S.; Mancel, C.; Mongeau, M.; Olive, X.; Rachelson, E. The aircraft runway scheduling problem: A survey. Comput. Oper. Res. 2021, 132, 105336. [Google Scholar] [CrossRef]
- Beasley, J.E.; Krishnamoorthy, M.; Sharaiha, Y.; Abramson, D. Scheduling Aircraft Landings—The Static Case. Transp. Sci. 2000, 34, 180–197. [Google Scholar] [CrossRef] [Green Version]
- Beasley, J.E.; Krishnamoorthy, M.; Sharaiha, Y.; Abramson, D. Displacement problem and dynamically scheduling aircraft landings. J. Oper. Res. Soc. 2004, 55, 54–64. [Google Scholar] [CrossRef]
- Bennell, J.A.; Mesgarpour, M.; Potts, C.N. Dynamic scheduling of aircraft landings. Eur. J. Oper. Res. 2017, 258, 315–327. [Google Scholar] [CrossRef] [Green Version]
- Hong, Y.; Choi, B.; Lee, K.; Kim, Y. Dynamic Robust Sequencing and Scheduling Under Uncertainty for the Point Merge System in Terminal Airspace. IEEE Trans. Intell. Transp. Syst. 2018, 19, 2933–2943. [Google Scholar] [CrossRef]
- Hu, X.-B.; Chen, W.-H. Receding horizon control for aircraft arrival sequencing and scheduling. IEEE Trans. Intell. Transp. Syst. 2005, 6, 189–197. [Google Scholar] [CrossRef] [Green Version]
- Ji, X.-P.; Cao, X.-B.; Du, W.-B.; Tang, K. An evolutionary approach for dynamic single-runway arrival sequencing and scheduling problem. Soft Comput. 2017, 21, 7021–7037. [Google Scholar] [CrossRef]
- Saraf, A.P.; Slater, G.L. Optimal Dynamic Scheduling of Aircraft Arrivals at Congested Airports. J. Guid. Control Dyn. 2008, 31, 53–65. [Google Scholar] [CrossRef]
- Bianco, L.; Dell’Olmo, P.; Giordani, S. Scheduling models for air traffic control in terminal areas. J. Sched. 2006, 9, 223–253. [Google Scholar] [CrossRef]
- Kapolke, M.; Fürstenau, N.; Heidt, A.; Liers, F.; Mittendorf, M.; Weiß, C. Pre-tactical optimization of runway utilization under uncertainty. J. Air Transp. Manag. 2016, 56, 48–56. [Google Scholar] [CrossRef]
- Khassiba, A.; Cafieri, S.; Bastin, F.; Mongeau, M.; Gendron, B. Two-stage stochastic programming models for the extended aircraft arrival management problem with multiple pre-scheduling points. Transp. Res. Part C Emerg. Technol. 2022, 142, 103769. [Google Scholar] [CrossRef]
- Solak, S.; Solveling, G.; Clarke, J.-P.B.; Johnson, E.L. Stochastic Runway Scheduling. Transp. Sci. 2018, 52, 917–940. [Google Scholar] [CrossRef]
- Sölveling, G.; Clarke, J.-P. Scheduling of airport runway operations using stochastic branch and bound methods. Transp. Res. Part C Emerg. Technol. 2014, 45, 119–137. [Google Scholar] [CrossRef]
- Girish, B. An efficient hybrid particle swarm optimization algorithm in a rolling horizon framework for the aircraft landing problem. Appl. Soft Comput. 2016, 44, 200–221. [Google Scholar] [CrossRef]
- Faye, A. Solving the Aircraft Landing Problem with time discretization approach. Eur. J. Oper. Res. 2015, 242, 1028–1038. [Google Scholar] [CrossRef] [Green Version]
- Ji, X.-P.; Cao, X.-B.; Tang, K. Sequence searching and evaluation: A unified approach for aircraft arrival sequencing and scheduling problems. Memetic Comp. 2016, 8, 109–123. [Google Scholar] [CrossRef]
- Salehipour, A.; Modarres, M.; Naeni, L.M. An efficient hybrid meta-heuristic for aircraft landing problem. Comput. Oper. Res. 2013, 40, 207–213. [Google Scholar] [CrossRef]
- Balakrishnan, H.; Chandran, B.G. Algorithms for Scheduling Runway Operations Under Constrained Position Shifting. Oper. Res. 2010, 58, 1650–1665. [Google Scholar] [CrossRef] [Green Version]
- Hong, Y.; Cho, N.; Kim, Y.; Choi, B. Multiobjective Optimization for Aircraft Arrival Sequencing and Scheduling. J. Air Transp. 2017, 25, 115–122. [Google Scholar] [CrossRef]
- Mokhtarimousavi, S.; Rahami, H.; Kaveh, A. Multi-objective mathematical modeling of aircraft landing problem on a runway in static mode, scheduling and sequence determination using NSGA-II. Iran Univ. Sci. Technol. 2015, 5, 21–36. [Google Scholar]
- Samà, M.; D’Ariano, A.; Corman, F.; Pacciarelli, D. Metaheuristics for efficient aircraft scheduling and re-routing at busy terminal control areas. Transp. Res. Part C Emerg. Technol. 2017, 80, 485–511. [Google Scholar] [CrossRef]
- Zhang, J.; Zhao, P.; Zhang, Y.; Dai, X.; Sui, D. Criteria selection and multi-objective optimization of aircraft landing problem. J. Air Transp. Manag. 2020, 82, 101734. [Google Scholar] [CrossRef]
- Briskorn, D.; Stolletz, R. Aircraft landing problems with aircraft classes. J. Sched. 2014, 17, 31–45. [Google Scholar] [CrossRef] [Green Version]
- Lieder, A.; Briskorn, D.; Stolletz, R. A dynamic programming approach for the aircraft landing problem with aircraft classes. Eur. J. Oper. Res. 2015, 243, 61–69. [Google Scholar] [CrossRef] [Green Version]
- Veresnikov, G.S.; Egorov, N.; Kulida, E.; Lebedev, V.G. Methods for Solving of the Aircraft Landing Problem. I. Exact Solution Methods. Autom. Remote Control 2019, 80, 1317–1334. [Google Scholar] [CrossRef]
- Artiouchine, K.; Baptiste, P.; Dürr, C. Runway sequencing with holding patterns. Eur. J. Oper. Res. 2008, 189, 1254–1266. [Google Scholar] [CrossRef] [Green Version]
- D’Ariano, A.; D’Urgolo, P.; Pacciarelli, D.; Pranzo, M. Optimal sequencing of aircrafts take-off and landing at a busy airport. In Proceedings of the 13th International IEEE Conference on Intelligent Transportation Systems, Funchal, Portugal, 19–22 September 2010; pp. 1569–1574. [Google Scholar] [CrossRef]
- Veresnikov, G.S.; Egorov, N.; Kulida, E.; Lebedev, V.G. Methods for Solving of the Aircraft Landing Problem. II. Approximate Solution Methods. Autom. Remote Control 2019, 80, 1502–1518. [Google Scholar] [CrossRef]
- Vadlamani, S.; Hosseini, S. A novel heuristic approach for solving aircraft landing problem with single runway. J. Air Transp. Manag. 2014, 40, 144–148. [Google Scholar] [CrossRef]
- Hu, X.-B.; Chen, W.-H. Genetic algorithm based on receding horizon control for arrival sequencing and scheduling. Eng. Appl. Artif. Intell. 2005, 18, 633–642. [Google Scholar] [CrossRef]
- Hu, X.-B.; Paolo, E.A.D. A Ripple-Spreading Genetic Algorithm for the Aircraft Sequencing Problem. Evol. Comput. 2011, 19, 77–106. [Google Scholar] [CrossRef] [PubMed] [Green Version]
- Xu, B. An efficient Ant Colony algorithm based on wake-vortex modeling method for aircraft scheduling problem. J. Comput. Appl. Math. 2017, 317, 157–170. [Google Scholar] [CrossRef]
- Zhang, J.; You, L.; Yang, C. Arrival sequencing and scheduling based on multi-objective imperialist competitive algorithm. Acta Aeronaut. Astronaut. Sin. 2021, 42, 324439. [Google Scholar]
- Eun, Y.; Hwang, I.; Bang, H. Optimal Arrival Flight Sequencing and Scheduling Using Discrete Airborne Delays. IEEE Trans. Intell. Transp. Syst. 2010, 11, 359–373. [Google Scholar] [CrossRef]
- Samà, M.; D’Ariano, A.; Pacciarelli, D. Rolling Horizon Approach for Aircraft Scheduling in the Terminal Control Area of Busy Airports. Procedia Soc. Behav. Sci. 2013, 80, 531–552. [Google Scholar] [CrossRef]
- Samà, M.; D’Ariano, A.; D’Ariano, P.; Pacciarelli, D. Optimal aircraft scheduling and routing at a terminal control area during disturbances. Transp. Res. Part C Emerg. Technol. 2014, 47, 61–85. [Google Scholar] [CrossRef]
- Carr, G.C.; Erzberger, H.; Neuman, F. Fast-Time Study of Airline-Influenced Arrival Sequencing and Scheduling. J. Guid. Control Dyn. 2000, 23, 526–531. [Google Scholar] [CrossRef]
- Hasevoets, N.; Conroy, P. AMAN status review 2010, 1st ed.; Eurocontrol: Brussels, Belgium, 2010. [Google Scholar]
- Hasevoets, N.; Conroy, P. Arrival Manager: Implementation Guidelines and Lessons Learned, 1st ed.; Eurocontrol: Brussels, Belgium, 2010. [Google Scholar]
- Zhang, J.; Zhao, P. A New Meta Heuristic Approach for Aircraft Landing Problem. Trans. Nanjing Univ. Aeronaut. Astronaut. 2020, 37, 197–208. [Google Scholar] [CrossRef]
- Jung, S.; Hong, S.; Lee, K. A Data-Driven Air Traffic Sequencing Model Based on Pairwise Preference Learning. IEEE Trans. Intell. Transp. Syst. 2019, 20, 803–816. [Google Scholar] [CrossRef]
- Zhang, J.; Peng, Z.; Yang, C.; Wang, B. Data-driven flight time prediction for arrival aircraft within the terminal area. IET Intell. Transp. Syst. 2022, 16, 263–275. [Google Scholar] [CrossRef]
- Trivedi, S.; Pardos, Z.; Heffernan, N.T. The Utility of Clustering in Prediction Tasks. arXiv 2015. [Google Scholar] [CrossRef]
- Heaton, J. An empirical analysis of feature engineering for predictive modeling. In Proceedings of the SoutheastCon 2016, Norfolk, VA, USA, 30 March–3 April 2016; pp. 1–6. [Google Scholar] [CrossRef] [Green Version]
- Micci-Barreca, D. A preprocessing scheme for high-cardinality categorical attributes in classification and prediction problems. ACM SIGKDD Explor. Newsl. 2001, 3, 27–32. [Google Scholar] [CrossRef]
- Horiguchi, Y.; Baba, Y.; Kashima, H.; Suzuki, M.; Kayahara, H.; Maeno, J. Predicting fuel consumption and flight delays for low-cost airlines. In Proceedings of the Twenty-Ninth IAAI Conference, San Francisco, CA, USA, 6–9 February 2017. [Google Scholar]
- Wang, Z.; Liang, M.; Delahaye, D. A hybrid machine learning model for short-term estimated time of arrival prediction in terminal manoeuvring area. Transp. Res. Part C Emerg. Technol. 2018, 95, 280–294. [Google Scholar] [CrossRef]
- Wang, Z.; Liang, M.; Delahaye, D. Automated data-driven prediction on aircraft Estimated Time of Arrival. J. Air Transp. Manag. 2020, 88, 101840. [Google Scholar] [CrossRef]
- Probst, P.; Wright, M.; Boulesteix, A.-L. Hyperparameters and tuning strategies for random forest. Wiley Interdiscip. Rev. Data Min. Knowl. Discov. 2019, 9, e1301. [Google Scholar] [CrossRef] [Green Version]
- Sáez, R.; Prats, X.; Polishchuk, T.; Polishchuk, V. Traffic synchronization in terminal airspace to enable continuous descent operations in trombone sequencing and merging procedures: An implementation study for Frankfurt airport. Transp. Res. Part C Emerg. Technol. 2020, 121, 102875. [Google Scholar] [CrossRef]
- Sáez, R.; Polishchuk, T.; Schmidt, C.; Hardell, H.; Smetanová, L.; Polishchuk, V.; Prats, X. Automated sequencing and merging with dynamic aircraft arrival routes and speed management for continuous descent operations. Transp. Res. Part C Emerg. Technol. 2021, 132, 103402. [Google Scholar] [CrossRef]


| Term | Description |
|---|---|
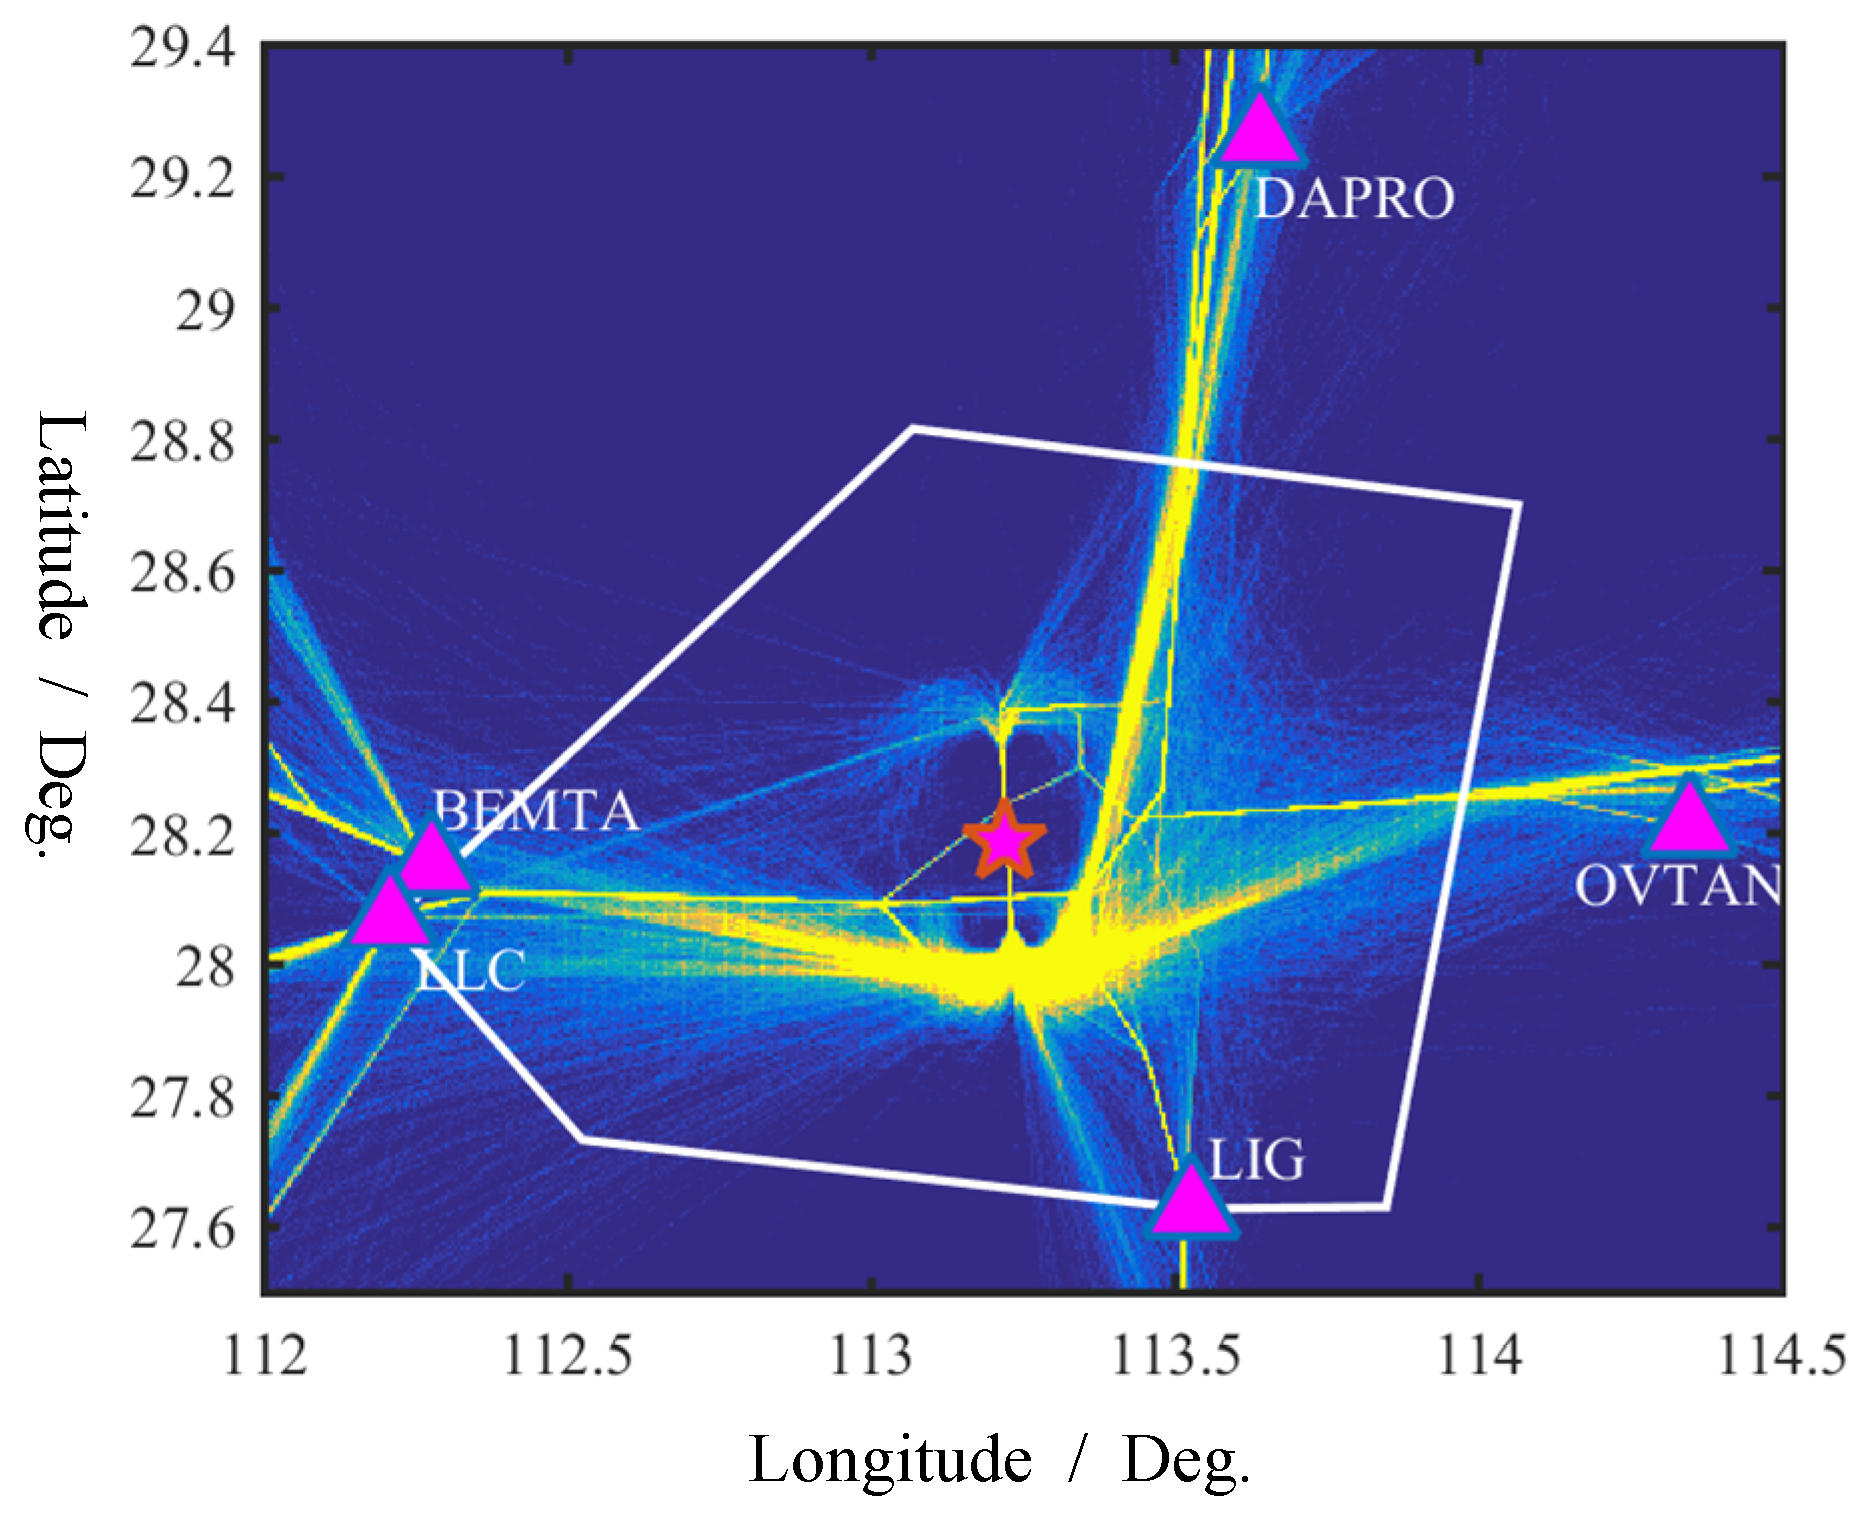
| ZGHA | Changsha Huanghua International Airport |
| TMA | Terminal Maneuvering Area |
| EF | Entry fix |
| ATA | Actual time of arrival |
| ETA | Estimated time of arrival |
| STA | Scheduled time of arrival |
| Delay time of aircraft j, if aircraft j arrives later than ETA | |
| Dwell time, the flight time from EF to the runway | |
| The corresponding percentage of arrival flight time (from the entry fix to the runway) | |
| ATA at a particular entry fix of aircraft j | |
| ETA of aircraft j | |
| STA of aircraft j | |
| Earliest ETA of aircraft j | |
| Latest ETA of aircraft j | |
| Binary decision variable. If aircraft k lands before aircraft j, = 1. | |
| Wake vortex separation between aircraft k and aircraft j |
| Symbol | Description | Type | Category |
|---|---|---|---|
| #fea 1 | Altitude of the aircraft when entering the TMA | N * | Trajectory |
| #fea 2 | Latitude of the aircraft when entering the TMA | N | |
| #fea 3 | Longitude of the aircraft when entering the TMA | N | |
| #fea 4 | Ground speed of the aircraft when entering the TMA | N | |
| #fea 5 | Heading of the aircraft when entering the TMA | N | |
| #fea 6 | Aircraft type | C | Airport |
| #fea 8 | Airline | C | |
| #fea 9 | Hour of day | N | |
| #fea 11 | Mean flight time during the previous 15 min (MT_15) | N | |
| #fea 12 | Mean flight time via the same fix during the previous 15 min (MTS_15) | N | |
| #fea 13 | Number of arrivals in the whole TMA | N | Operation |
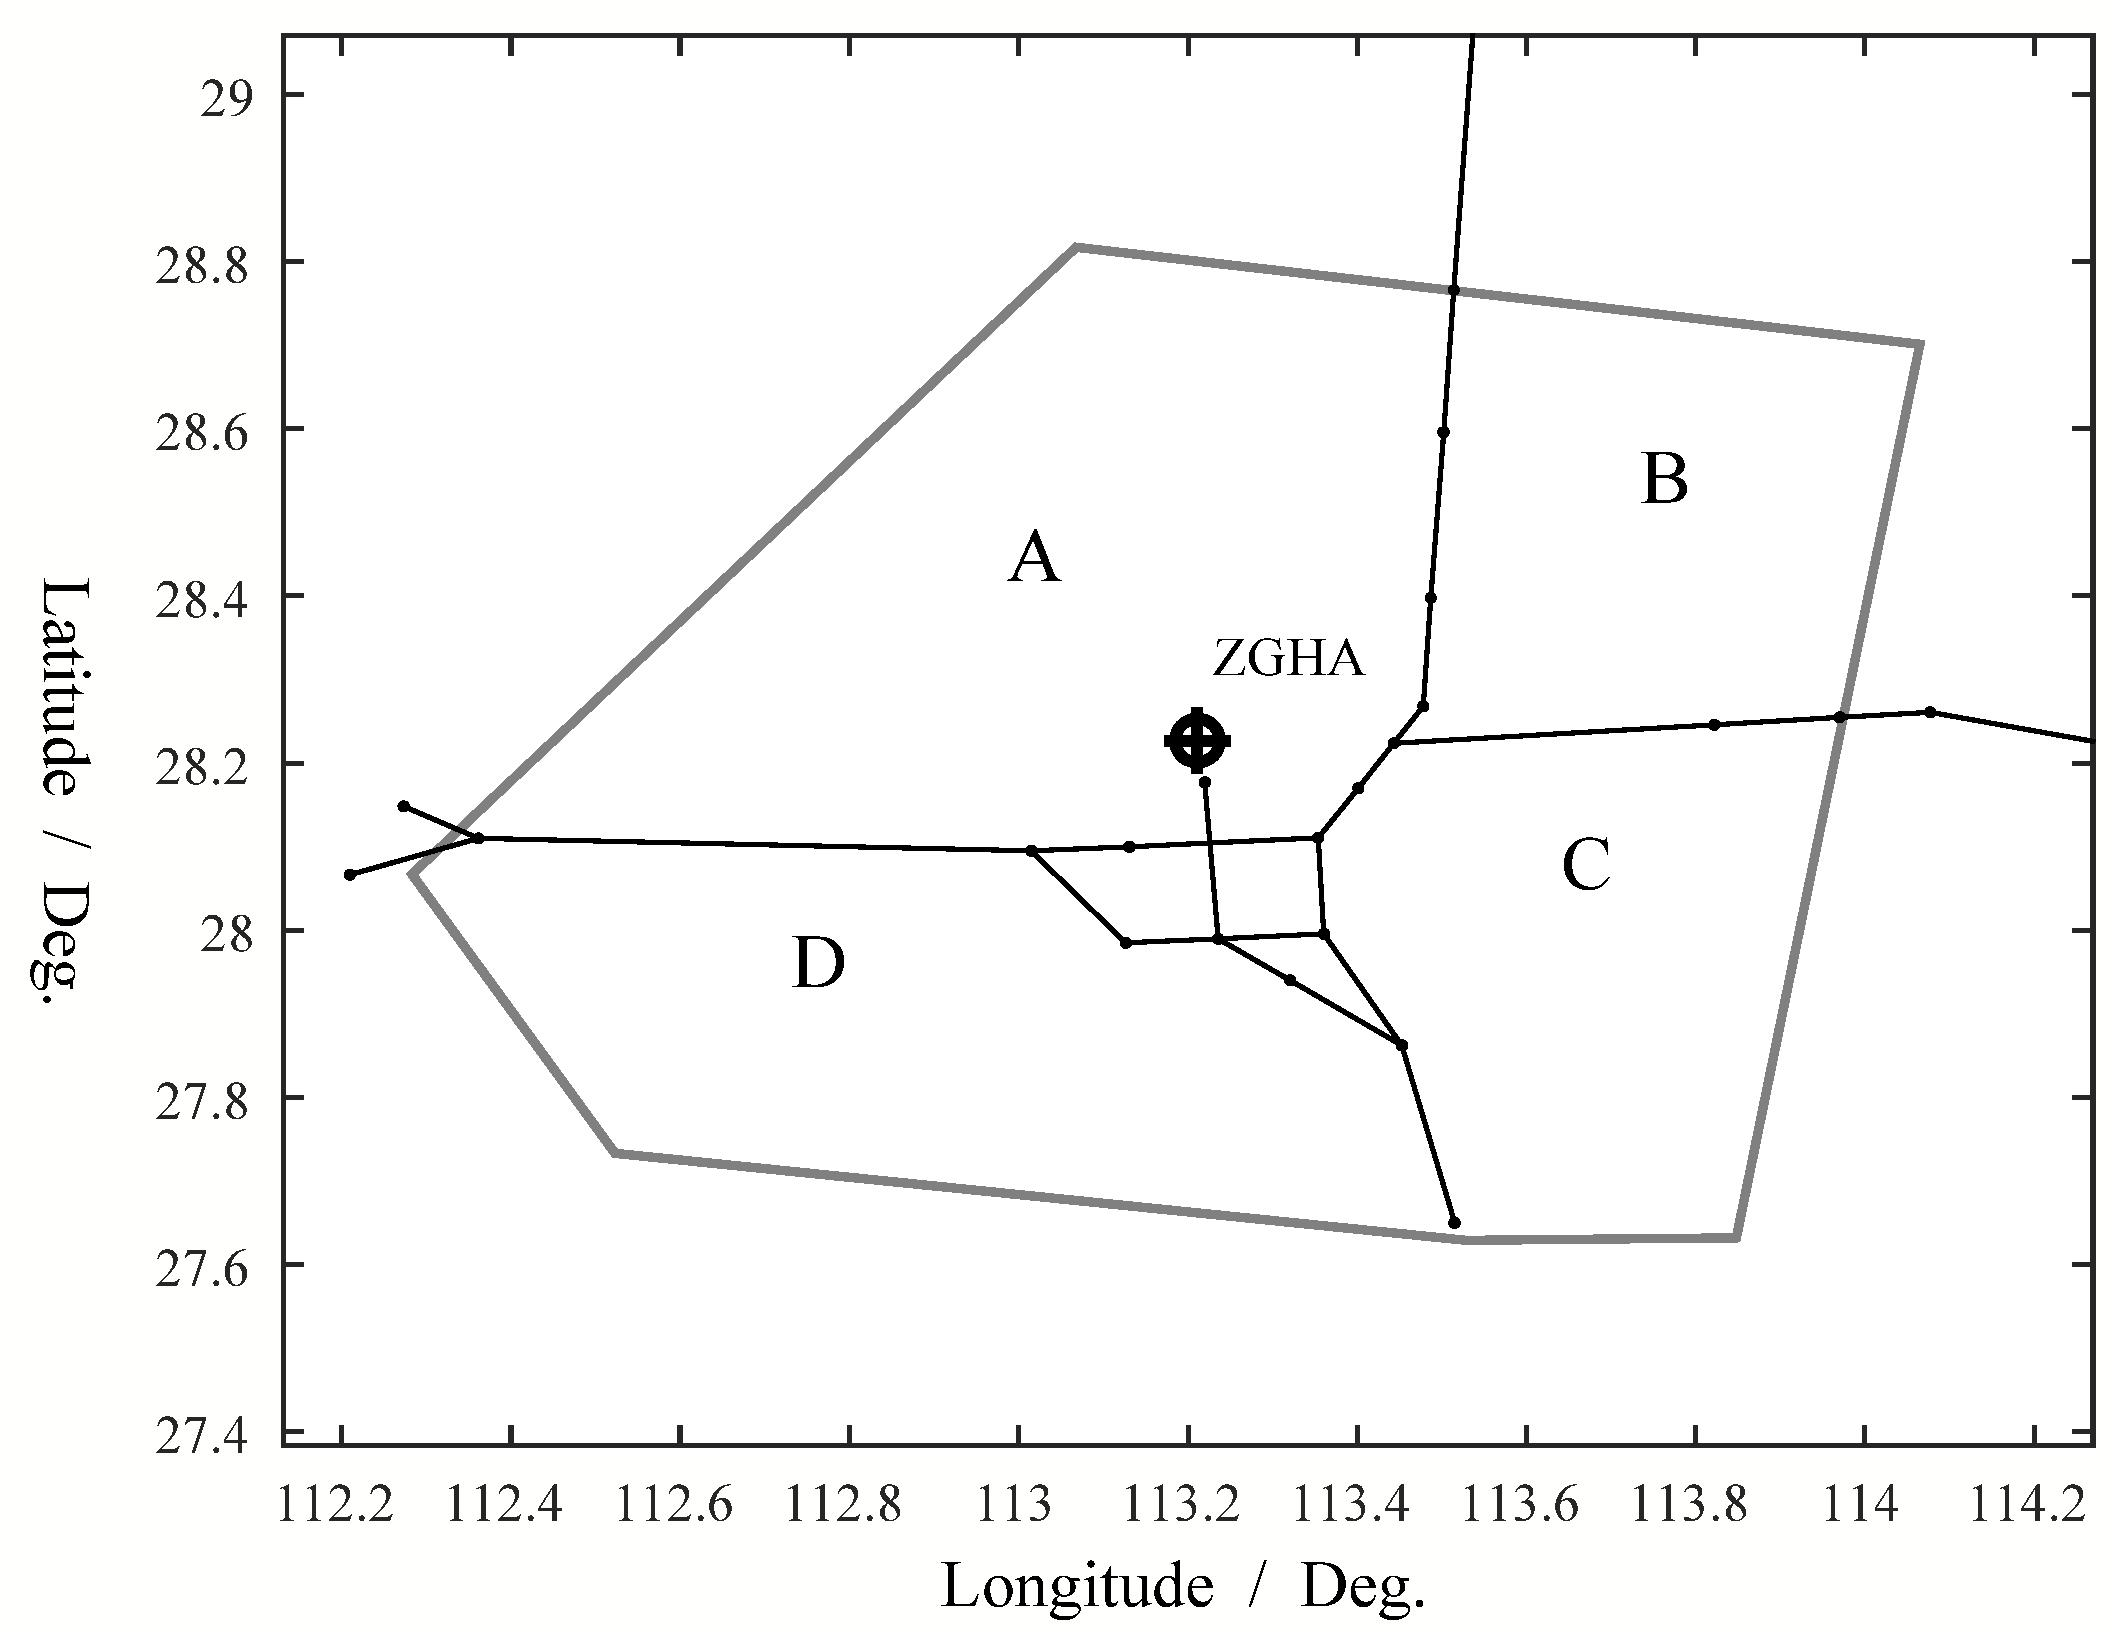
| #fea 14 | Number of arrivals within sector A | N | |
| #fea 15 | Number of arrivals within sector B | N | |
| #fea 16 | Number of arrivals within sector C | N | |
| #fea 17 | Number of arrivals within sector D | N | |
| #fea 18 | Number of arrivals near the TMA (Extra_num) | N |
| Entry Fix | Training Set | Testing Set | Total Data |
|---|---|---|---|
| LLC | 2348 | 593 | 2941 |
| OVTAN | 1131 | 282 | 1413 |
| LIG | 526 | 128 | 654 |
| DAPRO | 1706 | 427 | 2133 |
| Total | 5711 | 1430 | 7141 |
| Hyperparameter | Range of Grid |
|---|---|
| number of estimators | {10, 20, …, 300, 500} |
| max features | {0.6, 0.7, 0.8, 0.9, 1} |
| max depth | {3, 4, 5, 6, 7, 8, 9} |
| min samples leaf | {1, 2, …, 10} |
| Entry Fix | MAE (s) | RMSE (s) | MAPE (%) |
|---|---|---|---|
| LLC | 74.9 | 103.2 | 7.3 |
| OVTAN | 83.8 | 123.6 | 7.2 |
| LIG | 90.2 | 131.6 | 9.2 |
| DAPRO | 77.5 | 100.0 | 5.9 |
| Average | 77 | 109 | 6.9 |
| Data | Methods | Indicators | |||||
|---|---|---|---|---|---|---|---|
(s) | (s) | (s) | (s) | ||||
| Group 1 | FCFS | 160.6 | 1247 | 730 | 1661 | 7 | 0.9 |
| Beasley’s classic | 46.9 | 1022 | 526 | 1500 | 8 | 0.78 | |
| Opt-pETA | 0 | 1021 | 0 | 1316 | 6 | 0.9 | |
| Jung’s hybrid | 81.1 | 1088 | 435 | 1380 | 4 | 0.93 | |
| Opt-seq | 0 | 1062 | 0 | 1380 | 0 | 1 | |
| Group 2 | FCFS | 122 | 1200 | 672 | 1346 | 10 | 0.86 |
| Beasley’s classic | 4.75 | 863 | 67 | 1061 | 11 | 0.78 | |
| Opt-pETA | 0 | 863 | 0 | 1083 | 11 | 0.8 | |
| Jung’s hybrid | 16.6 | 961 | 174 | 1334 | 0 | 1 | |
| Opt-seq | 0 | 937 | 0 | 1196 | 2 | 0.91 | |
| Group 3 | FCFS | 134.7 | 1212 | 586 | 1346 | 6 | 0.9 |
| Beasley’s classic | 0 | 865 | 0 | 1222 | 7 | 0.8 | |
| Opt-pETA | 0 | 865 | 0 | 1077 | 7 | 0.83 | |
| Jung’s hybrid | 30.4 | 973 | 266 | 1263 | 0 | 1 | |
| Opt-seq | 0 | 973 | 0 | 1263 | 0 | 1 | |
| Strategy | ETA Accuracy | Indicators | ||
|---|---|---|---|---|
(s) | (s) | τ | ||
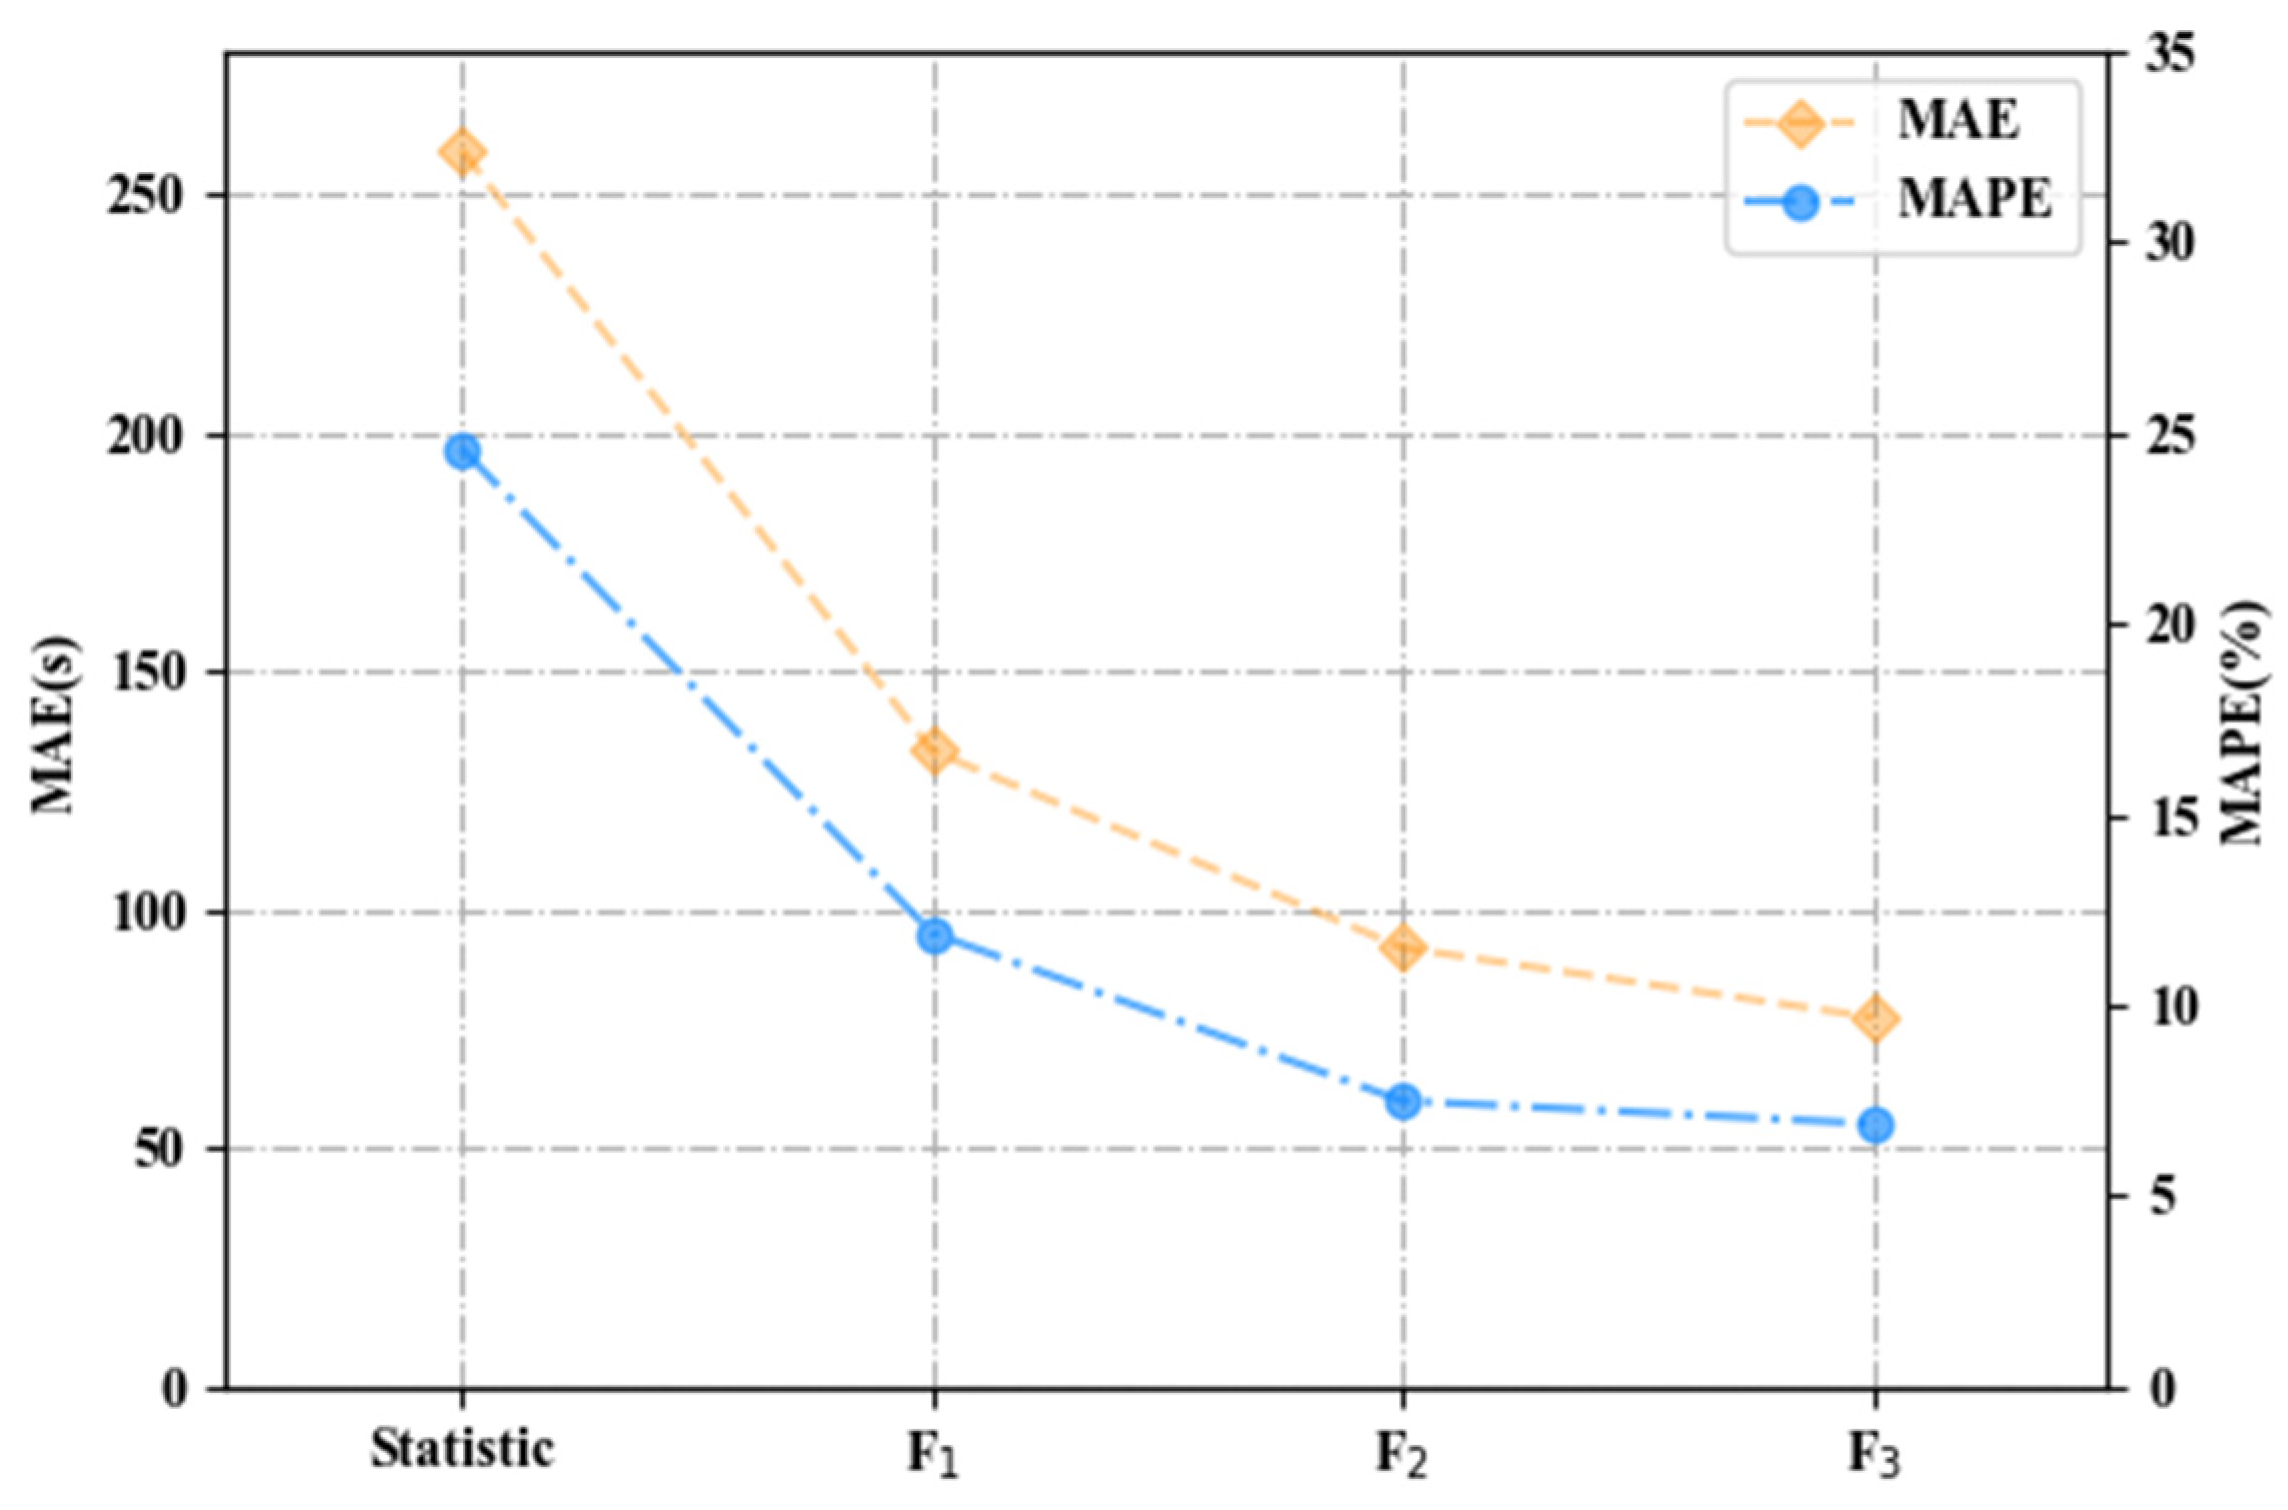
| Beasley’s classic | MAE: 259.3 | 46.9 | 1022 | 0.78 |
| Opt-pETA | Random Forests (F1) MAE: 133.4 | 18.2 | 1022 | 0.80 |
| Random Forests (F2) MAE: 92.1 | 1.56 | 1021 | 0.86 | |
| Random Forests (F3) MAE: 78.8 | 0 | 1021 | 0.9 | |
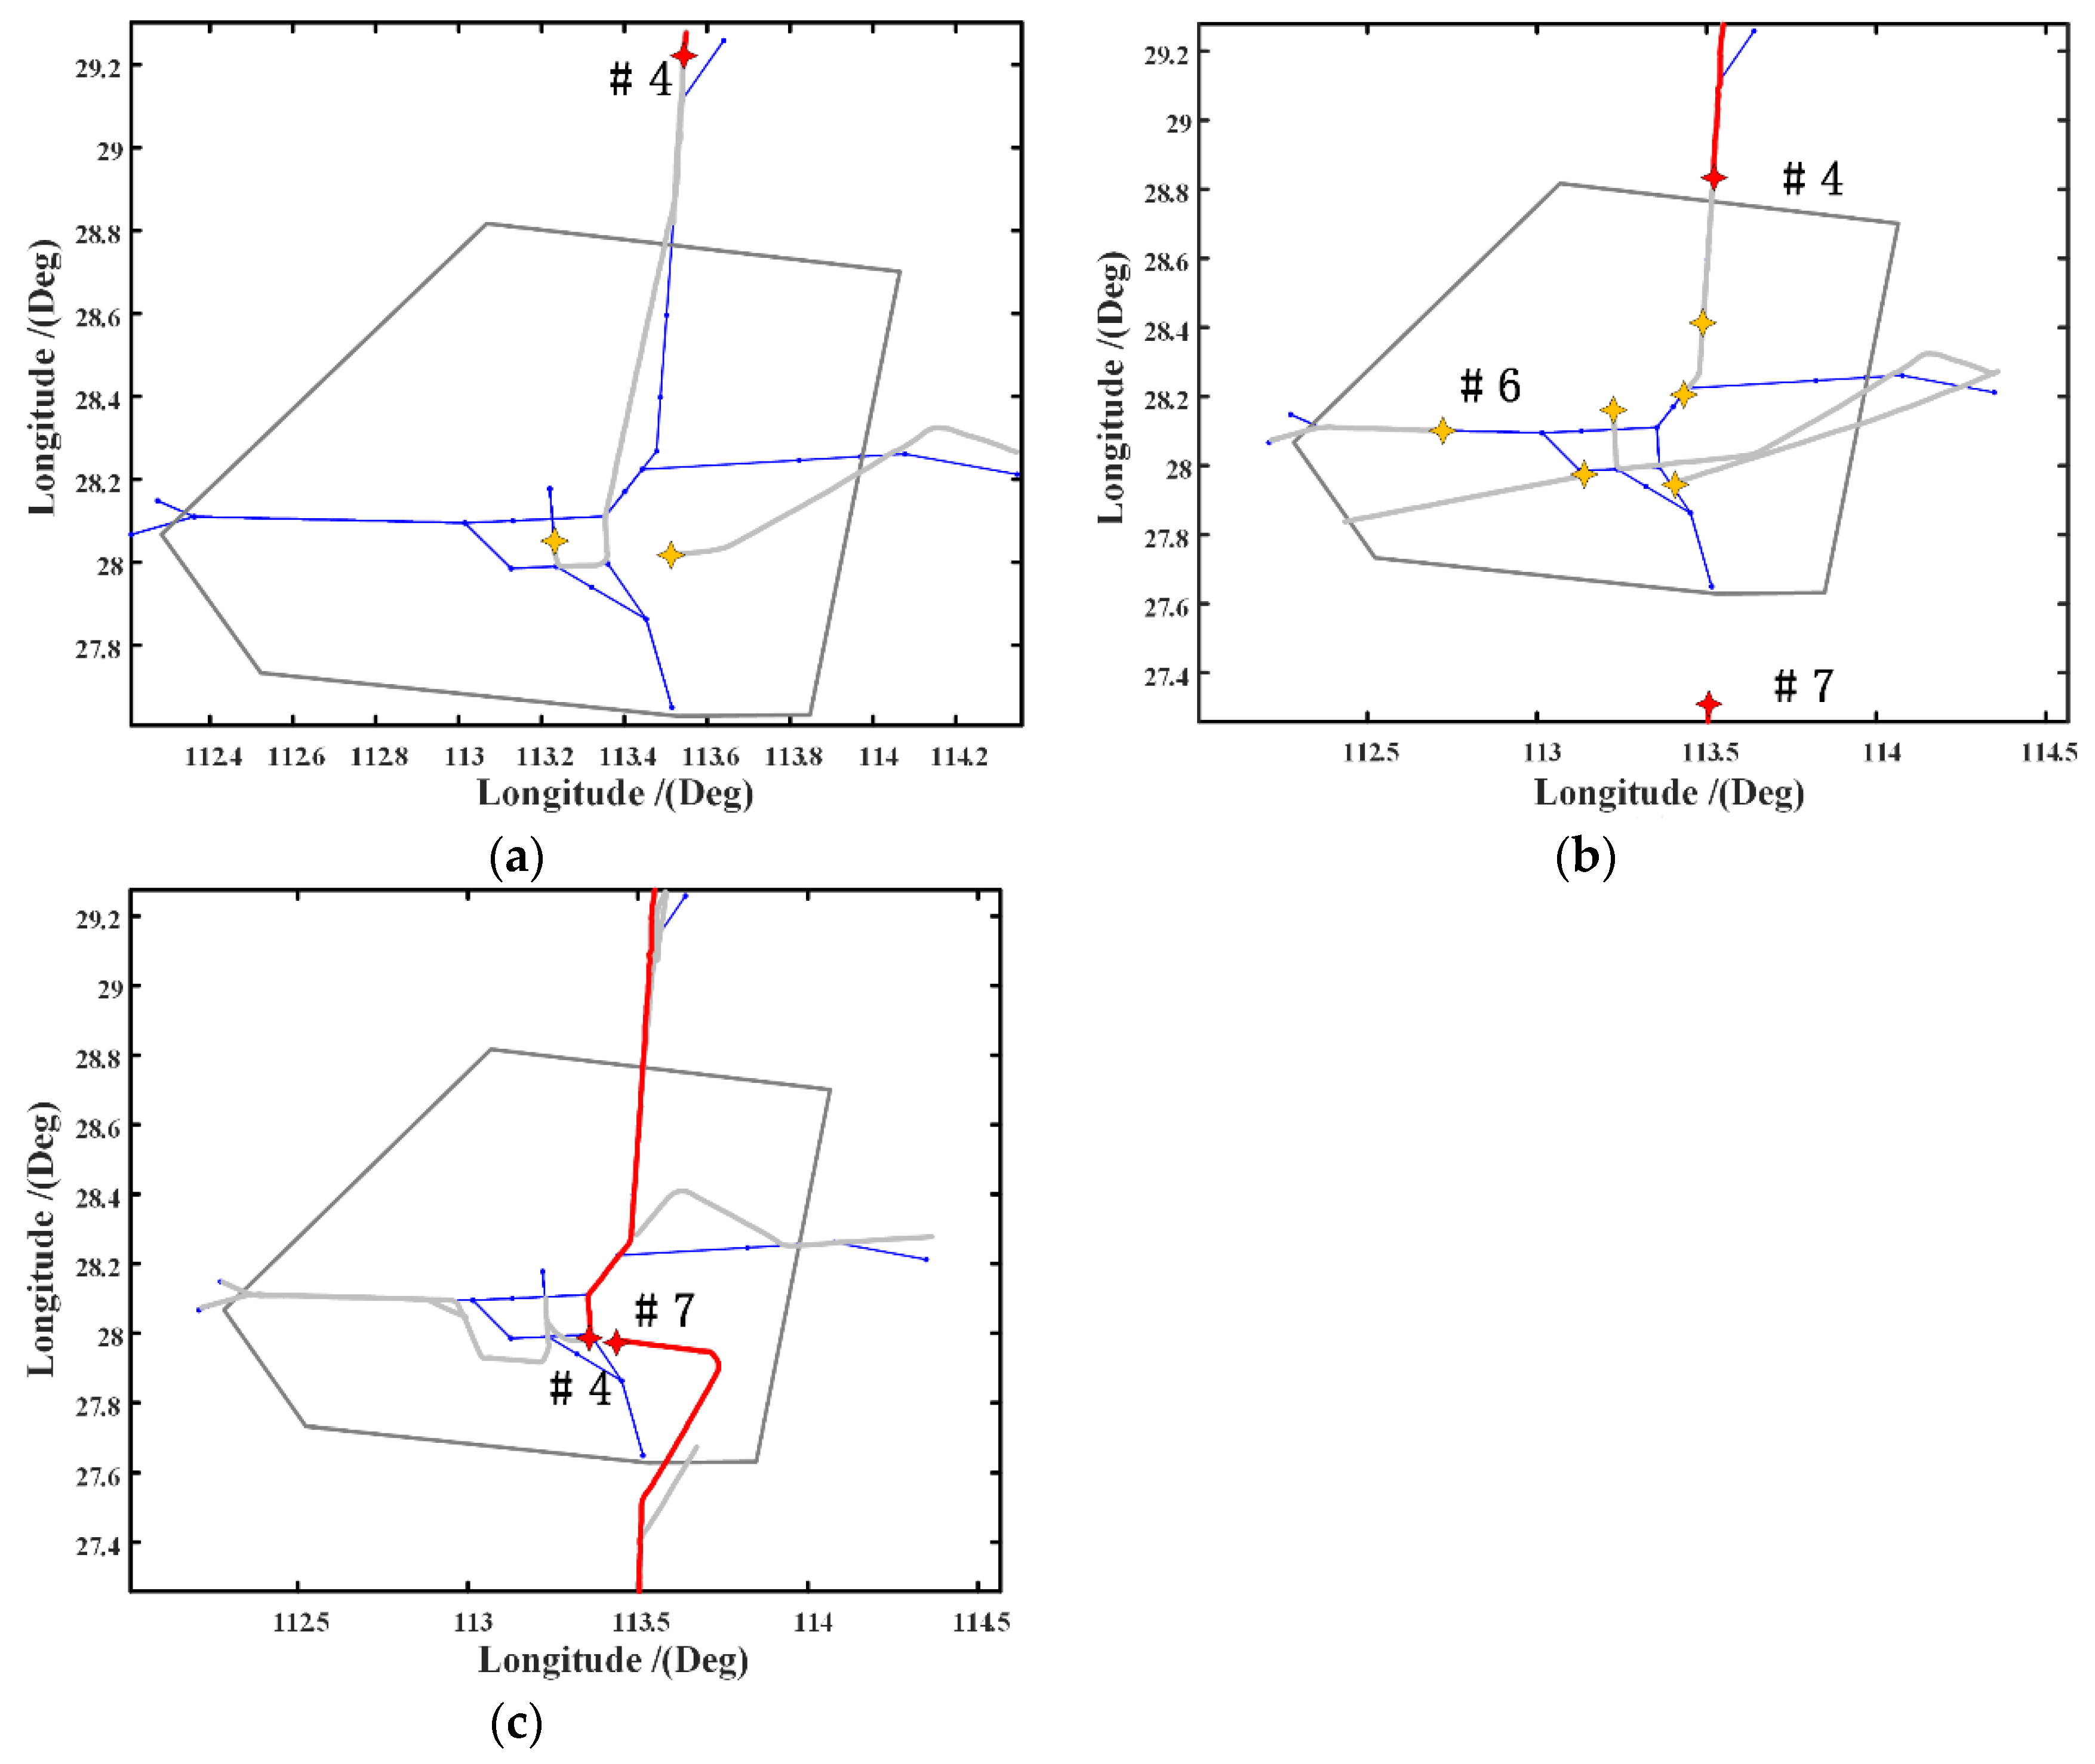
| ID | Flight ID | Entry Fix | Entry Time | Flight Time | ETA | ATA |
|---|---|---|---|---|---|---|
| AC#4 | “GCR6580” | DAPRO | 538 | 1243 | 1781 | 1841 |
| AC#6 | “KNA3019” | LLC | 759 | 1046 | 1805 | 1934 |
| AC#7 | “OKA2932” | LIG | 922 | 1172 | 2094 | 2020 |
Disclaimer/Publisher’s Note: The statements, opinions and data contained in all publications are solely those of the individual author(s) and contributor(s) and not of MDPI and/or the editor(s). MDPI and/or the editor(s) disclaim responsibility for any injury to people or property resulting from any ideas, methods, instructions or products referred to in the content. |
© 2023 by the authors. Licensee MDPI, Basel, Switzerland. This article is an open access article distributed under the terms and conditions of the Creative Commons Attribution (CC BY) license (https://creativecommons.org/licenses/by/4.0/).
Share and Cite
Du, Z.; Zhang, J.; Kang, B. A Data-Driven Method for Arrival Sequencing and Scheduling Problem. Aerospace 2023, 10, 62. https://doi.org/10.3390/aerospace10010062
Du Z, Zhang J, Kang B. A Data-Driven Method for Arrival Sequencing and Scheduling Problem. Aerospace. 2023; 10(1):62. https://doi.org/10.3390/aerospace10010062
Chicago/Turabian StyleDu, Zhuoming, Junfeng Zhang, and Bo Kang. 2023. "A Data-Driven Method for Arrival Sequencing and Scheduling Problem" Aerospace 10, no. 1: 62. https://doi.org/10.3390/aerospace10010062