1. Introduction
The U.S. Department of Defense (DoD) spends USD 78 B annually on maintenance of their substantial vehicle fleet [
1], opening up the opportunity for a significant return on investment from reducing maintenance costs and the time assets are unavailable for utilization. At the same time, according to a 2018 U.S. Government Accountability Office (GAO) report [
2], the three U.S. military services failed at meeting air readiness goals despite the money invested in maintaining them. Between fiscal years (FY) 2011 and 2016, the U.S. Air Force (USAF) and U.S. Navy (USN) generally did not meet their operational aircraft availability goals and support cost trends for 12 fixed-wing aircraft fleets varied with availability declining for six, availability falling short of goals for nine in 2016, operations costs increasing for five, and maintenance costs increasing for eight of the fleets.
Despite focused efforts, mission capable (MC) rates (a metric used to assess the health and readiness of military aircraft) and other related maintenance metrics trends have worsened since FY2015 for both services [
3]. For example, the USAF’s C-5M Galaxy strategic transport aircraft fleet has seen its MC rate drop from 68.1% in FY15 to 57.5% in FY2021, a 10.6 percentage-point drop and a full 17.5 points below the fleet’s goal of 75%. As a result, data such as the C-5M’s daily flight rate hovering around 21% during a four-month period in 2021 are in the news [
4]. The ability of the USAF and USN to complete aircraft maintenance directly affects air readiness. Maintenance delays compound requirements, aircraft reach inspection limits, and downtimes are forced versus planned. This causes missed operational taskings and extended downtime. An analysis of USAF fix rate data (which tracks speed of repair and the equipment maintainability of aircraft) from FY2015 to FY2020 found a downward trend in maintenance completion on selected aircraft within 8, 12, or 24 h windows [
3]. Efforts to reverse this trend through improved processes and scheduling optimization have the potential to save significantly on cost.
Extensive work has been published pertaining to maintenance scheduling at commercial airlines such as [
5,
6,
7], but distinct differences in military and civilian flight operations exist which renders existing work inapplicable without extensive effort. Additionally, we agree that the academic state of the art for military maintenance planning described in [
8,
9,
10] demonstrates adequate optimization approaches that could be used on the USAF’s C-5 fleet. While these methods focus on the scheduling of maintenance requirements for military aircraft, they assume the size of preventative maintenance packages (i.e., the number of tasks prescribed in a scheduled maintenance period) are fixed. We propose an improved optimization approach called Inspection Development Framework (IDF) to co-develop the sizing and scheduling of preventative maintenance requirements based on operational requirements, resource constraints, and maintenance efficiency goals.
In particular, military flying objectives revolve around combat readiness instead of cost savings and profitability, resulting in a different set of constraints and incentives. In order to be optimize its readiness to respond to external threats, military aviation focuses on maintaining continuous operational readiness, or the capability to perform all assigned present and future flight operations for a given budget, resulting in a difference set of objectives and constraints such as safety regulations, maintenance regulations, flight program requirements, personnel, and facility capacity and logistics support [
11].
This focus on readiness for a given budget has led military maintenance planning to utilize either phase or isochronal maintenance approaches where the aircraft is grounded for a period of days for an extensive series of inspections. Phase inspections occur upon an aircraft accruing a certain number of flying hours while isochronal inspections translate flying-hour utilization rates into calendar periods that are usually expressed in days [
12]. In the early 2000s, under pressure to increase availability and quality of aircraft and save time and money, the USAF transitioned aircraft from phase maintenance to isochronal [
13] while those aircraft fleets already using isochronal inspections, such as the C-5 Galaxy, optimized their approaches to reduce costs and promote scheduling predictability [
14,
15,
16]. While these changes did save money in the near-term, the data described above point to the need to balance this objective with more focus on combat readiness goals.
Additionally, in 2018, the U.S. released an updated National Defense Strategy [
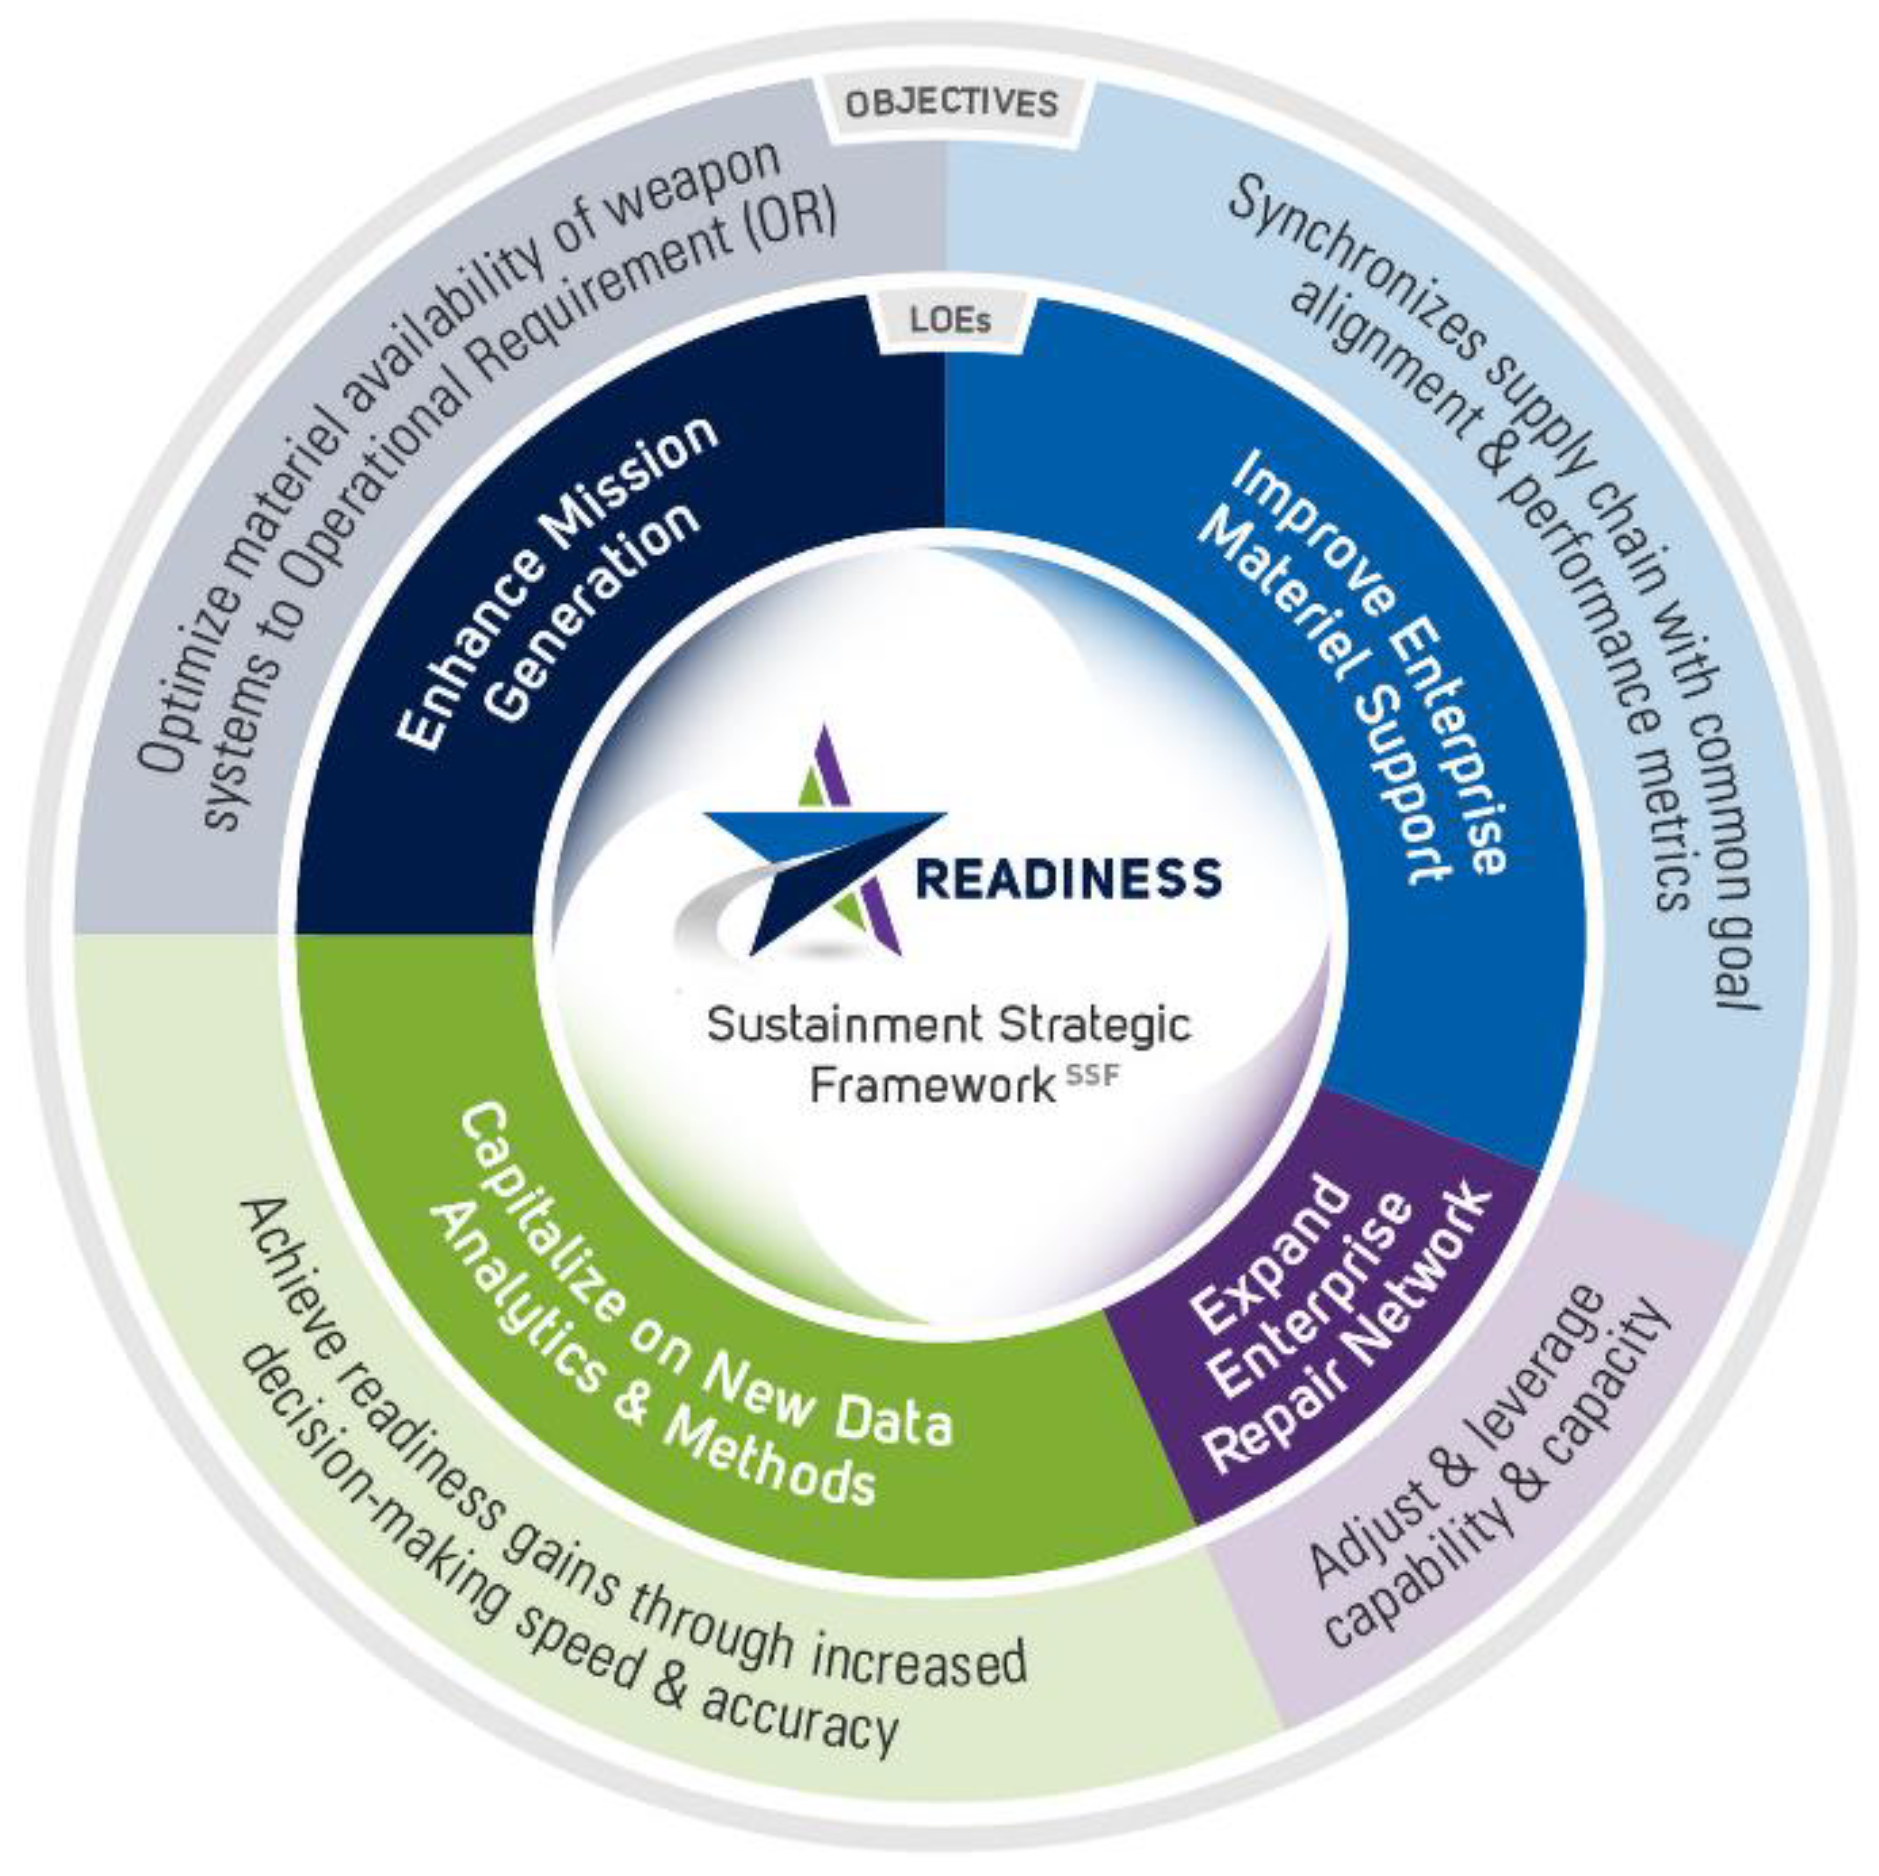
17] which described an increasing complex and volatile security environment defined by rapid technological change, challenges from adversaries in every operating domain, and the impact on current readiness from two decades of war. The strategy challenged the U.S. military to evolve innovative operational concepts that foster a culture of experimentation and calculated risk-taking and to develop an agile and resilient force posture and employment that includes dynamic force employment across the globe. In response, in 2019, the Secretary and Chief of Staff of the USAF approved the Sustainment Strategic Framework (SSF) which targets modern techniques in maintenance to reduce repair flow days and improve systems availability, productivity and cost control at operational units, and alignment and synchronization of supply chains [
18]. The Georgia Tech Research Institute (GTRI), in collaboration with Delta Air Lines’ maintenance, repair, and overhaul organization, Delta Technical Operations (DTO), directly supports execution of this framework by adapting commercial best practices to the USAF’s maintenance and reliability processes [
19]. One result of this work is the IDF advanced scheduling solution which seeks to balance the USAF’s earlier drive to reduce costs and promote scheduling predictability with the need to support current operational requirements.
In this study, we develop the IDF to optimize full maintenance supportability, improve trackability of work performed, and identify routine, repeatable, and mundane administrative tasks that can be automated to reduce the burden placed on front-line personnel. Additionally, a risk algorithm using existing data and supportability analysis demonstrates opportunity for additional maintenance efficiency improvements to achieve full supportability of tasks. We then perform a series of experiments within the USAF’s C-5 sustainment enterprise to investigate techniques for sizing, scheduling, and supportability of the maintenance work packages. Finally, the process is implemented in a production environment using a control and experiment methodology.
The paper is organized as follows:
Section 2 provides relevant background on IDF, focusing on the scheduling algorithm used in this study, and the design behind an initiative executed at two operational USAF bases to experiment with IDF.
Section 3 describes the results gained through these experiments and analyzes whether the data set is sufficient while
Section 4 extrapolates these results over a year and discusses the possible benefit to USAF aircraft readiness and utilization if these maintenance scheduling concepts are more widely adopted.
2. Materials and Methods
2.1. Inspection Development Framework (IDF) Concept
The IDF is a result of the research efforts between GTRI and DTO. In February 2019, the C-5 System Program Office (SPO) contracted with the two organizations to research and benchmark the C-5M sustainment enterprise to DTO. The study produced a gap analysis and technical roadmap identifying actions required for the C-5M community to adopt commercial best practices, improve readiness, and reduce costs. In July 2019, the team identified gaps in USAF processes and recommended actions to the C-5 SPO and SSF working groups which directly impacted the SSF’s objectives and lines of effort (LOE) show in
Figure 1. In October 2019, the USAF, GTRI and DTO performed follow-on research to include detailed definition and an implementation plan for a IDF concept introduced in the SSF under the “Optimize materiel availability of weapons systems to Operational Requirement (OR)” LOE [
18].
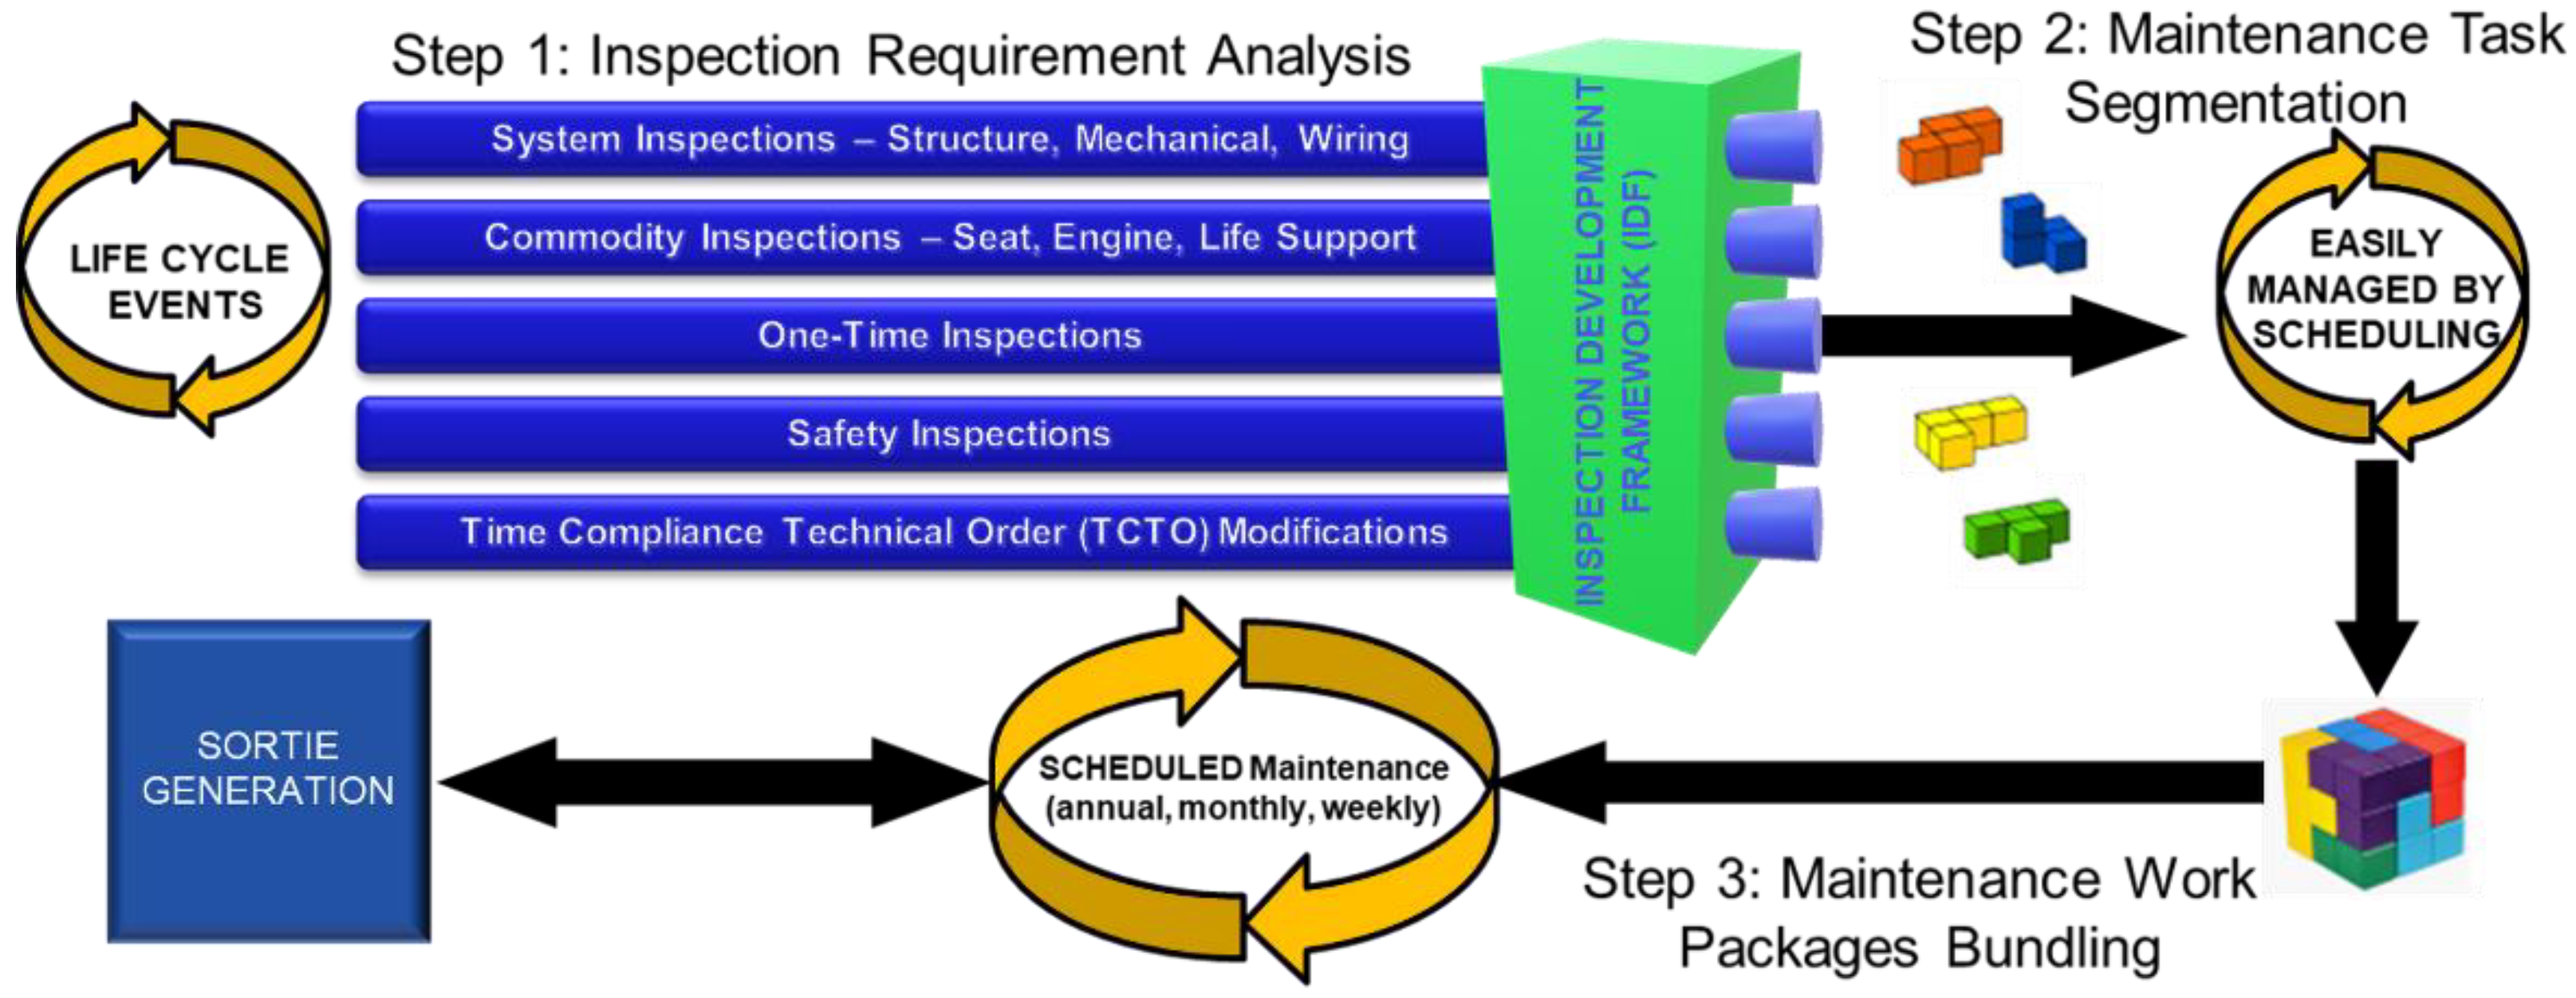
The IDF Model shown in
Figure 2 reflects the USAF’s desire to mirror commercial best practice in maintenance scheduling. Specially, IDF seeks to support maintenance schedulers and technicians in synchronizing maintenance packages with the operational mission’s demand signal in mind by optimizing the scheduling of inspections during maintenance opportunities to allow for better utilization of aircraft readiness [
18]. At its core, IDF identifies and divides inspections into smaller, more frequent inspections for better scheduling and utilization of maintenance opportunities. The process that IDF follows to accomplish this objective (as shown in
Figure 2) includes the following steps:
An airframe’s Maintenance Program is evaluated using Maintenance Steering Group-3 (MSG-3) industry standards to identify inspection requirements for systems (i.e., structures, mechanical subsystems, and wiring), commodities (i.e., seats and life vests), one-time and safety-linked actions, and work tied to Time Compliance Technical Order (TCTO) modifications.
These inspection requirements are segmented into smaller bundles of tasks known as work cards and analyzed to determine planning parameters such as total time to complete and personnel and materiel requirements. These parameters provide the level of detail required to manage maintenance scheduling more easily at the field and heavy maintenance organizations.
The work cards are bundled into maintenance work packages that can be used to complete the airframe’s scheduled maintenance requirements while allowing the aircraft under inspection to support flight operational needs.
While presented as a linear process, the IDF model acknowledges the iterative nature of its process using circular processes to represent the existing complexity of day-to-day maintenance operations while also focusing these efforts on supporting ever-changing sortie generation requirements.
Prognostic adjustment of scheduled maintenance requirements, risks, and execution times through the use of Condition-Based Maintenance (CBM) techniques is expected to further amplify the benefit of IDF. CBM better informs IDF’s approach to schedule maintenance during ground time opportunities through activities such as task removal/substitution, interval escalation/de-escalation, and critical path/chain analysis. Improving the predictability of maintenance requirements using the evidence provided by CBM data feeds enables the joint optimization of maintenance and flight planning across functional areas such as engineering and production.
2.2. Applying IDF to the C-5 Home Station Checks (HSC)
In order to explore the efficacy of the IDF, we applied the process describe in
Figure 2 to the C-5′s Maintenance Program. We first needed to gain an understanding of the C-5′s inspection requirements. For the C-5 airframe, scheduled maintenance is done in the isochronal manner on an eight-year, or 96-month, cycle (as described in
Table 1). This cycle revolves around a single Programmed Depot Maintenance (PDM) deep overhaul inspection conducted at Robins Air Force Base (AFB) with Major and Minor Isochronal Inspections (ISOs) and Home Station Checks (HSC) performed at operational bases across the USAF. Major/Minor ISO inspections are performed every 16 months with two Minor ISO inspections leading up to a Major ISO halfway through the cycle. HSCs are the most common inspection performed on the C-5 with two scheduled between each Major/Minor ISO.
Once we gained an understanding of the C-5 Maintenance Program, we coordinated with the C-5 SPO, which manages the program, to determine their most constrained maintenance process in order to test the efficacy of the IDF process. This analysis identified the airframe’s landing gear inspections as a good candidate process. However, after the first iteration of the IDF process, it was determined that the number of inspection tasks were statistically too small of an effort to test the full potential of the IDF process. Thus, the team shifted to work the full HSC process completed at the field-level (which includes these land gear inspections).
Once we decided to focus our efforts on the C-5′s HSC, the team moved to the second step of the IDF process, segmenting the HSC inspection into smaller bundles of tasks referred to as work cards. The team met with C-5 front-line maintainers at Dover and Travis AFBs to segment the HSC inspection technical order into approximately 134 individual work cards. Each card was analyzed to determine:
Total time required to complete the work card;
Number of people and the skill level, including training and certifications, needed to complete each individual maintenance task;
Ground equipment, tools, hangar space requirements;
Any required material parts and unique characteristics including hazardous material, consumables, and the quantity of the material needed.
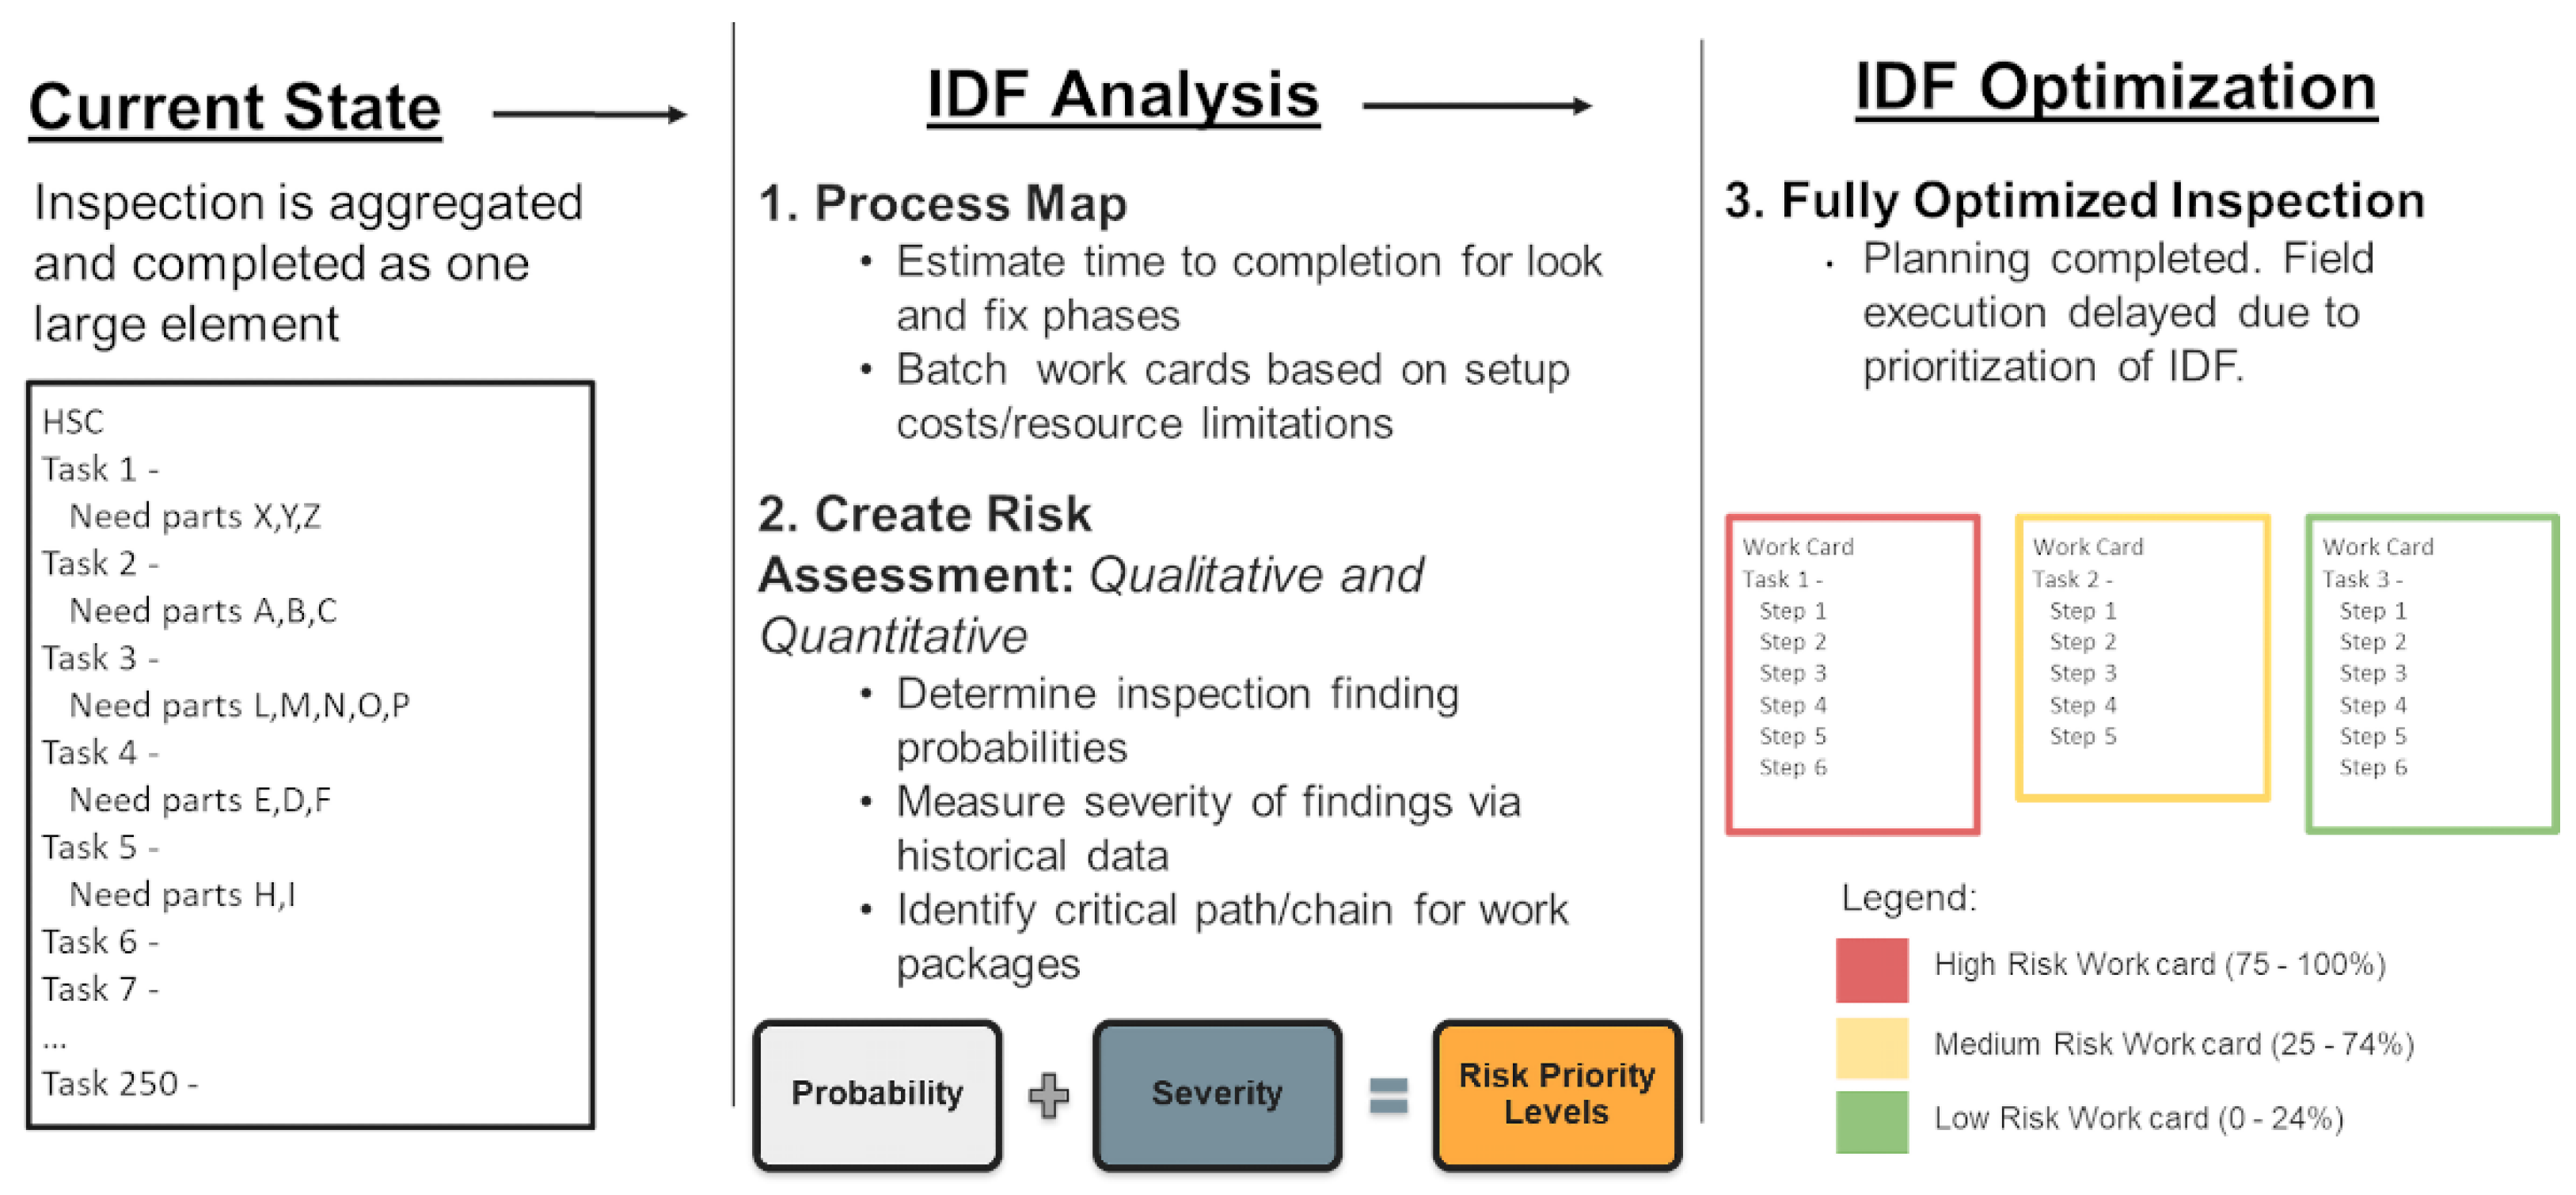
Additionally, the cards were assessed for the risk of additional work being required as shown in
Figure 3. This risk was defined as the probability of an inspection finding requiring additional work and the severity of the finding as defined by the additional work’s repair time. Individual tasks were then analyzed to calculate probability of a finding and mean and median time to repair were calculated. This analysis allowed development of a risk matrix using one to five scales where one axis described the probability of a finding on a one to five scale with one being a probability between 75% and 100% and five being a probability of 0% and the other axis showed overall severity of the finding through the time to complete an item with one being over 24 h to fix and five requiring no time to fix. In order to derive risk for the new work cards, maintainers at Dover and Travis AFBs were provided the matrix and individual task data and asked to estimate the risk for each work card based on the calculated task data and their experience to complete the matrix.
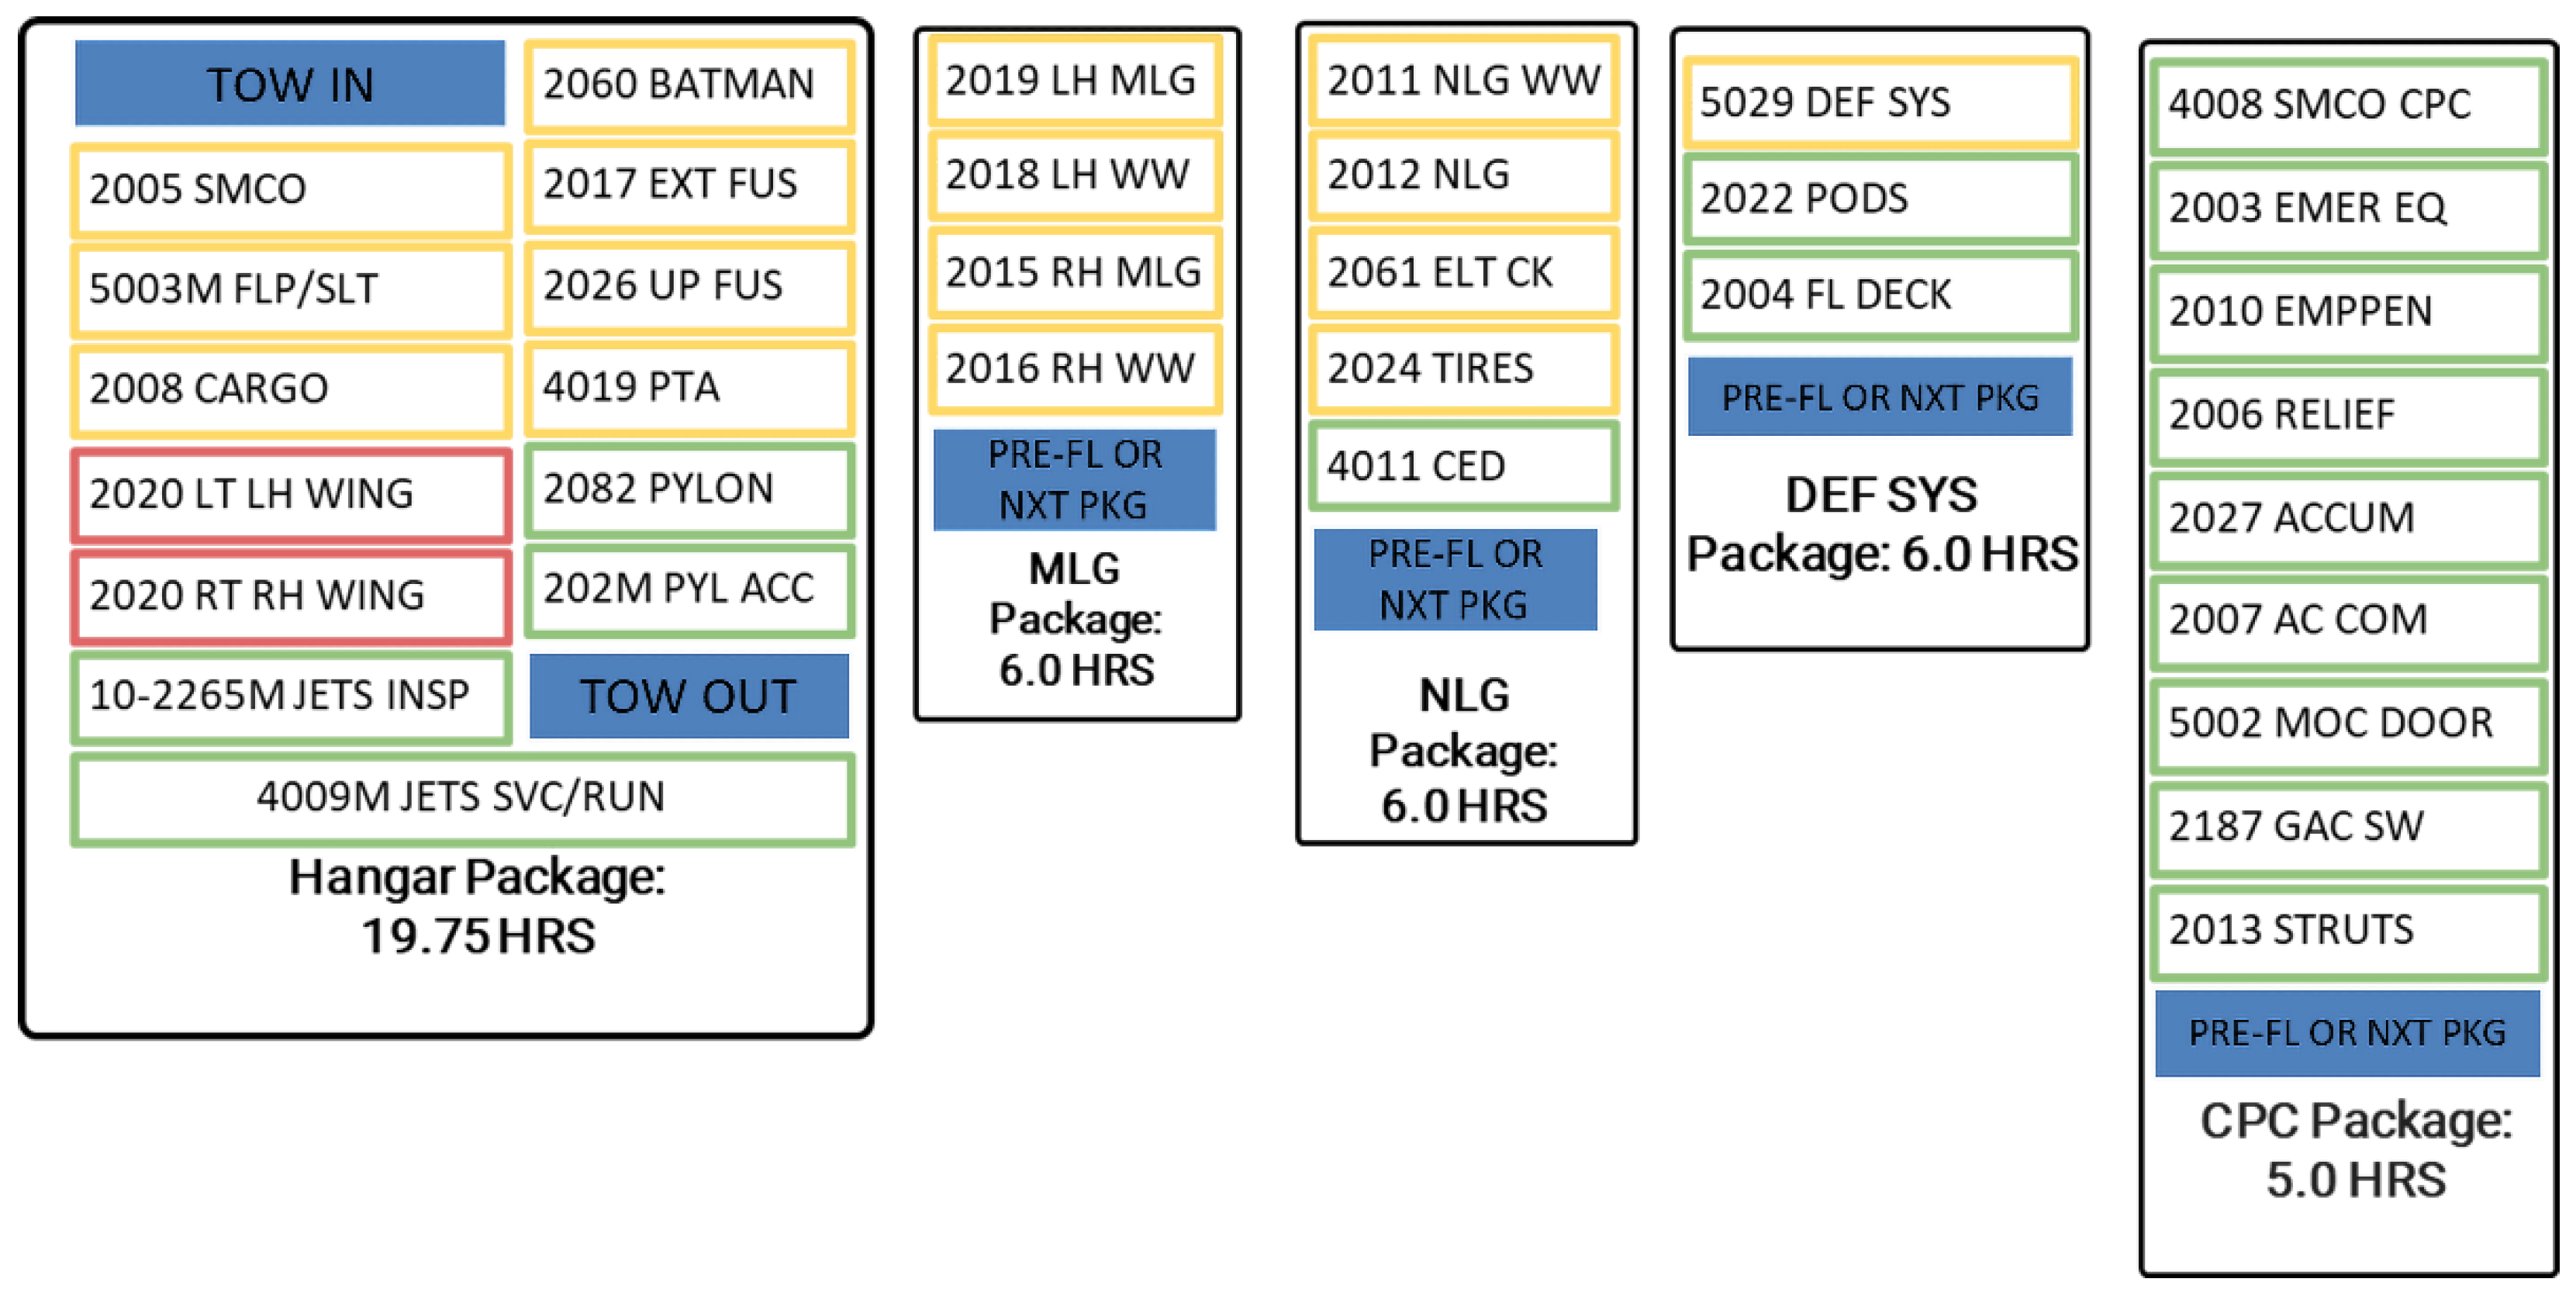
Once we were done with segmenting the HSC into work cards, we moved to the final IDF step where we bundled work cards into work packages. The team analyzed USAF maintenance operations to determine constraints and available capacity (where capacity is defined as the resources required to finish a maintenance task). A traditional C-5 HSC has an exclusive set of blocked days with the aircraft removed from the flying schedule for the entirety of the inspection. We reconstruct the HSC’s workflow to perform the new work package and to balance risk factors, meet local demand, and match capacity. The resulting work packages, such as the examples shown in
Figure 4, were targeted to provide increased operational flexibility, focus, and opportunities for continuous process improvement as well as better fidelity for data analysis.
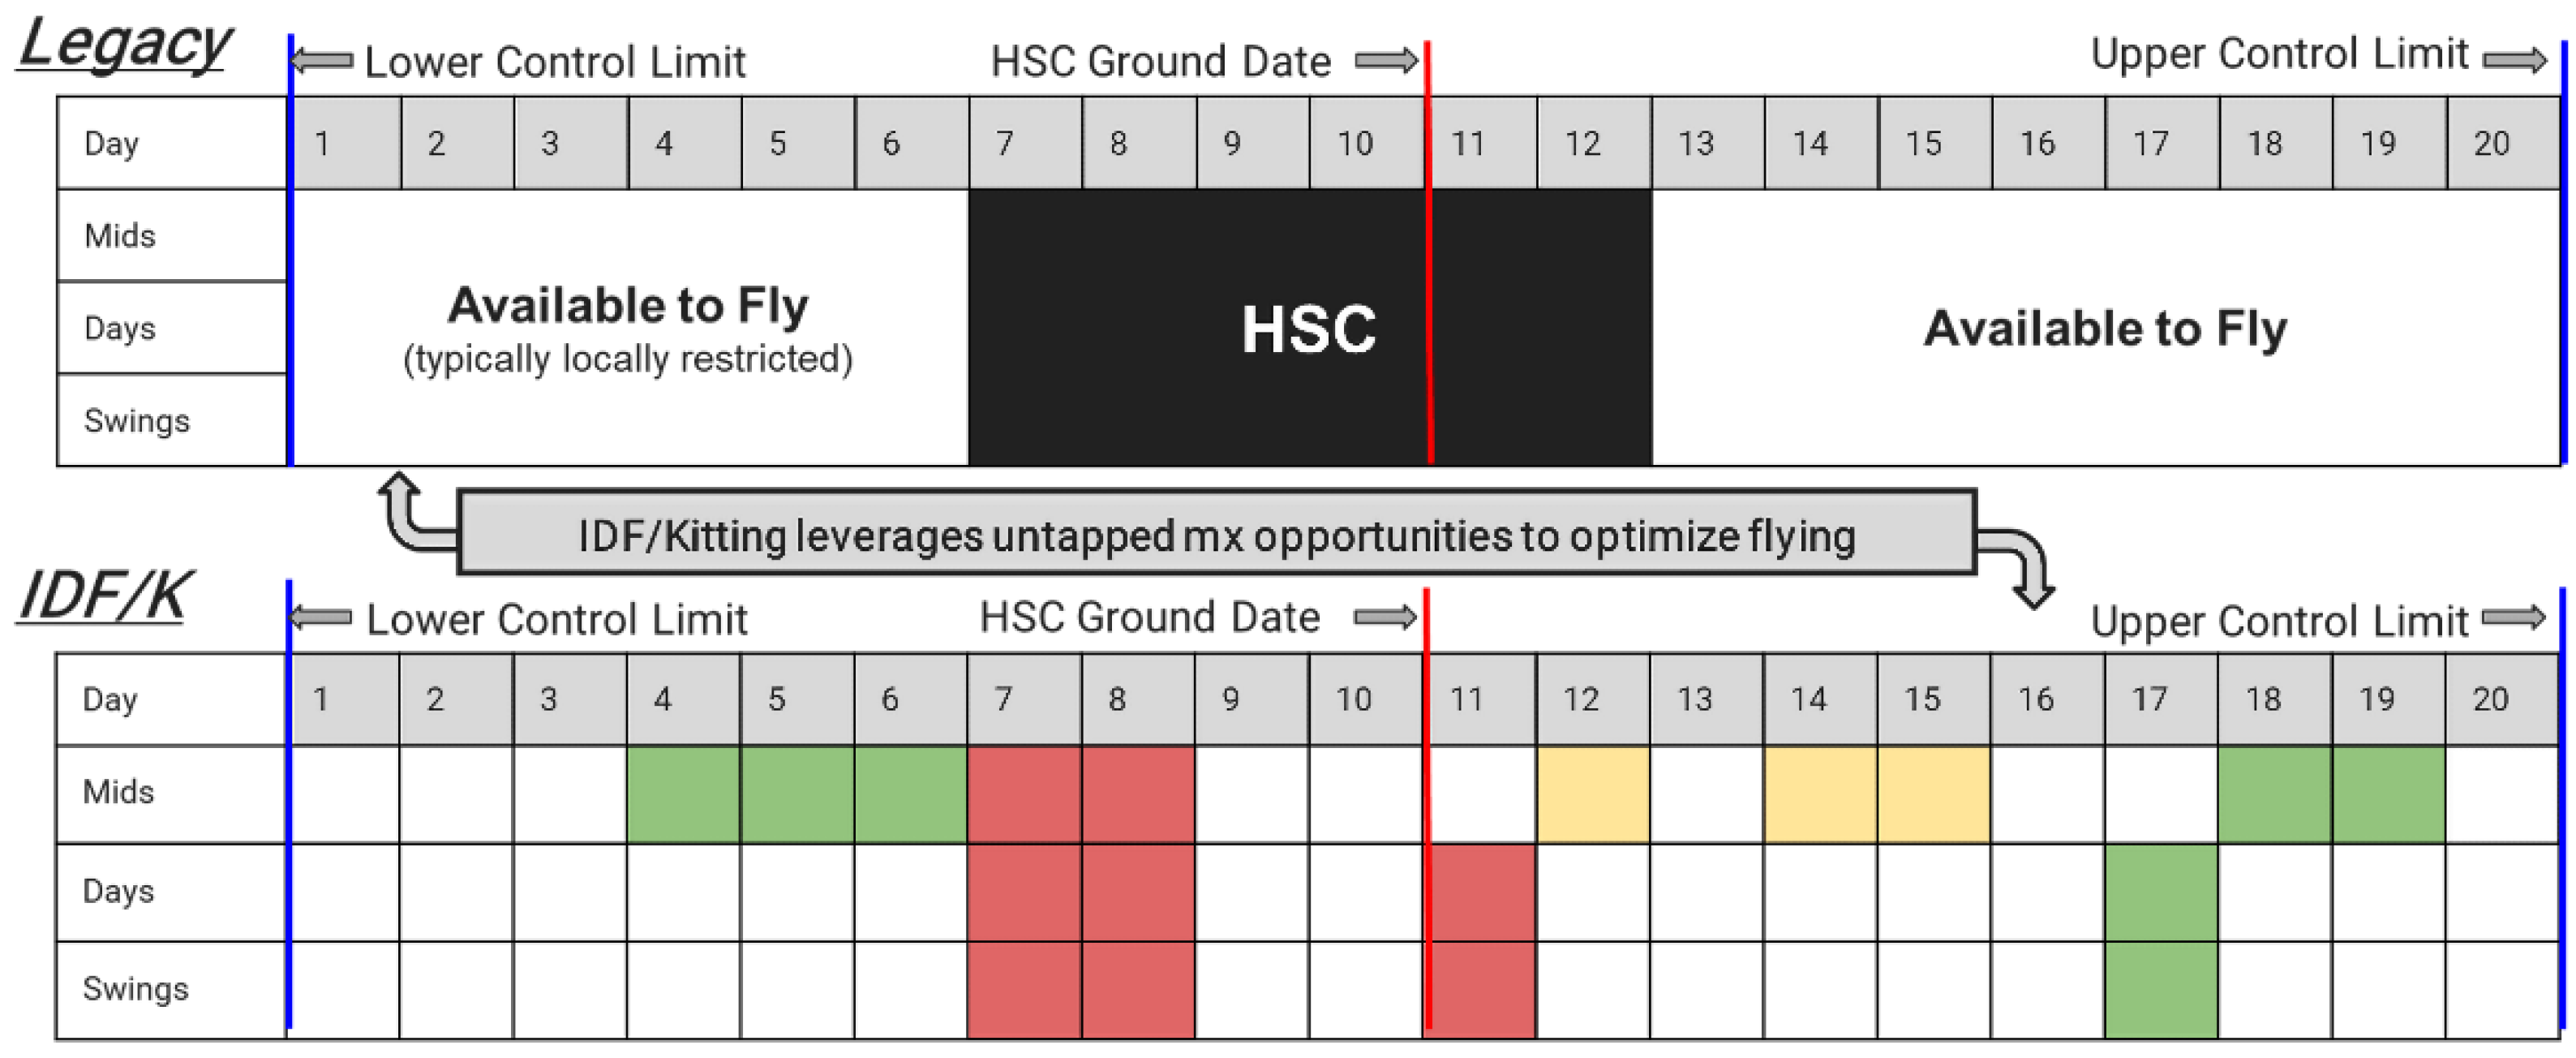
The resulting experimental HSCs were significantly different than traditional C-5M HSCs, as shown in the bottom and top of
Figure 5 respectively. While a traditional C-5M HSC would complete maintenance within a 20-day window determined by the due date (red line) plus or minus 10 days (blue lines indicating upper/lower control limits), experimental HSCs placed newly built maintenance packages, risk rated by color, onto the calendar within the 20-day window. The aircraft was then coordinated with the Production Supervisor and HSC Crew Chief for the timing of the flying versus maintenance inspection by shift (i.e., mid versus day versus swing shift).
2.3. IDF Pathfinder Methodology
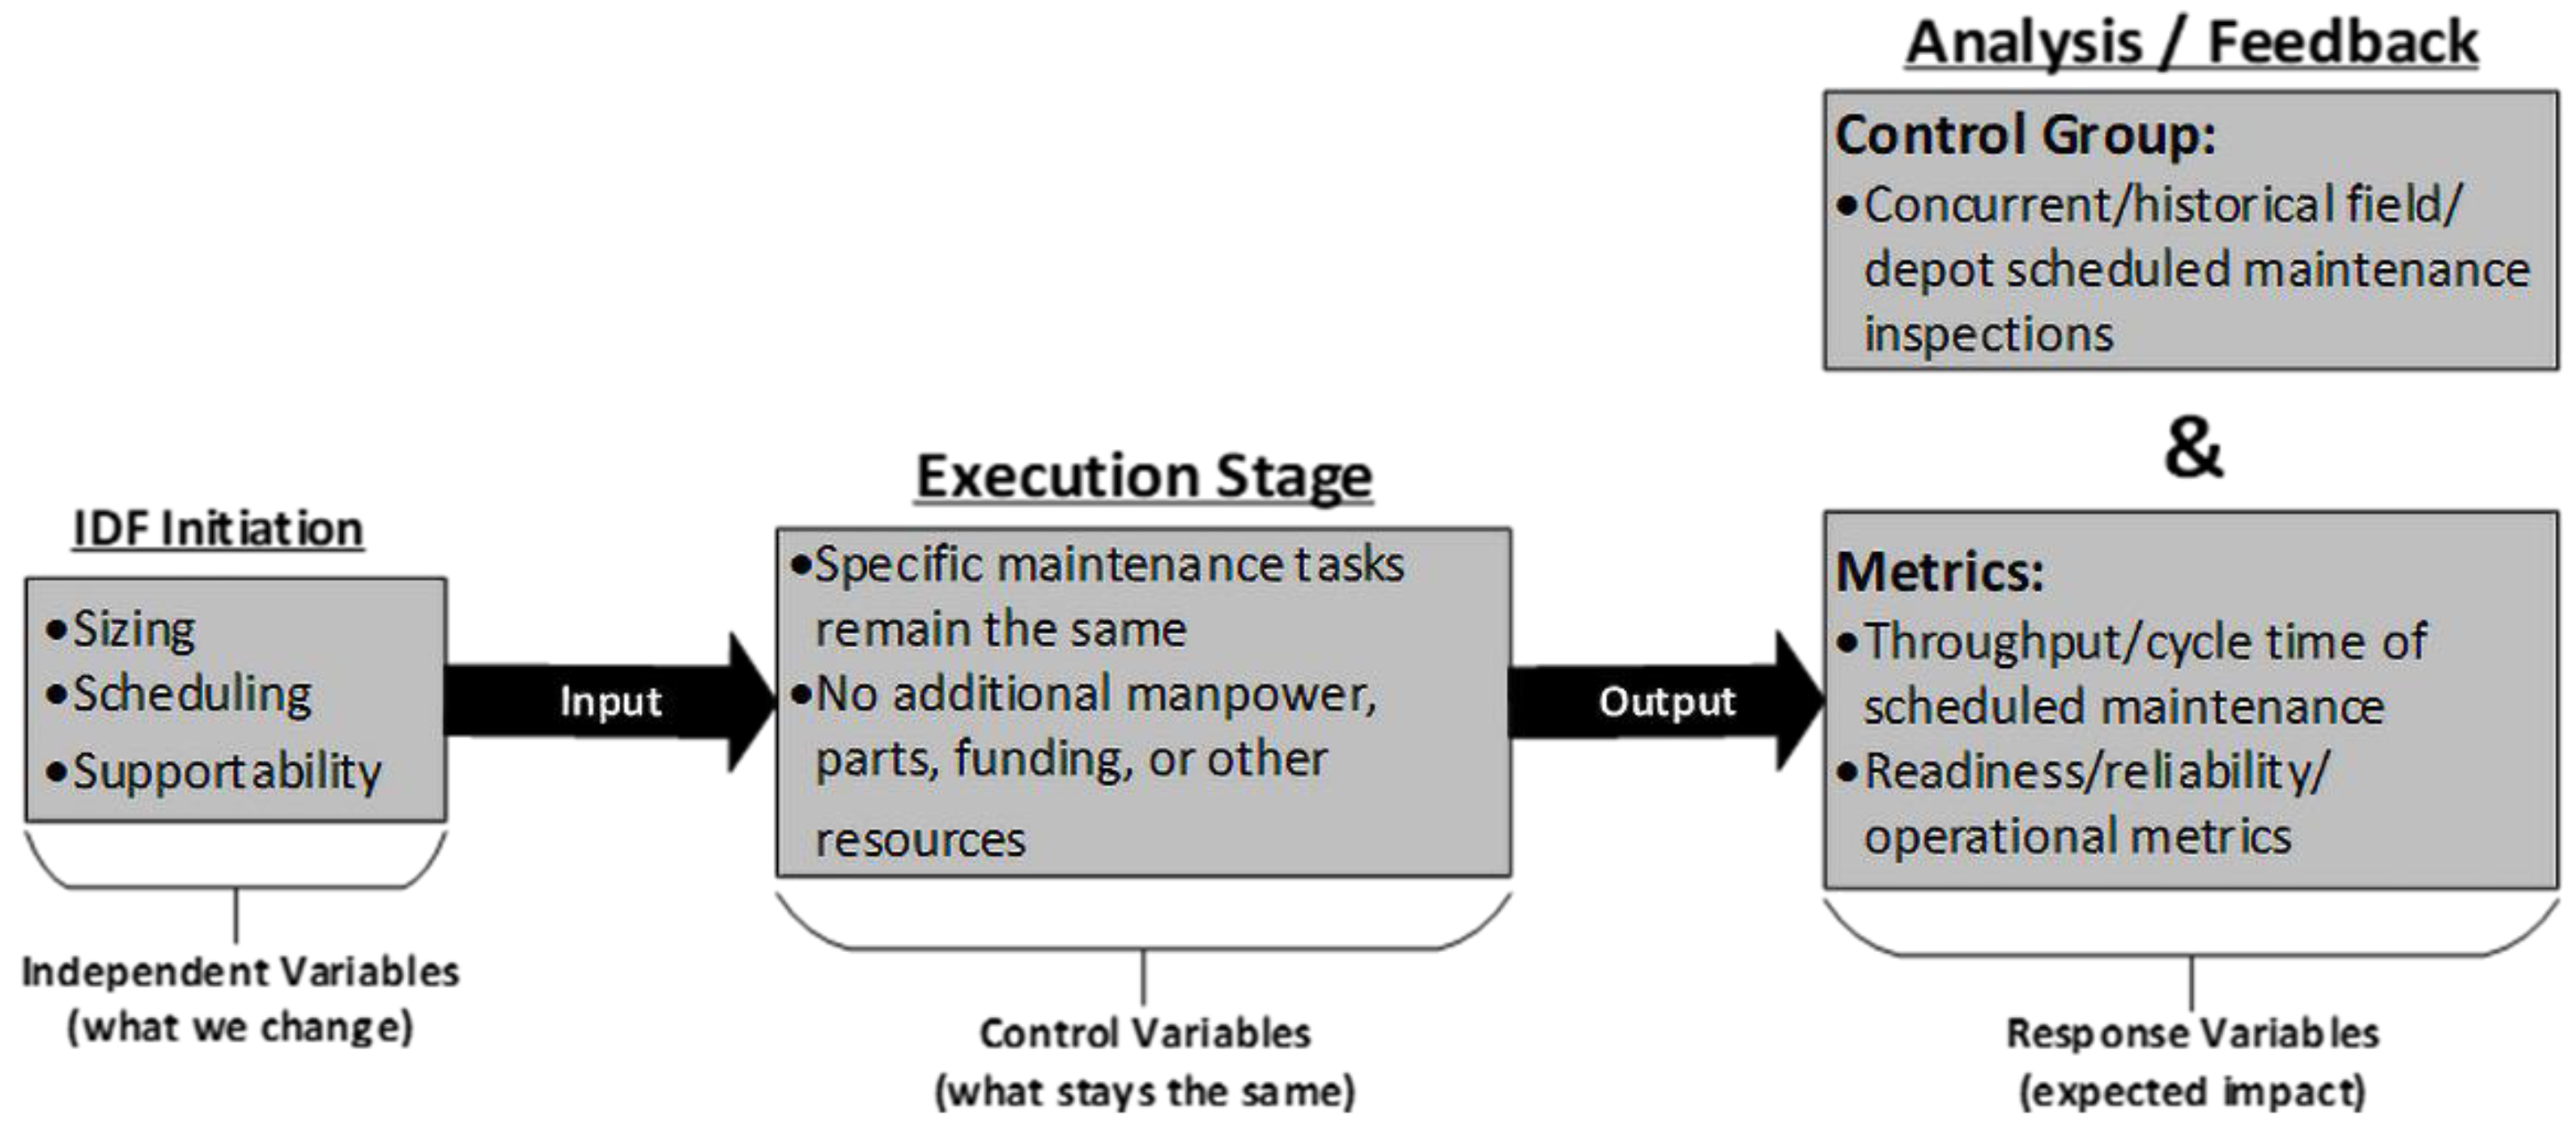
A series of experiments, shown in
Figure 6, was designed for the IDF pathfinder to identify, control, and measure the variables involved between the treatment and control groups. The hypothesis tests completed in the pathfinder attempted to confirm the notion that the commercial best practice of right-sizing maintenance tasks using the IDF approach would increase utilization rates. Specifically, the team proposed to segment and decompose the C-5′s HSC as a means to more closely replicate commercial airline maintenance operations and achieve better performance for the C-5 fleet. Independent variables changed in the pathfinder would include the sizing, scheduling, and supportability of maintenance packages using IDF (i.e., number of maintenance tasks planned for one period/package, when they are planned to be performed, and resource availability to complete the maintenance). During the pathfinder’s Execution Stage, control variables held constant include the specific maintenance tasks listed in the C-5 work cards comprising the work packages. During the Analysis/Feedback phase, response variables measured in the experimental group include performance metrics related to the velocity of the scheduled maintenance tasks and other readiness, reliability, and operational metrics. These variables are compared to the control group involving concurrent and historical scheduled maintenance inspections in the field.
The goal of IDF is to subordinate scheduled maintenance to the flying schedule, allowing increased scheduling flexibility while improving the ability to execute mission requirements. The IDF pathfinder therefore tested the multiple hypotheses, described in
Table 2, to independently measure the benefit, cost, and the cost–benefit ratio to ascertain the magnitude of impact IDF has on maintenance operations. Firstly, it was hypothesized that the total number of HSC scheduled maintenance hours would stay relatively the same. Since a traditional C-5 HSC is completed in a sequential five-day period during a 20-day window with no flying opportunities occurring, data was collected on Total Non-Mission Capable Maintenance Scheduled (TNMCMS) hours, defined as HSC maintenance hours which may or may not have utilized the full 20-day window. Additionally, the hypothesis suggested that sorties and number of hours flown within the 20-day time window would increase for the experimental HSC aircraft. These metrics were obtained from the initial induction of the aircraft into HSC plus 20 days.
A few different software capture methods were necessary to obtain the requisite data to analyze the experiment. Internally, both the Core Automated Maintenance System for Mobility (CAMS-FM/G081) and Reliability and Maintainability Information System (REMIS) capture maintenance and reliability information for individual aircraft. Global Decision Support System 2 (GDSS2) and Readiness Driven Allocation Process (RDAP) were used to acquire flight data and tasking necessities, respectively. Other data that are not currently measured in the internal USAF databases such as work-card detail, maintenance and flying schedules, and qualitative risk assessments was collected manually using Excel. Completing these Excel documents required consistent communication between front-line maintenance technicians, schedulers, and production superintendents.
Experimental methods and data collection varied at the two bases with each base putting an emphasis on individual parts of the pathfinder based on their willingness to accept risk and their interpretation of maintenance policies. These differing approaches expressed themselves within the data collection and output analysis. For example, one base may have had extra tows or preflight inspections that they completed in order to facilitate flying and maintenance requirements. Although not necessarily ideal, these implementations allowed some of the metrics to be more streamlined and a better case study for individual aspects of IDF/kitting.
2.4. T-test Assumptions
The following assumptions were made to ensure the feasibility of using a paired t-test to analyze the experiment:
It is reasonable to use the previous HSC for each experimental group as the control group for the paired t-test. The alternative—looking at the aircraft that completed traditional HSCs alongside the aircraft that completed IDF HSCs within relatively the same time frame—would not control for the variation seen across aircraft in the same fleet and reasonable pairs may not always be evident.
The last traditional HSC for the experimental aircraft is the most similar interval away from PDM as the experimental HSC. There is not enough data for each experimental aircraft at the same point in the MSG-3 cycle to compare to. Some aircraft have three to four years’ worth of data and each cycle is eight years.
All aircraft in each fleet fly the same general flying profile. Flying more and/or flying strenuously may correspondingly affect maintenance metrics. This assumption allows aircraft to be reasonably be compared to their counterparts within the same statistical distribution.
The metrics corresponding to each experimental aircraft’s previous HSC are representative of all previous HSCs completed for that aircraft. Without this assumption, there is no evident control partner for the experimental aircraft.
Both bases operate independently using the same guidelines and are constrained under relatively similar operating procedures and cultures. This assumption is needed to perform the t-test together rather than a t-test for both bases.
Each base has full supportability (i.e., parts, experience, and resources), and the supportability is equal at both bases. Otherwise, supportability would need to be another variable, yet it could not be tracked sufficiently.
Manning was consistent within the experiment. This is to say that manning did not vary from one day to the next during the HSC. Manning was another untraceable variable, which could directly affect the metrics from each experiment.
Possession of the aircraft between the flight line and the HSC team was the same at both bases. Any transfer of the aircraft between the teams at the bases would be extra administrative burden that would not be accounted for within in the data.
3. Results
This section presents the results that were obtained from IDF pathfinder experiments at Travis and Dover AFBs from January to July 2021. First, data was collected from 10 experimental IDF inspections to investigate optimizing the sizing, scheduling, and supportability of the HSC work package. Then, the data was checked to successfully verify that a paired
t-test was adequate to test the effectiveness of the pathfinder experiment before separate hypothesis tests were performed for each metric described in
Table 1.
In order to operationalize IDF and gather data needed to scale the approach across multiple aircraft fleets, the USAF decided to run a series of experiments on the C-5 enterprise. Referred to as the IDF Pathfinder, these experiments entailed GTRI and DTO subject matter experts working with representatives from the following USAF organizations:
436th Airlift Wing at Dover Air Force Base (AFB);
349th Air Mobility Wing at Travis AFB;
Air Mobility Command;
C-5 SPO;
Warner Robins Air Logistics Complex;
Defense Logistics Agency;
and several other cross-functional sustainment enterprise representatives to design detailed solutions for applying IDF.
3.1. Data Collection
Each base was asked to perform experimental HSCs on five of their aircraft in order to the achieve the necessary sample size of 10 experimental HSCs needed to begin hypothesis testing and to establish the possibility of statistical significance. While increasing the total number of experimental aircraft would have given better experimental metric measures and variabilities compared to the control group, this sample size was sufficient to begin analysis of the experiments with a limited level of confidence. Additionally, to limit individual aircraft and fleet-wide variation, the experiment was run using each aircraft’s previous traditional HSC as its control. Choosing the most recent prior HSC to the experimental HSC permitted the assumption that the maintenance check was representative of all other HSCs historically performed on that aircraft. The resulting experimental data set was collected between February and July of 2021 as described in
Table 3. The control group consists of only nine unique vectors of data points since the experiment was performed twice on the Dover AFB aircraft 3285. The previous control HSC prior to the first IDF HSC for aircraft 3285 was counted twice in the analysis of the control group.
3.2. Data Analysis
Once the data collection phase was completed, the data was checked to verify that a paired t-test was adequate to test the effectiveness of the experiment. There are four main assumptions for the use of a paired t-test: the dependent variable is continuous, the observations are independent of one another, the dependent variable is approximately normally distributed, and the dependent variable does not contain any outliers. This analysis found that these assumptions were relatively and reasonably met since:
Each metric is measured on a continuous scale or is a ratio with a continuous number;
The observations are in fact all independent of one another except for aircraft 3285 being repeated twice at Dover AFB (unfortunately, with the lack of experimental samples, this assumption cannot be relaxed to account for this artifact, and it manifests itself as a limitation of the data);
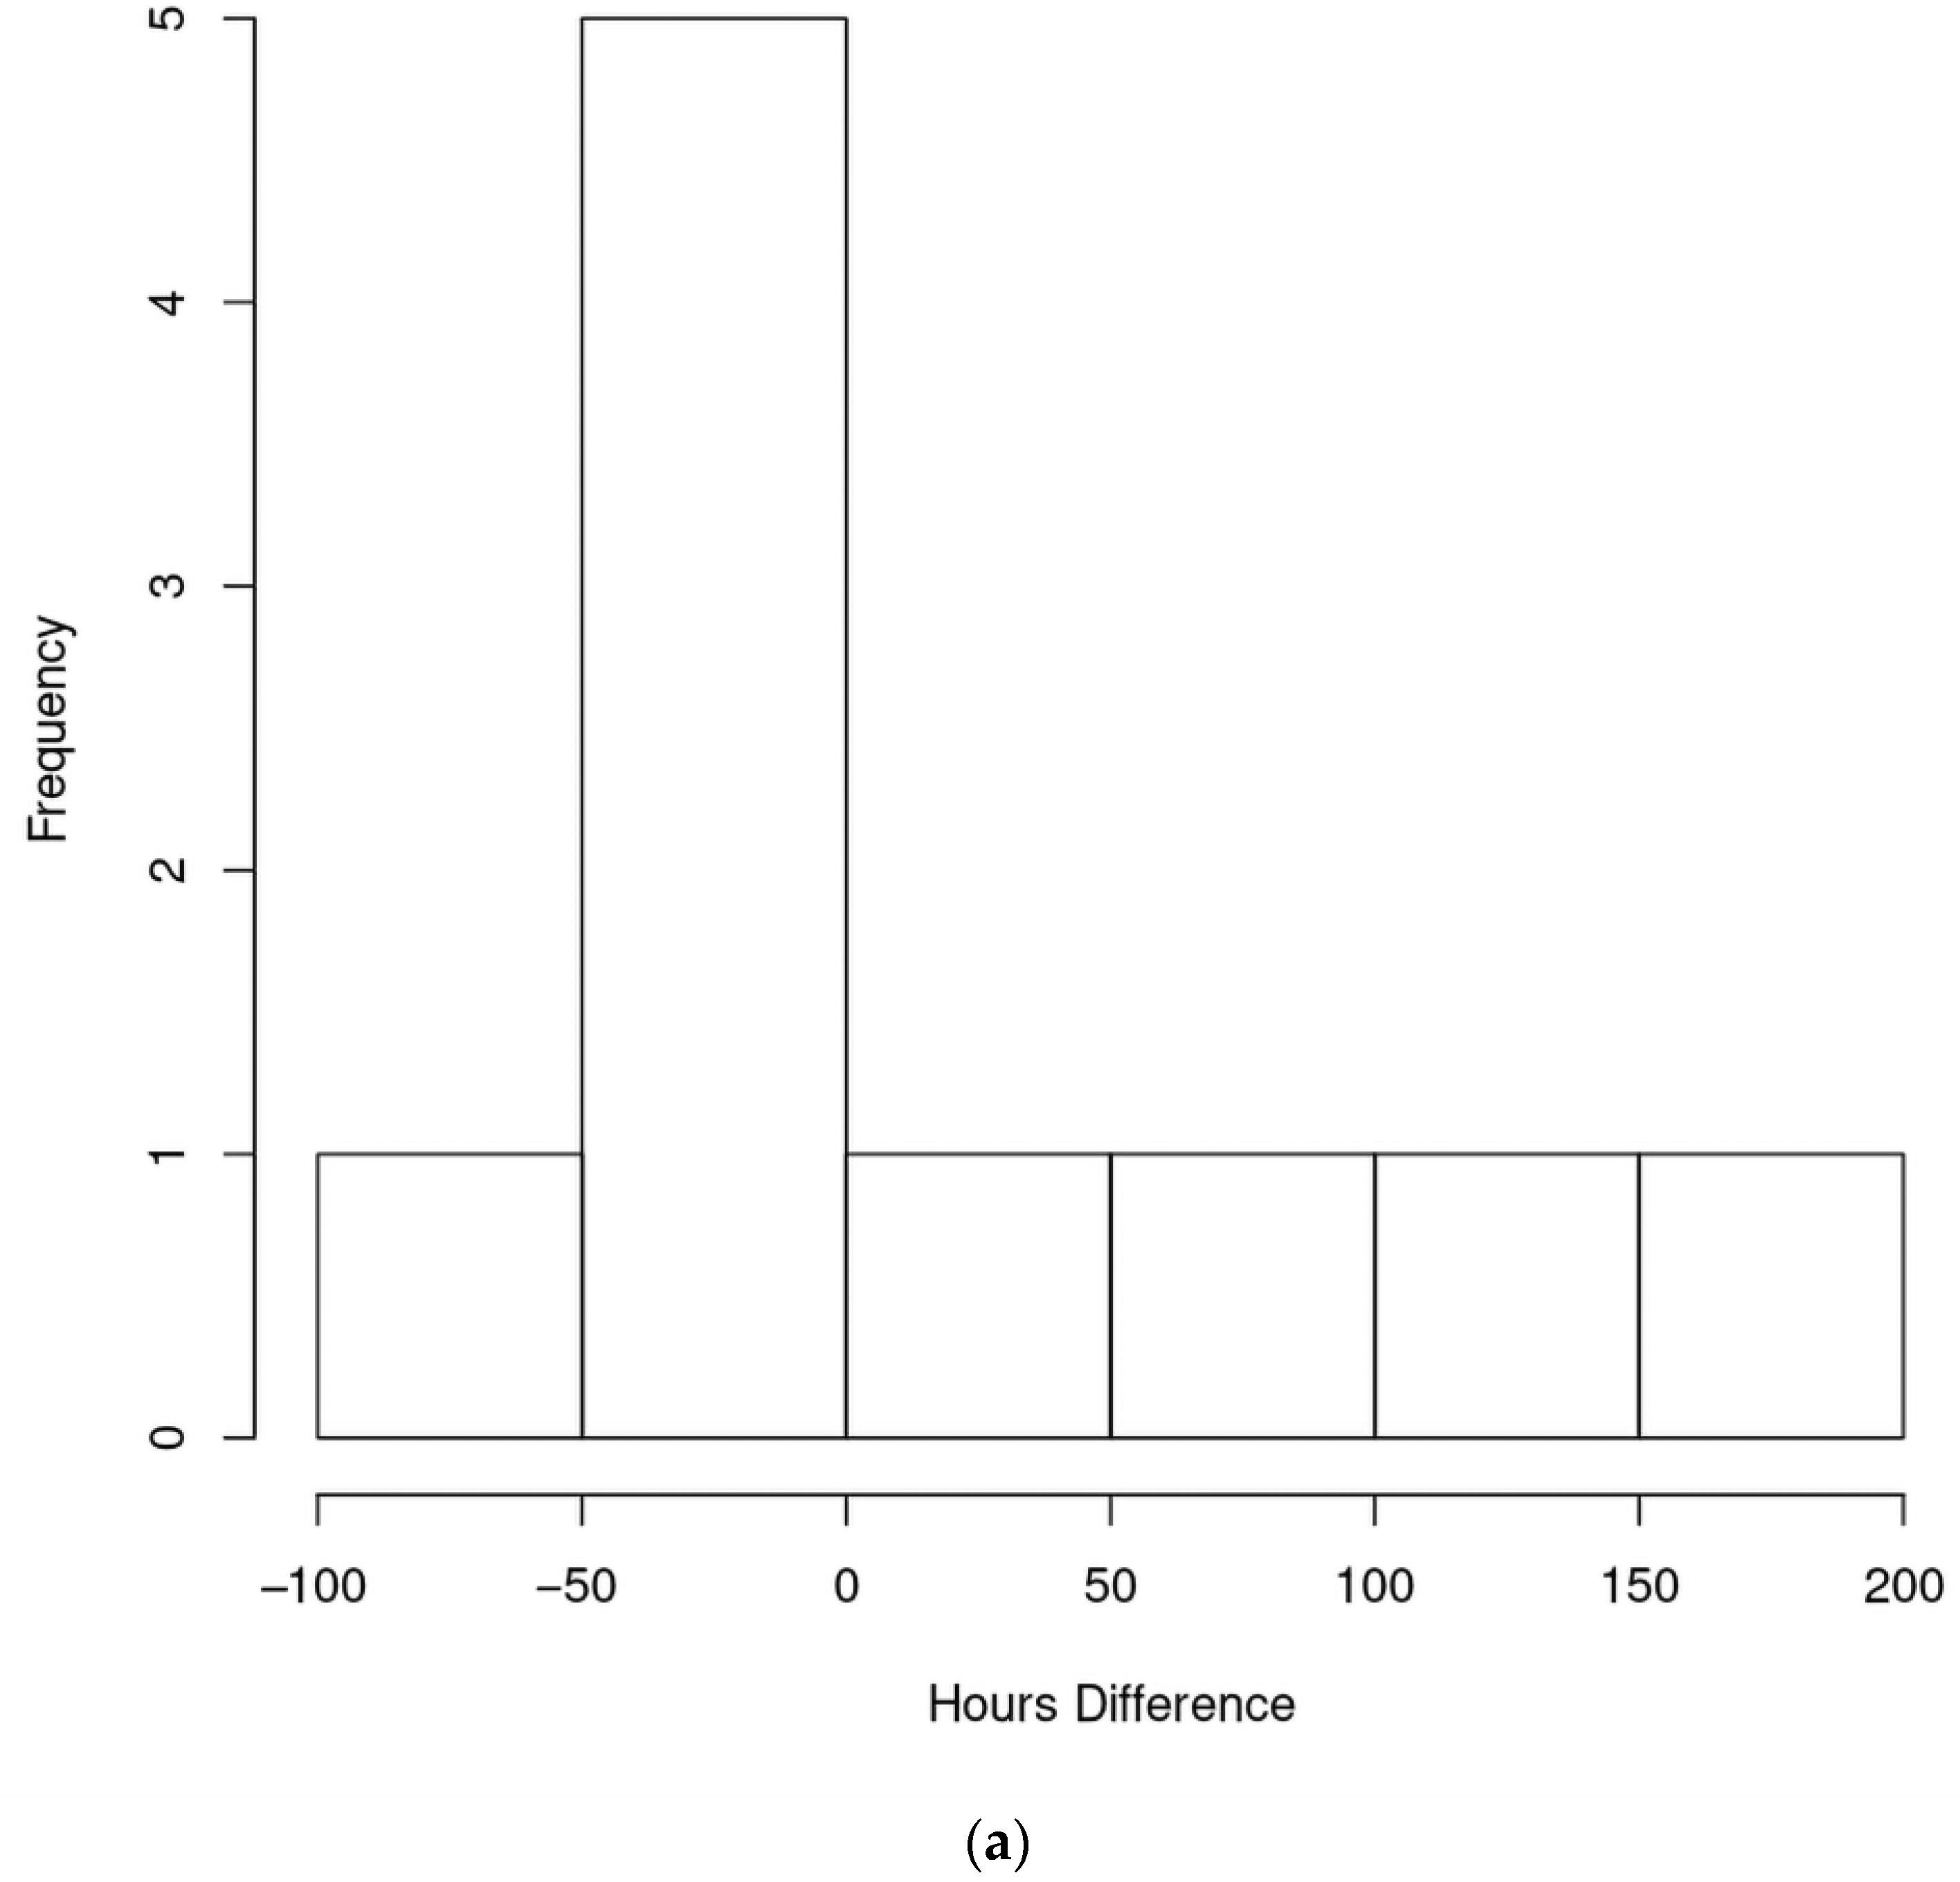
Histograms for each metric shown in
Figure 7 showed that despite only having 10 pairs of samples, it can reasonably be assumed that the normality assumption holds (since the data is not heavily skewed in one direction);
The histograms in
Figure 7 also demonstrate that no outliers were present.
Once it was determined that the usage of a paired t-test was applicable to this experiment, a separate hypothesis test was performed for each metric:
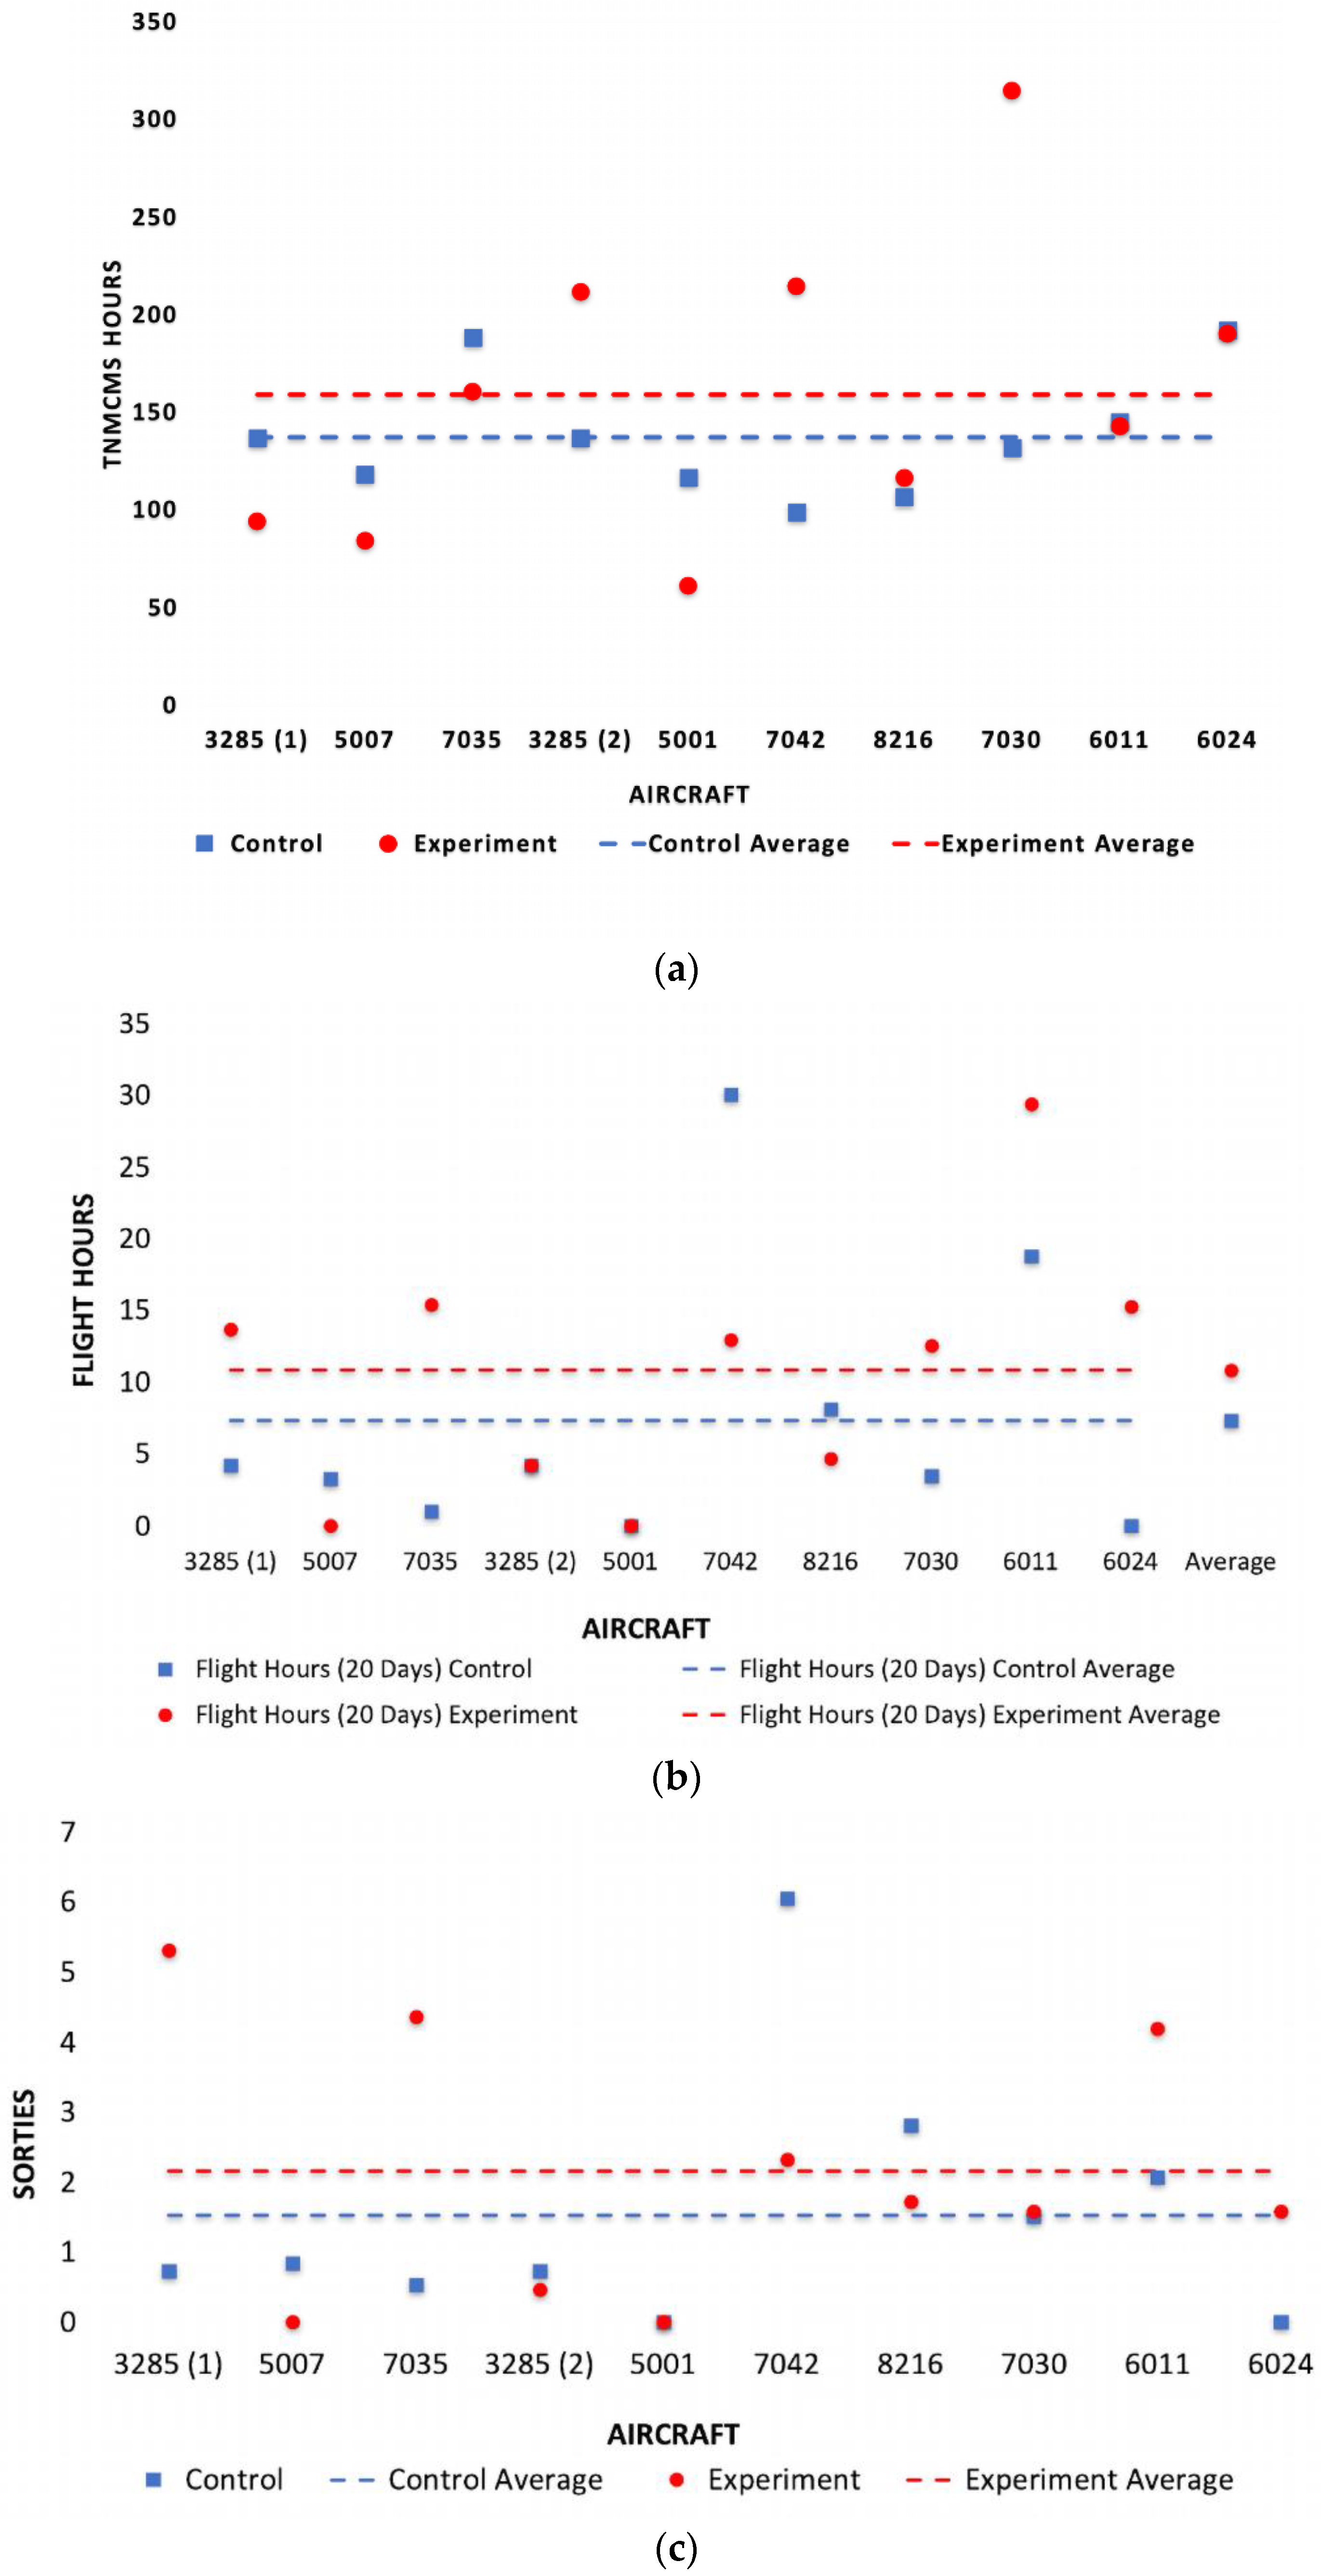
TNMCMS hours: As portrayed in
Figure 8a, the average increase in TNMCMS time was 21.8 h with a corresponding confidence interval of (−33.9, 77.5). With nine degrees of freedom, this test yielded a test statistic of −0.88602 with a corresponding p-value of 0.3987. At a significance level of 0.05, we failed to reject the null hypothesis that the mean of the control TNMCMS hours is equal to the experimental TNMCMS hours. Thus, there is not enough statistical evidence to conclude that the difference in means is different from zero.
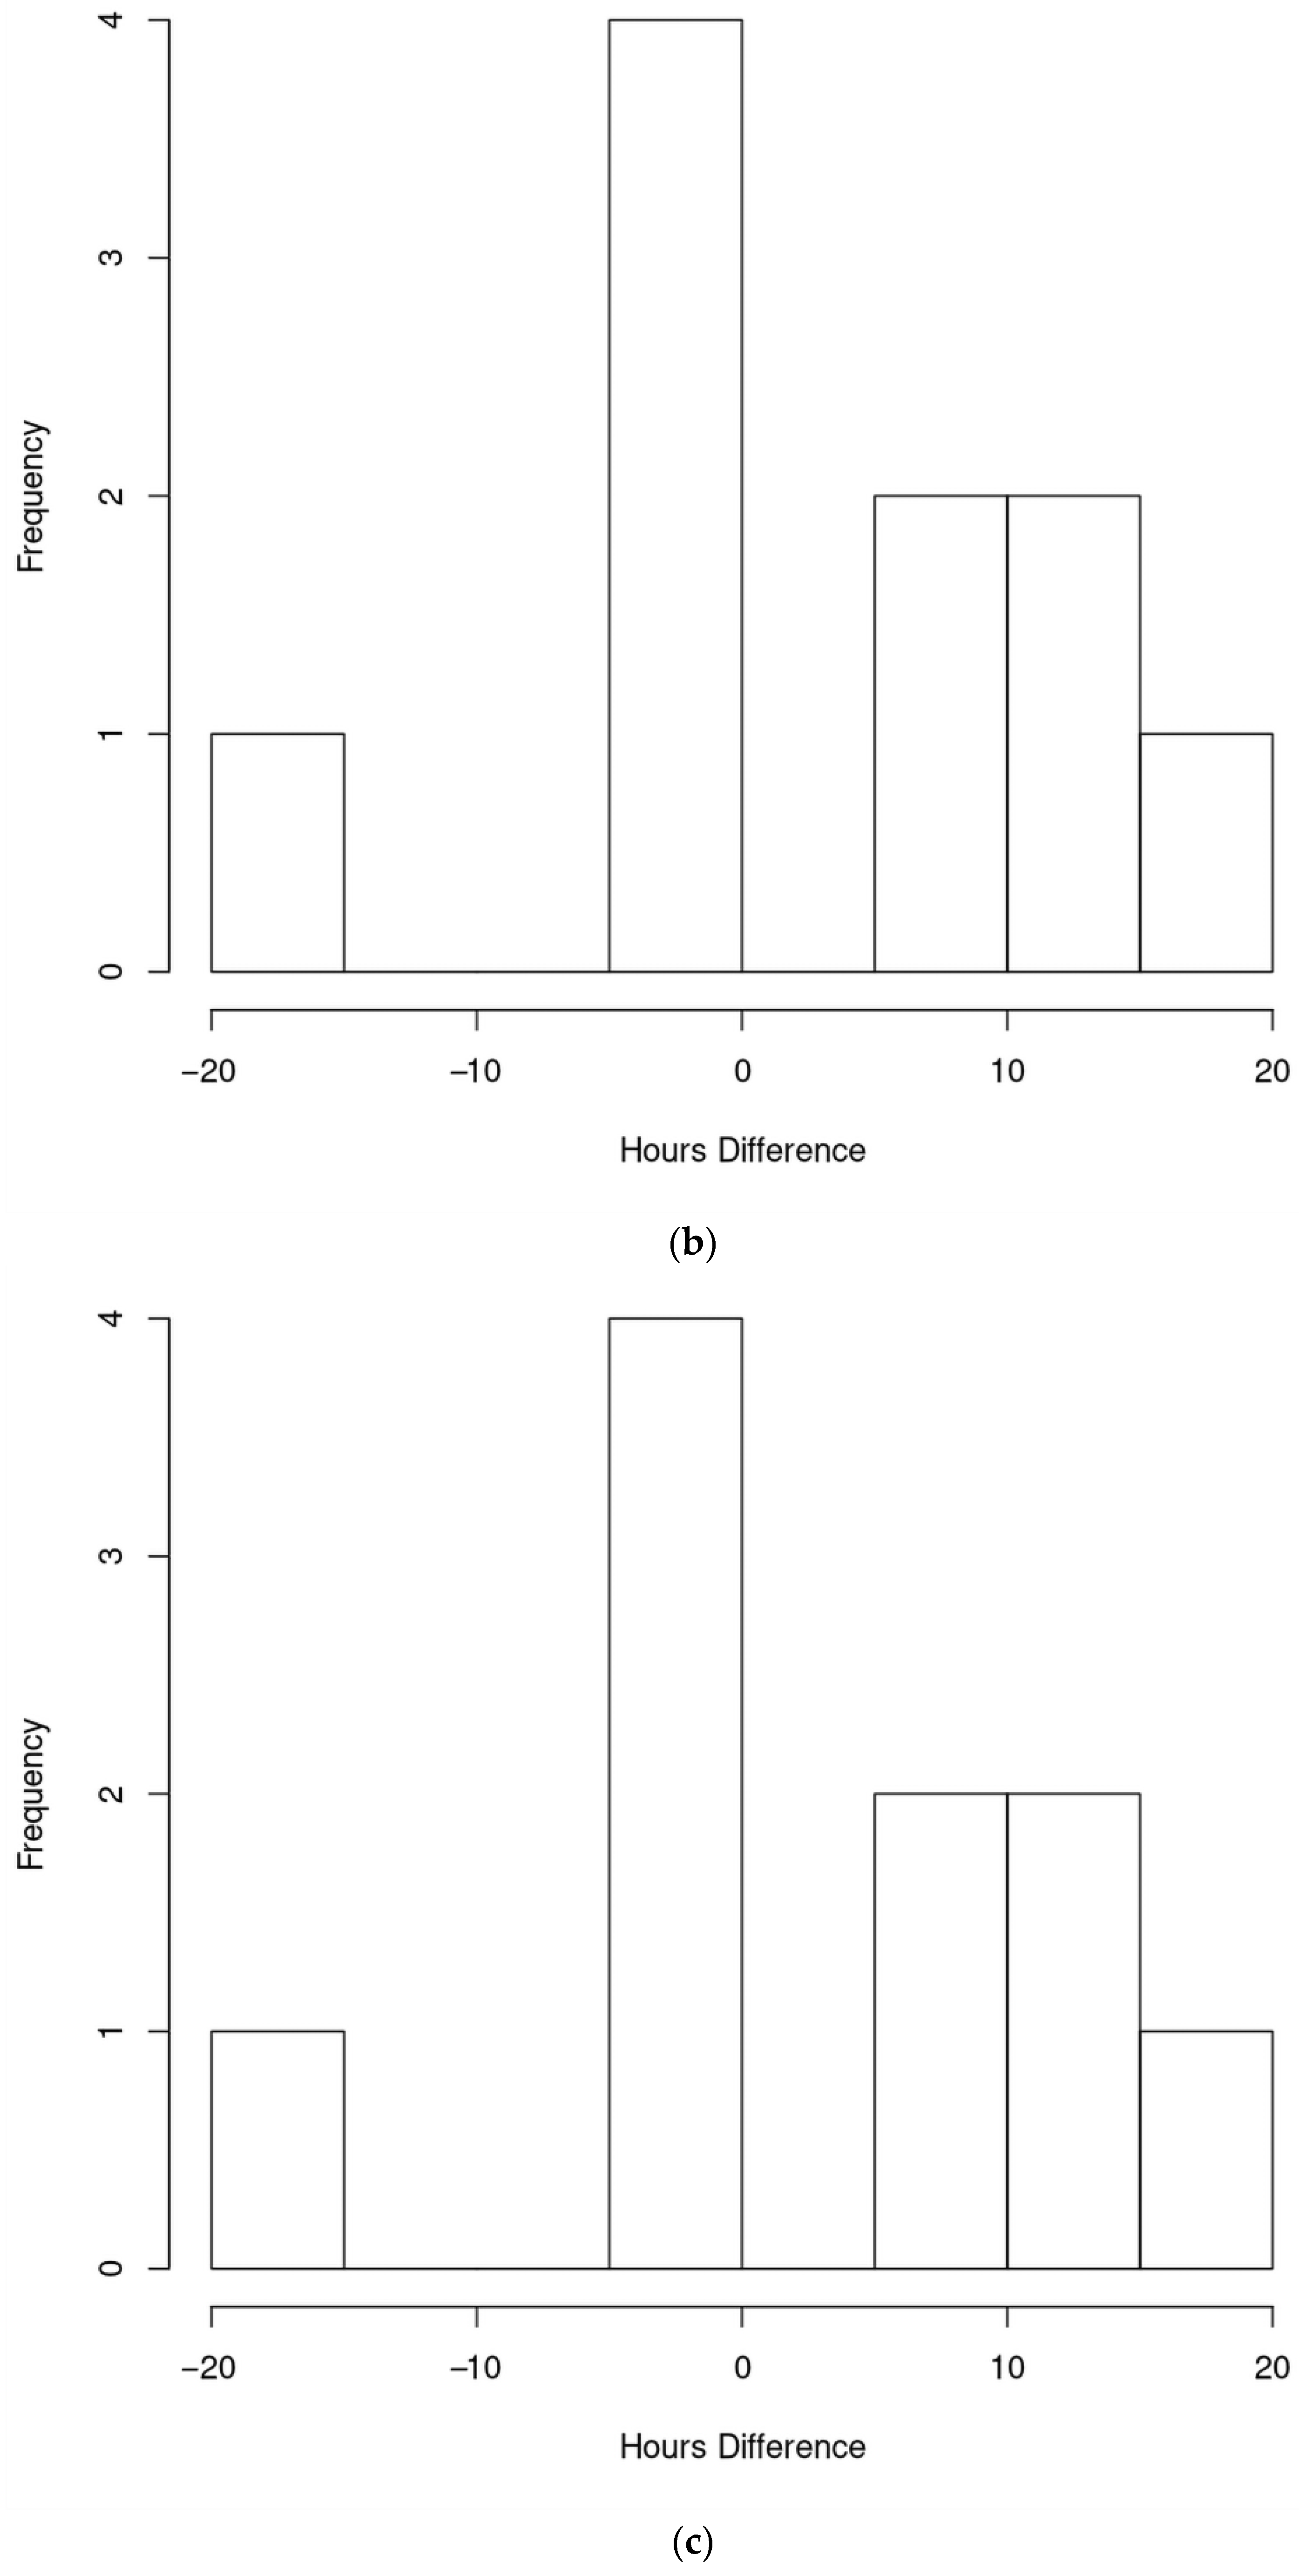
Flight hours: As portrayed in
Figure 8b, the average increase in flight hours was 3.50 h with a corresponding confidence interval of (−2.35, ∞). With nine degrees of freedom, this test yielded a test statistic of 1.0971 with a corresponding p-value of 0.1505. At a significance level of 0.05, we failed to reject the null hypothesis that the mean of the control flight hours is equal to the experimental flight hours. Thus, there is not enough statistical evidence to conclude that the difference in means is different from zero.
Sorties per 100 TNMCMS hours: As portrayed in
Figure 8c, the average increase in sorties per maintenance time was 0.63 with a corresponding confidence interval of (−0.80, ∞). With nine degrees of freedom, this test yielded a test statistic of 0.80654 with a corresponding
p-value of 0.2204. At a significance level of 0.05, we fail to reject the null hypothesis that the mean of the control sorties per 100 TNMCMS hours is equal to the experimental sorties per 100 TNMCMS hours. Thus, there is not enough statistical evidence to conclude that the difference in means is different from zero.
Although none of the metrics were statistically significant at the 0.05 level, all three metric means were larger for the experimental group (colored in red in
Figure 8) compared to the control group (colored in blue in
Figure 8). This increase was expected for the metrics relating to flying, but not for scheduled maintenance hours. Nevertheless, it was statistically improbable that the means for the TNMCMS hours would be exactly the same for the control and experimental groups. Furthermore, the ten samples captured took six months, and with the current assumptions, about 59 pairs of samples would be needed to establish statistical significance for all metrics. While it may take three years to gather the experimental samples, the control pairs will not increase in that time.
3.3. Organizational and Initiative Results
The IDF experiment implementation varied by base which manifested itself in the data. When isolating the metrics by base, Dover AFB decreased their TNMCMS hours and increased their flying hours and sorties per 100 TNMCMS hours as seen in
Table 4. Dover AFB used the experiment’s risk assessment to front-load their high-risk work-cards, which often resulted in findings that kept their experimental aircraft from flying within the HSC. However, by front-loading the risk, they were able complete their HSCs faster and have more consecutive days of flying after HSC completion.
In contrast, Travis AFB increased their TNMCMS hours and decreased their sorties per 100 TNMCMS hours as shown in
Table 5. These values increased by 60.6 and decreased by 0.21 units, respectively. Travis was willing to accept more risk within their maintenance requirements by performing high-risk cards after high priority sorties. This method was more aligned with pathfinder IDF recommendations because meeting operational flying requirements was the priority within the experiment. Travis AFB ultimately increased their total sorties completed but their experimental aircraft spent more time in NMC status after satisfying the flying requirements.
While the results varied, both bases demonstrated the benefits of using the experimental maintenance process. As shown in
Table 6, all three metric means were larger for the experimental group compared to the control group. This increase was expected for the metrics relating to flying, but not for scheduled maintenance hours. Nevertheless, it was statistically improbable that the means for the TNMCMS hours would be exactly the same for the control and experimental groups. Therefore, the pathfinder initiative did demonstrate the value in terms of benefit, cost, and cost–benefit ratio of IDF.
4. Discussion
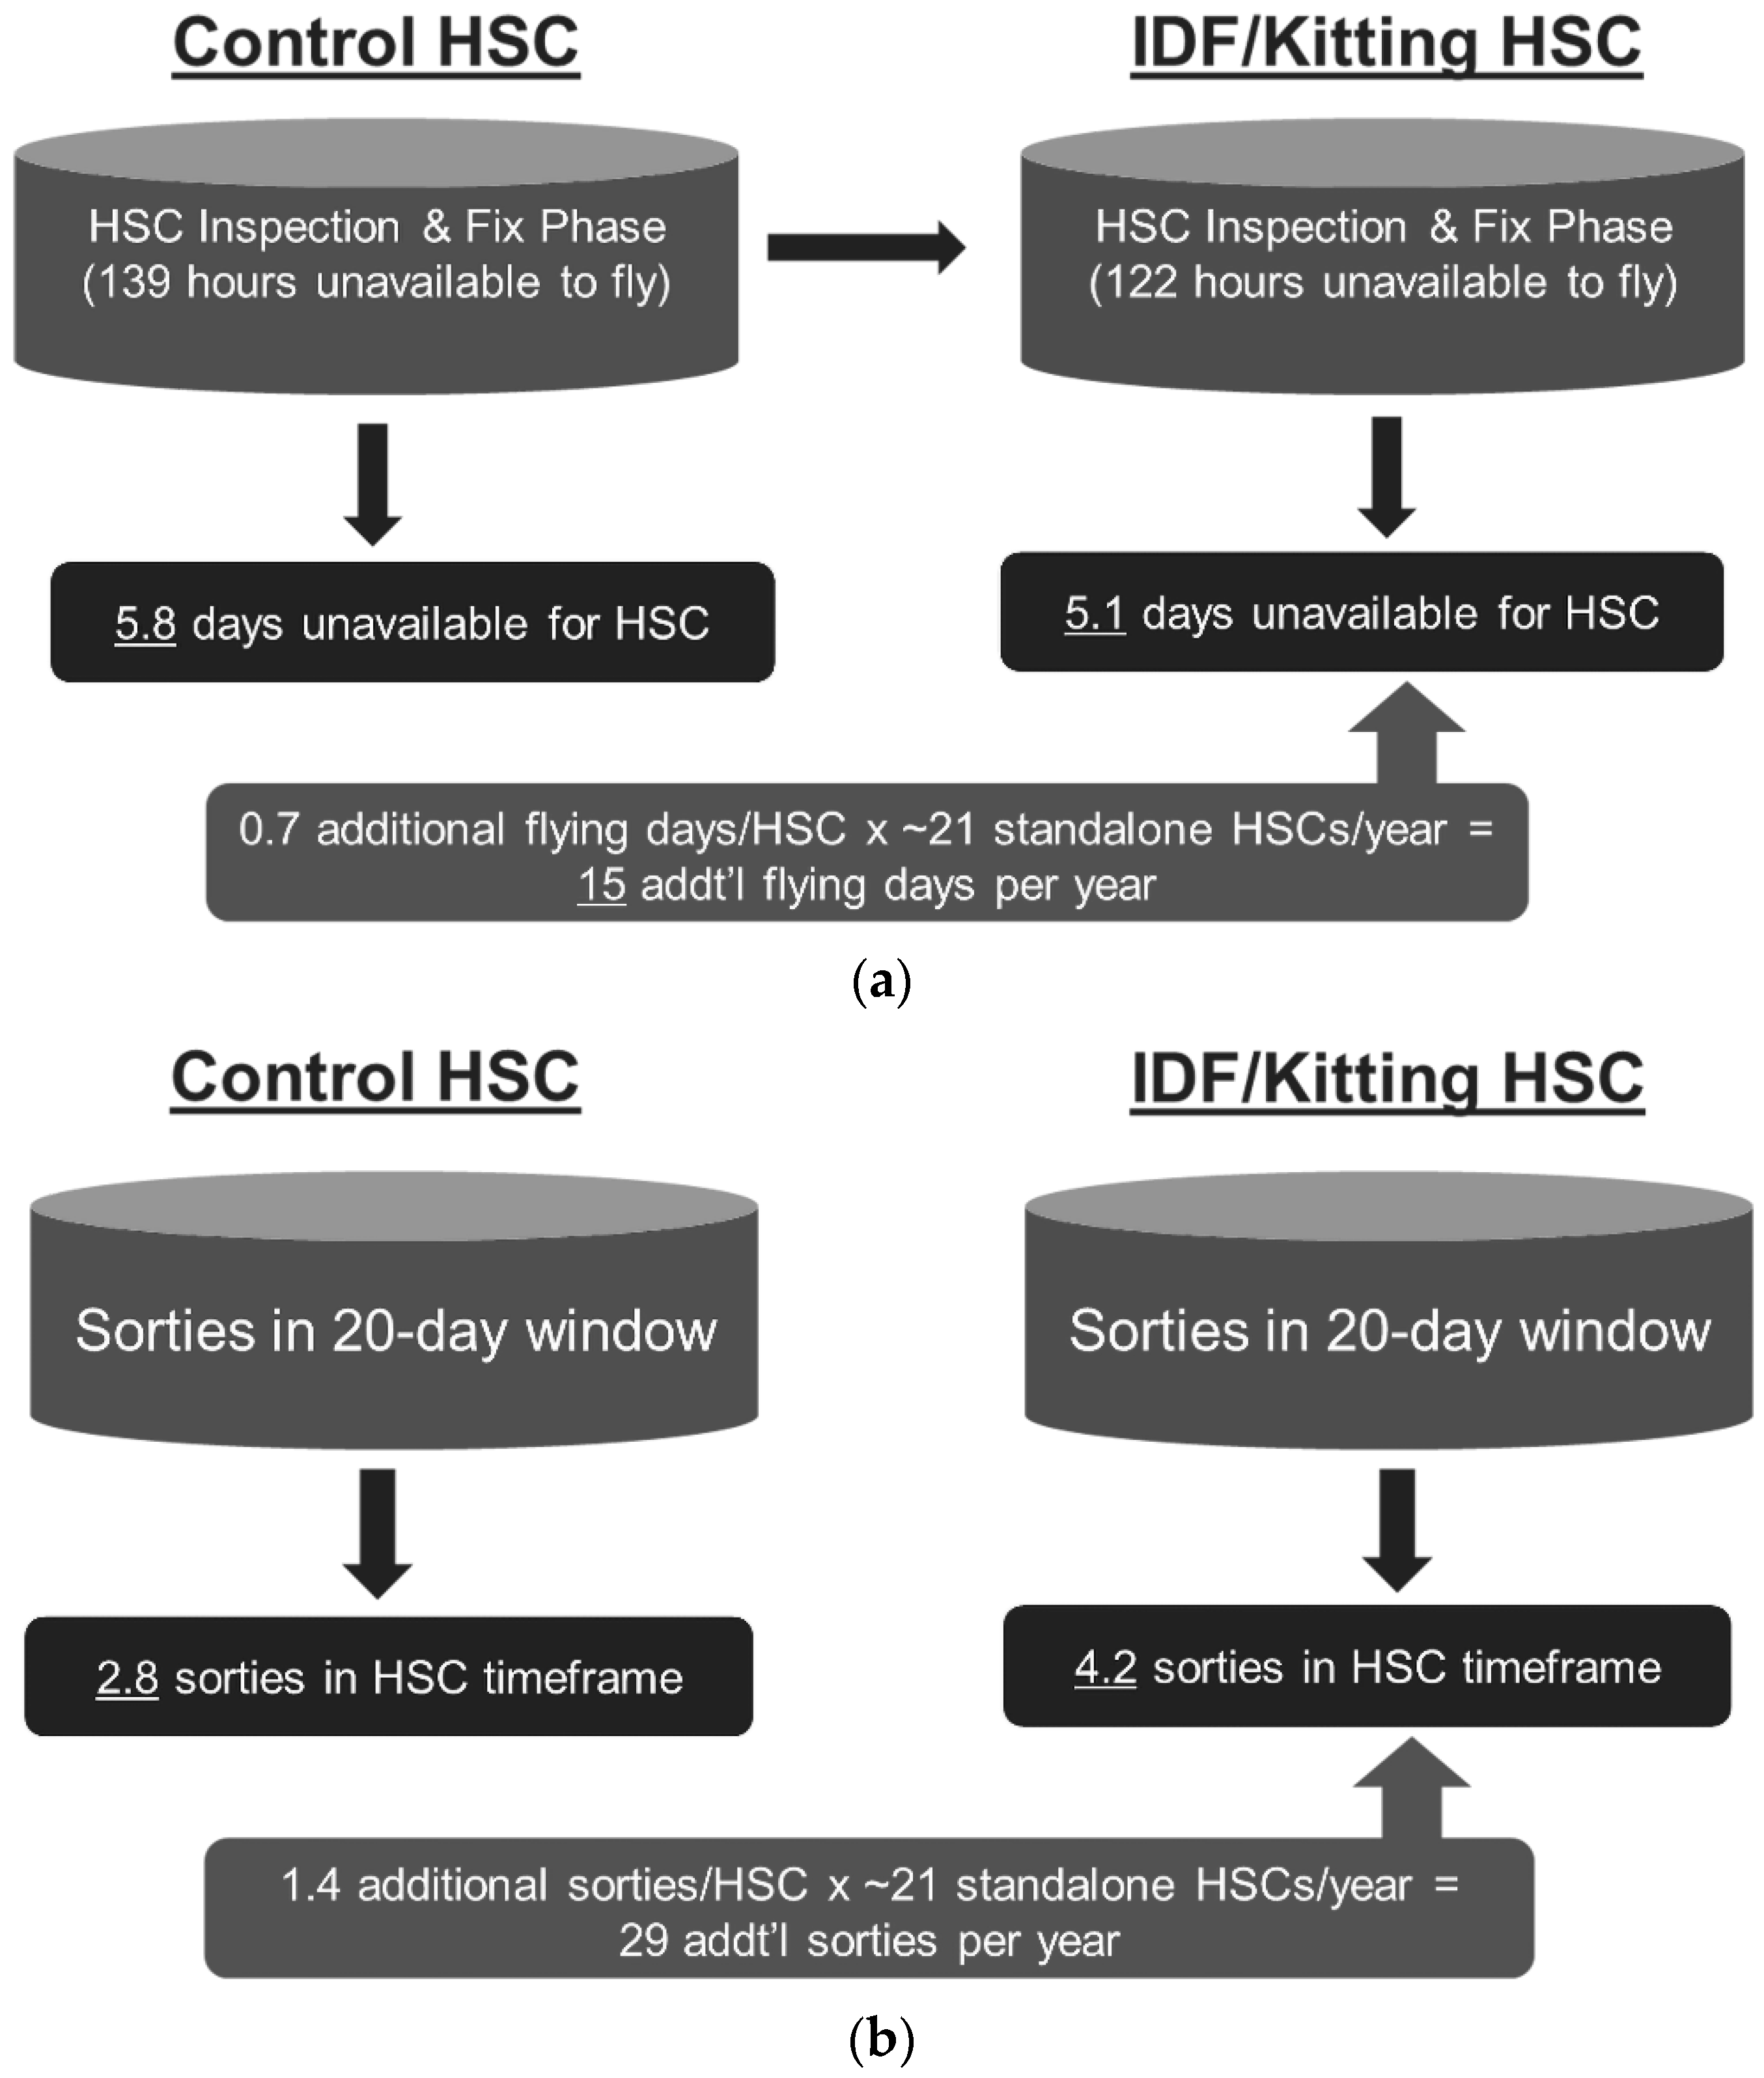
While implementation varied by base, both bases gained benefits from using the experimental IDF process. Dover AFB, on average, completed their IDF/kitting HSC scheduled maintenance 17.0 h faster than their legacy HSC with a 95% confidence interval of (−48.2, 88.2). Thus, assuming there is approximately 21 HSCs performed each year at Dover AFB, they would receive a total of 14.9 additional days of MC time as shown in
Figure 9a. Similarly, Travis AFB, on average, received an additional 1.4 sorties within their 20-day window with a 95% confidence interval of (−1.3, 4.1). Hence, assuming approximately 21 HSCs performed each year at Travis AFB, within the 20-day window from the start of the HSC, they would receive an extra 29.4 sorties as shown in
Figure 9b. The extrapolation to the 95% confidence interval would indicate that we are 95% confident that the true mean would provide between −27.3 and 86.1 additional sorties in the 20-day window for the base.
Overall, the IDF pathfinder demonstrated the approach’s value by showing that:
An additional 1.4 sorties were flown at Travis AFB which scales to 29 additional sorties per year.
A 0.7 day decrease in HSC TNMCMS hours at Dover AFB, scaling to 15 additional flying days per year for Dover AFB HSCs
An average 3.4 h increase in flight hours, 4.0 h increase in HSC NMC hours, and increase of 0.63 sorties per 100 HSC TNMCMS hours overall between Travis and Dover AFB.
These results demonstrate how novel maintenance scheduling concepts such as IDF can address the decline in USAF aircraft readiness and utilization. Additionally, they support the SSF’s LOE “Optimize materiel availability of weapons systems to OR” through agile scheduling of maintenance that subordinates to operational and resource constraints.
This agile and more dynamic scheduling technique also enables the emerging trend of Condition Based Maintenance (CBM) in aviation. CBM strategies require scheduled maintenance requirements to adjust their intervals based on prognostic evidence. IDF provides a methodology to optimally schedule CBM requirements under resource and operational constraints. The coordination IDF proposes between engineers developing scheduled and CBM maintenance requirements and operational planners responsible to execute those requirements is critical to realize the benefit of CBM in aerospace.
Finally, future work to scale IDF includes achieving statistical significance with a larger sample size, expanding IDF to the C-5M’s larger Isochronal and Programmed Depot Maintenance inspections, and formalizing the scheduled maintenance work packages in the C-5M’s technical orders after more quantitative and formal engineering and reliability analysis.


