
Acoustic Experimental Technology for Aircraft Nacelle Liner
Abstract
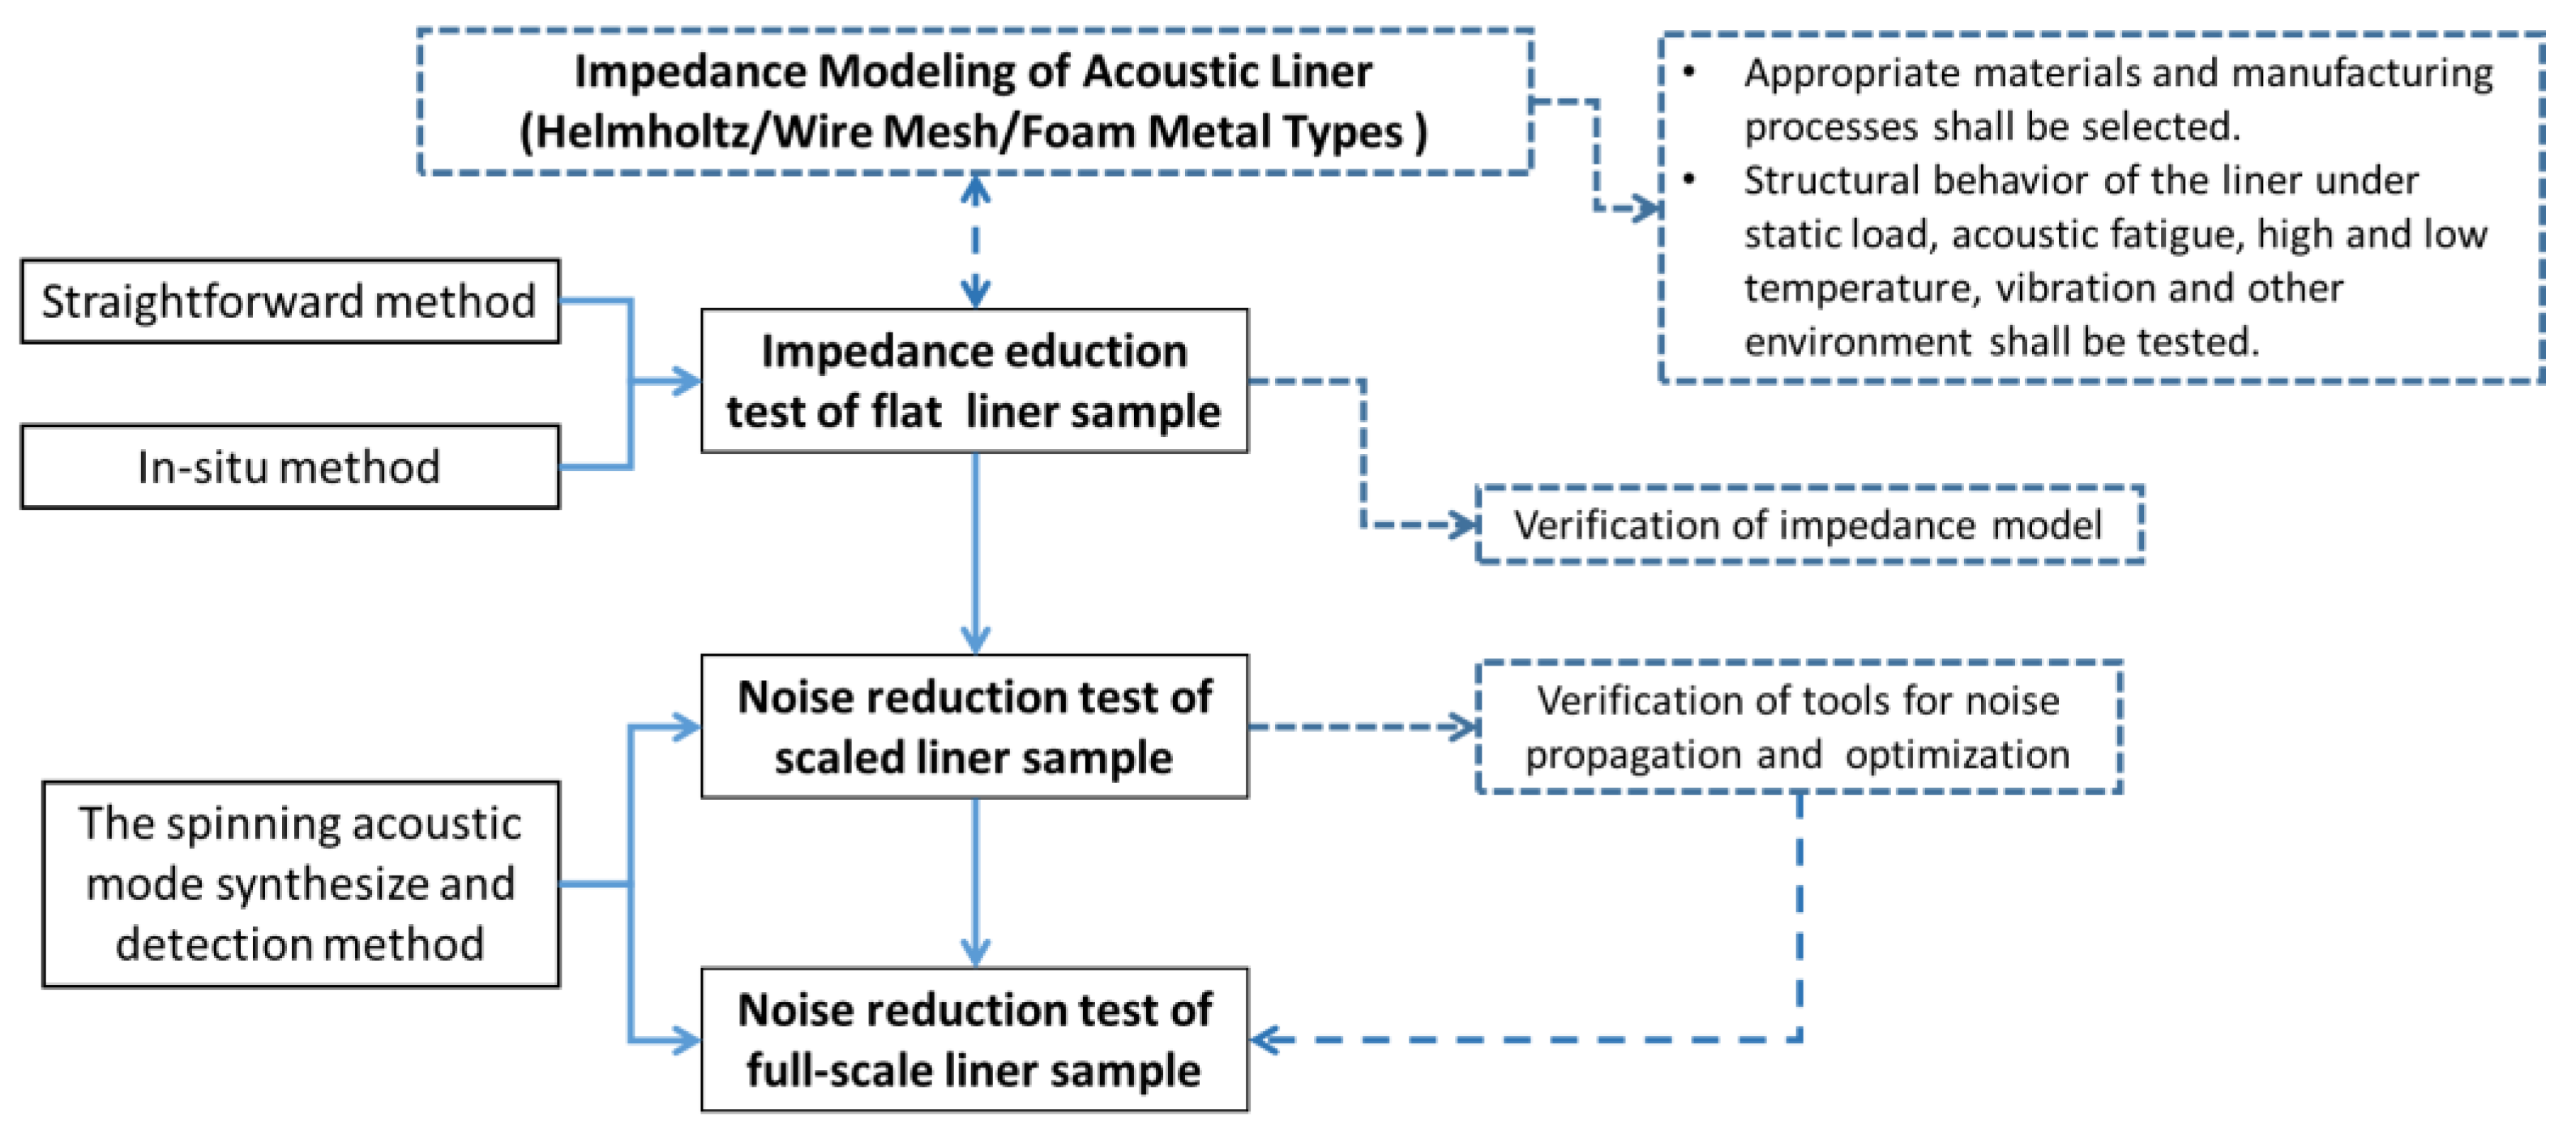
:1. Introduction
2. Acoustic Impedance Eduction Technology
2.1. Impedance Eduction Methodology
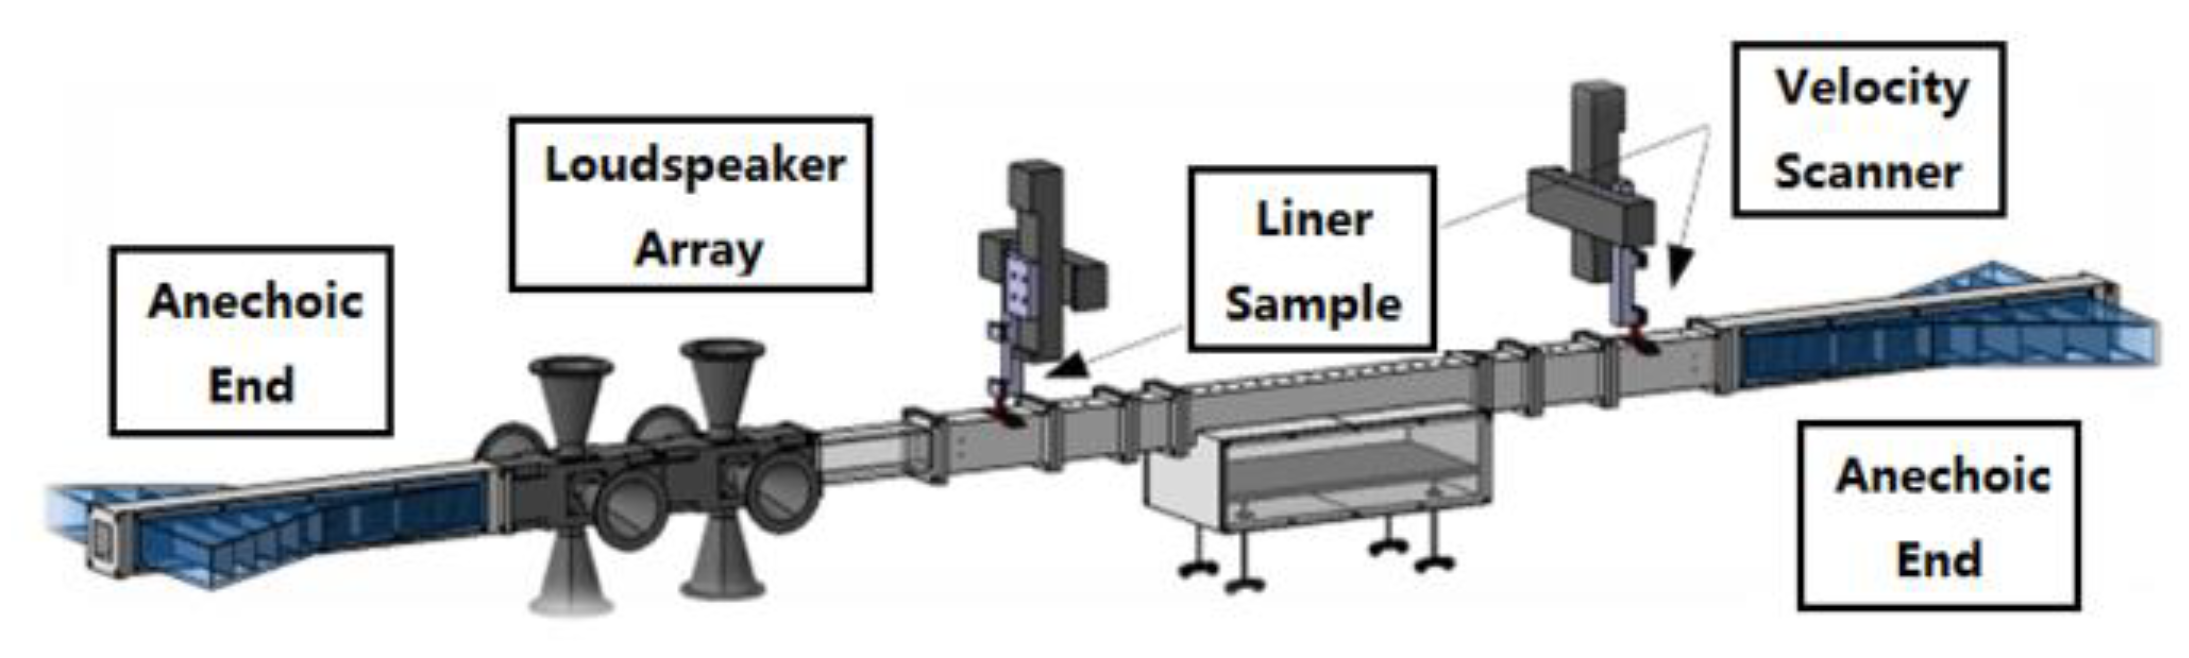
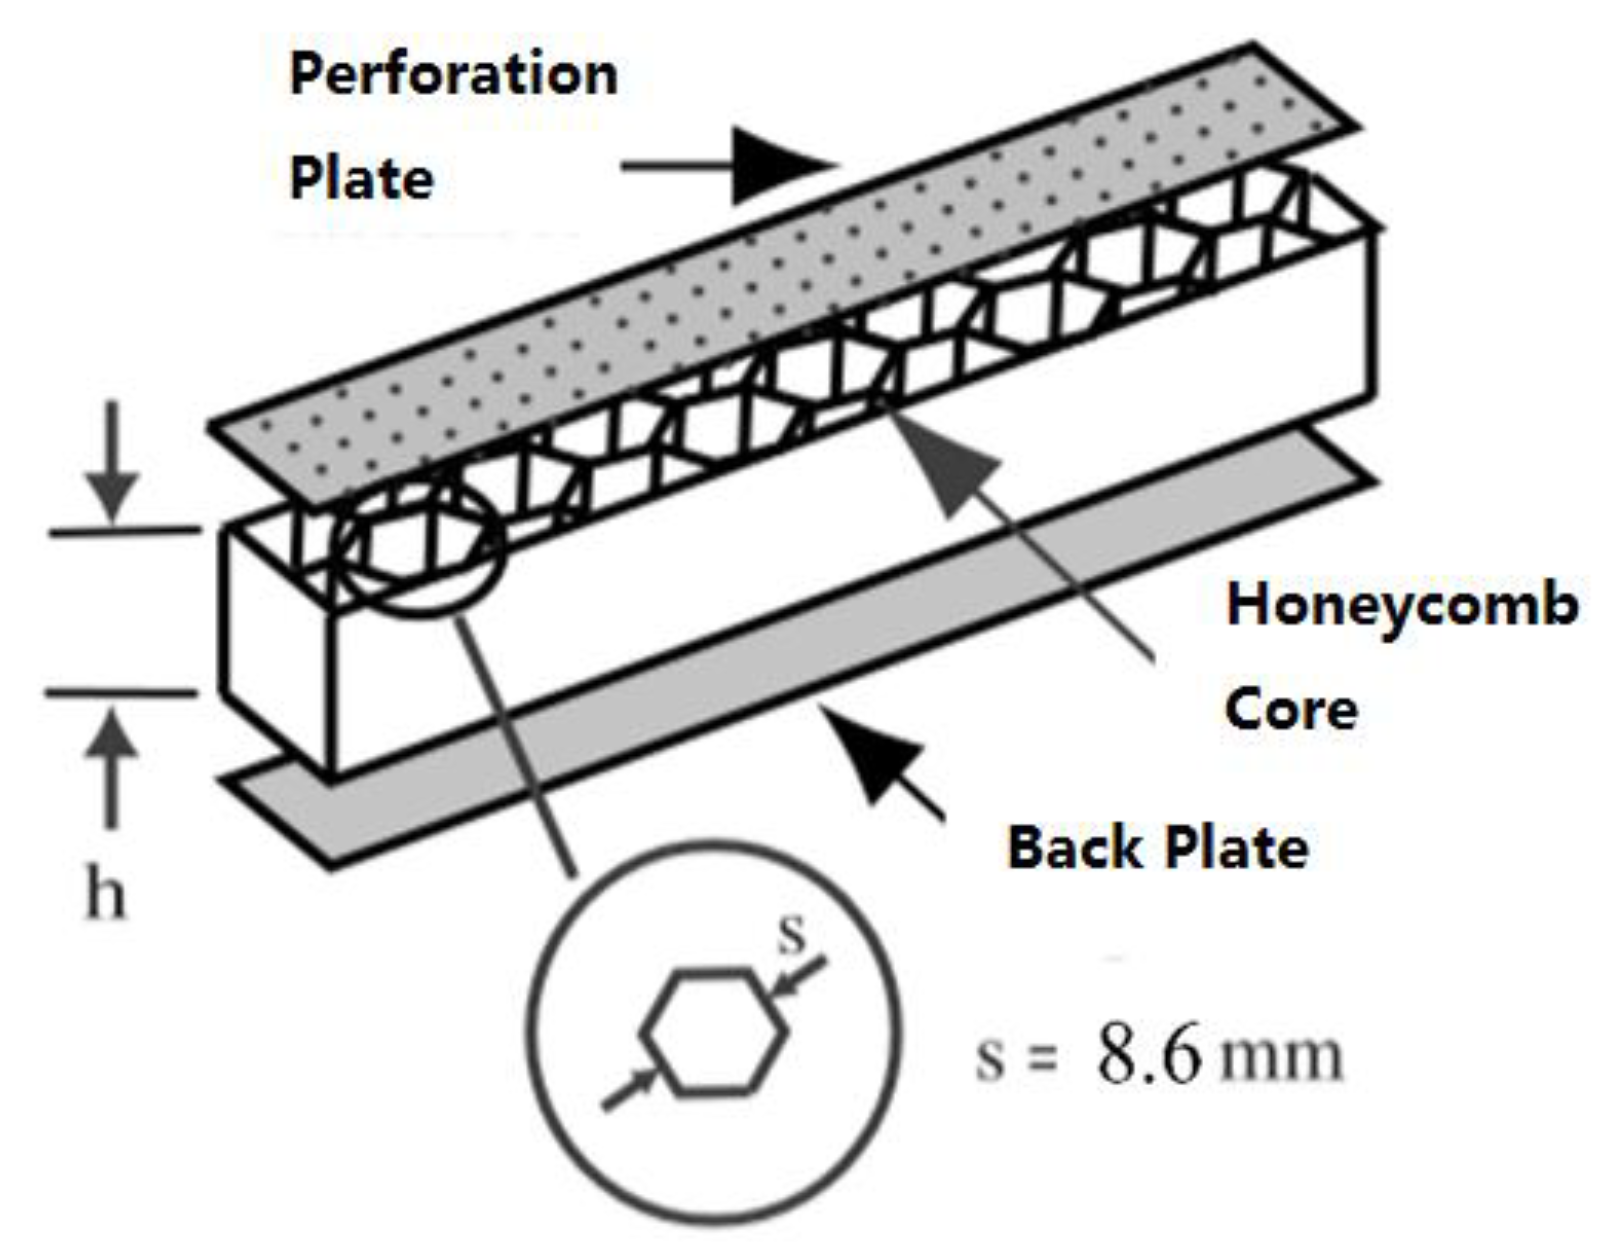
2.2. Acoustic Liner Impedance Edcation Experimental Device
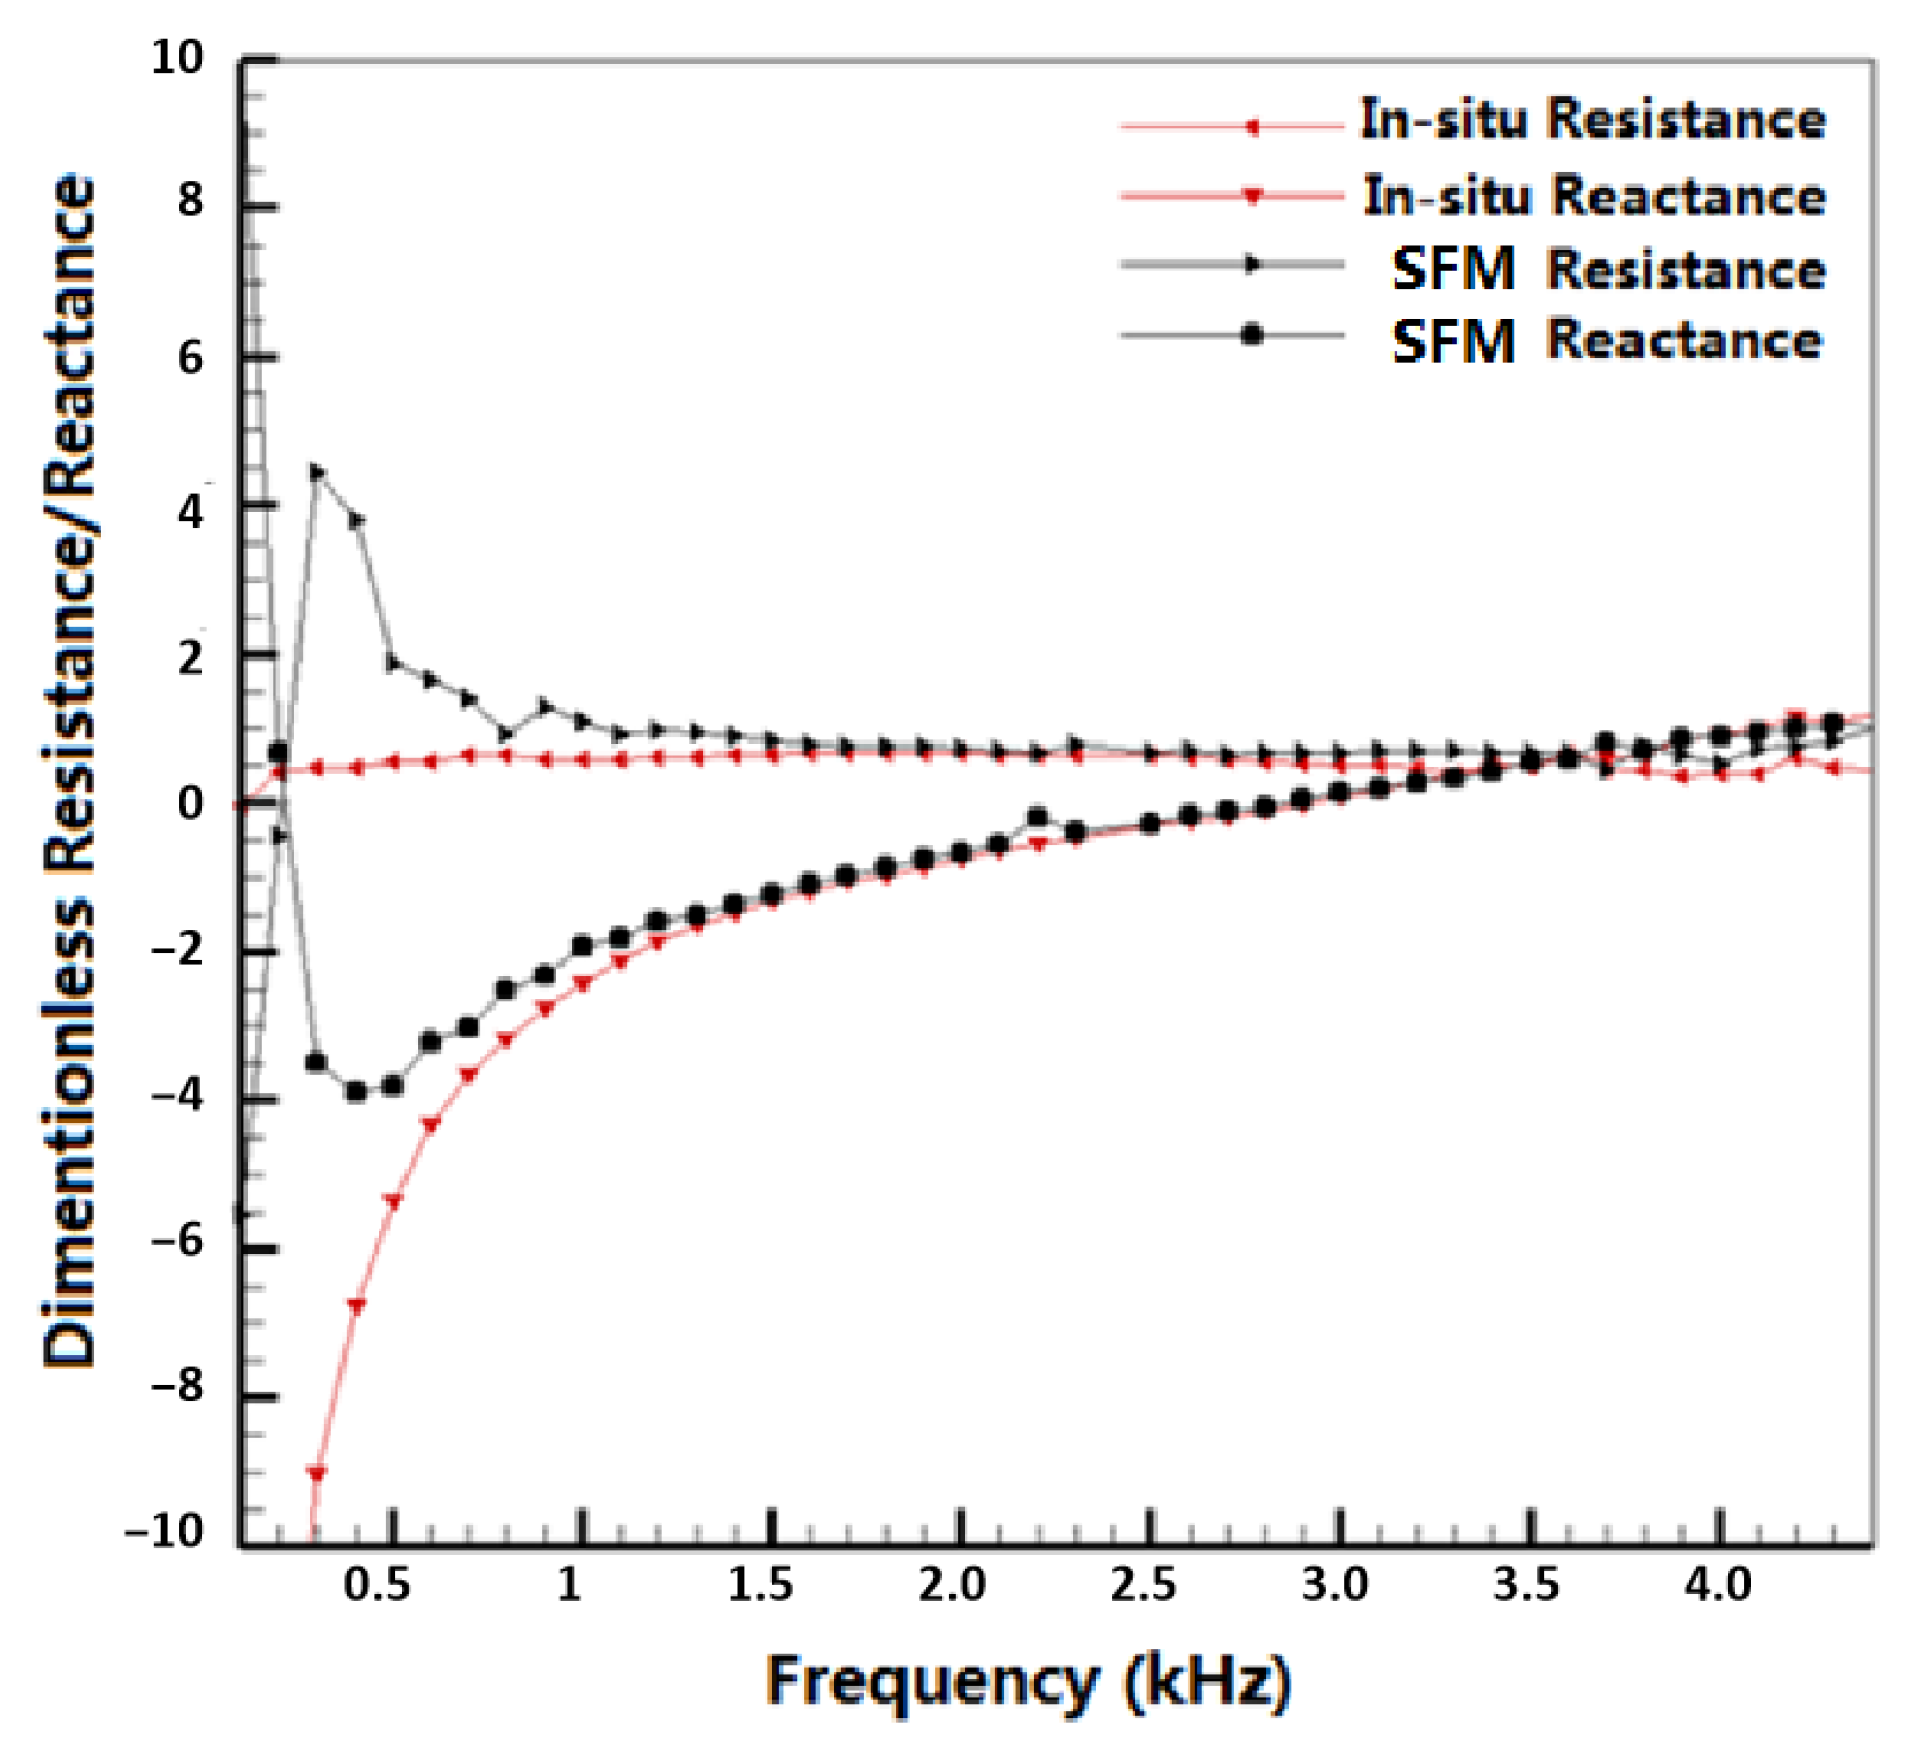
2.3. Comparison of Two Methods for Acoustic Liner Impedance Edcation
3. Acoustic Mode Synthesis and Detecting Technology for Nacelle Liner Test
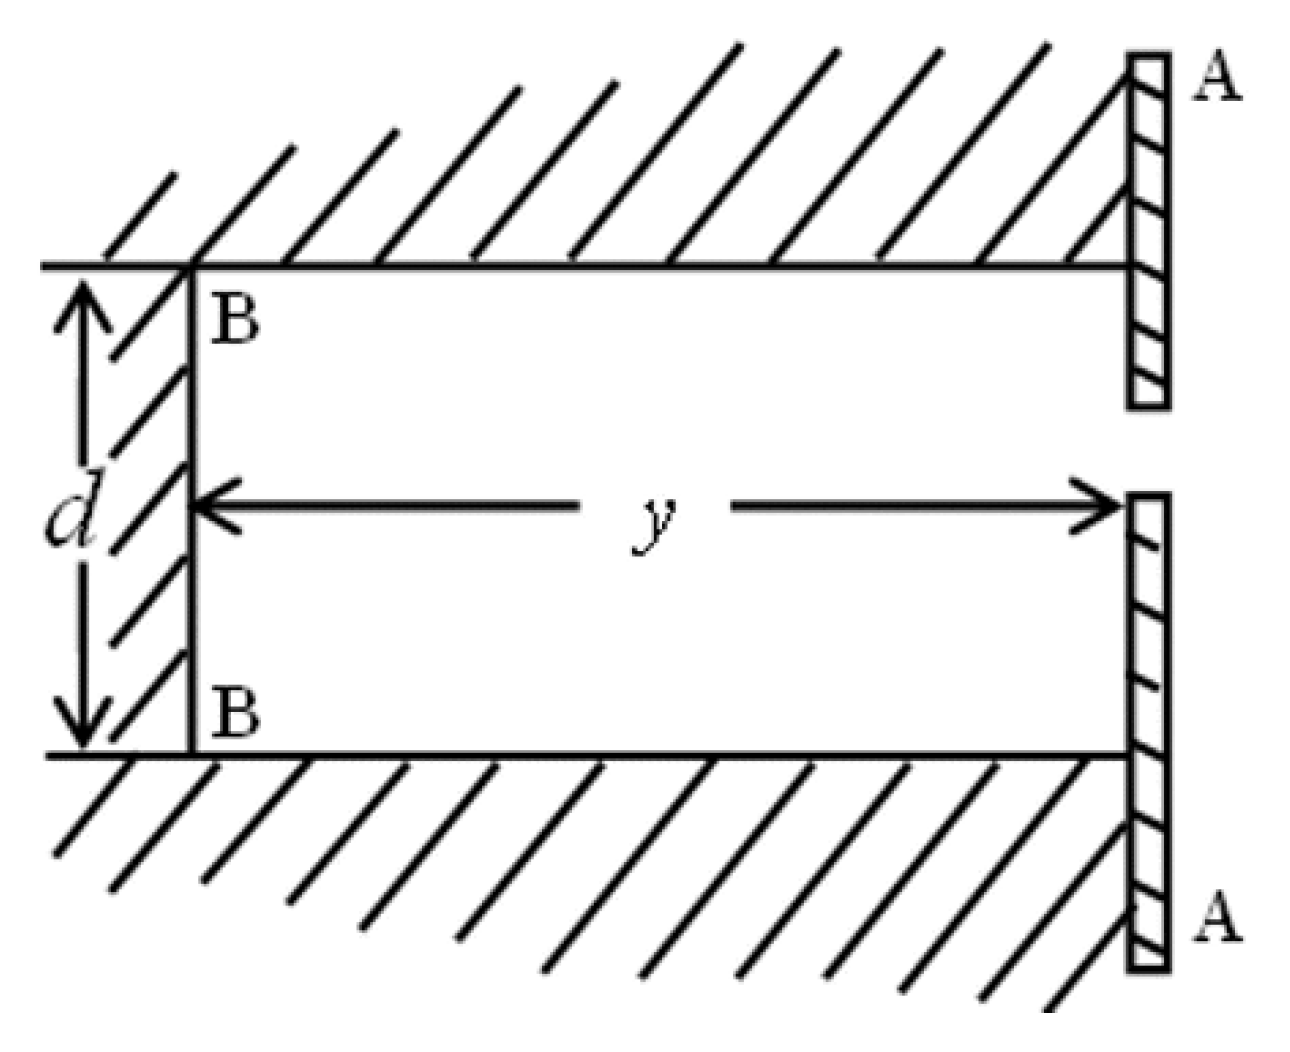
3.1. Design Principle of Acoustic Spinning Mode Generator
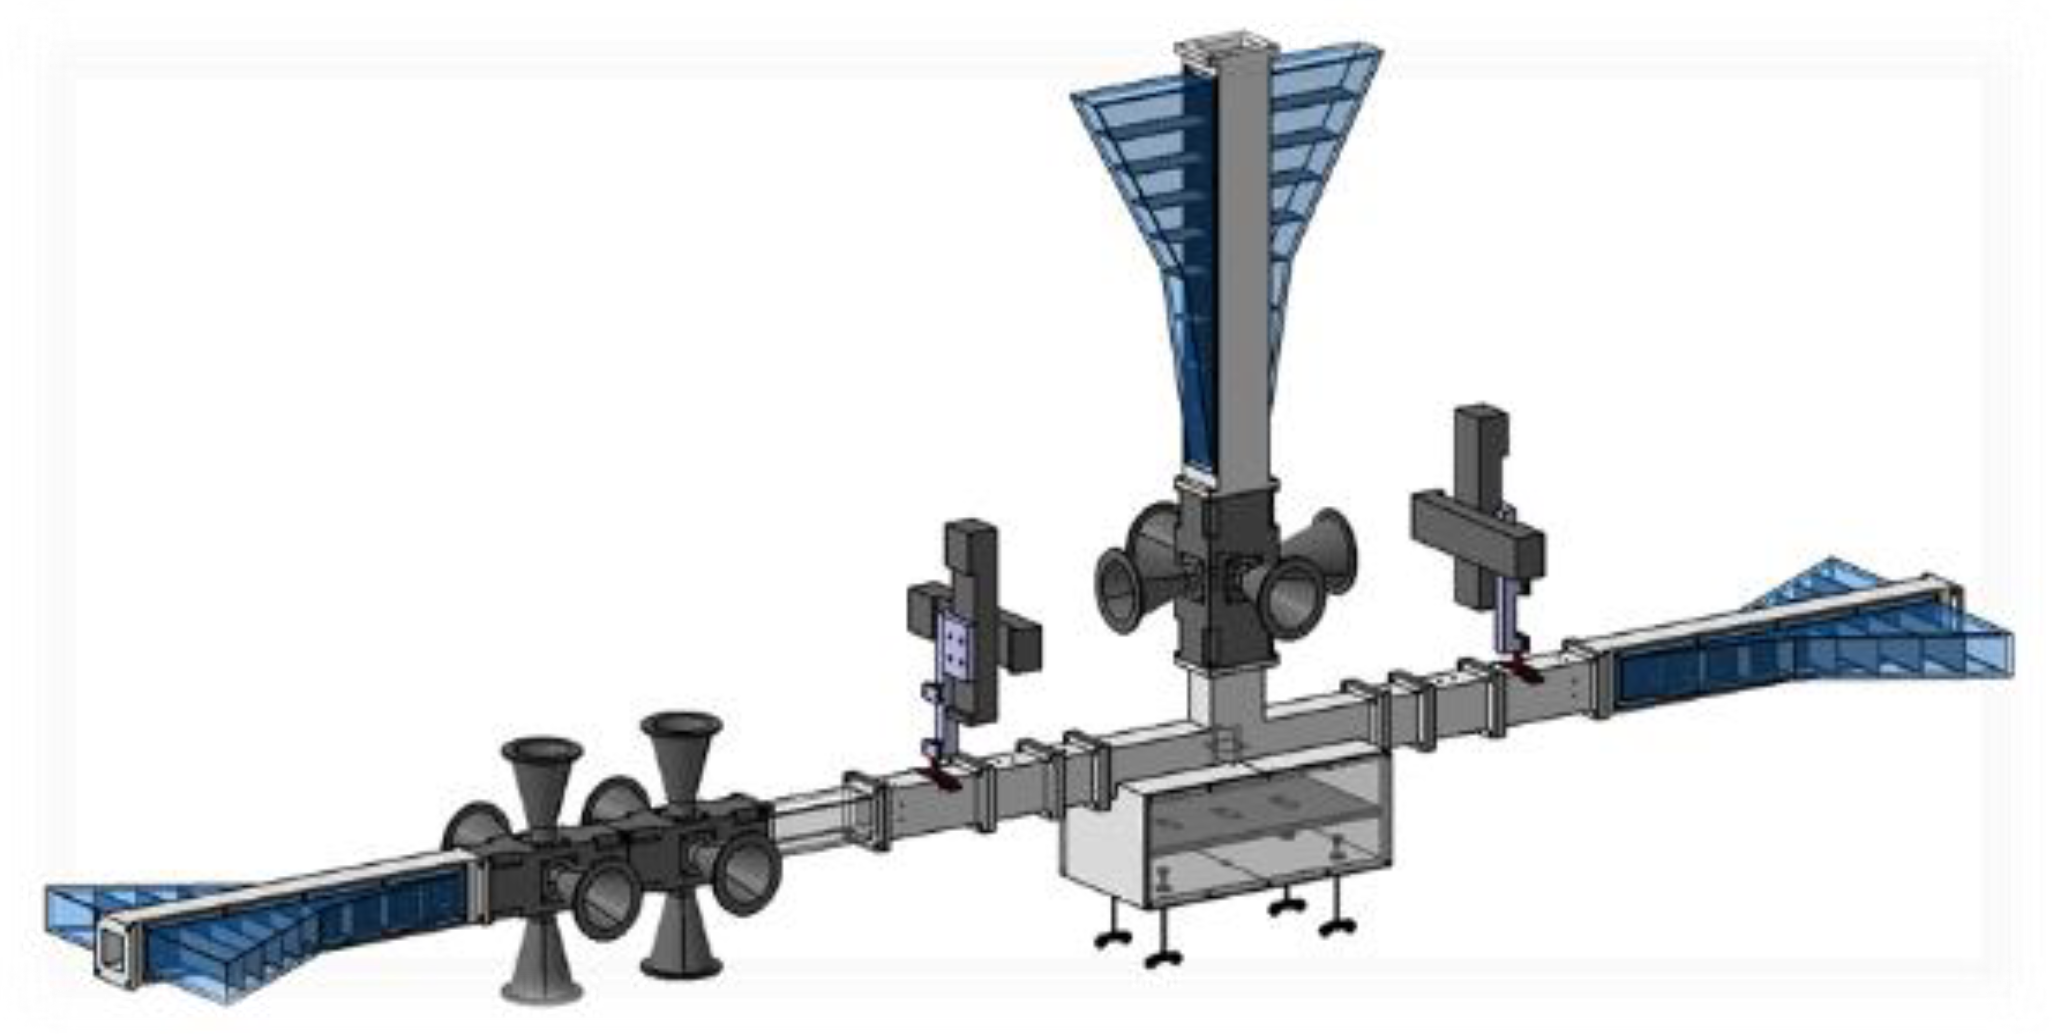
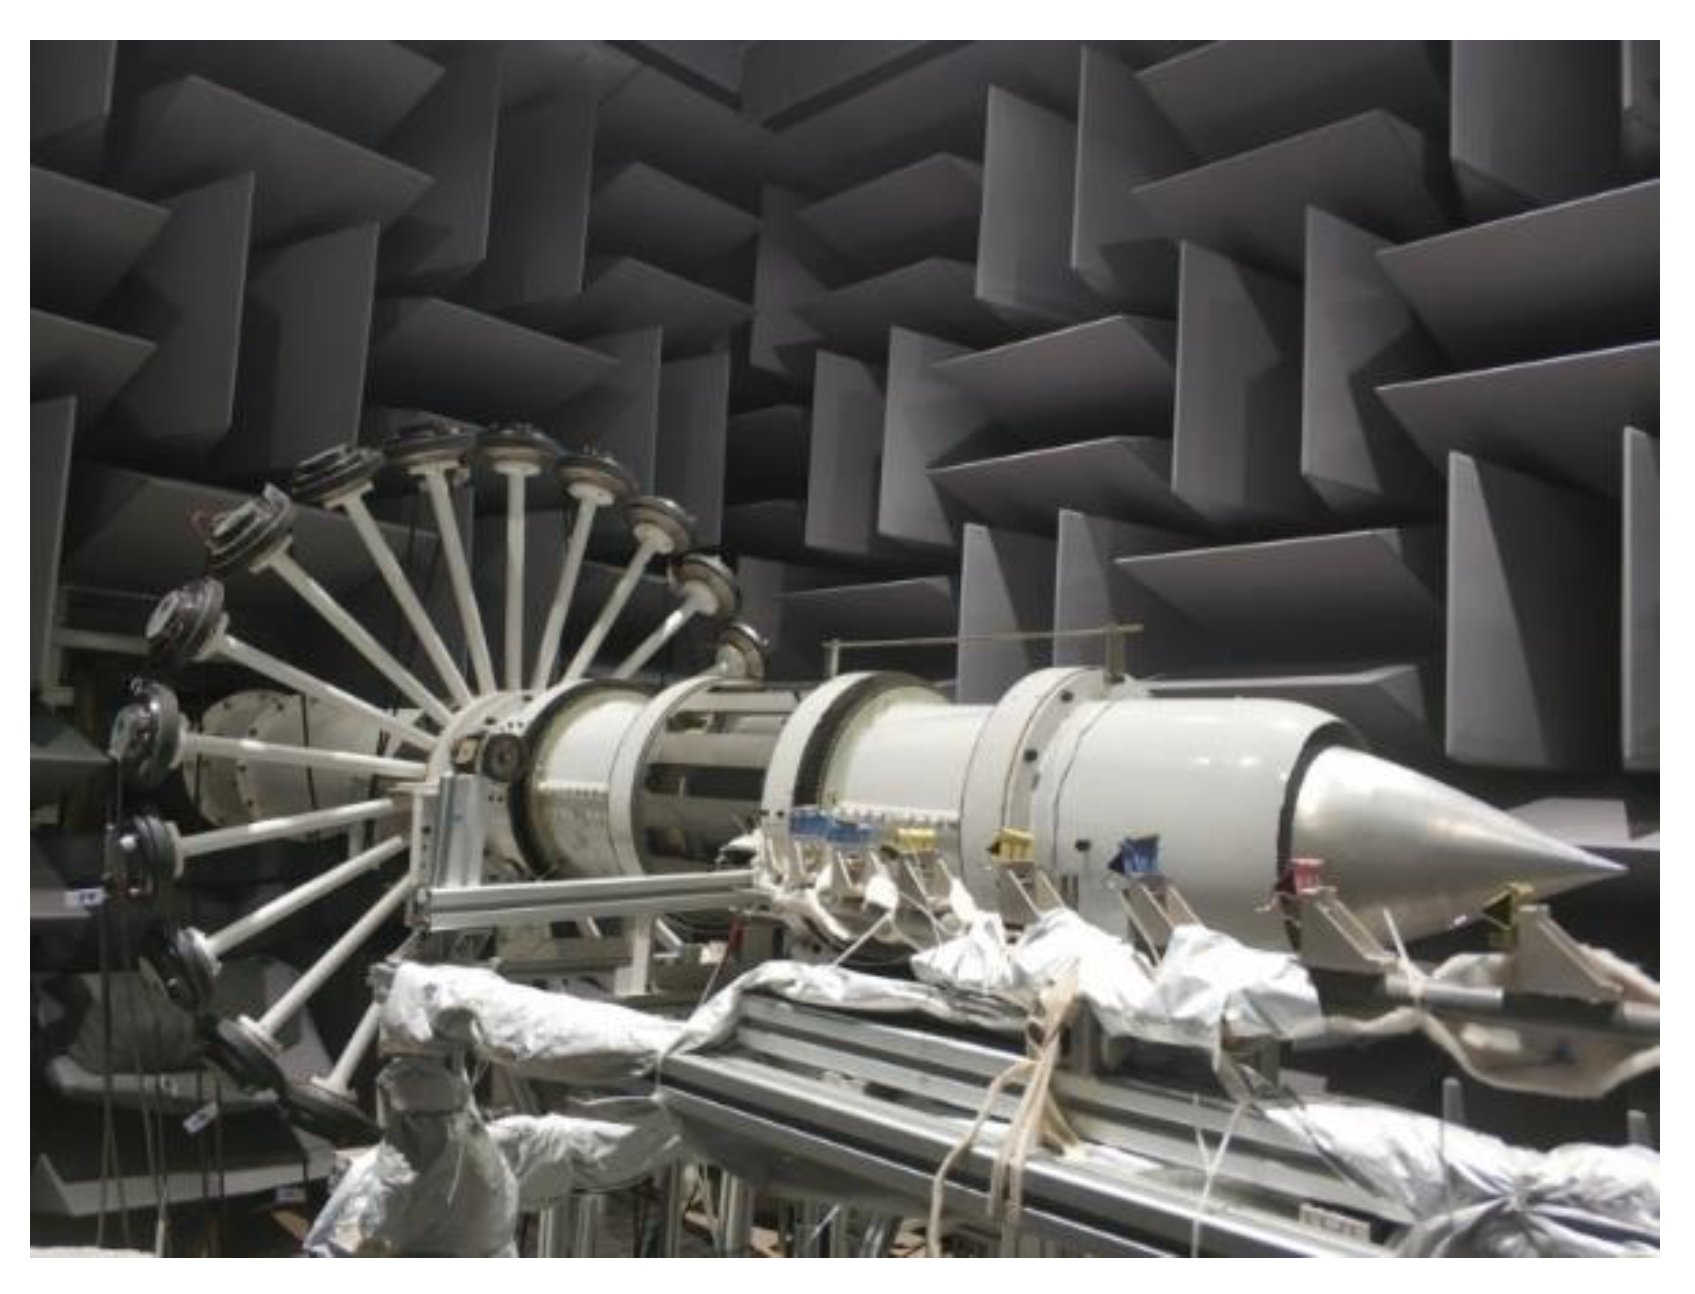
3.2. Experimental Device of Acoustic Spinning Mode Generator
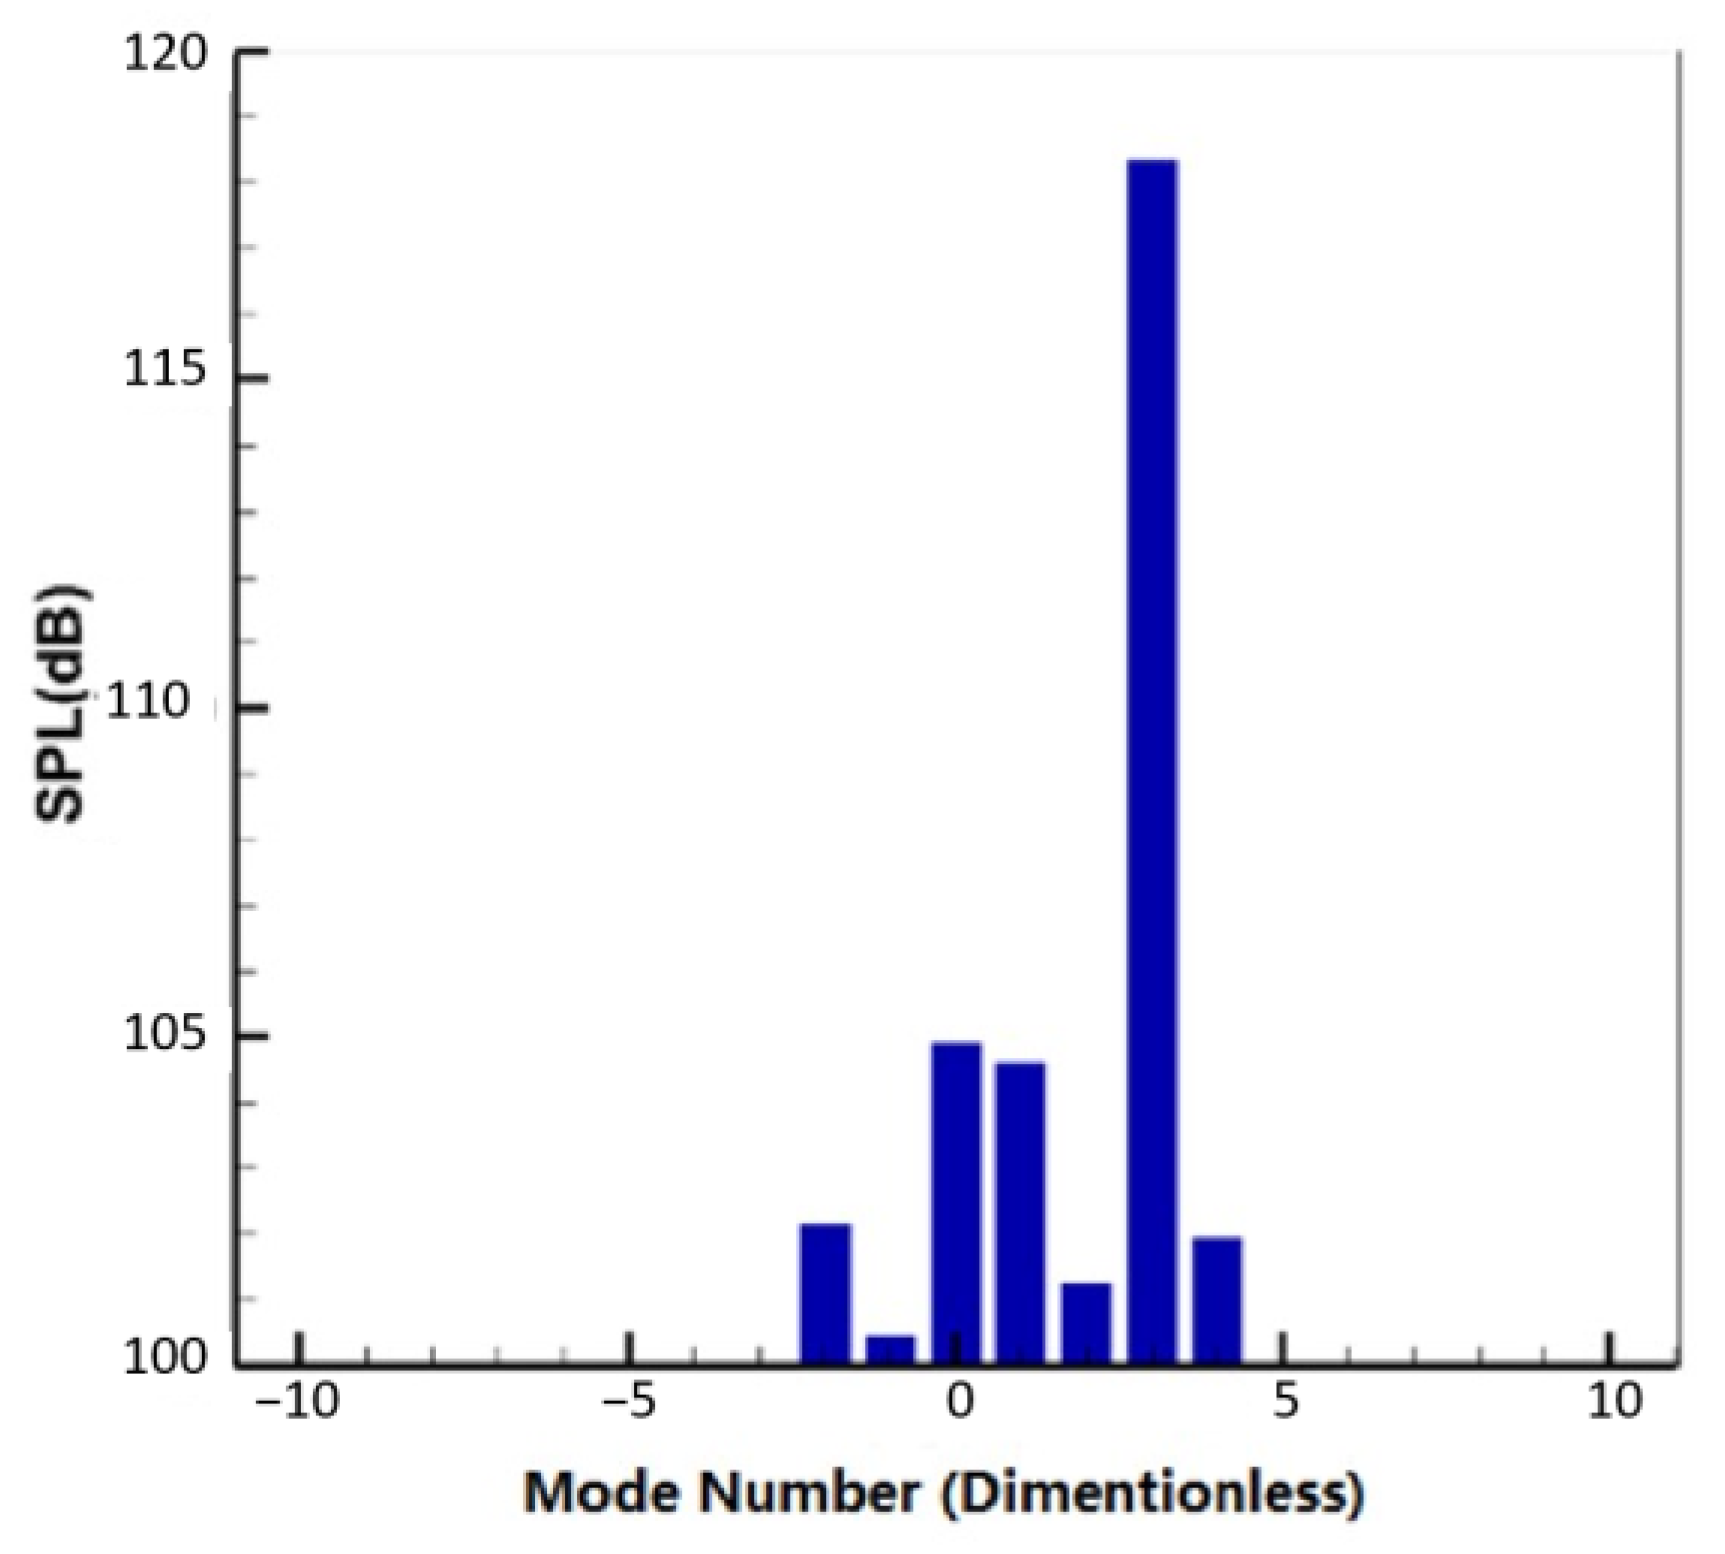
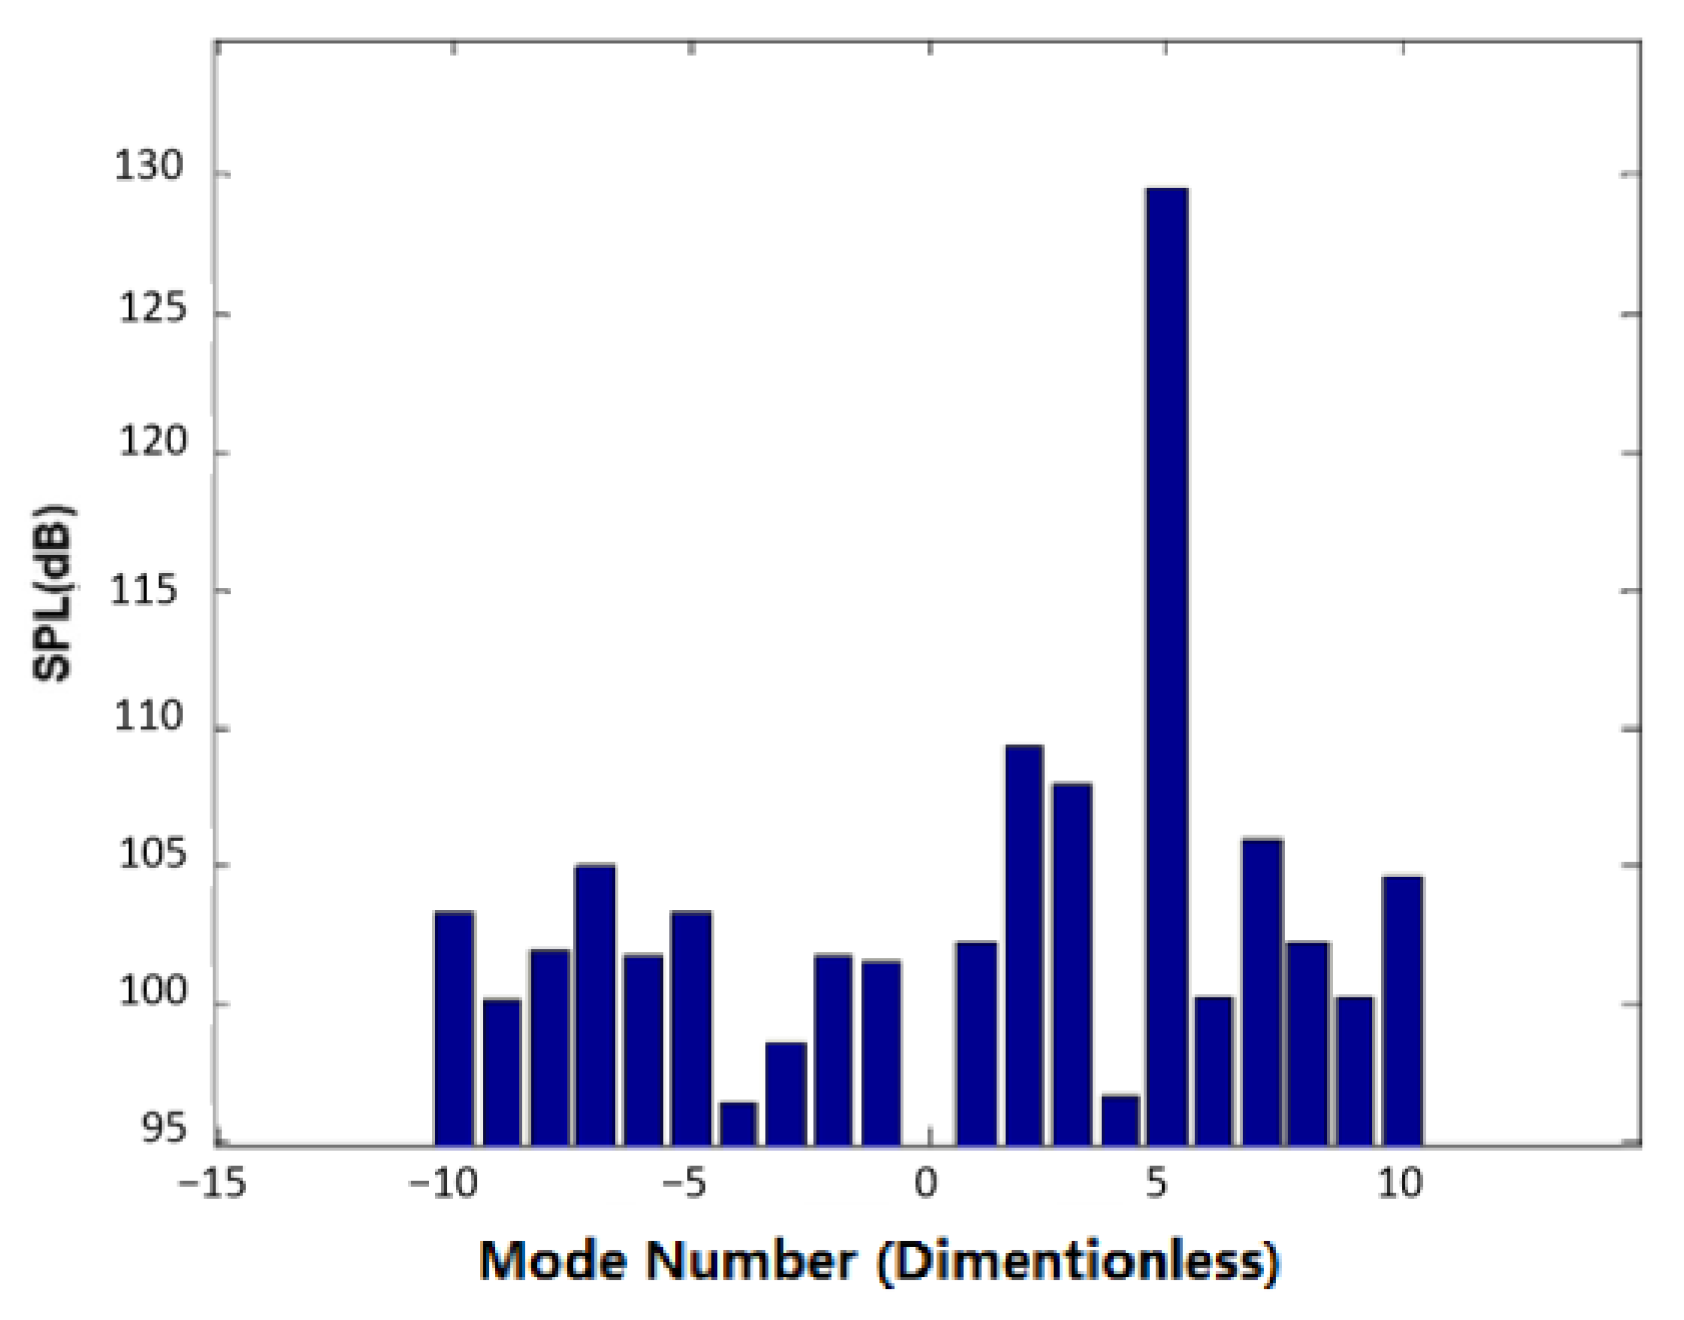
3.3. Verification of Acoustic Spinning Mode Generator
4. Experimental Validation of Noise Reduction of Full-Size Nacelle Acoustic Liner
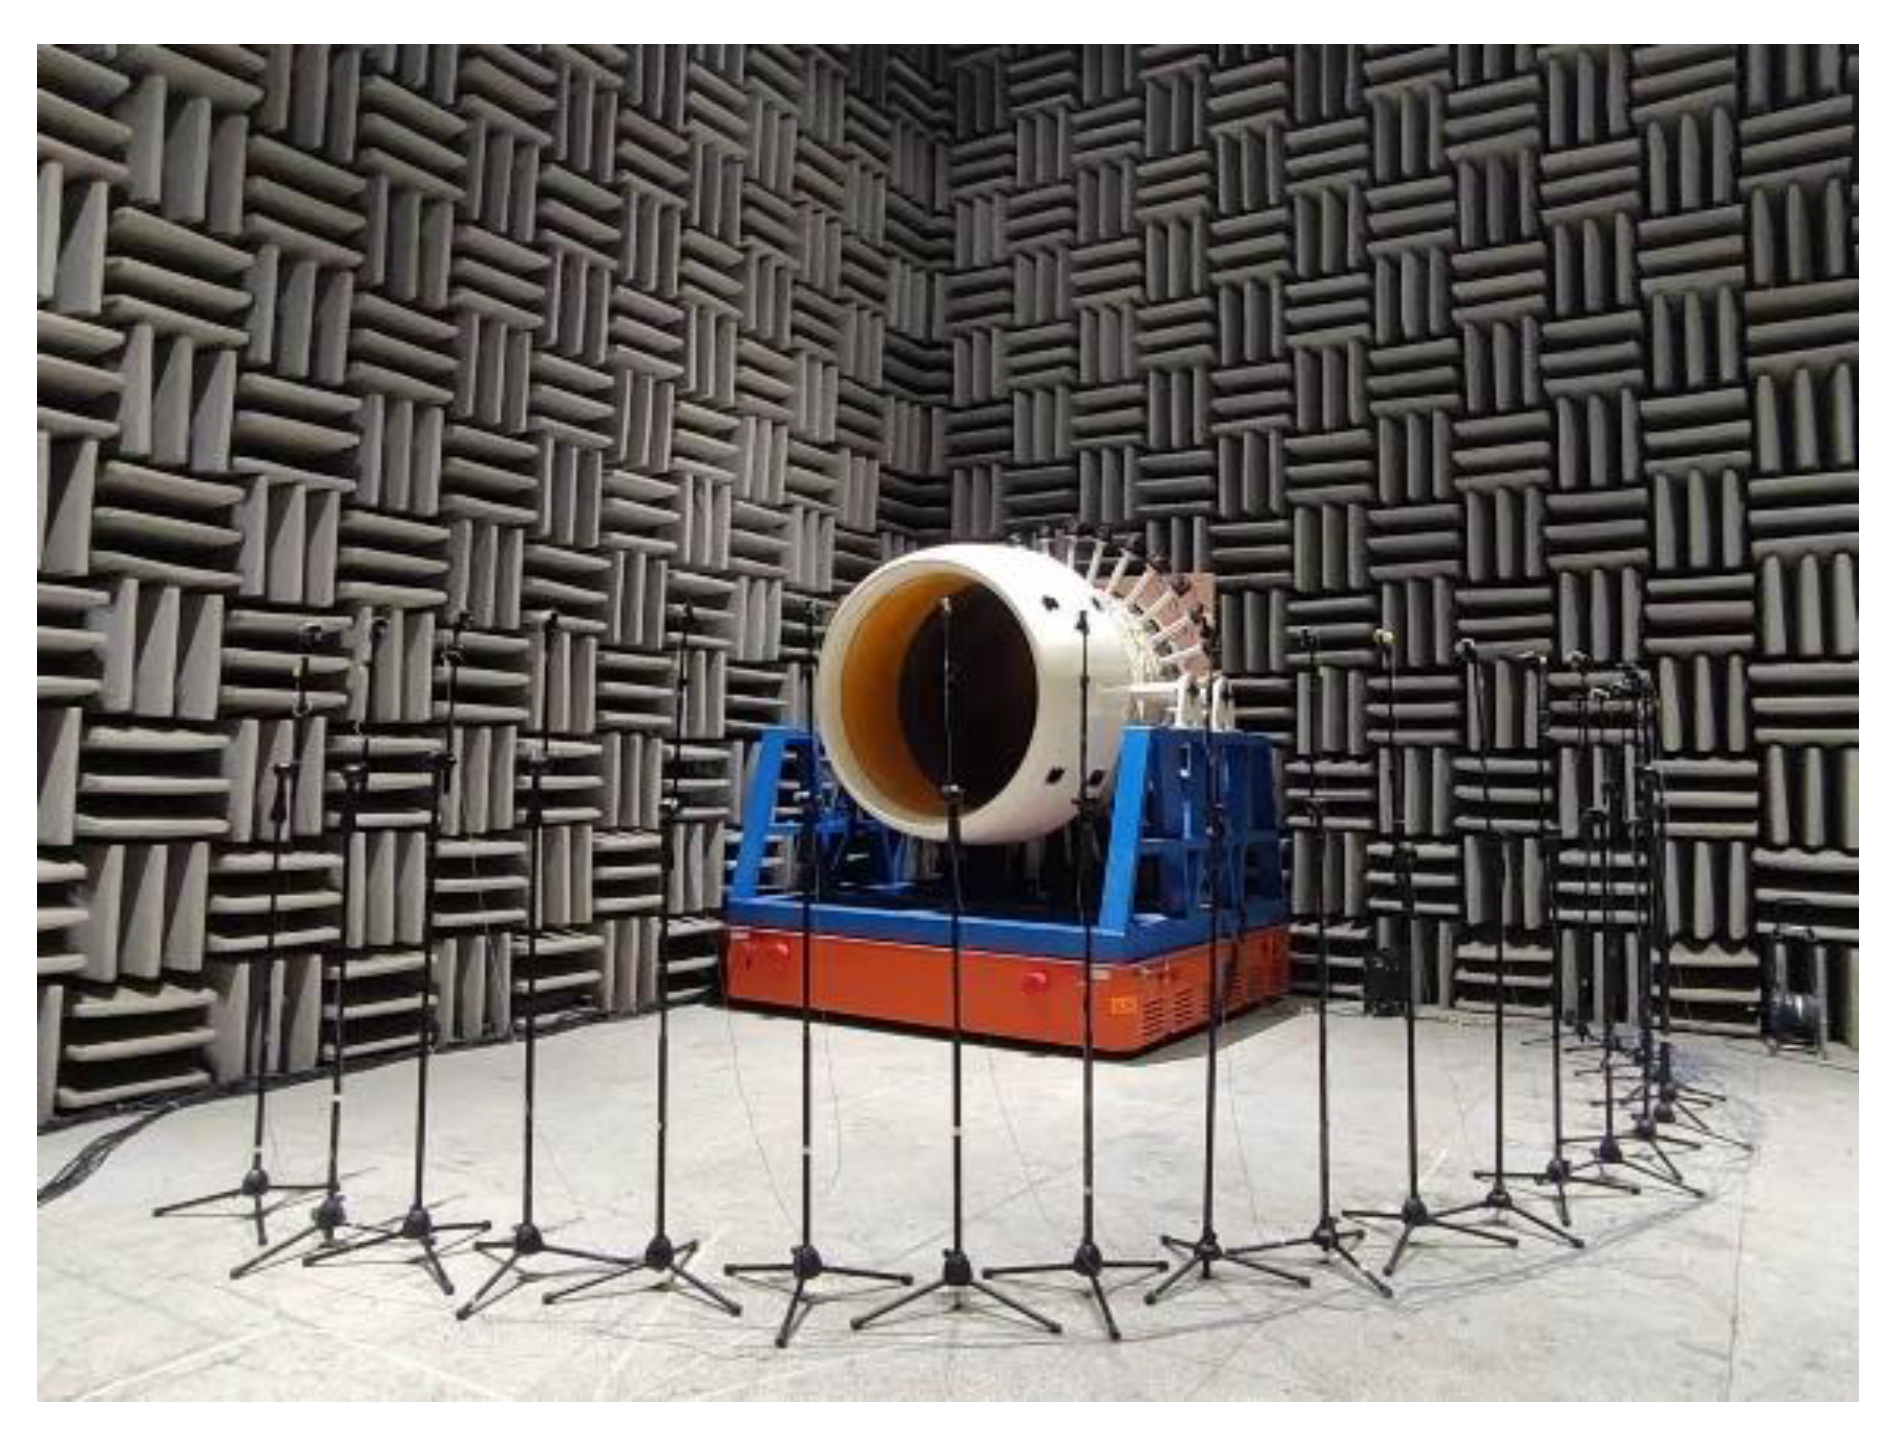
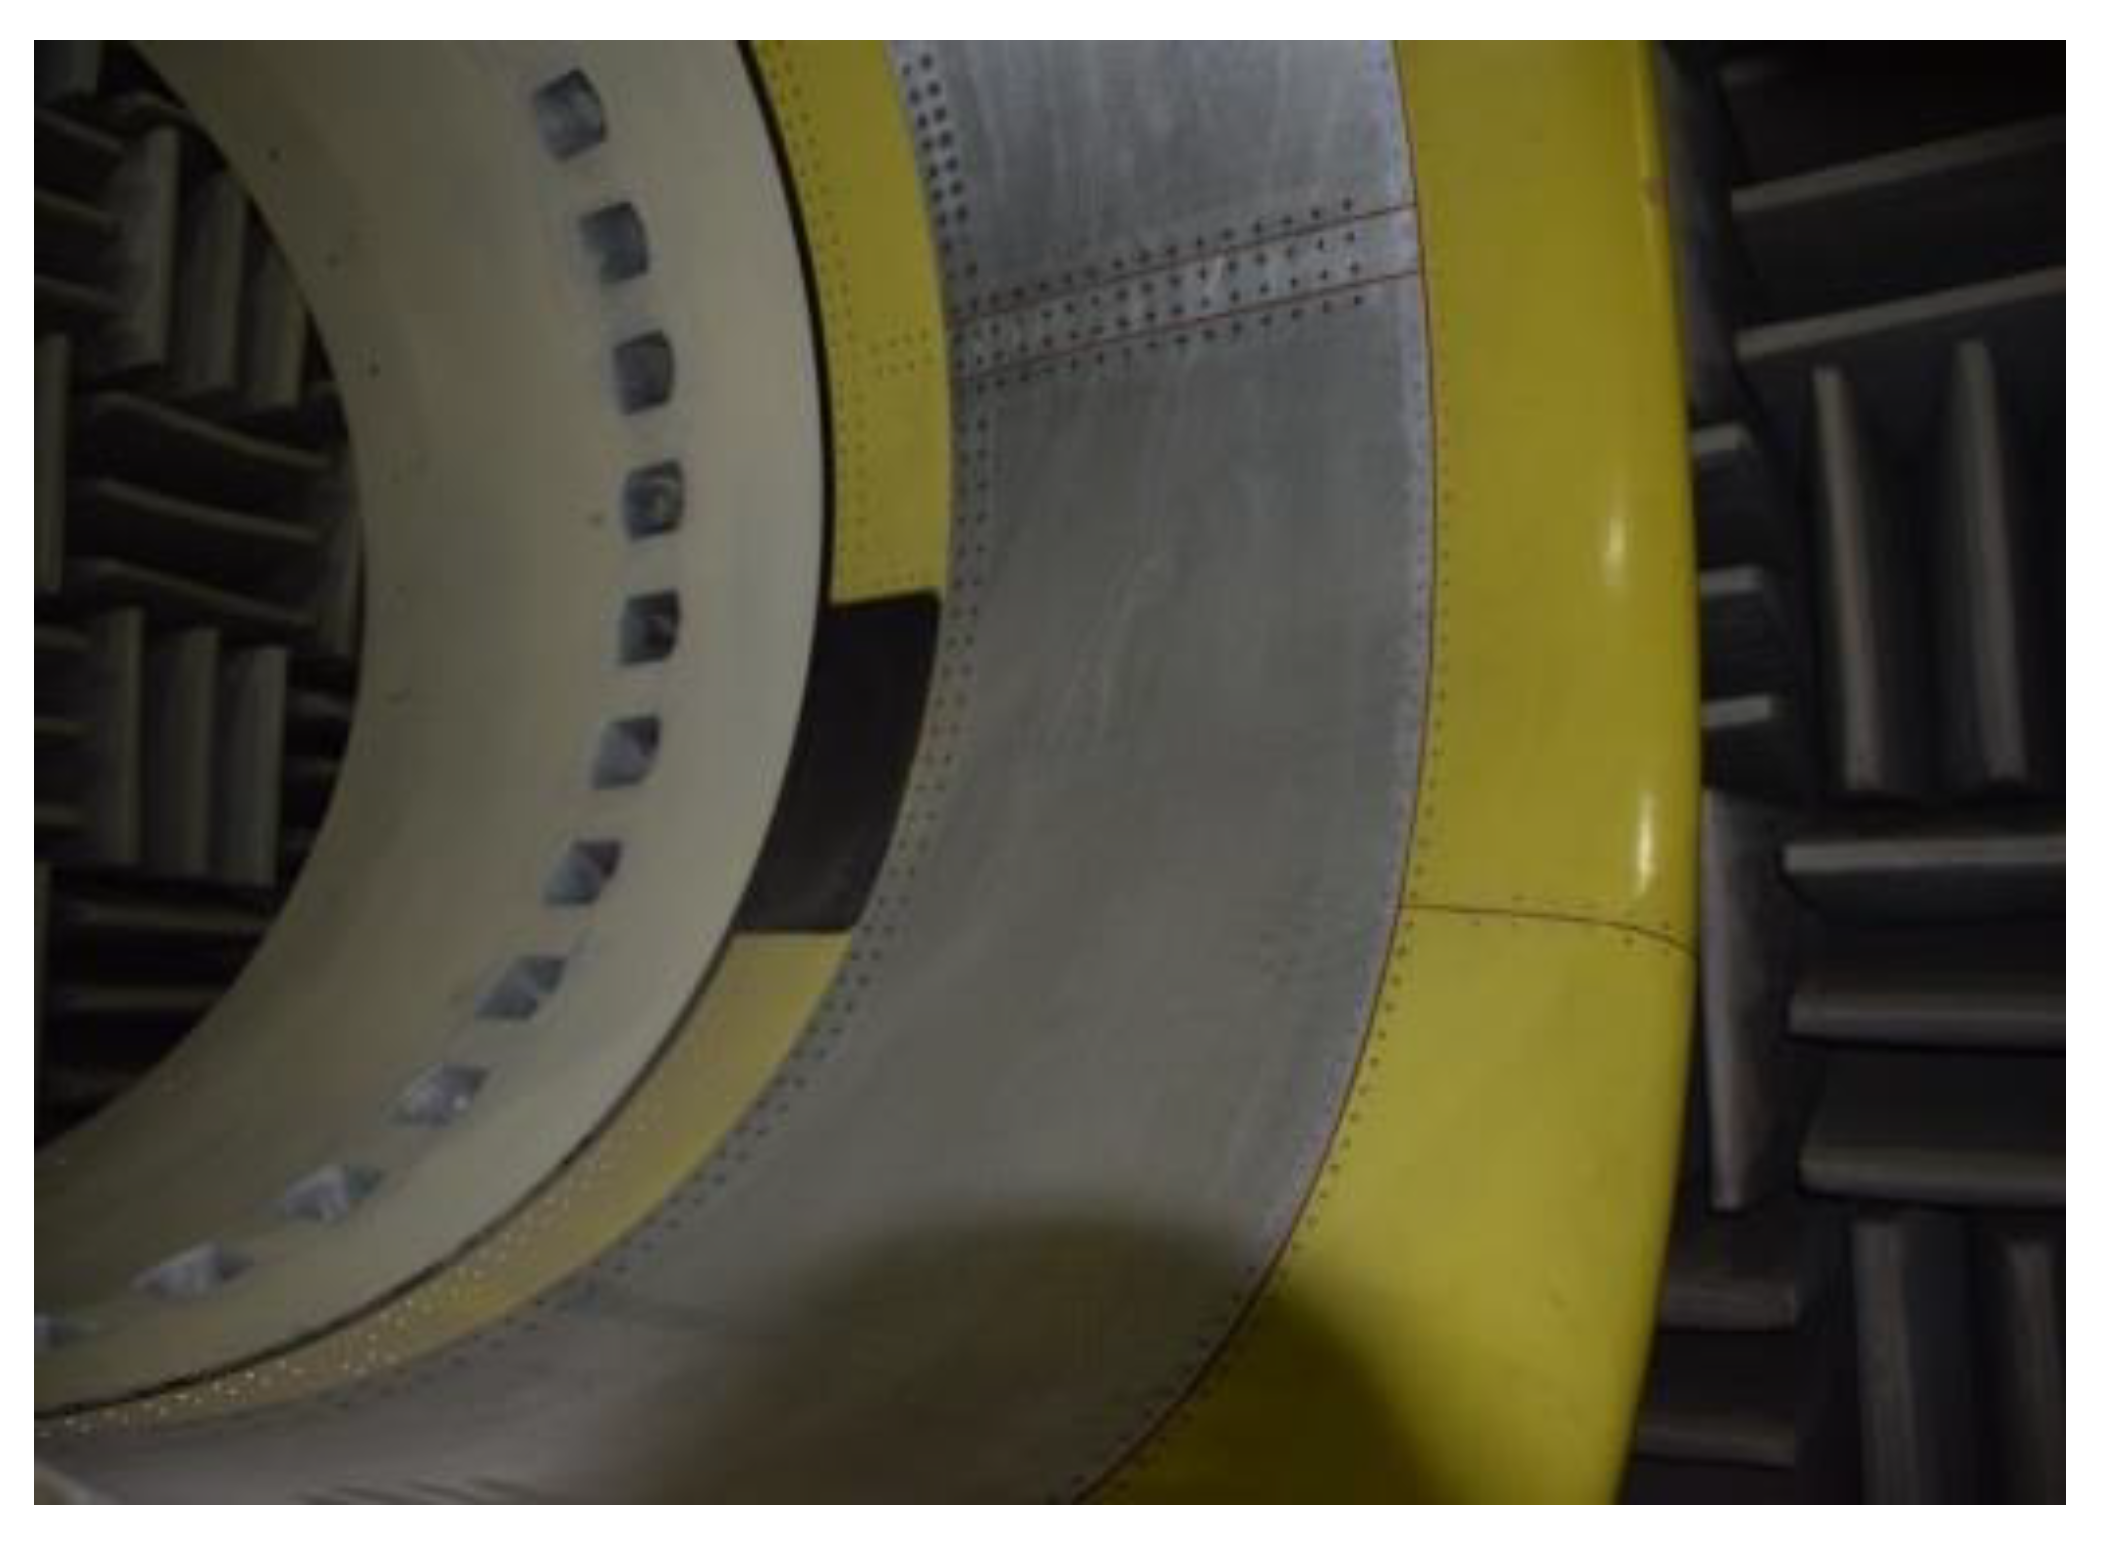
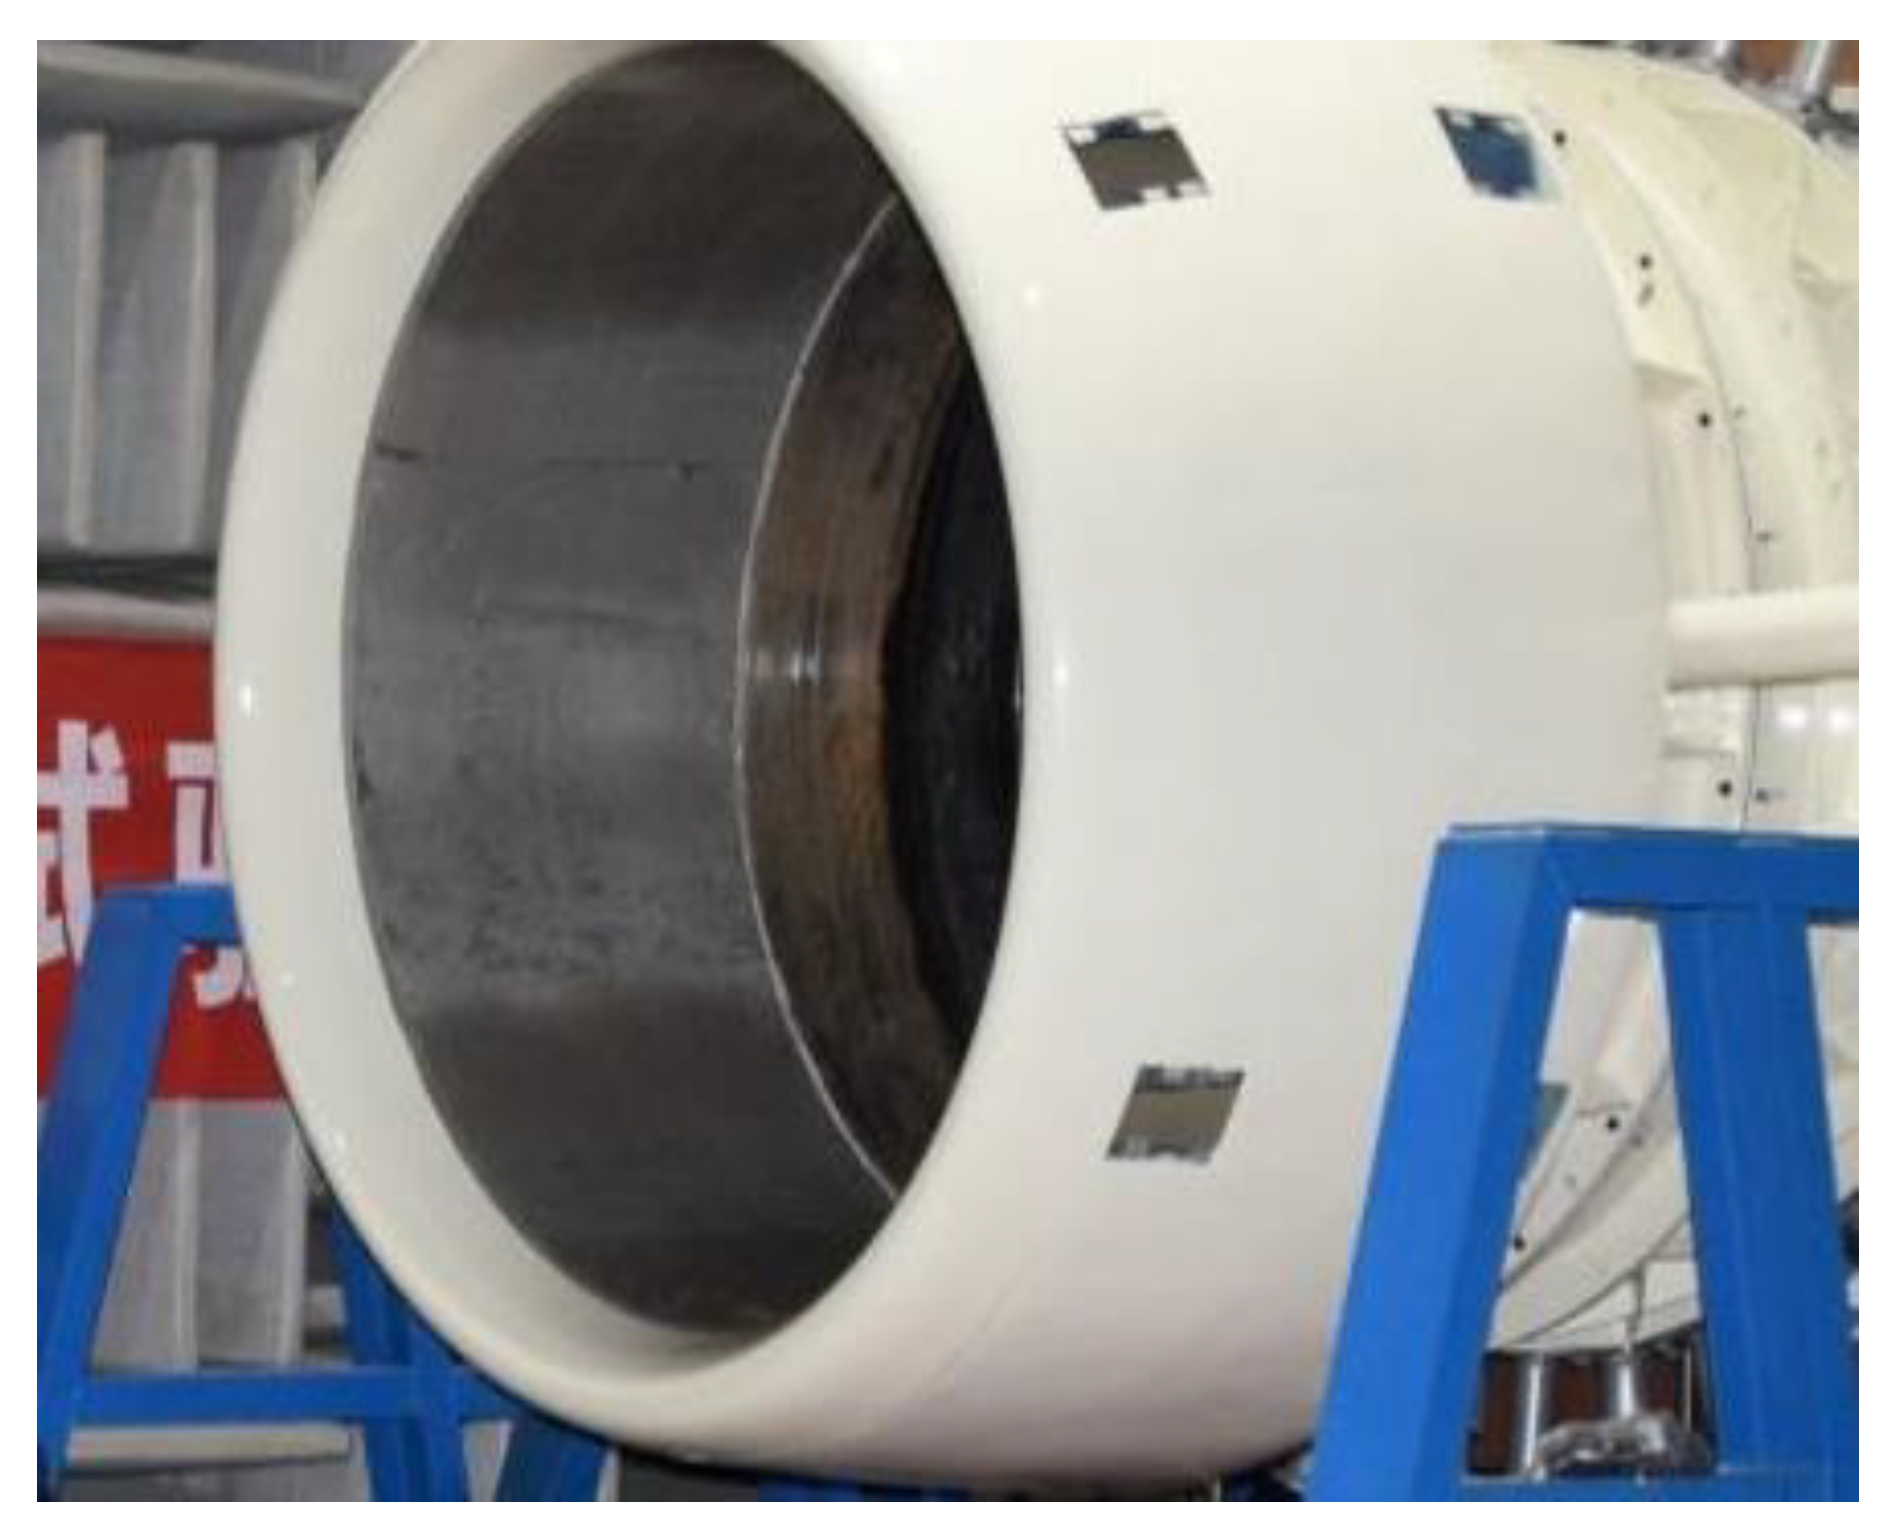
4.1. Experimental Setup
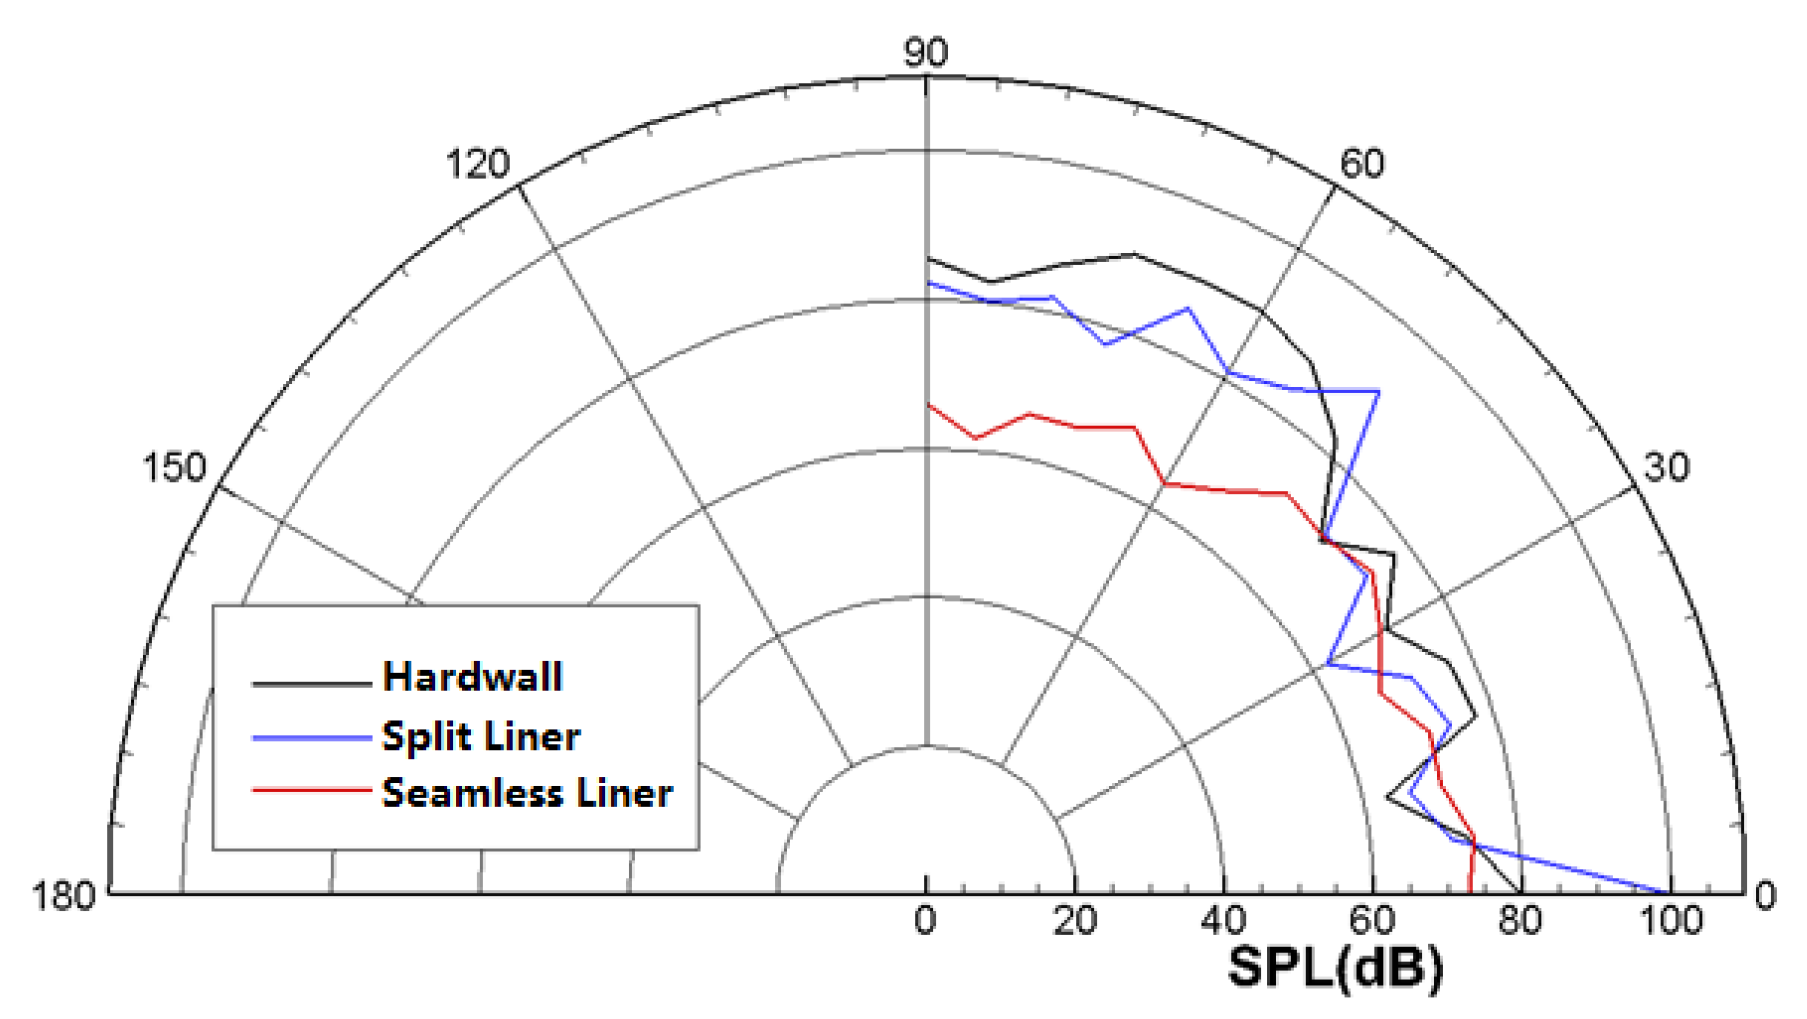
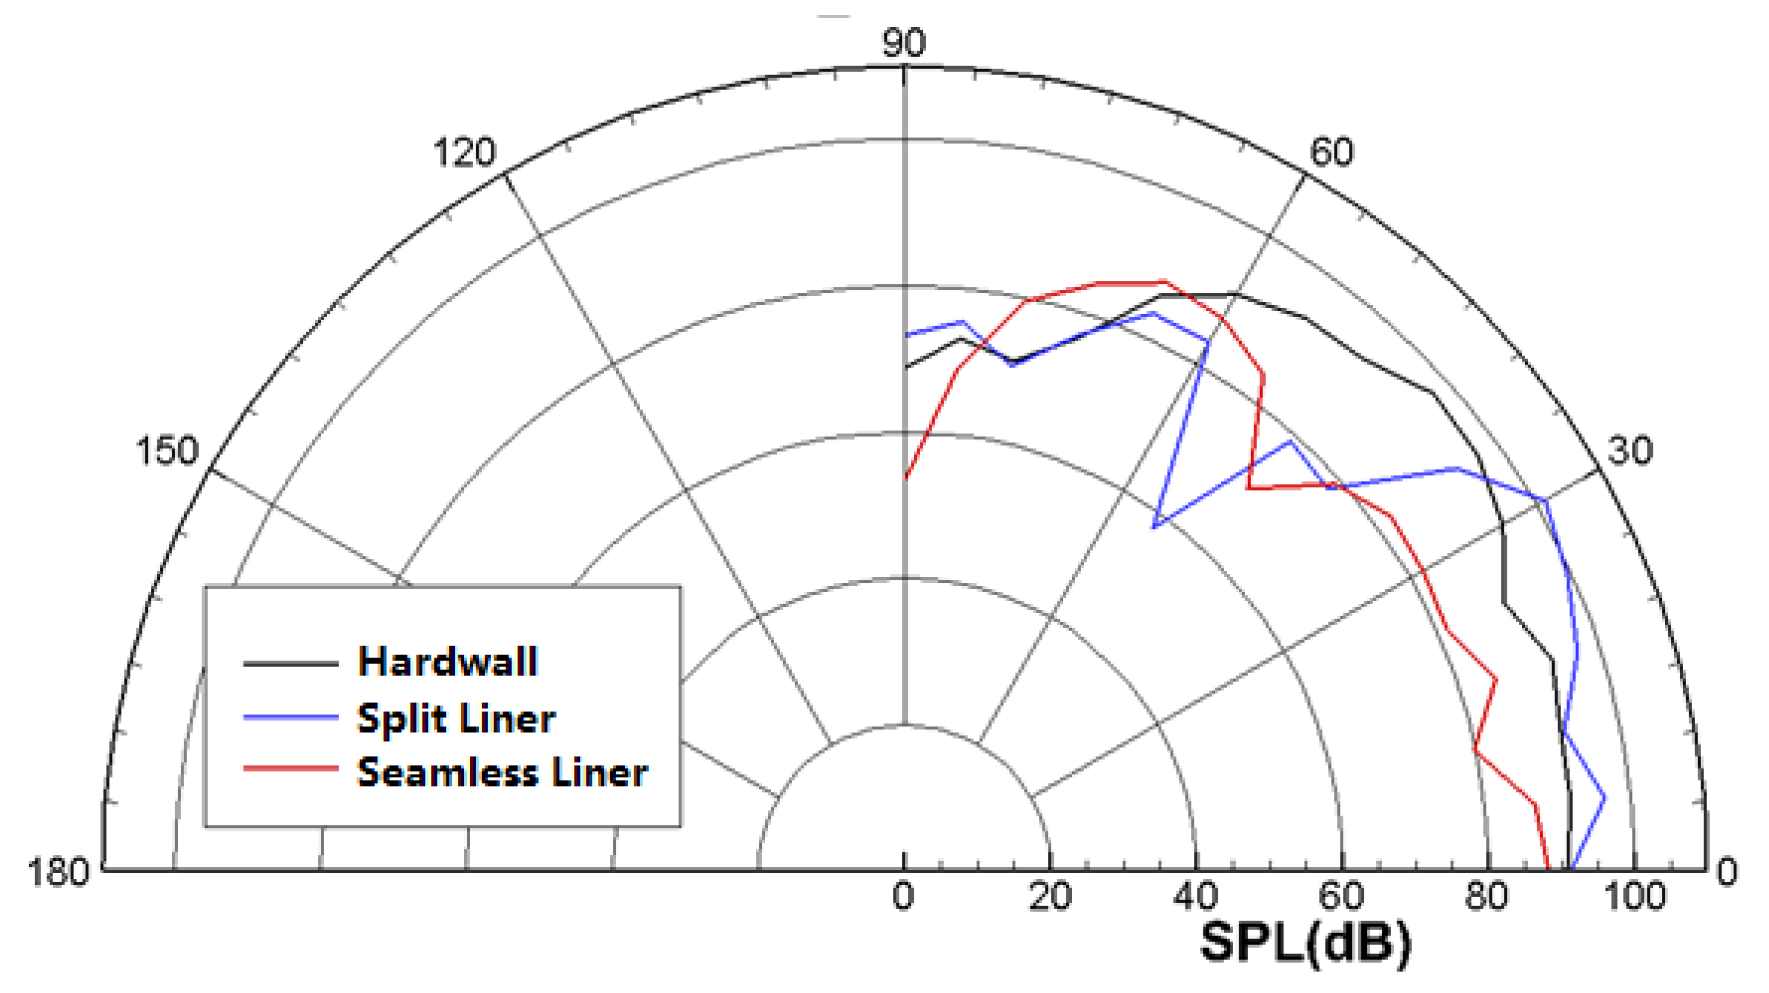
4.2. Noise Reduction Performance Test of Full Size Acoustic Liner Using Spinning Acoustic Mode Generator
5. Conclusions
Author Contributions
Funding
Institutional Review Board Statement
Informed Consent Statement
Data Availability Statement
Conflicts of Interest
References
- Nark, D.M.; Jones, M.G. An Investigation of Bifurcation Acoustic Treatment Effects on Aft-Fan Engine Nacelle Noise. In Proceedings of the 25th AIAA/CEAS Aeroacoustics Conference, Delft, The Netherlands, 20–23 May 2019. [Google Scholar]
- Envia, E. Fan noise reduction-an overview. In Proceedings of the 39th Aerospace Sciences Meeting and Exhibit, Reno, NV, USA, 8–11 January 2001. [Google Scholar]
- Wang, X.Y.; Sun, X.F. Transfer element method with application to acoustic design of aero-engine nacelle. Chin. J. Aeronaut. 2015, 28, 327–345. [Google Scholar] [CrossRef] [Green Version]
- Dean, P. An in situ method of wall acoustic impedance measurement in flow ducts. J. Sound Vib. 1974, 34, 97–130. [Google Scholar] [CrossRef]
- Zandbergen, T. On the practical use of a three-microphone technique for in-situ acoustic impedance measurements on double layer flow duct liners. In Proceedings of the 7th Aeroacoustics Conference, Palo Alto, CA, USA, 5–7 October 1981. [Google Scholar]
- Watson, W.R.; Jones, M.G.; Parrott, T.L. Validation of an impedance education method in flow. AIAA J. 1999, 37, 818–824. [Google Scholar] [CrossRef]
- Jones, M.G.; Watson, W.R.; Tracy, M.B.; Parrott, T.L. Comparison of two waveguide methods for educating liner impedance in grazing flow. AIAA J. 2004, 42, 232–240. [Google Scholar] [CrossRef]
- Watson, W.R.; Tanner, S.E.; Parrott, T.L. Optimization method for educating variable-impedance liner properties. AIAA J. 1998, 36, 18–23. [Google Scholar] [CrossRef]
- Jones, M.G.; Watson, W.R. Effects of liner length and attenuation on NASA Langley impedance education. In Proceedings of the 22nd AIAA/CEAS Aeroacoustics Conference, Lyon, France, 30 May–1 June 2016. [Google Scholar]
- Jing, X.D.; Peng, S.; Sun, X.F. A straightforward method for wall impedance education in a flow duct. J. Acoust. Soc. Am. 2008, 124, 227–234. [Google Scholar] [CrossRef] [PubMed]
- Qiu, X.; Xin, B.; Jing, X. Straightforward impedance education method for non-grazing incidence wave with multiple modes. J. Sound Vib. 2018, 432, 1–16. [Google Scholar] [CrossRef]
- Chen, L.; Du, L.; Wang, X.; Jing, X.; Sun, X. A three-dimensional straightforward method for liner impedance education in uniform grazing flow. J. Sound Vib. 2019, 468, 115119. [Google Scholar] [CrossRef]
- Loew, R.; Lauer, J.; Mcallister, J.; Sutliff, D.L. The advanced noise control fan. In Proceedings of the 25th AIAA Aerodynamic Measurement Technology and Ground Testing Conference, San Francisco, CA, USA, 5–8 June 2006. [Google Scholar]
- Tapken, U.; Raitor, T.; Enghardt, L. Tonal noise radiation from an UHBR fan—Optimized in-duct radial mode analysis. In Proceedings of the 15th AIAA/CEAS Aeroacoustics Conference (30th AIAA Aeroacoustics Conference), Miami, FL, USA, 11–13 May 2009. [Google Scholar]
- Yang, J.F.; Xue, D.W.; Li, Z.H.; Huang, T.; Xu, J. Single and double degree-of-freedom acoustic liners under grazing flow: Experiment. Acta Aeronaut. Astronaut. Sin. 2020, 41, 223860. [Google Scholar]
- Xin, B.; Yang, J.; Jing, X.; Sun, X. Experimental and numerical investigation of anechoic termination for a duct with mean flow. Appl. Acoust. 2018, 139, 213–221. [Google Scholar] [CrossRef]
- Davies, P. Practical flow duct acoustics. J. Sound Vib. 1988, 124, 91–115. [Google Scholar] [CrossRef]
- Yan, Q.; Xue, D.W.; Huang, W.C.; Gao, X. Design of acoustic spinning mode synthesizer an its application in aeroengine nacelle liner validation experiment. In Proceedings of the 15th Russia-Chinese Conference, TsAGI, Zhukovsky, 17–18 July 2017. [Google Scholar]
- Sijtsma, P.; Zillmann, J. In-duct and far-field mode detection techniques. In Proceedings of the 13th AIAA/CEAS Aeroacoustics Conference (28th AIAA Aeroacoustics Conference), Rome, Italy, 21–23 May 2007. [Google Scholar]
- Tapken, U.; Enghardt, L. Optimization of sensor arrays for radial mode analysis in flow ducts. In Proceedings of the 12th AIAA/CEAS Aeroacoustics Conference (27th AIAA Aeroacoustics Conference), Cambridge, MA, USA, 8–10 May 2006. [Google Scholar]
- Sutliff, D.L. Rotating rake turbofan duct mode measurement system. J. Acoust. Soc. Am. 2005, 118, 1864. [Google Scholar] [CrossRef]


| Ma | 0 | 0.085 | 0.18 | 0.26 |
| fc/HZ | 3400 | 3387 | 3344 | 3283 |
| Excitation Frequency | Acoustic Modes Order in Circumferential Direction | Acoustic Directivities Test |
|---|---|---|
| 1250 Hz | 9, 10, 12, 15 | 0~120° |
| 2000 Hz | 9, 10, 12, 15 | 0~120° |
| Parameter | Value | Material |
|---|---|---|
| Panel thickness/mm | 1 | 2024-T62 |
| Hole size/mm | 1 | / |
| Perforation ratio/% | 6.55 | 2024-T62 |
| Honeycomb height/mm | 30 | 5052 Aluminum |
| Parameter | Value | Material | |
|---|---|---|---|
| Segment A | Segment B | ||
| Panel thickness/mm | 1.2 | 1.2 | Fiber glass |
| Hole size/mm | 1.3 | 3.3 | / |
| Wire mesh count | 635 | 635 | Stainless steel |
| Perforation ratio/% | 30 | 18 | / |
| Honeycomb height/mm | 18 | 40 | NOMEX® |
| Excitation | Hardwall/dB | Split Acoustic Liner | Seamless Liner | |||
|---|---|---|---|---|---|---|
| SPL/dB | Noise Reduction/dB | SPL/dB | Noise Reduction/dB | Improvement/dB | ||
| 1250 Hz, 9th Mode | 98.5 | 98.2 | 0.3 | 83.6 | 14.9 | 14.6 |
| 1250 Hz, 10th Mode | 96.9 | 99.2 | −2.3 | 91.3 | 5.6 | 7.9 |
| 1250 Hz, 12th Mode | 83.9 | 90.7 | −6.8 | 74.9 | 9 | 15.8 |
| 1250 Hz, 15th Mode | 90.4 | 100.4 | −10 | 74.1 | 16.3 | 26.3 |
| 2000 Hz, 9th Mode | 93.8 | 91.6 | 2.2 | 86.4 | 7.4 | 5.2 |
| 2000 Hz, 10th Mode | 95.8 | 105.2 | −9.4 | 84.8 | 11 | 20.4 |
| 2000 Hz, 12th Mode | 91.9 | 107.3 | −15.4 | 84.6 | 7.3 | 22.7 |
| 2000 Hz, 15th Mode | 97.4 | 101.4 | −4 | 88.3 | 9.1 | 13.1 |
Disclaimer/Publisher’s Note: The statements, opinions and data contained in all publications are solely those of the individual author(s) and contributor(s) and not of MDPI and/or the editor(s). MDPI and/or the editor(s) disclaim responsibility for any injury to people or property resulting from any ideas, methods, instructions or products referred to in the content. |
© 2023 by the authors. Licensee MDPI, Basel, Switzerland. This article is an open access article distributed under the terms and conditions of the Creative Commons Attribution (CC BY) license (https://creativecommons.org/licenses/by/4.0/).
Share and Cite
Yan, Q.; Xue, D.; Mu, Q.; Yang, J.; Gao, X.; Huang, W. Acoustic Experimental Technology for Aircraft Nacelle Liner. Aerospace 2023, 10, 56. https://doi.org/10.3390/aerospace10010056
Yan Q, Xue D, Mu Q, Yang J, Gao X, Huang W. Acoustic Experimental Technology for Aircraft Nacelle Liner. Aerospace. 2023; 10(1):56. https://doi.org/10.3390/aerospace10010056
Chicago/Turabian StyleYan, Qun, Dongwen Xue, Qinqin Mu, Jiafeng Yang, Xiang Gao, and Wenchao Huang. 2023. "Acoustic Experimental Technology for Aircraft Nacelle Liner" Aerospace 10, no. 1: 56. https://doi.org/10.3390/aerospace10010056