
Thermal Impact Analysis and Electric–Thermal Coupled Modeling of Photovoltaic/Battery Space Power System with Different Surface Coatings

Abstract
:1. Introduction
- (a)
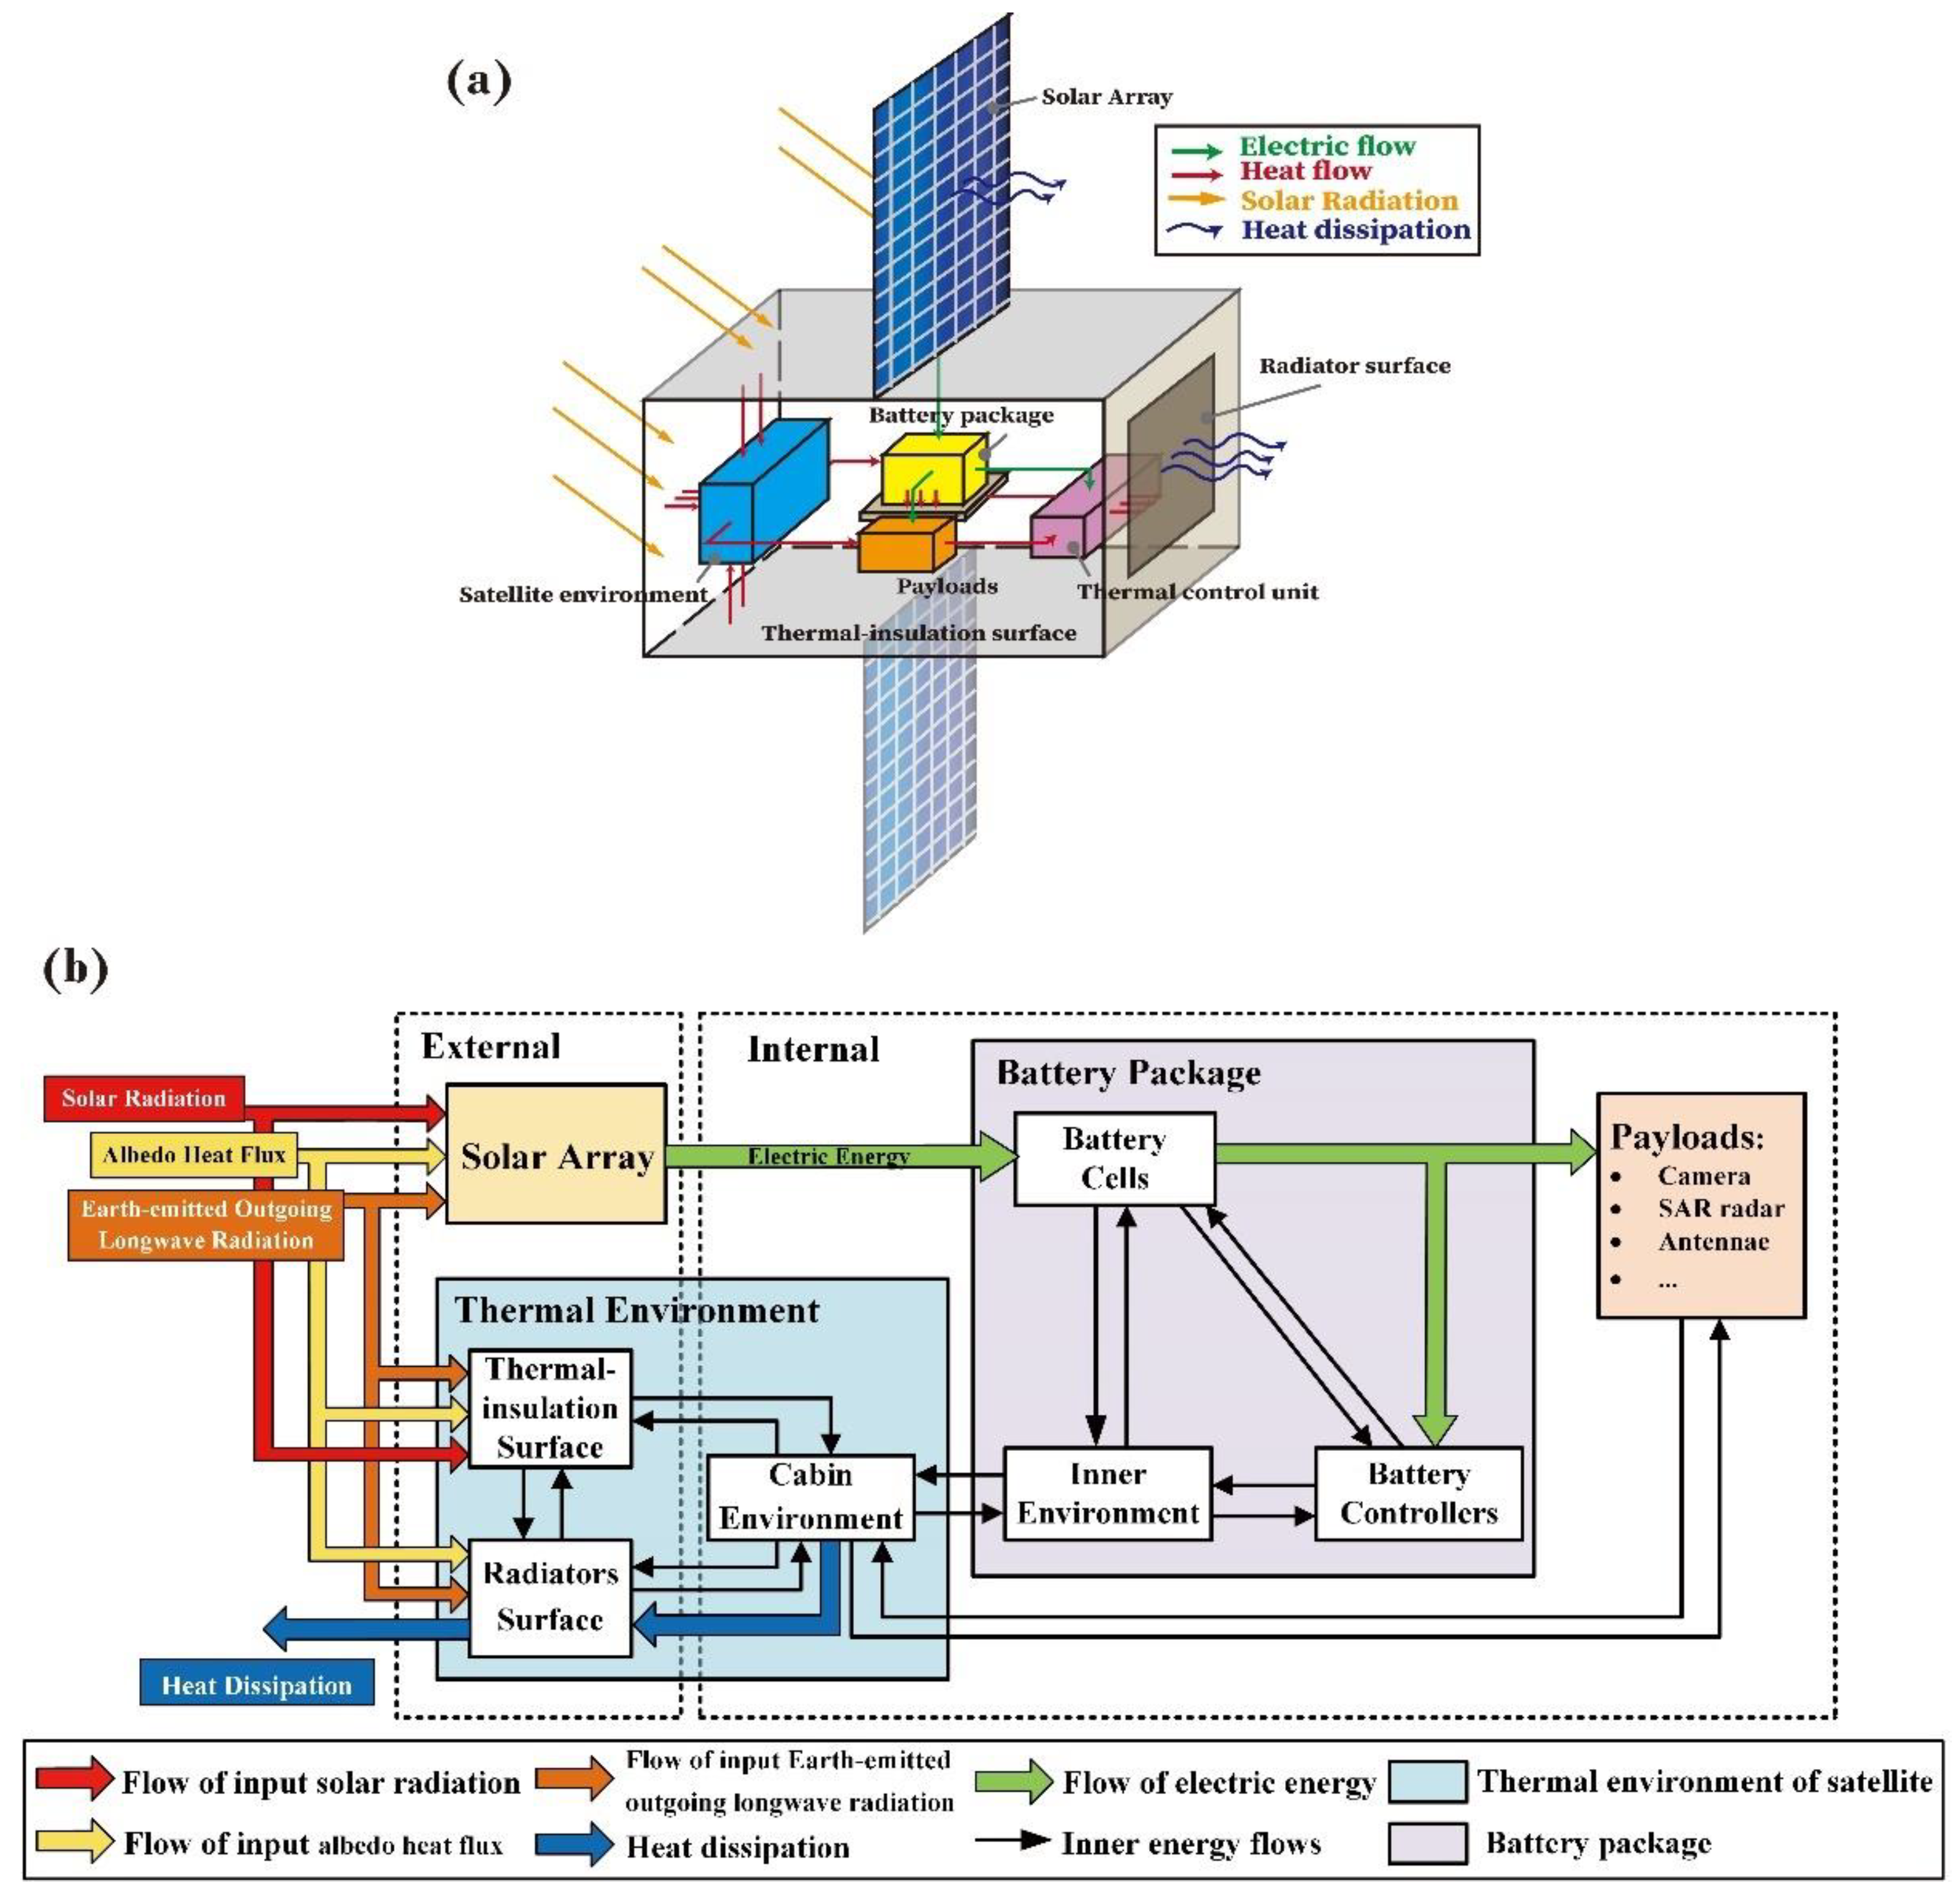
- A multiphysics model is introduced to analyze the electric–thermal behavior of space systems. Dynamic temperature models are developed to simulate the thermal environment of the satellite power system, from which the thermal effects of the surface’s coating can be observed. In temperature-influenced electrical models, the key electrical parameters of the Li-ion battery pack and single cells are expressed.
- (b)
- The change rules of temperatures and electric–thermal behavior with coating’s α/ε is clear. Error analysis and data fitting are conducted to investigate the accuracy of regularities. The results presented in this work should prove useful to the space industry, for example, in thermal designs and on-orbit battery studies.
2. Architecture of Space Li-Ion Battery Power System and Current Issues of Interdisciplinary Performance
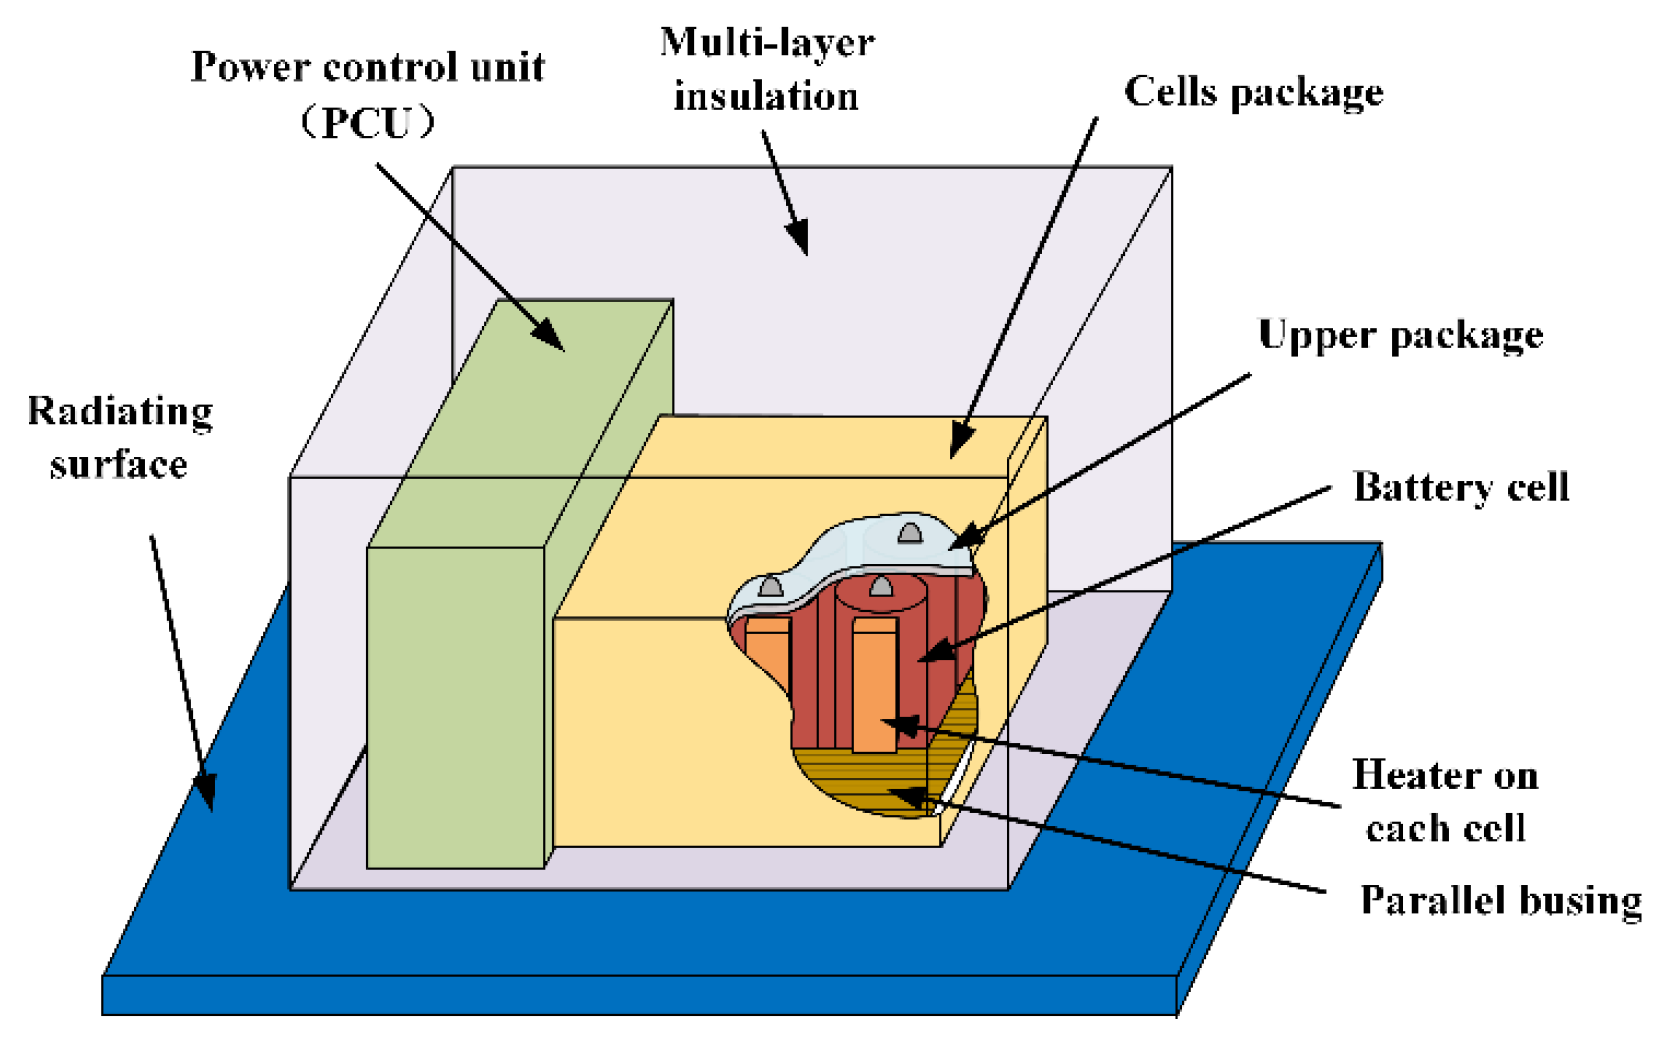
2.1. Architecture of Space Li-Ion Battery Power System
2.2. Problems in Analyzing Interdisciplinary Performance and Electric–Thermal Behavior
3. Comprehensive Models of Satellite Li-Ion Battery Power System
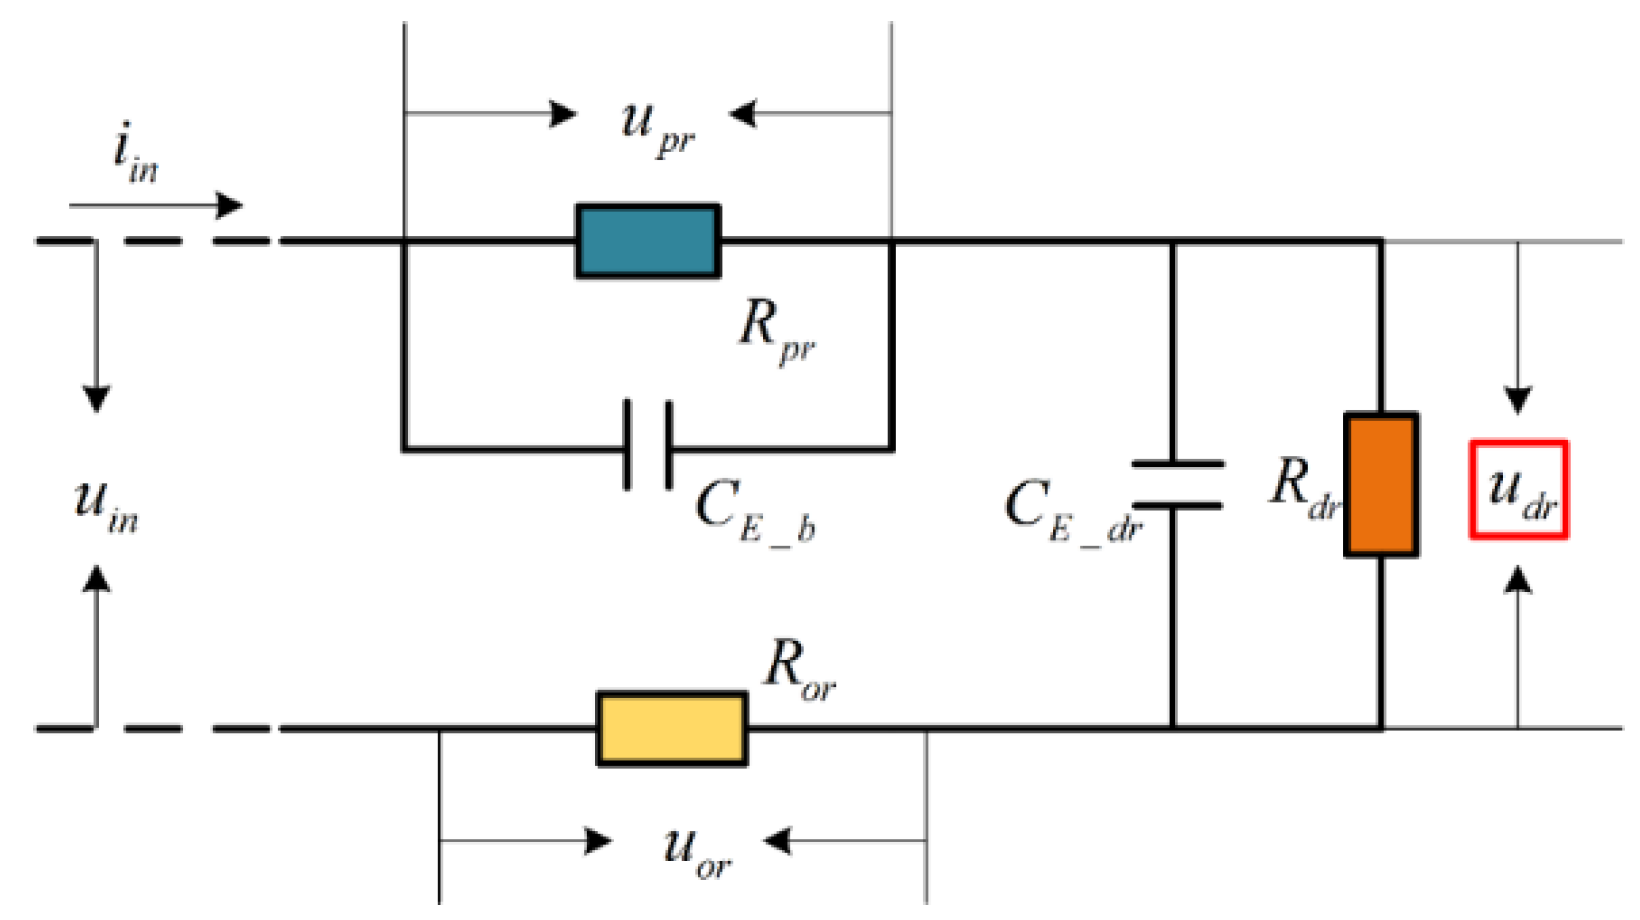
3.1. Temperature-Influenced Electrical Models
- Solar array
- Li-ion battery pack
3.2. Dynamic Temperature Models of the Space Power System
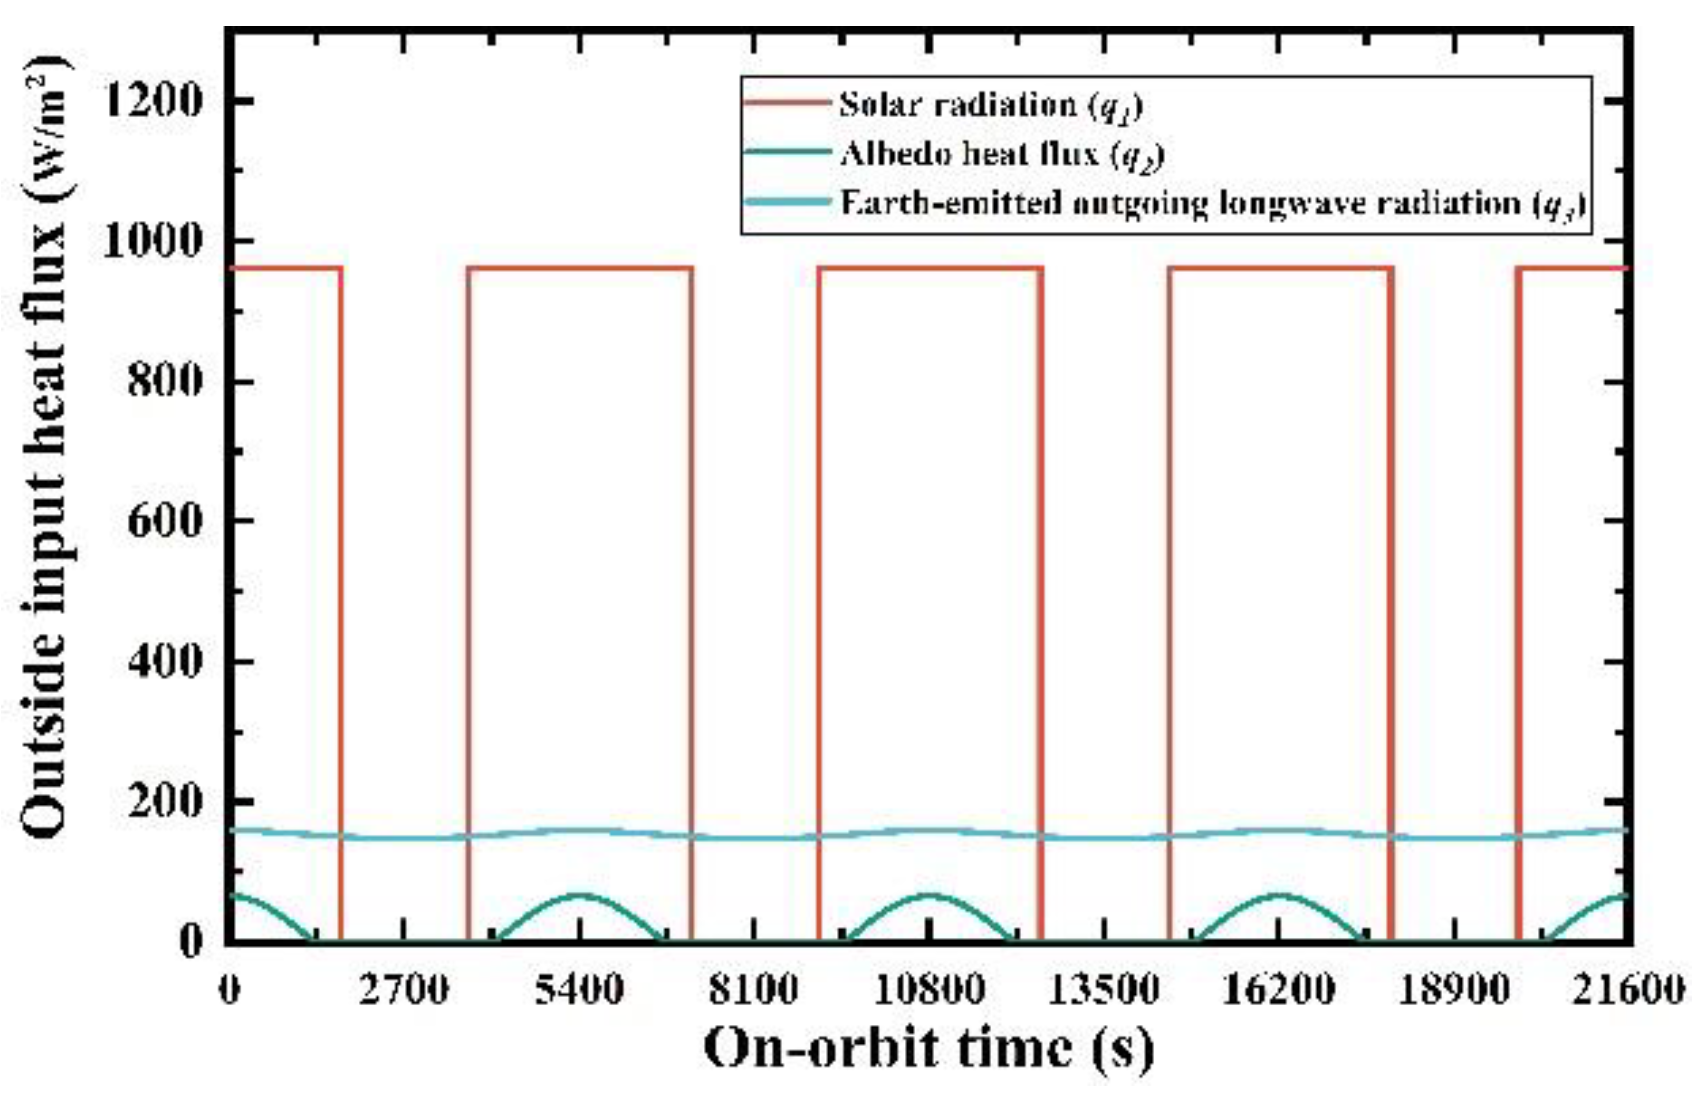
- Satellite thermal environment
- Solar array
- Li-ion battery pack
3.3. Selection of Thermal Control Coatings
4. Results and Discussions
4.1. The Cyclical Effect of on Thermal Performance
- Radiator surfaces
- Thermal-insulation surfaces
4.2. The Cyclical Effect of on Electric–Thermal Coupling Behavior
- Radiator surfaces
- Thermal-insulation surfaces
5. Conclusions
- The trends in temperature and electric–thermal behavior change with are similar in the radiator surface and thermal insulation surface. Thermal control coatings are selected according to the functions of the surfaces.
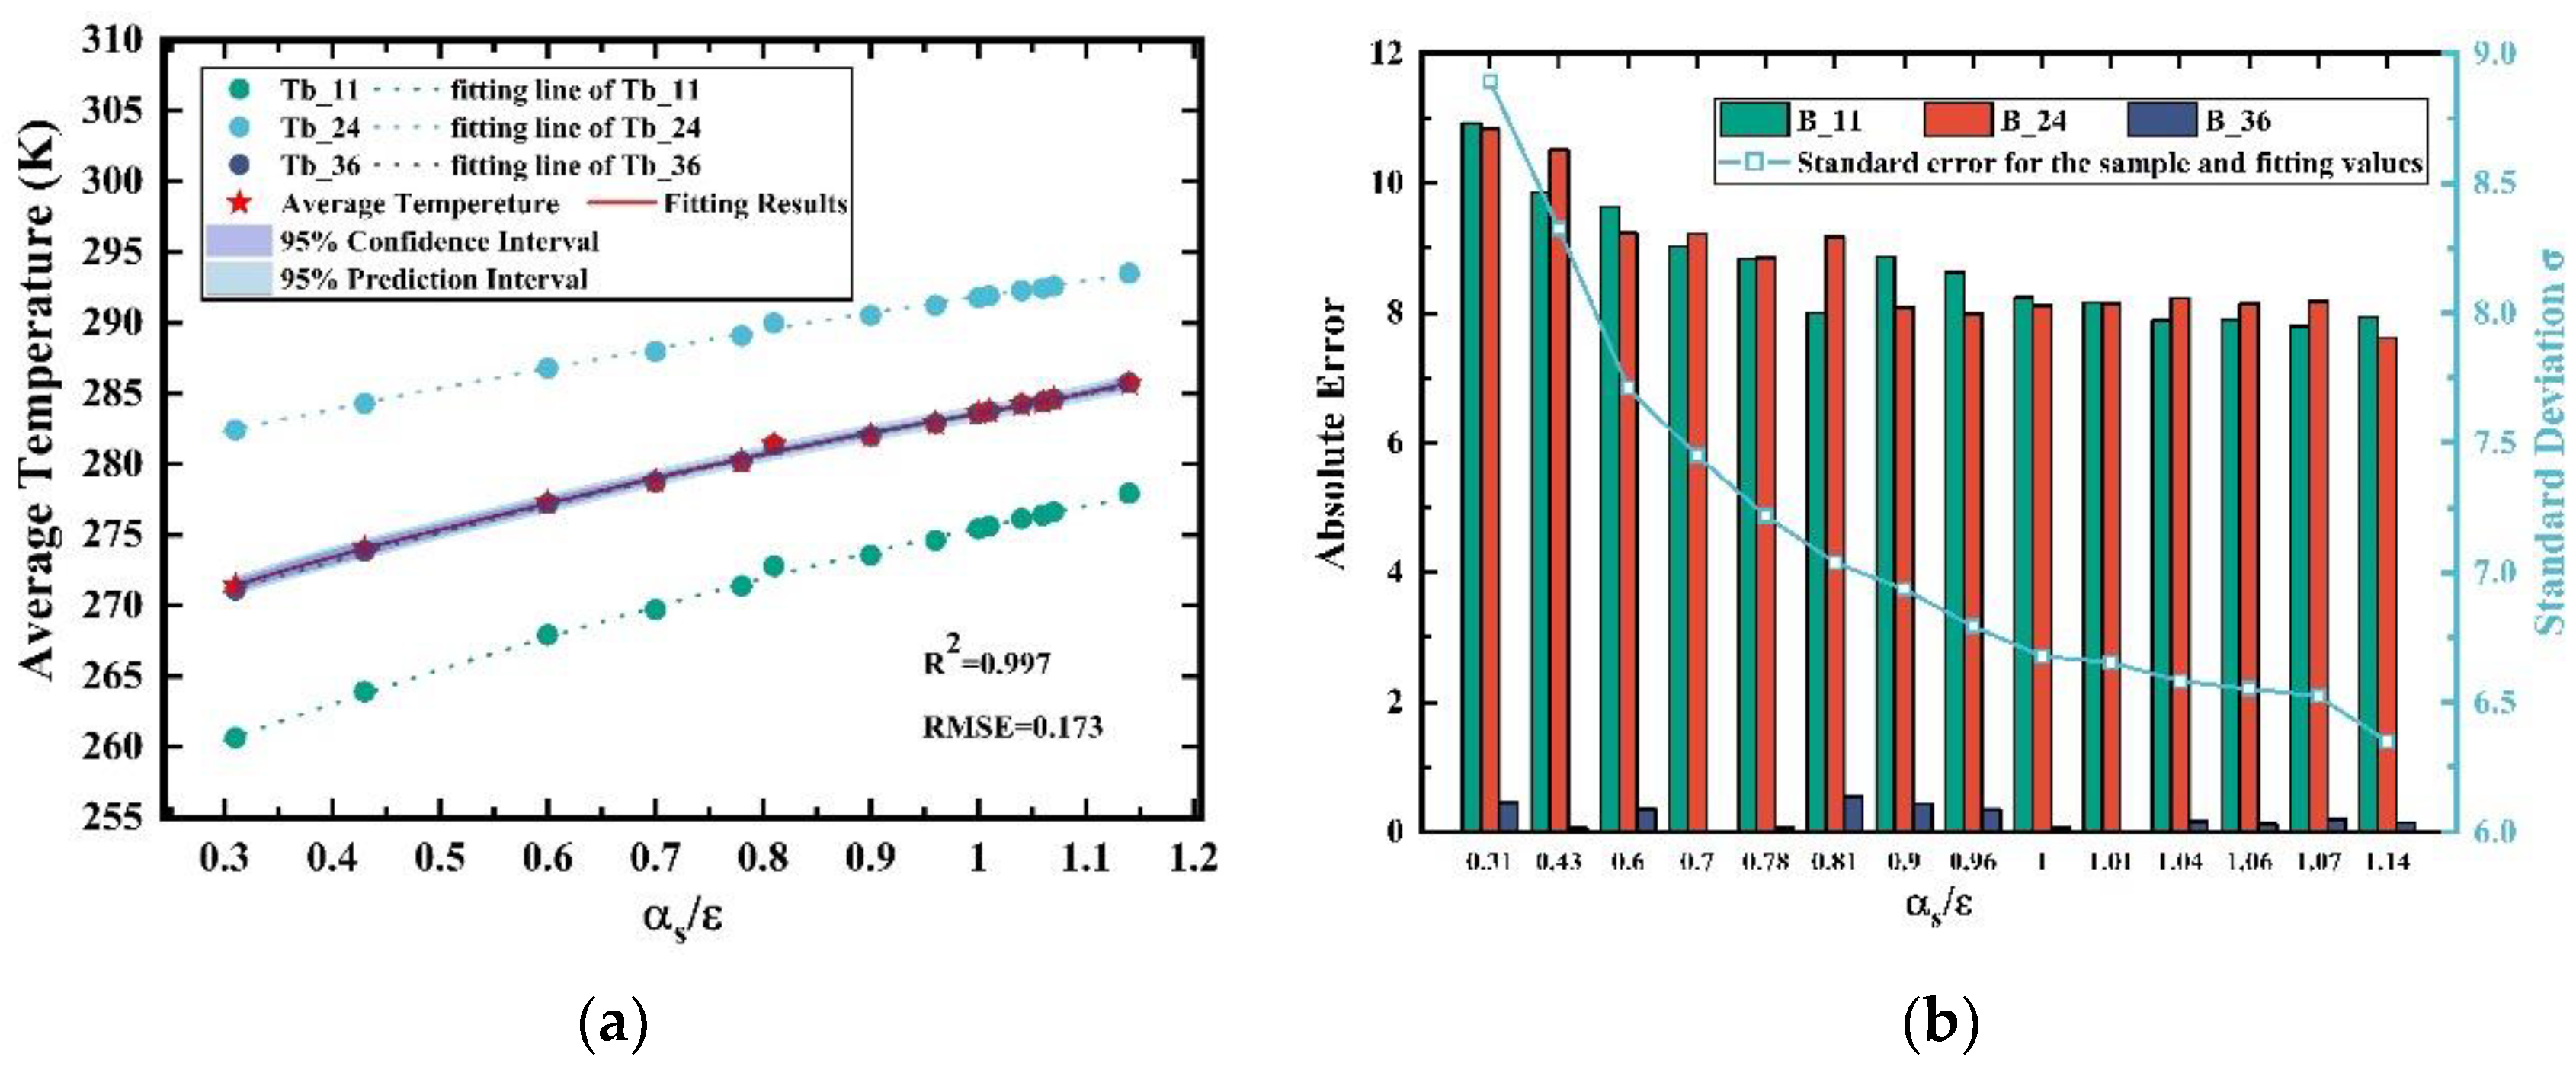
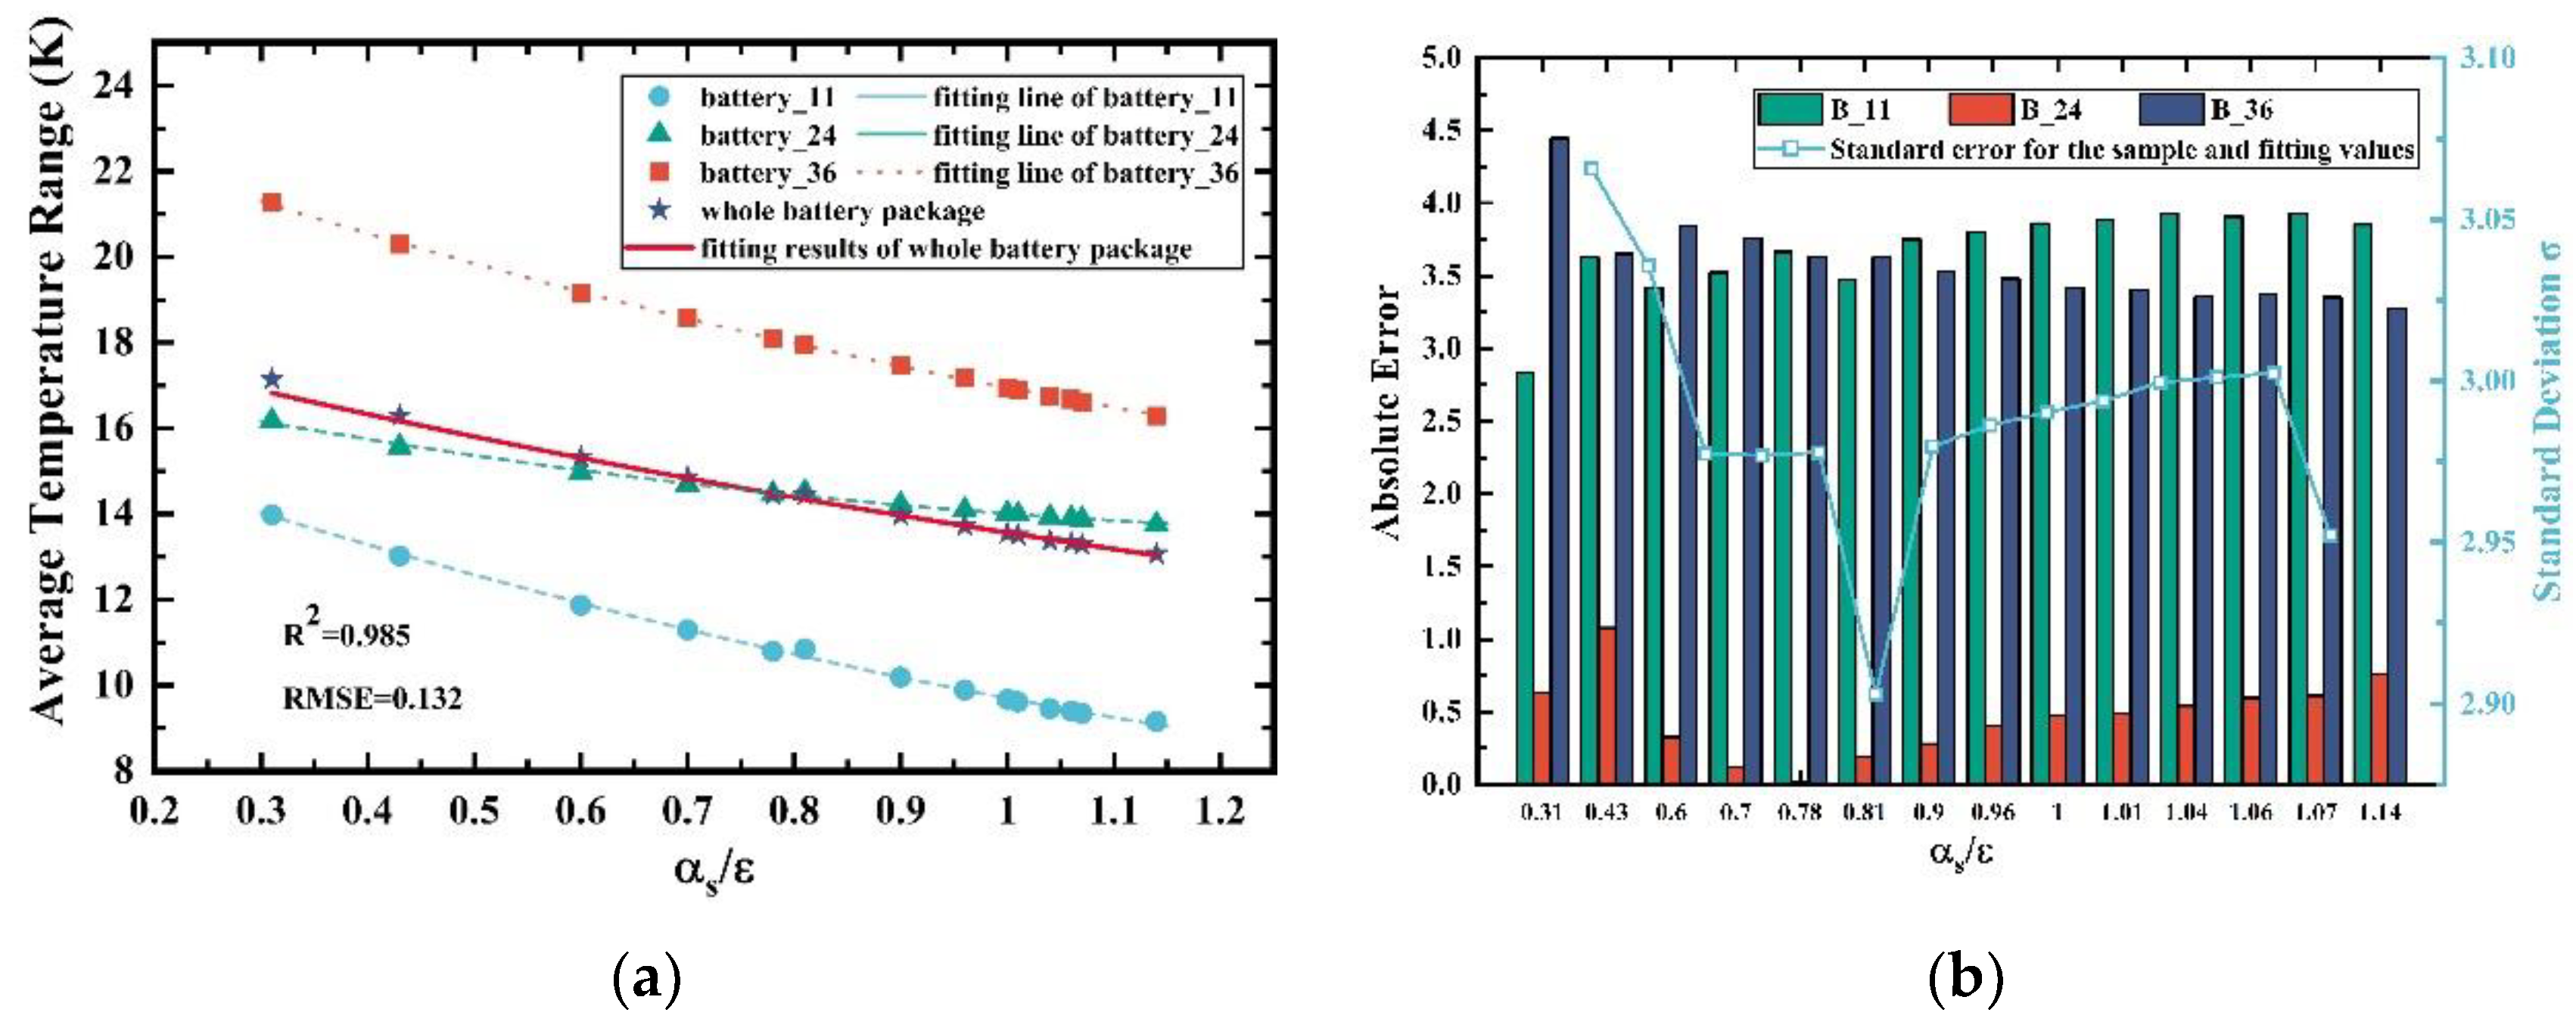
- Average temperatures and the temperature differences in the battery pack increase with , while the fluctuation of a single cell’s temperature declines.
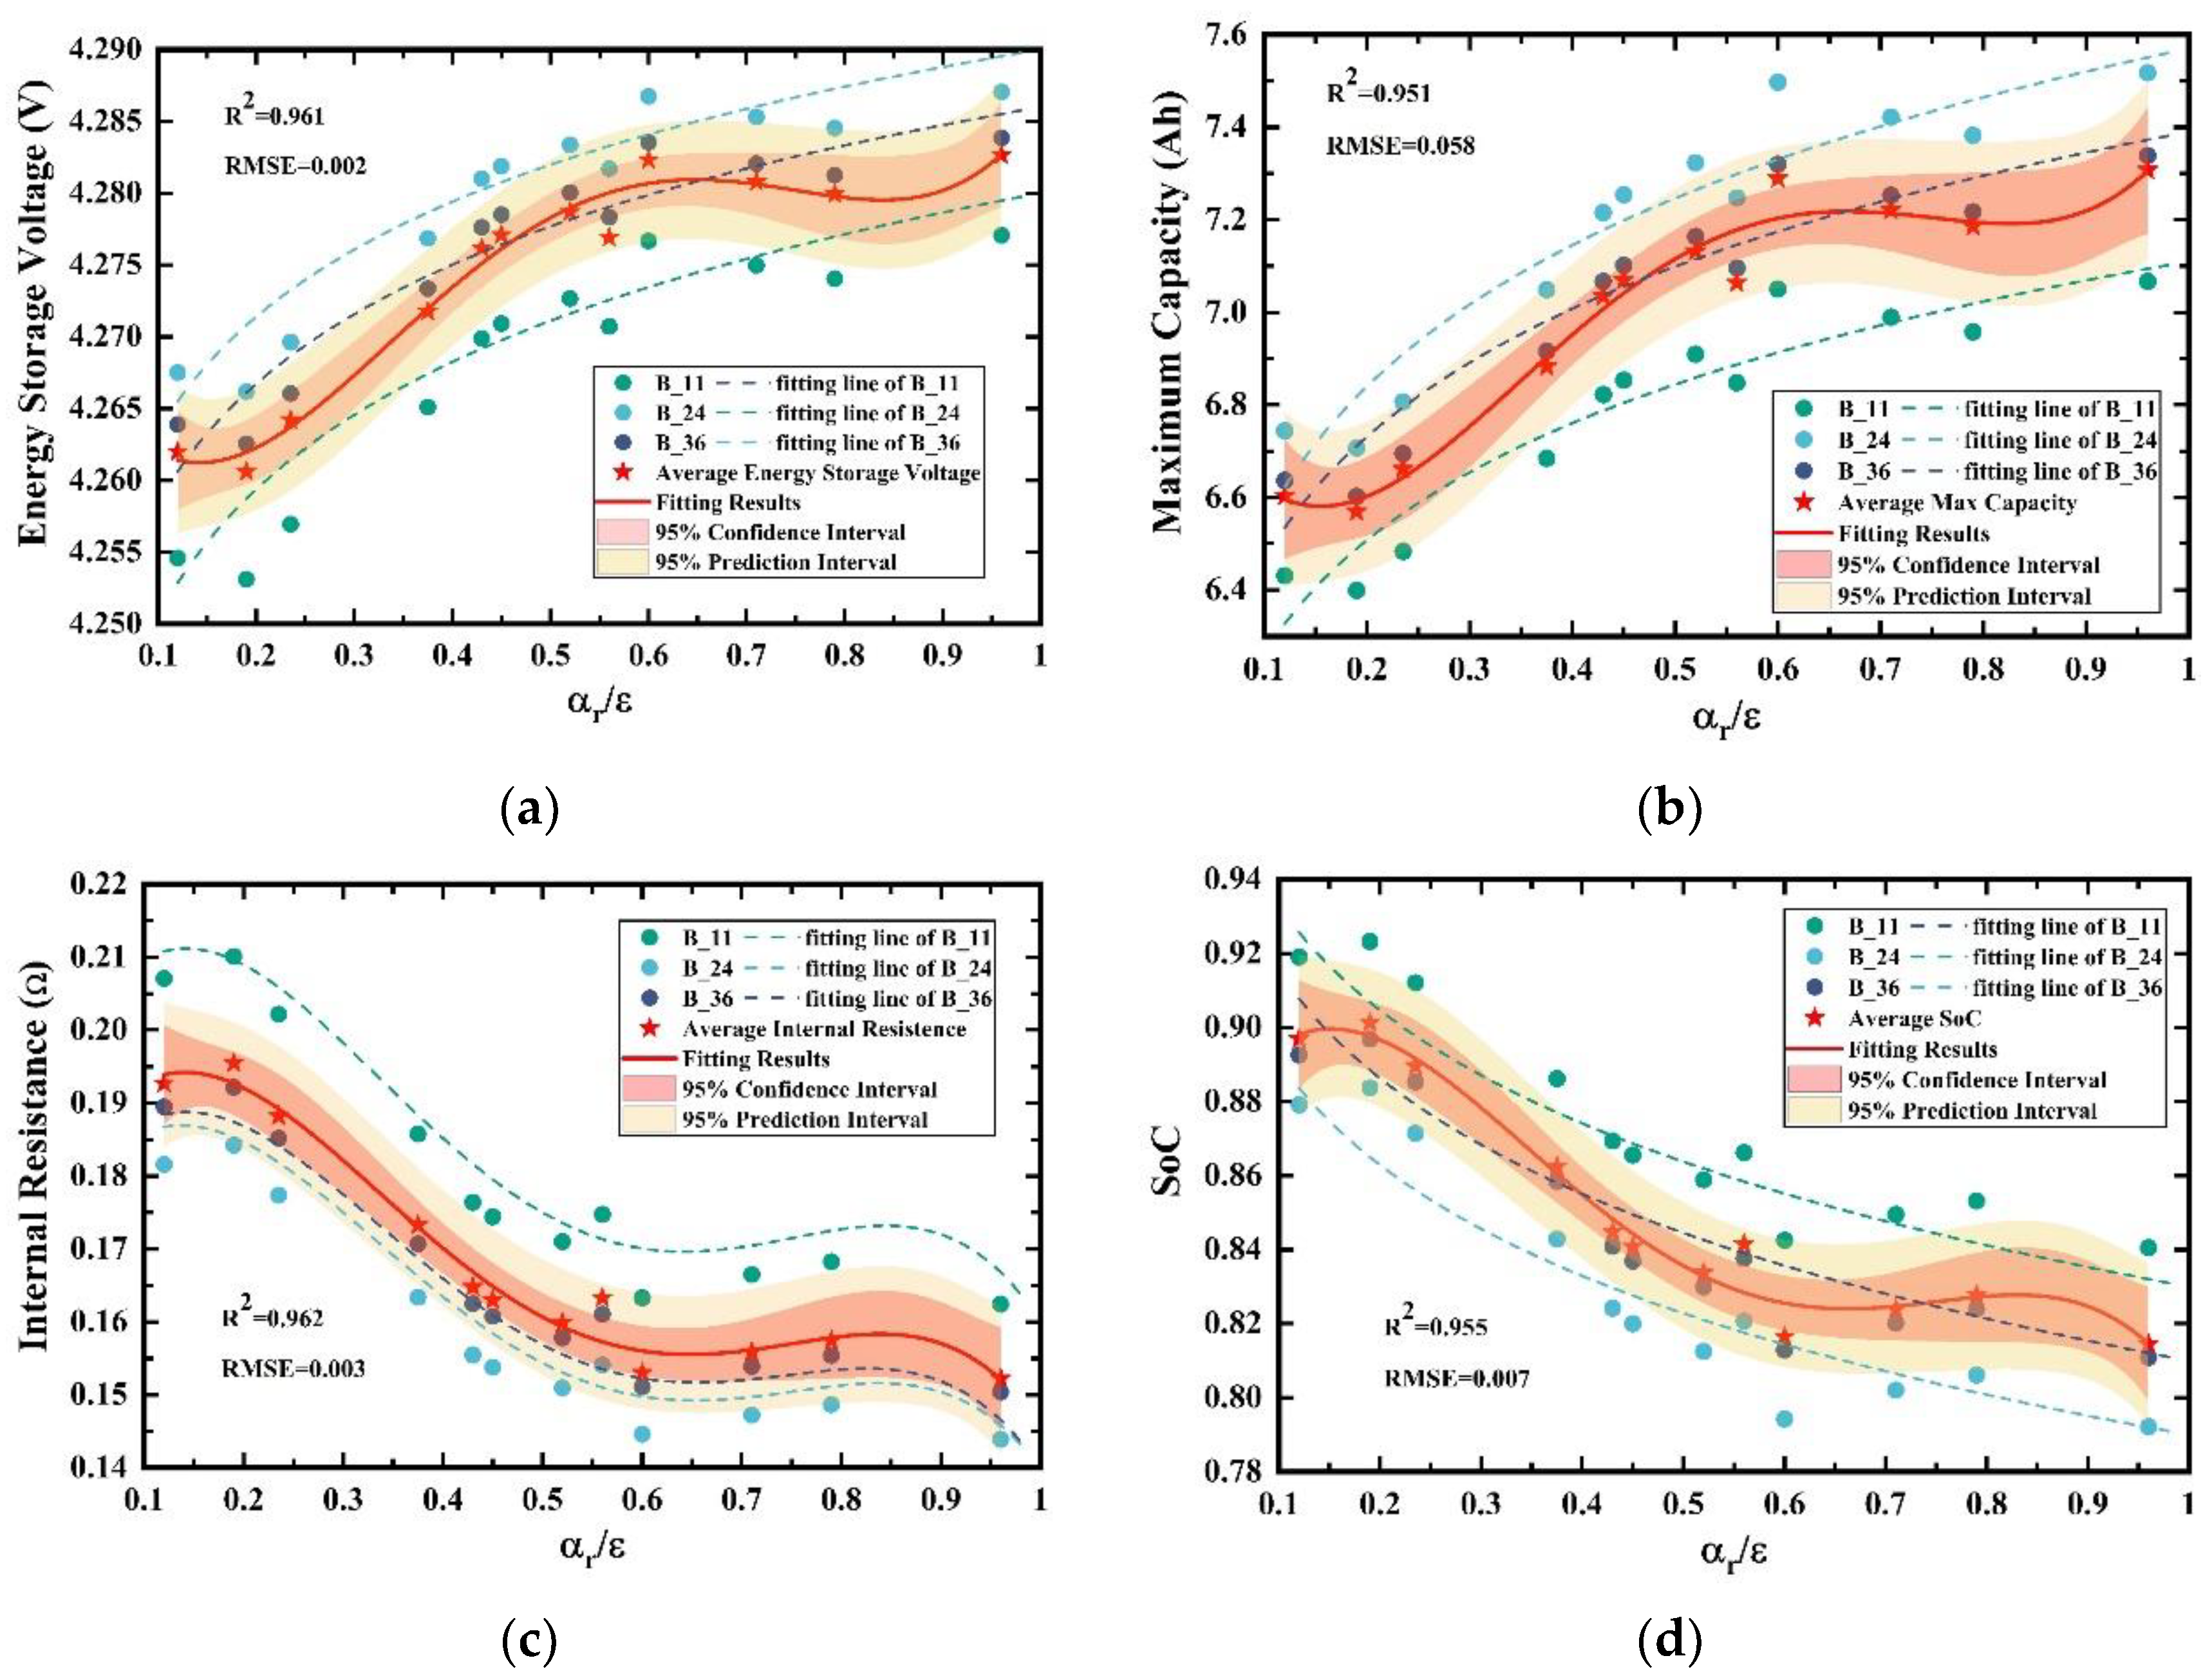
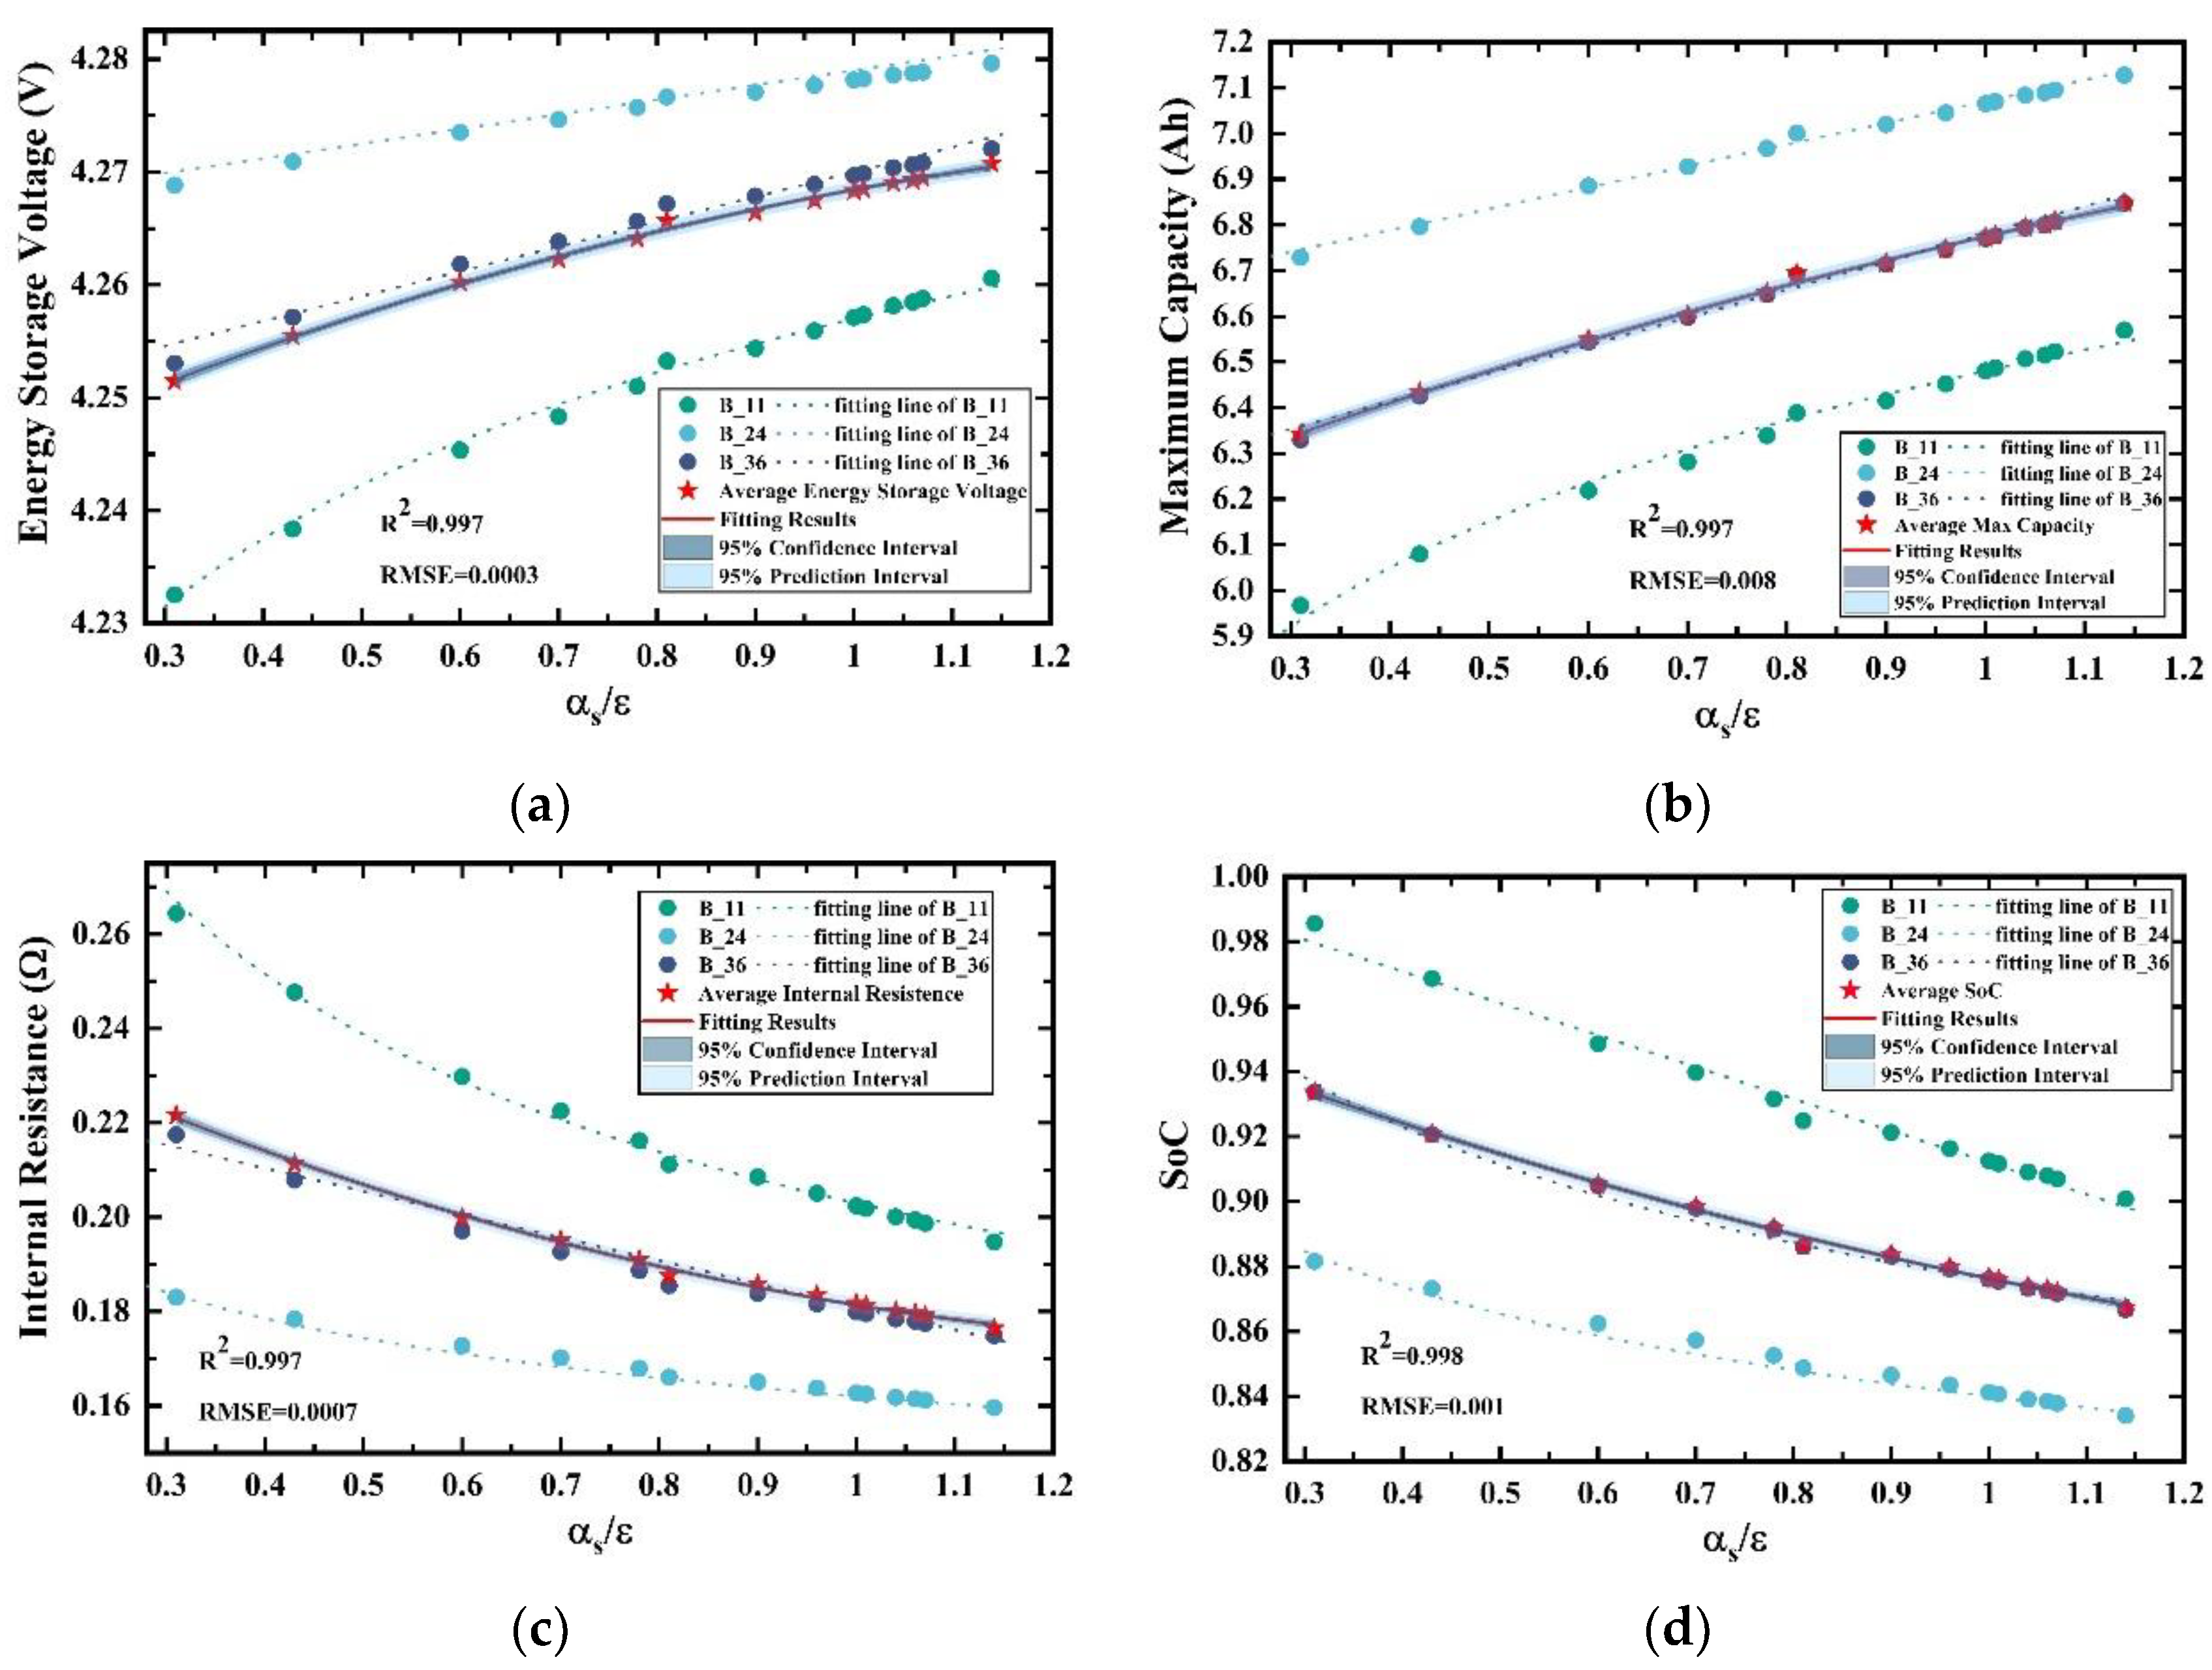
- The energy storage state of the battery will be improved and the internal resistance and SoC would drop with the growth of . However, these optimizations come at the cost of higher temperatures.
Author Contributions
Funding
Institutional Review Board Statement
Informed Consent Statement
Data Availability Statement
Conflicts of Interest
Notation
| Nomenclature | Subscript | ||
| A | Area [m2] | c | Satellite cabin environment |
| S | Solar constant | s | Thermal-insulation-surface |
| P | Power [W] | r | Radiator surface |
| q | Input energy density [W/m2] | sa | Solar array |
| U | Voltage of the battery pack [V] | B | Battery pack |
| I | Current of the battery pack [A] | b | Single battery cell |
| CE | Capacitance [F] | L | Payloads |
| CH | Heat capacity [J/K] | d | Energy storage |
| u | Voltage of a single battery cell [V] | un | Unused |
| i | Current of a single battery cell [A] | max | Maximum |
| R | Resistance [Ω] | in | Input |
| a | Charging coefficient | out | Output |
| b | Discharging coefficient | c | Satellite |
| E | Electric energy [J] | 0 | Initial value |
| SoC | State of capacity | or | Ohm resistance |
| K | Heat transfer coefficient [W/(m2·K)] | pr | Polarization resistance |
| Q | Thermal energy [J] | dr | Self-discharge resistance |
| cs | Cabin environment with thermal-insulation-surface | ||
| Greek symbol | cr | Cabin environment with radiator surface | |
| Absorbtivity | sr | Thermal-insulation-surface with radiator surface | |
| Emissivity | ij | Row and column numbers | |
| Stefan-Boltzmann constant | bc | Battery cell with cabin environment | |
| Efficiency | bs | Battery cell with thermal-insulation-surface | |
| Temperature correction coefficient of PV’s voltage | br | Battery cell with radiator surface | |
| Time [s] | bx | Battery pack’s environment | |
| Capacity [Ah] | T | Values at temperature T K | |
Appendix A

| SoC | SoC | ||||
|---|---|---|---|---|---|
| 258 | 0.05 | 6.1 | 283 | 0.05 | 2.5 |
| 0.3 | 5.8 | 0.3 | 2.1 | ||
| 0.5 | 5.5 | 0.5 | 2 | ||
| 1 | 5.1 | 1 | 2 | ||
| 263 | 0.05 | 5.05 | 288 | 0.05 | 2.1 |
| 0.3 | 4.8 | 0.3 | 1.95 | ||
| 0.5 | 4.6 | 0.5 | 1.8 | ||
| 1 | 4.2 | 1 | 1.8 | ||
| 268 | 0.05 | 4.1 | 293 | 0.05 | 2 |
| 0.3 | 3.9 | 0.3 | 1.85 | ||
| 0.5 | 3.85 | 0.5 | 1.5 | ||
| 1 | 3.5 | 1 | 1.5 | ||
| 273 | 0.05 | 3.55 | 298 | 0.05 | 1.9 |
| 0.3 | 3.1 | 0.3 | 1.8 | ||
| 0.5 | 3 | 0.5 | 1.3 | ||
| 1 | 2.95 | 1 | 1.3 | ||
| 278 | 0.05 | 3 | |||
| 0.3 | 2.65 | ||||
| 0.5 | 2.25 | ||||
| 1 | 2.2 |
| 0.25 | 308 | 2.2 | 1 | 308 | 1.98 |
| 298 | 2.05 | 298 | 1.95 | ||
| 278 | 1.81 | 278 | 1.72 | ||
| 268 | 1.65 | 268 | 1.56 | ||
| 258 | 1.49 | 258 | 1.38 | ||
| 0.5 | 308 | 2 | 1.5 | 308 | 1.95 |
| 298 | 1.98 | 298 | 1.91 | ||
| 278 | 1.78 | 278 | 1.72 | ||
| 268 | 1.6 | 268 | 1.58 | ||
| 258 | 1.43 | 258 | 1.39 | ||
| 0.75 | 308 | 1.99 | 2 | 308 | 1.94 |
| 298 | 1.96 | 298 | 1.91 | ||
| 278 | 1.76 | 278 | 1.73 | ||
| 268 | 1.59 | 268 | 1.61 | ||
| 258 | 1.4 | 258 | 1.41 |
Appendix B
| Fitting polynomial 1 | |||||
| Parameters | |||||
| Whole pack | 4.27 | −0.16 | 0.78 | −1.12 | 0.51 |
| Fitting polynomial 2 | |||||
| Parameters | |||||
| B_11 | 4.28 | 0.003 | |||
| B_24 | 4.29 | 0.0027 | |||
| B_36 | 4.286 | 0.0028 | |||
| Error analysis | Whole pack | B_11 | B_24 | B_36 | |
| R-square | 0.961 | 0.895 | 0.89 | 0.894 | |
| RMSE | 0.002 | 0.003 | 0.002 | 0.0025 | |
| Fitting polynomial 1 | |||||
| Parameters | |||||
| Whole pack | 6.97 | −5.83 | 26.71 | −37.49 | 17.05 |
| Fitting polynomial 2 | |||||
| Parameters | |||||
| B_11 | 7.11 | 0.055 | |||
| B_24 | 7.57 | 0.063 | |||
| B_36 | 7.39 | 0.058 | |||
| Error analysis | Whole pack | B_11 | B_24 | B_36 | |
| R-square | 0.951 | 0.9 | 0.89 | 0.895 | |
| RMSE | 0.058 | 0.077 | 0.094 | 0.085 | |
| Fitting polynomial 1 | |||||
| Parameters | |||||
| Whole pack | 0.18 | 0.31 | −1.51 | 2.17 | −1.00 |
| B_11 | 0.19 | 0.34 | −1.66 | 2.39 | −1.1 |
| B_24 | 0.17 | 0.28 | −1.4 | 2.02 | −0.93 |
| B_36 | 0.17 | 0.3 | −1.46 | 2.1 | −0.97 |
| Error analysis | Whole pack | B_11 | B_24 | B_36 | |
| R-square | 0.962 | 0.962 | 0.962 | 0.962 | |
| RMSE | 0.003 | 0.003 | 0.003 | 0.003 | |
| Fitting polynomial 1 | |||||
| Parameters | |||||
| Whole pack | 0.86 | 0.67 | −3.11 | 4.39 | −2.01 |
| Fitting polynomial 2 | |||||
| Parameters | |||||
| B_11 | −0.46 | 0.11 | 1.29 | ||
| B_24 | −0.49 | 0.12 | 1.28 | ||
| B_36 | −0.47 | 0.11 | 1.28 | ||
| Error analysis | Whole pack | B_11 | B_24 | B_36 | |
| R-square | 0.955 | 0.89 | 0.89 | 0.89 | |
| RMSE | 0.007 | 0.01 | 0.01 | 0.01 | |
| Fitting polynomial 1 | ||||
| Parameters | ||||
| Whole pack | 4.24 | 0.04 | −0.01 | |
| Fitting polynomial 2 | ||||
| Parameters | ||||
| B_11 | 4.257 | 0.005 | ||
| Fitting polynomial 3 | ||||
| Parameters | ||||
| B_24 | 0.013 | 4.266 | ||
| B_36 | 0.022 | 4.248 | ||
| Error analysis | Whole pack | B_11 | B_24 | B_36 |
| R-square | 0.997 | 0.995 | 0.987 | 0.979 |
| RMSE | 0.0003 | 0.0006 | 0.0004 | 0.0008 |
| Fitting polynomial 1 | ||||
| Parameters | ||||
| Whole pack | 6.1 | 0.86 | −0.18 | |
| Fitting polynomial 2 | ||||
| Parameters | ||||
| B_11 | 6.48 | 0.075 | ||
| Fitting polynomial 3 | ||||
| Parameters | ||||
| B_24 | 0.47 | 6.6 | ||
| B_36 | 0.61 | 6.17 | ||
| Error analysis | Whole pack | B_11 | B_24 | B_36 |
| R-square | 0.997 | 0.99 | 0.995 | 0.992 |
| RMSE | 0.0008 | 0.018 | 0..009 | 0.014 |
| Fitting polynomial 1 | ||||
| Parameters | ||||
| Whole pack | 0.25 | −0.1 | 0.03 | |
| Fitting polynomial 2 | ||||
| Parameters | ||||
| B_11 | 0.203 | −0.234 | ||
| B_24 | 0.162 | −0.106 | ||
| Fitting polynomial 3 | ||||
| Parameters | ||||
| B_36 | −0.049 | 0.23 | ||
| Error analysis | Whole pack | B_11 | B_24 | B_36 |
| R-square | 0.997 | 0.995 | 0.99 | 0.975 |
| RMSE | 0.0007 | 0.001 | 0.0007 | 0.002 |
| Fitting polynomial 1 | ||||
| Parameters | ||||
| Whole pack | 0.97 | −0.12 | 0.03 | |
| Fitting polynomial 2 | ||||
| Parameters | ||||
| B_11 | −0.098 | 1.01 | ||
| Fitting polynomial 3 | ||||
| Parameters | ||||
| B_24 | 0.84 | −0.043 | ||
| B_36 | 0.876 | −0.057 | ||
| Error analysis | Whole pack | B_11 | B_24 | B_36 |
| R-square | 0.998 | 0.987 | 0.983 | 0.99 |
| RMSE | 0.001 | 0.003 | 0.002 | 0.002 |
References
- Starner, K.E.; Stark, R.L. Effects of roughness on rear-surface mirror satellite coatings. J. Spacecr. Rocket. 1968, 5, 125–127. [Google Scholar] [CrossRef]
- Putz, B.; Wurster, S.; Edwards, T.; Völker, B.; Milassin, G.; Többens, D.; Semprimoschnig, C.; Cordill, M. Mechanical and optical degradation of flexible optical solar reflectors during simulated low earth orbit thermal cycling. Acta Astronaut. 2020, 175, 277–289. [Google Scholar] [CrossRef]
- Peters, J. System Level Testing of the Passive Thermal Control System for Space Station Freedom. In Proceedings of the 23rd International Conference on Environmental Systems, Colorado Springs, Colorado, 12–15 July 1993. [Google Scholar] [CrossRef]
- Foster, J.A.; Aglietti, G.S. Strategies for Thermal Control of a Multifunctional Power Structure Solar Array. J. Aerosp. Eng. 2012, 25, 454–462. [Google Scholar] [CrossRef] [Green Version]
- Swanson, T.D.; Birur, G.C. NASA thermal control technologies for robotic spacecraft. Appl. Therm. Eng. 2003, 23, 1055–1065. [Google Scholar] [CrossRef] [Green Version]
- Haddad, E.; Kruzelecky, R.V.; Hendaoui, A.; Chaker, M.; Jamroz, W. Large Tuneability IR Emittance Thermal Control Coating for Space Applications. In Proceedings of the 43rd International Conference on Environmental Systems, Vail, CO, USA, 14–18 July 2013. [Google Scholar] [CrossRef]
- Taylor, S.; Boman, N.; Chao, J.; Wang, L. Cryothermal vacuum measurement of thermochromic variable-emittance coatings with heating/cooling hysteresis for spacecraft thermal management. Appl. Therm. Eng. 2021, 199, 117561. [Google Scholar] [CrossRef]
- Mandal, J.; Du, S.; Dontigny, M.; Zaghib, K.; Yu, N.; Yang, Y. Li4Ti5O12: A Visible-to-Infrared Broadband Electrochromic Material for Optical and Thermal Management. Appl. Phys. Lett. 2019, 115, 073902. [Google Scholar] [CrossRef]
- Bertagne, C.L.; Cognata, T.J.; Sheth, R.B.; Dinsmore, C.E.; Hartl, D.J. Testing and analysis of a morphing radiator concept for thermal control of crewed space vehicles. Appl. Therm. Eng. 2017, 124, 986–1002. [Google Scholar] [CrossRef]
- Johnson, J.; Cerbus, C.; Haines, A.; Kenny, M. Review of Improved Thermal Control Coating Development for NASA’s SEE Program. In Proceedings of the 43rd AIAA Aerospace Sciences Meeting and Exhibit, Reno, Nevada, 10–13 January 2013. [Google Scholar] [CrossRef]
- Fartash, A.H.; Poursaeidi, E. Thermal analysis of thermal barrier coating systems under transient and time harmonic thermal loads. Appl. Therm. Eng. 2022, 208, 118225. [Google Scholar] [CrossRef]
- Athirah, N.; Afendi, M.; Hafizan, K.; Amin, N.; Majid, M.A. Stress and Thermal Analysis of CubeSat Structure. Appl. Mech. Mater. 2014, 554, 426–430. [Google Scholar] [CrossRef]
- Corpino, S.; Caldera, M.; Nichele, F.; Masoero, M.; Viola, N. Thermal design and analysis of a nanosatellite in low earth orbit. Acta Astronaut. 2015, 115, 247–261. [Google Scholar] [CrossRef] [Green Version]
- Reyes, L.A.; Cabriales-Gómez, R.; Chávez, C.E.; Bermúdez-Reyes, B. Thermal modeling of CIIIASat nanosatellite: A tool for thermal barrier coating selection. Appl. Therm. Eng. 2020, 166, 114651. [Google Scholar] [CrossRef]
- Wang, S.; Li, Y.; Li, Y. A forced gas cooling circle packaging with liquid cooling plate for the thermal management of li-ion batteries under space environment. Appl. Therm. Eng. 2017, 123, 929–939. [Google Scholar] [CrossRef]
- Xu, H.-J.; Wang, J.-X.; Li, Y.-Z.; Bi, Y.-J.; Gao, L.-J. A Thermoelectric-Heat-Pump Employed Active Control Strategy for the Dynamic Cooling Ability Distribution of Liquid Cooling System for the Space Station’s Main Power-Cell-Arrays. Entropy 2019, 21, 578. [Google Scholar] [CrossRef] [PubMed] [Green Version]
- Bonkile, M.P.; Ramadesigan, V. Physics-based models in PV-battery hybrid power systems: Thermal management and degradation analysis. J. Energy Storage 2020, 31, 101458. [Google Scholar] [CrossRef]
- Ma, S.; Jiang, M.; Tao, P.; Song, C.; Wu, J. Temperature effect and thermal impact in lithium-ion batteries: A review. Prog. Nat. Sci. Mater. Int. 2018, 28, 653–666. [Google Scholar] [CrossRef]
- Luo, M.; Song, J.; Ling, Z.; Zhang, Z.; Fang, X. Phase change material coat for battery thermal management with integrated rapid heating and cooling functions from −40 °C to 50 °C. Mater. Today Energy 2021, 20, 100652. [Google Scholar] [CrossRef]
- Feng, X.; Ouyang, M.; Liu, X.; Lu, L.; Fang, X. Thermal runaway mechanism of lithium ion battery for electric vehicles: A review. Mater. Today Energy 2018, 10, 246–267. [Google Scholar] [CrossRef]
- Thomas, P.B.; Margot, L.W. Spacecraft Li-Ion Battery Power System State-of-Practice: A Critical Review. In Proceedings of the 2018 International Energy Conversion Engineering Conference, Cincinnati, OH, USA, 9–11 July 2018. [Google Scholar] [CrossRef]
- Schoen, A.; Powers, A.R.; Arastu, A.; Canter, S.; Hall, J. High Performance Lithium Ion Battery Systems Development for Long Life Geostationary Satellites. In Proceedings of the 3rd International Energy Conversion Engineering Conference, San Francisco, CA, USA, 15–18 August 2005. [Google Scholar]
- Bazarbayev, R.; Yakubov, K.; Kurbanov, D.; Allaniyazov, A.; Balakumar, S.; Kamalov, A.; Janabergenova, G.; Wei, Q.; Qian, H.; Polvonnazirov, I.; et al. Performance of crystalline Si solar cells and module on temperature and illumination intensity. Mater. Today: Proc. 2022, 64, 1661–1665. [Google Scholar] [CrossRef]
- Cotfas, D.T.; Cotfas, P.A.; Machidon, O.M. Study of Temperature Coefficients for Parameters of Photovoltaic Cells. Int. J. Photoenergy 2018, 2018, 1–12. [Google Scholar] [CrossRef] [Green Version]
- Bonnici, M.; Mollicone, P.; Fenech, M.; Azzopardi, M.A. Analytical and numerical models for thermal related design of a new pico-satellite. Appl. Therm. Eng. 2019, 159, 113908. [Google Scholar] [CrossRef]
- Shrestha, S.; Del Pino, C.B.; Malayoglu, U. Inorganic White Thermal-Control Coatings for Extreme Space Environments. J. Spacecr. Rocket. 2016, 53, 1061–1067. [Google Scholar] [CrossRef]
- Gong, X. Modeling of Lithium-ion Battery Considering Temperature and Aging Uncertainties. Ph.D. Thesis, University of Michigan Dearborn, Dearborn, MI, USA, 2016; p. 53. [Google Scholar]
- Li, L.; Xie, Y.; Cao, L.; Huang, K. Analysis of different cathode materials of lithium-ion battery capacity characteristics. Chin. J. Power Sources 2017, 41, 1677–1680. [Google Scholar]


| Parameters | Values |
|---|---|
| Weight | 15 kg |
| Area of thermal insulation surfaces | 2.5 m2 |
| Area of radiator surface | 0.5 m2 |
| Area of the solar array | 2 m2 |
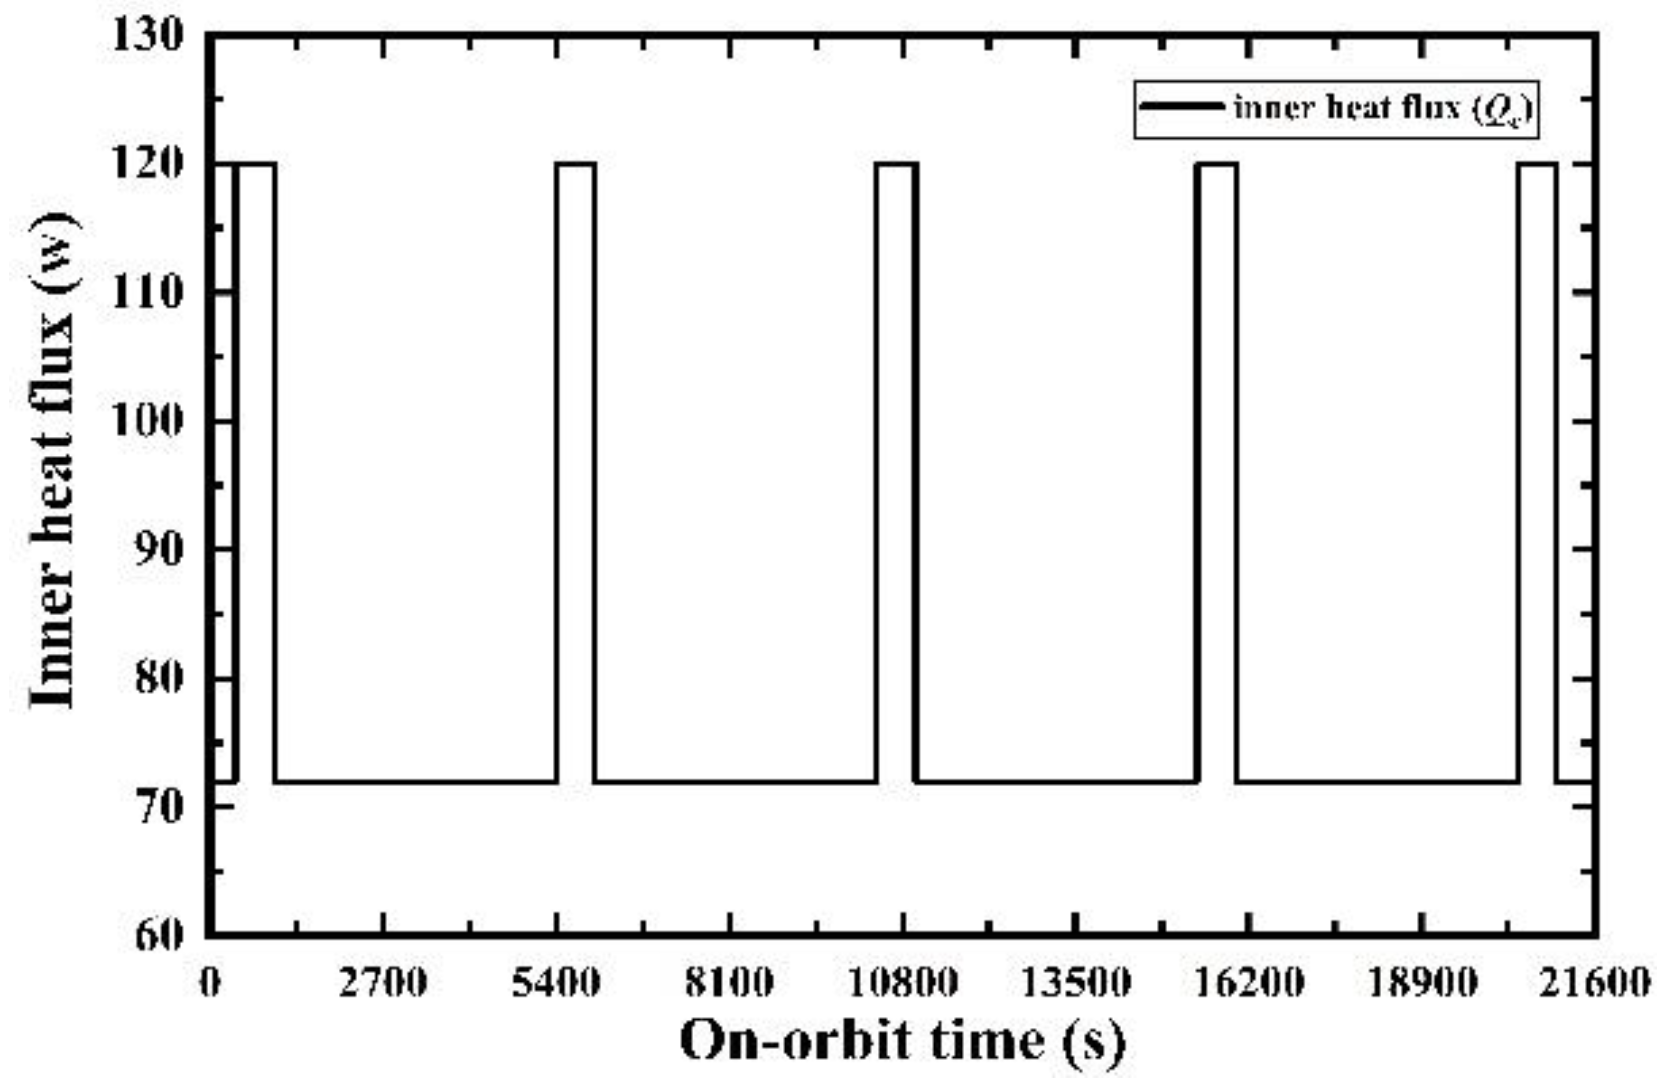
| Payloads’ total power | normal: 120 W; peak: 200 W; peak time: 10 min |
| Heat efficiency | 40% |
| Orbit altitude | perigee: 170 km; apogee: 400 km |
| Orbit period | 90 min |
| Shadow period | ≈33 min |
| Heat Capacity (J/K) | Heat Transform Coefficient (W/m2·K) | Absorptivity | Emissivity | Heat Transfer Area (m2) | |
|---|---|---|---|---|---|
| Thermal insulation surface | 1300 | kcs = 1.8 | 0.8 | 0.7 | 2.5 |
| Radiator surface | 940 | ksr = 3.5 | 0.17 | 0.88 | 0.5 |
| Cabin environment | 4800 | kcr = 1.43 | - | - | - |
| Solar array | 400 | - | 0.3 | 0.5 | 2 |
| Li-ion cell | 80 | kbs = 0.1; kbi = 0.3; kbr = 1.98 | - | 0.1 | Abs, Abi, Abr = 0.007 |
| Types | Coatings | Absorptivity α | Emissivity ε | α/ε |
|---|---|---|---|---|
| Anodizing | Aluminum oxide | 0.32 | 0.74 | 0.43 |
| Aluminum alloy | 0.3 | 0.8 | 0.375 | |
| Electroplating | Black nickel plating on aluminum | 0.85 | 0.89 | 0.96 |
| White paint | S781 white paint | 0.17 | 0.88 | 0.19 |
| S956 white paint | 0.2 | 0.85 | 0.235 | |
| - | 0.33 | 0.73 | 0.45 | |
| - | 0.38 | 0.73 | 0.52 | |
| Gray paint | S731-SR107 | 0.69 | 0.87 | 0.79 |
| - | 0.45 | 0.8 | 0.56 | |
| - | 0.55 | 0.78 | 0.71 | |
| Black nickel plated | Aluminized quartz glass | 0.1 | 0.81 | 0.12 |
| Aluminum plating on polyimide film | 0.41 | 0.68 | 0.6 |
| Types | Coatings | Absorptivity α | Emissivity ε | α/ε |
|---|---|---|---|---|
| White paint | - | 0.27 | 0.86 | 0.31 |
| Anodizing | Aluminum alloy | 0.32 | 0.74 | 0.43 |
| Second surface mirror | Polyimide film aluminum plating | 0.41 | 0.68 | 0.6 |
| Inorganic gray paint | PS17 | 0.57 | 0.82 | 0.7 |
| Gray paint | EZ665ZC | 0.72 | 0.92 | 0.78 |
| S956 gray paint | 0.78 | 0.87 | 0.9 | |
| Metallic paint | S781 | 0.25 | 0.31 | 0.81 |
| Black paint | ES665NFCG | 0.85 | 0.85 | 1.0 |
| - | 0.89 | 0.88 | 1.01 | |
| S731-SR107 | 0.94 | 0.9 | 1.04 | |
| S956 black paint | 0.93 | 0.88 | 1.06 | |
| - | 0.8 | 0.7 | 1.14 | |
| Black nickel plated | Black nickel plating on aluminum | 0.85 | 0.89 | 0.96 |
| Black nickel plating on stainless steel | 0.92 | 0.86 | 1.07 |
| Fitting polynomial | ||||||
| Parameters | ||||||
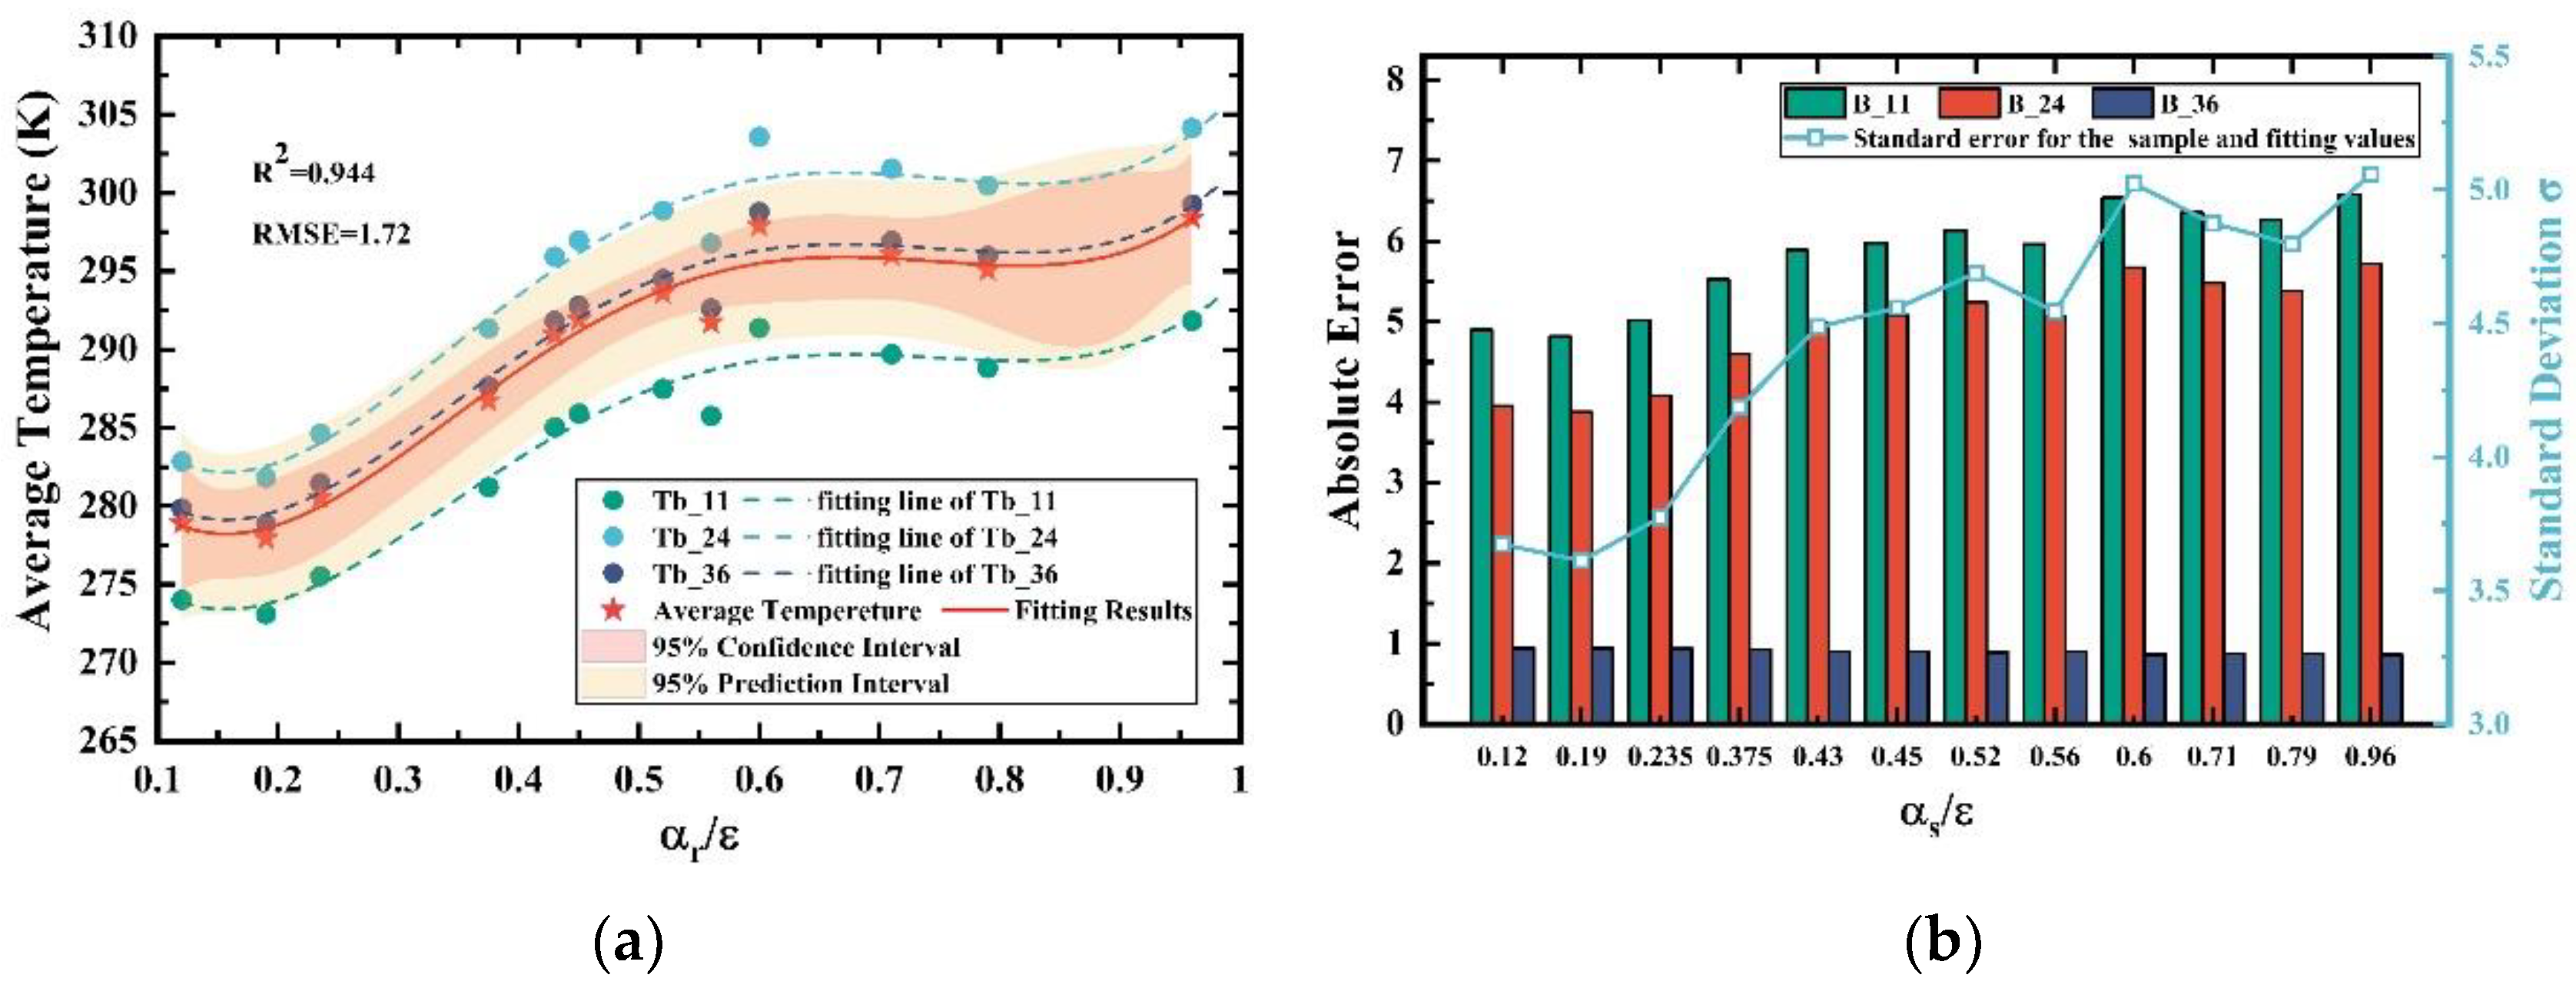
| Whole pack | 290.6 | −184.72 | 864.28 | −1326 | 770.18 | −113.36 |
| B_11 | 284.9 | −171.9 | 808 | −1255 | 749.7 | −121.2 |
| B_24 | 295.4 | −197.3 | 918.8 | −1390 | 780.8 | −101 |
| B_36 | 291.5 | −184.9 | 866 | −1333 | 780.1 | −117.9 |
| Error analysis | Whole pack | B_11 | B_24 | B_36 | ||
| R-square | 0.944 | 0.945 | 0.943 | 0.944 | ||
| RMSE | 1.72 | 1.57 | 1.89 | 1.72 | ||
| Fitting polynomial 1 | ||||||
| Parameters | ||||||
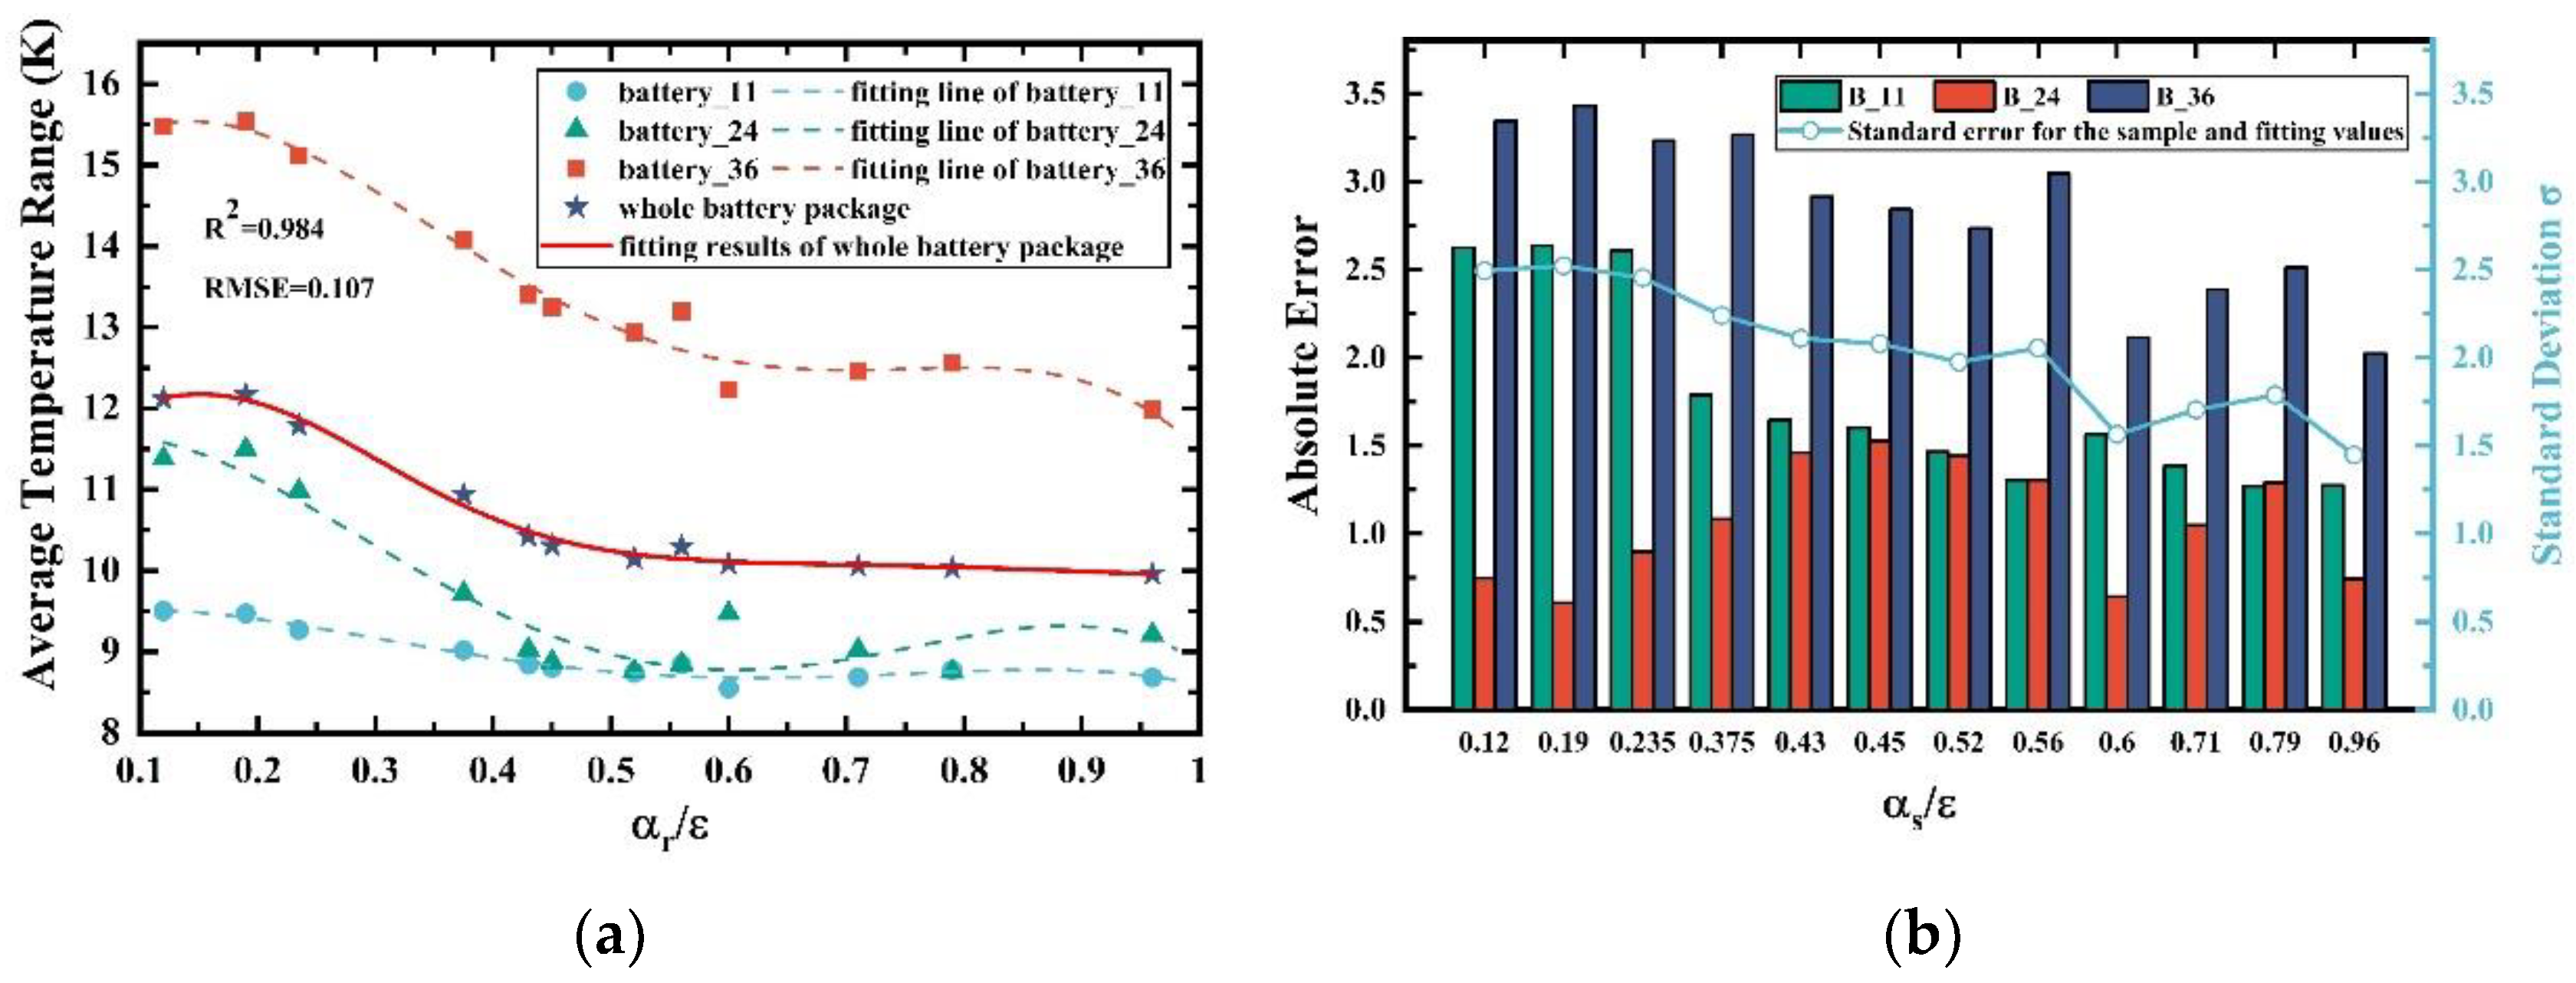
| Whole pack | 2.28 | 0.14 | 0.22 | 10.08 | 0.6 | 3.29 |
| Fitting polynomial 2 | ||||||
| Parameters | ||||||
| B_11 | 9.357 | 3.606 | −23.42 | 36.16 | −17.11 | |
| B_24 | 11.32 | 9.165 | −71.08 | 113.9 | −54.43 | |
| B_36 | 14.11 | 22.67 | −109.2 | 154.1 | −70.2 | |
| Error analysis | Whole pack | B_11 | B_24 | B_36 | ||
| R-square | 0.984 | 0.92 | 0.96 | 0.96 | ||
| RMSE | 0.107 | 0.09 | 0.21 | 0.261 | ||
| Fitting polynomial | ||||||
| Parameters | ||||||
| Whole pack | 254.95 | 103.38 | −256.84 | 385.65 | −284.59 | 81.05 |
| B_11 | 251.9 | 30.7 | −7.12 | |||
| B_24 | 277.3 | 17.73 | −3.154 | |||
| B_36 | 263.8 | 25.58 | −5.75 | |||
| Error analysis | Whole pack | B_11 | B_24 | B_36 | ||
| R-square | 0.997 | 0.997 | 0.998 | 0.997 | ||
| RMSE | 0.173 | 0.265 | 0.164 | 0.22 | ||
| Fitting polynomial 1 | ||||
| Parameters | ||||
| Whole pack | 6.11 | 12.62 | −0.53 | |
| Fitting polynomial 2 | ||||
| Parameters | ||||
| B_11 | 2.11 | −8.93 | 16.52 | |
| B_24 | 1.81 | −5.43 | 17.63 | |
| B_36 | 2.04 | −8.86 | 23.77 | |
| Error analysis | Whole pack | B_11 | B_24 | B_36 |
| R-square | 0.985 | 0.998 | 0.996 | 0.999 |
| RMSE | 0.132 | 0.07 | 0.046 | 0.031 |
Disclaimer/Publisher’s Note: The statements, opinions and data contained in all publications are solely those of the individual author(s) and contributor(s) and not of MDPI and/or the editor(s). MDPI and/or the editor(s) disclaim responsibility for any injury to people or property resulting from any ideas, methods, instructions or products referred to in the content. |
© 2022 by the authors. Licensee MDPI, Basel, Switzerland. This article is an open access article distributed under the terms and conditions of the Creative Commons Attribution (CC BY) license (https://creativecommons.org/licenses/by/4.0/).
Share and Cite
Xie, J.; Li, Y.-Z.; Yang, L.; Sun, Y. Thermal Impact Analysis and Electric–Thermal Coupled Modeling of Photovoltaic/Battery Space Power System with Different Surface Coatings. Aerospace 2023, 10, 12. https://doi.org/10.3390/aerospace10010012
Xie J, Li Y-Z, Yang L, Sun Y. Thermal Impact Analysis and Electric–Thermal Coupled Modeling of Photovoltaic/Battery Space Power System with Different Surface Coatings. Aerospace. 2023; 10(1):12. https://doi.org/10.3390/aerospace10010012
Chicago/Turabian StyleXie, Jingyan, Yun-Ze Li, Lizhu Yang, and Yuehang Sun. 2023. "Thermal Impact Analysis and Electric–Thermal Coupled Modeling of Photovoltaic/Battery Space Power System with Different Surface Coatings" Aerospace 10, no. 1: 12. https://doi.org/10.3390/aerospace10010012