Mapping Vulnerability of Cotton to Climate Change in West Africa: Challenges for Sustainable Development

 , ,
, ,
Abstract
:1. Introduction
1.1. Climate Change and Sustainable Development in West Africa
1.2. Spatially Explicit Modeling of Climate Factors
1.3. Cotton, Climate, and Smallholder Income
2. Methods
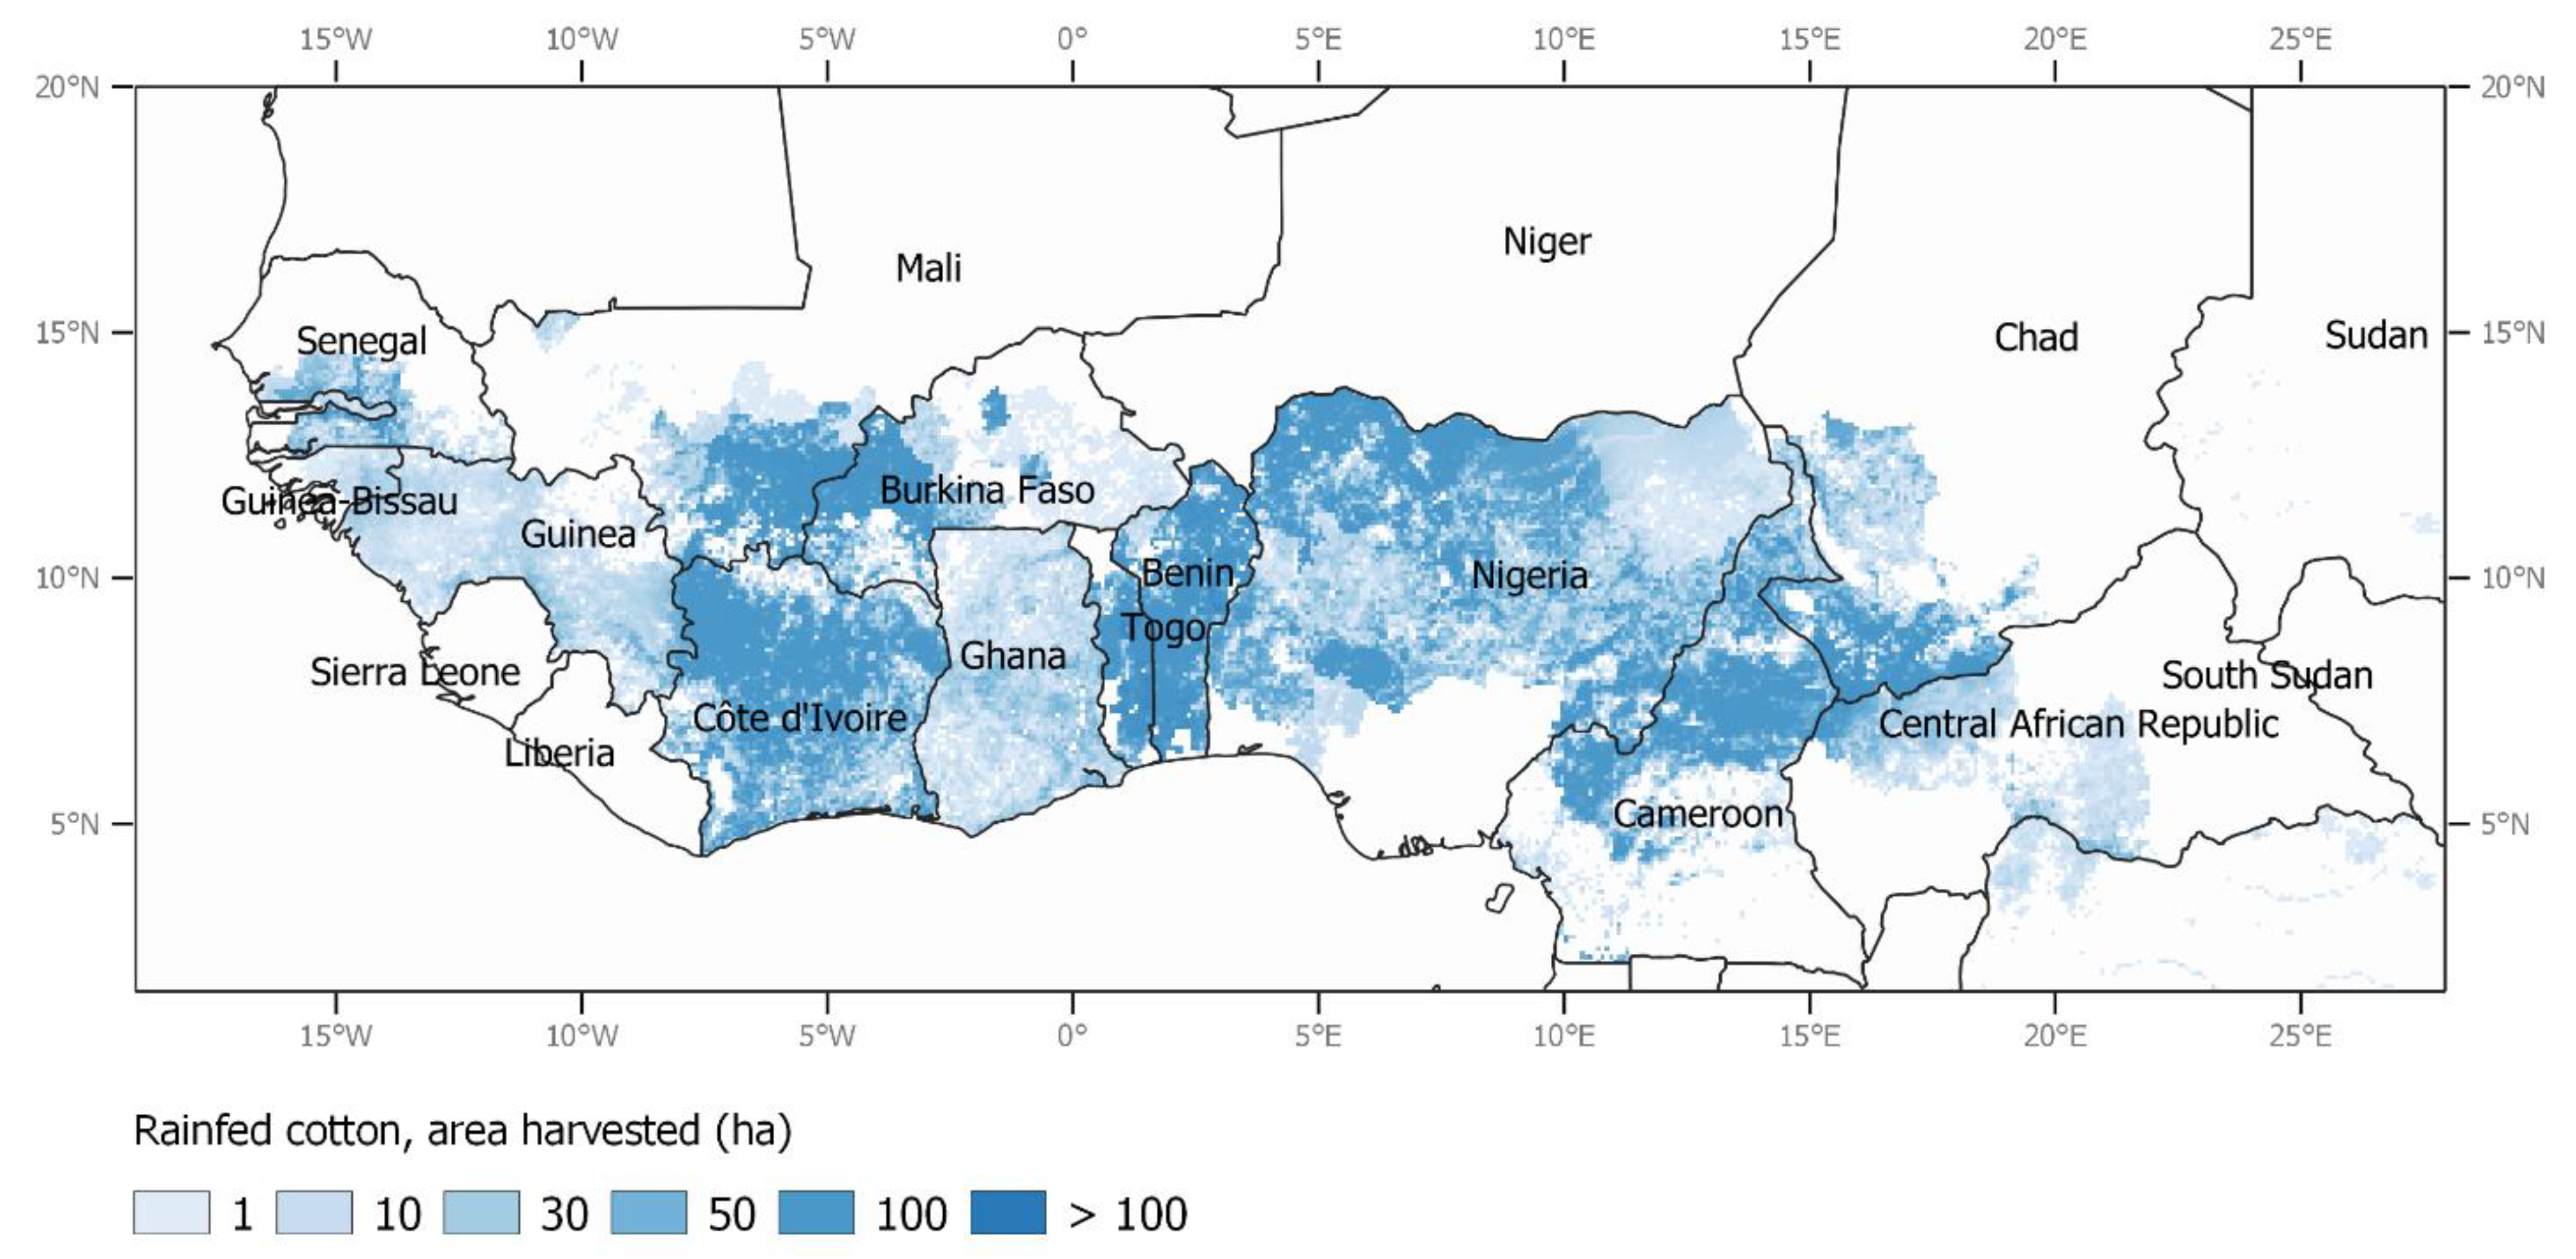
2.1. Study Area
2.2. Model Selection and Cotton Data
2.3. Climate Data
2.4. Climate Variable Selection and Comparison
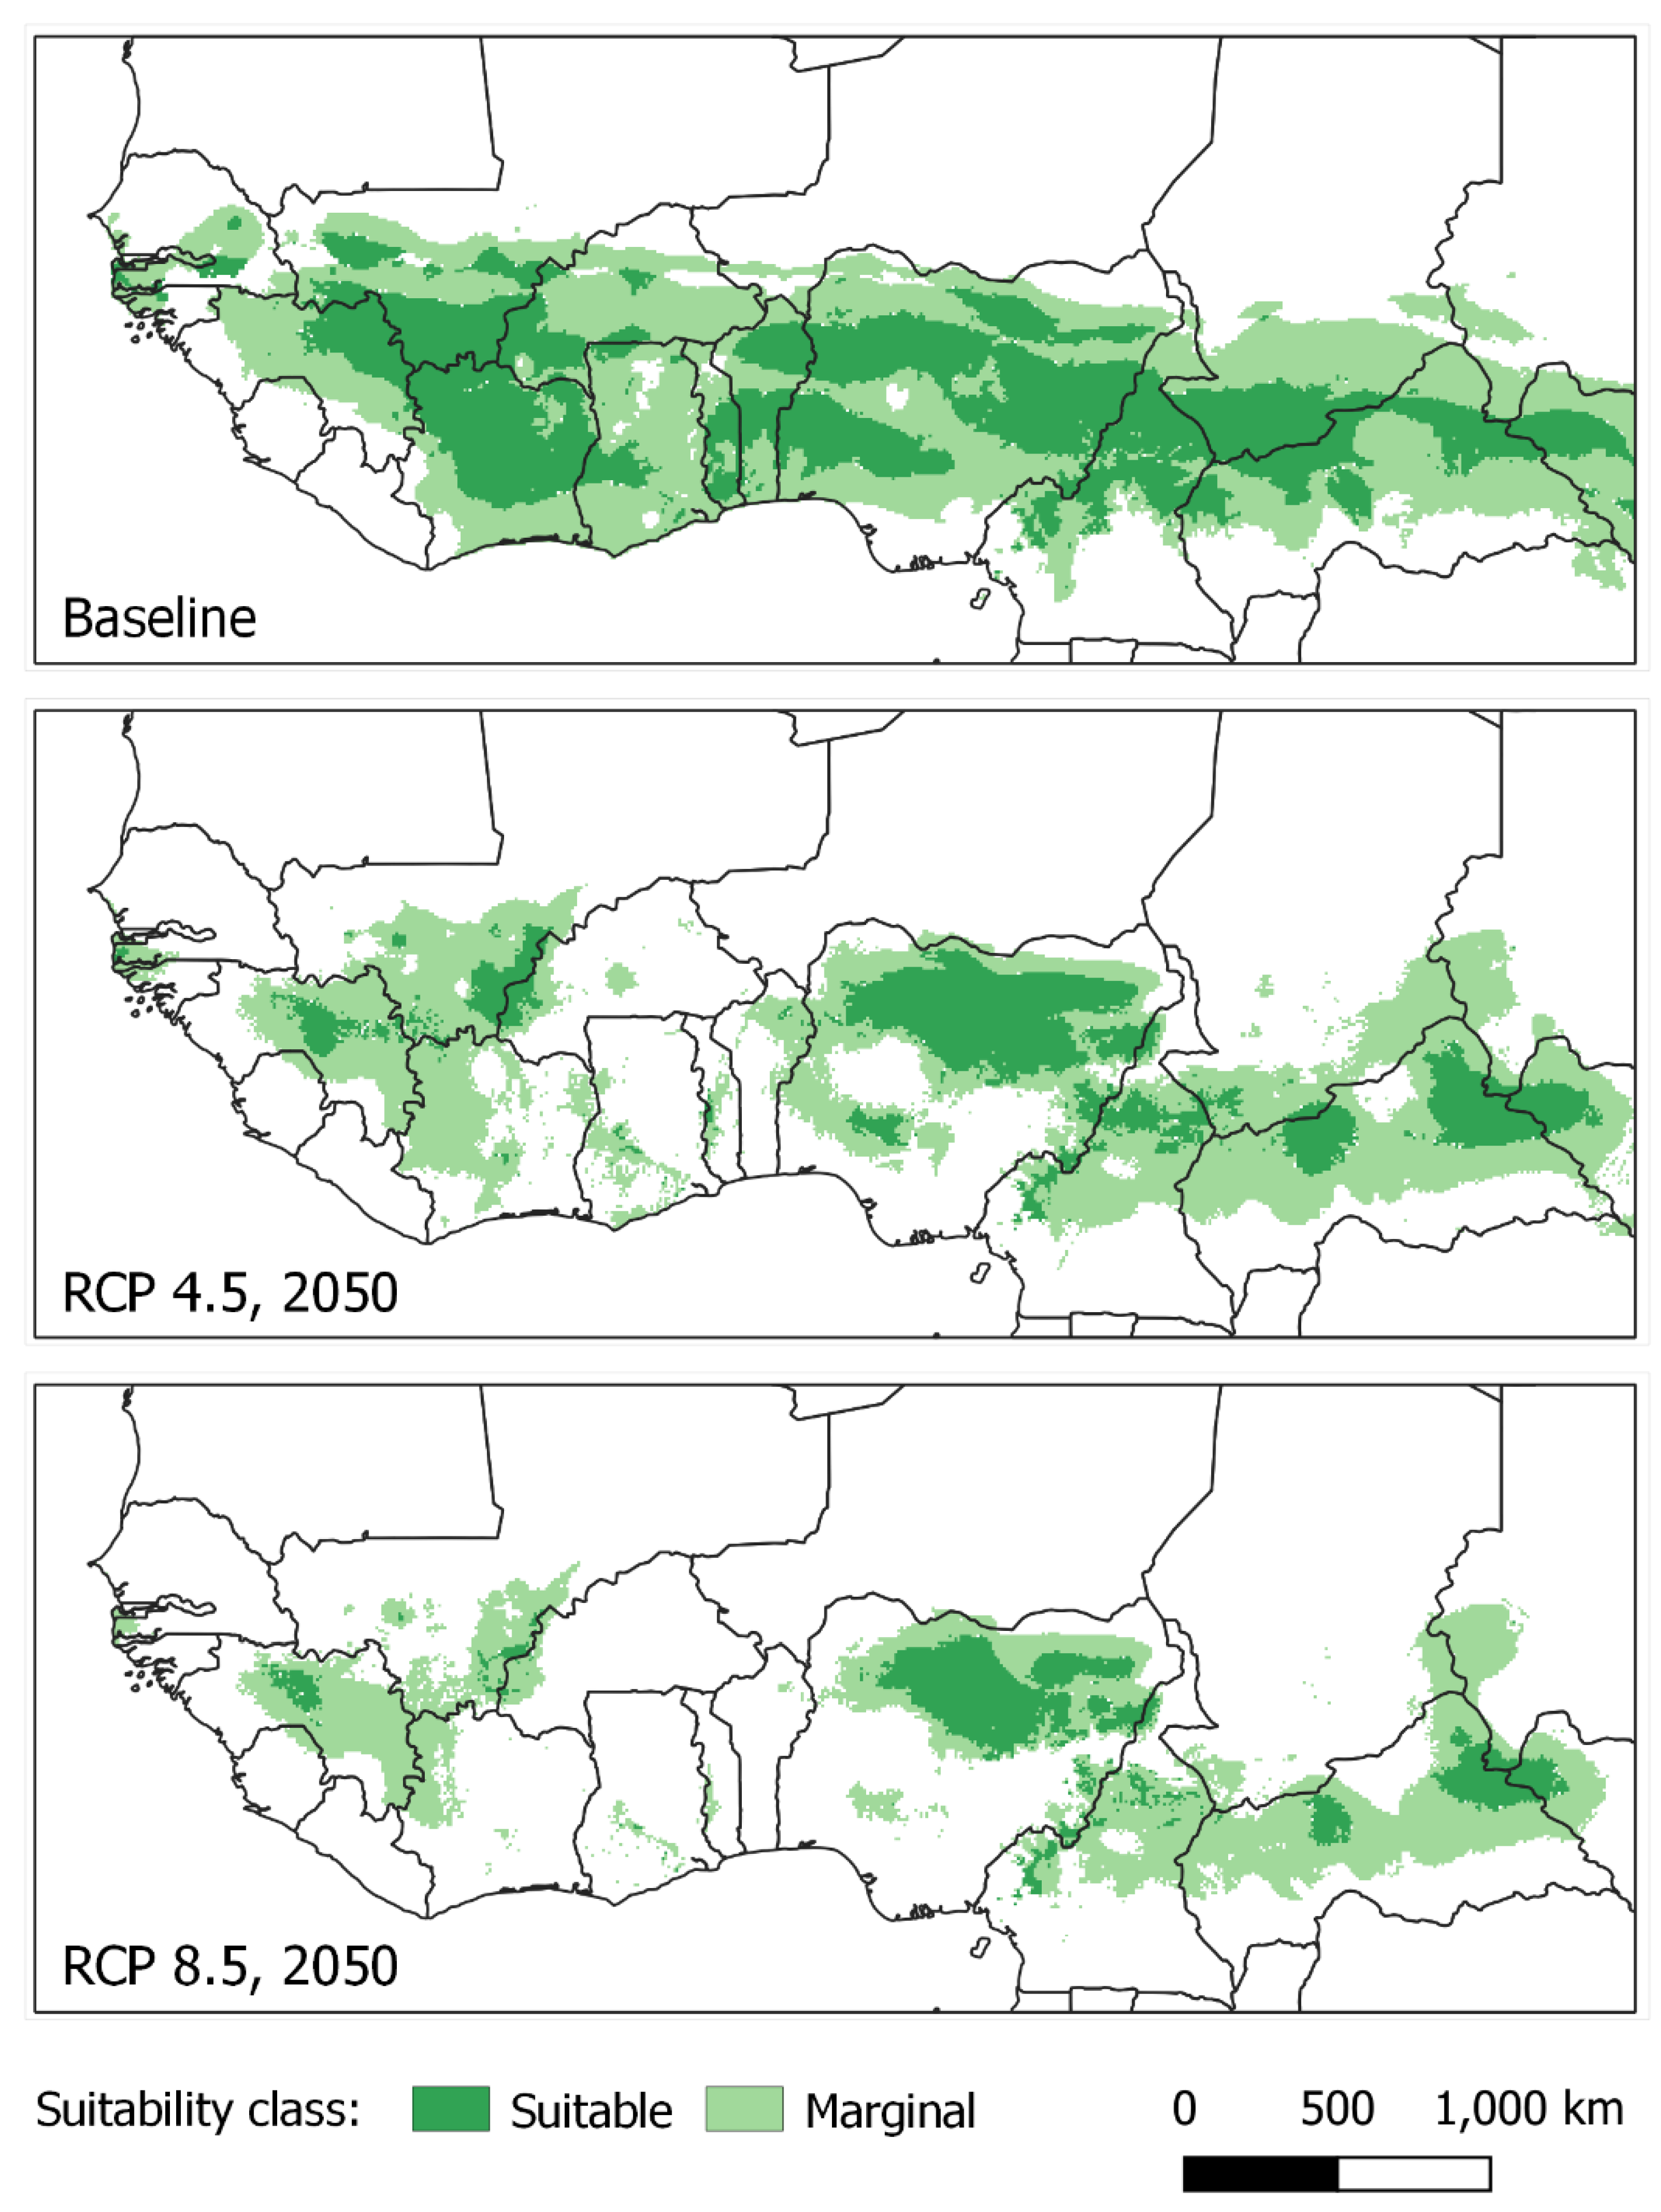
2.5. Suitability Classification
2.6. Comparison to Global Cotton-Growing Regions
3. Results
3.1. Model and Variable Selection
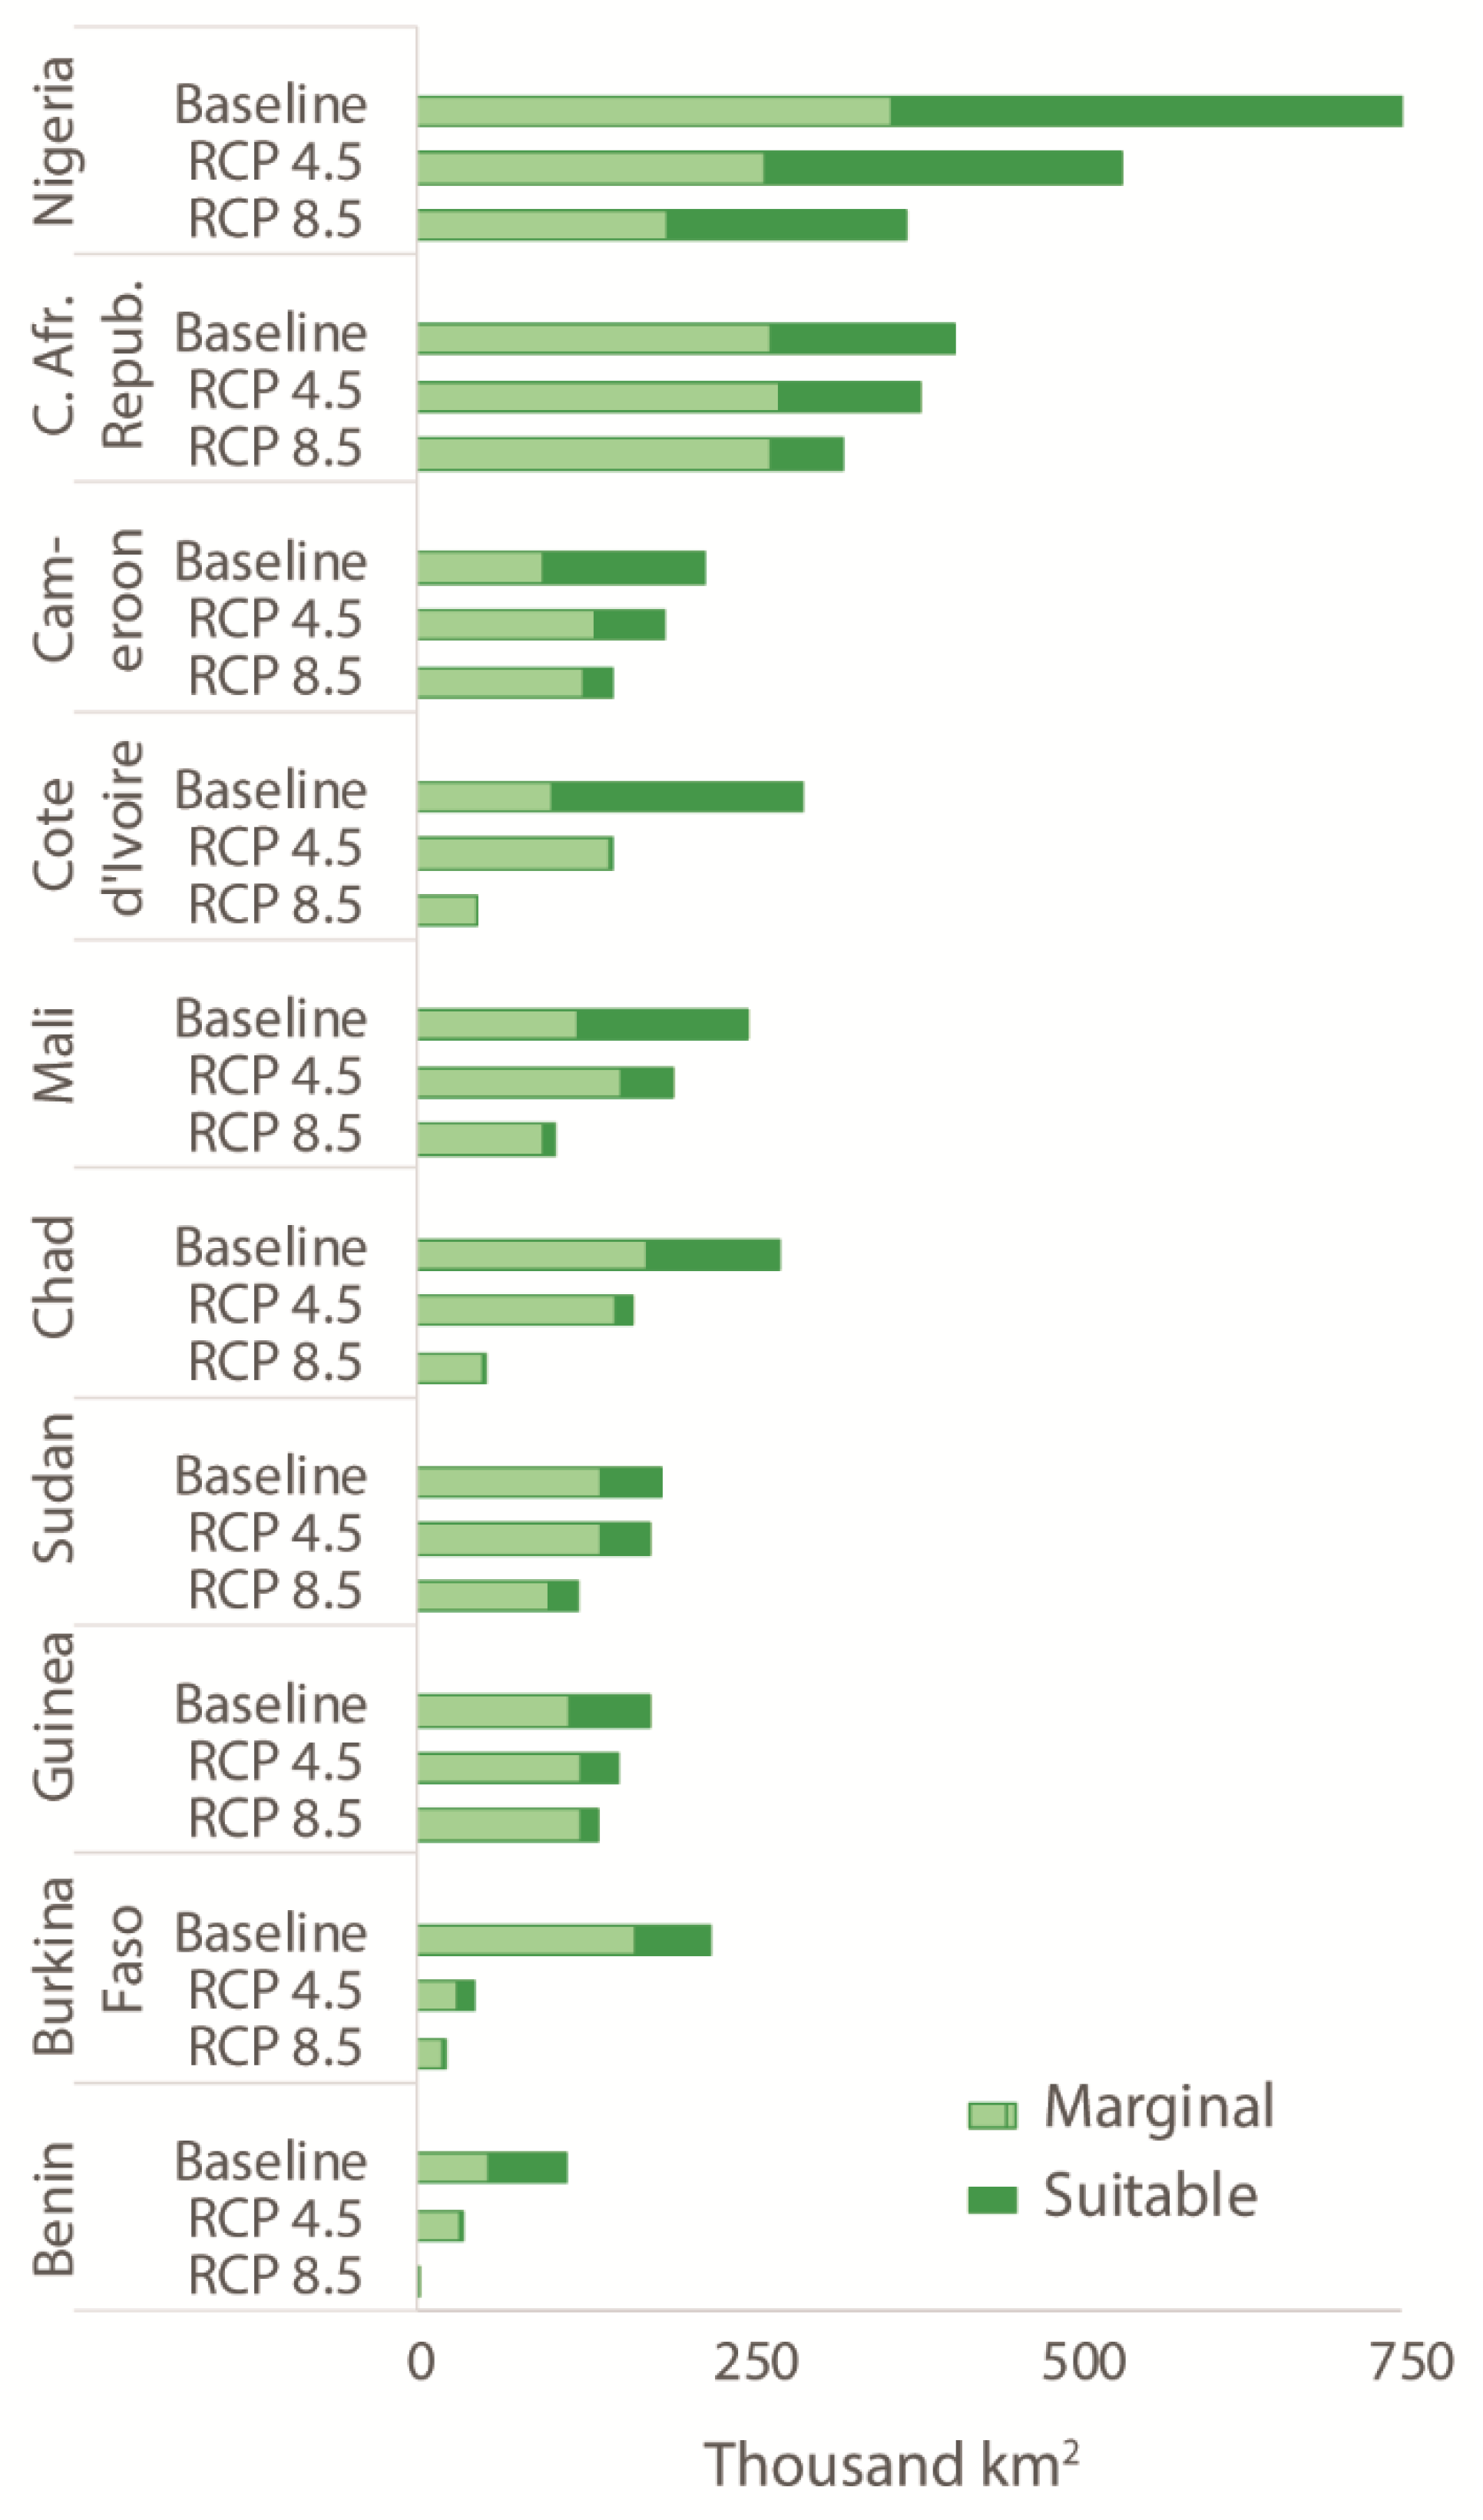
3.2. Change in Suitable Area
3.3. Comparison to Global Production Regions
4. Discussion
4.1. Projected Changes and Sustainable Development Goals
4.2. Model Selection and Uncertainty
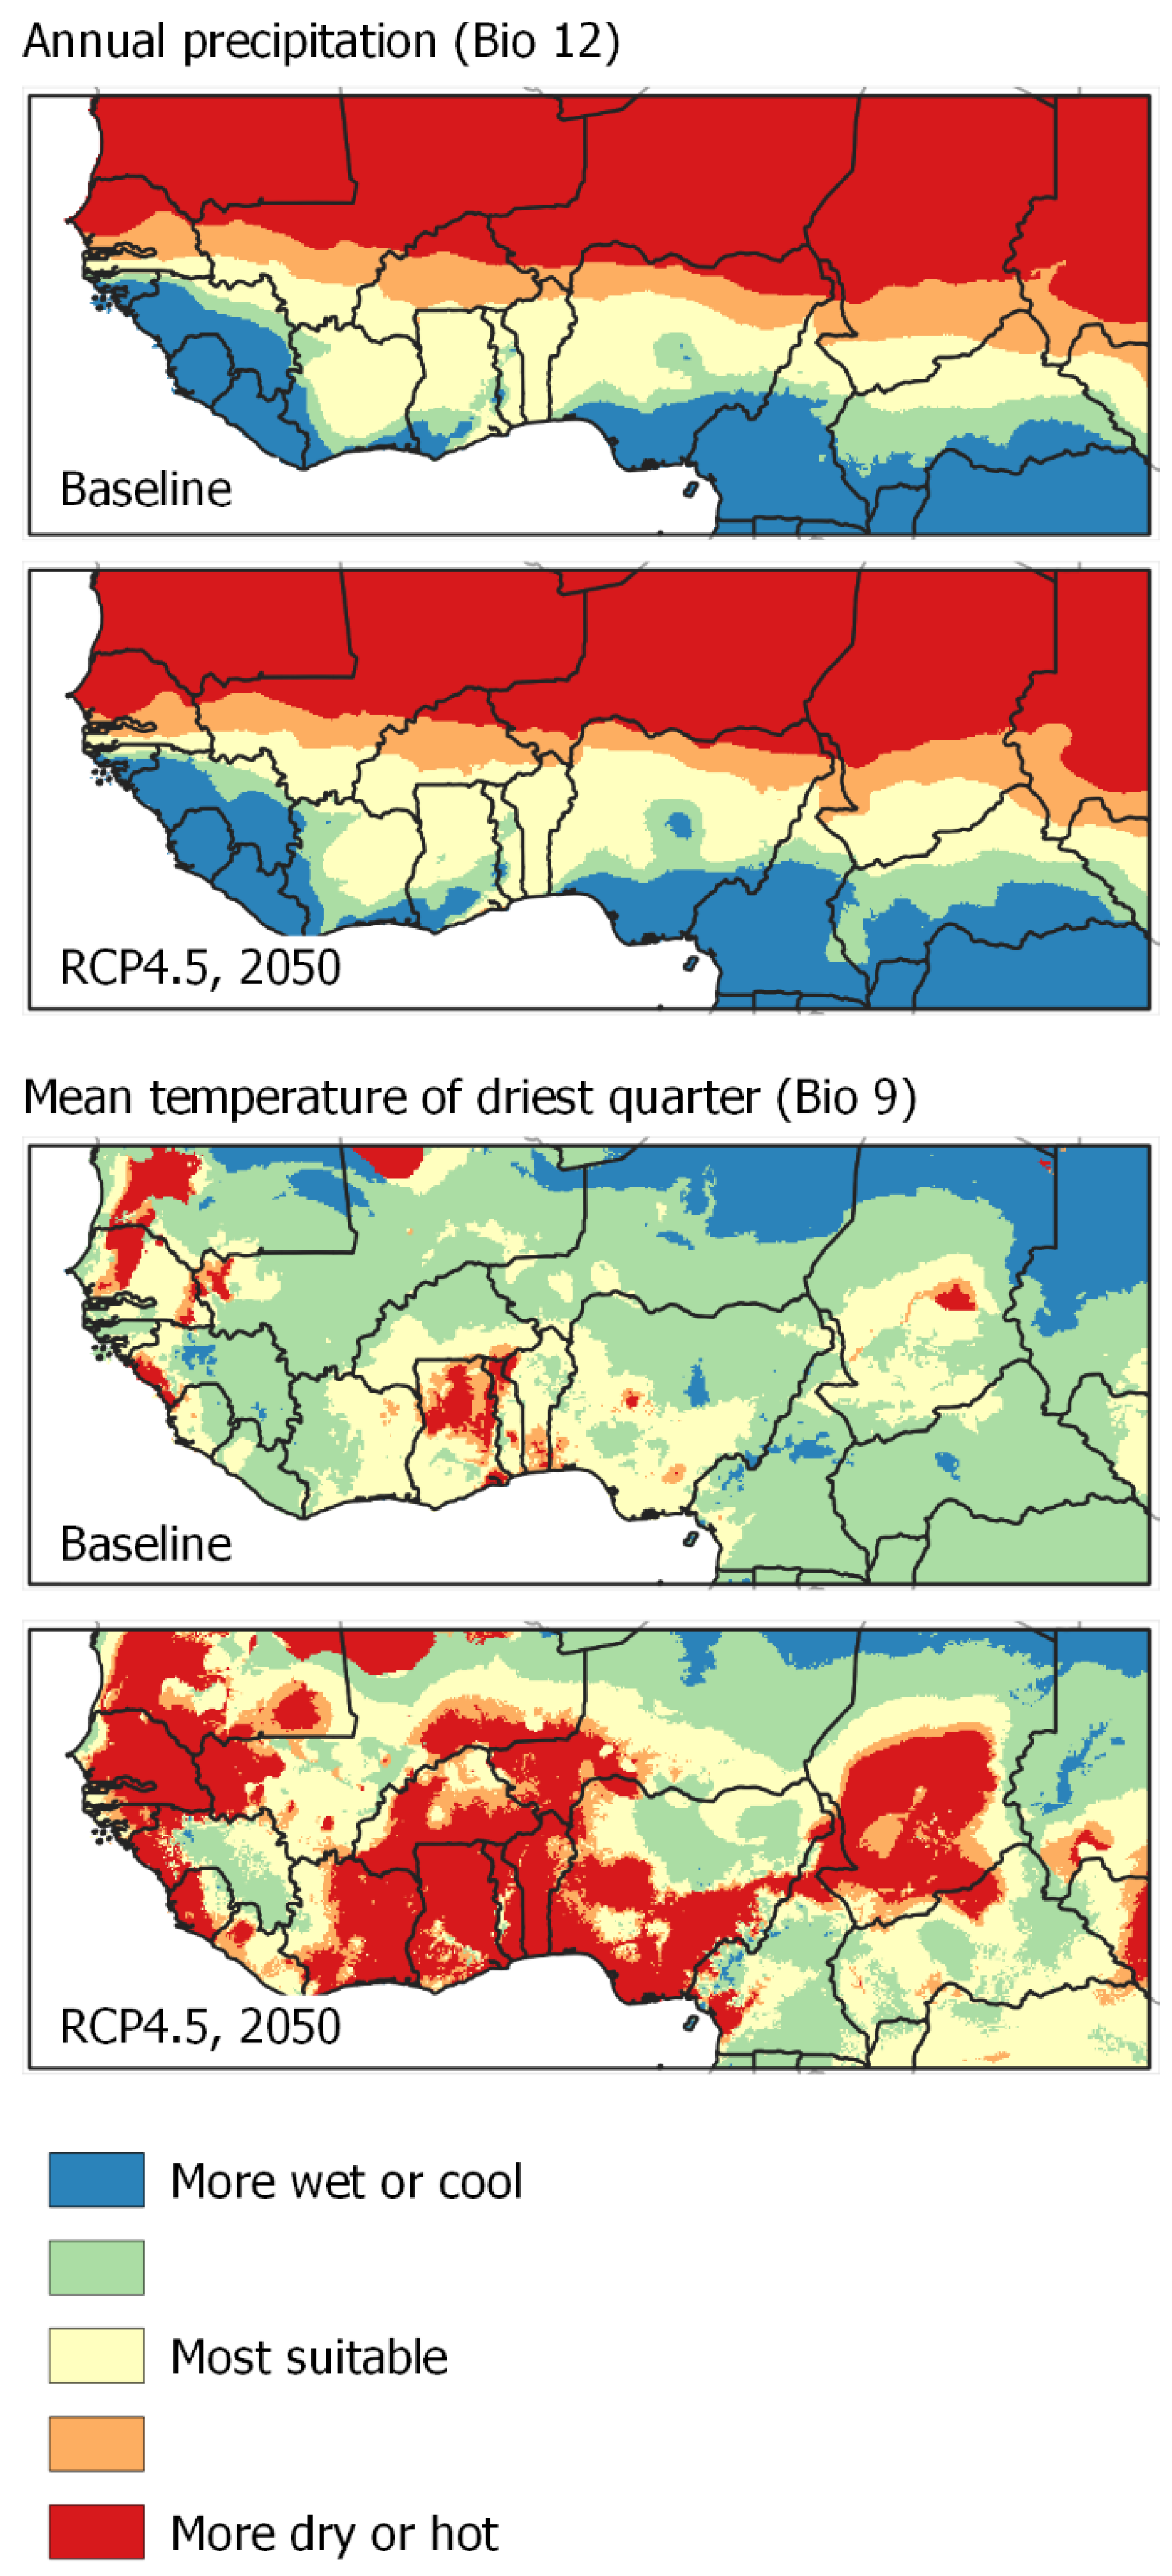
4.3. Changing Importance of Precipitation and Temperature
4.4. SDGs and the Global Context of Adaptation
5. Conclusions
Supplementary Materials
Author Contributions
Funding
Acknowledgments
Conflicts of Interest
References
- United Nations Development Programme (UNDP). Africa|UNDP Climate Change Adaptation. Available online: https://www.adaptation-undp.org/CCA-Africa (accessed on 10 April 2021).
- Barros, R.V.; Field, C.B.; Dokken, D.J.; Mastrandrea, M.D.; Mach, K.J.; Bilir, T.E.; Ebi, K.L.; Estrada, Y.O.; Genova, R.C.; Girma, B.; et al. Climate Change 2014: Impacts, Adaptation, and Vulnerability; Cambridge University Press: Cambridge, UK; New York, NY, USA, 2014. [Google Scholar]
- Chapman, S.; Birch, C.E.; Pope, E.; Sallu, S.; Bradshaw, C.; Davie, J.; Marsham, J.H. Impact of Climate Change on Crop Suitability in Sub-Saharan Africa in Parameterized and Convection-Permitting Regional Climate Models. Environ. Res. Lett. 2020, 15, 094086. [Google Scholar] [CrossRef]
- Niang, I.; Ruppel, O.C.; Abdrabo, M.A.; Essel, A.; Lennard, C.; Padgham, J.; Urquhart, P. Africa. In Climate Change 2014: Impacts, Adaptation, and Vulnerability. Part B: Regional Aspects. Contribution of Working Group II to the Fifth Assessment Report of the Intergovernmental Panel on Climate Change; Cambridge University Press: Cambridge, UK; New York, NY, USA, 2014; pp. 1199–1265. Available online: https://www.ipcc.ch/site/assets/uploads/2018/02/WGIIAR5-Chap22_FINAL.pdf (accessed on 10 April 2021).
- ECOWAS. 2025 Strategic Policy Framework. (ECOWAS Department of Agriculture, Environment and Water Resources, Abuja, Nigeria). 2017. Available online: http://araa.org/sites/default/files/media/ECOWAP%202025%20Strategic%20Policy%20Framework%20ENG.pdf (accessed on 10 April 2021).
- Sustainable Development Goals Center for Africa and Sustainable Development Solutions Network (SDGCA). Africa SDG Index and Dashboards Report 2020. Kigali and New York: SDG Center for Africa and Sustainable Development Solutions Network. 2020. Available online: https://sdgcafrica.org/wp-content/uploads/2020/10/2020_africa_index_and_dashboards.pdf (accessed on 10 April 2021).
- UN Economic Commission for Africa (UNECA); United Nations. Economic Commission for Africa. Subregional Office West Africa (SRO-WA). Report on sustainable development goals for the West Africa subregion. Addis Ababa: UNECA. 2015. Available online: http://hdl.handle.net/10855/22652 (accessed on 10 April 2021).
- Dosio, A. Projection of Temperature and Heat Waves for Africa with an Ensemble of CORDEX Regional Climate Models. Clim. Dyn. 2017, 49, 493–519. [Google Scholar] [CrossRef] [Green Version]
- Egbebiyi, T.S.; Crespo, O.; Lennard, C. Defining Crop–Climate Departure in West Africa: Improved Understanding of the Timing of Future Changes in Crop Suitability. Climate 2019, 7, 101. [Google Scholar] [CrossRef] [Green Version]
- Jalloh, A.; Nelson, G.C.; Thomas, T.S.; Zougmoré, R.; Roy-Macauley, H. West African Agriculture and Climate Change: A Comprehensive Analysis; IFPRI Research Monograph; International Food Policy Research Institute: Washington, DC, USA, 2013. [Google Scholar] [CrossRef]
- Akpoti, K.; Kabo-bah, A.T.; Dossou-Yovo, E.R.; Groen, T.A.; Zwart, S.J. Mapping Suitability for Rice Production in Inland Valley Landscapes in Benin and Togo Using Environmental Niche Modeling. Sci. Total Environ. 2020, 709, 136165. [Google Scholar] [CrossRef]
- VIB Cotton in Africa. Ghent, Belgium: International Plant Biotechnology Outreach. 2017. Available online: https://ipbo.sites.vib.be/sites/ipbo.sites.vib.be/files/2021-01/Cotton%20in%20Africa.pdf (accessed on 10 April 2021).
- Murphy, S.; Hansen-Kuhn, K. The Stubborn Persistence of U.S. Cotton Dumping. Institute for Agriculture and Trade Policy (IATP). 2017. Available online: https://www.iatp.org/documents/stubborn-persistence-us-cotton-dumping (accessed on 10 April 2021).
- Del Rio, A.; Simpson, B.M. Agricultural Adaptation to Climate Change in the Sahel: A Review of Fifteen Crops Cultivated in the Sahel; U.S. Agency for International Development (USAID): Washington, DC, USA, 2014. Available online: https://www.climatelinks.org/resources/agricultural-adaptation-climate-change-sahel-review-fifteen-crops-cultivated-sahel (accessed on 10 April 2021).
- OECD. Cotton: West Africa in the International Market. ECOWAS-SWAC/OECD: Atlas on Regional Integration in West Africa. 2006. Available online: https://www.oecd.org/swac/publications/38409410.pdf (accessed on 10 April 2021).
- Prasad, A.M.; Iverson, L.R.; Matthews, S.; Peters, M. A Climate Change Atlas for 134 Forest Tree Species of the Eastern United States. 2007. Available online: https://www.nrs.fs.fed.us/atlas/tree (accessed on 10 April 2021).
- Young, N.E.; Fairchild, M.; Belcher, T.; Evangelista, P.; Verdone, C.J.; Stohlgren, T.J. Finding the Needle in the Haystack: Iterative Sampling and Modeling for Rare Taxa. J. Insect Conserv. 2019, 23, 589–595. [Google Scholar] [CrossRef]
- Vitale, J.; Vognan, G.; Vitale, P.P. The Socio-economic impacts of GM cotton in Burkina Faso: Does farm structure affect how benefits are distributed? AgBioForum 2016, 19, 120–135. [Google Scholar]
- Mechiche-Alami, A.; Abdi, A.M. Agricultural Productivity in Relation to Climate and Cropland Management in West Africa. Sci. Rep. 2020, 10, 3393. [Google Scholar] [CrossRef] [PubMed]
- Jales, M. How Would a WTO Agreement on Cotton Affect Importing and Exporting Countries? ICTSD Programme on Agricultural Trade and Sustainable Development Issue Paper No. 26; International Centre for Trade and Sustainable Development: Geneva, Switzerland, 2010. [Google Scholar]
- Kogo, B.K.; Kumar, L.; Koech, R.; Kariyawasam, C.S. Modelling Climate Suitability for Rainfed Maize Cultivation in Kenya Using a Maximum Entropy (MaxENT) Approach. Agronomy 2019, 9, 727. [Google Scholar] [CrossRef] [Green Version]
- Jarnevich, C.S.; Stohlgren, T.J.; Kumar, S.; Morisette, J.T.; Holcombe, T.R. Caveats for Correlative Species Distribution Modeling. Ecol. Inform. 2015, 29, 6–15. [Google Scholar] [CrossRef]
- Intergovernmental Panel on Climate Change (IPCC). Summary for Policymakers. In Global Warming of 1.5 °C; Masson-Delmotte, V.P., Zhai, P., Pörtner, H.-O., Eds.; An IPCC Special Report on the Impacts of Global Warming of 1.5 °C Above Pre-Industrial Levels and Related Global Greenhouse Gas Emission Pathways, in the Context of Strengthening the Global Response to the Threat of Climate Change, Sustainable Development, and Efforts to Eradicate Poverty; 2018; Available online: https://www.ipcc.ch/sr15/chapter/spm/ (accessed on 10 April 2021).
- Vitale, J. Economic Importance of Cotton in Burkina Faso. Background Paper to the UNCTAD-FAO Commodities and Development Report 2017 Commodity Markets, Economic Growth and Development. 2018. Available online: http://www.fao.org/3/i8330en/I8330EN.pdf (accessed on 10 April 2021).
- Burke, J.J.; Wanjura, D.F. Plant Responses to Temperature Extremes. In Physiology of Cotton; Stewart, J.M., Oosterhuis, D.M., Heitholt, J.J., Mauney, J.J., Eds.; Springer: New York, NY, USA, 2010; pp. 123–128. [Google Scholar]
- Wells, R.; Stewart, A.M. Morphological alterations in response to management and environment. In Physiology of Cotton; Stewart, J.M., Oosterhuis, D.M., Heitholt, J.J., Mauney, J.R., Eds.; Springer: New York, NY, USA, 2010; pp. 24–32. [Google Scholar]
- Sylla, M.B.; Elguindi, N.; Giorgi, F.; Wisser, D. Projected Robust Shift of Climate Zones over West Africa in Response to Anthropogenic Climate Change for the Late 21st Century. Clim. Chang. 2016, 134, 241–253. [Google Scholar] [CrossRef]
- Comité Permanent Inter-états de Lutte contre la Sécheresse dans le Sahel [CILSS]. Landscapes of West Africa—A Window on a Changing World; CILSS: Ouagadougou, Burkina Faso, 2016; 219p. [Google Scholar] [CrossRef]
- Hijmans, R.J.; Elith, J. Spatial Distribution Modeling. 2019. Available online: https://rspatial.org/raster/sdm/SDM.pdf (accessed on 10 April 2021).
- Hallgren, W.; Beaumont, L.; Bowness, A.; Chambers, L.; Graham, E.; Holewa, H.; Laffan, S.; Mackey, B.; Nix, H.; Price, J.; et al. The Biodiversity and Climate Change Virtual Laboratory: Where ecology meets big data. Environ. Model. Softw. 2016, 76, 182–186. [Google Scholar] [CrossRef] [Green Version]
- Allouche, O.; Tsoar, A.; Kadmon, R. Assessing the Accuracy of Species Distribution Models: Prevalence, Kappa and the True Skill Statistic (TSS): Assessing the Accuracy of Distribution Models. J. Appl. Ecol. 2006, 43, 1223–1232. [Google Scholar] [CrossRef]
- Portmann, F.T.; Siebert, S.; Döll, P. MIRCA2000-Global Monthly Irrigated and Rainfed Crop Areas around the Year 2000: A New High-Resolution Data Set for Agricultural and Hydrological Modeling: Monthly Irrigated and Rainfed Crop Areas. Glob. Biogeochem. Cycles 2010, 24. [Google Scholar] [CrossRef]
- Evangelista, P.; Young, N.; Burnett, J. How Will Climate Change Spatially Affect Agriculture Production in Ethiopia? Case Studies of Important Cereal Crops. Clim. Chang. 2013, 119, 855–873. [Google Scholar] [CrossRef]
- Singh, K.; McClean, C.J.; Büker, P.; Hartley, S.E.; Hill, J.K. Mapping Regional Risks from Climate Change for Rainfed Rice Cultivation in India. Agric. Syst. 2017, 156, 76–84. [Google Scholar] [CrossRef] [PubMed]
- Hijmans, R.J.; Cameron, S.E.; Parra, J.L.; Jones, P.G.; Jarvis, A. Very High Resolution Interpolated Climate Surfaces for Global Land Areas. Int. J. Clim. 2005, 25, 1965–1978. [Google Scholar] [CrossRef]
- Fick, S.E.; Hijmans, R.J. WorldClim 2: New 1km spatial resolution climate surfaces for global land areas. Int. J. Clim. 2017, 37, 4302–4315. [Google Scholar] [CrossRef]
- Intergovernmental Panel on Climate Change (IPCC). Summary for Policymakers. In Climate Change 2013: The Physical Science Basis; Contribution of Working Group I to the Fifth Assessment Report of the Intergovernmental Panel on Climate Change; Cambridge University Press: Cambridge, UK; New York, NY, USA, 2013. [Google Scholar]
- Schwalm, C.R.; Glendon, S.; Duffy, P.B. RCP8.5 Tracks Cumulative CO 2 Emissions. Proc. Natl. Acad. Sci. USA 2020, 117, 19656–19657. [Google Scholar] [CrossRef]
- Ramírez Villegas, J.; Jarvis, A. Downscaling Global Circulation Model Outputs: The Delta Method Decision and Policy Analysis Working Paper No. 1; International Center for Tropical Agriculture. 2010. Available online: https://hdl.handle.net/10568/90731 (accessed on 10 April 2021).
- Navarro-Racines, C.; Tarapues, J.; Thornton, P.; Jarvis, A.; Ramirez-Villegas, J. High-Resolution and Bias-Corrected CMIP5 Projections for Climate Change Impact Assessments. Sci. Data 2020, 7, 7. [Google Scholar] [CrossRef] [Green Version]
- De Sherbinin, A.; Chai-Onn, T.; Giannini, A.; Jaiteh., M.; Levy, M.; Mara, V.; Pistolesi, L.; Trzaska, S. Mali Climate Vulnerability Mapping. USAID African and Latin American Resilience to Climate Change Project (ARCC). 2014. Available online: https://www.usaid.gov/sites/default/files/documents/1860/MALI%20CLIMATE%20VULNERABILITY%20MAPPING.pdf (accessed on 10 April 2021).
- Phillips, S.J.; Anderson, R.P.; Schapire, R.E. Maximum Entropy Modeling of Species Geographic Distributions. Ecol. Model. 2006, 190, 231–259. [Google Scholar] [CrossRef] [Green Version]
- Govereh, J.; Jayne, T.S. Effects of Cash Crop Production on Food Crop Productivity in Zimbabwe: Synergies or Trade-Offs? Food Security International Development Working Papers 54670; Michigan State University, Department of Agricultural, Food, and Resource Economics: East Lansing, MI, USA, 1999. [Google Scholar]
- Merow, C.; Smith, M.J.; Silander, J.A. A Practical Guide to MaxEnt for Modeling Species’ Distributions: What It Does, and Why Inputs and Settings Matter. Ecography 2013, 36, 1058–1069. [Google Scholar] [CrossRef]
- Phillips, S.J.; Dudík, M.; Schapire, R.E. Maxent Software for Modeling Species Niches and Distributions (Version 3.4.1). Available online: http://biodiversityinformatics.amnh.org/open_source/maxent/ (accessed on 10 April 2021).
- Brysse, K.; Oreskes, N.; O’Reilly, J.; Oppenheimer, M. Climate Change Prediction: Erring on the Side of Least Drama? Glob. Environ. Chang. 2013, 23, 327–337. [Google Scholar] [CrossRef]
- Oreskes, N.; Oppenheimer, M.; Jamieson, D. Scientists Have Been Underestimating the Pace of Climate Change. Scientific American Blog Observations. 2019. Available online: https://blogs.scientificamerican.com/observations/scientists-have-been-underestimating-the-pace-of-climate-change/ (accessed on 10 April 2021).
- United States Geological Survey (USGS). Climate | West Africa. Available online: https://eros.usgs.gov/westafrica/node/157 (accessed on 10 April 2021).
- Sylla, M.B.; Pal, J.S.; Faye, A.; Dimobe, K.; Kunstmann, H. Climate Change to Severely Impact West African Basin Scale Irrigation in 2 °C and 1.5 °C Global Warming Scenarios. Sci. Rep. 2018, 8, 14395. [Google Scholar] [CrossRef] [PubMed] [Green Version]
- International Trade Centre (ITC). Cotton and Climate Change: Impacts and Options to Mitigate and Adapt; Technical paper, Doc. No. MAR-11-200.E; ITC: Geneva, Switzerland, 2011. [Google Scholar]
- Adeniyi, M.O. The Consequences of the IPCC AR5 RCPs 4.5 and 8.5 Climate Change Scenarios on Precipitation in West Africa. Clim. Chang. 2016, 139, 245–263. [Google Scholar] [CrossRef]
- United Nations Conference on Trade and Development (UNCTAD). Pan-African Cotton Road Map: A Continental Strategy to Strengthen Regional Cotton Value Chains for Poverty Reduction and Food Security; United Nations: Geneva, Switzerland, 2014; Available online: https://unctad.org/system/files/official-document/suc2014d6_en.pdf (accessed on 10 April 2021).


| Algorithm | Type | Abbreviation | AUC | TSS |
|---|---|---|---|---|
| Artificial neural network | machine learning | ANN | 0.81 | 0.125 |
| Boosted regression tree | machine learning | BRT | 0.74 | 0.274 |
| Maximum entropy | machine learning | Maxent | 0.87 | 0.601 |
| Generalized additive model | statistical model | GAM | 0.85 | 0.582 |
| Generalized linar model | statistical model | GLM | 0.81 | 0.548 |
| Multiple adaptive regression spline | statistical model | MARS | 0.84 | 0.554 |
| Variable | Definition, Units | Percent Contribution | Individual AUC |
|---|---|---|---|
| Bio 12 | Annual precipitation, mm | 57 | 0.79 |
| Bio 4 | Temperature seasonality (std dev) | 21 | 0.77 |
| Bio 18 | Precipitation of warmest quarter, mm | 17.8 | 0.78 |
| Bio 10 | Mean temperature of warmest quarter, °C | 2.2 | 0.71 |
| Bio 9 | Mean temperature of driest quarter, °C | 2 | 0.63 |
| Country | Baseline | RCP4.5 | RCP8.5 |
|---|---|---|---|
| Côte d’Ivoire | 59.45 | 0.65 | 0.00 |
| Benin | 51.42 | 1.07 | 0.00 |
| Togo | 46.29 | 3.64 | 0.00 |
| Nigeria | 43.38 | 30.17 | 20.17 |
| South Sudan | 33.78 | 23.32 | 12.02 |
| Cameroon | 26.86 | 11.02 | 4.87 |
| Guinea | 24.56 | 11.13 | 5.57 |
| Central African Republic | 22.99 | 17.30 | 9.03 |
| Burkina Faso | 21.11 | 5.04 | 0.67 |
| Gambia | 19.53 | 0.00 | 0.00 |
| Mali | 13.62 | 4.05 | 0.84 |
| Ghana | 13.57 | 1.00 | 0.28 |
| Chad | 9.20 | 1.15 | 0.01 |
| Senegal | 6.45 | 0.67 | 0.00 |
| Guinea-Bissau | 3.84 | 0.00 | 0.00 |
Publisher’s Note: MDPI stays neutral with regard to jurisdictional claims in published maps and institutional affiliations. |
© 2021 by the authors. Licensee MDPI, Basel, Switzerland. This article is an open access article distributed under the terms and conditions of the Creative Commons Attribution (CC BY) license (https://creativecommons.org/licenses/by/4.0/).
Share and Cite
Cunningham, M.A.; Wright, N.S.; Mort Ranta, P.B.; Benton, H.K.; Ragy, H.G.; Edington, C.J.; Kellner, C.A. Mapping Vulnerability of Cotton to Climate Change in West Africa: Challenges for Sustainable Development. Climate 2021, 9, 68. https://doi.org/10.3390/cli9040068
Cunningham MA, Wright NS, Mort Ranta PB, Benton HK, Ragy HG, Edington CJ, Kellner CA. Mapping Vulnerability of Cotton to Climate Change in West Africa: Challenges for Sustainable Development. Climate. 2021; 9(4):68. https://doi.org/10.3390/cli9040068
Chicago/Turabian StyleCunningham, Mary Ann, Nicholas S. Wright, Penelope B. Mort Ranta, Hannah K. Benton, Hassan G. Ragy, Christopher J. Edington, and Chloe A. Kellner. 2021. "Mapping Vulnerability of Cotton to Climate Change in West Africa: Challenges for Sustainable Development" Climate 9, no. 4: 68. https://doi.org/10.3390/cli9040068